Embed Size (px)
Citation preview
Minnesota Truck Size and Weight Project
prepared for
Minnesota Department of Transportation
prepared by
Cambridge Systematics, Inc.
with
SRF Consulting Group, Inc. Harry Cohen
final
report
June 2006 www.camsys.com

final report
Minnesota Truck Size and Weight Project
prepared for
Minnesota Department of Transportation
prepared by
Cambridge Systematics, Inc. 4800 Hampden Lane, Suite 800 Bethesda, Maryland 20814
with
SRF Consulting Group, Inc. Harry Cohen
June 2006
Minnesota Truck Size and Weight Project
Table of Contents
Executive Summary .............................................................................................................. ES-1
Minnesota Truck Size and Weight Project Final Report ............................................... 1 Introduction.................................................................................................................... 1 Background: Minnesota’s Freight Challenge ........................................................... 1 Minnesota Truck Size and Weight Laws within the National and Upper
Midwest Regional Context................................................................................... 3 TS&W Issues and Considerations ............................................................................... 10 Project Approach ........................................................................................................... 15 Findings and Recommendations................................................................................. 20 Expected Outcomes....................................................................................................... 25
Appendix A Changing Business Practices and Economic Forces ................................................. A-1
Appendix B Scope, Limits, and Administration of Existing Truck Size and Weight Laws in Minnesota ....................................................................................................................... B-1
Appendix C Review of Selected Truck Size and Weight Laws and Practices Elsewhere.......... C-1
Appendix D Heavy Truck Equipment, Configuration, and Technology Trends ....................... D-1
Appendix E Heavy Truck Safety Considerations ........................................................................... E-1
Appendix F Truck Size and Weight Impact Analysis Methodology ........................................... F-1
Appendix G Outreach Efforts for Minnesota Truck Size and Weight Project............................. G-1
Cambridge Systematics, Inc. i 7583.060

Minnesota Truck Size and Weight Project
List of Tables
ES.1 Truck Size and Weight Proposal Benefits.................................................................. ES-5
ES.2 Minnesota Truck Size and Weight Recommendations............................................ ES-7
1. Summary of Maximum Truck Dimensions in Minnesota and Neighboring States and Provinces ..................................................................................................... 8
2. Summary of Maximum Truck Weights in Minnesota and Neighboring States and Provinces ................................................................................................................ 9
3. Equivalent Single-Axle Load Values for Flexible Pavements................................. 12
4. Surplus Brake Capacity by Configuration................................................................. 19
5. Truck Size and Weight Proposal Benefits.................................................................. 21
A.1 Truck Haul Lengths by Value and Tonnage ............................................................. A-4
A.2 Top Truck Commodities by Share of Total Annual Tonnage Originated in Minnesota....................................................................................................................... A-5
A.3 Geographic Distribution of Minnesota Mineral Extraction .................................... A-9
A.4 Top Minnesota Agricultural Commodities ............................................................... A-10
A.5 Major Minnesota Forest Products and Lumber Processing Facilities.................... A-21
B.1 Permanent Inspection Stations.................................................................................... B-17
C.1 Summary of Maximum Truck Dimensions in Minnesota and Neighboring States and Provinces ..................................................................................................... C-5
C.2 Summary of Maximum Truck Weights in Minnesota and Neighboring States and Provinces ................................................................................................................ C-6
E.1 Effect of Truck Configuration and Vehicle Miles of Travel on Fatal Involvement Rate .......................................................................................................... E-3
E.2 Ontario Analysis of Collision Rates by Tractor-Trailer Class................................. E-6
E.3 Surplus Brake Capacity by Configuration................................................................. E-9
E.4 Number of Trucks with at Least One Violation ....................................................... E-11
E.5 Performance Measures for the Six- and Seven-Axle Tractor Semitrailer.............. E-19
Cambridge Systematics, Inc. iii

Minnesota Truck Size and Weight Project
List of Tables (continued)
E.6 Performance Measures for the Eight-Axle Double Configured as A- and B-Trains .............................................................................................................................. E-19
E.7 Performance Measures for the Seven-Axle Straight Truck at 80,000 Pounds ...... E-20
F.1 Year 2004 VMT by Heavy Trucks on Non-Interstate Trunk Highways in Minnesota....................................................................................................................... F-4
F.2 Basis for Estimating Equivalent Single-Axle Load Factors ..................................... F-7
F.3 Bridge Posting Analysis ............................................................................................... F-8
F.4 Added Delay to Other Vehicles Per 1,000 Passenger Car Equivalent (PCE) Vehicle-Miles ................................................................................................................. F-13
F.5 Truck Size and Weight Proposal Benefits.................................................................. F-15
iv Cambridge Systematics, Inc.

Minnesota Truck Size and Weight Project
List of Figures
1. Minnesota Beet Industry Production Map ................................................................ 2
2. National Truck Network and Minnesota Twin Trailer Network........................... 5
3. Illustration of Reduced Truck Trips with Higher Payloads ................................... 11
4. Bridge Crossing Scenario ............................................................................................. 14
A.1 Current and Future Minnesota Truck Tonnage........................................................ A-3
A.2 Minnesota Mineral Extraction and Production ........................................................ A-9
A.3 Minnesota Wheat Production and Transportation .................................................. A-11
A.4 Minnesota Corn Production and Transportation ..................................................... A-12
A.5 Minnesota Soybean Production and Transportation ............................................... A-13
A.6 Minnesota Sugar Beet Production and Transportation ........................................... A-14
A.7 Minnesota Hay Production and Transportation ...................................................... A-15
A.8 Minnesota Sweet Corn and Peas Production and Transportation......................... A-16
A.9 Minnesota Dairy Production and Transportation.................................................... A-17
A.10 Minnesota Cattle Production and Transportation ................................................... A-18
A.11 Minnesota Hogs and Pigs Production and Transportation .................................... A-19
B.1 National Network and Minnesota Twin Trailer Network...................................... B-13
C.1 Neighboring U.S. States and Canadian Provinces ................................................... C-3
C.2 IAP Operating Model ................................................................................................... C-26
D.1 On-Board Scale Unit ..................................................................................................... D-10
E.1 Fatal Crash Rates for Heavy Trucks........................................................................... E-5
E.2 Declining Fatal Truck Crash Rate Per 100 Million Vehicle Miles Traveled.......... E-7
E.3 Illustration of Rollover Initiation ................................................................................ E-15
E.4 Rearward Amplification of Lateral Acceleration ..................................................... E-16
E.5 Low-Speed Offtracking ................................................................................................ E-17
Cambridge Systematics, Inc. v

Minnesota Truck Size and Weight Project
List of Figures (continued)
E.6 High-Speed Offtracking ............................................................................................... E-18
E.7 Comparison of Static Rollover Threshold for All Vehicles ..................................... E-21
E.8 Comparison of Load Transfer Ratio for All Vehicles............................................... E-22
E.9 Comparison of Rearward Amplification for All Vehicles....................................... E-23
E.10 Comparison of High-Speed Transient Offtracking for All Vehicles...................... E-24
E.11 Comparison of High-Speed Offtracking for All Vehicles ....................................... E-25
E.12 Comparison of Low-Speed Offtracking for All Vehicles ........................................ E-26
E.13 Comparison High-Speed Friction Utilization for All Vehicles............................... E-27
E.14 Comparison Low-Speed Friction Utilization for All Vehicles................................ E-28
F.1 Effect of Pavement Condition on Road User Costs for Low-Volume Roads ....... F-6
F.2 Fatal Crash Rates for Heavy Trucks........................................................................... F-12
vi Cambridge Systematics, Inc.

Minnesota Truck Size and Weight Project
Minnesota Truck Size and Weight Project – Executive Summary
Introduction
This report summarizes the approach, findings, and recommendations of the Minnesota Truck Size and Weight (TS&W) Project led by the Minnesota Department of Transportation (Mn/DOT) in cooperation with other public and private stakeholders. The purpose of the project is to assess changes to Minnesota’s TS&W laws that would benefit the Minnesota economy while protecting roadway infrastructure and safety.
Background: Minnesota’s Freight Challenge
Minnesota’s industries and economy depend on an efficient multimodal transportation network. Each year, nearly $600 billion in goods are transported in Minnesota, supporting agriculture, manufacturing, and retail growth throughout the State. Over the last few dec-ades, demand for freight transportation has grown significantly and freight demand is projected to further increase by about 60 percent by 2020 according to Mn/DOT’s Statewide Freight Plan.1 All modes of freight transportation are being challenged to increase capacity and improve productivity to respond to this growth.
The State of Minnesota continues to make investment in its highway network to support population and economic growth, and has developed several intermodal freight programs, including the Minnesota Rail Service Improvement Program and the Port Development Assistance Program, to preserve and modernize basic freight infrastructure. An integrated network of more efficient freight facilities and services for all modes (highway, rail, water, and air) is needed to foster Minnesota’s competitiveness, including access to markets out-side of Minnesota.
In recent years, Minnesota lawmakers have considered many proposals to change TS&W laws. A number of these legislative proposals tailored to specific industry needs have been enacted, clearly demonstrating the need for a more comprehensive approach to future
1 Minnesota Statewide Freight Plan, prepared for the Minnesota Department of Transportation, Office
of Freight and Commercial Vehicle Operations by Cambridge Systematics, Inc., May 2005.
Cambridge Systematics, Inc. ES-1
Minnesota Truck Size and Weight Project
TS&W changes that consider economic, infrastructure, safety, and other impacts. As a result, the Minnesota TS&W Project was initiated in the spring of 2005.
Issues and Considerations
Industry Challenges and Considerations
Minnesota operates in a global economy, and competes especially with states in the Upper Midwest and with Canada. Several of these jurisdictions have higher weight limits than Minnesota, potentially putting Minnesota industries at a competitive disadvantage. For example, North and South Dakota allow vehicles with weights up to 105,500 and 129,000 pounds, respectively, (versus an 80,000-pound limit in most instances within Minnesota). Many agricultural industries in Minnesota directly border these states and are impacted competitively by the lower vehicle productivity in Minnesota. TS&W limits affect freight transportation costs because they control the amount of payload that can be carried in a truck. Increases in truck weight limits increase the allowable weight per trip, so fewer trips are required to carry the same amount of goods. Freight transportation cost savings due to increases in TS&W limits accrue to shippers, carriers, and consumers.
Pavement Considerations
Engineers design roads to accommodate projected vehicle loads, in particular, heavy vehi-cle axle loads. The life of a pavement is related to the magnitude and frequency of these heavy axle loads. Pavement engineers use the concept of an equivalent single-axle load (ESAL) to measure the effects of heavy vehicles on pavements. Any truck axle configura-tion and weight can be converted to this common unit of measure. Adding axles to a truck can greatly reduce the impact on pavement. A conventional five-axle tractor-semitrailer operating at 80,000 pounds gross vehicle weight (GVW) is equivalent to about 2.4 ESALs. If the weight of this vehicle were increased to 90,000 pounds (a 12.5 percent increase), its ESAL value goes up to 4.1 (a 70.8 percent increase), because pavement damage increases at a geometric rate with weight increases. However, a six-axle tractor-semitrailer at 90,000 pounds has an ESAL value of only 2.0, because its weight is distributed over six axles instead of five. An added pavement benefit of the 90,000-pound six-axle truck is that fewer trips are required to carry the same amount of payload, resulting in almost 30 percent fewer ESAL miles per payload ton-mile.
The effect of ESALs on pavements is not constant throughout the year. During the winter, when the ground is frozen, a truck carrying a given load causes much less damage to pavements than at other times of the year. During the spring, the inverse is true: pave-ment layers are generally in a saturated, weakened state due to partial thaw conditions and trapped water, causing greater pavement damage by the same truck.
ES-2 Cambridge Systematics, Inc.

Minnesota Truck Size and Weight Project
Bridge Considerations
Increases in truck weight limits can affect bridges in several ways. Should the legally allow-able limits change, and the limits exceed the design criteria for a bridge, the bridge must be posted (signed for restricted use) to prevent those heavy vehicles from using it. Changing allowable limits will increase agency costs for inspecting and rating bridges and for posting signs. Concrete decks and other bridge elements can wear out with repetitive loadings by heavy vehicles. The number, spacing, and weight of individual axles, as well as the GVW carried on a truck, are important considerations for bridges. To protect bridges from over-stress, Minnesota law includes a table of maximum weights for truck axle groups.
Highway Safety Considerations
Changes in TS&W regulations can affect highway safety by: 1) increasing or decreasing the amount of truck traffic; 2) causing or requiring changes in vehicle design and vehicle per-formance that may affect crash rates and severity; and 3) causing trucks to shift to high-ways with higher or lower crash rates. Crash rates per vehicle-mile increase slightly with gross weight primarily because loading a truck heavier raises its center of gravity and thereby increases the possibility of rollover. However, crash rates per payload ton-mile decrease with a gross weight increase because fewer truck trips are required to haul a given amount of freight.
All heavier vehicles proposed in the project were evaluated against and found to meet internationally accepted safety performance standards. Review of international practice revealed that technology enhancements also can improve the safety performance of heavy trucks. For example, special couplings for double-trailer trucks, as proposed in this study, significantly improve vehicle stability related performance measures.
Finally, study results show that there is greater surplus brake capacity for all of the pro-posed vehicle configurations than for the standard five-axle tractor-semitrailer when categorized on the basis of normal and winter weights.
Project Approach
A set of guiding principles was established early in the project in cooperation with the project’s advisory committees. These guiding principles set the parameters for analysis of proposed alternatives. In summary, the principles provided that any changes would: be in concert with Federal law; seek to protect highway infrastructure and safety; provide benefit to Minnesota’s industries and economy; promote ease and uniformity of application; and seek to cover costs imposed on the system.
An extensive outreach process was conducted for the project. Regional meetings were held around the State and more than 35 meetings were held with stakeholder organizations. The outreach process culminated in a Northstar Workshop held on October 25, 2005, where
Cambridge Systematics, Inc. ES-3
Minnesota Truck Size and Weight Project
project findings and candidate TS&W proposals were presented and discussed by a broad cross section of about 140 stakeholders.
Mn/DOT conducted an extensive analysis of TS&W alternatives in cooperation with the advisory committee for the project who represent a variety of industries, all levels of gov-ernment, and other interested organizations. The analysis methodology for the project was based on nationally accepted methods utilized by the National Academy of Sciences and the U.S. Department of Transportation.
Key Findings
Key findings of the outreach process were:
• The variations in TS&W laws across Minnesota road systems work against freight pro-ductivity. A more extensive “10-ton” road system is needed.
• The complexity of TS&W laws results in added cost to industry and complicates com-pliance. TS&W laws need to be simplified and industry training provided.
• Lack of consistency among states creates barriers to cross-border freight movement.
• Enforcement of TS&W laws, and the permitting process for heavy trucks, is inconsis-tent across jurisdictions; a centralized system may be needed.
• Spring load restrictions cause circuity of travel and loss of business.
• There needs to be increased flexibility of weight limits and vehicle configurations to allow greater payloads.
• There are concerns about the infrastructure impacts of increased weight limits, particu-larly on local roads and bridges.
• There are safety concerns about proposed increases in truck weight or length.
• There needs to be more investment in infrastructure and improved operations to achieve a more productive freight system.
• The proliferation of exemptions, exceptions, and tolerances in TS&W laws creates ineq-uities and adversely impacts enforcement and infrastructure.
The key finding of the technical analyses was that four heavier truck configurations were found feasible and generated net statewide benefits. A set of changes to spring load restric-tions and other related TS&W regulations were also developed and found to offer net bene-fits. Each of the proposed changes is further discussed below under Recommendations. The benefits and costs of each of the proposed changes are reported in Table ES.1. The evaluation considered transport savings, pavement costs, bridge inspection costs, rating and posting impacts, bridge fatigue and deck wear effects, increased bridge design load requirements, safety, and congestion.
ES-4 Cambridge Systematics, Inc.

Minnesota Truck Size and Weight Project
Table ES.1 Truck Size and Weight Proposal Benefits (Benefits in Millions of Dollars per Year; Negative Values Represent Increased Costs)
Transport Savings Pavements
Bridge Inspection, Rating & Posting
Bridge Fatigue and Decks
Increased Bridge Design Loads Safety Congestion
Total Net
Benefits Truck Size and Weight Package Elements
Proposed Vehicle Configurations
6-Axle 90,000 lb. Semi $3.68 $1.27 $-0.05 $0.15 $-0.96 $0.15 $0.18 $4.43
7-Axle 97,000 lb. Semi 4.00 2.24 -0.01 0.22 -0.64 0.23 0.23 6.27
8-Axle Twin 108,000 lb. 2.01 1.25 -0.01 0.14 -0.72 0.05 0.08 2.79
SU up to 80,000 lb. 6.27 0.55 0.00 0.10 -0.13 0.06 0.05 6.90
Subtotal $15.96 $5.31 $-0.07 $0.61 $-2.45 $0.49 $0.54 $20.39
Spring Load Restrictions and Other Legislative Policy Issues
Change SLR $8.82 $-2.34 $0.00 $0.04 $0.00 $0.44 $0.17 $7.12
80,000 lb. on 9-Ton System 24.82 -8.49 0.00 -0.83 0.00 1.65 0.72 17.87
Subtotal $33.64 $-10.83 $0.00 $-0.79 $0.00 $2.09 $0.89 $24.99
Total Package $49.60 $-5.52 $-0.07 $-0.18 $-2.45 $2.57 $1.43 $45.38
Cambridge Systematics, Inc. ES-5

Minnesota Truck Size and Weight Project
Recommendations
Based on technical analysis of alternative changes to TS&W laws, as well as the input from the outreach process, advisory committee feedback, the Northstar Workshop, and Departmental deliberations, the TS&W proposals detailed in Table ES.2 were recom-mended and advanced by Mn/DOT for legislative consideration consistent with the policy principles adopted for this study. The recommendations represent a balanced approach that protects highway infrastructure and safety while providing industry productivity improvements that will benefit Minnesota’s economy and competitiveness.
Expected Outcomes
Based on the analyses conducted for this study, the proposed package of TS&W law changes is expected to have significant net statewide benefits:
Impacts of Proposed Vehicle Configurations
• Increased payloads and fewer truck trips will lower transport costs significantly.
• Additional axles and fewer truck trips will result in less pavement wear.
• A modest increase in bridge postings and future design costs will be necessary.
• Proposed trucks have slightly higher crash rates but, given fewer overall truck miles (due to increased payloads) than would be experienced otherwise under existing weight limits, safety would improve slightly.
• The proposed vehicle configurations for operations above 80,000 pounds GVW meet internationally accepted heavy vehicle safety performance standards.
Impacts of Changing Spring Load Restrictions and Increasing Nine-Ton System to 80,000 Pounds
• Increased payloads and fewer truck trips will lower transport costs significantly.
• Pavement costs will increase somewhat due to increased weights carried on existing truck configurations.
ES-6 Cambridge Systematics, Inc.

Minnesota Truck Size and Weight Project
Table ES.2 Minnesota Truck Size and Weight Recommendations
Spring Load Restrictions and
Other Legislative Policy Issues Proposed Vehicle Configurationsa
6-Axle 90,000 lb. GVW on Non-Interstate 10-ton Network
7-Axle 97,000 lb. GVW on Non-Interstate 10-ton Network Change Spring Load Restrictions (SLR)
• Must meet bridge formula, axle, and tire weight limits
• 53 ft. maximum trailer length (no change) • 99,000 lb. GVW winter and seasonal increases; no
further tolerances or exemptions • Allowed on 10,000-mile 10-ton Network (not on
Interstates) • Requirements: permits with fees; axles to be added
by certified remanufacturer; brakes required on every wheel
• Must meet bridge formula, axle, and tire weight limits
• 53 ft. maximum trailer length (no change) • 99,000 lb. winter and seasonal increases; no further
tolerances or exemptions • Allowed on 10,000-mile 10-ton Network (not on
Interstates) • Requirements: permits with fees; axles to be added
by certified remanufacturer; brakes required on every wheel
• All county roads default to 7 tons per axle unless posted otherwise (instead of current 5 tons per axle)
• State trunk highways remain at 10 tons per axle unless posted otherwise
• City streets and township roads continue to default to 5 tons per axle unless posted otherwise
• SLR for gravel roads ends two weeks later than paved roads
80,000 lb. GVW Single Unit (SU) Truck on 10-ton Network
(including Interstate)
8-Axle 108,000 lb. Twin Trailer on Non-Interstate MN Twin Trailer
Network and National Truck Network
• Must meet bridge formula, axle, and tire weight limits
• 28.5 ft. each maximum trailer length (no change) • Allowed on pre-approved state trunk highway
routes only (approximately 6,700 miles) • No harvest or winter increases; no tolerances or
exemptions • Requirements: permits with fees; B-train coupling;
axles to be added by certified remanufacturer; brakes required on every wheel; driver CDL endorsement required for double trailer operation
• Must meet bridge formula, axle, and tire weight limits
• Vehicle length increase up to 45 ft. max (from current 40 ft.)
• Lift axles must be down with loads • Axles in excess of 4 must be self-steering castering
wheels • Requirements: permits with fees; axles to be added
by certified remanufacturer; breaks required on every wheel
There are a number of other legislative policy issues to be considered parallel to potential weight increases, which include: • Eliminate liability exemptions for farm implements
that damage roads or bridges • Remove the 73,280 lb. GVW limit for 5-axle semi-
trailers on 9-ton roads and allow axle weights and the bridge formula to control up to 80,000 lbs. GVW
• Eliminate seasonal harvest permits (still allow 10 percent harvest increase, but no requirement to obtain permits)
• Expand seasonal harvest allowance to include all farm crops
Note: a All configurations and drivers must meet Federal Motor Carrier Safety regulations.
Cambridge Systematics, Inc. ES-7

Minnesota Truck Size and Weight Project
Minnesota Truck Size and Weight Project – Final Report
Introduction
This report summarizes the approach, findings, and recommendations of the Minnesota Truck Size and Weight (TS&W) Project led by the Minnesota Department of Transportation (Mn/DOT) in cooperation with other public and private stakeholders. In light of changing patterns of economic growth and logistics, continuing increases in truck traffic, and numerous requests for changes to laws, it was decided that a comprehensive review of Minnesota’s TS&W laws was needed. The purpose of the project is to assess changes to Minnesota’s TS&W laws that would benefit the Minnesota economy while protecting highway infrastructure and safety.
Background: Minnesota’s Freight Challenge
Minnesota’s industries and economy depend on an efficient multimodal transportation network. Each year, nearly $600 billion in goods are transported in Minnesota, supporting agriculture, manufacturing, and retail growth throughout the State. Over the last few decades, demand for freight transportation has grown significantly and freight is pro-jected to further increase by about 60 percent by 2020 according to Mn/DOT’s Statewide Freight Plan.1 All modes of freight transportation are being challenged to increase capacity and improve productivity to respond to this growth.
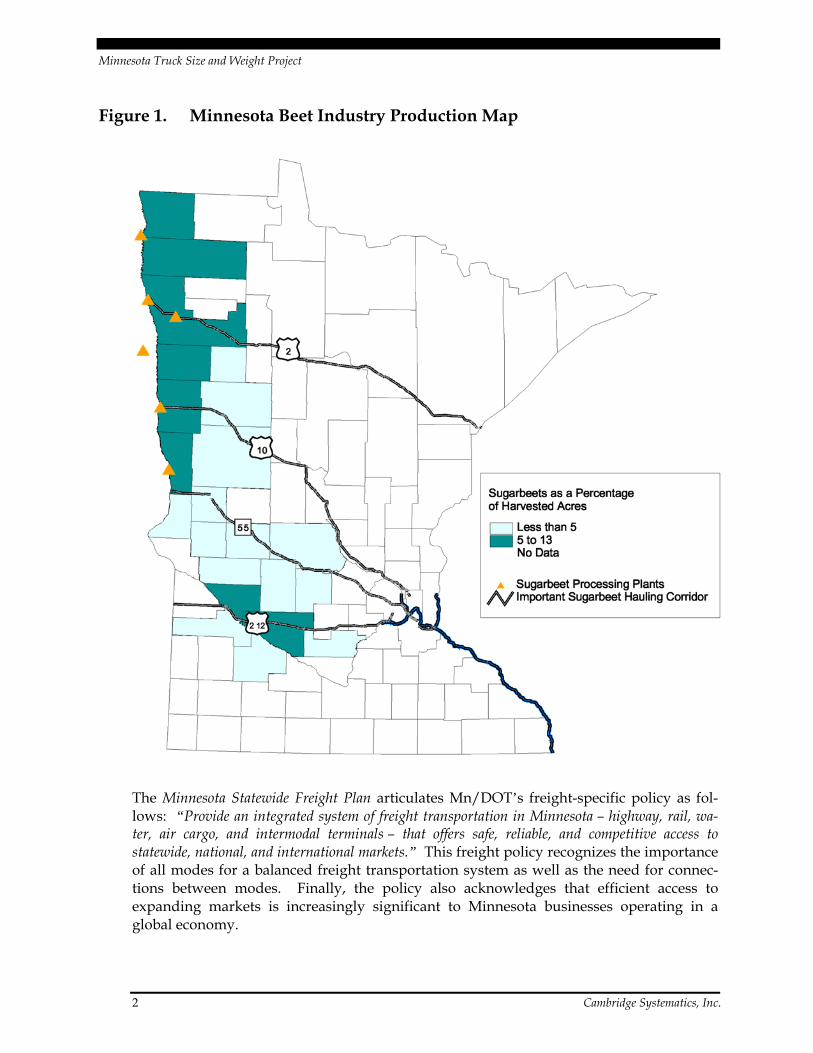
Minnesota operates in a regional economy, with states in the Upper Midwest and with Canada. Several of these jurisdictions have higher truck weight limits than Minnesota, which potentially puts Minnesota’s industries at a competitive disadvantage. For exam-ple, North and South Dakota operate vehicles at weights up to 105,500 and 129,000 pounds, respectively, (versus an 80,000-pound limit in most instances within Minnesota). Minnesota’s agricultural industries directly border these states and are impacted com-petitively by the lower vehicle productivity in Minnesota. A good example is Minnesota’s beet industry, which directly abuts North and South Dakota as illustrated in Figure 1.
1 Minnesota Statewide Freight Plan, prepared for the Minnesota Department of Transportation, Office
of Freight and Commercial Vehicle Operations by Cambridge Systematics, Inc., May 2005.
Cambridge Systematics, Inc. 1
Minnesota Truck Size and Weight Project
Figure 1. Minnesota Beet Industry Production Map
The Minnesota Statewide Freight Plan articulates Mn/DOT’s freight-specific policy as fol-lows: “Provide an integrated system of freight transportation in Minnesota – highway, rail, wa-ter, air cargo, and intermodal terminals – that offers safe, reliable, and competitive access to statewide, national, and international markets.” This freight policy recognizes the importance of all modes for a balanced freight transportation system as well as the need for connec-tions between modes. Finally, the policy also acknowledges that efficient access to expanding markets is increasingly significant to Minnesota businesses operating in a global economy.
2 Cambridge Systematics, Inc.

Minnesota Truck Size and Weight Project
Mn/DOT is pursuing a multimodal approach to meeting the challenges of freight trans-portation and trade growth. In addition to considering TS&W increases and related highway network changes to improve truck freight productivity, Mn/DOT operates intermodal freight programs, such as the Minnesota Rail Service Improvement Program and the Port Development Assistance Program, which were established to preserve and modernize basic freight infrastructure for those modes. Minnesota has assisted regional railroads to become more productive by upgrading tracks to accommodate heavier rail cars and also making other capacity improvements. Minnesota also works with the ports to improve access and competitiveness.
Minnesota Truck Size and Weight Laws within the National and Upper Midwest Regional Context
The laws governing commercial vehicle size and weight are intended to preserve Minnesota’s highway infrastructure from undue damage caused by heavy vehicles. At the same time, the regulations seek to maintain highway safety as well as foster the pro-ductivity of shippers and receivers in support of the State’s economy and competitiveness. The current regulations contain exceptions, usually granted through permit, that ensure the economic viability of Minnesota’s basic industries, including agriculture, forestry, and paper production. Mn/DOT and the Department of Public Safety have administrative and enforcement responsibilities to ensure adequate compliance with Federal and State regulations. Counties and local jurisdictions also administer and enforce commercial vehicle size and weight regulations on their roads.
Federal Regulations
The Federal Highway Administration (FHWA) is responsible for administering the Federal regulations governing commercial vehicle (truck and bus) sizes and weights. The statutory authority for the Federal oversight of vehicle size and weight activities is described in three locations within the U.S. Code (U.S.C.), Titles 23 and 49:
• Title 23 U.S.C. 127 establishes weight limits states shall allow and must enforce on the Interstate system;
• Title 23 U.S.C. 141 requires states annually certify that they are adequately enforcing all state laws regarding size and weight limits as a prerequisite for receipt of Federal-Aid Highway funding; and
• Title 49 U.S.C. 31111-31115 establishes minimum size requirements on the National Network (NN) and access routes to the NN.
The entire set of regulatory provisions that guide the administration of the vehicle size and weight activity are found in the Code of Federal Regulations (CFR), Volume 23,
Cambridge Systematics, Inc. 3

Minnesota Truck Size and Weight Project
Parts 657 and 658. These two sections outline the responsibilities of the Federal program, including the procedures for state certification and enforcement of Federal size and weight limits, as well as requirements for the NN of highways, including the vehicle size and weight limits that must be enforced on those NN highways to guarantee state eligibility for Federal highway funding.
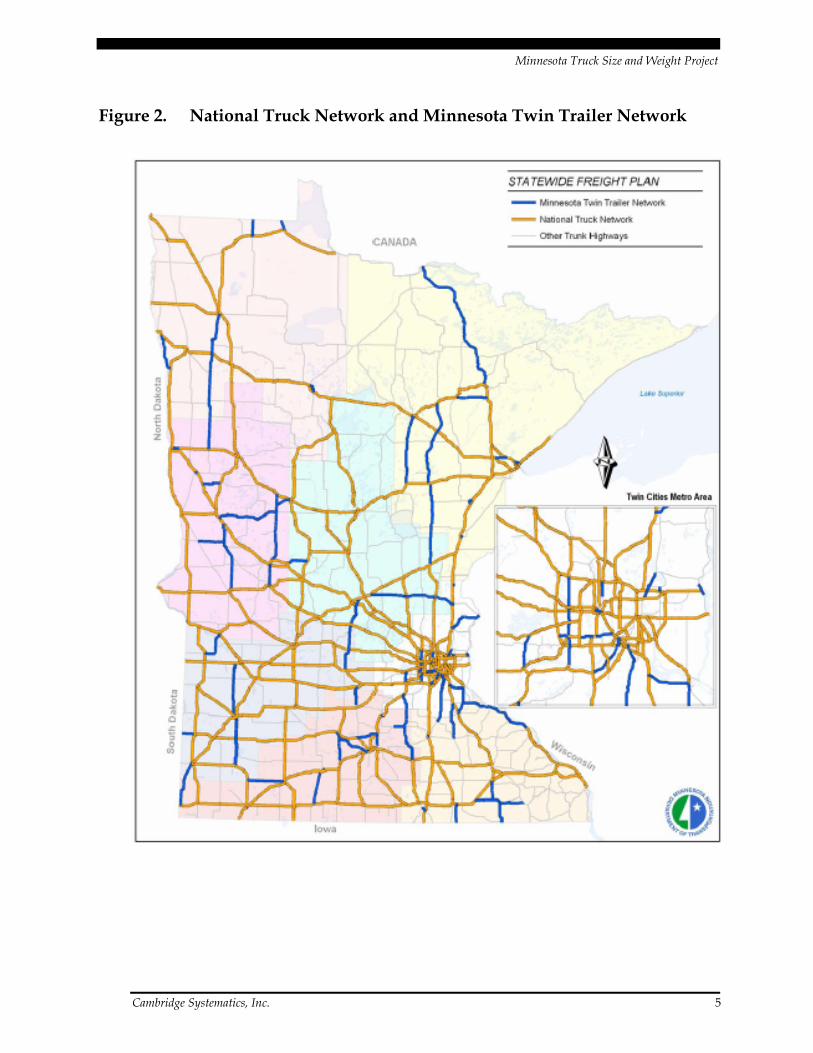
The NN is defined in CFR 23, Part 658 as “the Interstate System plus other qualifying Federal-Aid Primary System Highways in existence on June 1, 1991.” Appendix B of the regulation provides a listing of routes that comprise the 4,904 miles of designated NN roadway in Minnesota. The NN is supplemented by Minnesota’s Twin Trailer Network, a system of other trunk and local highways on which doubles also may operate, as repre-sented in Figure 2. The regulation also provides for “reasonable access” to the NN from terminals. It requires that states designate reasonable access routes and make that infor-mation available to motor carriers.
The current Federal limits on length, width, and weight applicable to the NN are based on dimensions specified in the 1982 Surface Transportation Assistance Act (STAA). In their most basic form, limits on state regulations are set forth as follows:
• Length – 48 feet minimum trailers for tractor-trailer combinations and 28 feet mini-mum on any trailer in either a tractor-semi or trailer-trailer combination, applicable to NN routes.
• Width – 102-inch minimum and maximum width applicable to the NN routes.
• Weight – 80,000 pounds maximum gross vehicle weight (GVW) limit applicable to the Interstate System, except where the bridge formula dictates a lower vehicle weight:
− 20,000 pounds per single axle; and
− 34,000 pounds per tandem axle.
The bridge gross weight formula also is set forth in this section to specify the maximum gross weight allowed on any group of two or more consecutive axles based on the rela-tionship between the number of axles and the distance between axles.
A number of states have grandfathered exceptions to these general limits, but Minnesota is not among them.
Longer Combination Vehicle Freeze
The regulation also affirms the Intermodal Surface Transportation Efficiency Act of 1991 (ISTEA) freeze on permitting longer combination vehicles (LCV) on the NN. LCVs include any tractor and double or triple trailer, or double semitrailer combinations, excluding the STAA-authorized twin 28 foot allowed on the NN with a GVW in excess of 80,000 pounds. Minnesota does not have any LCV regulations grandfathered under ISTEA; therefore, LCVs could not be allowed on the NN in Minnesota.
4 Cambridge Systematics, Inc.
Minnesota Truck Size and Weight Project
Figure 2. National Truck Network and Minnesota Twin Trailer Network
Cambridge Systematics, Inc. 5

Minnesota Truck Size and Weight Project
Minnesota Truck Size and Weight Laws
Minnesota TS&W laws largely follow Federal limits for gross, axle, and bridge formula. Tire load is an additional requirement by the State. The Minnesota TS&W laws are spelled out in Minnesota Statues Chapter 169, Section 080.
The application of GVW and axle weight limitations vary by highway type in Minnesota: Designated Highways and Non-Designated Highways.
Designated Highways (10-Ton Network)
Designated Highways include Interstates, U.S. highways, most Minnesota state trunk highways, and certain designated local highways. The weight limits on this system are:
• 80,000 pounds GVW, for any vehicle combination with five or more axles with mini-mum spacings; and
• 20,000 pounds for any single axle and 10,000 pounds for any single wheel.
Non-Designated Highways
Non-Designated Highways are other streets and county roads within the State (all routes other than state trunk highways and routes designated under Minnesota Statute 169.832, Subd. 11), divided into three groups based on single-axle weight limits: 9-Ton Network; 7-Ton Network, and 5-Ton Network.
Weight limits on the 9-Ton Network are:
80,000 pounds GVW for any vehicle combination with six or more axles with minimum spacings; 73,280 pounds GVW for any vehicle combination with five axles with minimum spacings; 18,000 pounds for any single axle; and 9,000 pounds for any single wheel.
Weight limits on the 7-Ton Network are:
14,000 pounds for any single axle; and 7,000 pounds for any single wheel.
Weight limits on the 5-Ton Network are:
10,000 pounds for any single axle; and 5,000 pounds for any single wheel.
Tire Load
Tire weight limits are universally applicable over all highway systems in the State. No tire may exceed 600 pounds per inch width on a steer axle (maximum two steer axles) or more than 500 pounds per inch on non-steer axles. The manufacturers’ tire load capacity may not be exceeded.
6 Cambridge Systematics, Inc.

Minnesota Truck Size and Weight Project
Axle Weight and Bridge Restrictions
In addition to the axle restrictions by highway type, bridge restrictions also limit axle weights.
• Bridges are posted where the rated weight capacity is less than the highway allows.
• Consecutive axles are limited to four:
− Unless the additional axles are steering or castering axles, consecutive axles must comply with the limitations related to spacing in Minnesota Statue 169.822 and cannot exceed 20,000 pounds gross axle weight.
− On the Interstate and Defense Highways, the maximum GVW for a five-axle vehi-cle is 80,000 pounds, but vehicles must still comply with Federal axle weight limits as well.
• More specific restrictions are contained in the Gross Weight Schedule of the Minnesota Statutes (169.824), specifically in the Table of Axle Weight Limits, which dictates maximum gross weight for axle groups based on the number of consecutive axles in a group and the distance between the centers of foremost and rearmost axles of a group for axle groups between two and seven axles.
More detail on Minnesota and Federal TS&W laws may be found in Appendix B.
Summary of Truck Size and Weight Laws in Neighboring States and Provinces in Comparison to Minnesota
Tables 1 and 2 show the dimension and weight limits in Minnesota in comparison to neighboring states and provinces.
Truck width is common throughout the jurisdictions at the Federal minimum of 102 inches. Lengths of conventional STAA vehicles are obviously common among the states but, of course, those lengths do not apply in Canada. Single-unit truck lengths are fairly standard among the states and provinces, averaging about 40 feet maximum length. North Dakota and South Dakota are the exceptions, with longer lengths of 50 feet and 45 feet respectively for single-unit trucks. LCV lengths vary among the jurisdictions that allow them; however, Minnesota does not permit them. Gross weight is where the great-est variance occurs among jurisdictions. Minnesota’s neighbors to the west allow heavier weights on single- and double-trailer combinations as does Canada. Because Minnesota’s agricultural and natural resource industries abut these jurisdictions, competitive pressures are common.
Cambridge Systematics, Inc. 7

Minnesota Truck Size and Weight Project
Table 1. Summary of Maximum Truck Dimensions in Minnesota and Neighboring States and Provinces
Minnesota Iowa Michigan North
Dakota South
Dakota Wisconsin Federal Manitoba Ontario Dimension
Width (Inches) 102 102 102a 102 102 102 102 102 102
Height (Feet) 13.5 13.5 13.5 14 14 13.5 No limit 13.67 13.67
Length Single Unit (Straight Truck) 40 40 40 50 45 40 No limit 41.2 41.2 Semitrailer 53 53 53b 53 53 53 48 minimum 53.39 53.39 Twin Combinations Maximum Trailer Length
28.5 28.5 28.5 53c 45d 28.5 No limit 82.4e 82.4e
LCVs Allowed Nof Yesg Yes Yes Yes No Varies by state Yese Yese
Notes: a Michigan limits width to 96 inches off the Interstate/Designated systems. b Michigan limits semitrailer length to 50 feet off the Interstate/Designated systems. c Overall length of 110 feet on Interstate, 95 feet on state highways, and 75 feet on other roads. d Maximum total length of 81.5 feet measured from front of first trailer to rear of last trailer, including hitching device. e Manitoba and Ontario each have configuration-based guidelines for twin trailer length and overall twin length cannot exceed 82.4 feet. f STAA doubles are allowed in all states on the NN and, in Minnesota, they are further allowed on the designated Minnesota Twin Trailer
Network. g LCVs, including double- and triple-trailer combinations, are allowed on a limited basis up to 100 feet in length.
8 Cambridge Systematics, Inc.

Minnesota Truck Size and Weight Project
Table 2. Summary of Maximum Truck Weights in Minnesota and Neighboring States and Provinces
Weights Minnesota Iowa Michigan North
Dakota South
Dakota Wisconsin Federal Manitobaa Ontario
5-Axle Vehicle 80,000 80,000 80,000 80,000 80,000 80,000 87,083 97,224bGVW Interstate 6-Axle Vehicle 80,000 80,000 101,400c 100,000 88,000 80,000
80,000 102,515 111,333b
5-Axle Vehicle 80,000d 80,000e 87,400 88,000 81,200 80,000 82,673 97,224bOther State Highways 6-Axle Vehicle 80,000d 80,000f 101,400c 105,500 88,700g 80,000
80,000 98,106 111,333b
Single-Axle Weight 20,000 20,000 20,000 20,000 20,000 20,000 20,000 20,062 22,000 Tandem (2-Axle) Weight 34,000 34,000 34,000 34,000 34,000 34,000 34,000 37,478 39,700
Axle Weights
Tridem (3-Axle) Weight 42,000 42,000 42,000 48,000 42,000 42,000 See h 52,911 57,320i
Gross Vehicle Weight 92k/144k 100k/160k 80k/164k 103k/136k 116kk 110k/191k 137,788l 139,994l
Single Axle 20,000 20,000 13,000 20,000 31,000 20,000 20,062l 20,062l
Routine Maximum Permitj
Double Axle 40,000 40,000 26,000 45,000 52,000 60,000 N/A
37,478l 37,478l
Spring Load Restrictions Yes Yesm Yesm Yesm Yes Yes Yes Yes Yes Seasonal Limits Winter Weight Increase Yes
88,000 No No Yes
10 percent No No N/A Yes No
Notes: a Manitoba weight limits depend on the highway classification, axle spacing, and configuration type; limits here are shown for five- and six-axle tractor and semitrailer combinations on the Roads and Transportation Association of Canada (RTAC) System (roughly Interstate equivalent) and A-1 system (roughly equivalent to “Other State Highways”). Lower limits exist for the B-1 Provincial system. Maximum axle weights shown are for the RTAC System.
b GVW limits in Ontario depend on axle spacings; the values in the table reflect the generally applicable limits. The maximum limits are 105,600 pounds GVW for five axles and 123,860 pounds GVW for six axles.
c Based on axle spacing and tire size. Vehicles with 11 axles and proper axle spacings of 164,000 pounds GVW maximum. d On the 9-ton system, five-axle combinations may operate with a maximum of 73,280 pounds GVW and six axles up to 80,000 pounds GVW. Lower limits apply
to the 7- and 5-ton systems. e On non-Interstates, five-axle livestock trucks with spread-axle trailers are allowed 86,000 pounds GVW. f Construction and livestock vehicles up to 96,000 pounds. g Maximum GVW is controlled by Federal Bridge Formula (maximum practical GVW is 129,000 pounds). h There is no set maximum specified in Federal regulations for tridem axles, but the Federal Bridge Formula allows for tridem axle weights between 34,000 and
60,000 pounds depending on wheel spacing of the axle group. i Effective January 2006. j Permits issued regularly without special conditions and include widely used configurations for specific industries. k Five-axle routine permit value is estimated assuming two, 52,000-pound tandem groups, and 12,000-pound steer axle. Ad hoc determination based on 600
pounds per inch width of tire and proper axle spacings. l Determination on a case-by-case basis. m In Iowa, Michigan, North Dakota, and South Dakota few state roads are posted with Spring Load Restrictions.
Cambridge Systematics, Inc. 9

Minnesota Truck Size and Weight Project
TS&W Issues and Considerations
This section reviews TS&W issues and considerations important to the Minnesota TS&W Project.
Industry Challenges and Considerations
TS&W limits affect freight transportation costs because they control the amount of pay-load that can be carried in a truck. For high-density freight, the maximum payload of a truck is usually controlled by the difference between its practical maximum GVW and its empty weight. For low-density freight, the maximum payload of a truck is usually con-trolled by its cubic capacity.
Raising truck weight limits increases the allowable weight per trip, so fewer trips are required to carry the same amount of goods. This effect is illustrated schematically in Figure 3. Large trucks reduce the number of trucks and truck trips needed to serve the economy at a given time. The volume of freight and trucks will continue to grow with population and the economy over time, but fewer trucks will be required. Trucks designed to operate at higher gross weights generally have higher empty weights and cost more to operate on a per vehicle-mile basis. These factors, however, only partially offset the productivity gains associated with fewer trips.
Not all high-density freight shipments can take advantage of increased weight limits. While trucks carrying finely divisible commodities (e.g., liquids or grain) can be loaded very close to their theoretical capacities, this often is not possible for trucks carrying indi-visible loads (e.g., steel coils or machinery). In addition, increases in weight limits that are applicable only to certain highways may not be useful to trucks that also must use other highways. (Trucks must be loaded to the most restrictive limit encountered on their trips or face the possibility of being fined for running illegally.)
Freight transportation cost savings due to increases in TS&W limits accrue to shippers, carriers, and consumers. The share to each depends primarily on the competitive struc-ture of the markets for the goods being transported. In highly competitive markets, more of the benefits are received by consumers. In less competitive markets, more of the bene-fits are received by shippers and carriers.
Increases in truck weight limits also can affect the total amount of freight carried by trucks, either by causing shifts from other modes of transport (most notably from rail to truck) or by increasing the total amount of freight shipped. Diversion of freight from rail to truck is expected to be relatively small for the scenarios examined, because most of the competition between truck and rail is for longer-haul Interstate type movements (e.g., more than 500- to 700-mile) shipments. The heavier vehicle freight movements considered in this study would occur on the Minnesota state trunk highways and lower systems and would be of a shorter regional nature.
10 Cambridge Systematics, Inc.

Minnesota Truck Size and Weight Project
Figure 3. Illustration of Reduced Truck Trips with Higher Payloads
Pavement Considerations
Engineers design roads to accommodate projected vehicle loads, in particular, heavy vehi-cle axle loads. The life of a pavement is related to the magnitude and frequency of these heavy axle loads. Pavement engineers use the concept of an equivalent single-axle load (ESAL) to measure the effects of heavy vehicles on pavements. By convention, an 18,000-pound single axle is 1.00 ESAL. The American Association of State Highway and Transportation Officials (AASHTO) conducted research to develop ESAL values for sin-gle, tandem, and tridem axles at different weights on different types of pavements. The effect of a vehicle on pavements can be estimated by summing the ESAL values for each of its axles.
Cambridge Systematics, Inc. 11

Minnesota Truck Size and Weight Project
The original AASHTO research on pavements found that ESAL values varied approxi-mately as the fourth power of axle weight.2 This means, for example, that the effect of a 20,000-pound single axle would be about 52 percent greater than the effect of an 18,000-pound axle because (20/18)4 = 1.52.
Adding axles to a truck can greatly reduce its effect on pavement. A conventional five-axle tractor-semitrailer operating at 80,000 pounds is about 2.4 ESALs. If the weight of this vehicle were increased to 90,000 pounds (a 12.5 percent increase), its ESAL value goes up to 4.1 (a 70.8 percent increase), because pavement damage increases at a geometric rate with weight increases. However, a six-axle tractor-semitrailer at 90,000 pounds has an ESAL value of only 2.0 because its weight is distributed over six axles instead of five. An added pavement benefit of the 90,000-pound six-axle truck is that fewer trips are required to carry the same amount of payload. Consequently, the six-axle truck at 90,000 pounds produces almost 30 percent fewer ESAL miles per payload ton-mile than the five-axle truck at 80,000 pounds. Table 3 shows the ESAL values for flexible pavements for the con-figurations being considered in this study. All the configurations under consideration in this study are better for pavements than the current five-axle tractor-semitrailer at 80,000 pounds based on ESAL factors.
Table 3. Equivalent Single-Axle Load Values for Flexible Pavements
Configuration Total ESALs
Current 5-axle tractor-semitrailer at 80,000 lbs. 2.4
6-axle tractor-semitrailer at 90,000 lbs. 2.0
7-axle tractor-semitrailer at 97,000 lbs. 1.5
8-axle double at 108,000 lbs. 1.8
Single unit 6- and 7-axle respectively 0.7 and 0.9
The effect of ESALs on pavements is not constant throughout the calendar year. During the winter when the ground is frozen, a given traffic loading does much less damage to pavements than at other times of the year. During the spring, pavement layers are gener-ally in a saturated, weakened state due to partial thaw conditions and trapped water. A given traffic loading during spring thaw results in five to eight times more damage to pavements than that same loading at other times of the year.
2 Recent developments in pavement analysis have found that ESAL values vary depending on the
type of pavement distress under consideration. Nonetheless, the fourth power rule from the original AASHTO research remains a useful approximation in estimating the overall effect of traffic loadings on pavements.
12 Cambridge Systematics, Inc.

Minnesota Truck Size and Weight Project
Bridge Considerations
Increases in truck weight limits can affect bridges and bridge-related costs in several ways:
• If the vehicles made legal by changes in limits exceed the overstress criteria for a bridge, the bridge must be posted to prevent those vehicles from using it.
• The possibility that a bridge might need to be posted will increase agency costs for inspecting and rating bridges and also for placing bridge posting signs.
• Agencies may be pressured to replace posted bridges so that bridges can be used by all trucks.
• Illegal overloads can overstress bridges, resulting in permanent damage and, in extreme cases, catastrophic bridge failure.
• Concrete decks and other bridge elements can wear out with repetitive loadings by heavy vehicles.
• If legal loadings are increased, it may be necessary to increase the loadings used in designing new and replacement bridges, which, in turn, will increase costs for these structures.
The number, spacing, and weight of individual axles, as well as the GVW carried, on a truck are important considerations for bridges. The Federal Bridge Formula, known as Formula B, is designed to protect bridges from overstress. Formula B specifies the maxi-mum weight that can legally be carried on a group of contiguous axles, depending on the number of axles in the group and the distance from the first to the last axle.3 Longer vehi-cles with wider axle spacings have less concentrated loads, and therefore result in less stress on bridge members. For this reason, Formula B allows longer axle groups to carry heavier weights. Minnesota truck weight laws include a table of maximum weights for axle groups, based on Formula B, with a few modifications.
The FHWA, in its brochure Bridge Formula Weights, explains the importance of axle weights and their distribution as follows:
“Axle spacing is as important as axle weight in bridge design. A bridge is analogous to thin ice on a pond. Walking on the ice concentrates a person’s weight on the small area covered by the individual’s feet, and then the ice may break. Lying down, however, spreads the same weight over a much
3 The formula is: W = 500 [ L N / ( N – 1 ) + 12 N + 36 ] where W is the maximum weight of the
axle group, L is the distance from the first to last axle in feet, and N is the number of axles. The Federal Highway Administration’s brochure Bridge Formula Weights is available at: http://www.ops.fhwa.dot.gov/freight/publications/bridge_frm_wts/index.htm.
Cambridge Systematics, Inc. 13

Minnesota Truck Size and Weight Project
larger area, and the ice is less likely to break. Consider trucks crossing a bridge as shown in Figure 4:4
Figure 4. Bridge Crossing Scenario
In Figure 4 (A), the stress on bridge members as the longer truck rolls across is much less than that caused by the short vehicle in Figure 4 (B), even though both trucks have the same total weight and individual axle weights. The weight of the longer vehicle is spread out, while the shorter vehicle has all of the weight concentrated on a small area.”5
Highway Safety Considerations
Highway safety is an important consideration in TS&W regulations as changes can affect highway safety by:
4 The original figure in the Federal Highway Administration brochure is labeled Figure 1. 5 U.S. Department of Transportation, Federal Highway Administration, Bridge Formula Weights,
January 1994.
14 Cambridge Systematics, Inc.

Minnesota Truck Size and Weight Project
• Increasing or decreasing the amount of truck traffic, which in turn affects the number of crashes;
• Changing operating weights and weight-related performance characteristics (i.e., roll-over potential and speed, acceleration, and braking capabilities);
• Encouraging carriers to adopt different types or designs of vehicles, which may have higher or lower crash rates than those currently in use; and
• Causing trucks to shift to highways with higher or lower crash rates than those on which they currently are operating.
All of these factors were analyzed for the Minnesota TS&W Project as discussed in the Project Approach below.
Project Approach
In carrying out the TS&W Project, Mn/DOT undertook an extensive outreach process; set up Policy and Technical advisory committees, representing a variety of industries, all lev-els of government, and other interested organizations; and carried out an extensive ana-lytical evaluation of TS&W alternatives.
The Outreach Process
An extensive outreach process was conducted for this project. Regional meetings were held around the State and more than 35 meetings were held with individual stakeholder organizations.
The outreach process culminated in a Northstar Workshop, held on October 25, 2005, where candidate TS&W proposals were presented and discussed by a broad cross section of stakeholders totaling approximately 140 people.
Guiding Principles
In undertaking this study, a set of guiding principles was established in cooperation with the Policy and Technical Advisory Committees created by Mn/DOT. The principles are:
• Changes will be within the envelope allowed by Federal TS&W law;
• Changes should seek to protect highway infrastructure at all levels of government;
• Changes should not be a detriment to highway safety;
Cambridge Systematics, Inc. 15

Minnesota Truck Size and Weight Project
• Changes should benefit the Minnesota economy and competitiveness of industry;
• Changes should promote the uniform application of TS&W provisions within the State and, where possible, with neighboring states;
• Changes should promote equity and fairness in application;
• Users should pay the costs they impose on the system;
• Changes should promote ease of compliance, administration, and enforcement; and
• Changes should be consistent with Mn/DOT transportation performance measures and the infrastructure considerations of local jurisdictions.
Analysis Methodology
Mn/DOT conducted an extensive analysis of TS&W alternatives in cooperation with the advisory committees. The analysis methodology was based on nationally accepted meth-ods utilized by the National Academy of Sciences (NAS) and the U.S. Department of Transportation (DOT). The methodology is briefly summarized below:
Analysis Procedures for Transport Cost Calculations
The Comprehensive Truck Size and Weight Study Report to Congress in 2000 by the U.S. DOT was the primary source for the analysis of truck traffic shifts and transport cost impacts of alternative scenarios.6 That study provided detailed distributions of truck traffic by state, highway system, truck type, and operating weight, which were adjusted to be consistent with Mn/DOT traffic data. The U.S. DOT study also provided operating costs (in dollars per vehicle-mile) for different types of trucks.
The analysis for the Minnesota TS&W Project included estimates of the amount of freight (measured in payload ton-miles) that would shift from conventional five-axle tractor-semitrailers to the new trucks that would become legal under different scenarios. The analysis also included estimates of the amount of freight that would shift from Interstate to non-Interstate highways for scenarios that would result in higher-weight limits off of the Interstate system.
The possibility of increasing the amount of freight carried by truck (as a result of either diversion from rail or an increase in the total amount of freight shipped because of lower transport costs) was investigated through sensitivity analysis.
6 U.S. Department of Transportation/Federal Highway Administration’s Comprehensive Truck Size
and Weight Study available at http://www.fhwa.dot.gov/policy/otps/truck/index.htm.
16 Cambridge Systematics, Inc.

Minnesota Truck Size and Weight Project
Analysis Procedures for Pavement Impacts
Pavement costs were estimated based on changes in ESAL-miles for each scenario. With both lower ESALs and fewer vehicle-miles for scenario trucks, pavement costs were lower than current for all configuration scenarios. Two different approaches were used to cal-culate pavement costs: road user costs and agency costs, as explained in the appendices. To quantify pavement effects on road users, relationships between pavement conditions and road user costs from the FHWA’s Highway Economic Requirements System (HERS) model were used.
The effect of ESALs on pavements is not constant throughout the year. During the winter, when the ground is frozen, a truck carrying a given load causes much less damage to pavements than at other times of the year. During the spring, the inverse is true: pave-ment layers are generally in a saturated, weakened state due to partial thaw conditions and trapped water, causing greater pavement damage by the same truck. The methodol-ogy accounted for the seasonal impacts of TS&W changes.
Analysis Procedures for Bridge Impacts
Additional posted bridges under each scenario were identified by the Mn/DOT Bridge Office using “worst-case” legal loadings for the scenarios and information on the load-bearing capacity of individual bridges from the Minnesota bridge inventory. Bridge inspection, rating, and posting costs were estimated by applying unit costs to the number of additional posted bridges under each scenario.
Bridge fatigue costs were estimated using procedures from Transportation Research Board (TRB) Special Report 2277 in which fatigue costs were proportional to the third power of stresses in bridge elements. Cost for concrete bridge decks were calculated based on the effects of traffic loadings on deck lives in which traffic loadings were proportional to the fourth power of axle weight as with pavements.
Of the additional posted bridges necessitated by each scenario, potential bridge replace-ment costs were analyzed using data from the Mn/DOT bridge inventory. A cost-benefit analysis was performed to see if any of these posted bridges justified replacement based on detours of scenario freight. Finally, revised bridge design requirements for new or replacement bridges were considered in light of potential truck weight increases.
Analysis Procedures for Safety Impacts
For this study, the consultant team used safety analysis methods from the National Academy of Sciences, Transportation Research Board (TRB) TS&W Special Report 225 Truck Weight Limits: Issues and Options which reported that crash rates per vehicle-mile
7 Transportation Research Board, New Trucks for Greater Productivity and Less Road Wear – An
Evaluation of the Turner Proposal, Special Report 227, National Research Council, 1990.
Cambridge Systematics, Inc. 17

Minnesota Truck Size and Weight Project
increase modestly with gross weight due primarily to the fact that increasing a truck’s load raises its center of gravity and thereby increases the likelihood of rollover accidents. The TRB study also found no conclusive evidence of increases in crash severity with the heav-ier weights.8 The report concluded that the “Severity of truck accidents is not sensitive to truck configuration, and given that a truck accident occurs, the probability of fatalities or injuries are not sensitive to changes in truck weight” (1990, 133). The TRB Report 225 also concluded that, although heavier vehicles have slightly higher crash rates, the increased payload for heavier vehicles means that fewer trips are required. For the Mn/DOT TS&W Project, this factor more than offsets the slightly higher crash rates of heavier trucks (as shown in Appendix F – Methodology), resulting in slightly fewer predicted crashes over-all with the proposed heavy vehicle configurations.
Research has found that double-trailer trucks have slightly higher crash rates than tractor-semitrailers after adjustments to raw crash rates are made to account for the fact that dou-bles tend to operate a higher percentage of their miles on Interstate highways, which are safer than other roads.9 Truck technology enhancements can improve the safety perform-ance of doubles. For example, Canada provides for increased weight on a “B-train” dou-ble configuration in which the second trailer is connected directly to a “fifth wheel” on back of the first trailer. This feature can reduce rollover-type crashes. Minnesota has therefore included this requirement in its TS&W proposals.
In regard to heavy vehicle crash causation, a recently published Federal study10 found that in two-vehicle crashes that occurred between truck and passenger vehicles, the passenger vehicle was responsible in a majority of the crashes. The critical crash causation reasons assigned for both truck and passenger vehicles were similar – driver recognition and driver decisions.
Braking requirements was one of the significant issues considered. Table 4 from work done by the University of Michigan Transportation Research Institute (UMTRI) 11 for this study shows the maximum GVW for each configuration, the corresponding manufacturer’s brake capacity rating (GAWR) expressed in terms of vertical axle load, and percent brake surplus available for the vehicle configuration. The results show that there is surplus brake capacity for all of the proposed vehicle configurations as defined by Federal Motor Vehicle Safety Standards (FMVSS-121). In all cases, the proposed vehicles have more brake capacity than the current five-axle tractor-semitrailer when categorized on the basis of normal and winter weights. It follows therefore, that under loaded
8 Transportation Research Board, Truck Weight Limits: Issues and Options, Special Report 225,
National Research Council, 1990. 9 Campbell, K. et al., Analysis of Accident Rates of Heavy-Duty Vehicles, University of Michigan
Transportation Research Institute, 1988. 10 http://www.fmcsa.dot.gov/facts-research/research-technology/report/ltccs-2006.htm#EXECSUM. 11 University of Michigan Transportation Research Institute, Performance-Based Evaluation of Selected
Heavy Vehicles (Draft, Version 3), August 2006.
18 Cambridge Systematics, Inc.

Minnesota Truck Size and Weight Project
conditions, the proposed vehicle configurations will have better stopping distance performance than the existing five-axle tractor-semitrailers.
Table 4. Surplus Brake Capacity by Configuration
Regulated GVW
Σ GAWR Brake Capacity
GAW Brake Requirement
Percent Surplus Brake Capacity Vehicle Configuration
5-Axle semi 80,000 92,000 80,000 15.0
5-Axle semiwinter 88,000 92,000 88,000 4.5
6-Axle semi 90,000 112,000 90,000 24.4
6-Axle semiwinter 99,000 112,000 99,000 13.1
7-Axle semi 97,000 132,000 97,000 36.1
7-Axle semiwinter 99,000 132,000 99,000 33.3
8-Axle B-Train 108,000 152,000 108,000 40.7
7-Axle Single-Unit Truck 80,000 132,000 80,000 65.0
Note: Gross Axle Weight Rating assumptions: Steer axle 12,000 pound Drive axle 20,000 pound Trailer axle 20,000 pound
UMTRI further supported the Mn/DOT TS&W Project with its evaluation of internation-ally accepted safety performance measures for single-unit, tractor-semitrailer, and double-trailer configurations as discussed in Appendix E. The vehicle performance evaluation methodology was originally developed by the University of Michigan for Canada’s 1988 Weights and Dimensions Study12 and recently used in the FHWA’s Comprehensive Truck Size and Weight Study and Western Longer Combination Scenario Analysis13.
12 Ervin, R.D. and Guy Y. The influence of weights and dimensions on the stability and control of heavy-
duty trucks in Canada. Volume II – appendices. Final report. University of Michigan Transportation Research Center, 1986. Available at http://deepblue.lib.umich.edu/handle/2027.42/94.
13 The U.S. Department of Transportation/Federal Highway Administration’s Comprehensive Truck Size and Weight Study and Western Longer Combination Scenario Analysis are available at http://www.fhwa.dot.gov/policy/otps/truck/index.htm.
Cambridge Systematics, Inc. 19

Minnesota Truck Size and Weight Project
Findings and Recommendations
Outreach Findings
Key findings of the outreach process were:
• The variations in TS&W laws across Minnesota’s road systems (i.e., different weight limits for different types of roads) work against freight productivity. A more exten-sive “10-ton” road system is needed.
• The complexity of TS&W laws results in added cost to industry and complicates com-pliance. TS&W laws need to be simplified and industry training provided.
• Lack of consistency among states creates barriers to cross-border freight movement.
• Enforcement of TS&W laws, and the permitting process for heavy trucks, is inconsis-tent across jurisdictions; a centralized system may be needed.
• Spring Load Restrictions (SLR) cause circuity of travel and loss of business.
• There needs to be increased flexibility of weight limits and vehicle configurations to allow greater payloads.
• There are concerns about the infrastructure impacts of increased weight limits, par-ticularly on local roads and bridges.
• There are safety concerns about proposed increases in truck weight or length.
• There needs to be more investment in infrastructure and improved operations to achieve a more productive freight system.
• The proliferation of exemptions, exceptions, and tolerances in TS&W laws creates ineq-uities and adversely impacts enforcement and infrastructure.
Analysis Findings
The key finding of the technical analyses was that four heavier truck configurations were found feasible and generated net statewide benefits. A set of changes to SLR and other related TS&W regulations were also developed and found to have net benefits. Each of the proposed changes is further discussed below under Recommendations. The benefits and costs of each of the proposed changes are reported in Table 5. The evaluation consid-ered transport savings, pavement costs, bridge inspection costs, rating and posting impacts, bridge fatigue and deck wear effects, increased bridge design load requirements, safety, and congestion.
Finally, the UMTRI vehicle performance analysis found that the proposed truck configu-rations for operations above 80,000 pounds GVW for the Mn/DOT TS&W Project met internationally accepted heavy vehicle safety performance standards. In fact, the heaviest configuration proposed by Mn/DOT, the B-train double operating at 108,000 pounds, showed better safety performance in most cases than the conventional double operating at 80,000 pounds (see Appendix E for greater detail).
20 Cambridge Systematics, Inc.

Minnesota Truck Size and Weight Project
Table 5. Truck Size and Weight Proposal Benefits (Benefits in Millions of Dollars per Year; Negative Values Represent Increased Costs)
Bridge Inspection, Rating and
Posting
Total Net
Benefits Increased Bridge
Design Loads Truck Size and Weight Package Elements
Transport Savings
Bridge Fatigue and Decks Pavements Safety Congestion
Proposed Vehicle Configurations
6-Axle 90,000 lb. Semi $3.68 $1.27 $-0.05 $0.15 $-0.96 $0.15 $0.18 $4.43
7-Axle 97,000 lb. Semi 4.00 2.24 -0.01 0.22 -0.64 0.23 0.23 6.27
8-Axle Twin 108,000 lb. 2.01 1.25 -0.01 0.14 -0.72 0.05 0.08 2.79
Single Unit up to 80,000 lbs. 6.27 0.55 0.00 0.10 -0.13 0.06 0.05 6.90
Subtotal $15.96 $5.31 $-0.07 $0.61 $-2.45 $0.49 $0.54 $20.39
Spring Load Restrictions and Other Legislative Policy Issues
Change SLR $8.82 $-2.34 $0.00 $0.04 $0.00 $0.44 $0.17 $7.12
80,000 lb. GVW on 9-Ton System 24.82 -8.49 0.00 -0.83 0.00 1.65 0.72 17.87
Subtotal $33.64 $-10.83 $0.00 $-0.79 $0.00 $2.09 $0.89 $24.99
Total Package $49.60 $-5.52 $-0.07 $-0.18 $-2.45 $2.57 $1.43 $45.38
Cambridge Systematics, Inc. 21

Minnesota Truck Size and Weight Project
Recommendations
Based on technical analysis of alternative changes to TS&W laws, as well as the input from the outreach process, advisory committee feedback, the Northstar Workshop, and Departmental deliberations, the following TS&W proposals were recommended and advanced by Mn/DOT for legislative consideration consistent with the policy principles adopted for this study. These recommendations were developed through an extensive tech-nical and policy evaluation process. The analysis has followed nationally accepted method-ology used by the NAS/TRB TS&W studies and the U.S. DOT/FHWA Comprehensive Truck Size and Weight Study. The findings also have been peer reviewed by national and interna-tional experts in TS&W policy, infrastructure impacts, and safety analysis.
The final list of recommendations represents a balanced approach that protects highway infrastructure and safety while providing industry productivity improvements that will benefit Minnesota’s economy and competitiveness. The vehicle configurations are rec-ommended for operation under special permit with appropriate fees to recover additional administration, enforcement, and infrastructure costs. Special safety requirements also are recommended as deemed appropriate to the specific configuration based on a comprehen-sive review of each vehicle against accepted international performance standards. Finally, changes to SLR and other TS&W policy issues are recommended to be considered in par-allel to potential vehicle configuration weight increases.
Allow Six-Axle 90,000 Pounds Gross Vehicle Weight on Non-Interstate 10-Ton Network
• Must meet bridge formula, axle, and tire weight limits.
• Maximum trailer length of 53 feet (no change).
• Winter and seasonal increases to 99,000 pounds GVW, but no additional tolerances or exemptions allowed beyond 99,000 pounds.
• Allowed on 10,000-mile 10-Ton Network (non-Interstate); except sealed intermodal containers are allowed on Interstates.
• Similar to timber haulers truck enacted by the Minnesota legislature in 2004 and live-stock truck enacted in 2005 (effective 2006).
• Requirements: special permits with fees; axles to be added by certified remanufac-turer; and brakes required on every wheel.
22 Cambridge Systematics, Inc.

Minnesota Truck Size and Weight Project
Allow Seven-Axle 97,000 Pounds Gross Vehicle Weight Non-Interstate 10-Ton Network
• Must meet axle, bridge formula, and tire weight limits.
• Maximum trailer length of 53 feet (no change).
• Winter and harvest increases to 99,000 pounds GVW, but no additional tolerances or exemptions allowed beyond 99,000 pounds.
• Allowed on 10,000-mile 10-Ton Network (non-Interstate).
• Requirements: permits with fees; axles to be added by certified remanufacturer; brakes on every wheel; and subject to Federal Motor Carrier Safety Administration (FMCSA) regulations under Title 49, Part 391.
Allow Eight-Axle 108,000-Pound Twin Trailer on Non-Interstate Minnesota Twin Trailer Network and National Truck Network
• Must meet axle, bridge formula, and tire weight limits.
• Maximum trailer length of 28.5 feet each (no change).
• Allowed on pre-approved state trunk highway routes only (Minnesota Twin Trailer Network and National Truck Network) – approximately 6,700 miles.
• No harvest or winter increases nor any other tolerances or exemptions beyond 108,000 pounds.
• Same as paper products truck enacted in 2005 (effective 2006).
• Requirements: permits with fees; B-train coupling; axles to be added by certified remanufacturer; brakes on every wheel; Commercial Driver’s License (CDL) endorse-ment for multitrailer operations; and subject to FMCSA regulations.
Cambridge Systematics, Inc. 23

Minnesota Truck Size and Weight Project
Allow 80,000 Pounds Gross Vehicle Weight Single-Unit Truck on 10-Ton Network (Including Interstate)
• Must meet axle, bridge formula, and tire weight limits.
• Vehicle length increase up to 45 feet maximum (from current 40 feet).
• Lift axles must be down with loads.
• Axles in excess of 4 must be steering axles/castering axles
• Requirements: Permits with fees; axles to be added by certified remanufacturer; and brakes on every wheel.
Change Spring Load Restrictions
Based on extensive input and discussion regarding the economic impact of SLR in Minnesota, the following changes are recommended:
• All county roads default to seven tons per axle rather than to the current five tons unless posted otherwise.
• State trunk highways remain at 10 tons per axle unless posted otherwise.
• City streets and township roads continue to default to five tons per axle unless posted otherwise.
• SLR for gravel roads ends two weeks later than paved roads.
Other Legislative Policy Issues to be Considered
Following is a list of other legislative policy issues to be considered parallel to potential weight increases. These issues are closely linked to the above-recommended TS&W legisla-tive changes. Other policy issues for future consideration are included in the appendices.
• Eliminate liability exemptions for farm implements that damage roads or bridges;
• Remove the 73,280-pound GVW limit for five-axle semitrailers on 9-ton roads and allow axle weights and the bridge formula to control up to 80,000 pounds GVW;
24 Cambridge Systematics, Inc.

Minnesota Truck Size and Weight Project
• Eliminate seasonal harvest permits (still allow 10 percent harvest increase, but no requirement to obtain permits); and
• Expand seasonal harvest allowance to include all farm crops.
Expected Outcomes
Based on the analyses conducted for this study, the proposed package of TS&W improvements is expected to have significant net statewide benefits:
Impacts of Proposed Vehicle Configurations
• Increased payloads and fewer truck trips will lower transport costs significantly.
• Additional axles and fewer truck trips will result in less pavement wear.
• There will be a modest increase in bridge postings and future design costs.
• Proposed trucks have slightly higher crash rates but, given fewer overall truck miles (due to increased payloads) than would be experienced otherwise under existing weight limits, safety would improve slightly.
• The proposed vehicle configurations for operations above 80,000 pounds GVW meet internationally accepted heavy vehicle safety performance standards.
• The surplus brake capacity available for all of the proposed vehicle configurations is greater than the surplus brake capacity of a standard five-axle tractor semitrailer and therefore the stopping distance for all of these vehicles should be better than the existing 80,000-pound tractor semitrailer.
Impacts of Changing Spring Load Restrictions and Increasing 9-Ton System to 80,000 Pounds Gross Vehicle Weight
• Increased payloads and fewer truck trips will lower transport costs significantly.
• Pavement costs will increase somewhat due to increased weights carried on existing truck configurations.
Cambridge Systematics, Inc. 25

Appendix A Changing Business Practices and Economic Forces

Minnesota Truck Size and Weight Project
Changing Business Practices and Economic Forces
Summary
Minnesota’s robust and diverse economy relies on the efficient transportation of raw materials and finished products via its multimodal freight network. Transportation effi-ciency is currently threatened by capacity constraints on the highway and rail systems and by increasing transportation costs associated with escalating fuel prices and a driver shortage. In order to ameliorate the effects of capacity constraints and rising costs, Minnesota industries are seeking productivity gains through increased limits of truck size and weight. Many of the industries that stand to benefit from this proposal are agricul-tural, mineral, and forestry industries that have always served as the backbone of the State’s production and manufacturing sector. These industries typically produce com-modities with high tonnages and low unit values, such as taconite or corn. Most of these materials are hauled from the point of extraction or harvest to the first point of processing or distribution by truck. Facing increased competition from their counterparts in states with more lenient truck size and weight laws, Minnesota’s heavy hauling industries are likely to adopt the proposed changes to truck size and weight limits.
Objective
The purpose of this appendix is to provide insight into the economic forces, particularly those in Minnesota, that are driving industry demand for increases in truck size and weight. This analysis focuses on how current and future trends are affecting the trucking, shipping, and logistics industries and their relevance to truck size and weight laws. This appendix also examines how potential changes in truck size and weight might best respond to these trends.
Methodology
The analysis draws upon important sources of freight industry trends and data, including the Minnesota Statewide Freight Plan (MSFP), the 2002 Commodity Flow Survey, 2002 Economic Census, and 2004 Minnesota Agricultural Statistics to identify the principal trends influencing
Cambridge Systematics, Inc. A-1
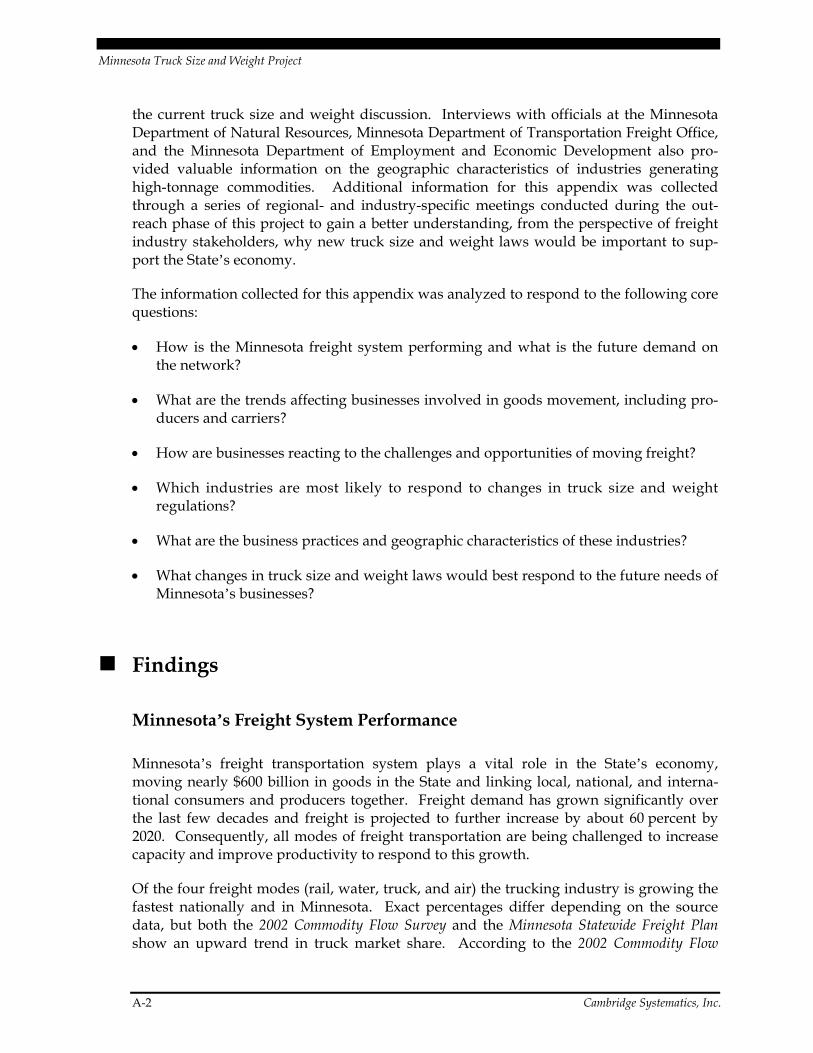
Minnesota Truck Size and Weight Project
the current truck size and weight discussion. Interviews with officials at the Minnesota Department of Natural Resources, Minnesota Department of Transportation Freight Office, and the Minnesota Department of Employment and Economic Development also pro-vided valuable information on the geographic characteristics of industries generating high-tonnage commodities. Additional information for this appendix was collected through a series of regional- and industry-specific meetings conducted during the out-reach phase of this project to gain a better understanding, from the perspective of freight industry stakeholders, why new truck size and weight laws would be important to sup-port the State’s economy.
The information collected for this appendix was analyzed to respond to the following core questions:
• How is the Minnesota freight system performing and what is the future demand on the network?
• What are the trends affecting businesses involved in goods movement, including pro-ducers and carriers?
• How are businesses reacting to the challenges and opportunities of moving freight?
• Which industries are most likely to respond to changes in truck size and weight regulations?
• What are the business practices and geographic characteristics of these industries?
• What changes in truck size and weight laws would best respond to the future needs of Minnesota’s businesses?
Findings
Minnesota’s Freight System Performance
Minnesota’s freight transportation system plays a vital role in the State’s economy, moving nearly $600 billion in goods in the State and linking local, national, and interna-tional consumers and producers together. Freight demand has grown significantly over the last few decades and freight is projected to further increase by about 60 percent by 2020. Consequently, all modes of freight transportation are being challenged to increase capacity and improve productivity to respond to this growth.
Of the four freight modes (rail, water, truck, and air) the trucking industry is growing the fastest nationally and in Minnesota. Exact percentages differ depending on the source data, but both the 2002 Commodity Flow Survey and the Minnesota Statewide Freight Plan show an upward trend in truck market share. According to the 2002 Commodity Flow
A-2 Cambridge Systematics, Inc.

Minnesota Truck Size and Weight Project
Survey, the truck share of total tonnage originating in Minnesota increased from 65.5 percent in 1997 to 69 percent in 2002. Future estimates show that trucking will continue to gain market share and outpace the growth of other freight modes in tonnage through 2020. As shown in Figure A.1, the Minnesota Statewide Freight Plan TRANSEARCH data forecast an increase in total truck tonnage of nearly 80 percent from 374 million annual tons in 2001 to over 670 million annual tons in 2020. With this growth, trucks will capture an even greater share of the total tonnage, moving from 59 percent of all freight moved by weight in 2001 to 66 percent in 2020.
Another notable trend, especially in relation to truck size and weight, is the forecast growth of intrastate tonnage from 48 percent of total tonnage in 2001 to 51.5 percent in 2020. While intrastate movements grow, outbound tonnage is forecast to remain at nearly its current share while inbound and through tonnage will see slight decreases in shares. Added detail is shown in Figure A.1 where the shares of tonnage by direction are noted as percentages above the bars representing 2001 and 2020 figures.
Figure A.1 Current and Future Minnesota Truck TonnageBy Direction and Percentage of Total Tonnage, 2001 and 2020
0
1
2
3
4
5
6
7
8
Intrastate Outbound Inbound Through Total
20012020
Tons (in Hundreds)
51.5%
48%
14.5%21.9%
15.6%14.7%
19.3%14.4%
100%
100%
Source: 2001 TRANSEARCH data from Minnesota Statewide Freight Plan.
Intrastate moves are important to this discussion because of the tendency of shorter dis-tance moves to be considerably heavier than long-distance moves. According to the 2002 Commodity Flow Survey, more than 70 percent of the total truck tonnage originating in Minnesota was moved 50 miles or less from origin to destination, much of which was lower in unit value than commodities moved longer distances. Table A.1 illustrates the distribution of Minnesota lengths of hauls with respect to tonnage and value.
Cambridge Systematics, Inc. A-3

Minnesota Truck Size and Weight Project
Table A.1 Truck Haul Lengths by Value and Tonnage 2002
Distance (Miles) Share of Tonnage Share of Value
Less Than 50 70.3% 34.8% 50-100 8.2% 10.1% 100-249 8.5% 11.7% 250-500 4.3% 13.3% More Than 500 8.7% 30.1%
Source: 2002 Commodity Flow Survey.
According to the 2002 Commodity Flow Survey, the average truck trip length in Minnesota is 200 miles, a considerably shorter distance than the average trip length of waterborne (813 miles), rail (884 miles) and airborne (1,499 miles) freight moves. This is an important finding considering the relationship between tonnage and trip length illustrated in Table A.1. This leads to the observation that trucks carry a high proportion of the heavy tonnage short-distance moves, many of which are intrastate or short-distance interstate moves.
The data also show that short-distance moves, especially those moves of 50 miles or less, account for the greatest percentage of truck tonnage – about 70 percent in Minnesota. These short-distance moves, especially those less than 50 miles, have the highest tonnage-to-value ratio of any other distance category at nearly 2:1. Longer distance trips, by con-trast, carry freight that is relatively light but high in value, such as expedited packages, computer equipment, and medical devices. Moves over 500 miles, for example, have a tonnage-to-value ratio of more than 1:3. The implication of this difference for truck size and weight is that firms specializing in short hauls of heavy, low-value commodities are most likely to take advantage of truck size and weight increases. Firms hauling high-value products over long distances tend to “cube out” their trailers before approaching current weight maximums. Thus, the proposed changes affecting Minnesota’s state highway system are likely to benefit local firms hauling locally produced products.
Given the high tonnage proportion of short moves, it is not surprising that Minnesota’s top five commodities by weight are goods with high tonnage-to-value ratios. The top five commodities, by weight, moving in Minnesota via all modes are: 1) farm products; 2) minerals and ores; 3) food products; 4) coal; and 5) lumber/wood products. These same commodities, when examined by mode, are among the top commodities moved by trucks in Minnesota. Table A.2 presents the top five truck commodities in Minnesota according to the 2002 Commodity Flow Survey.
Several of these high tonnage-to-value groups will be profiled in a subsequent section under “Findings”, including the distribution patterns within the State.
A-4 Cambridge Systematics, Inc.

Minnesota Truck Size and Weight Project
Table A.2 Top Truck Commodities by Share of Total Annual Tonnage Originated in Minnesota 2002
Commodity Class 2002 Share of Tonnage
Metallic Ores and Concentrates 19.2% Cereal Grains 8.3% Gravel and Stone 5.7% Other Agricultural Shipments 4.4% Animal Feed and Products 3.2%
Source: 2002 Commodity Flow Survey.
Now that we have established the current and forecast freight movements in Minnesota, it is important to understand the trends affecting businesses involved in goods movement.
Trends Impacting Goods Movement
Capacity Constraints
Across the United States and in Minnesota, growth in transportation system capacity has not kept pace with the growth of population and production. Consequently, the trans-portation system, especially in urban areas, is congested and will be unable to accommo-date future freight demand without significant capital investments or revolutionary changes in transportation operations. Building new highways is more difficult than it used to be for several reasons, including funding constraints and increased public scrutiny of projects. Attempts to shift freight from highway to other modes, including rail and barge, have limited potential to mitigate congestion in the long term. But railroads in the United States and in Minnesota currently are running at full capacity and simply do not have the equipment or capacity to offer much relief. Moreover, trucking continues to grow faster than rail.
Given this situation and the increasing volumes of freight on Minnesota’s transportation system, shippers, producers, carriers, and consumers will be increasingly impacted by delay. Logically, the freight community continues to push for system expansion and/or productivity gains to ameliorate the effects of congestion. Each freight mode faces its own set of challenges to implement improvements. Railroads, for example, have been success-ful in upgrading track weight allowances to the 286,000-pound standard and currently are upgrading some track to accommodate railcars with tonnages up to 312,000 pounds. The shipping industry, especially transoceanic shipping, has responded to increased demand with larger container and bulk carrying vessels. Similarly, air cargo carriers are adding larger planes to their fleets, including the forthcoming Airbus A-380.
Cambridge Systematics, Inc. A-5

Minnesota Truck Size and Weight Project
The trucking industry, however, has not been able to add capacity through increases in size and weight. Trucking relies on highway capacity and operational improvements, which are not keeping pace with growing demand or increasing transportation costs.
Rising Transportation Costs
Another trend impacting the freight industry is the rising cost of transportation. With increased foreign and domestic competition, freight-dependent businesses are continually seeking for ways to decrease transportation costs. Recently, freight rates have been increasing due to several factors, including:
• Rising Fuel Costs – The cost of diesel fuel has risen dramatically, up from $1.15 per gallon (average United States retail price) in January 2002 to $2.46 per gallon in January 2006. This represents an increase of 113 percent over the last four years. Diesel has risen much faster than the rate of overall inflation, which has averaged between 2 and 3 percent a year from 2002 to 2005.
• Labor Costs – The transportation industry in the United States is facing a prolonged labor shortage, especially of long-haul truck drivers, which has inflated wages resulting in higher overall transport costs. According to the Federal Reserve Bank of Minneapolis, Minnesota faces additional driver shortages “because of the preponder-ance of manufacturing” in the State.1
• Equipment Shortage – Demand for rail cars and ocean freighters has outpaced sup-ply, resulting in rates for rail shipments and waterborne shipments. Consequently, many international and long-haul rates for heavy commodities are increasing.
Containerization
Across the transportation modes, containerization of cargoes into standardized shipping units continues to revolutionize the way that trucking companies and railroads operate. Containers allow for much greater interoperability and speed by reducing transfer costs associated with multimodal shipments. For Minnesota, an emerging trend is the shipment of agricultural commodities in containers, including export grain shipments. This trend is especially important for international trade between United States ocean ports and Minnesota and long-distance domestic trade. Future intermodal traffic, especially inter-national shipments, will continue to use Pacific ports (Los Angeles, Long Beach, Seattle, and Tacoma) to access global markets. Due to physical limitations on the St. Lawrence Seaway and the Mississippi River, it is unlikely that Minnesota ports will fully participate in this national trend.
1 Keep on Truckin’ (please). Fedgazzette. Joe Mahon, March 2005. Federal Reserve Bank of Minneapolis.
A-6 Cambridge Systematics, Inc.
Minnesota Truck Size and Weight Project
Growth in Freight Demand
According to the Federal Highway Administration’s Freight Analysis Framework (FAF), the highest growth rates in future freight demand will be among high-value goods. These goods typically require premium service from production to retail via air cargo, truck ser-vice, or intermodal container. These types of commodities will demand larger, but not necessarily heavier trucks in the future because of their tendency to “cube out,” or run out of space, before exceeding maximum weight limits.
Some “heavy” commodities also will grow at above average rates in Minnesota. The FAF forecasts that inbound and outbound commodities with the highest tonnages and above average growth rates include clay, concrete, glass and stone, food processing, and lumber. These commodity classes, including the agricultural inputs for food processing, have a high likelihood of adopting proposed size and weight increases for at least part of their supply chains. The future growth of these commodities depends, however, on the ability of the transportation system to move them efficiently to the rest of the United States and abroad.
Agricultural Trends Affecting Transportation
Recently, changes in agricultural production in the United States have altered the delivery of farm products from field to market or processing. Consolidation of small farms into fewer but larger farms and cooperative ventures means that farmers and farming corpo-rations can achieve transportation economies of scale by shipping their own products using their own or hired semitrailer equipment. Consequently, they are shipping more outputs over longer distances compared to the previous pattern where farmers would focus on short moves to local consolidation points and rail terminals. As a result, grain producers have begun to rely less on railroads to ship their grain products, instead turning to farmer-owned semitrailers to deliver their products. The use of semis provides grain producers increased mobility options because they now have the ability to bypass local grain elevators and railroads and haul directly, albeit over a longer distance, to the processor, to another railroad, or to the Mississippi River.2
Another change that has occurred is in the feeding industry. Shifts in hog, cattle, and dairy production have resulted in a demand for feed in areas beyond the Corn Belt. The expansion of the livestock industry means that these industries may become dependent on rail for their feeding needs, which has implications for the quality of rail service (i.e., timeliness and predictability).3
2 http://www.ctre.iastate.edu/pubs/semisesq/session4/gervais/index.htm. 3 http://www.ams.usda.gov/tmd/summit/ch4b.pdf.
Cambridge Systematics, Inc. A-7

Minnesota Truck Size and Weight Project
Rail Trends
Railroad disruptions, including the shortage of railcars, can impact distances of heavy hauling, especially if agricultural or mineral loads must be driven further distances by truck to access an alternative rail terminal. Of particular concern for intermodal rail operations is the congestion of the Chicago rail hub. Minnesota is largely dependent on Chicago for efficient intermodal routing. With mounting capacity constraints and no immediate plans for resolution, Chicago disruptions could ripple through Minnesota, increasing the demand for longer truck distances to more reliable railheads.
Business Practices and Geographic Characteristics of “Heavy Hauling” Industries
Heavy hauling industries are those firms that ship commodities with typically low unit value and high tonnage. These are often bulk commodities, such as grain, minerals, or forest products. The supply chain of these commodities is multimodal – relying on rail and waterborne transportation for long-haul moves and often on trucks for first hauls from the point of extraction, primary production, or harvest to the next stage of produc-tion or distribution.
This section highlights the business practices and geographic distribution patterns of heavy hauling firms in Minnesota that are likely to take advantage of higher truck size and weight maximums.
Mineral Extraction
Minnesota is the largest producer of taconite, a low-grade metallic iron ore. Once the iron ore is extracted from the taconite rock, it is processed into pellets and is moved by truck or shortline railroad to ports and railheads for consolidation and transport to long-distance destinations. As shown in Figure A.2, taconite is mined almost exclusively in Northeast Minnesota where the Mesabi iron range is located. Mines, plants, and Great Lake port facilities are concentrated in this geographic area. Much of the short-distance movement of taconite is over privately owned roads maintained by the mines. There are no truck size and weight restrictions on such routes.
Other minerals mined in Minnesota, although to a lesser extent, are those used for indus-trial purposes such as clay, silica sand, granite, limestone, and peat. Some of the principal distributions are shown in Table A.3.
A-8 Cambridge Systematics, Inc.

Minnesota Truck Size and Weight Project
Figure A.2 Minnesota Mineral Extraction and Production
Table A.3 Geographic Distribution of Minnesota Mineral Extraction
Mineral Region of Extraction
Taconite (Iron Ore) Mesabi Range Clay Minnesota River Valley Granite St. Cloud/Redwood Falls Sand and Gravel (for Concrete, Other Uses) Statewide Silica Sand (for Glass Production) Southeastern Minnesota Dimensional Stone Vermillion/Mesabi Range/St. Cloud Limestone Northern and Southern Minnesota
Source: Minnesota Department of Natural Resources.
Cambridge Systematics, Inc. A-9
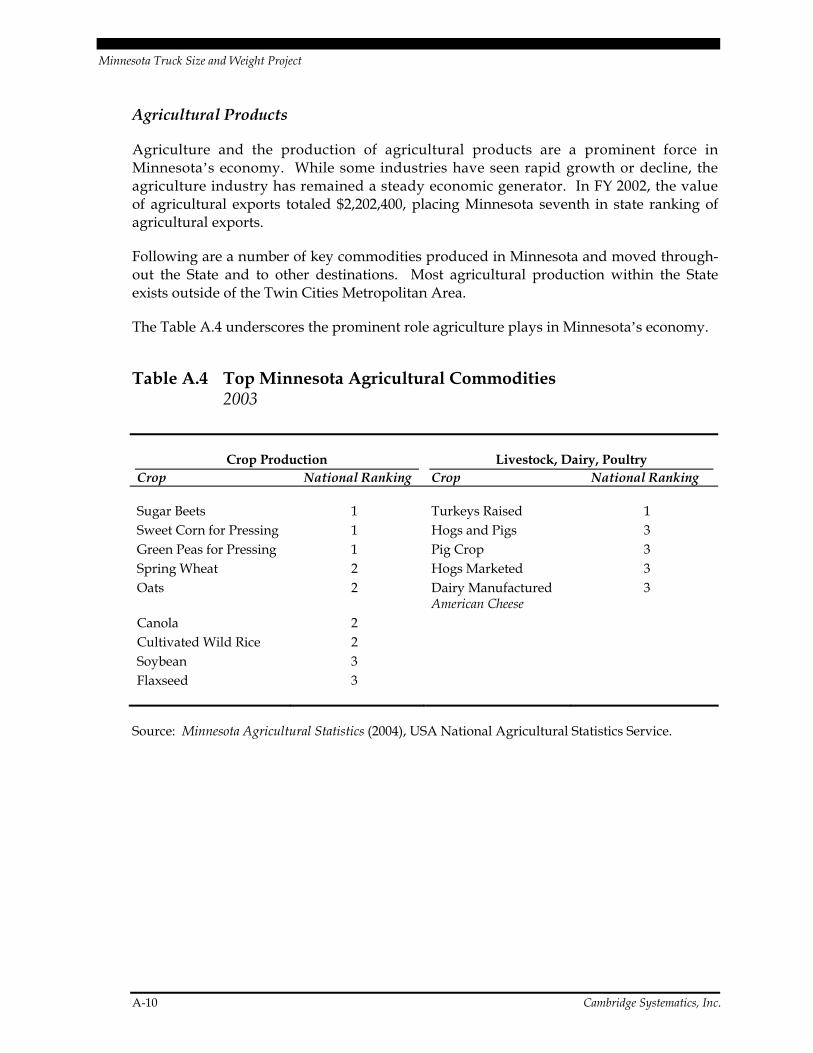
Minnesota Truck Size and Weight Project
Agricultural Products
Agriculture and the production of agricultural products are a prominent force in Minnesota’s economy. While some industries have seen rapid growth or decline, the agriculture industry has remained a steady economic generator. In FY 2002, the value of agricultural exports totaled $2,202,400, placing Minnesota seventh in state ranking of agricultural exports.
Following are a number of key commodities produced in Minnesota and moved through-out the State and to other destinations. Most agricultural production within the State exists outside of the Twin Cities Metropolitan Area.
The Table A.4 underscores the prominent role agriculture plays in Minnesota’s economy.
Table A.4 Top Minnesota Agricultural Commodities 2003
Crop Production Livestock, Dairy, Poultry Crop National Ranking Crop National Ranking
Sugar Beets 1 Turkeys Raised 1 Sweet Corn for Pressing 1 Hogs and Pigs 3 Green Peas for Pressing 1 Pig Crop 3 Spring Wheat 2 Hogs Marketed 3 Oats 2 Dairy Manufactured
American Cheese 3
Canola 2 Cultivated Wild Rice 2 Soybean 3 Flaxseed 3
Source: Minnesota Agricultural Statistics (2004), USA National Agricultural Statistics Service.
A-10 Cambridge Systematics, Inc.
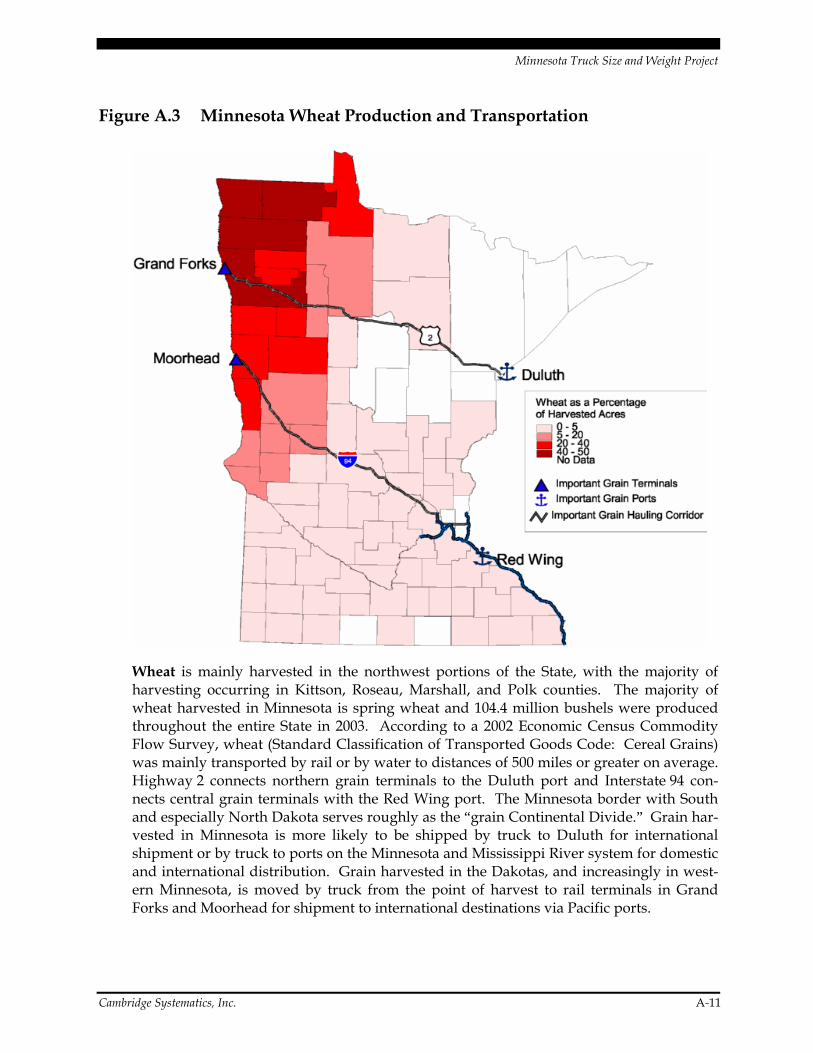
Minnesota Truck Size and Weight Project
Figure A.3 Minnesota Wheat Production and Transportation
Wheat is mainly harvested in the northwest portions of the State, with the majority of harvesting occurring in Kittson, Roseau, Marshall, and Polk counties. The majority of wheat harvested in Minnesota is spring wheat and 104.4 million bushels were produced throughout the entire State in 2003. According to a 2002 Economic Census Commodity Flow Survey, wheat (Standard Classification of Transported Goods Code: Cereal Grains) was mainly transported by rail or by water to distances of 500 miles or greater on average. Highway 2 connects northern grain terminals to the Duluth port and Interstate 94 con-nects central grain terminals with the Red Wing port. The Minnesota border with South and especially North Dakota serves roughly as the “grain Continental Divide.” Grain har-vested in Minnesota is more likely to be shipped by truck to Duluth for international shipment or by truck to ports on the Minnesota and Mississippi River system for domestic and international distribution. Grain harvested in the Dakotas, and increasingly in west-ern Minnesota, is moved by truck from the point of harvest to rail terminals in Grand Forks and Moorhead for shipment to international destinations via Pacific ports.
Cambridge Systematics, Inc. A-11

Minnesota Truck Size and Weight Project
Figure A.4 Minnesota Corn Production and Transportation
Corn is harvested in the southern geographic region of the State contiguous with Iowa, the top corn-producing state in the nation. Corn, considered a cereal grain, also is mainly transported by rail or by water to distances of 500 miles or greater on average. There are a number of highways that act as corn hauling corridors, which intersect Interstate 94. Approximately one-third of all corn produced in Minnesota is processed into ethanol at one of a growing number of plants in the southern portion of the State. Ethanol plants are interspersed throughout this region, including a large plant in Claremont on U.S. 14, in Preston, in Little Falls, and Laverne. The other two-thirds of the corn is shipped via rail or barge to destinations mostly external destinations. Principal corn ports include Savage (on the Minnesota River) and Red Wing (on the Mississippi River) where terminal opera-tors transfer the corn from trucks to barges.
A-12 Cambridge Systematics, Inc.

Minnesota Truck Size and Weight Project
Figure A.5 Minnesota Soybean Production and Transportation
Soybeans are most heavily harvested in the southern portion of the State, with production also occurring western and central counties as well. Shorter varieties of soybeans are grown in the Red River Valley, principally north of SR 55. After its initial farm-to-terminal move, approximately 75 percent of the State’s soybean crop is transported long distances via rail or water. The remaining 25 percent of the crop is processed into soy meal at one of several soybean processing plants. The largest plants (soybean crushers) are located in and around Mankato and are served by a number of highways. At these plants, the soybeans are crushed into meal for eventual production into a number of different food and consumer products. Trucks carry the greatest mode share of this commodity for intrastate moves, especially to processing plants. A significant portion of soybeans are shipped via water.
Cambridge Systematics, Inc. A-13

Minnesota Truck Size and Weight Project
Figure A.6 Minnesota Sugar Beet Production and Transportation
Sugar beet harvesting and processing, of which Minnesota leads the nation in production, are geographically concentrated along the western border of the State abutting North Dakota. The gross value of sugar beet production in 2004 totaled $803.93 per acre; the highest it has been since 1996. Not surprisingly, processing plants are located in counties where sugar beet production is high, with the exception of Renville and Chippewa coun-ties where harvest must be transported longer distances for processing. Sugar beets are produced throughout the year, but the fall harvest is the most significant period of truck movement. Processing of the fall harvest can last until July of the following year. A typi-cal stack of beets received at a processing plant weighs roughly 40,000 tons, producing approximately 6,000 tons of sugar. Trucks carry the greatest percentage of this commod-ity. Highways U.S. 212, MN 55, and U.S. 10 act as feeders to the sugar beet centers and also to the Great Lakes port regions. Another important root crop that grows in largely the same area as sugar beets is carrots.
A-14 Cambridge Systematics, Inc.

Minnesota Truck Size and Weight Project
Figure A.7 Minnesota Hay Production and Transportation
Hay harvesting is concentrated in Ramsey, Pine, Kanabec, Mille Lacs, Wadena, Hubbard, and Clearwater counties; however, hay harvesting takes place in the majority of counties. Of the commodities profiled in this report, hay is the most likely to be transported over short distances and both cultivated and used in Minnesota. Roughly 85 percent of all hay produced in Minnesota is consumed internally, usually within 100 miles of the point of harvest. Thus, hay is highly truck-dependent for its short moves and distribution pattern throughout the State.
Cambridge Systematics, Inc. A-15

Minnesota Truck Size and Weight Project
Figure A.8 Minnesota Sweet Corn and Peas Production and Transportation
Sweet corn and peas are harvested in the south of Minnesota with Dakota, Olmstead, Steele, Waseca, Brown, Renville, and Silbey counties producing the most amount of corn and pea production. Vegetable processing plants are located in or near all of the afore-mentioned counties and are closely situated to highway hauling corridors as well. For this commodity type, the most common mode of transport is truck followed by water.
A-16 Cambridge Systematics, Inc.

Minnesota Truck Size and Weight Project
Figure A.9 Minnesota Dairy Production and Transportation
Dairy production is concentrated in the central and southwestern portions of the State. Stearns, Winona, Wabasha, Goodhue, Carver, and Morrison Counties are the center of milk production with high numbers of cows per square miles. Dairy processing plants are peppered throughout the central portion of the State with distribution plants sited along the eastern rim of the State. Some of the largest plants are located in Thief River Falls, Perham, Dawson, Litchfield, Paynesville, and New Ulm. Rochester also is a center of dairy production and a plant in Melrose, North Dakota also processes large quantities of Minnesota milk. Unlike most other agricultural commodities, much of the dairy is proc-essed into final product at plants in the Twin Cities metropolitan area. The plants in the Twin Cities area include specialty production facilities for ice cream and yogurt. The heavy hauling portion of dairy production is in the first move from farm to initial
Cambridge Systematics, Inc. A-17

Minnesota Truck Size and Weight Project
processing plant, typically with a tanker and pup-trailer combination. A high proportion of dairy products is consumed within the State and region but Minnesota is a leading pro-ducer of dairy products, including cheese and butter, distributed nationally.
Figure A.10 Minnesota Cattle Production and Transportation
Beef cows are raised throughout the State, with high concentrations of beef cattle per square mile in Rock, Pipestone, Wabasha, Olmstead, Winona, Fillmore, Houston, Kanabec, Benton, Morrison, and Todd counties. Beef processing plants are located within distance of major highways (10, 212, and 60), This commodity type is almost exclusively trans-ported via truck.
A-18 Cambridge Systematics, Inc.

Minnesota Truck Size and Weight Project
Figure A.11 Minnesota Hogs and Pigs Production and Transportation
Hog and pig production is concentrated in the Southern portion of Minnesota, including Rock, Pipestone, Nobles, Martin, Watonwan, Blue Earth, Nicollet, and Waseca Counties. Three major pork processing plants are located in the southern portion of the State.
Farm-to-Market Routes
Many local, county, and state highways serve as harvest collector routes for locally grown products. The distribution of trips on these systems varies by harvest season but is typi-cally highest in the fall. Certain other routes carry an even higher proportion of agricul-tural traffic, especially those highways that serve as conduits to major processing and
Cambridge Systematics, Inc. A-19

Minnesota Truck Size and Weight Project
transfer centers, such as Mankato. While the traffic on these conduit routes differs by commodity, there are some routes that serve multiple commodity flows. Those routes include:
• U.S. 169 from Mankato to Savage (soybeans and corn);
• U.S. 14 across the southern tier of the State;
• U.S. 52 between St. Paul and Rochester;
• U.S. 14/SR 60 from Mankato to Red Wing (Mississippi River Port);
• SR 23 from Southwestern Minnesota to the Duluth (Great Lakes Port);
• U.S. 212 across the middle tier of the State;
• SR 55 and U.S. 10 corridors from Moorhead to Minneapolis/St. Paul; and
• U.S. 2 between the Red River Valley (grain production area) and Duluth.
Forestry and Wood Products
The forestry industry in Minnesota has seen continued expansion since 1975. Mills are typically located close to production areas. Wood products are typically transported via trucks with a flat-bed vehicle configuration. One advantage for the logging industry is that logging traditionally takes place during the winter season, which means that trucks can take advantage of winter weight increases.
Despite this, the forest and wood product industry remains disadvantaged by current truck size and weight standards in Minnesota. Minnesota’s forestry industry faces com-petition from Wisconsin, Michigan, and Ontario where truck size and weight limits are higher. There also is pressure to increase forestry size and weight limits because the price of lumber is increasing rapidly. Large buyers of lumber and other forestry products are trying to control costs, including transportation costs, through larger shipments. The timber industry secured passage of legislation in 2004 to permit 90,000-pound six-axle semitrailer use for their industry. There currently are about 500 timber permit users.
In addition, Northern Minnesota does not have widespread access to rail and intermodal shipping opportunities. This significantly limits the industry’s mobility options and cre-ates a challenge for the industry’s supply chain. Together, limited load limits for trucks and limited rail service disadvantage the forestry and wood products industry in Minnesota.
Table A.5 outlines the location of wood mills, all of which utilize various species of wood.
A-20 Cambridge Systematics, Inc.

Minnesota Truck Size and Weight Project
Table A.5 Major Minnesota Forest Products and Lumber Processing Facilities 2005
Type of Mill County
Oriented Strand Board and Engineering • Beltrami • Crow Wing • Itasca
• Lake • St. Luis
Pulpwood and Paper • Carlton • Itasca • Koochiching
• Scott • St. Luis • Stearns
Recycled Fiber • Ramsey • Sherburne • St. Luis
Hardboard • St. Luis Large Sawmills • Cass
• Cook • Hubbard • Itasca
Source: Minnesota Department of Natural Resources.
Construction Industry
The construction industry in Minnesota is particularly impacted by the spring load restrictions (SLR) on county and municipal roads. Five-ton limits on local roads during spring thaw significantly increases transport costs causing circuitous routing or use of more trucks to move the same amount of construction material. They advocated increasing the SLR on local roads to at least seven-ton. Further, the industry advocated allowance of 80,000 pounds for single unit trucks, the predominant configuration used by their industry. Current 40-foot length limits in Minnesota constrain the industry’s ability to get to 80,000 pounds.
Conclusions
Increasing transportation costs, capacity constraints, cross-border competition, and the shift to containerized shipments are driving businesses to seek additional productivity gains from the Minnesota freight transportation system. The agriculture, mineral, and forestry industries of Minnesota are the most vulnerable to cross-border competition and variations in the cost of transportation because of the low value-to-tonnage ratio of their respective commodities. These industries also are the most likely to benefit from changes to truck size and weight laws affecting combination trucks in the State. The construction industry would likely benefit most from easing of spring load restrictions. Also, allowance of longer single unit trucks would allow construction industry users to get up to the current 80,000-pound weight limit.
Cambridge Systematics, Inc. A-21

Appendix B Scope, Limits, and Administration of Existing Truck Size and Weight Laws in Minnesota

Minnesota Truck Size and Weight Project
Scope, Limits, and Administration of Existing Truck Size and Weight Laws in Minnesota
Summary
This appendix outlines the existing truck size and weight (TS&W) laws in the State of Minnesota and provides a summary of administrative practices related to those laws. Federal, state, and some county/local laws are examined, including the following characteristics:
• Limits and provisions;
• Exclusions and exceptions;
• Roles and responsibilities;
• Federal requirements and options;
• Permit process; and
• Enforcement practices.
This appendix draws from the Minnesota Statutes, recent legislative proposals, interpre-tive guidance from the Minnesota Truck Department of Transportation (Mn/DOT) Office of Freight and Commercial Vehicle Operations personnel, Federal documents, including the Federal Register, American Association of State Highway and Transportation Officials (AASHTO) Materials, and other interpretive materials. Throughout this appendix, cita-tions to the Minnesota Statutes are provided in parenthesis.
Several sections follow the main body of this appendix. The first section defines key size and weight terms; the second section lists the National Network Highways of Minnesota; and the third section summarizes recent legislative proposals.
Objective
The objective of this appendix is to summarize current laws governing commercial vehicle size and weight in Minnesota, including state, Federal, county, and local statutes. The intent of this appendix is to provide clear description of current laws, including permitted
Cambridge Systematics, Inc. B-1

Minnesota Truck Size and Weight Project
exceptions to dimension and weight limits, that will assist Mn/DOT in making recom-mendations to change existing laws to accomplish the policy goals and objectives of the public and private stakeholders.
Methodology
This review draws principally from the Minnesota Statutes and associated interpretive materials provided by Mn/DOT. Federal regulations and interpretive materials also were consulted. The primary sources consulted for this appendix include:
• Minnesota Statutes 2004;
• Minnesota Commercial Truck and Passenger Regulations (2004/2005);
• Code of Federal Regulations 23, Part 658;
• Federal Size Regulations for Commercial Motor Vehicles;
• AASHTO Guide for Vehicle Weights and Dimensions;
• Minnesota Department of Transportation and Federal Highway Administration (FHWA) Internet sites; and
• Interviews with Mn/DOT and FHWA staff.
The study team also interviewed Mn/DOT, Minnesota Department of Public Safety (DPS) and FHWA personnel involved in the administration and enforcement of truck size and weight laws to clarify regulatory implications of statutes and determine the current administrative and enforcement practices.
This appendix organizes the information from these sources into several categories:
• Limits and provisions;
• Exclusions and exceptions;
• Roles and responsibilities;
• Federal requirements and options;
• Permit process; and
• Enforcement practices.
Definitions for common size and weight terms, a list of the National Network (NN) routes in Minnesota, and a summary of the recent (not enacted) legislative proposals related to truck size and weight are included at the end of this appendix respectively under Appendix a, Appendix b, and Appendix c.
B-2 Cambridge Systematics, Inc.

Minnesota Truck Size and Weight Project
Findings
Limits and Provisions
Width, height, and weight provisions are described in this section. These are the general provisions applicable to most commercial vehicles traveling in Minnesota. Generally, these limits and provisions are universally applicable and do not require special permits. Principal exclusions and exceptions, most of which require permits, are described in a subsequent section. For each of the laws summarized below the Federal limit, where applicable, also is noted.
Width
Definition: The outside width of a commercial vehicle, exclusive of rear view mirrors or temporary load securement devices, which are not an integral part of the vehicle, may extend an additional three inches on each side of the vehicle or load. (169.80, Subd. 2)
• The maximum allowable outside width in Minnesota is 8 feet 6 inches, which also is the Federal limit (102 inches). (169.80, Subd. 2)
Height
Definition: The total vertical dimension of a vehicle above the ground surface, including any load and load-holding device thereon. (AASHTO)
• Minnesota’s maximum allowable outside height is 13 feet 6 inches. There is no Federal height limit; each state sets its own height standards. (169.81)
Length
Definition: The total longitudinal dimension of a single vehicle, a trailer, or a semitrailer, including bumper and load, but excluding non-cargo-carrying equipment. (AASHTO)
Maximum length in Minnesota depends on the vehicle configuration.
• No single vehicle may exceed 40 feet in length except mobile cranes (48 feet) and buses (45 feet). (169.81, Subd. 2)
• The most common configuration type is the tractor semitrailer configuration. The Federal government requires states to allow trailers in a tractor semitrailer combina-tion of at least 48 feet. The most common exception to this rule is that 53-feet trailers are allowed if the distance from kingpin to center of rear axle group is 43-feet or less. (169.81, Subd. 2, (3)(b))
Cambridge Systematics, Inc. B-3

Minnesota Truck Size and Weight Project
• A single trailer cannot exceed 45 feet in length, including the tow bar assembly but exclusive of rear bumpers that extend the overall length by more than 6 inches. (169.81, Subd. 2, (3)(c))
• There is no Federal maximum overall length restriction.
• A combination more than 75 feet is known as a “Longer Combination Vehicle” or LCV and is allowed on designated National Network Highways and the Minnesota Twin Trailer Network (as designated by the Mn/DOT Commissioner), which consists of four-lane divided highways and reasonable access routes. (169.81, 3(c))
• Statewide, the maximum number of units in a combination should not exceed two. There are important exceptions discussed below under “Length Exceptions, Combination Unit Exceptions.” (169.81, Subd. 2a)
• States can allow heavier LCVs off the Interstate and longer doubles or triples off the National Network.
Weight
There are three means of measuring commercial vehicle weight in Minnesota: 1) gross vehicle weight (GVW), 2) axle weight, and 3) tire weight. There are regulations governing all three. Gross vehicle and tire weight limitations protect highway pavements. Axle weights limitations are especially important to protecting the integrity of short-span bridges as short-bridges are impacted by overweight axles more than overweight trucks.
The application of GVW and axle weight limitations vary by highway type: Designated Highways and Non-designated Highways.
Designated Highways (10-Ton Network)
The Designated Highways include Interstates, U.S. Highways, Minnesota State Trunk Highways (as defined in 160.62 Subd. 29 and for all routes designated under 169.832, Subd. 11) and certain designated local highways. The weight limits on this system are:
• 80,000 GVW, for any vehicle combination with five or more axles with minimum spac-ings; (169.824, Subd. 2)
• 20,000 GW for any single-axle; and (169.824, Subd. 1)
• 10,000 GW for any single wheel. (169.823, Subd. 1)
Non-designated Highways
The Non-designated Highways are other streets and county roads within the state (all routes other than state trunk highways and routes designated under 169.832, Subd. 11), divided into three groups based on single-axle weight limits: Nine-Ton Network; Seven-Ton Network; and Five-Ton Network.
B-4 Cambridge Systematics, Inc.

Minnesota Truck Size and Weight Project
The Nine-Ton Network the weight limits are:
• 80,000 GVW, for any vehicle combination with six or more axles with minimum spacings;
• 73,280 GVW, for any vehicle combination with five axles with minimum spacings;
• 18,000 GW for any single-axle; and
• 9,000 GW for any single wheel.
The Seven-Ton Network the weight limits are:
• 14,000 GW for any single-axle; and
• 7,000 GW for any single wheel.
The Five-Ton Network the weight limits are:
• 10,000 GW for any single-axle; and
• 5,000 GW for any single wheel.
Tire Load
Tire weight limits are universally applicable over all highway systems in the state. No tire may exceed 600 pounds per inch width on a steer axle (maximum two steer axles) or more than 500 pounds per inch on non-steer axles. The manufacturers’ tire load capacity may not be exceeded. (169.823)
Axle Weight and Bridge Restrictions (169.824, Subd. 1)
In addition to the axle restrictions by highway type, bridge restrictions also limit axle weights.
• Bridges are posted where the rated weight capacity is less than the highway.
• Consecutive axles are limited to four.
• On the Interstate and Defense Highways, the maximum GVW for a five-axle vehicle is 80,000, but it still must comply with the Federal Bridge Formula axle weights, which dictate:
− 20,000 pounds per single-axle;
− 34,000 pounds per tandem axle; and
− 42,000 pounds per tridem axle.
• More specific restrictions are contained in the Gross Weight Schedule of the Minnesota Statutes (169.824), specifically in the Table of Axle Weight Limits which indicates
Cambridge Systematics, Inc. B-5
Minnesota Truck Size and Weight Project
maximum gross weight for axle groups based on the number of consecutive axles in a group and the distance between the centers of foremost and rearmost axles of a group for axle groups consisting of between two and seven axles.
• Consecutive Axles – are limited to four axles unless the additional axles are steering or castering axles. Consecutive axles must comply with the limitations related to spacing in 169.822 and not exceed 20,000 gross axle weight. (169.828, Subd. 1)
Variable Load Axles
Variable load axles must have the pressure control preset so that the weight carried on the variable load axle may not be varied by the operator during the transport of any load. This is not applicable to rear loading refuse compactor vehicles except those with tridem ream axles must comply before being issued an annual permit. (169.829, Subd. 2)
Exclusions and Exemptions
This section summarizes the principal exclusions and exemptions to the commercial vehi-cle size and weight laws presented above. This list of exclusions and exemptions is by no means exhaustive; its general intent is to document those circumstances where the existing statute allows current limits to be exceeded, usually under permit. The emphasis on this list is privately owned and operated commercial vehicles engaged in freight movement; it does not attempt to document the exclusions and exemptions for passenger transport (motor coaches) or vehicles owned by political subdivisions or utilities related to the everyday maintenance of sanitation, power, water, sewage, and like systems. The following exclusions and exemptions are organized by width, height, length, and weight.
Width
• Farm and Construction Equipment Width Exception to 9 feet – for low-bed trailer or equip-ment dolly used exclusively for transporting farm machinery and construction equip-ment. A permit is required as per 169.86 for transport on the Interstate system. (169.80)
• Implement of Husbandry Width Exception to 11 feet 6 inches – applicable to 1) horse-drawn wagons carrying loose straw or hay; 2) specialized vehicles resembling low-slung trailers having short-beds or platforms, while transporting one or more implements of husbandry; or 3) an implement of husbandry being driven or towed at a speed of not more than 30 miles per hour provided that the vehicle is owned, leased, or under the control of a farmer or implement dealer and only while operated on non-Interstate roads or highways within 75 miles of any implement dealership or farmland if the farmland is owned, leased, or operated by the farmer. (169.801)
• Vehicles carrying round bales of hay, straw, or cornstalks to 11 feet 6 inches – annual permit required, unless traveling less than 20 miles. (169.862, Subd. 1)
B-6 Cambridge Systematics, Inc.

Minnesota Truck Size and Weight Project
• Vehicles carrying first haul of square bales of hay or straw to 12 feet – Allowed by permit, unless traveling less than 20 miles, between August 1 and March 1 within 35 miles of the North Dakota border. (169.862, Subd. 1)
− Both the aforementioned wide-load bale exemptions are subject to the following operational restrictions: operation may not occur between sunset and sunrise, or when weather conditions create impaired visibility (less than 500 feet), on Sundays from noon until sunset, or on several national holidays outlined in the Statute.
• Counties and other political subdivisions may issue permits for other configurations that exceed Minnesota Statutes for width as long as the movement occurs on high-ways under their jurisdiction. (169.86)
Height
• Vehicles carrying square bales of hay or straw to 15 feet – Allowed by annual permit and limited to the public streets and highway specified in the permit. Operation may not occur between sunset and sunrise, or when weather conditions create impaired visi-bility (less than 500 feet), on Sundays from noon until sunset, or on several national holidays outlined in the Statute. (169.862, Subd. 1)
• Counties and other political subdivisions may issue permits for other configurations that exceed Minnesota Statutes for height as long as the movement occurs on high-ways under their jurisdiction. (169.86)
Length
The length exceptions and exclusions are organized by articulation: single unit, and com-bination unit exceptions.
Single Unit Exceptions
Mobile Crane Length Exception to 48 feet. (169.81)
Combination Unit Exceptions
Semitrailer Exception to 53 feet if the distance between the kingpin setting to the centerline of the rear axle group of the semitrailer does not exceed 43 feet (169.81).
Vehicles may exceed 75 feet on four-lane divided highways (and reasonable access routes) including the following configurations: (169.81, Subd. 3)
• Truck tractor and semitrailer (including auto racks, boat carriers, and saddle mounts);
• Truck tractor and semitrailer and semitrailer; and
• Truck tractor and semitrailer and full trailer.
Cambridge Systematics, Inc. B-7

Minnesota Truck Size and Weight Project
Vehicles may exceed 75 feet when transporting: (169.81, Subd. 3)
• Telephone poles;
• Electric light and power poles;
• Piling;
• Pole length pulpwood; or
• Pipe or other objects by a public utility when required for emergency or repair of pub-lic service facilities ore when operated under special permits.
Three units in combination – may operate on the Minnesota Twin Trailer Network, as desig-nated by the Commissioner (169.87, Subd. 1) and subject to the approval of the authority having jurisdiction over the highway. The Twin Trailer Network consists generally of four-lane divided highways (and reasonable access highways). The three-unit exception (169.81, Subd. 2a. (b)) is applicable to the following configurations and limitations:
• Twin trailers not exceeding 28 feet 6 inches for a single vehicle (trailer or semitrailer) exclusive of non-cargo-carrying equipment, including refrigeration units or air com-pressors, coupler plates, tow bar assembly, and lower coupler equipment. (169.81, Subd. 2a) Exceptions include:
− Trailers exceeding 28 feet 6 inches in a three-unit combination, if empty and origi-nating from a point of manufacture within the state to the state border when using a B-train hitching mechanism and only under permit.
− Trailers exceeding 28 feet 6 inches in a three-unit combination also are allowed under permit renewal if the original permit was issued before April 16, 1984.
• Saddle mounts. (169.81, Subd. 3)
• Milk haulers between point of production and processing. (169.81, Subd. 2a)
• Farm truck, livestock, or poultry truck if third unit is a two-wheel trailer with a loaded weight of 3,000 pounds or less for the sole purpose of transporting a livestock or poultry loading chute and when driven within 10 miles of the home post office of the owner. This exception does not apply to the seven-county metropolitan area. (169.81, Subd. 8, 9)
• Pickup towing two empty [agricultural] trailers used primarily to transport liquid fer-tilizer, anhydrous ammonia or any agricultural commodity ammonia or liquid fertil-izer, which is limited to two empty trailers within a 35-mile radius of the home post office of the owner of the pickup driven at not more than 35 mph. (169.81, Subd. 10)
Weight
The weight exceptions and exclusions are organized by several subcategories, including by industry, infrastructure (route/bridge), seasonal increases, and spring load restrictions.
B-8 Cambridge Systematics, Inc.

Minnesota Truck Size and Weight Project
Industry-Specific Weight Exceptions and Exclusions
Timber Haulers – (169.8261) are allowed a weight exception to 90,000 GVW maximum for combination vehicles with six axles (with brakes) hauling raw or unfinished forest prod-ucts, including wood chips, under the following conditions:
• Must operate on the most direct route to the nearest highway (excluding Interstate and Defense Highways);
• Must obtain an annual permit ($300);
• Must comply with bridge load limits postings;
• Must obey all road postings;
• Single-axle cannot exceed 20,000 GW;
• Timber haulers also are allowed a winter weight increase to 98,000 GVW (see “sea-sonal exemptions and exclusions” below); and
• Effective August 1, 2006, timber haulers also may exceed the legal axle weight limits listed in the Minnesota Table of Axle Weights (169.824) by not more than 12.5 percent; except during the Winter Weight Increase, wherein legal axle weights may be exceeded by not more than 22.5 percent.
Special Paper Products Vehicle – Under permit, a nine-axle combination consisting of a truck tractor and semitrailer drawing one additional semitrailer and an auxiliary dolly (with maximum trailer length of 28 feet 6 inches) is allowed a maximum GVW of 108,000. The vehicle must comply with tire load restrictions and can only be operated on the following state trunk highways and is not eligible for the winter weight increase: (169.864)
• Hwy. 2 between Grand Rapids and the port of Duluth;
• Hwy. 169 between Grand Rapids and its junction with Hwy. 53; and
• Hwy. 53 between Virginia and the port of Duluth.
First Haul – There is an exception to the relevant evidence required for vehicles trans-porting the first haul of unprocessed or raw farm products (including milk) or raw and unfinished forest products as long as the weight recorded does not exceed the maximum allowable weight by 10 percent. (169.851, Subd. 5)
Farm Truck Exemption from Variable Load Axle Restrictions – applicable to any farm truck registered prior to July 1, 1981 for 57,000 pounds or less. (169.828, Subd. 2)
Waste Haulers Exception from Variable Load Axle Restrictions – applicable to rear loading refuse compactor vehicles except those with a tridem rear axle (which must comply with the Variable Load Axle Restriction before being issued a special permit). (169,828, Subd. 2)
Cambridge Systematics, Inc. B-9
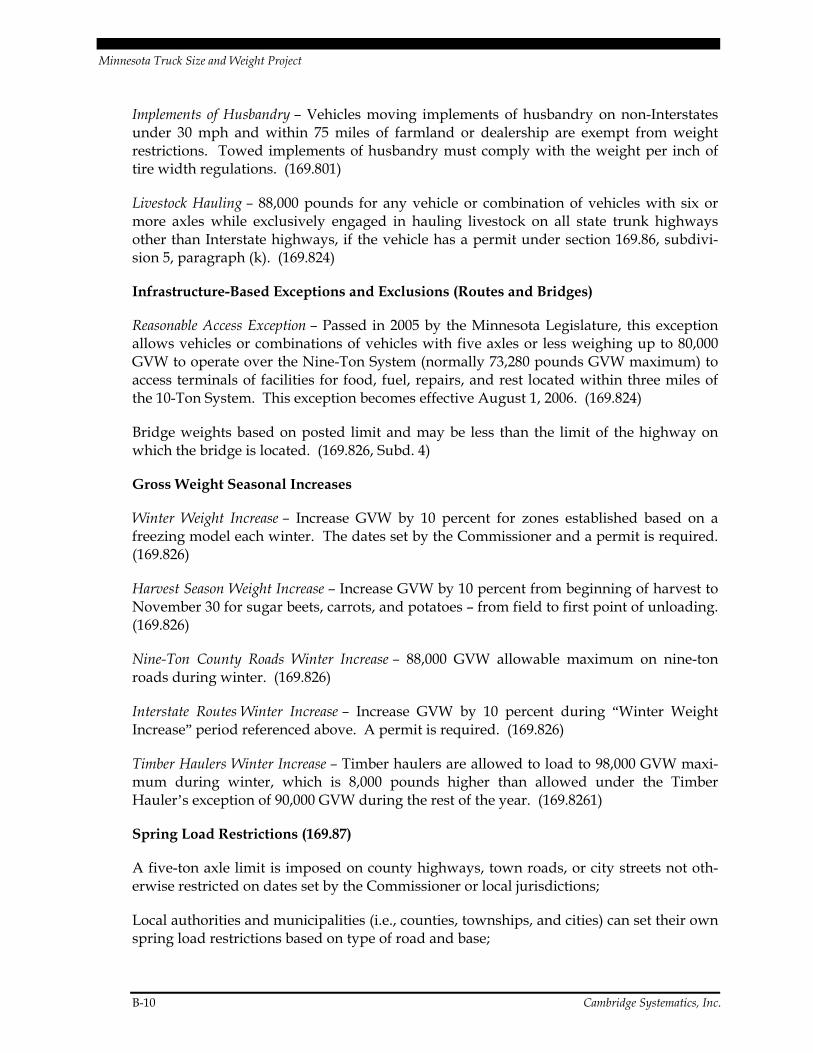
Minnesota Truck Size and Weight Project
Implements of Husbandry – Vehicles moving implements of husbandry on non-Interstates under 30 mph and within 75 miles of farmland or dealership are exempt from weight restrictions. Towed implements of husbandry must comply with the weight per inch of tire width regulations. (169.801)
Livestock Hauling – 88,000 pounds for any vehicle or combination of vehicles with six or more axles while exclusively engaged in hauling livestock on all state trunk highways other than Interstate highways, if the vehicle has a permit under section 169.86, subdivi-sion 5, paragraph (k). (169.824)
Infrastructure-Based Exceptions and Exclusions (Routes and Bridges)
Reasonable Access Exception – Passed in 2005 by the Minnesota Legislature, this exception allows vehicles or combinations of vehicles with five axles or less weighing up to 80,000 GVW to operate over the Nine-Ton System (normally 73,280 pounds GVW maximum) to access terminals of facilities for food, fuel, repairs, and rest located within three miles of the 10-Ton System. This exception becomes effective August 1, 2006. (169.824)
Bridge weights based on posted limit and may be less than the limit of the highway on which the bridge is located. (169.826, Subd. 4)
Gross Weight Seasonal Increases
Winter Weight Increase – Increase GVW by 10 percent for zones established based on a freezing model each winter. The dates set by the Commissioner and a permit is required. (169.826)
Harvest Season Weight Increase – Increase GVW by 10 percent from beginning of harvest to November 30 for sugar beets, carrots, and potatoes – from field to first point of unloading. (169.826)
Nine-Ton County Roads Winter Increase – 88,000 GVW allowable maximum on nine-ton roads during winter. (169.826)
Interstate Routes Winter Increase – Increase GVW by 10 percent during “Winter Weight Increase” period referenced above. A permit is required. (169.826)
Timber Haulers Winter Increase – Timber haulers are allowed to load to 98,000 GVW maxi-mum during winter, which is 8,000 pounds higher than allowed under the Timber Hauler’s exception of 90,000 GVW during the rest of the year. (169.8261)
Spring Load Restrictions (169.87)
A five-ton axle limit is imposed on county highways, town roads, or city streets not oth-erwise restricted on dates set by the Commissioner or local jurisdictions;
Local authorities and municipalities (i.e., counties, townships, and cities) can set their own spring load restrictions based on type of road and base;
B-10 Cambridge Systematics, Inc.

Minnesota Truck Size and Weight Project
Restrictions are in place generally from March through May, depending on the zone;
On trunk highway beginning and ending dates are moderated by actual condition; and
Restrictions are not applicable to portland cement concrete roads, between the dates set by the Commissioner.
Roles and Responsibilities
Federal, state, county, and local jurisdictions (city, township) may set regulations, issue permits, and enforce size and weight laws. This section describes the roles and responsi-bilities of each level of government pertaining to size and weight administration.
Federal Highway Administration
The Federal Highway Administration (FHWA) is responsible for administering the Federal regulations governing commercial vehicle (truck and bus) sizes and weights. The FHWA Vehicle Size and Weight (S&W) Program is guided by several key statutes and regulations. The statutes and regulations provide the program with its statutory authority and govern its structure and performance. The statutory authority for the Federal over-sight of vehicle size and weight activities is described in three locations within U.S. Code (U.S.C.), Titles 23 and 49:
• Title 23 U.S.C. 127 establishes weight limits states shall allow and must enforce on the Interstate system;
• Title 23 U.S.C. 141 requires states annually to certify that they adequately are enforcing all state laws regarding size and weight limits as a prerequisite for receipt of Federal-Aid Highway funding; and
• Title 49 U.S.C. 31111-31115 establishes minimum size requirements on the National Network and access routes to the NN.
Additional provisions are codified in various locations in Titles 23 and 49. However, the entire set of regulatory provisions that guide the administration of the Vehicle Size and Weight Activity are found in the Code of Federal Regulations, Volume 23, Parts 657 and 658. These two sections outline the responsibilities of the Federal program, including the procedures for state certification and enforcement of Federal size and weight limits. Spe-cifically, Part 657 describes the state certification process of submitting enforcement plans, annual plan updates, and certification evaluations to the FHWA and the role of the FHWA in reviewing and certifying these documents. Part 658 identifies the Interstate System and the National Network of highways and the Federal motor vehicle size and weight limits that must be enforced on those NN highways to guarantee state eligibility for Federal highway funding.
Cambridge Systematics, Inc. B-11

Minnesota Truck Size and Weight Project
State
The Minnesota Department of Transportation (Mn/DOT) and the Minnesota Department of Public Safety (DPS) are the two State agencies involved in commercial vehicle regula-tion and enforcement. Mn/DOT is the custodian of regulatory and administrative func-tions, including permitting and Federal reporting. The Minnesota Department of Public Safety is charged with enforcement of size and weight laws.
Local (County, Township, Municipal)
Counties and other political subdivisions are authorized to set and enforce size and weight laws on their road and highway networks. Some laws may vary by jurisdiction, including spring load restrictions.
Counties and other political subdivisions may issue permits for other configurations that exceed Minnesota Statutes for height, length, and weight as long as the movement occurs within the boundaries of that subdivision.
Federal Requirements and Options
This section summarizes Federal statutes governing size and weight and describes state reporting requirements and options.
Federal Regulations
The National Network is defined in Code of Federal Regulations (CFR) 23, Part 658 as “the Interstate System plus other qualifying Federal-Aid Primary System Highways” as of June 1, 1991 as described in Title 23 of U.S.C. The National Truck Network consists of desig-nated roadways throughout the United States that allow long combination vehicles, semi-trailer trucks with two trailers and single-trailer trucks with an extra long trailer. In Minnesota, 4,904 miles of roadway are part of the National Truck Network (NTN); see Appendix b for a listing of routes. The NTN is supplemented by Minnesota’s Twin Trailer Network, a system of other trunk and local highways on which LCVs also may operate. Figure B.1 shows these systems. The NN also includes those routes that provide “reason-able access” to the NN from truck and bus terminals, for example. The regulation requires that states designate reasonable access and make that information available to motor car-riers. It also stipulates that states administer an “access review process” to ensure proper analysis and review of access proposals. The regulation demands the submission of access provisions from each state allowing Surface Transportation Assistance Act (STAA)-dimensioned vehicles on all public roadways by June of 1990.
B-12 Cambridge Systematics, Inc.

Minnesota Truck Size and Weight Project
Figure B.1 National Network and Minnesota Twin Trailer Network
The current Federal limits on length, width, and weight are based on the STAA-dimen-sions and are presented in the context of applicability to the NN and its constituent parts (Interstates and Federal-Aid Primary Systems). In their most basic form, those limits on state regulations are set forth as:
Cambridge Systematics, Inc. B-13

Minnesota Truck Size and Weight Project
• Length – 48 feet minimum trailers in tractor-trailer combinations and 28 feet minimum on any trailer in either a tractor-semitrailer-trailer combination, applicable to the National Network routes;
• Width – 102 inches minimum and maximum width, applicable to the National Network routes;
• Height – There is no Federal height limit; these limits are set by the states; and
• Weight – 80,000 pounds maximum gross vehicle weight (GVW) limit, applicable to the Interstate System, except where the bridge formula dictates a lower vehicle weight:
− 20,000 pounds per single-axle; and
− 34,000 pound per tandem axle.
Currently, 16 states follow the basic definition of the NN by allowing all STAA-dimensioned vehicles on all Federal-Aid Primary System Highways. However, the other 32 states, including Minnesota, and the District of Columbia, and Puerto Rico limit STAA vehicles to specific Federally designated routes from the old Federal-Aid Primary System. For those states with detailed lists of individual routes, Federal designation has been granted to routes adhering to certain general safety, regulatory, design, and traffic flow characteristics. The regulation also provides information on the process whereby states add or delete portions of the NN, based on FHWA approval, and a list in Appendix b of Part 658 provides a full listing of NN routes for each state.
The bridge gross weight formula also is set forth in this section to specify the maximum gross weight allowed on any group of two or more consecutive axles based on the rela-tionship between the number of axles and distance between axles.
Longer Combination Vehicle Freeze
The regulation also affirms the Intermodal Surface Transportation Efficiency Act (ISTEA) freeze on enforcement of longer-combination vehicles (LCVs) on the Interstate and Defense Highways. The LCVs include any tractor and double or triple trailer, or double semitrailer combinations, excluding the STAA authorized twin 28 feet allowed on the NN, with a gross vehicle weight in excess of 80,000 pounds. Minnesota does not have any LCV regulations grandfathered under ISTEA.
Federal Requirements
Federal regulations specify enforcement as a state activity and place the burden of compli-ance with Federal regulations for size and weight on the states. The objective of the regu-lation is for states to develop programs to identify oversize and overweight vehicles and to systematically reduce violations thereby improving conditions for safety and system preservation. The statute requires states to engage in enforcement activities as a means of discouraging the violation of size and weight regulations.
B-14 Cambridge Systematics, Inc.

Minnesota Truck Size and Weight Project
Ultimately, there are two justifications underlying the Federal requirement for states to engage in enforcement activities that reduce violations. Those justifications are:
• System Preservation – Adherence to vehicle size and weight limits by motor carriers preserves pavement conditions and bridge structures; and
• Safety – Compliance with vehicle size and weight limits creates a safer driving environment.
To this end, states are required annually to submit two documents to the FHWA demon-strating enforcement of Federal size and weight regulations:
• State Enforcement Plan (SEP) – or annual Enforcement Plan Update, articulates the approach, resources (facilities, technology, and personnel) and procedures (hours, locations) used by the state to enforce size and weight laws; and
• Enforcement Certification – The state’s governor or designated agent (usually the Department of Transportation Secretary or Commissioner) submits a statement affirming that all state laws and Federal limits, including the ISTEA freeze on LCVs and other multi-unit vehicles, are enforced on the Interstate System and all Federal-Aid Primary and Secondary Highways in the state and that all state laws governing size and weight regulation on the Interstate System are consistent with 23 U.S.C. 127 a) and (b). The Enforcement Certification must document changes to state laws or regulations made since the last certification. Finally, the Certification must include a report of state size and weight enforcement activities during the past year with several data requirements: 1) actual number of enforcements versus those forecast in the Enforcement Plan, with focus on changes in operation from those proposed in the Enforcement Plan; 2) the outcomes of the enforcement process actually applied in terms of changes in the number of oversize and overweight vehicles identified; 3) total vehicles weighed and type of device used; 4) number and type of penalties; and 5) the number and type (divisible versus non-divisible) of permits issued for overweight loads.
Certification Failure
If a state fails to certify that it is adequately enforcing all state size and weight laws on Federal-Aid Highways, the state’s annual apportionment of Federal-Aid Highway funds may be reduced by 10 percent of the amount that would otherwise be apportioned. A 10 percent reduction may result in the following instances: 1) the state fails to submit a certi-fication, or 2) the Federal Highway Administrator determines that the state is not ade-quately enforcing size and weight regulations, despite the submission of a certification report. In both cases, the Federal Highway Administrator will transmit a determination of non-conformity identifying the reasons for the decision.
Cambridge Systematics, Inc. B-15

Minnesota Truck Size and Weight Project
Permit Processes
Before transporting an oversize (OS) or overweight (OW) load, the hauler is required by law to apply for an Overdimension/Overweight Transportation Permit through the Mn/DOT Office of Freight and Commercial Vehicle Operations’ Overdimension/Overweight Permits Section.
Permit Authority and Requirements
The Mn/DOT Commissioner and local authorities (Counties, cities, townships, etc.) may issue permits for vehicle configurations exceeding those specified in the Minnesota Statutes. The permits issues by Mn/DOT and local authorities must, when necessary:
• Prescribe conditions of operation to assure against undue damage to road foundations, surfaces or structures; and
• Require security for injury or damage to any roadway or road structure, such as a pol-icy of liability insurance or bond affording substantially the same coverage with respect to injury to persons and damage to property as is required for proof of financial responsibility under the No-Fault Automobile Insurance Act.
Permit Fees
Permit fees may be collected, and in the case of Mn/DOT, the proceeds are directed to The State Treasury for use on the truck highway system. Fees may be assessed on a single-trip basis, using overweight axle group cost factors, or on a seasonal/annual basis using GVW ranges, e.g., 90,001 to 100,000 annual permit fee is $300.
Reciprocal Agreements
On behalf of the State of Minnesota, the commissioner may enter into agreements with authorized representatives of other states for the reciprocal administration and granting of permits to allow the movement of vehicles of sizes and weights that do not conform to Minnesota law. The agreement may authorize representatives of other states to issue permits to allow vehicles that do not conform to the size and weight provisions of this chapter to travel on highways under the jurisdiction of the commissioner.
Enforcement Practices
Two State agencies are responsible for TS&W enforcement in the State:
1. Commercial Vehicle Enforcement (CVE) Section of the Minnesota State Patrol; and
2. Commercial Vehicle Operations (CVO) Section of the Mn/DOT Office of Freight and Commercial Vehicle Operations.
B-16 Cambridge Systematics, Inc.

Minnesota Truck Size and Weight Project
The State Patrol CVE Section enforces size and weight regulations via several ongoing activities, including:
• Annual Inspection Program – for all commercial vehicles or combination vehicles more than 26,000 pounds or those vehicles required to be placarded and registered in Minnesota. Once inspected, the vehicle must display a valid safety inspection decal issued by an inspector certified by the Commissioner of Public Safety or the vehicle must carry proof that it is engaged in Interstate commerce and that a certificate of compliance has been issued. Inspectors are not employees of the Department of Public Safety or Transportation and are required to recertify every two years through an approved technical college.
• Ongoing Enforcement – occurs through roadside inspections using portable scales and fixed station inspections throughout the State. There are eight permanent Commercial Vehicle Enforcement Stations in the State; each is equipped with fixed scales and vehi-cle safety inspection facilities.
Table B.1 Permanent Inspection Stations
Route and Direction Location
U.S. 2 and MS 33 all directions Saginaw
U.S. 2 and U.S. 59 all directions Erkskine
U.S. 10/169 NB, SB Anoka 5-miles west
U.S. 61 NB, SB Winona
I-90 EB Worthington-east
I-94 EB Dilworth at junction U.S. 75
I-94 WB at Wisconsin State line
The Mn/DOT CVO Section administers and enforces safety and economic regulations that govern for-hire and private motor carriers operating in or through Minnesota. With regard to size and weight regulations, the CVO Section maintains several comprehensive programs to ensure compliance and is responsible for permitting and enforcement of permits, primarily through audits.
Cambridge Systematics, Inc. B-17
Minnesota Truck Size and Weight Project
Conclusions
The laws governing commercial vehicle size and weight are intended to preserve Minnesota’s highway infrastructure from undue damage from oversize and overweight vehicles. At the same time, the regulations seek to maintain highway safety and the pro-ductivity of shippers and receivers vital to the State’s economy. The current regulations contain exceptions, usually granted through permit, that ensure economic viability of basic industries in Minnesota, including agriculture, forestry, and the production of paper. The State’s Department of Transportation and Public Safety have administrative and enforcement responsibilities to ensure adequate compliance with Federal and Minnesota regulations. Counties and local jurisdictions also administer and enforce commercial vehicle size and weight regulations.
B-18 Cambridge Systematics, Inc.

Minnesota Truck Size and Weight Project
Appendix a
Definitions
Axle – The common axis of rotation of one or more wheels whether power driven or freely rotating, and whether in one or more segments, and regardless of the number of wheels carried thereon.
Axle Group – An assemblage of two or more consecutive axles considered together in determining their combined load effect on a bridge or pavement structure.
Gross Weight – the weight on any single wheel, single-axle, or group of consecutive axles and the gross vehicle weight.
Implement of Husbandry – Any vehicle used in the process of cultivating, harvesting, or transporting agricultural products, including crops and animals. Common implement of husbandry vehicles include tractors, trailers.
Reasonable Access – Routes between the divided highways of four or more lanes of travel and terminals, facilities for food, fuel, repair, and rest and points of loading and unloading for household goods carriers, livestock carriers, or for the purpose of providing continuity of route.
Single-Axle – “Single-axle” includes all wheels whose centers may be included within two parallel transverse vertical planes 40 inches apart.
Single Wheel – includes two or more wheels with centers less than 48 inches apart on an axle.
Tandem – two consecutive axles whose centers are spaced more than 40 inches and not more than 96 inches apart.
Tire Width – the manufacturer’s width as shown on the tire or the width at the widest part of the tire excluding protective side ribs, bars, and decorations.
Tridem Axles – three axles spaced within 9 feet or less.
Variable Load Axle – means any axle that is specifically designed so that, through use of an actuating control, the wheels may be lifted so that the wheels do not contact the road surface or may be lowered to carry loads of varying weights when in contact with the road surface.
Cambridge Systematics, Inc. a-1
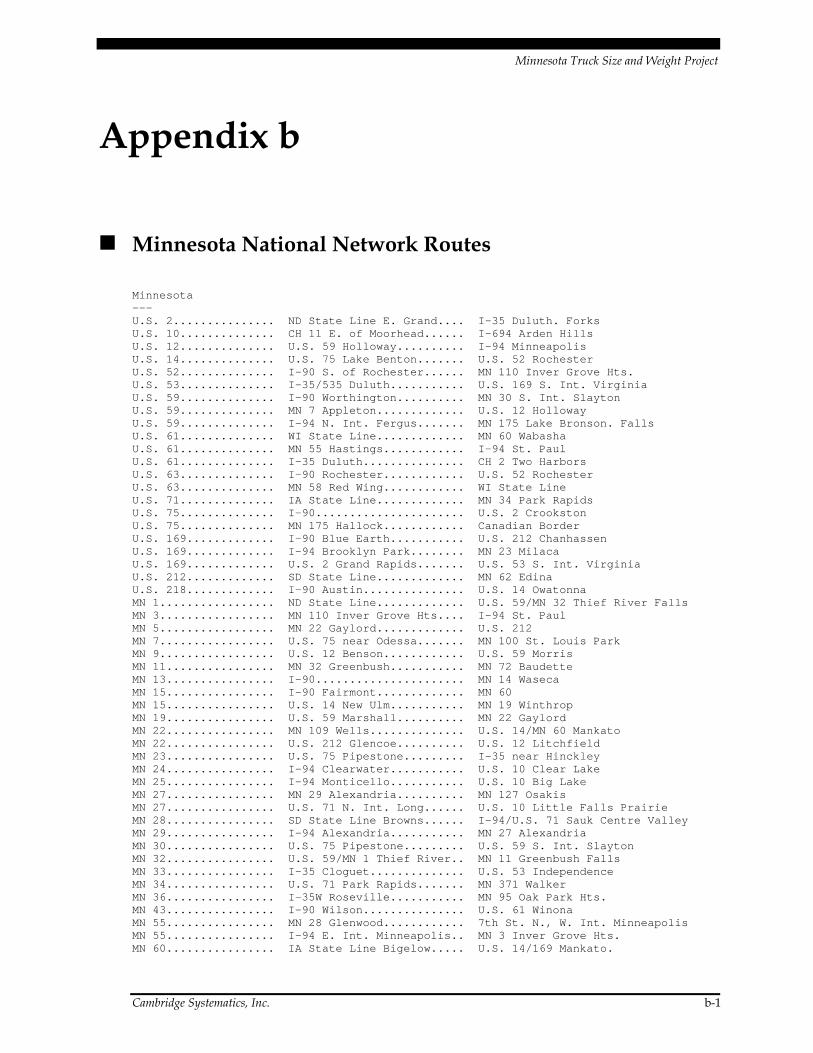
Minnesota Truck Size and Weight Project
Appendix b
Minnesota National Network Routes
Minnesota --- U.S. 2............... ND State Line E. Grand.... I-35 Duluth. Forks U.S. 10.............. CH 11 E. of Moorhead...... I-694 Arden Hills U.S. 12.............. U.S. 59 Holloway.......... I-94 Minneapolis U.S. 14.............. U.S. 75 Lake Benton....... U.S. 52 Rochester U.S. 52.............. I-90 S. of Rochester...... MN 110 Inver Grove Hts. U.S. 53.............. I-35/535 Duluth........... U.S. 169 S. Int. Virginia U.S. 59.............. I-90 Worthington.......... MN 30 S. Int. Slayton U.S. 59.............. MN 7 Appleton............. U.S. 12 Holloway U.S. 59.............. I-94 N. Int. Fergus....... MN 175 Lake Bronson. Falls U.S. 61.............. WI State Line............. MN 60 Wabasha U.S. 61.............. MN 55 Hastings............ I-94 St. Paul U.S. 61.............. I-35 Duluth............... CH 2 Two Harbors U.S. 63.............. I-90 Rochester............ U.S. 52 Rochester U.S. 63.............. MN 58 Red Wing............ WI State Line U.S. 71.............. IA State Line............. MN 34 Park Rapids U.S. 75.............. I-90...................... U.S. 2 Crookston U.S. 75.............. MN 175 Hallock............ Canadian Border U.S. 169............. I-90 Blue Earth........... U.S. 212 Chanhassen U.S. 169............. I-94 Brooklyn Park........ MN 23 Milaca U.S. 169............. U.S. 2 Grand Rapids....... U.S. 53 S. Int. Virginia U.S. 212............. SD State Line............. MN 62 Edina U.S. 218............. I-90 Austin............... U.S. 14 Owatonna MN 1................. ND State Line............. U.S. 59/MN 32 Thief River Falls MN 3................. MN 110 Inver Grove Hts.... I-94 St. Paul MN 5................. MN 22 Gaylord............. U.S. 212 MN 7................. U.S. 75 near Odessa....... MN 100 St. Louis Park MN 9................. U.S. 12 Benson............ U.S. 59 Morris MN 11................ MN 32 Greenbush........... MN 72 Baudette MN 13................ I-90...................... MN 14 Waseca MN 15................ I-90 Fairmont............. MN 60 MN 15................ U.S. 14 New Ulm........... MN 19 Winthrop MN 19................ U.S. 59 Marshall.......... MN 22 Gaylord MN 22................ MN 109 Wells.............. U.S. 14/MN 60 Mankato MN 22................ U.S. 212 Glencoe.......... U.S. 12 Litchfield MN 23................ U.S. 75 Pipestone......... I-35 near Hinckley MN 24................ I-94 Clearwater........... U.S. 10 Clear Lake MN 25................ I-94 Monticello........... U.S. 10 Big Lake MN 27................ MN 29 Alexandria.......... MN 127 Osakis MN 27................ U.S. 71 N. Int. Long...... U.S. 10 Little Falls Prairie MN 28................ SD State Line Browns...... I-94/U.S. 71 Sauk Centre Valley MN 29................ I-94 Alexandria........... MN 27 Alexandria MN 30................ U.S. 75 Pipestone......... U.S. 59 S. Int. Slayton MN 32................ U.S. 59/MN 1 Thief River.. MN 11 Greenbush Falls MN 33................ I-35 Cloguet.............. U.S. 53 Independence MN 34................ U.S. 71 Park Rapids....... MN 371 Walker MN 36................ I-35W Roseville........... MN 95 Oak Park Hts. MN 43................ I-90 Wilson............... U.S. 61 Winona MN 55................ MN 28 Glenwood............ 7th St. N., W. Int. Minneapolis MN 55................ I-94 E. Int. Minneapolis.. MN 3 Inver Grove Hts. MN 60................ IA State Line Bigelow..... U.S. 14/169 Mankato.
Cambridge Systematics, Inc. b-1

Minnesota Truck Size and Weight Project
MN 62............... U.S. 212 Edina............ MN 100 Edina. MN 65............... I-694 Fridley............. MN 23 Mora. MN 68............... U.S. 75 Canby............. MN 19 Marshall. MN 101.............. I-94 Rogers............... U.S. 10 Elk River. MN 109.............. I-90 Alden................ MN 22 Wells. MN 175.............. U.S. 75 Hallock........... U.S. 59. MN 210............... ND State Line............... U.S. 59 W. Int. Fergus Breckenridge
Falls MN 210.............. U.S. 10 Motley............ I-35 Carlton MN 371.............. U.S. 10 Little Falls...... U.S. 2 Cass Lake NOTE: I-35E St. Paul_The parkway segment of I-35E from 7th Street to I-94 is
not available to trucks because of reduced design standards.
b-2 Cambridge Systematics, Inc.

Minnesota Truck Size and Weight Project
Appendix c
Recent Minnesota Legislative Proposals Related to Commercial Vehicle Size and Weight
This appendix summarizes legislation introduced during the 2003-2004 and 2005-2006 legislative sessions potentially affecting truck size and weight regulations. The following summaries provide a brief overview of each bill introduced, including its current status (signed by Governor, referred to committee, etc.)
2003-2004 Session
SF 2930, HF 2671 Three Vehicle Combination for New Trailers
• Status: HF 2671 signed by Governor 5/19/2004; effective 5/20/2004
• Proposed changes: Would amend 169.86 to allow annual permits to be issued for three vehicle combinations consisting of two empty, newly manufactured trailers for cargo, horses, or livestock, length not to exceed 18 feet 6 inches per trailer. The permit allows the vehicles to be moved from a trailer manufacturer to a trailer dealer only while operating on twin trailer routes designated under section 169.81, Subd. 3 (c).
SF 2263, HF 2479 Weight Limitation Route Designation by Local Government and Spring Load Restriction Two Week Extension over Gravel Roads
• Status: HF 2479 signed by Governor 5/29/2004; effective various dates
• Proposed changes: Weight Limitation Route Designation by Local Government Would amend 169.832 by adding a subdivision 11a to read: notwithstanding subdivi-sion 11, the governing body of a county, statutory or home rule charter city, or town may designate any street or highway under its jurisdiction that has been designated and built to carry such weights to carry weight permitted under sections 169.822 to 169.929. Designations by the governing body of a county, statutory, or home rule charter city, or town under this subdivision are not subject to the approval of the Commissioner.
• Proposed changes: Spring Load Restriction Two Week Extension over Gravel Roads also would amend 169.87 to extend Seasonal Load Restrictions to “statutory or home
Cambridge Systematics, Inc. c-1

Minnesota Truck Size and Weight Project
rule charter city streets” and would keep in effect the seasonal load restrictions on gravel road two weeks longer than SLRs for other streets or highways in that zone.
SF 1948, HF 1838 Articulated Buses Length Exemption
• Status: HF 1838 signed by Governor 5/29/2004; effective 8/1/2004
• Proposed changes: Would amend 169.81 by adding a subdivision (3e) to allow a motor carrier of passengers registered under section 221.0252 to operate without a permit an articulated bus of up to 61 feet in length.
SF 1793 Clarification of First Haul Exemption For Registration Purposes
• Status: SF 1793 referred to House Finance Committee 2/5/2004
• Proposed changes: Expansion of First Haul Exemption – Would amend 169.81 by adding a subdivision (3e) which exempts the first haul of unprocessed or raw farm products or unfinished forest products from the relevant evidence tolerance for over-loads (the greater of 4 percent or 1,000 pounds above registered weight) and releases the owner/driver/user of the vehicle from a misdemeanor charge for overweight violation (169.81 Subd. d) if registered gross weight is not exceeded by more than 10 percent.
SF 1118, HF 1238 Higher Winter Weight Increase
• Status: SF 1118 introduced; HF 1238 referred to Transportation Policy Committee 3/26/2003
• Proposed changes: Would expand the authority of the Commissioner of Transportation to establish seasonal highway zones to allow operation of overweight vehicles during the winter season and increasing the allowable percentage increase amount to 25 per-cent over maximum annual allowable GVW.
SF 1113, HF 0985 Maximum Gross Weight Increase (Six or More Axles)
• Status: SF 1113 referred to Finance Committee 3/26/2003; HF 0985 referred to Transportation Finance Committee 3/15/2004
• Proposed changes: Would amend 169.824, Subd. 2 to provide for the maximum gross weight of 88,000 pounds for any vehicle or combination of vehicles with six or more axles exclusively hauling livestock on non-Interstate highways, but does not authorize operation in violation of bridge weight limits.
c-2 Cambridge Systematics, Inc.

Minnesota Truck Size and Weight Project
SF 1090, HF 1130 Gross Winter Weight Increase SF 0973, HF 0643 Vehicle Registration Provisions and Modifications
• Status: HF 0643 substituted on General Orders 5/7/2003; HF 0643 passed as amended 5/5/2003
• Proposed changes: Modifies motor vehicle registration, dealer transaction, insurance regulatory responsibilities, truck weighing, and driver’s license expiration provisions.
SF 0457, HF 0722 Garbage and Recycling Truck Weight Exemption
• Status: SF 0457 signed by Governor 5/18/2004; effective 5/19/2004
• Proposed changes: Amends 169.87, Subd. 6 to exempt garbage trucks and recycling vehicles from weight restrictions until July 1, 2005.
SF 1324, HF 0804 Weight Exemption For Vehicles Carrying Farm or Forest Products
• Status: SF 1234 language added by Author 2/23/2004; HF 0804 second reading 4/14/2004
• Proposed changes: Would change Minnesota Statute 169 to authorize vehicles or vehicle combinations hauling raw or unfinished farm or forest products from the place of production or storage to the nearest highway to exceed certain highway gross weight limits, except during seasonal load restrictions and bridge load limits.
HF 0087 Implement of Husbandry Civil Liability
• Status: HF 0087 referred to Transportation Policy Committee 1/16/2003
• Proposed changes: Would amend 169.801 by adding a subdivision holding an owner and operator of overweight implement of husbandry liable for damages caused to roads and bridges.
2005 Session
SF 2051, HF 2256 First Haul Weight Exemption
• Status: SF 2051 referred to Transportation Committee 4/4/2005; HF 2256 referred to Transportation Committee 3/31/2005
• Proposed Changes: Would amend 169.8261 to exempt first hauls of manufactured wood products from certain highway weight restrictions.
Cambridge Systematics, Inc. c-3

Minnesota Truck Size and Weight Project
SF 1990, HF 1896 Recreation Vehicle Definition Expansion and Weight Limit Increase for Livestock Haulers
• Status: SF 1990 referred to Transportation Committee 3/31/2005; HF 1896 referred to Transportation Finance Committee 3/31/2005
• Proposed Changes: Would expand the definition of a recreational vehicle combination to certain pick-up trucks hauling horse trailers. The bill also would increase the gross vehicle weight to 88,000 for six-axle vehicles carrying live-stock on non-Interstate highways with an annual permit
SF 1849, HF 1667 Expanded Wheel and Axle Weight Limits
• Status: SF 1849 referred to Transportation Committee 3/21/02005; HF 1667 referred to Transportation Committee 3/10/2005
• Proposed Changes: Would amend 169.823, Subd. 1 to allow 10,000 pounds on any wheel of vehicles equipped with pneumatic tires as well as 20,000 pounds on any single-axle. The bill also would amend 169.87, Subd. 2 to increase the weight for a single-axle from five to seven tons during spring weight restrictions.
SF 1848, HF 1825 Amendment to SF 1849, HF 1667 – Weight Increase During First Four Weeks of SLR
• Status: SF 1848 referred to Transportation Committee 3/21/2005; HF 1825 referred to Transportation Committee 3/16/2005
• Proposed Changes: Amends SF 1849 and HF 1667 to allow seven-ton vehicle loading four weeks after the commencement of seasonal load restrictions.
SF 1542, HF 1400 Recreational Vehicle Definition; Additional Winter Weight Increase for Forest Products; Annual Permits
• Status: SF 1542 second reading on 5/5/2005; HF 1400 language added by Author 4/7/2005
• Proposed Changes: Would expand the definition of recreational vehicle combination to include carriers hauling equestrian equipment and supplies. The bill also would impose a maximum 20,000-pound limit on single axles of vehicles hauling forest products and allows these vehicles to exceed legal axle weights in the gross weight schedule by up to 12.5 percent or 22.5 percent during the period when winter weight allowances are in effect. The bill also provides for annual oversize and overweight permits for hauling manufactured storage buildings and special permits for certain vehicles hauling paper products.
c-4 Cambridge Systematics, Inc.

Minnesota Truck Size and Weight Project
SF 1541, HF 1537 Reasonable Access Exemption
• Status: SF 1541 second reading 4/4/2005; HF 1537 introduced 3/3/2005
• Proposed Changes: Would amend 169.824, Subd. 2 to allow a five-axle vehicle or combination up to 80,000 pounds to operate on a highway that is not designated for 80,000 pound operation if the vehicle or combination requires reasonable access to food, fuel, repair or rest facilities within 3 miles of a designated highway. The bill also amends 168.85, Subds. 1 and 6 respectively to specify that signs for portable truck weighing scales be posted within the highway right-of-way and redefines “officer.”
SF 1528, HF 1411 Milk Transport Exemption
• Status: SF 1528 referred to Transportation Committee 3/10/2005; HF 1411 language added by Author 3/3/2005
• Proposed Changes: Would amend 169.87, Subd. 4 to exempt vehicles transporting milk from weight restrictions.
SF 1466, HF 1508 Clarification of Seasonal Load Restrictions For Utility Vehicles
• Status: SF 1466 signed by Governor 4/14/2005; effective 4/15/2005
• Proposed Changes: Clarifies 169.87, Subd. 1 and 2 of for the seasonal load restrictions of utility vehicles.
SF 1259, HF 1189 Seasonal Weight Limit Repeal For Recycling and Garbage Trucks
• Status: HF 1189 substituted on Consent Calendar 4/18/2005
• Proposed Changes: Would amend 169.87, Subd. 6 to repeal the July 1, 2005 sunset date to seasonal axle weight limits of 14,000 pounds for recycling and garbage trucks.
SF 1185, HF 1188 Recreational Vehicle Combinations Operation Without a Permit
• Status: SF 1185 referred to Transportation Committee 2/24/2005, HF 1188 referred to Transportation Committee 2/21/2005
• Proposed Changes: Would amend 169.81, Subd. 3c to authorize operation of recrea-tional vehicle combinations carrying equestrian equipment and supplies to exceed certain length limits without a permit.
Cambridge Systematics, Inc. c-5

Minnesota Truck Size and Weight Project
SF 0729, HF 1170 Storage Shed Oversize Load Permit
• Status: SF 0729 second reading on 3/14/2005; HF 1170 referred to Transportation Committee 2/21/2005
• Proposed Changes: Would amend 169.80 Subd. 2 and 169.86, Subd. 5 to authorize oversize load permits for the transport of storage sheds.
HF 0570 Seven-Axle Weight Increase
• Status: HF 0570 referred to Transportation Committee 1/31/2005
• Proposed Changes: Would authorize vehicles equipped with seven or more axles to operate in excess of weight limits up to 105,000 pounds on non-Interstate highways if the vehicle a) has a total length of 95 feet, b) is within five miles of a state border that permits combinations with equal or greater length and gross vehicle weight, c) obeys all postings and bridge weight limits, and d) possesses a permit.
c-6 Cambridge Systematics, Inc.

Appendix C Review of Selected Truck Size and Weight Laws and Practices Elsewhere

Minnesota Truck Size and Weight Project
Review of Selected Truck Size and Weight Laws and Practices Elsewhere
Summary
This appendix compares and contrasts Minnesota’s truck size and weight (TS&W) laws and regulations against those of neighboring U.S. states and Canadian provinces. A num-ber of case studies of regulatory approaches to TS&W are presented, including domestic and international examples, for consideration by the Minnesota Department of Transportation (Mn/DOT).
This comparative analysis reveals that, in general, Minnesota’s TS&W laws are relatively similar to those of surrounding states and provinces. The primary exceptions to this are regulations governing longer combination vehicles (LCV) and gross vehicle weights (GVW), which are more restrictive in Minnesota. Specific observations include:
• Minnesota, like its neighbors, grants exceptions to certain industries, especially agri-cultural and extractive industries like timber. However, Minnesota’s laws are more restrictive for these exempted industries than in surrounding states and provinces.
• Unlike Minnesota, LCVs are generally allowed on the Interstate or the National Network (NN) in several surrounding states and provinces except Iowa and Wisconsin.
• Canada’s limits are based on specific truck configurations and are higher than Minnesota’s limits for like configurations.
• Two widely acknowledged Transportation Research Board studies conclude that establishing a Federally supervised state permitting program would provide states the flexibility to change regulations to fit their needs and also can be an instrument to promote safety of heavier vehicles.
• Most states do not require additional safety equipment requirements for heavy vehicle configurations beyond those that are Federally mandated in the Code of Federal Regulations.
Cambridge Systematics, Inc. C-1

Minnesota Truck Size and Weight Project
Objective
The objective of this appendix is to present TS&W laws and regulations from neighboring U.S. states and Canadian provinces in relation to the laws and regulations of Minnesota in order to determine where similarities and inconsistencies exist and to identify examples of regulations, configurations, and practices that might be applicable to Minnesota. Ulti-mately, the information contained in this appendix will assist Mn/DOT in making rec-ommendations to change existing laws to accomplish the policy goals and objectives of the public and private stakeholders.
Methodology
This analysis draws principally from the Minnesota Statutes, existing studies and reports, and materials prepared by Mn/DOT staff. This appendix is a synthesis of existing materi-als and not an extensive literature review of all statutes and regulations. The primary sources consulted for this appendix include:
• Upper Midwest Freight Corridor Study (Midwest University Regional Transportation Center);
• Minnesota Shippers and State Truck Size/Weight Regulations (Mn/DOT);
• Truck Weight Subcommittee Final Report (West Central Initiative);
• North Dakota Strategic Freight Analysis;
• Minnesota Commercial Truck and Passenger Regulations (2004/2005);
• Code of Federal Regulations 23, Part 658;
• Federal Size Regulations for Commercial Motor Vehicles;
• American Association of State Highway and Transportation Officials (AASHTO) Guide for Vehicle Weights and Dimensions;
• Materials developed by Mn/DOT staff (Commercial Vehicle Operations and Financial Planning and Analysis);
• State Department of Transportation and provincial web sites, and the Federal Motor Carrier Safety Administration web site; and
• State and Provincial statutes.
C-2 Cambridge Systematics, Inc.

Minnesota Truck Size and Weight Project
The study team also interviewed personnel from Mn/DOT and Manitoba to define the practical application of the regulations.
The states and provinces analyzed in this appendix include those sharing borders with Minnesota, specifically the following states: Iowa, North Dakota, South Dakota, and Wisconsin. Canadian provinces sharing a border with Minnesota include Manitoba and Ontario. In addition to these states and provinces, this analysis also includes Michigan due to its proximity and similarity in industrial composition and geographic position. Moreover, Michigan has a similar set of laws that grant special exemptions to certain industries, such as timber haulers, making Michigan a State of interest to this study and Mn/DOT. The following figure shows the location of the states and provinces analyzed in this appendix.
Figure C.1 Neighboring U.S. States and Canadian Provinces
This appendix organizes information into summary tables that present size and weight dimensions for Minnesota and its neighboring states and provinces. For each state or province, a brief synopsis of size and weight regulations as well as its differences in rela-tion to Minnesota summarize the following:
• Limits and provisions;
• Exclusions and exemptions;
Cambridge Systematics, Inc. C-3

Minnesota Truck Size and Weight Project
• Roles and responsibilities; and
• Federal requirements and options.
The information presented on state and provincial laws and practices concentrates on the similarities and differences between the neighboring jurisdictions and Minnesota. Fol-lowing the state and province summaries, international case studies are presented of innovative international approaches to truck size and weight regulation.
Findings
Limits and Provisions
The following tables array commercial vehicle dimensions (Table C.1) and weights (Table C.2) for Minnesota and its surrounding states and provinces. These are the general limits applicable to most five- and six-axle tractor semitrailer configurations. Generally, these limits and provisions do not require special permits. Principal exclusions and exemptions, most of which require permits, are described in table footnotes as well as in subsequent sections for each state and province. For each of the laws summarized below, the Federal limit, where applicable, also is noted.
C-4 Cambridge Systematics, Inc.

Minnesota Truck Size and Weight Project
Table C.1 Summary of Maximum Truck Dimensions in Minnesota and Neighboring States and Provinces
Dimension Minnesota Iowa Michigan North
Dakota South
Dakota Wisconsin Federal Manitoba Ontario
Width (Inches) 102 102 102a 102 102 102 102 102 102
Height (Feet) 13.5 13.5 13.5 14 14 13.5 No limit 13.67 13.67
Length
Single Unit (Straight Truck) 40 40 40 50 45 40 No limit 41.2 41.2
Semitrailer 53 53 53b 53 53 53 48 minimum 53.39 53.39
Twin Combinations Maximum Trailer Length
28.5 28.5 28.5 53c 45d 28.5 No limit 82.4e 82.4e
LCVs Allowed Nof Yesg Yes Yes Yes No Varies by state Yese Yese
Notes: a Michigan limits width to 96 inches off the Interstate/Designated systems.
b Michigan limits semitrailer length to 50 feet off the Interstate/Designated systems.
c Overall length of 110 feet on Interstate, 95 feet on state highways, and 75 feet on other roads.
d Maximum total length of 81.5 feet measured from front of first trailer to rear of last trailer, including hitching device.
e Manitoba and Ontario each have configuration-based guidelines for twin trailer length and overall twin length cannot exceed 82.4 feet.
f Surface Transportation Assistance Act (STAA) doubles are allowed in all states on the NN and, in Minnesota, they are further allowed on the designated Minnesota Twin Trailer Network.
g LCVs, including double- and triple-trailer combinations, are allowed on a limited basis up to 100 feet in length.
Cambridge Systematics, Inc. C-5
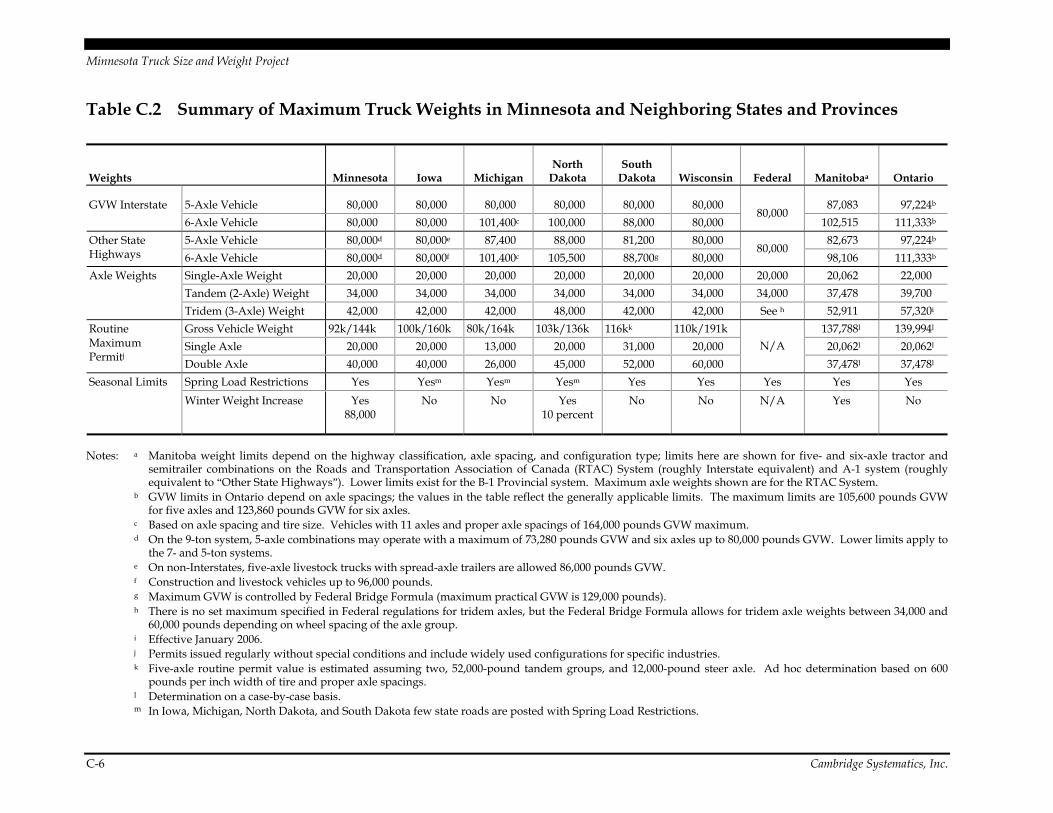
Minnesota Truck Size and Weight Project
Table C.2 Summary of Maximum Truck Weights in Minnesota and Neighboring States and Provinces
Weights Minnesota Iowa Michigan North
Dakota South
Dakota Wisconsin Federal Manitobaa Ontario
5-Axle Vehicle 80,000 80,000 80,000 80,000 80,000 80,000 87,083 97,224bGVW Interstate 6-Axle Vehicle 80,000 80,000 101,400c 100,000 88,000 80,000
80,000 102,515 111,333b
5-Axle Vehicle 80,000d 80,000e 87,400 88,000 81,200 80,000 82,673 97,224bOther State Highways 6-Axle Vehicle 80,000d 80,000f 101,400c 105,500 88,700g 80,000
80,000 98,106 111,333b
Single-Axle Weight 20,000 20,000 20,000 20,000 20,000 20,000 20,000 20,062 22,000 Tandem (2-Axle) Weight 34,000 34,000 34,000 34,000 34,000 34,000 34,000 37,478 39,700
Axle Weights
Tridem (3-Axle) Weight 42,000 42,000 42,000 48,000 42,000 42,000 See h 52,911 57,320i
Gross Vehicle Weight 92k/144k 100k/160k 80k/164k 103k/136k 116kk 110k/191k 137,788l 139,994l
Single Axle 20,000 20,000 13,000 20,000 31,000 20,000 20,062l 20,062l
Routine Maximum Permitj
Double Axle 40,000 40,000 26,000 45,000 52,000 60,000 N/A
37,478l 37,478l
Spring Load Restrictions Yes Yesm Yesm Yesm Yes Yes Yes Yes Yes Seasonal Limits Winter Weight Increase Yes
88,000 No No Yes
10 percent No No N/A Yes No
Notes: a Manitoba weight limits depend on the highway classification, axle spacing, and configuration type; limits here are shown for five- and six-axle tractor and semitrailer combinations on the Roads and Transportation Association of Canada (RTAC) System (roughly Interstate equivalent) and A-1 system (roughly equivalent to “Other State Highways”). Lower limits exist for the B-1 Provincial system. Maximum axle weights shown are for the RTAC System.
b GVW limits in Ontario depend on axle spacings; the values in the table reflect the generally applicable limits. The maximum limits are 105,600 pounds GVW for five axles and 123,860 pounds GVW for six axles.
c Based on axle spacing and tire size. Vehicles with 11 axles and proper axle spacings of 164,000 pounds GVW maximum. d On the 9-ton system, 5-axle combinations may operate with a maximum of 73,280 pounds GVW and six axles up to 80,000 pounds GVW. Lower limits apply to
the 7- and 5-ton systems. e On non-Interstates, five-axle livestock trucks with spread-axle trailers are allowed 86,000 pounds GVW. f Construction and livestock vehicles up to 96,000 pounds. g Maximum GVW is controlled by Federal Bridge Formula (maximum practical GVW is 129,000 pounds). h There is no set maximum specified in Federal regulations for tridem axles, but the Federal Bridge Formula allows for tridem axle weights between 34,000 and
60,000 pounds depending on wheel spacing of the axle group. i Effective January 2006. j Permits issued regularly without special conditions and include widely used configurations for specific industries. k Five-axle routine permit value is estimated assuming two, 52,000-pound tandem groups, and 12,000-pound steer axle. Ad hoc determination based on 600
pounds per inch width of tire and proper axle spacings. l Determination on a case-by-case basis. m In Iowa, Michigan, North Dakota, and South Dakota few state roads are posted with Spring Load Restrictions.
C-6 Cambridge Systematics, Inc.

Minnesota Truck Size and Weight Project
Iowa
Limits and Provisions
Dimensions: Same as Minnesota
Iowa’s basic commercial vehicle dimension limits and provisions are the same as Minnesota except that LCVs are allowed, on a limited basis, on the Interstate to and from South Dakota and Nebraska to Sioux City (see Federal Requirements and Options below).
Weight: Same as Minnesota, Except No Winter Weight Increase
Like Minnesota, maximum weight on the Interstate and non-Interstate systems is limited to 80,000 pounds in Iowa, with important exclusions and exceptions, which are noted below. Iowa Interstate axle weight limits also are the same as Minnesota. Axle weights off the Interstate system are governed by weight tables that generally allow higher axle weights on county and city highways. Iowa restricts spring loads, but few highways are posted. There is no winter weight increase in Iowa.
Exclusions and Exemptions
• Six-Axle Livestock and Construction Vehicles – Six-axle livestock and construction vehicles can exceed the non-Interstate GVW limit up to 96,000 pounds, with appropri-ate spacing (62 feet overall wheel base).
• Spread-Axle Livestock Vehicles – Five-axle “spread-axle” livestock vehicles are allowed up to 86,000 pounds GVW off the Interstates if they have an overall wheelbase of at least 61 feet and may only transport livestock. Throughout the State, bridges are posted to indicate maximum weights.
• Implements of Husbandry – Driven or towed implements of husbandry, under nor-mal operation, are not subject to posted road embargoes. Grain carts, tank wagons, and fenceline feeders also are not exempt from posted road embargoes. Implements of husbandry hauling units for repair are exempt from bridge weight limits and posted road embargoes while being transported.
Roles and Responsibilities
The Iowa Department of Transportation (DOT) Office of Motor Vehicle Enforcement enforces size and weight laws on its highways. The Iowa DOT’s Office of Motor Carrier Services administers the permitting system for oversize and overweight trucks.
Cambridge Systematics, Inc. C-7

Minnesota Truck Size and Weight Project
Counties and cities can post temporary and seasonal embargoes on roadways and bridges within their jurisdiction.
Federal Requirements and Options
The Federal “LCV Freeze” allows limited operation of double and triple trailer LCVs in Iowa within the city limits of Sioux City to and from its terminals. Specifically, LCVs may operate on Interstate and NN systems within the city limits of Sioux City to and from South Dakota (at up to 100 feet in trailer length and 129,000 GVW) and Nebraska (at up to 65 feet in trailer length and 95,000 GVW).
Michigan
Limits and Provisions
Dimensions: Narrow Widths Off Interstate/Designated Highways, Shorter Semitrailer Lengths Off Interstate/Designated Highways, But LCVs Are Allowed on Interstate Highways
Michigan’s basic commercial vehicle dimension limits and provisions are the same as Minnesota with three notable exceptions: 1) Michigan has a more narrow (96 inch) maxi-mum width limit off its Interstate and Designated routes; 2) semitrailers are limited to 50 feet in length on Non-designated routes; and 3) LCVs are allowed, including double trailer combinations up to 58 feet on Interstates and Designated state routes.
Weight: Same as Minnesota, Except No Winter Weight Increase
Like Minnesota, maximum weight on the Interstate and non-Interstate systems is limited to 80,000 pounds in Michigan for 5-axle combinations. Michigan’s weight limit for 6-axle combinations on the Interstate and for both 5- and 6-axle combinations off the Interstate system are higher than Minnesota limits. Specifically, Michigan allows a 6-axle 101,400-pound combination on the Interstate system; Michigan also allows a 5-axle 87,400-pound combination and a 6-axle, 101,400-pound combination off the Interstate system. Michigan achieves these higher weight limits through axle spacing as its axle weight limits are the same as Minnesota. Michigan enforces spring load restrictions (SLR), but milk haulers can apply for an exemption from SLRs. Like Iowa, Michigan posts SLRs on a small percentage of its highways. Michigan restricts spring loads, but few highways are posted. There is no winter weight increase.
C-8

Minnesota Truck Size and Weight Project
Exclusions and Exemptions
• 108-Inch Width Exceptions – Loads of unprocessed logs, pulpwood, wood bolts, agri-cultural products, and concrete pipe have a maximum width of 108 inches, 6 inches more than the normal legal width of 102 inches.
• Implements of Husbandry Width Exemption– Implements of husbandry, operated by a farmer only, can exceed the legal width limit to any width required for normal farming operations.
• Combination Length Exceptions – Truck and semitrailer or trailer, or two semitrailers in a combination can exceed the 53 feet length limit to 58 feet on Designated Highways and up to 59 feet on Non-designated routes.
• 65-Foot Truck and Trailer or Semi Trailer Length Exception – These combinations can be operated on Designated routes.
• 70-Foot Timber Hauler Length Exception – Timber haulers transporting saw logs, pulpwood, and tree length poles can move trailers or semitrailers up to 70 feet in length and may be operated on Designated routes, including National Network routes (see Federal Requirements and Options below).
• Assembled Motor Vehicle Length Exceptions – Tractor and trailer or semitrailer com-binations designed and used exclusively to move assembled motor vehicles or bodies, recreational vehicles, or boats can exceed length limits to 65 feet except stinger-steered, single tow-bar, or saddle mount combinations, which can exceed length limits to 75 feet on Designated routes and 55 feet on Non-designated routes.
Roles and Responsibilities
The Michigan State Police Motor Carrier Division enforces size and weight laws on the highways. The Michigan Department of Transportation administers the permitting sys-tem for oversize and overweight trucks.
Federal Requirements and Options
Federal regulations allow LCVs with double trailer cargo carrying units up to 58 feet in total length on the Interstate system and Designated state highways. Federal law also allows for truck-trailer combinations carrying timber (see above) to operate on the National Network with a cargo carrying trailer up to 63 feet in length or 70 feet overall with power unit.
Cambridge Systematics, Inc. C-9

Minnesota Truck Size and Weight Project
North Dakota
Limits and Provisions
Dimensions: Higher Height Limit and Longer Lengths, Including LCVs
North Dakota’s height limit is 14 feet maximum, which is 6 inches higher than the Minnesota height limit. The maximum allowable length for single unit trucks is 50 feet, which is 10 feet longer than Minnesota’s limit or the limits of any surrounding state or province. Combination units of 2, 3, or 4 vehicles cannot exceed 75 feet on Non-designated highways or 110 feet on Designated highways, including the Interstate and National Network, 4-lane divided highways, and state highways Designated by the DOT director or local authorities with jurisdiction.
Weight: Higher Weight Limits than Minnesota
Like Minnesota, maximum weight on the Interstate system in North Dakota is limited to 80,000 pounds North Dakota’s Interstate axle weight limits are the same as Minnesota for single and tandem axles. For tridem axles, North Dakota allows up to 48,000 gross axle weight, which is higher than surrounding states or provinces except Ontario. Axle weights off the Interstate system are governed by a weight table, which allows higher axle weights off the Interstate system. Maximum allowable GVW is 105,500 off the Interstate system. North Dakota restricts spring loads, but few highways are posted. There is a winter weight increase of 10 percent.
Exclusions and Exemptions
• Farm Vehicle Height Exception – Farm vehicles driven by resident ranchers, farmers, dealers, or manufacturers driven 60 miles or less off the Interstate system and between sunrise and sunset.
• Construction Vehicle Width Exception – Construction vehicles can transport vehicles or loads up to 10 feet wide.
• Implements of Husbandry Width, Height, and Length Exception – Implements of husbandry moved by resident farmers, ranchers, governmental entities, dealers, or manufacturers between sunrise and sunset are not subject to North Dakota’s commer-cial vehicle dimension limits for width, height, and length.
C-10

Minnesota Truck Size and Weight Project
• Agriculture Exemption – Other vehicles and loads are exempt from dimension limita-tions of width, height, and length, including:
− Hay transported between sunrise and sunset on the right edge of a roadway by a farmer;
− Self-propelled fertilizer spreaders, portable grain cleaners, forage harvesters, hay grinders, agricultural chemical applicators, and other applicable agricultural vehi-cles towed or operating under their own power and subject to certain restrictions and permitting requirements.
• 10 Percent Agricultural Seasonal Exemptions – Vehicles carrying agricultural prod-ucts may exceed weight limits by 10 percent up to 105,500 pounds GVW with a permit issued by either North Dakota DOT or a local authority. This exemption is applicable to:
− Harvest Season movement of all agricultural products from July 15 to December 1 is allowed from the field of first harvest to the point of initial storage.
− Winter Movement of agricultural commodities is allowed between December 1 and March 7, including solid waste.
− Potato and Sugar Beet vehicles between July 15 and December 15 are allowed unrestricted movement.
Roles and Responsibilities
The North Dakota Department of Transportation Central Office Motor Vehicle Division administers the permitting system for oversize and overweight trucks and enforces vehi-cle dimensions and weights. Local authorities may limit vehicle size and weight through adequate posting when roads or bridges have been damaged by emergency or climactic events. Local authorities also can issue some permits, including harvest season permits.
Federal Requirements and Options
Federal regulations allow a maximum GVW of 105,500 on the National Network for truck tractor and two trailing unit combinations and also require the lightest trailer at the end of the train. The provision also allows reasonable access for up to 10 miles off the National Network. Federal regulations also allow for cargo unit lengths up to 103 feet for double trailer combinations and up to 100 feet for triple trailer combinations.
Cambridge Systematics, Inc. C-11

Minnesota Truck Size and Weight Project
South Dakota
Limits and Provisions
Dimensions: Slightly Longer Allowable Lengths
South Dakota allows a single unit of up to 45 feet in length and a single trailer in a twin trailer combination of up to 45 feet, as long as the total length does not exceed 83.5 feet. South Dakota’s height limit, like North Dakota, is 14 feet.
Weight: Higher Off Interstate Weight Limit; No Winter Weight Increase
Like Minnesota, maximum weight on the Interstate systems is limited to 80,000 pounds except by permit. South Dakota Interstate axle weight limits also are the same as Minnesota. GVW off the Interstates is higher in South Dakota than Minnesota (81,200 GVW for a typical 5-axle combination; 88,700 GVW for a typical 6-axle combination). The maximum practical GVW off the Interstate system is based on the application of the Federal Bridge Formula and South Dakota’s length limit up to 129,000 GVW. South Dakota restricts spring loads, but few highways are posted. There is no winter weight increase in South Dakota.
Exclusions and Exemptions
• Hay Hauler Height Exemption – A vehicle with a load of baled hay is permissible up to 14 feet 3 inches off the Interstate system.
• Farm Machinery Height and Width Exemptions – Farm vehicles operated by farmers are not subject to height or width limits but must abide by posted bridge clearances. Such vehicles are not allowed on the Interstate system.
• Straight Truck with Trailer Length Exemption – The overall length of a straight truck-trailer combination is limited to 80 feet.
• Saddlemount and Two Trailer Combinations Length Exemption – These combina-tions are limited to a maximum of 4 units (saddlemount) or two trailing units (towing vehicle and two-trailer combination) and cannot exceed 75 feet in length.
• Fertilizer Trailer Length Exemption – A combination of a towing unit and up to two-trailer tanks for distribution of anhydrous ammonia may not exceed a total length of 70 feet and must abide by other operating regulations.
C-12

Minnesota Truck Size and Weight Project
• 10 Percent Harvest Weight Tolerance – Vehicles moving agricultural products from the point of harvest to the point of first unloading are granted a tolerance of 10 percent above legal limits for the configuration if traveling within 50 miles of the loading site, off the Interstate system, and at a speed of 50 miles per hour or less.
• 5 Percent Farm Hauling Tolerance – Vehicles moving agricultural products from farm storage or livestock from a farm are granted a tolerance of 5 percent above legal limits for the configuration if traveling within 50 miles of the loading site, off the Interstate system, and at a speed of 50 miles per hour or less. This tolerance is not given during the spring load restriction period.
Roles and Responsibilities
The South Dakota Highway Patrol’s Motor Carrier Services division enforces size and weight laws on the highways and administers the permitting system for oversize and overweight trucks.
Federal Requirements and Options
The Federal Bridge Formula governs the maximum GVW in South Dakota, resulting in a maximum GVW of 129,000. LCVs, including double and triple combination cargo car-rying units up to 100 feet, are allowed on Designated highways in South Dakota.
Wisconsin
Limits and Provisions
Dimensions: Same as Minnesota
Wisconsin’s basic commercial vehicle dimension limits and provisions are the same as Minnesota. LCVs are not allowed under Federal law.
Weight: Same as Minnesota, Except No Winter Weight Increase
Wisconsin, like Minnesota, limits maximum weight on the Interstate and non-Interstate systems to 80,000 pounds Interstate axle weight limits also are the same as Minnesota. Axle weights off the Interstate system are governed by weight charts that generally allow higher axle weights on county and city highways. Wisconsin restricts spring loads, but does not provide for a winter weight increase.
Cambridge Systematics, Inc. C-13

Minnesota Truck Size and Weight Project
Exclusions and Exemptions
• Implements of Husbandry Width, Height, and Length Exceptions – Implements of husbandry are not limited if operated temporarily on highways during the normal performance of work.
• 75-Foot Livestock Hauler Exception – Exceptions are allowed for a 2-vehicle combina-tion transporting livestock, conditions apply.
• 9-Foot Timber Hauler Width Exception – This exception is applicable to vehicles hauling tie logs, tie slabs, and veneer logs off the Interstate and National Network.
• 12-Foot Hay Width Exception – Allowed as long as the width of the load does not exceed the width of the lane of traffic. The exception is only applicable off the Interstate and National Network. Wisconsin law also exempts tractors from normal width limits up to 12 feet.
• Length Limit Exemption on Designated (State) Highways – There is no overall length limit for a tractor-semitrailer combination, a double bottom, or an automobile haul-away when operated on a Designated highway.
• Auto Haul Away Length Exception – Total length exception is 66 feet plus 4-foot overhang and 5 feet to the rear of vehicle.
Roles and Responsibilities
The Wisconsin Department of Transportation administers the size and weight program in the State, including permit functions. The Wisconsin State Patrol enforces size and weight laws and operates safety and weight enforcement facilities throughout the State.
Federal Requirements and Options
There are no grandfathered configurations under Federal law in Wisconsin.
C-14

Minnesota Truck Size and Weight Project
Manitoba
Limits and Provisions
Dimensions: Same as Minnesota, except A-, B-, and C-Train Doubles Allowed
Manitoba’s basic commercial vehicle dimension limits and provisions, converted from metric scale, are nearly the same as Minnesota’s. Unlike Minnesota, Manitoba allows A-, B-, and C-Train doubles LCV configurations on its highest functional classification system, the Roads and Transport Association of Canada (RTAC) system. This system is roughly equivalent to the U.S. Interstate and other freight significant National Highway System highways.
Weight: Higher Weights Generally Allowed
Weight limits in Manitoba vary by highway system. On the RTAC system, Manitoba allows 5-axle tractor-semitrailer configurations up to 87,083 pounds GVW and 6-axle vehi-cles up to 102,515 pounds GVW without permit. On its A-1 System, which is the “provincial trunk highway” system, Manitoba allows 5-axle vehicles up to 82,673 pounds GVW and 6-axle vehicles up to 98,106 pounds GVW without permit. Finally, on the B-1 System (Provincial Roads), Manitoba allows 5-axle vehicles up to 76,059 pounds GVW and 6-axle vehicles up to 88,185 pounds GVW without permit. Other configurations may have higher maximum GVW allowances (i.e., 6-axle RTAC single truck and full trailer can weigh up to 106,482 pounds GVW). Single-axle weight limits are slightly higher than Minnesota and tandem axle weight also is slightly higher (37,478 pounds gross axle weight) and tridem axle weights are significantly higher at 52,911 pounds gross axle weight. Like Minnesota, Manitoba enforces spring load restrictions and grants a winter weight increase.
Exclusions and Exemptions
• Implements of Husbandry Width Exception – Implements of husbandry are not gen-erally subject to width exemptions when driven temporarily by a farmer or dealer during routine operation or for repair. Vehicles continue to be subject to height and length limits.
• Hay Hauler Width Exception – Vehicles transporting loose hay, straw, or fodder may exceed the width limit up to 12.12 feet.
• Road Construction and Snow Removal Exception – Size and weight laws are not applicable to vehicles solely involved in road construction or snow removal.
Cambridge Systematics, Inc. C-15
Minnesota Truck Size and Weight Project
Roles and Responsibilities
The Manitoba Transportation and Government Services’ Compliance and Regulatory Services Division administers the size and weight program in Manitoba, including per-mitting. The Division deploys Compliance Inspectors at Provincial Weigh Stations to enforce size and weight regulations. Manitoba Highway Patrol units also enforce com-mercial vehicle regulations throughout Manitoba.
Federal Requirements and Options
There are no Canadian laws governing size and weight. Since 1954, all limits have been set by the individual provinces and territories, which also are responsible for extraprovin-cial operations. There are, however, several interprovincial agreements that regulate interprovincial commercial vehicles, including minimum standards for interprovincial size and weight limitations. The principal agreement was endorsed in 1988 by the Council of Ministers Responsible for Transportation and Highway Safety. In 1997, the same group entered into an Appendix of Understanding of Vehicle Weights and Dimensions that specified minimum interprovincial standards for seven common configurations. Several other interprovincial agreements exist within regions.
Ontario
Limits and Provisions
Dimensions: Same as Minnesota except A-, B-, and C-Train Doubles Allowed
Ontario’s basic commercial vehicle dimension limits and provisions, converted from met-ric scale, are nearly the same as Minnesota. Unlike Minnesota, Ontario allows A-, B-, and C-Train doubles LCV configurations.
Weight: Innovative Technology Application Standardizes GVW Limits
Ontario currently is in the latter phases of a Vehicle Weight and Dimension Reforms ini-tiative, which is the subject of one of the case studies in this appendix. The most recent changes were enacted through the new Highway Traffic Act Regulation 413/05: “Vehicle Weights and Dimensions – for Safe, Productive and Infrastructure-Friendly Vehicles,” otherwise known as (SPIF) standards (June 2005). The new standards will be applied to commercial vehicles manufactured after 2005 and will require axles that automatically load-equalize to distribute trailer weight equally over all axles. In addition, self-steering axles are required for many configurations on trailers to increase the stability of heavy loads.
C-16
Minnesota Truck Size and Weight Project
Like Minnesota, Ontario enforces spring load restrictions. Ontario does not allow for winter weight increases.
Exclusions and Exemptions
• Implements of Husbandry Width and Height Exceptions – Implements of husbandry are allowed to exceed width and height limits without a permit.
Roles and Responsibilities
The Ontario Ministry of Transportation administers the permitting system for oversize and overweight trucks. The Ministry’s Carrier Safety and Enforcement Branch is respon-sible for size and weight enforcement.
Federal Requirements and Options
There are no Federal limits in Canada. Ontario sets its own size and weight regulations but endorses Ministers Responsible for Transportation and Highway Safety agreements on minimum interprovincial dimension and weight standards. In addition, Ontario and Quebec maintain interprovincial agreements on uniformity of traffic between the two provinces.
Case Studies of Regulatory Approaches
The following case studies summarize domestic and innovative international experiences in size and weight regulation that may have implications for Minnesota.
Domestic Approaches
Administering Permit Programs
Criteria for permitting larger or heavier trucks varies by state. The 1990 TRB Study “Truck Weight Limits: Issues and Options”1 suggested that states establish heavy vehicle permit programs, albeit with provisions to control the characteristics and operations of permitted vehicles, including designated routes, maximum weights, fee structures, and safety 1 Transportation Research Board Special Report 225, “Truck Weight Limits: Issues and Options”;
National Research Council, 1990.
Cambridge Systematics, Inc. C-17

Minnesota Truck Size and Weight Project
restrictions. Moreover, the study suggests that, with regard to safety restrictions, states use permitting processes to aggressively promote safety of heavier vehicles. The recom-mended state safety regulations for permit vehicles are as follows:
• Power requirements for acceleration and hill climbing;
• Driver qualifications;
• Accident reporting and insurance requirements;
• Braking systems;
• Connecting equipment such as fifth wheels, pick-up plates, kingpins, and hitch con-nections; and
• Axle width, tires, and rims.
Many states have grandfather exemptions above the Federal limit on gross weight, but allow operation of vehicles above the Federal limit only with a special permit. The study proposes allowing those states without grandfather exemptions the option to establish a permit programs to operate over Federal limits. Furthermore, the study advocates a per-mit fee structure commensurate with the damage caused to pavements. The permit fee structure would offset increases in pavement or bridge costs as a result of the heavier vehicles. Finally, a state issued permit process would allow a state to impose special con-ditions, such as requiring safety-related vehicle components as a condition for use, and also would strengthen the state’s enforcement capabilities.
TRB Special Report 267 (2002) supersedes the 1990 study, but maintains many of the same recommendations for permitting heavy vehicles. Similar to the 1990 study, the updated study calls for states to participate in a state-implemented, but Federally supervised, per-mit program provided that states satisfy several requirements, including size and weight provisions and implementation provisions. The 2002 study modifies some of the size and weight provisions and implementation provisions put forth in the 1990 study, specifically:
• Size and Weight Provisions:
− Trucks operating under grandfather exemptions or state-specific exemptions would be subject to the state’s permitting program.
• Implementation Provisions:
− A qualitative test would be imposed to ensure that user fees cover all costs of administering and enforcing permits and infrastructure costs;
− Enforcement under the permit program would include performance bench-marking, the application of new enforcement tools, including information technol-ogy, and adequate and stable funding; and
− Safety requirements continue to include power requirements, driver qualifications, accident reporting, brakes, couplings, and axle, tire, and rim specifications.
C-18

Minnesota Truck Size and Weight Project
Both studies envision the permit program as one that provides states more flexibility to change regulations than they currently experience. Of course, these requirements would necessitate changes in Federal law for such operations to occur on the Interstate system.
Examples of States with Divisible Load Permits
The states of New York, Pennsylvania, Washington State, North Dakota, and South Dakota were scanned for permitting programs for divisible loads. New York, North Dakota, and Washington State have implemented permitting programs for the heavy truck transport of divisible loads. Both Pennsylvania and South Dakota have permits regulating the transport of non-divisible loads, but currently do not have permitting pro-grams specifically for divisible loads. The following summarizes practice for the three states found with divisible load permits.
New York
The New York State Department of Transportation, the New York State Thruway Authority, and the New York State Bridge Authority have procedures for permitting vehi-cles that are over legal dimensions and/or weight allowed to travel across the highways they own and operate.
All divisible load overweight permit types are restricted (r), which means that vehicles cannot cross bridges posted with a sign reading “no trucks with r permits” unless the permit applicant holds a determination by the Commissioner to cross a bridge posted with this sign.
All 2006 model year or newer vehicles are eligible for any permit type, but must be equipped with:
• All axles, other than steerable or trackable axles, must have two tires on each side of the axle;
• All lift axles must be steerable or trackable (self-steering);
• Air pressure controls for lift axles must be located outside of the cab and beyond the reach of cab occupants when the vehicle is in motion; and
• The weight on any grouping of two or more axles is distributed so that no axle in the grouping carries less than 80 percent of any other axle in the grouping.2
Permits for tractor-trailer combinations are limited to one power unit married to a single trailer or semitrailer. Two options are provided for those seeking a permit:3
2 http://www.dot.state.ny.us/nypermits/files/div_load/perm69%20_legal(7%202005).pdf. 3 See footnote 1.
Cambridge Systematics, Inc. C-19

Minnesota Truck Size and Weight Project
1. One power unit can be married to an unlimited number of trailers or semitrailers, with each combination of a Power unit and trailer or semitrailer shown on a separate per-mit document. Trailers or semitrailers may have Different axle spacings, axle weights, gross axle weight ratings, tire size, and different number of axles. Certain divisible load permit applications apply.
2. One power unit can be married to an unlimited number of trailers or semitrailers (up to 20 combinations of a power unit and trailers or semitrailers is be shown on a sepa-rate permit document). The axle spacing, number of axles, recommended axle weight, number of tires and tire size of each trailer must all be the same. Certain divisible load permit applications apply.
North Dakota
For carriers transporting divisible loads, North Dakota provides a 10 percent wintertime weight exemption permit. These loads cannot exceed 105,500 gross vehicle weight during a specified period of time. The permit covers 10 percent over legal axle weights and/or 10 percent over legal exterior bridge distance – whichever is more restrictive. Travel is restricted on the Interstate system, county, township, and city streets. Following are the axle/gross weight limitations imposed on the permit:
• Tire weight may not exceed 605 pounds per inch width of tire (550 pounds plus 10 percent);
• Single-axle weight (4 tires) may not exceed 22,000 pounds (20,000 pounds plus 10 percent);
• Tandem axle weight (8 tires) may not exceed 37,400 pounds (34,000 pounds plus 10 percent);
• Triple axle weight (12 tires) may not exceed 52,800 pounds (48,000 pounds plus 10 per-cent, not to exceed 18,700 pounds per axle);
• Gross vehicle weights are determined by number of axles and the measurement between extreme axle centers’ and
• Vehicle combinations of 6 or more axles also qualify for the 10 percent additional weight as determined by the Weight Limitations Chart.4
Washington State
Washington State permits divisible loads for the several truck configurations. The single trailer is permitted a monthly and annual permit to load up to 56 feet from the front of the trailer/load to the rear of the trailer/load – whichever is longer. Permits for this type of
4 http://www.state.nd.us/ndhp/permits/wintertime.html.
C-20

Minnesota Truck Size and Weight Project
configuration is exempt from commuter hour and holiday restrictions, oversize sign requirements, nighttime travel restrictions, and winter restrictions prohibiting permitted movement when traction tires/devices/ chains are advised, recommended or required but must obey chain requirements. Monthly and annual permits for double trailers car-rying divisible loads up to 68 feet from the front of the first trailer/load to the end of the last trailer/load – whichever is longer. This permit is exempt from the same restrictions as the single trailer configuration.5
Safety and Driver Requirements
Most states generally refer to the requirements set forth by the Federal Motor Carrier Safety Administration (FMCSA). For heavy vehicle configurations, the safety features required meet safety threshold requirements that have been codified into Federal regula-tions (FMCSA) and state regulations, which usually refer back to FMCSA requirements. For Michigan, South Dakota, North Dakota, and Wisconsin, there are no additional safety equipment requirements beyond Federal (mostly FMCSA) mandated for semitrailers. There are some additional equipment requirements in other states (mostly LCV states) like Colorado and Utah. For example, Ontario requires a split break system on a 5-axle trailer (not including the tractor) of a 135,000-pound configuration. The split break system requires two separate breaking systems – one that feeds three axles and one that feeds two axles – to provide redundancy in case of a system leak or failure in one of the systems. This requirement only applies to new vehicles.
In the United States, there are no special driver requirements beyond the Code of Federal Regulations 49 Parts 387-399 and there is no delineation for drivers of standard versus permitted trucks except as required by FMCSA. FMCSA requires Commercial Driver’s License (CDL) endorsements for double and triple trailers as well as hazmats. Minnesota requires CDL endorsement for twin trailer operation.
Other notable examples of driver requirements for heavy truck configurations are found in the practices of Colorado, Washington State, and some Canadian provinces. Colorado requires written and road tests for LCV configurations for each driver certified by the safety office of the permit holder (the trucking company). Washington State requires endorsements (tests) for LCVs, hazmats, and the operation of air brakes.
Canadian provinces tend to have more specific regulations than its American counterpart. In Alberta, for example, any company operating an LCV must show proof that their driv-ers and driver trainers meet and maintain the requirements outlined in the Longer Combination Vehicle Driver’s and/or Instructor’s Manual.6 In addition, the driver must carry a Driver’s Certificate. This document certifies that the driver has the appropriate course-work, medical/physical requirements, and 24 months (150,000 km) of experience with articulated vehicles.
5 http://www.wsdot.wa.gov/commercialvehicle/permits/. 6 Canadian Trucking Alliance, Longer Combination Vehicle Driver’s and/or Instructor’s Manual.
Cambridge Systematics, Inc. C-21

Minnesota Truck Size and Weight Project
International Approaches
Seasonal Load Restrictions
Countries and States with severe seasonal changes, particularly the freezing and thawing cycles of pavement in the winter, often implement seasonal load restrictions on motor car-riers. Studies show that seasonal load restrictions are a cost-effective method of protecting pavement life.7 The following examples highlight seasonal load restriction strategies and challenges in Canada and Scandinavia.
Canada
Seasonal load restrictions vary considerably in the 10 Canadian provinces. A survey of seasonal Canadian practices reveals considerable variation between provinces with regard to load restrictions, testing, and enforcement.8 Each provincial transportation agency can impose its own set of load restrictions. One common practice is a reduction in the basic allowable weight between 90 and 50 percent during thawing. Another is that provincial agencies who allow tolerances above the basic allowable weight remove the privilege during the restriction period. In addition, primary highways are usually unrestricted; however, some primary highways are reclassified during the thaw, making the highway subject to seasonal load restrictions. Even though many provincial agencies employ these methods in order to restrict loads, there is no consistency between provincial agencies as to when and what restrictions are applied.9
In response to the disparate load reduction policies throughout Canada, the three prairie provinces of Manitoba, Saskatchewan, and Alberta initiated a study of standardizing spring weight restrictions. The study suggests that harmonizing spring weight restric-tions can be initiated by: a) developing a technology that would transfer information about technical activities between provinces; b) simplifying basic weight restrictions; c) improving communication tools between provinces and the trucking industry; d) implementing a condition-based program that measures physical criteria to set, amend, or terminate restrictions; and e) exploring alternative truck routes with higher weight allowances. (Note: Actions taken since the study are unknown.)10
7 Isotalo, Jukka. “Seasonal Truck-Load Restrictions and Road Maintenance in Countries With Cold
Climate.” Transport No. RD-14. Transportation, Water, and Urban Development Department, World Bank. March 1993. http://www.worldbank.org/transport/publicat/td-rd14.htm.; Canadian Strategic Highway Research Program Technical Brief #21 “Seasonal Load Restrictions in Canada and Around the World.” http://www.cshrp.org/products/brief-21.pdf.
8 Canadian Strategic Highway Research Program Technical Brief #21 “Seasonal Load Restrictions in Canada and Around the World.” http://www.cshrp.org/products/brief-21.pdf.
9 See Footnote 5. 10 Clayton, Alan & McGregor, Robyn. “Harmonization of Spring Weight Restrictions and Winter
Weight Premiums for Roads in the Prairie Region.” February 2001.
C-22

Minnesota Truck Size and Weight Project
Scandinavia
Norway, Sweden, and Finland implement spring load restrictions on their highway net-works. Studies have shown that without thaw restrictions, frost-related repair expendi-tures in these countries would increase by more than 250 percent.11 The World Bank, in 1993, said the principal challenge in implementing thaw restrictions in cold countries is the limited ability to measure road bearing capacity quickly and cheaply. To overcome this and other challenges associated with seasonal temperature variations, the World Bank recommended the following actions in its 1993 report:12
• Frost and spring thaw defects should be included in the road database and mainte-nance management system, as already is the case in Finland.
• Regular measurement of frost depth and falling weight deflectometer measurements along the road network, in conditions similar to the actual roads, and comprising suf-ficient variety of soil and moisture conditions are of importance.
• Portable weigh bridges should be available to assist police and maintenance staff to enforce weight limit restrictions. The overweight penalties should be in right propor-tion to damage caused by overweight.
• Meteorological institutes should provide sufficient regional statistics on temperatures below zero. The Road Administration in Finland receives its frost information as a sum of hours below zero multiplied by the actual temperature during each hour (h°C).
• The weight restriction system applied in a country should be uniform, understandable for the road user, enforceable and easy to measure on the spot.
• The economic consequences of weight restrictions can be partly mitigated by allowing additional loading of vehicles during the peak winter period, as is done presently in Finland and Sweden.
Ontario Weight and Dimension Reforms
Ontario has undertaken a new weight and dimension reform policy under the Highway Traffic Act known as Safe, Productive, and Infrastructure-Friendly Vehicles or SPIF. The new series of regulations, initiated in 2001, are intended to address infrastructure damage caused by heavy vehicles while also increasing productivity of motor transport. More specifically, SPIF is slowly implementing changes to Ontario’s highway laws to introduce technologies like self-steering and variable load axles to simultaneously increase produc-tivity while enhancing safety. Thirteen SPIF tractor-trailer vehicle combinations are included in the regulations. SPIF vehicles possess certain physical improvements and are meant to be an alternative to vehicles that cause roadway damage. For example, SPIF 11 See Footnote 4. 12 See Footnote 4.
Cambridge Systematics, Inc. C-23

Minnesota Truck Size and Weight Project
vehicles have a standardized maximum length as well as a tandem and tridem axle weight increase for double trailers so that they harmonize with regulations in a number of other provinces.13 When vehicles qualify as SPIF, their allowable weight increases. A result of Ontario’s vehicle weight and dimension reforms is that non-SPIF qualifying tractor-trailers will face additional reductions from allowable gross weights.
SPIF vehicles are being introduced as a series of four phases. Phase 1 addresses all non-dump semitrailers with three or less axles; Phase 2 addresses dump semitrailers (including end dumps and open hopper dumps); Phase 3 addresses all non-dump semi-trailers with four or more axles and all double trailers; and Phase 4 addresses straight trucks and their trailers.14
Australia Federal Weight Increase
In the mid-1980s, the Australian Commonwealth sought to implement higher mass limits in order to attain greater efficiency in the transport of heavy vehicles. A proposal was presented to increase the gross vehicle mass (GVM) limit to 42.5 metric tons (93,700 pounds) before requiring a permit, but met resistance from several states.15 Instead, an alternative to the proposal was instituted known as the Federal Interstate Registration Scheme (FIRS).
Established in 1985 through the Interstate Road Transport Act, FIRS is a vehicle registra-tion scheme that allows registered FIRS vehicles to operate higher GVM on particular routes. Vehicles weighing 4.5 tons or greater and that only engage in Interstate activity may apply to register with FIRS. FIRS provides nationally uniform charges and operating conditions for all FIRS registered vehicles.16 Registration charges are refunded back to the states and are used as a means of road cost recovery.
In 1999, FIRS tandem and triaxle vehicles (not road trains) were afforded higher mass limits on updated (2002) Designated routes.17 However, the vehicles must be fitted with a “road-friendly” suspension system and triaxle operators must possess an accredited mass management scheme approved by the Australian Government. Federal B-doubles can only operate on Designated routes; however, FIRS registered B-doubles operating with higher mass limits can use a different route network, which also was updated in 2002.18
13 http://www.mto.gov.on.ca/english/trucks/vwd/index.html. 14 http://www.mto.gov.on.ca/english/trucks/vwd/index.html. 15 http://www.aph.gov.au/library/pubs/bd/1997-98/98bd191.htm. 16 http://www.dotars.gov.au/transreg/str_firs.aspx. 17 See Footnote 9. 18 See Footnote 8.
C-24

Minnesota Truck Size and Weight Project
Intelligent Access Program
Heavy goods vehicles (HGV) in Australia currently are permitted the following levels of access to the roadway network: general and restricted (notice, permit, or escort). A third generation of access has been introduced known as Intelligent Access Program (IAP). IAP is a smart compliance mechanism designed to help Australia manage and meet the growth of goods movement throughout the country and across jurisdictional boundaries. Using telematics technology,19 IAP employs a host of advanced technologies to improve roadway access in Australia.
IAP is a voluntary program meant to assist in the management of heavy vehicles moving across Australia’s roadway network. Each jurisdiction has its own set of conditions of access and the IAP is meant to ensure that freight vehicles comply with these conditions. IAP monitors heavy vehicles via a remote destination (satellite) to track vehicles and ensure that they are complying with the permitted conditions of a particular locality. In the first stage of implementation, IAP parameters will be set for monitoring spatial, tem-poral, and speed compliance in order to ensure that heavy vehicles follow jurisdictional conditions of access.20 With regard to truck size and weight, great opportunity exists to set parameters according to truck size and weight and employ IAP technology to track compliance by jurisdiction or roadway classification. IAP has the potential to improve road safety, reduce infrastructure wear as well as harm-ful environmental effects, manage public perception of heavy vehicle movement, optimize policy and operations tasks through road enforcement activities, and improve overall productivity.21 IAP vehicles will be fitted with an in-vehicle technology that transmits vehicle performance data to remote service providers. Private sector service providers22 will supply monitoring services and also will notify transport authorities of non-compliance. Figure C.2 illustrates the various players involved in the IAP operating model.
19 Telematics is the integration of wireless communications, and global positioning systems. For
more information, visit http://www.webopedia.com/TERM/T/telematics.html. 20 http://www.rapp.ch/documents/papers/ITS_IAP_26676_%20ChE_Paper.pdf. 21 http://www.ite.org/meetcon/2005AM/Koniditsiotis_Wed.pdf. 22 Service providers must be certified by a Certification and Auditing Group.
Cambridge Systematics, Inc. C-25

Minnesota Truck Size and Weight Project
Figure C.2 IAP Operating Model
IAP ServiceProviders
Jurisdictions TransportOperators
Certificationand Auditing
Group
IAPAuditor
Certif
icatio
n an
d Aud
iting
Fee f
or Se
rvice
IAC C
onfir
mat
ion
Non
-Com
plian
ce R
epor
ts (N
CRs)
Scheme with Intelligent Access Conditions (IACs)
Compliant Behavior
Fee for Service
IAC and Possible Fleet Managem
ent ServicesM
embe
r Lev
el
Repo
rting
Source: National Transport Commission Information Bulletin (February 2005) http://www.ntc.gov.au/filemedia/bulletins/IAPInfoBullFeb2005.pdf.
In May 2003, the Australian Transport Council endorsed the feasibility of IAP and a sub-sequent endorsement of the program by Austroads Council23 occurred in October 2004. IAP is a national initiative with legislation by the National Transport Commission (Model Legislation – Intelligent Access Program) currently under review.24 The bill includes: powers for road transport authorities to issue IAP conditions; duties of transport opera-tors, drivers and IAP services providers; privacy safeguards; auditing requirements; reporting and tampering obligations; provisions relating to non-compliance with IAP con-ditions; and provisions for ensuring data is of evidentiary standard.25 The Model Bill will be adapted by each jurisdiction according to local law and will commence in each juris-diction once it is passed by its respective Parliament.
23 Austroads is an association of Australian and New Zealand transport and traffic authorities. 24 http://www.ntc.gov.au/filemedia/Reforms/DraftIAPRegsFeb2005.pdf. 25 http://www.ntc.gov.au/DocView.aspx?page=A022105073009800200.
C-26

Minnesota Truck Size and Weight Project
Canadian Interprovincial Memorandum of Understanding
National standards of interprovincial vehicle weights and dimensions are identified in a 1988 Appendix of Understanding (MOU) and its subsequent amendments.26 The MOU provides a higher level of weight and dimension regulation uniformity than previously experienced across the Canadian provinces. Each jurisdiction agreed on minimum and maximum thresholds for weight and dimension limits as well as a number of vehicle con-figurations. Vehicles that comply with the MOU weight and dimension standards are permitted to travel on Designated roadways. One important qualification to the MOU is that each jurisdiction maintains authority to apply different vehicle configurations as well as more liberal weights and dimensions than those specified in the MOU.
Attempts to harmonize weight and dimension standards vis-à-vis the MOU are weakened by the fact that provinces and territories retain regulatory authority for the trucking activ-ity in their jurisdiction. Therefore, even with an MOU in place, provincial weight and dimension standards remain fragmented. Such fragmentation is evident, for example, by a separate MOU signed by the four Atlantic provinces of New Brunswick, Nova Scotia, Prince Edward Island, and Newfoundland establishing uniform weight and dimension standards in their jurisdictions.27
European Union Standardization
The Treaty of Rome established the European Community in 1957, but it was not until the mid-1980s that the European Union (EU) became more involved in crafting a common transport policy.28 In 1996, the EU seriously addressed interoperability by harmonizing and legally adopting common weight and dimension standards.
EU policy provides maximum dimension standards for international truck traffic as well as traffic throughout the EU community. Maximum weight standards for axles and com-bined vehicles engaged in international activity also are set forth. For international trans-port, weight limits range from 18 to 44 metric tons (approximately 40,000 to 97,000
26 “Heavy Truck Weight and Dimension Limits for Interprovincial Operations in Canada Resulting
From The Federal-Provincial-Territorial Appendix of Understanding on Interprovincial Weights and Dimensions.” Task Force on Vehicle Weights and Dimensions Policy. May 1999. http://www.comt.ca/english/programs/trucking/MOU99.PDF.
27 “Guide to The Agreement on Uniform Vehicle Weights and Dimensions Limits in Atlantic Canada.” October 2001. http://www.comt.ca/english/programs/trucking/Guide.PDF.
28 Lakshmanan, T.R. & Anderson, William. “Transport Governance Systems and Trade Expansion.” Working Paper Series # CTS2001B. Boston University Center for Transportation Studies. 2001. http://www.bu.edu/transportation/CTS2001B.pdf.
Cambridge Systematics, Inc. C-27

Minnesota Truck Size and Weight Project
pounds) depending on the type of vehicle. Axle weight varies from 10 to 24 tons (approximately 22,000 to 53,000 pounds).29
A striking feature of EU weight limit policy is that Member States have the authority to set different maximum weight limits for national transport. A carrier circulating goods throughout the EU is able to move freely due to harmonized dimensions and weights. However, a carrier transporting goods within a Member State may be subject to the Member States’ maximum weight limit. Non-resident carriers can transport goods within a Member State as long as the carrier possesses a Community license and abides by the Member States’ rules for: 1) rates and condition; 2) weights and dimension; 3) special goods requirements; 4) driving and rest time; and 5)value added taxes.30
The EU has achieved a harmony of international dimension and weight standards that unifies the goods movement process throughout the European Community. However, the absence of uniform maximum weight limits for national transport remains problematic for national goods movement and also suggests a resistance by Member States to relinquish autonomy with regard to the transport of goods nationally.
Mercosur Harmonization
The Mercado Commún del Sur (Mercosur) is a South American trading bloc comprised of Argentina, Brazil, Paraguay, and Uruguay. Bolivia and Chile are associate members and recent efforts have been made to include several Andean countries. Mercosur officially formed in 1991 to foster bilateral trade, but it was the Latin American Free Trade Association of 1960 that prompted efforts to harmonize surface transportation rules and regulations.
Mercosur has established uniform truck size and weight standards for transport between its member countries. These standards require that trucking companies be prequalified to operate in Mercosur countries. Within Brazil, for example, approximately 47,000 trucks and 1,000 companies are qualified to operate within the Mercosur market.31 In addition, roughly 26,000 trucks and 1,400 companies from Mercosur countries are qualified to oper-ate in Brazil.32
Mercosur’s standardization efforts demonstrate an understanding of the importance of interoperability across borders. Harmonizing vehicle standards should help to facilitate
29 European Union Director General Transport. “DG Guide To The Transport Acquis.”
http://europa.eu.int/comm/transport/themes/enlargement_policies/english/en.pdf. 30 http://europa.eu.int/comm/transport/road/legislation/abc/index_en.htm#2.5.1. 31 http://international.fhwa.dot.gov/latinamer/index.htm. 32 See Footnote 1.
C-28

Minnesota Truck Size and Weight Project
trade and provide a seamless flow of goods across borders.33 Even though Mercosur has begun to address inconsistencies in transport regulation between Mercosur countries, cross border flow remains problematic. For example, processing delays of prequalified trucks at border crossings and a lack of coordination between Mercosur countries persist. These obstacles weaken Mercosur’s harmonizing efforts, which may potentially inhibit Mercosur’s ability to establish relationships with other trading partners.
Conclusions
In general, truck width is common throughout the jurisdictions at the Federal minimum of 102 inches. Single-unit truck lengths are fairly standard among the states and provinces, averaging about 40 feet maximum length. North Dakota and South Dakota are the excep-tions, with longer lengths of 50 feet and 45 feet respectively for single unit trucks. LCV lengths vary among the jurisdictions that allow them; however, Minnesota does not per-mit them. Gross weight is where the greatest variance occurs among jurisdictions. Minnesota’s truck weight regulations are generally more restrictive than those of surrounding states and provinces. Iowa and Wisconsin’s truck weight provisions are more similar to Minnesota than those of Michigan, North Dakota, and South Dakota, especially regarding maximum allowable weights for common five- and six-axle configu-rations where permits are not required. The Canadian provinces of Manitoba and Ontario generally maintain higher weight allowances for like configurations. It should be recog-nized, however, that Canada’s design standards in many cases accommodate greater weights than similar highways in the United States. Ontario has recently undertaken a new weight and dimension reform policy under the Highway Traffic Act known as Safe, Productive, and Infrastructure-Friendly Vehicles (SPIF). The new series of regulations, initiated in 2001, are intended to address infrastructure damage caused by heavy vehicles while also increasing productivity of motor transport. More specifically, SPIF is slowly implementing changes to Ontario’s highway laws to introduce technologies like self-steering and variable load axles to simultaneously increase productivity while enhancing safety.
Minnesota, like its neighboring states and provinces, grants exceptions to size and weight allowances for specific industries, including agriculture and timber hauling. Most of the surrounding states and provinces, like Minnesota, grant seasonal weight increases for agriculture (during harvest) and some provide winter weight increases for all industries. Similarly, spring load restrictions are common in a number of the surrounding states to protect highway infrastructure during thawing periods.
33 Button, Kenneth. “Effective Infrastructure Policies To Foster Integrated Economic Development.”
Third African Development Forum. March 2002.
Cambridge Systematics, Inc. C-29

Appendix D Heavy Truck Equipment, Configurations, and Technology Trends

Minnesota Truck Size and Weight Project
Heavy Truck Equipment, Configuration, and Technology Trends
Summary
This appendix introduces several emerging and existing technologies related to in-vehicle heavy truck equipment and examines how these innovations could address infrastructure, safety, and compliance issues related to increases in truck size and weight (TS&W). The equipment, configuration, and technology innovations discussed in this appendix include new technologies as well as applications of existing technologies to heavy trucks.
The methodology used to develop the findings presented in this appendix consists of a lit-erature review of available information and studies, including international experience, and an interview with personnel at the Truck Manufacturers Association.
The technologies outlined in this appendix are grouped into three categories:
• Pavement protection devices – including variable load axles and self-steering axles used to redistribute additional weight, automated tire pressure adjustment, and smart sus-pension systems;
• Safety enhancing technologies – preventive systems that that enhance safety on road-ways, including automatic slack adjusters, collision avoidance systems, rollover warning and control systems, and electronically controlled braking systems (ECBS); and
• Enforcement/Compliance systems – applications that enhance compliance with TS&W laws, include highly advanced technologies, such as, Global Positioning Systems (GPS), on-board scales, virtual weight stations, and wireless inspection systems.
Pavement protection is most commonly achieved by adding axles to a heavy vehicle in order to compensate for its higher weight. Even though fewer trips would be required to carry the same amount of goods under higher allowable weight limits, raising truck weight limits means that pavements must be able to withstand the negative effects of more weight. An alternative to counter theses adverse effects on pavement conditions are technologies meant to distribute weight evenly across a heavy vehicle. Tire width and tire pressure also are important factors of preserving pavement. Wider tires and lower
Cambridge Systematics, Inc. D-1

Minnesota Truck Size and Weight Project
pressure contribute to reducing the damage caused by higher weights. For example, self-steering axles currently are being used in place of lift axles in Ontario to increase compli-ance and mitigate pavement damage. Automated tire monitoring and pressure systems protect against improperly inflated tires, which can compromise both pavements and roadway safety.
Safety enhancements can be realized through the deployment of several innovative sys-tems, including automated tire pressure systems, automatic slack adjusters, collision avoidance systems, rollover warning and control systems, and ECBS. Automated tire monitoring and pressure systems protect against improperly inflated tires, which can compromise roadway safety. Automatic slack adjusters protect against poor braking capacity and stopping distance. Collision avoidance systems use radar-based sensors to alert a driver of potential hazards ahead, such as a slow moving vehicle. Rollover warning systems sense when the truck is in imminent danger of a rollover and either notify the operator (warning) or automatically reduce engine power and apply the engine brake (control). ECBS systems replace standard pneumatic brakes with electronically controlled brakes and have two major benefits. First, when combined with a rollover control system, ECBS can apply individual wheel brakes to bring a load down if an unsta-ble situation is detected and second, ECBS also reduces stopping distance. Trucks with heavier loads are inherently less stable and require longer stopping distances than those with lighter loads. These technologies directly mitigate these two conditions these sys-tems help to counter the effects of increased weight without adversely affecting safety.
Enforcement and compliance activities have the potential to benefit from several emerging technologies, including on-board scales with wireless inspections. These sys-tems are designed to provide real-time information regarding load weight and truck systems faults to both the vehicle operator and to law enforcement personnel, thus decreasing the number of overloaded and unsafe trucks on the road. Other promising technologies are the use of GPS and E-Seal systems to protect against security vulnerabili-ties and virtual weigh stations for monitoring overweight vehicles, which will protect pavements and bridges from stress.
Overall, the trucking industry has been slow to adopt these innovations. Resistance in adopting these innovations is primarily due to the relatively low volume of new trucks produced and purchased each year. There are several factors influencing this low equip-ment turnover rate, including:
• Motor carriers are purchasing fewer new trucks each year due to the high unit cost involved in Class A truck manufacturing;
• National long-haul carriers, because of their large fleets and higher equipment turn-over, have been more proactive in implementing new technologies; and
• Heavy haulers, which often have small fleets and specialize in regional and local mar-kets, tend to use older equipment.
These innovations may have the potential to mitigate the negative safety and infrastruc-ture effects of increasing TS&W limits. For Minnesota, the results of exploring these
D-2 Cambridge Systematics, Inc.
Minnesota Truck Size and Weight Project
innovations may mean considering linking the awarding of special heavy-haul permits to firms that provide evidence of properly outfitted trucks.
Objective
The objective of this appendix is to identify current and emerging innovations in advanced on-board vehicle technologies and roadside enforcement technologies that could address infrastructure needs, safety, and enforcement issues associated with increasing TS&W.
Methodology
The methodology includes a review of available international, national, and state infor-mation and studies to discover innovative new technologies that currently are either on the market or in research and development (R&D) related to heavy truck equipment.
Personnel at the Truck Manufacturers Association were interviewed in order to identify trends in technology and to provide context and insight into the experience manufacturers have had in marketing new technology to the trucking industry.
Findings
The most significant finding resulting from this study is that while several innovative truck technologies are in varying stages of development, incorporating these technologies into the general truck fleet is a slow process. Following are two considerable obstacles that prevent new technologies from widely permeating the trucking industry.
Unit Costs – Class A trucks have very high unit costs. These types of trucks are expensive to manufacture, with much of the truck configuration and technologies customized to the buyer’s specifications. The production volume of Class A trucks in the United States var-ies between 150,000 and 250,000 units annually. By comparison, there are approximately 17 million cars and light trucks produced each year. Lower volumes of production means that heavy truck manufacturers’ research and development costs for new technologies must be spread over fewer units than their car and light truck manufacturing counter-parts, which results in higher unit costs. In addition to slowing the pace of innovation, this high-cost and low-volume paradigm impacts which type of firm is most likely to pur-chase trucks with advanced technologies and capabilities. For example, large national trucking firms update their fleets more frequently, and the newer trucks are deployed with the latest technology. By contrast, smaller firms do not have the capital necessary to
Cambridge Systematics, Inc. D-3

Minnesota Truck Size and Weight Project
purchase new trucks frequently and their fleets tend to be comprised of ageing trucks without the latest in technologies.
Market Penetration – The slow process of market penetration tends to start with the large national truckload and less-than-truckload carriers. These companies rely on operational efficiency gains, among other factors, to grow corporate profits. Large national carriers also have fleets of up to thousands of trucks and continually order replacement vehicles with the latest technology. Carriers specializing in heavy hauling and regional/local hauling tend to maintain small fleets and replace equipment infrequently. Consequently, the demand for new vehicles and new technologies by smaller carriers is lower than for national carriers. Because small regional/local carriers are more likely to haul heavy commodities, such as raw agricultural or forest products, within Minnesota and on its state trunk network, rapid deployment of innovations is unlikely.
Implications for Minnesota
All told, benefits to pavement and bridge condition, safety, and compliance will not occur quickly for most technologies unless improvements to vehicles are mandated. Absent a regulation requiring adoption of these technologies, the applications that hold greatest promise for rapid deployment are those relatively inexpensive technologies, such as self-steering axles, that immediately begin to show a return on investment in the form of higher allowable weights.
One way to ensure that appropriate new technology is used for the heaviest trucks is to require it as a condition to obtaining special permits in Minnesota allowing increases in size and weight. Requiring advanced technologies as a prerequisite for higher weight allowances would create an economic incentive for heavy haulers to procure innovative technology for their trucks.
Technologies for Heavy Trucks
The following sections summarize the emerging and existing technologies that are poten-tially applicable to heavy trucks in Minnesota. These technologies are presented under three categories: 1) applications that protect pavements and bridges; 2) safety innova-tions; and 3) enforcement and compliance systems.
Pavement and Bridge Protection
Variable Load (Lift) Axles and Tires
Additional axles increase the contact area of the vehicle with the pavement and reduce the pressure of the load on the highway surface. For example, variable load or “lift” axles are
D-4 Cambridge Systematics, Inc.

Minnesota Truck Size and Weight Project
widely used on waste trucks and dump trucks to decrease axle weights on fixed axles when the vehicle is fully loaded. When the vehicle is empty, the driver uses an actuating control to lift the wheels off the highway surface. Similarly, tires can be made wider and tire pressures can be lowered to increase contact area with the road. Of these existing tire options, the use of wider tires is generally preferred by motor carriers as lower tire pres-sure causes premature tire wear. These two basic applications are widely codified into state laws governing truck size and weight.
Self-steering Axles and Load Equalization
A self-steering axle consists of two or more wheels fitted at each end with a device that can pivot around a vertical axis, allowing the wheels to automatically steer along the vehi-cle path. The wheels can articulate in response to forces generated between the tires and the road and operate independently from the driver. Self-steering axles can generally accommodate between 8,000 and 13,500 gross pounds. There are two main benefits derived from self-steering axles: 1) they accommodate additional weight, which mitigates pavement damage; and 2) self-steering axles provide greater stability, especially on nar-row or winding roads, to avoid rollovers.
Self-steering axles have been widely used on longer combination vehicle trailing units and are now being examined for use in other configurations, including semi trailer combina-tions. Through Ontario’s ongoing Safe, Productive, and Infrastructure-Friendly Vehicles (SPIF) initiative, a number of approved semi trailer configurations are required to use self-steering axles in lieu of variable load (lift axles). Because self-steering axles remain on the road surface at all times, they ensure that all axles carry their proper share of weight. Furthermore, the SPIF regulations require that all semi trailer axles “load equalize” to evenly distribute weight over all axles.
Smart Suspension Systems
Most vehicles are equipped with conventional suspension systems, whose system charac-teristics do not change once installed and are considered to be passive. Increasingly, how-ever, air suspension systems, usually either Hendrickson or an air ride suspension system, are being deployed on newer vehicles. These “smart” systems automatically adjust sus-pension based on measured responses of vehicle sensors of the road surface. Dynamic adjustments take place according to changing road conditions in real time and, by doing so, extend the design parameters of the suspension system.
The basic components of active suspension systems, known as Computerized Ride Control, are:
• An electronic control unit (ECU);
• Adjustable shocks and springs;
• A series of sensors at each wheel and throughout the car; and
• An actuator or servo atop each shock and spring.
Cambridge Systematics, Inc. D-5

Minnesota Truck Size and Weight Project
Sensors feed road surface changes to the ECU, which in turn processes the information and sends instructions to the outlying components. These components then make adjustments to the suspension system in order to improve ride performance, responsive-ness, and so forth. Essentially, these sensors detect changes in the wheel position relative to the road and vehicle, microprocessors then analyze the information and the suspension system adjusts the shock absorbers or springs accordingly, all of which is done in real time. Smart suspension systems are advantageous to both the trucking industry as well as state Departments of Transportation because the system provides improvements in load characteristics for commercial vehicles and less damage to pavement surfaces.
Automated Technology for Tire Pressure
When tires are not properly inflated, the load-carrying capability of a tire, the tire life, and safety on the roadway is compromised. Because inflation pressure can change without warning or without a perceptible change in driving conditions, many tires remain improperly inflated. Since tire pressure is often neglected in the motor carrier industry, new technologies have been developed to help improve tire maintenance practices, including tire monitoring systems and automatic tire inflation systems.
Tire pressure monitoring systems consist of sensors placed inside of tires for real-time interior air pressure monitoring. When a tire is under inflated, weight is concentrated on the tread located just under the sidewalls, rather than being spread evenly across the full width of the tire. What this means is that as the tire rolls, the sidewall is continually flexed and heats up, which can affect both performance and safety. One result of this condition is poor handling, which for a heavy truck can have severe consequences. For example, low-pressure tires are likely to blow out because they are stressed from the heat buildup and flexing of the sidewall.
Automatic tire inflation (ATI) systems monitor and repeatedly adjust air pressure in order to maintain appropriate tire pressure even when a truck is moving. There are several dif-ferent types of ATI systems and they can easily be retrofitted into existing trucks and trail-ers. Some of the benefits of proper tire inflation are: extended tire life, savings of more than $200 per year in tire replacement costs when installed on the truck drive and trailer axles, and reduced fuel consumption by more than 100 gallons annually for a typical long-haul combination truck, which also results in annual cost savings of about $170 and the elimination of more than one metric ton of greenhouse gas emissions.
Safety Enhancing Technologies
Automatic Slack Adjusters
Poorly adjusted or defective air brakes are the most likely cause for commercial vehicles to be placed out of service. These problems severely reduce the braking capacity and stop-ping distance of commercial vehicles. There are two basic types of automatic slack adjust-ers (ASA) – clearance sensing and stroke sensing. The Federal government mandated that
D-6 Cambridge Systematics, Inc.

Minnesota Truck Size and Weight Project
all air braked vehicles regulated by the Federal Motor Vehicle Safety Standard 121 and built after October 20, 1994 be fitted with automatic slack adjusters.
Automatic slack adjusters help to provide consistent braking performance and safety, though sometimes they may require manual adjustment. When ASAs are properly and regularly maintained, they work to reduce brake maintenance costs, keep a vehicle in compliance with maintenance requirements, and provide optimal brake performance. However, ASAs even though automatic, must regularly be checked and adjustments made.
Collision Avoidance Systems
Collision avoidance systems use radar-based sensors to detect potential hazards and pro-vide for automatic deceleration and limited braking. These systems also alert the driver to take evasive action when necessary. Radar penetrates rain, dirt, and fog and enables the driver to maintain safe distances under most conditions. In frontal collision avoidance systems, such as Delphi Corporation’s Headway Alert, the radar is mounted behind the truck’s front grille and automatically regulates the truck’s cruise control speed to maintain a set time-distance behind the vehicle or approaching object. Another company, Eaton, has pioneered the use of front and side collision avoidance systems. Eaton’s Vehicle On-Board Radar EVT-300 system, for example, notifies the driver of approaching objects to the front and side of the vehicle through a dash display system and audible signals. Both Eaton and Delphi’s current systems automatically adjust cruise control to maintain safe distances and to resume cruise once the lane clears.
Despite the promise of these technologies, deployment has been slow. Eaton, which has been developing its collision avoidance systems for more than a decade, is just beginning to break even on its R&D investment.
Electronically Controlled Braking Systems
Most North American heavy-duty trucks today incorporate air brake systems. Air brake systems transfer pedal input to the brakes via pneumatic control circuits (air lines) and pneumatic valves. An electronically controlled braking system, on the other hand, uses electronic circuits and electro-pneumatic valves to perform this function. With these capabilities, ECBS may be an enabling technology to mitigate the greater instability inher-ent in heavier trucks and provide shorter stopping distances, improved dynamic brake force distribution, improved combination vehicle brake balance in addition to other inte-grated features. Combined with electronic stability systems, ECBS also can offer improved vehicle control for commercial drivers, particularly when sudden evasive maneuvers are made. For example, when a tractor-trailer is going around a curve too fast and is actually in danger of tipping over, the electronics would sense that problem and actuate one side of the brakes and cause the vehicle to pull the load back down. This would significantly reduce the chances of a rollover. ECBS offers the potential for improved anti lock braking system (ABS) functionality by facilitating more precise control of wheel speed as well as providing the basis for additional advances and new features.
Cambridge Systematics, Inc. D-7

Minnesota Truck Size and Weight Project
Rollover Warning Systems
Heavier trucks have a higher center of gravity and are therefore more prone to rollovers. Rollover warning and control systems can help mitigate these safety risks in heavier trucks. As part of the U.S. DOT’s Intelligent Vehicle Initiative (IVI) program, the department has worked with Freightliner Inc. on the development of technologies to detect and minimize the risk of vehicle rollovers. The Roll Stability Advisor is an on-board unit that warns the driver when it detects a risk of rollover so that the driver can take the appropriate steps to prevent an accident. The Roll Stability Controller function takes rollover prevention to the next level by automatically slowing the vehicle. Sensor data track the truck’s lateral accel-eration and wheel speed in order to detect the potential for rollovers. When the system indicates that a rollover is imminent, a signal is sent to the engine’s electronic control unit to reduce engine power and apply the engine brake. When the vehicle becomes stable, power is restored and the engine brake is turned off. Both technologies use sensors integrated into the truck’s antilock brake system.
In 2000 and 2001, the DOT conducted a series of studies to test these technologies, using six vehicles and 23 drivers. An independent evaluator determined that the products resulted in a 26 percent reduction in “near-crash” events. Newer technologies are expected to work more efficiently, and significantly increase this already considerable percent reduction.
Sidetracker Video System (by FreightLiner)
The Sidetracker video system is designed to give truck drivers visibility to the blind spot or “No-Zone” on the right side of a tractor-trailer combination. The system utilizes a weatherproof color video camera with excellent resolution and special low distortion wide-angle lens. Mounted on the existing right front fender mirror mount, the camera sends a picture through a cable back to a color monitor located in the cab approximately 30 to 36 inches from the driver’s eyes. The monitor displays a view of the entire right side of the tractor-trailer extending beyond the back of the trailer as well as five to six lanes to the right, including entrance ramps. When driving heavy trucks, such increased visibility would provide an added benefit to driver handling and, in turn, roadway safety.
Enforcement/Compliance Systems
Electronic Seals (E-Seal)/Cargo Tracking
E-Seal technology is a wireless device used to provide cargo security. E-Seal technology can generate an alert automatically when a cargo seal is compromised or opened without proper authorization. The cargo seal is equipped with a short-range wireless communica-tion device that permits its interface with a mobile E-Seal reader, which is located in the vehicle or carried manually by an inspector. The mobile reader, if interfaced to the on-board wireless communications device, can send “alerts” automatically to the dispatcher or security official. These alerts include the date, time, and location where the seal was breached.
D-8 Cambridge Systematics, Inc.

Minnesota Truck Size and Weight Project
Global Positioning/Location Systems (GeoFencing)
GeoFencing technology was originally designed for security purposes, but has since found a potential market in transportation. GeoFencing is specialized software that allows a dis-patcher to define and monitor a risk area or a route. After an area or route is set, an “elec-tronic fence” is virtually positioned around this area or route on a displayable map. For example, the dispatcher defines a risk vicinity, such as the White House, and an alert will be sent to the carrier’s dispatch center if the vehicle enters the risk area or deviates from its route. In addition, the software also can configure a safe haven by defining a geofenced, with similar notification if a vehicle leaves the area.
For enforcement purposes, GeoFencing can be used to define a road network, such as, state trunk highways or certain designated roads, for trucks over a certain weight limit to travel. If the truck changes routes, or travels on a route carrying more weight than per-mitted, wireless communication technology can alert enforcement officials.
Wireless Inspection and On-Board Scales
Technology is available to continually evaluate the condition of a heavy vehicle and monitor its cargo and weight. These systems are designed to track:
• Brake and tire condition;
• The presence of any fault codes related to the power train, brakes, or electrical systems;
• The failure of exterior lighting mechanisms (turn signals, brakes, running, headlights, and so forth);
• Steering, suspension, and exhaust system condition;
• Horn operation; and
• Vehicle weight.
The status of the truck in terms of these conditions can be extracted by law enforcement officers either by plugging a device directly in to the truck, or by using wireless communi-cation while the vehicle is traveling at highway speeds. If properly programmed, the system also can keep track of driver and operations data for a particular truck, which also can be relayed via a wireless connection to the officer. Examples of this type of informa-tion include:
• Driver identification;
• Hours of service;
• Route information (origin, destination, route); and
• On-board cargo (an electronic freight manifest).
Figure D.1 illustrates a typical on-board scale unit used for road or wireless inspections.
Cambridge Systematics, Inc. D-9

Minnesota Truck Size and Weight Project
Figure D.1 On-Board Scale Unit
Booz Allen Hamilton Incorporated is working with the Federal Motor Carrier Safety Administration (FMCSA) and the Federal Highway Administration (FHWA) to develop a system for law enforcement agents (i.e., highway troopers) to inspect commercial vehicles wirelessly. Moreover, agents would be able to inspect these vehicles from their own vehi-cle while traveling at highway speeds. The technology provides enforcement agents the capability to obtain information from the truck’s on-board scale regarding the cargo car-ried on-board, as well as the driver and associated operations data.
Using this technology, enforcement officials would only need to pull over vehicles who are not compliant, which would provide considerable time savings for both the enforce-ment officer and for the driver and/or carrier. This technology provides a more effective means of compliance monitoring as it helps to direct enforcement activities to those instances when a law is being violated. The technology would also serve the trucking industry, as it would save a significant amount of time for legal vehicles. As a result, wireless inspections have the potential to significantly reduce the costs associated with enforcing compliance of commercial vehicles for state agencies and for the trucking industry.
Virtual Weigh Stations
Given the relatively high cost and potential avoidance of weight enforcement at fixed weigh stations, weigh-in-motion and virtual weigh station technology offer an alternative to static weigh stations. With weigh-in-motion technology, vehicles are weighed while traveling via underground loops (sensors) that measure the dynamic tire forces of a vehi-cle, calculating an estimate of the corresponding tire load. This technology essentially screens for overweight vehicles, providing information that is then used at a static weigh station to monitor the vehicle for compliance.
Virtual weigh stations build on weigh-in-motion technology. In addition to the site where weigh-in-motion technology is located, a camera or transponder is added. When a vehicle
D-10 Cambridge Systematics, Inc.

Minnesota Truck Size and Weight Project
passes over the loops, a profile of the vehicle’s characteristics and a picture or reading of the vehicle is taken. This information is then transmitted to enforcement officers who will then have a picture or reading of the vehicle so that they can safely pull it over and weigh it using a certified portable scale. The major advantage of the technology for enforcement officials is that it allows them to strategically pinpoint overweight vehicles, freeing up resources at static weigh stations for other enforcement activities. In addition, unlike static weigh stations, where operators can easily find bypass routes to avoid compliance, virtual weigh stations are built into the infrastructure and can be installed on known bypass routes in order to target enforcement and increase compliance. The virtual weigh station is a cost-effective technology for size and weight enforcement activity because it improves the efficiency of enforcement and reduces operational costs by managing resources better. Virtual weigh station technology is particularly effective in urban envi-ronments where weigh stations are few and far between.
Conclusions
Innovative in-vehicle technologies can mitigate safety and infrastructure concerns related to heavier trucks. Wider use of self-steering axles in lieu of variable load axles can ensure equal weight distribution, increase compliance, and add stability. Collision avoidance systems warn commercial vehicle drivers of upcoming hazards while rollover warning and control systems and ECBS systems have the potential to reduce the probability of roll-overs, thereby offsetting the decreased stability inherent with heavier trucks. On-board scales coupled with wireless inspections can provide real-time information about cargo weight and truck systems faults to both truck operators and law enforcement personnel, thus decreasing the number of overloaded and unsafe trucks on the road. The crossover benefits of these technologies is another avenue for exploration. For example, GPS GeoFencing and wireless communication technology presents the potential to protect pavements and bridges by monitoring truck positions and notifying both operators and law enforcement personnel about truck movement over restricted infrastructure.
The benefits of these technologies are not widely realized, mainly because there is little incentive to expand current truck fleets to incorporate these technologies and market forces are slow to penetrate the broader trucking industry. Although the benefits of these new technologies can be especially significant with heavier trucks, heavy-haul local truck-ers are least likely to install these technologies without an economic incentive or regula-tory mandate. Overall, tying these improvements such as those outlined herein to a special permitting process allowing heavier vehicles would provide an economic incentive for heavy haulers to update their fleet. This action has the potential to be a catalyst in realizing the overall benefits related to increased TS&W while mitigating the safety and infrastructure problems inherent with heavy-haul trucking. Finally, virtual weigh station technology offers state enforcement officials a potentially more cost-effective method of ensuring compliance of heavy commercial vehicles.
Cambridge Systematics, Inc. D-11

Appendix E Heavy Truck Safety Considerations
Minnesota Truck Size and Weight Project
Heavy Truck Safety Considerations
Summary
The National Academy of Sciences, Transportation Research Board (TRB) Truck Size and Weight Special Report 225 Truck Weight Limits: Issues and Options reviewed for this appen-dix reported that crash rates per vehicle-mile increase modestly with gross weight due primarily to the fact that increasing a truck’s load raises its center of gravity and thereby increases the likelihood of rollover accidents; however, the TRB studies found no conclu-sive evidence of increases in crash severity with the heavier weights.1 The TRB Report 225 also concluded that, although heavier vehicles have slightly higher crash rates, the increased payload for heavier vehicles means that fewer trips are required. For the Minnesota Department of Transportation (Mn/DOT) Truck Size and Weight (TS&W) Project, this factor more than offsets the slightly higher crash rates of heavier trucks (as shown in Appendix F), resulting in slightly fewer predicted crashes overall with the pro-posed heavy vehicle configurations. In regard to heavy vehicle crash causation, a recently published Federal study2 found that in two-vehicle crashes that occurred between truck and passenger vehicles, the passenger vehicle was responsible in a majority of the crashes.
The University of Michigan Transportation Research Institute (UMTRI) supported the Mn/DOT Truck Size and Weight Project with its study Performance-Based Evaluation of Selected Vehicles (Draft, Version 2), which used eight performance measures to evaluate sin-gle unit, tractor-semitrailer, and double-trailer configurations. The study found that the proposed vehicle configurations for operations above 80,000 pounds gross vehicle weight for the Mn/DOT TS&W Project met internationally accepted heavy vehicle safety per-formance standards. In fact the heaviest configuration proposed by Mn/DOT, the B-train double operating at 108,000 pounds, showed better safety performance in most cases than the conventional double operating at 80,000 pounds (notably in the very important per-formance measure of load transfer ratio, which combines the influence of static roller threshold and rearward amplification of the trailers).
1 Transportation Research Board, Truck Weight Limits: Issues and Options, Special Report 225,
National Research Council, 1990. 2 http://www.fmcsa.dot.gov/facts-research/research-technology/report/ltccs-2006.htm#EXECSUM.
Cambridge Systematics, Inc. E-1

Minnesota Truck Size and Weight Project
Objective
This appendix explores current research about the effect of vehicle size and weight on crash rates and evaluates Mn/DOT’s proposed heavy vehicle configurations against internationally developed safety performance factors.
Methodology
Material for this appendix was based on a review of crash statistics from nationally and internationally compiled sources, review of studies that have evaluated heavy truck crash rates and causation, and review of the University of Michigan Transportation Research Institute Performance-Based Evaluation of Selected Heavy Vehicles (Draft, Version 2), which was prepared in support of this project.
Findings
Crash Data from U.S. and Canadian Sources
This section covers crash data sources for heavy vehicles in the U.S. and Canada. The fol-lowing key studies address safety-related issues of heavy vehicles.3
A 1988 study by the University of Michigan Transportation Research Institute titled Analysis of Accident Rates of Heavy-Duty Vehicles focused on fatal crashes involving single and double-trailer combinations.4 The effect of truck configurations, road class, and oper-ating environment on crash rates were estimated using data on fatal crashes and truck travel. Data for double trailer combinations were adjusted to account for the fact that a higher percentage of their mileage occurs on access-controlled highways. Adjusted fatal accident ratios were calculated assuming the same distribution of mileage by eight travel categories.5 After adjustment, it was found that, under identical driving conditions, the accident rate of doubles was 10 percent higher than that of tractor-semitrailors and that,
3 Large trucks, as defined by the National Highway Traffic Safety Administration, are more than
10,000 pounds gross vehicle weight rating, including single unit trucks and truck tractors. 4 Campbell, K. et al., Analysis of Accident Rates of Heavy-Duty Vehicles, University of Michigan
Transportation Research Institute, 1988. 5 Travel categories were defined by the combinations of two road types (limited access versus all
other roads), urban versus rural areas, and day versus night.
E-2 Cambridge Systematics, Inc.

Minnesota Truck Size and Weight Project
proportionally, doubles were involved in more fatal rollover and jackknife crashes than tractor-semitrailers, but proportionally less fatal multiple-vehicle crashes. In addition, regardless of the number of trailers, limited access roads had the lowest involvement of fatal crashes relative to travel on that type of road than found on uncontrolled access highways. The study particularly highlights the importance of changes to a truck’s oper-ating environment on fatal crashes.
Building on the findings of fatal crash rates in the 1988 UMTRI study, Special Report 225 Truck Weight Limits: Issues and Options (1990)6 sought to isolate the effect of truck configu-ration and truck weight on fatal accident rates. Estimates of injury and property-damage-only accidents were used to expand the fatal crash rates from the 1988 study. Special Report 225 reviewed data on three common vehicle configurations as shown in Table E.1: single unit trucks, tractor-semitrailer, and doubles. The study suggests that the main determinant of the severity of truck-car crashes is the magnitude of the change of velocity of a car when impacted and that crash rates increase with gross vehicle weight to a certain point after which they generally level off. Another major finding in this report is that truck weight is not likely to affect the severity sustained by passenger car occupants involved in crashes. Furthermore, the report concluded that the “Severity of truck acci-dents is not sensitive to truck configuration, and given that a truck accident occurs, the probability of fatalities or injuries are not sensitive to changes in truck weight” (1990, 133).
Table E.1 Effect of Truck Configuration and Vehicle Miles of Travel on Fatal Involvement Rate
1985 VMT (Millions)
1980-1984 Fatal Involvements
1985 Fatal Involvement Rate (Involvement/100 Million VMT) Vehicle
Single-Unit Trucks 14,680 5,420 7.7
Tractor-Semitrailers 33,450 16,260 10.2
Doubles 2,007 829 8.6
Doubles Adjusted 11.2
Source: TRB Special Report 225.
For the accident analysis conducted in the Mn/DOT Truck Size and Weight Project, as described in Appendix F, Cambridge Systematics used crash rates by truck type and oper-ating weight found in the TRB Special Report 225 but adjusted to reflect today’s actual crash rates. (Note: Since the time of the TRB study in 1990, national heavy vehicle crash rates have continued to fall reaching an all time low heavy truck fatal crash rate of 1.96 per
6 Transportation Research Board, Truck Weight Limits: Issues and Options, Special Report 225,
National Research Council, 1990.
Cambridge Systematics, Inc. E-3

Minnesota Truck Size and Weight Project
million vehicle miles in 2004.7) The TRB rates were adjusted so that the crash rates for all heavy vehicles combined would be consistent with those found in the Minnesota Statewide Heavy Vehicle Safety Plan.8 As the previously cited UMTRI study indicated, double-trailer combinations have slightly higher crash rates than tractor-semitrailers after adjustments to raw crash rates are made to account for the fact that doubles tend to operate a higher per-centage of their miles on Interstate highways, which are safer than other roads. Figure E.1 shows fatal crash rates for single unit trucks, tractor-semitrailers, and doubles by operat-ing weight as used for the Project analysis described in Appendix F. Similar crash rate curves for severe injury crashes, moderate injury crashes, minor injury crashes, and prop-erty damage only crashes also were developed. It was found that, in the scenarios consid-ered for the Mn/DOT TS&W Project, the reduction in truck vehicle-miles of travel (less overall exposure) more than offsets the slightly higher crash rate per vehicle-mile, so that the number of truck-related crashes is reduced slightly as a result of the proposed increases in gross vehicle weight. In addition, crash rates per payload ton-mile decrease with gross weight because fewer truck trips are needed to haul a given amount of freight. Although increasing gross weight has the potential to adversely affect the stopping dis-tance capability of a heavy truck unless more axles with brakes are added to the vehicle, this is mitigated in all the scenarios studied for the Mn/DOT TS&W Project by requiring additional axles, wheels, and brakes. Table E.3 displays the additional brake capability resulting from the additional axles, wheels, and brakes required for the proposed vehicles in the TS&W Project.
7 http://ai.volpe.dot.gov. 8 http://www.dot.state.mn.us/ofrw/PDF/SHVSP.pdf.
E-4 Cambridge Systematics, Inc.
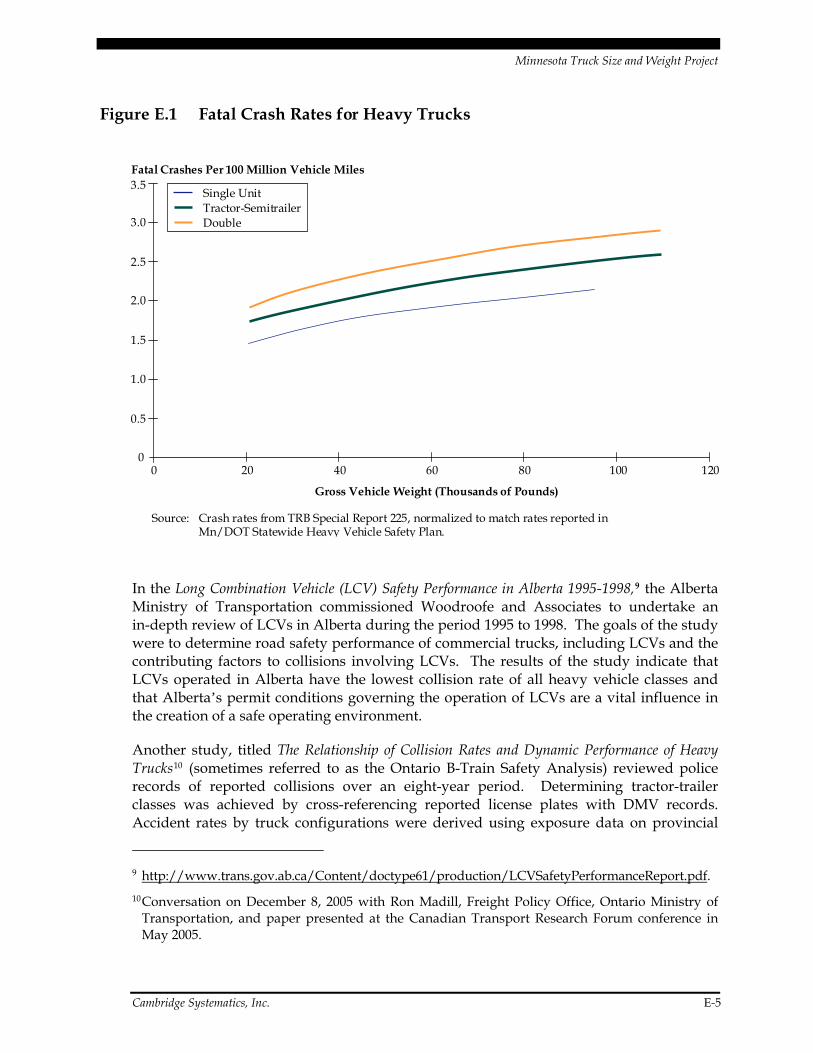
Minnesota Truck Size and Weight Project
Figure E.1 Fatal Crash Rates for Heavy Trucks
0
0.5
1.0
1.5
2.0
2.5
3.0
3.5
0 20 40 60 80 100
Gross Vehicle Weight (Thousands of Pounds)
Fatal Crashes Per 100 Million Vehicle Miles
120
Source: Crash rates from TRB Special Report 225, normalized to match rates reported in Mn/DOT Statewide Heavy Vehicle Safety Plan.
Single UnitTractor-SemitrailerDouble
In the Long Combination Vehicle (LCV) Safety Performance in Alberta 1995-1998,9 the Alberta Ministry of Transportation commissioned Woodroofe and Associates to undertake an in-depth review of LCVs in Alberta during the period 1995 to 1998. The goals of the study were to determine road safety performance of commercial trucks, including LCVs and the contributing factors to collisions involving LCVs. The results of the study indicate that LCVs operated in Alberta have the lowest collision rate of all heavy vehicle classes and that Alberta’s permit conditions governing the operation of LCVs are a vital influence in the creation of a safe operating environment.
Another study, titled The Relationship of Collision Rates and Dynamic Performance of Heavy Trucks10 (sometimes referred to as the Ontario B-Train Safety Analysis) reviewed police records of reported collisions over an eight-year period. Determining tractor-trailer classes was achieved by cross-referencing reported license plates with DMV records. Accident rates by truck configurations were derived using exposure data on provincial
9 http://www.trans.gov.ab.ca/Content/doctype61/production/LCVSafetyPerformanceReport.pdf.10 Conversation on December 8, 2005 with Ron Madill, Freight Policy Office, Ontario Ministry of
Transportation, and paper presented at the Canadian Transport Research Forum conference in May 2005.
Cambridge Systematics, Inc. E-5
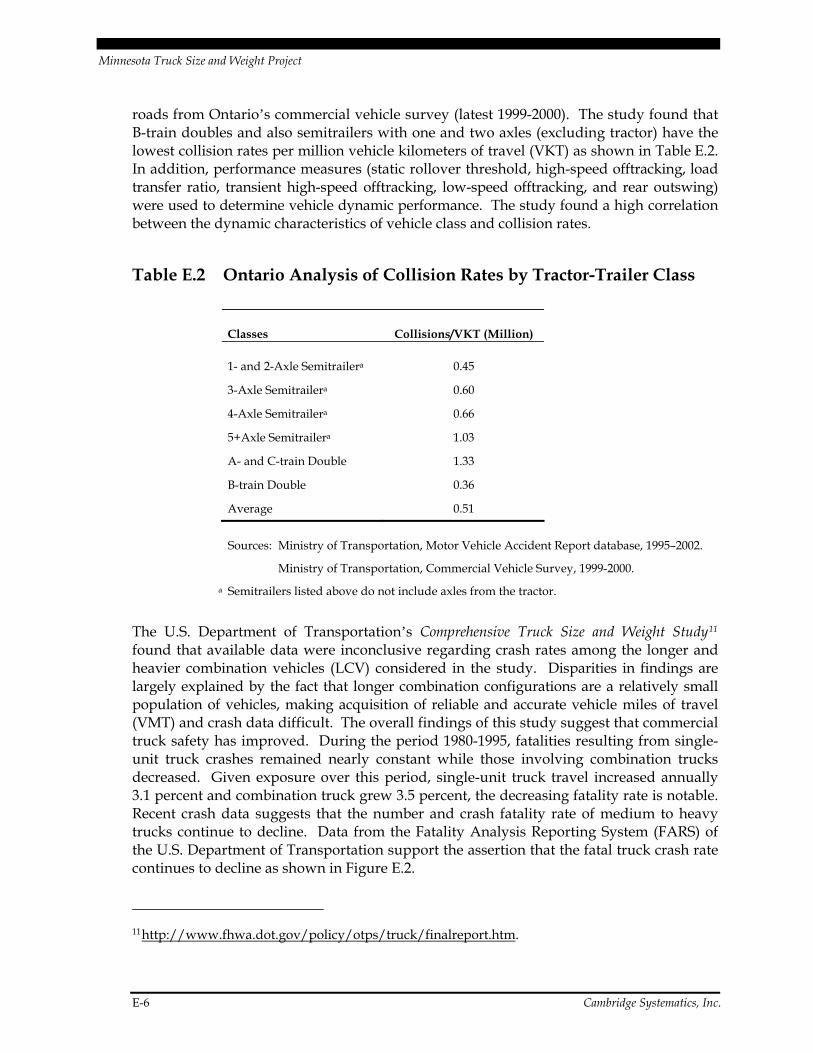
Minnesota Truck Size and Weight Project
roads from Ontario’s commercial vehicle survey (latest 1999-2000). The study found that B-train doubles and also semitrailers with one and two axles (excluding tractor) have the lowest collision rates per million vehicle kilometers of travel (VKT) as shown in Table E.2. In addition, performance measures (static rollover threshold, high-speed offtracking, load transfer ratio, transient high-speed offtracking, low-speed offtracking, and rear outswing) were used to determine vehicle dynamic performance. The study found a high correlation between the dynamic characteristics of vehicle class and collision rates.
Table E.2 Ontario Analysis of Collision Rates by Tractor-Trailer Class
Classes Collisions/VKT (Million)
1- and 2-Axle Semitrailera 0.45
3-Axle Semitrailera 0.60
4-Axle Semitrailera 0.66
5+Axle Semitrailera 1.03
A- and C-train Double 1.33
B-train Double 0.36
Average 0.51
Sources: Ministry of Transportation, Motor Vehicle Accident Report database, 1995–2002.
Ministry of Transportation, Commercial Vehicle Survey, 1999-2000.
a Semitrailers listed above do not include axles from the tractor.
The U.S. Department of Transportation’s Comprehensive Truck Size and Weight Study11 found that available data were inconclusive regarding crash rates among the longer and heavier combination vehicles (LCV) considered in the study. Disparities in findings are largely explained by the fact that longer combination configurations are a relatively small population of vehicles, making acquisition of reliable and accurate vehicle miles of travel (VMT) and crash data difficult. The overall findings of this study suggest that commercial truck safety has improved. During the period 1980-1995, fatalities resulting from single-unit truck crashes remained nearly constant while those involving combination trucks decreased. Given exposure over this period, single-unit truck travel increased annually 3.1 percent and combination truck grew 3.5 percent, the decreasing fatality rate is notable. Recent crash data suggests that the number and crash fatality rate of medium to heavy trucks continue to decline. Data from the Fatality Analysis Reporting System (FARS) of the U.S. Department of Transportation support the assertion that the fatal truck crash rate continues to decline as shown in Figure E.2.
11 http://www.fhwa.dot.gov/policy/otps/truck/finalreport.htm.
E-6 Cambridge Systematics, Inc.

Minnesota Truck Size and Weight Project
Figure E.2 Declining Fatal Truck Crash Rate Per 100 Million Vehicle Miles Traveled
0.00
1.00
2.00
3.00
4.00
5.00
6.00
1975 1980 1985 1990 1995 2000Year
Fatal Crash Rate
2004
4.584.65
3.92
3.09
2.35 2.221.96
Source: Fatality Analysis Reporting System and Federal Highway Administration; data available on-line at: http://ai.volpe.dot.gov.
Factors that predispose or influence crash risk cited by the Comprehensive Truck Size and Weight Study12 are: vehicle and equipment, driver performance, and operating environ-ment. For example, brake system performance contributes to crashes; however, braking performance is not affected by changes in TS&W when a truck has the requisite number of axles with brakes and has a regularly maintained braking system. The U.S. Department of Transportation’s Western Uniformity Scenario Analysis13 confirms findings of the Comprehensive Truck Size and Weight Study that traveling on undivided, high-speed-limit roads with at-grade intersections and entrances increases crash risk as compared to road-ways with design characteristics similar to Interstate highways; high density increases crash risk and changes to TS&W regulations, which impact vehicle design characteristics, can influence stability and control. The study notes that isolating the impact of the spe-cific factors that contribute to crash risk is difficult and that differentiating crash patterns also is difficult considering that heavy trucks are a relatively small subgroup of all trucks.
12 http://www.fhwa.dot.gov/policy/otps/truck/finalreport.htm. 13 http://www.fhwa.dot.gov/policy/otps/truck/wusr/wusr.pdf.
Cambridge Systematics, Inc. E-7

Minnesota Truck Size and Weight Project
A recently released Federal study known as the Large Truck Crash Causation Study (LTCCS)14 provides a nationally representative sample of large truck fatal and injury crashes. The LTCCS focuses on the causes of, or factors related to, large truck crashes. Most traffic safety databases contain descriptive data about crashes, which is primarily collected from police reports. The LTCCS uses the same type of descriptive data as found in these national databases, but also focuses on precrash factors (i.e., driver error, vehicle failure, environmental conditions). The LTCCS coded events surrounding a crash with a “critical event,” the event that immediately led to the crash, a “critical reason,” the imme-diate reason for the critical event that helps to describe why the critical event occurred, and “associated factors,” the conditions or circumstances present at the time of the crash. With regard to two-vehicle crashes that occurred between truck and passenger vehicles, the passenger vehicle was assigned the critical reason in 56 percent of the crashes. The critical reasons assigned for both truck and passenger vehicles were similar – driver rec-ognition and driver decisions. However, when the passenger vehicle was coded with the critical reason, the critical reason related to condition and performance in a higher percent of the cases than trucks.
Braking Requirements
Influence of Increased Mass on Brake Performance15
It is a requirement that the heavy truck manufacturing industry comply with Federal Motor Vehicle Safety Standards (FMVSS). In particular, FMVSS-121 establishes require-ments for braking systems on vehicles equipped with air brake systems to ensure safe braking performance under normal and emergency conditions. FMVSS 121 regulations specify maximum stopping distances for pneumatically braked heavy vehicles. Truck tractors equipped with a test control trailer traveling at 60 miles per-hour (mph) must stop within 355 feet while a straight truck must stop within 310 feet. The difference in the required stopping distance allows for the added mass of the unbraked control trailer used during test to load the tractor to the rated gross vehicle weight as required by the test procedure.
Axles that are added to any truck or trailer are rated for load carrying capacity, which is referred to as the Gross Axle Weight Rating (GAWR). The brakes fitted to the axle are sized to be in compliance with FMVSS-121 brake performance requirements relative to the particular GAWR of the axle. Typical weight ratings for trailers axles are 18,000 and 20,000 pounds per axle. Typical weight ratings for tractor-semitrailer axles are 12,000 pounds for the tractor steer axle, 20,000 pounds for each tractor drive axle, and 20,000 pounds for each trailer axle. Using standard pre-rated axles and brakes allow manufacturers to assemble vehicle units with sufficient brake capacity for a given vehicle design. 14 http://www.fmcsa.dot.gov/facts-research/research-technology/report/ltccs-2006.htm#EXECSUM. 15 University of Michigan Transportation Research Institute, Performance-Based Evaluation of Selected
Heavy Vehicles (Draft, Version 2), January 2006.
E-8 Cambridge Systematics, Inc.

Minnesota Truck Size and Weight Project
When considering increases in vehicle size and weight, bridge and pavement loading con-straints require that additional axles be added to the vehicle. The amount of weight that each additional axle can carry is always less than the sum of individual axles. For exam-ple, in Minnesota, the maximum weight permitted on single and multiple axle groups is as follows:
• Single axles 20,000 pounds;
• Tandem axle group (two axles) 34,000 pounds; and
• Tridem axle group (three axles) 42,000 pounds.
Since these multiple axle groups are assembled using standard axles, the brake capacity increases proportionately to the sum of GAWR (Σ GAWR) for the axle group. For example, a tandem axle group comprised of two 20,000-pound axles will have braking capacity sufficient to manage 40,000 pounds. However, size and weight regulations limit the tandem axle group to 34,000 pounds, which means the tandem axle group has more braking capacity than required. Table E.3 shows the maximum gross vehicle weight (GVW) for each configuration, the corresponding brake capacity expressed in terms of vertical axle load (GAWR) and percent brake surplus available for the vehicle configuration.
The results show that there is surplus brake capacity for all of the proposed vehicle configurations as defined by FMVSS-121. In all cases, the proposed vehicles have more brake capacity than the current five-axle tractor-semitrailer when categorized on the basis of normal and winter weights. It follows therefore, that under loaded conditions, the proposed vehicle configurations will have better stopping distance performance than the existing five-axle tractor-semitrailers.
Table E.3 Surplus Brake Capacity by Configuration
Vehicle configuration Regulated GVW Σ GAWR Brake
capacity GAW Brake requirement
Percent Surplus Brake capacity
5-axle semi 80,000 92,000 80,000 15.0
5-axle semi winter 88,000 92,000 88,000 4.5
6-axle semi 90,000 112,000 90,000 24.4
6-axle semi winter 99,000 112,000 99,000 13.1
7-axle semi 97,000 132,000 97,000 36.1
7-axle semi winter 99,000 132,000 99,000 33.3
8-axle B-train 108,000 152,000 108,000 40.7
7-axle single-unit truck 80,000 132,000 80,000 65.0
Note: Gross Axle Weight Rating assumptions: Steer axle 12,000 pound Drive axle 20,000 pound Trailer axle 20,000 pound
Cambridge Systematics, Inc. E-9

Minnesota Truck Size and Weight Project
Brake Maintenance and Crash Risk
Proper brake adjustment is an important factor when considering the stopping ability of pneumatically braked trucks. The following analysis of existing crash data has been conducted to provide insight into the importance of proper brake adjustment and maintenance.
Fatal Accident Complaint Team (FACT) is a data source of trucks involved in fatal crashes in Michigan starting in 1996. The value of the FACT data is that information has been coded that is relevant to vehicle condition. The database contains information regarding truck violations and out-of-service conditions. It also contains information about the role of the truck in the crash, and which vehicle had the right-of-way. In many cases, these data can be used to infer which vehicle was at fault in the crash.
Using the FACT data, it was possible to identify 290 semitrailers that were involved in fatal crashes. Table E.4 displays the number of trucks with at least one violation for vari-ous violation types. In total, 91 different violation types are coded in the FACT data. Table E.4 shows 13 violation types, along with an “other” category that contains the aggregated count of the remaining 78 violation types. Note that the total does not sum to 290 since some vehicles had multiple violations. For example, in addition to a brake vio-lation, a truck also may have had a light violation. The most common violations in Table E.4 were brake violations (29.3 percent), followed by lights/signal violations (15.5 percent), and driver log violations (13.1 percent). Therefore, Table E.4 demonstrates that about 30 percent of the trucks involved in fatal crashes had at least one brake violation. Many trucks had more than one brake violation. For example, 50 trucks (17.2 percent) had two or more brake violations.
From the FACT data analysis conducted by the University of Michigan Transportation Research Institute, the following observations related to brake maintenance emerged.
1. Trucks in brake-related accidents are 6.17 times more likely to be at fault.
2. Brake-related accidents are 3.37 times more likely at signalized intersections.
3. Trucks with at least one brake violation are 2.65 times more likely to be involved in brake-related accidents.
4. Trucks with at least one brake violation are 2.55 times more likely to be at fault.
These observations clearly show the importance of proper brake maintenance on vehicle safety performance. It is important to note that this data analysis focused on standard pneumatically braked tractor semitrailers. It can be expected that the safety benefits gained through measures that promote improved brake maintenance can be expected to benefit all large trucks. One option for heavier vehicles introduced under special permit, would be to require proof of regular brake maintenance and adjustment as an operational requirement of the special permit system. Such conditions coupled with superior brake capacity of the new configurations, as shown in Table E.3, would promote improved brake-related safety performance that would exceed that of standard commercial vehicles.
E-10 Cambridge Systematics, Inc.

Minnesota Truck Size and Weight Project
Table E.4 Number of Trucks with at Least One Violation FACT 1996-2001
Violation Type N Percent
Safety Belt 5 1.7%
Driver Log 38 13.1%
Hours of Service 5 1.7%
Other Driver 22 7.6%
Cab 22 7.6%
Coupling Devices 5 1.7%
Miscellaneous Trailer 10 3.4%
Brake 85 29.3%
Lights/Signal 45 15.5%
Tires/Wheels 33 11.4%
Steering 8 2.8%
Suspension 18 6.2%
Cargo Securement 15 5.2%
Other 57 19.7%
Proposed Federal Rule
The National Highway Traffic Safety Administration (NHTSA) has provided notice in the Federal Register16 of a proposed rule known as Reduced Stopping Distance for Truck Tractors. This rulemaking would require reduced stopping distance for truck tractors; recent research and testing of heavy vehicle braking systems by NHTSA show that improved stopping performance is achievable for today’s heavy vehicles.
16 (RIN 2127-AJ37).
Cambridge Systematics, Inc. E-11

Minnesota Truck Size and Weight Project
Performance-Based Evaluation of Selected Vehicles
The University of Michigan Transportation Research Institute provided an engineering assessment of the performance of the candidate vehicles that have emerged from Mn/DOT’s truck size and weight study.17 The analysis is based on well-established interna-tional vehicle performance measures that define the spatial and dynamic characteristics of the vehicles. Each performance measure has a pass fail criteria that can be used to deter-mine the acceptability of the vehicle. The procedure allows for adjustments to basic vehicle layout such as axle locations and coupling options to achieve improved or acceptable performance.
The performance measures are evaluated by computer simulation. UMTRI’s Yaw/Roll simulation package was used to evaluate the vehicles. The simulation package is based on Newtonian physics and has been validated by field tests. The Yaw/Roll simulation focuses on vehicle dynamics excluding brakes and acceleration. Acceleration and braking was evaluated using separate analytical methods.
Transportation Engineering Research New Zealand (TERNZ) was selected as a subcon-tractor to perform the simulation run tasks. UMTRI worked with Mn/DOT to specify the vehicle configurations, in terms of axle weights and positions, coupling systems and freight density. This information constituted the input data requirements for the simula-tions and once compiled, the files were sent to TERNZ for routine processing. UMTRI conducted the analysis of the results using the data from the output files and produced the final report.
Four vehicles have been identified by the Mn/DOT truck size and weight study as candi-dates. The axle locations were determined by Mn/DOT. Each of these vehicles was evaluated at the proposed maximum GVW and the seasonal increase using the perform-ance measure procedure. The analysis of the 8-axle 108,000 pound double was performed assuming A and B double configurations. This vehicle was simulated under the following conditions:
• A-train configuration at 80,000 pound (Surface Transportation Assistance Act double);
• A-train configuration at 108,000 pound; and
• B-train configuration at 108,000 pound.
Note: The A-train configuration uses a standard converter dolly to connect the rear trailer to the lead trailer. The B-train configuration utilizes a fifth wheel on the rear of the lead trailer. The rear trailer therefore couples directly to the lead trailer. This connection eliminates one point of articulation and couples the two trailers in roll. The combination of these two improvements in coupling greatly enhances dynamic stability of the vehicle.
17 University of Michigan Transportation Research Institute, Performance-Based Evaluation of Selected
Heavy Vehicles (Draft, Version 2), January 2006.
E-12 Cambridge Systematics, Inc.
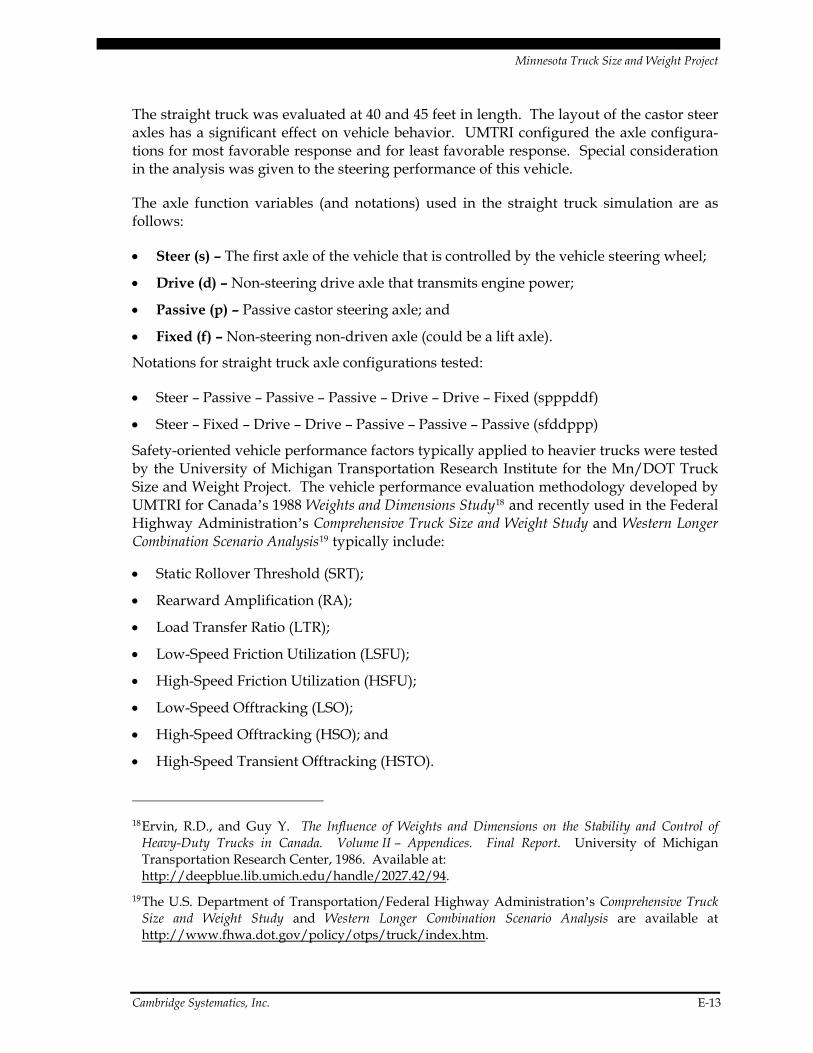
Minnesota Truck Size and Weight Project
The straight truck was evaluated at 40 and 45 feet in length. The layout of the castor steer axles has a significant effect on vehicle behavior. UMTRI configured the axle configura-tions for most favorable response and for least favorable response. Special consideration in the analysis was given to the steering performance of this vehicle.
The axle function variables (and notations) used in the straight truck simulation are as follows:
• Steer (s) – The first axle of the vehicle that is controlled by the vehicle steering wheel;
• Drive (d) – Non-steering drive axle that transmits engine power;
• Passive (p) – Passive castor steering axle; and
• Fixed (f) – Non-steering non-driven axle (could be a lift axle).
Notations for straight truck axle configurations tested:
• Steer – Passive – Passive – Passive – Drive – Drive – Fixed (spppddf)
• Steer – Fixed – Drive – Drive – Passive – Passive – Passive (sfddppp)
Safety-oriented vehicle performance factors typically applied to heavier trucks were tested by the University of Michigan Transportation Research Institute for the Mn/DOT Truck Size and Weight Project. The vehicle performance evaluation methodology developed by UMTRI for Canada’s 1988 Weights and Dimensions Study18 and recently used in the Federal Highway Administration’s Comprehensive Truck Size and Weight Study and Western Longer Combination Scenario Analysis19 typically include:
• Static Rollover Threshold (SRT);
• Rearward Amplification (RA);
• Load Transfer Ratio (LTR);
• Low-Speed Friction Utilization (LSFU);
• High-Speed Friction Utilization (HSFU);
• Low-Speed Offtracking (LSO);
• High-Speed Offtracking (HSO); and
• High-Speed Transient Offtracking (HSTO).
18 Ervin, R.D., and Guy Y. The Influence of Weights and Dimensions on the Stability and Control of
Heavy-Duty Trucks in Canada. Volume II – Appendices. Final Report. University of Michigan Transportation Research Center, 1986. Available at:
http://deepblue.lib.umich.edu/handle/2027.42/94. 19 The U.S. Department of Transportation/Federal Highway Administration’s Comprehensive Truck
Size and Weight Study and Western Longer Combination Scenario Analysis are available at http://www.fhwa.dot.gov/policy/otps/truck/index.htm.
Cambridge Systematics, Inc. E-13

Minnesota Truck Size and Weight Project
These performance measures are described in detail below.
Steady-State Roll Stability
Steady-state roll stability is an expression of the magnitude of lateral acceleration required to produce vehicle rollover. It is given as a proportion of gravitational acceleration (g). Total rollover occurs when the wheels on one side of the vehicle lift off the road surface, as illustrated in Figure E.3.
Rollover occurs when the lateral acceleration equals or exceeds the vehicle’s rollover limit (which may be assisted by roadway crossfall or camber). Lateral acceleration on a curve is highly sensitive to speed, and the speed required to produce rollover reduces as the curve radius reduces.
Roll stability is influenced by the center of gravity (COG) height, the effective track width provided by the axles and tires, and the suspension roll characteristics. The COG height is affected by the chassis height, load space height, load space length, and average freight density. The significance of roll stability depends on the commodity, body type, and operation involved.
This performance measure is evaluated in terms of the steady-state lateral acceleration at which all wheels on the inside of the turn have lifted off the road surface. This is accom-plished by increasing the steer angle of a vehicle unit until all axles on one side of a given vehicle unit lift off.
E-14 Cambridge Systematics, Inc.
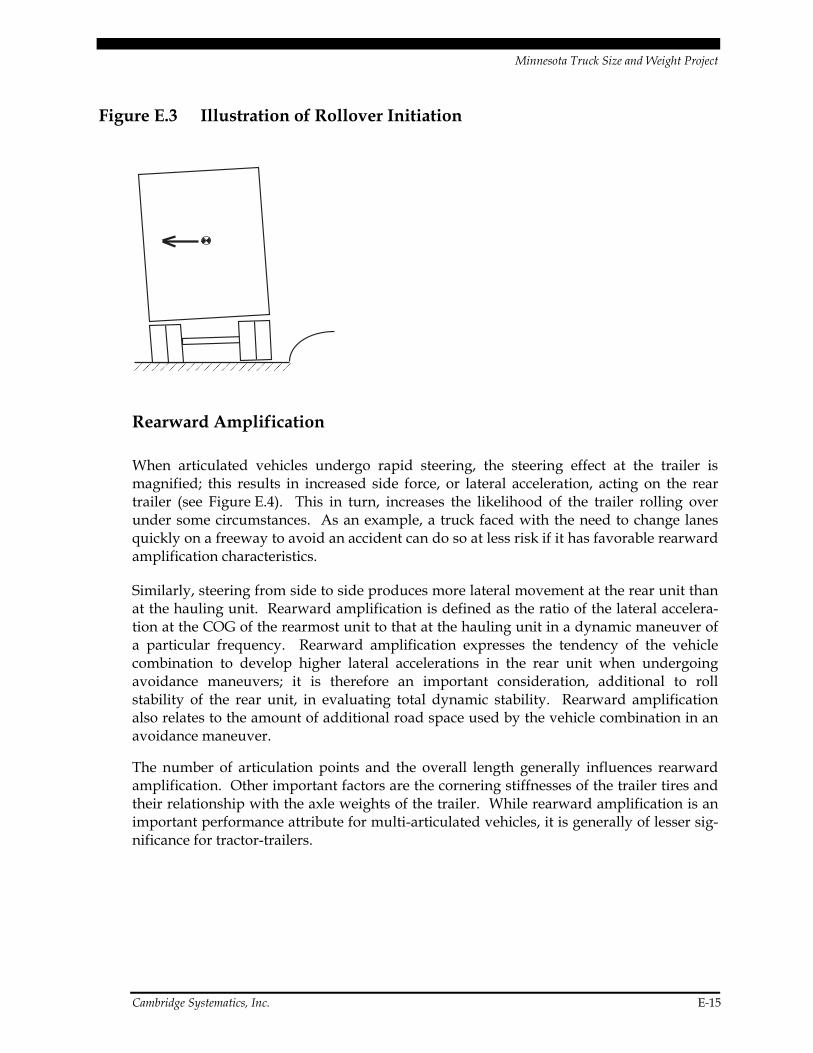
Minnesota Truck Size and Weight Project
Figure E.3 Illustration of Rollover Initiation
Rearward Amplification
When articulated vehicles undergo rapid steering, the steering effect at the trailer is magnified; this results in increased side force, or lateral acceleration, acting on the rear trailer (see Figure E.4). This in turn, increases the likelihood of the trailer rolling over under some circumstances. As an example, a truck faced with the need to change lanes quickly on a freeway to avoid an accident can do so at less risk if it has favorable rearward amplification characteristics.
Similarly, steering from side to side produces more lateral movement at the rear unit than at the hauling unit. Rearward amplification is defined as the ratio of the lateral accelera-tion at the COG of the rearmost unit to that at the hauling unit in a dynamic maneuver of a particular frequency. Rearward amplification expresses the tendency of the vehicle combination to develop higher lateral accelerations in the rear unit when undergoing avoidance maneuvers; it is therefore an important consideration, additional to roll stability of the rear unit, in evaluating total dynamic stability. Rearward amplification also relates to the amount of additional road space used by the vehicle combination in an avoidance maneuver.
The number of articulation points and the overall length generally influences rearward amplification. Other important factors are the cornering stiffnesses of the trailer tires and their relationship with the axle weights of the trailer. While rearward amplification is an important performance attribute for multi-articulated vehicles, it is generally of lesser sig-nificance for tractor-trailers.
Cambridge Systematics, Inc. E-15

Minnesota Truck Size and Weight Project
Figure E.4 Rearward Amplification of Lateral Acceleration
61m (200' ) 1.46m (4' 9.5")
(not to scale)
88 km/h (54.7 mph)
lateral acceleration at tractor COG
vs. time lateral acceleration at rear trailer COG
vs. time
Load Transfer Ratio
Load Transfer Ratio (LTR) is defined as the proportion of load on one side of a vehicle unit transferred to the other side of the vehicle in a transient maneuver. Where vehicle units are roll-coupled – as in tractor-trailers and B-trains – the load transfer ratio is computed for all axles on the vehicle. When the load transfer ratio reaches a value of 1, rollover is about to occur. The LTR is a vital measure of rollover stability and is particularly relevant to high-speed operations in dense traffic.
Friction Utilization
Friction Utilization is the non-tractive friction required between the tires and the road sur-face at any axle of a vehicle combination. It is a measure of the lateral shear force between the tires and the road that results from the vehicle negotiating a curve in the road or car-rying out a transient maneuver. The friction utilization of the steer axle tires is considered to be the most critical parameter under slow speed conditions. If saturation occurs, the vehicle may plough straight ahead failing to negotiate the turn. This is particularly important on low-friction surfaces, such as when roads are covered in snow and ice.
Low-Speed Offtracking
Low-speed offtracking represents a measure of the swept path of the vehicle and its lateral road space requirement when turning at intersections or when turning into loading areas.
This performance measure is evaluated for a standard 90-degree right-hand turn of radius 12.8 meters (measured at the center of the steering axle) negotiated at a speed of 5 km/h. This maneuver is illustrated in Figure E.5. The low-speed offtracking is determined as the maximum radial distance between the path of the midpoint of the steer axle and the path of the midpoint of the rearmost trailer axle.
E-16 Cambridge Systematics, Inc.

Minnesota Truck Size and Weight Project
Figure E.5 Low-Speed Offtracking
5 km/h (3.1 mph)
12.8 m (42 ft)radius
low speedofftracking
path traced by centre of steering axle
path traced by centre of rear axle
High-Speed Offtracking
High-speed offtracking is defined as the extent to which the rearmost tires of the vehicle track outboard of the tires of the hauling unit in a steady turn at highway speed. High-speed offtracking relates closely to road width requirements for the travel of combination vehicles. This maneuver is illustrated in Figure E.6.
This performance measure is evaluated for a constant-radius curve of radius 393 meters (1,290 feet), with a planar surface, negotiated at a speed of 100 km/h (62 mph); this maneuver produces a constant lateral acceleration of 0.2 g. High-speed offtracking is determined as the radial distance between the path of the center of the steer axle and the path of the center of the rearmost trailer axle.
Cambridge Systematics, Inc. E-17

Minnesota Truck Size and Weight Project
Figure E.6 High-Speed Offtracking
100 km/h (62 mph)
393.27 m(1290.3 ft)
radius
high-speed offtracking
path traced by centre of steering axle
path traced by centre of rear axle
Transient High-Speed Offtracking
Transient high-speed offtracking is a measure of the lateral excursion of the rear of the vehi-cle with reference to the path taken by the front of the vehicle during the same dynamic maneuver used for rearward amplification and transfer ratio. This expresses the amount of additional road space used by the vehicle combination in an avoidance maneuver.
Simulation Results
The results of the simulations are found in Tables E.5, E.6, and E.7. Each table represents a different vehicle class. The column labeled target values contains a list of the recom-mended threshold values that demote acceptable vehicle performance. Some of the threshold target values have flexibility. However, target values for the primary vehicle dynamic measures “load transfer ratio” and rearward amplification should be respected.
E-18 Cambridge Systematics, Inc.

Minnesota Truck Size and Weight Project
Table E.5 Performance Measures for the Six- and Seven-Axle Tractor Semitrailer
Six-Axle Semi Seven-Axle Semi Performance Measure Target Value 99,000 90,000 99,000 97,0000
Static Rollover Threshold (Ideal) 0.35g (min) 0.361g 0.371g 0.391g 0.394g
Load Transfer Ratio 0.60 (max) 0.335 0.309 0.328 0.324
Rearward Amplification 2.00 (max) 1.02 0.977 1.04 1.03
High-Speed Transient Offtracking 0.80 m (max) 0.12 m 0.11 m 0.11 m 0.10 m
High-Speed Offtracking 0.46 m (max) 0.36 m 0.32 m 0.32 m 0.31 m
Low-Speed Offtracking 6.00 m (max) 6.41 m 6.41 m 6.32 m 6.32 m
High-Speed Friction Utilization
Tractor Axle 1 17.7% 18.0% 18.4% 18.1%
Low-Speed Friction Utilization
Tractor Axle 1 26.0% 25.4% 52.2% 51.7%
Table E.6 Performance Measures for the Eight-Axle Double Configured as A- and B-Trains
8-Axle A-Double 8-Axle B-Double Performance Measure Target Value 108,000 80,000 108,000
Static Rollover Threshold (Ideal) 0.35g (min) 0.394g 0.455g 0.394g
Load Transfer Ratio 0.60 (max) 0.941 0.807 0.329
Rearward Amplification 2.00 (max) 2.59 2.43 1.38
High-Speed Transient Offtracking 0.80 m (max) 0.79 m 0.63 m 0.32
High-Speed Offtracking 0.46 m (max) 0.47 m 0.45 m 0.43 m
Low-Speed Offtracking 6.00 m (max) 3.58 m 3.59 m 4.94 m
High-Speed Friction Utilization
42% 39.6% 23.3% Tractor Axle 1
Low-Speed Friction Utilization
29.0% 26.1% 30.7% Tractor Axle 1
Cambridge Systematics, Inc. E-19

Minnesota Truck Size and Weight Project
Table E.7 Performance Measures for the Seven-Axle Straight Truck at 80,000 Pounds
Seven-Axle Straight
Target Value 40 foot
spppddf a45 foot
spppddf 40 foot
Performance Measure sfddppp b45 foot
sfddppp Static Rollover Threshold (Ideal) 0.35 g (min) 0.369 g 0.371 g 0.391 g 0.390 g
Load Transfer Ratio 0.60 (max) 0.420 0.398 0.448 0.442
Rearward Amplification 2.00 (max) 1.0 1.0 1.0 1.0
High-Speed Transient Offtracking 0.80 m (max) 0.13 m 0.12 m 0.17 m 0.18 m
High-Speed Offtracking 0.46 m (max) 0.22 m 0.24 m 0.39 m 0.41 m
Low-Speed Offtracking 6.00 m (max) 3.27 m 3.80 m 0.71 m 1.08 m
High-Speed Friction Utilization
Tractor Axle 1 26.0% 28.5% 30.8% 28.5%
Low-Speed Friction Utilization
Tractor Axle 1 100% 90% 88.4% 78.0%
a Steer – Passive – Passive – Passive – Drive – Drive – Fixed (spppddf).
b Steer – Fixed – Drive – Drive – Passive – Passive – Passive (sfddppp).
Graphical Results
Figures E.7 through E.14 contain graphs designed to illustrate how the vehicle perform-ance by performance measure category. An explanation of the significance follows:
Static Rollover Threshold – All vehicles examined had acceptable rollover threshold per-formance (Figure E.7). The largest change in static rollover threshold occurred with 8-axle double when the weight was increased from 80,000 pounds to 108,000 pounds. The sta-bility decreased from 0.455g to 0.394g; however, it remained above the target value of 0.35g.
E-20 Cambridge Systematics, Inc.

Minnesota Truck Size and Weight Project
Figure E.7 Comparison of Static Rollover Threshold for All VehiclesMinimum Recommended Value 0.35g – Larger Values Are Better
6-axle Semi 99,000 lbs.
6-axle Semi 90,000 lbs.
7-axle semi 99,000 lbs.
7-axle semi 97,000 lbs.
8-axle A-double 108,000 lbs.
8-axle A-double 80,000 lbs.
8-axle B-double 108,000 lbs.
Truck spppddf 40 ft. 80,000 lbs.
Truck spppddf 45 ft. 80,000 lbs.
Truck sfddppp 4 0ft. 80,000 lbs.
Truck sfddppp 45 ft. 80,000 lbs.
0 0.1 0.2 0.3 0.4 0.5Rollover Threshold (g) (>>> Better)
Load Transfer Ratio – Load transfer ratio is arguably the most powerful performance measure as it combines the influence of rearward amplification and static rollover thresh-old (Figure E.8). In the opinion of the author, the maximum target value of 0.6 should be respected. The A-double at 80,000 pound exceeds the recommended value by 35 percent and increasing the mass to 108,000 pounds exceeds the target by 57 percent. This finding shows that the performance of the short double in the A-train configuration is very poor and increasing vehicle decreases stability performance. However, it is important to note that double trailer combinations in the A configuration with longer trailers can have acceptable load transfer ratio performance.
Cambridge Systematics, Inc. E-21

Minnesota Truck Size and Weight Project
Figure E.8 Comparison of Load Transfer Ratio for All Vehicles Maximum Recommended Value 0.6 – Smaller Values Are Better
0 0.1 0.2 0.3 0.4 0.5 0.6 0.7 0.8 0.9 1
6-axle semi 99,000 lbs.
6-axle semi 90,000 lbs.
7-axle semi 99,000 lbs.
7-axle semi 97,000 lbs.
8-axle A-double 108,000 lbs.
8-axle A-double 80,000 lbs.
8-axle B-double 108,000 lbs.
Truck spppddf 40 ft. 80,000 lbs.
Truck spppddf 45 ft. 80,000 lbs.
Truck sfddppp 40 ft. 80,000 lbs.
Truck sfddppp 45 ft. 80,000 lbs.
Load Transfer Ratio (Better <<<<)
Configuring the identical vehicle as a B-train results in substantial improvement in stabil-ity performance. The B-train configuration is well within the recommended performance target (45 percent less than the maximum allowable). Comparing the vehicle at a GVW of 108,000 pounds, the B-train configuration outperforms the A-train by a factor of 2.9.
Rearward Amplification is a measure specifically developed to assess the dynamic qual-ity of articulated vehicles. Generally, the measure becomes more active as the number of articulation joints increase. The straight truck always has a ratio of unity, as it is a single vehicle element. The double trailer in the A-configuration is the most active unit, exceeding the target value of 2 at 80,000 pounds and 108,000 pounds. However, when the double trailer combination is coupled as a B configuration the performance is well within acceptable limits.
E-22 Cambridge Systematics, Inc.

Minnesota Truck Size and Weight Project
Figure E.9 Comparison of Rearward Amplification for All Vehicles Maximum Recommended Value 2.0 – Smaller Values Are Better
6-axle semi 99,000 lbs.
6-axle semi 90,000 lbs.
7-axle semi 99,000 lbs.
7-axle semi 97,000 lbs.
8-axle A-double 108,000 lbs.
8-axle A-double 80,000 lbs.
8-axle B-double 108,000 lbs.
Truck spppddf 40 ft. 80,000 lbs.
Truck spppddf 45 ft. 80,000 lbs.
Truck sfddppp 40 ft. 80,000 lbs.
Truck sfddppp 45 ft. 80,000 lbs.
0 0.5 1 1.5 2 2.5Rearward Amplification (Better <<<<)
3
High-Speed Transient Offtracking increases with articulation, vehicle length, and mass. The tractor semitrailers and straight truck perform very well. The performance of the A-doubles increases with mass but remain within the target value of 0.8m. Coupling the double trailer vehicle in the B-configuration results in substantial improvements.
Cambridge Systematics, Inc. E-23

Minnesota Truck Size and Weight Project
Figure E.10 Comparison of High-Speed Transient Offtracking for All Vehicles Maximum Recommended Value 0.80m – Smaller Values Are Better
6-axle semi 99,000 lbs.
6-axle semi 90,000 lbs.
7-axle semi 99,000 lbs.
7-axle semi 97,000 lbs.
8-axle A-double 108,000 lbs.
8-axle A-double 80,000 lbs.
8-axle B-double 108,000 lbs.
Truck spppddf 40 ft. 80,000 lbs.
Truck spppddf 45 ft. 80,000 lbs.
Truck sfddppp 40 ft. 80,000 lbs.
Truck sfddppp 45 ft. 80,000 lbs.
0 0.1 0.2 0.3 0.4 0.5 0.6 0.7 0.8Offtracking (m) (Better <<<<)
High-Speed Offtracking also increases with vehicle length and mass. It is less sensitive to the number of articulation joints that high-speed transient Offtracking. At 108,000 pounds, the A-train double exceeds the target value however when in the B configuration, the vehicle performance improves and is within acceptable the limit. All of the other vehi-cle options are within the acceptable limit.
E-24 Cambridge Systematics, Inc.

Minnesota Truck Size and Weight Project
Figure E.11 Comparison of High-Speed Offtracking for All Vehicles Maximum Recommended Value 0.46m – Smaller Values Are Better
6-axle semi 99,000 lbs.
6-axle semi 90,000 lbs.
7-axle semi 99,000 lbs.
7-axle semi 97,000 lbs.
8-axle A-double 108,000 lbs.
8-axle A-double 80,000 lbs.
8-axle B-double 108,000 lbs.
Truck spppddf 40 ft. 80,000 lbs.
Truck spppddf 45 ft. 80,000 lbs.
Truck sfddppp 40 ft. 80,000 lbs.
Truck sfddppp 45 ft. 80,000 lbs.
0 0.1 0.2 0.3 0.4 0.5Offtracking (m) (Better <<<<)
Low-Speed Offtracking is greatest for the tractor semitrailer combinations. These vehi-cles exceed the target values however given that this is a slow speed maneuver the target value has some flexibility. All other vehicles performed well within the target values.
Cambridge Systematics, Inc. E-25

Minnesota Truck Size and Weight Project
Figure E.12 Comparison of Low-Speed Offtracking for All Vehicles Maximum Recommended Value 6.0m – Smaller Values Are Better
0 1 2 3 4 5 6 7
6-axle semi 99,000 lbs.
6-axle semi 90,000 lbs.
7-axle semi 99,000 lbs.
7-axle semi 97,000 lbs.
8-axle A-double 108,000 lbs.
8-axle A-double 80,000 lbs.
8-axle B-double 108,000 lbs.
Truck spppddf 40 ft. 80,000 lbs.
Truck spppddf 45 ft. 80,000 lbs.
Truck sfddppp 40 ft. 80,000 lbs.
Truck sfddppp 45 ft. 80,000 lbs.
Offtracking (m) (Better <<<<)8
High-Speed Friction Utilization of the steering axle is significantly greater for the A-train than any other vehicle. In the B configuration, the high-speed friction utilization reduces significantly. There is no target value for this measure. However lower performance val-ues are highly desirable.
E-26 Cambridge Systematics, Inc.

Minnesota Truck Size and Weight Project
Figure E.13 Comparison High-Speed Friction Utilization for All Vehicles Maximum Recommended Value NA – Smaller Values Are Better
0 10 20 30 40 5
6-axle semi 99,000 lbs.
6-axle semi 90,000 lbs.
7-axle semi 99,000 lbs.
7-axle semi 97,000 lbs.
8-axle A-double 108,000 lbs.
8-axle A-double 80,000 lbs.
8-axle B-double 108,000 lbs.
Truck spppddf 40 ft. 80,000 lbs.
Truck spppddf 45 ft. 80,000 lbs.
Truck sfddppp 40 ft. 80,000 lbs.
Truck sfddppp 45 ft. 80,000 lbs.
Friction Utilization (Percent) (Better <<<<)0
Low-Speed Friction Utilization of the steer axle gives an indication of the steerability of a vehicle. A high level of friction utilization means that much of the available friction between the road and tire is being consumed steering the vehicle. Under these conditions, if brakes were applied the tires may saturate and be unable to direct the vehicle as the driver demands. When the low-speed friction demand reaches 100 percent, the low-speed vehicle directional control becomes highly compromised and practically ineffective. The straight truck with multiple axles was found to have very high levels of friction utilization making this vehicle impractical when it approaches 100 percent friction utilization.
Similarly, the seven-axle tractor semitrailer with the triaxle group at the tractor drive axle position also generates very high low-friction utilization. The measure is influenced by the weight on the front steer axle and the tractor wheel base.
This use of self-steering axles on straight trucks and truck-tractors requires careful engi-neering analysis particularly when more than one steer axle is to be used on a particular vehicle unit.
Cambridge Systematics, Inc. E-27

Minnesota Truck Size and Weight Project
Figure E.14 Comparison Low-Speed Friction Utilization for All Vehicles Maximum Recommended Value NA – Smaller Values Are Better
0 20 40 60 80 100
6-axle semi 99,000 lbs.
6-axle semi 90,000 lbs.
7-axle semi 99,000 lbs.
7-axle semi 97,000 lbs.
8-axle A-double 108,000 lbs.
8-axle A-double 80,000 lbs.
8-axle B-double 108,000 lbs.
Truck spppddf 40 ft. 80,000 lbs.
Truck spppddf 45 ft. 80,000 lbs.
Truck sfddppp 40 ft. 80,000 lbs.
Truck sfddppp 45 ft. 80,000 lbs.
Friction Utilization (Percent) (Better <<<<)
Conclusions
The University of Michigan Transportation Research Institute safety performance study conducted for the Mn/DOT TS&W Project found that the proposed vehicle configurations for operations above 80,000 pounds gross vehicle weight met internationally accepted heavy vehicle safety performance standards.
E-28 Cambridge Systematics, Inc.
Appendix F Truck Size and Weight Impact Analysis Methodology

Minnesota Truck Size and Weight Project
Truck Size and Weight Impact Analysis Methodology
Summary
This appendix reviews the methodology used to evaluate potential changes to truck size and weight (TS&W) under consideration by the Minnesota Department of Transportation (Mn/DOT).
Objective
The objective of this appendix is to describe the methodology for analyzing the impacts of changes in Minnesota truck size and weight laws. The methodology draws heavily upon past studies of truck size and weight limit changes by the Mn/DOT, the U.S. Department of Transportation, and the Transportation Research Board.
The impact areas covered in this appendix are:
• Truck traffic effects (including modal or system diversion);
• Transport costs;
• Pavement costs;
• Bridge posting and replacement;
• Bridge fatigue;
• Bridge decks;
• Bridge design;
• Crash costs; and
• Congestion costs.
Cambridge Systematics, Inc. F-1

Minnesota Truck Size and Weight Project
Methodology
This section describes the methodology for each impact area. In describing the methodol-ogy, conditions under current truck size and weight limits are referred to as the “Base Case” and conditions under a proposed change in limits are referred to as the “Scenario.” A spreadsheet model was developed for the project to analyze the above impact areas for the various TS&W scenarios considered during the study process. For each scenario, the following steps were undertaken for each impact area.
Findings
1. Truck Traffic Effects (Including Modal or System Diversion)
Step 1.1 – Identify vehicle configurations allowed under the Scenario that are not allowed under the Base Case on different highway systems and times of the year.
Step 1.2 – Consider possible shipper and carrier responses to the Scenario and specify the types of shipments to be analyzed.
Step 1.3 – For these shipments, specify Base Case and Scenario vehicles, loaded weights, empty weights, backhaul (empty/loaded ratios), and highway systems used.
Step 1.4 – Estimate the amount of payload that would shift to Scenario trucks.
Step 1.5 – Calculate changes in vehicle-miles of travel (VMT) by truck type and operating weight caused by the Scenario.
The principal shipper and carrier responses considered were changes in operating weights and the types of trucks used, in order to reduce the amount of truck VMT (and hence cost) to carry a given amount of freight. The following possibilities also were considered: 1) changes in limits might cause shifts from rail to truck, 2) changes in the total amount of freight shipped, 3) shifts in highway systems used by trucks,1 and 4) shifts in the time of year for shipments (due to seasonal differences in limits). Sensitivity analysis was per-formed to investigate how different assumptions about the size of shifts might affect the overall evaluation of a scenario. For example a sensitivity analysis involving the first two shifts was performed for the scenario that would permit 90,000-pound six-axle semitrailer configurations to operate off the Interstate system. The result showed that, if we assumed 10 percent induced freight from some combination of rail diversion and increases in the
1 Note: Based on input from the Technical Advisory Committee, 10 percent diversion from
Interstate routes was assumed due to increased weights allowed on non-Interstate routes.
F-2 Cambridge Systematics, Inc.

Minnesota Truck Size and Weight Project
total amount of freight carried due to lower transport costs, net benefits would be reduced about 11 percent for scenario trucks.
The truck traffic analysis also included the effects of illegal overloads. The default assumption was that the same amount of illegal overloading would occur under the Base Case and the Scenario. Trucks that exceeded the Base Case limit by a given percentage were assumed to exceed the Scenario limit by the same percentage. Sensitivity analysis was performed in order to examine the consequences of reduced overloading.
The amount of truck VMT required per unit of payload is calculated as follows:
Loaded Truck VMT/Payload Ton-Mile = 1/(Loaded Weight – Empty Weight)
Empty Truck VMT/Payload Ton-Mile = (Empty/Loaded Ratio)/(Loaded Weight – Empty Weight) where Loaded Weight and Empty Weight are in tons.
Empty/loaded ratios vary by type of truck and commodity carried. For specialized vehi-cles like cement mixers and grain hoppers, empty/loaded ratios are typically 1.0, since a loaded trip usually involves an empty backhaul trip of the same length. For dry vans operating over long distances, empty/loaded ratios are much lower (0.2 is typical).
The primary sources for information on empty weights, and empty/loaded ratios were the U.S. Department of Transportation’s Comprehensive Truck Size and Weight Study2 and interviews with shippers and carriers in Minnesota.
To guide estimates of the amount of freight that might shift to heavier trucks under each Scenario, tables were created to show the current distribution of truck traffic by truck type, operating weight, and highway system (Interstates, other trunk highways, and local). As an example, Table F.1 shows year 2004 vehicle-miles by truck type and oper-ating weight on all non-Interstate trunk highways in Minnesota. Data on truck miles by state, highway functional class, truck type, and operating weight from the U.S. DOT’s 2000 Comprehensive TS&W Study was used as the starting point in preparing these truck traffic distributions. The U.S. DOT distributions were updated and adjusted to be consis-tent with more recent data on truck miles compiled by Mn/DOT.
With these distributions, estimates were made regarding the amount of Base Case freight (measured in payload ton-miles) moving in trucks that are at or close to Base Case weight limits. This weight-limited freight is a good candidate for shifting to heavier trucks if weight limits are increased.
2 U.S. Department of Transportation, Comprehensive Truck Size and Weight Study (2000), available at
http://www.fhwa.dot.gov/policy/otps/truck/index.htm.
Cambridge Systematics, Inc. F-3

Minnesota Truck Size and Weight Project
Table F.1 Year 2004 VMT by Heavy Trucks on Non-Interstate Trunk Highways in Minnesota Millions
Single-Unit Trucks Weight Range
Tractor- Semitrailers
Truck- Trailers Doubles
(Thousands) Axles From To 3 4+ 3 4 5 6 7+ 4 5 6+ 5 6+
0 5 0.000 0.000 0.000 0.000 0.000 0.000 0.000 0.000 0.000 0.000 0.000 0.000
5 10 0.000 0.000 0.867 0.000 0.000 0.000 0.000 0.140 0.000 0.000 0.000 0.000
10 15 3.302 0.000 2.662 4.671 0.000 0.000 0.000 0.845 0.038 0.000 0.000 0.000
15 20 15.658 0.359 6.427 5.272 0.450 0.299 0.000 1.081 0.276 0.011 0.000 0.004
20 25 22.202 1.669 9.124 8.151 2.324 1.664 0.000 1.534 0.668 0.042 0.067 0.010
25 30 21.551 2.459 9.273 8.697 6.978 3.385 0.127 1.690 1.930 0.046 0.202 0.057
30 35 18.864 2.410 5.470 9.977 27.115 7.433 0.200 1.353 2.046 0.178 0.410 0.145
35 40 18.220 2.121 3.547 9.425 71.720 8.241 0.309 0.807 1.482 0.180 0.658 0.277
40 45 13.086 1.236 2.470 7.388 75.246 7.865 0.491 0.485 1.220 0.174 1.460 0.304
45 50 10.985 1.124 1.458 6.009 51.661 8.891 0.418 0.253 0.987 0.171 1.639 0.421
50 55 7.088 1.244 0.456 5.134 44.382 6.384 0.618 0.125 1.074 0.200 1.712 0.426
55 60 3.880 2.559 0.207 2.737 42.594 6.329 0.636 0.067 1.118 0.167 1.833 0.410
60 65 2.962 2.388 0.039 1.967 42.478 5.021 0.655 0.054 1.138 0.193 1.474 0.370
65 70 1.725 2.120 0.000 0.807 65.823 6.327 0.964 0.019 1.444 0.274 1.079 0.300
70 75 0.592 1.635 0.000 0.555 94.816 4.998 1.145 0.013 1.508 0.304 0.585 0.225
75 80 0.075 0.875 0.000 0.107 51.463 5.731 1.164 0.000 1.088 0.145 0.323 0.110
80 85 0.000 0.347 0.000 0.079 16.948 8.026 0.727 0.000 0.914 0.064 0.183 0.094
85 90 0.000 0.155 0.000 0.107 13.637 8.067 0.655 0.000 0.579 0.043 0.121 0.026
90 95 0.000 0.064 0.000 0.000 9.461 9.799 0.727 0.000 0.449 0.008 0.102 0.034
95 100 0.000 0.015 0.000 0.000 4.317 5.453 0.745 0.000 0.218 0.016 0.066 0.048
100 105 0.000 0.000 0.000 0.000 2.086 2.391 0.855 0.000 0.232 0.022 0.000 0.012
105 110 0.000 0.000 0.000 0.000 1.030 1.347 0.691 0.000 0.082 0.040 0.000 0.017
110 115 0.000 0.000 0.000 0.000 0.019 0.871 0.836 0.000 0.000 0.029 0.000 0.012
115 120 0.000 0.000 0.000 0.000 0.000 0.447 0.327 0.000 0.000 0.036 0.000 0.000
120 125 0.000 0.000 0.000 0.000 0.000 0.305 0.255 0.000 0.000 0.025 0.000 0.000
125 130 0.000 0.000 0.000 0.000 0.000 0.629 0.273 0.000 0.000 0.011 0.000 0.000
130 135 0.000 0.000 0.000 0.000 0.000 0.000 0.145 0.000 0.000 0.007 0.000 0.000
135 140 0.000 0.000 0.000 0.000 0.000 0.000 0.000 0.000 0.000 0.007 0.000 0.000
140 145 0.000 0.000 0.000 0.000 0.000 0.000 0.000 0.000 0.000 0.000 0.000 0.000
145 150 0.000 0.000 0.000 0.000 0.000 0.000 0.000 0.000 0.000 0.000 0.000 0.000
Total 140.189 22.781 41.998 71.084 624.548 109.902 12.964 8.466 18.493 2.393 11.914 3.302
Source: Truck traffic distributions prepared for the U.S. Department of Transportation Comprehensive Truck Size and Weight Study, 2000 and Mn/DOT classification counts.
F-4 Cambridge Systematics, Inc.

Minnesota Truck Size and Weight Project
2. Transport Costs
Step 2.1 – Obtain unit operating costs ($/VMT) for Base Case and Scenario trucks at dif-ferent operating weights.
Step 2.2 – Calculate Scenario cost savings using the unit costs and truck traffic impacts.
The primary source for information on truck operating costs was the U.S. Department of Transportation’s Comprehensive Truck Size and Weight Study (2000). The U.S. DOT Study provides truck operating costs by truck type and operating weight for the following cost components: drivers, vehicles, fuel, tires, repair, and overhead. Costs were updated from that study to 2005 dollars.
3. Pavements
Step 3.1 – Estimate costs or benefits to highway agencies and other road users associated with a change in equivalent single-axle load (ESAL)3 miles of travel for various types of highways and highway conditions.
Step 3.2 – Estimate ESALs as a function of operating weight for Base Case and Scenario trucks.
Step 3.3 – Calculate the change in ESAL miles due to freight shifting from Base Case to Scenario trucks.
Step 3.4 – Calculate the change in pavement costs as the product of 1) the change in ESAL miles, and 2) cost per ESAL-mile.
Pavement impacts of scenarios were calculated under two different assumptions:
1. Pavement-related expenditures by highway agencies would be adjusted upward or downward so that the pavement conditions experienced by road users would not be affected by the Scenario; and
2. Agency costs for pavements would be the same under the Base Case and the Scenario, so that all pavement impacts are incident on road users.
Changes in ESALs affect agency cost for pavements primarily by increasing or decreasing the time to the next pavement resurfacing or reconstruction. Agency cost impacts were estimated using data on ESALs compiled by Mn/DOT’s Office of Transportation Data and Analysis. Average resurfacing costs per lane-mile by highway type were estimated from the Federal Highway Administration’s (FHWA) Highway Economic Requirements 3 The equivalent single-axle load (ESAL) is used to measure the effects on pavements of different
types of axles and axle weights. By convention, one ESAL is an 18,000-pound single axle.
Cambridge Systematics, Inc. F-5

Minnesota Truck Size and Weight Project
Model (HERS), and the assumption of an average of 13 years between pavement resur-facings was based on Minnesota data compiled for the Highway Performance Monitoring System (HPMS).
Deteriorating pavements affect road users by increasing vehicle repair costs, fuel con-sumption, and ride discomfort (especially at higher speeds). Relationships between pavement condition, vehicle speeds, and vehicle operating costs from FHWA’s HERS were used to estimate impacts on road users. These relationships are illustrated in Figure F.1 for low-volume roads with speed limits of 40 and 60 miles per hour (mph). The curve for 60 mph is below the curve for 40 mph because travel time is a major component of road user costs. Both curves slope downward, indicating that road user costs decrease with improvements in pavement condition. The 60 mph curve has a larger downward slope than the 40 mph curve, indicating that pavement condition has more of an effect on road user costs on higher speed roads.
Figure F.1 Effect of Pavement Condition on Road User Costs for Low-Volume Roads
0.00
0.05
0.10
0.15
0.20
0.25
0.30
0.35
0.40
0.45
0.50
2.00 2.50 3.00 3.50 4.00 4.50
Pavement Condition (PSR)
Road User Costs (Dollars per Vehicle Mile)
Speed Limit = 40 mphSpeed Limit = 60 mph
Source: Developed using travel time and vehicle operating cost models in FHWA’s Highway Economic Requirements System (HERS).
These relationships, together with assumptions about the total volume of traffic and ESALs on a highway, can be used to estimate the cost to other road users of an additional ESAL-mile of travel.
For example, consider a low-volume road with a 55 mph speed limit, annual average daily traffic of 2,000, and average ESALs per day of 200. Assume further that the road will be
F-6 Cambridge Systematics, Inc.

Minnesota Truck Size and Weight Project
resurfaced at a fixed time interval. If ESALs on the road are increased, pavement condition will be worse at the time of resurfacing and road user costs over the life of the pavement will be higher. Using typical pavement deterioration curves and the cost rela-tionships shown in Figure F.1, it is estimated that, with a 10 percent increase in ESALs, average road user costs over the life of the pavement will increase by $0.0022 per vehicle-mile. With this information, the added cost to road users per ESAL-mile can be calculated as follows:
2,000 Average Annual Daily Traffic (AADT) * $0.0022/VMT/20 more ESALs/day = $0.22 per added ESAL-mile)
Using the approach illustrated above, cent per ESAL-mile values were developed for dif-ferent types of roads, varying speed limit, congestion level, AADT, and ESALs per day.
To analyze scenarios that involve changes to spring load restrictions (SLR), it was neces-sary to adjust estimates of cost per added ESAL-mile to reflect spring thaw conditions. Mn/DOT’s Technical Fact Sheet on Spring Load Restrictions indicates that, without SLRs, the pavement damage that occurs each day during the spring is about five times the dam-age that occurs each day during the summer.4 This is consistent with a Transports Quebec web page,5 which states that the same axle can cause between five to eight times more damage in the spring than it would at other times of the year. This range was used in analyzing scenarios that would modify the restrictions.
In calculating ESALs as a function of operating weight, the ESAL values shown in Table F.2 were used, with the assumption that ESAL values for each type of axle group vary with the fourth power of axle weight. This is the same procedure used by Mn/DOT in calculating ESALs for pavement design.
Table F.2 Basis for Estimating Equivalent Single-Axle Load Factors
Factor Axle Configuration Basic Load (kips) Flexible Equivalency Rigid Equivalency
Single 18 1.00 1.00
Tandem 34 1.09 1.95 Tridem 48 1.03 2.55
Note: ESAL values for other weights are calculated based on the assumption that ESALs vary as the fourth power of operating weight for each type of axle configuration.
4 http://www.mrr.dot.state.mn.us/research/seasonal_load_limits/thawindex/tfs_slr.asp. 5 www.mtq.gouv.qc.ca/en/camionnage/charges/degel.asp.
Cambridge Systematics, Inc. F-7
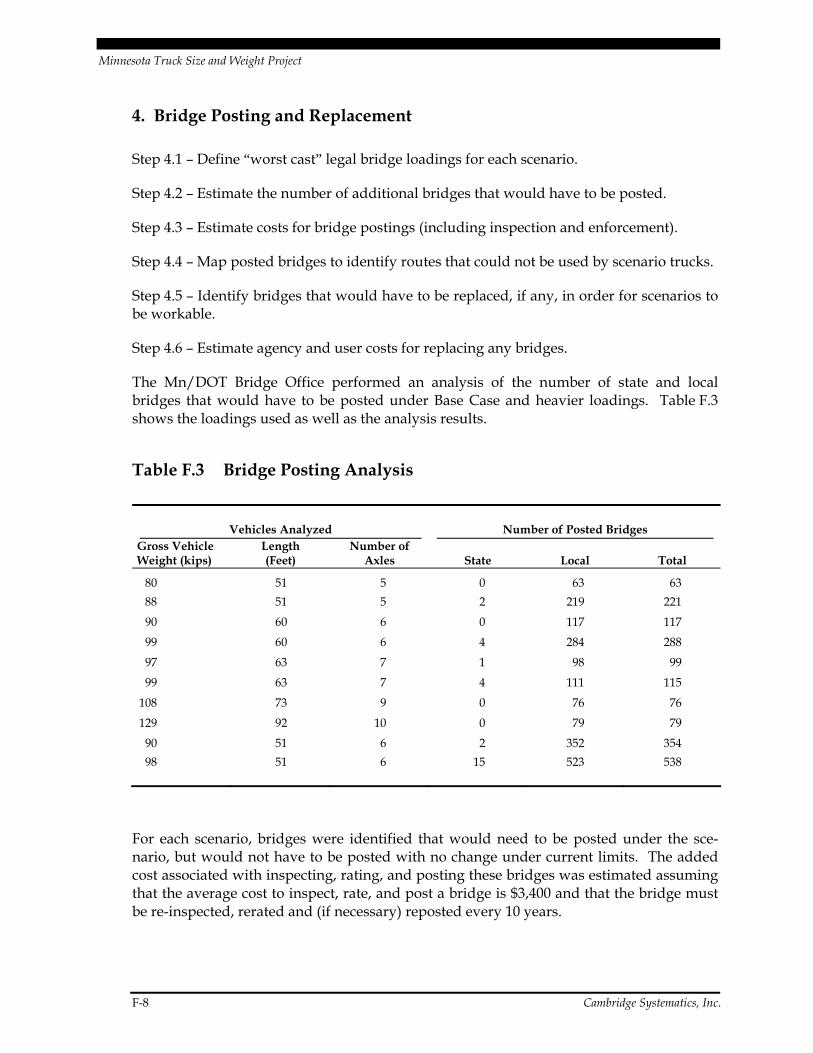
Minnesota Truck Size and Weight Project
4. Bridge Posting and Replacement
Step 4.1 – Define “worst cast” legal bridge loadings for each scenario.
Step 4.2 – Estimate the number of additional bridges that would have to be posted.
Step 4.3 – Estimate costs for bridge postings (including inspection and enforcement).
Step 4.4 – Map posted bridges to identify routes that could not be used by scenario trucks.
Step 4.5 – Identify bridges that would have to be replaced, if any, in order for scenarios to be workable.
Step 4.6 – Estimate agency and user costs for replacing any bridges.
The Mn/DOT Bridge Office performed an analysis of the number of state and local bridges that would have to be posted under Base Case and heavier loadings. Table F.3 shows the loadings used as well as the analysis results.
Table F.3 Bridge Posting Analysis
Vehicles Analyzed Number of Posted Bridges Gross Vehicle Weight (kips)
Length (Feet)
Number of Axles State Local Total
80 51 5 0 63 63 88 51 5 2 219 221
90 60 6 0 117 117
99 60 6 4 284 288
97 63 7 1 98 99
99 63 7 4 111 115
108 73 9 0 76 76
129 92 10 0 79 79
90 51 6 2 352 354 98 51 6 15 523 538
For each scenario, bridges were identified that would need to be posted under the sce-nario, but would not have to be posted with no change under current limits. The added cost associated with inspecting, rating, and posting these bridges was estimated assuming that the average cost to inspect, rate, and post a bridge is $3,400 and that the bridge must be re-inspected, rerated and (if necessary) reposted every 10 years.
F-8 Cambridge Systematics, Inc.

Minnesota Truck Size and Weight Project
The benefits and costs of replacing the bridges that would have to be posted under each scenario were estimated. These estimates were prepared using data from the Minnesota bridge inventory on traffic volumes, bridge deck area, and detour distance. In these analyses, the added transport costs associated with scenario trucks having to detour around a posted bridge was compared with the cost of replacing the bridge to accommo-date scenario trucks. In all cases, the benefits associated with replacing the bridges to accommodate scenario trucks were found to be less than the cost of replacing the bridges.
5. Bridge Fatigue
Step 5.1 – Obtain bridge fatigue unit costs for Minnesota bridges.
Step 5.2 – Calculate fatigue cost per vehicle-mile for affected trucks.
Step 5.3 – Calculate the change in bridge fatigue costs as the product of cost per mile and the change in miles.
TRB Special Report 2276 estimated bridge fatigue costs of $0.01 per passage of a loaded tractor-semitrailer over a steel bridge. Fatigue costs for concrete bridges are not signifi-cant. After updating the fatigue costs to 2005 dollars and applying data on the number of steel bridges and the distribution of truck traffic on different types of Minnesota high-ways, the estimate for bridge fatigue cost is $0.0014 per mile for a loaded (80,000-pound) tractor-semitrailer on non-Interstate highways in Minnesota.
Fatigue costs depend not only on the number of loaded trucks but also their weight. As discussed in TRB Special Report 225,7 the governing damage law for steel components has an exponent of three, so that fatigue damage varies as the third power of stress in a bridge. This third power law was used in calculating fatigue damage for heavier trucks.
6. Bridge Decks
Step 6.1 – Estimate the increase in bridge deck costs associated with an additional ESAL-mile8 of travel for various types of highways.
Step 6.2 – Estimate ESALs as a function of operating weight for Base Case and Scenario trucks.
TRB Special Report 227, New Trucks for Greater Productivity and Less Road Wear: An Evaluation of the Turner Proposal, Transportation Research Board, National Research Council, 1990.
6
TRB Special Report 225, Truck Weight Limits: Issues and Options, Transportation Research Board, National Research Council, 1990.
7
8 The ESAL for rigid pavements is also used to measure the effects on bridge decks of different types of axles and axle weights.
Cambridge Systematics, Inc. F-9

Minnesota Truck Size and Weight Project
Step 6.3 – Calculate the change in ESAL miles due to freight shifting from Base Case to Scenario trucks.
Step 6.4 – Calculate the change in bridge deck costs as the product of 1) the change in ESAL miles, and 2) cost per ESAL-mile.
Changes in traffic loadings affect bridge deck lives (i.e., the time until the deck must be replaced). To estimate the costs associated with these changes, it was assumed that bridge decks are designed to last 40 years and that the cost to replace a bridge deck is $40 per square foot. These assumptions were taken from a damage assessment performed for the Minnesota Weight Compliance Strategic Plan. Information on bridge deck area by high-way type was compiled from the Minnesota bridge inventory.
In calculating ESALs as a function of operating weight, the ESAL values shown earlier in Table F.2 were used, with the assumption that ESAL values for each type of axle group vary with the fourth power of axle weight.
7. Bridge Design
Step 7.1 – Determine whether design loads would have to be increased for a change in limits.
Step 7.2 – Estimate increase in bridge unit costs due to higher design loads.
Step 7.3 – Estimate annual construction of new and replacement bridges.
Step 7.4 – Estimate added costs for new and replacement bridges.
Minnesota now uses the Load and Resistance Factor Design (LRFD) method for new bridges. This method uses an HS20 truck along with a lane load. The resulting designs are close to an HS20 design for short bridges and to an HS23 design for longer bridges.
Mn/DOT bridge officials compared Scenario trucks and Base Case trucks in terms of their effects on bridges to identify instances where increases in bridge design loads are needed. Mn/DOTs experience with past increases in bridge design loads was used in estimating cost increases for new bridges. The 25 percent increase in bridge design loads that was implemented about 20 years ago resulted in a 3 to 5 percent increase in bridge construc-tion costs. Using 4 percent (for the 3 to 5 percent range) and assuming that cost increases are proportional to design load increases, the percent increase in costs was calculated as the percent increase in design load times 4 percent divided by 25 percent.
In a typical year, costs for new and replacement bridges in Minnesota are about $100 mil-lion on the state system and $50 million on the local system. Hence, state system bridge costs for a design load increase were calculated as $100 million times the percent increase in costs and local system bridge costs were calculated as $50 million times the percent increase in costs by these trucks.
F-10 Cambridge Systematics, Inc.

Minnesota Truck Size and Weight Project
Not all of these cost increases should be allocated to Scenario trucks if other vehicles con-tribute to the need for increased bridge design loads. Specifically, it was assumed that these costs are the responsibility of all trucks with gross vehicle weights (GVW) over 75,000 pounds and the costs should be allocated in proportion to the percentage of pay-load ton-miles carried.
8. Crash Costs
Step 8.1 – Estimate crash rates and unit costs by highway system, truck type, and oper-ating weight.
Step 8.2 – Apply crash rates and unit costs with estimated changes in truck traffic.
Crash rates by type of truck and operating weight from TRB Special Report 225 were adjusted so that crash rates for all heavy vehicles combined are consistent with those reported for heavy vehicles in the Minnesota Statewide Heavy Vehicle Safety Plan.9 Figure F.2 shows fatal crash rates for single-unit trucks, tractor-semitrailers, and doubles by operating weight. Similar crash rate curves for severe injury crashes, moderate injury crashes, minor injury crashes, and property damage only crashes also were developed.
In calculating crash costs, the following values were used:
• Fatal $3,600,000
• Serious Injury $280,000
• Moderate Injury $61,000
• Minor Injury $30,000
• Property Damage Only $4,400
These values were taken from the Mn/DOT Office of Investment Management Benefit/Cost Analysis Standard Value Tables.10
9 http://www.dot.state.mn.us/ofrw/PDF/SHVSP.pdf. 10 http://www.oim.dot.state.mn.us/EASS/.
Cambridge Systematics, Inc. F-11

Minnesota Truck Size and Weight Project
Figure F.2 Fatal Crash Rates for Heavy Trucks
0
0.5
1.0
1.5
2.0
2.5
3.0
3.5
0 20 40 60 80 100
Gross Vehicle Weight (Thousands of Pounds)
Fatal Crashes Per 100 Million Vehicle Miles
120
Single UnitTractor-SemitrailerDouble
Source: Crash rates from TRB Special Report 225, normalized to match rates reported in Mn/DOT Statewide Heavy Vehicle Safety Plan.
9. Congestion Costs
Step 9.1 – Estimate added costs to road users associated with unit traffic volume increases by highway system.
Step 9.2 – Estimate passenger car equivalent (PCE) factors as a function of truck type and operating weight.
Step 9.3 – Estimate added costs to road users associated with predicted changes in truck traffic.
Congestion costs were estimated using results from an analysis of external costs per-formed as part of the 1997 Federal Highway Cost Allocation Study.11 In that study, the added delay to other highway users associated with traffic volume increases was estimated by functional class (see Table F.4). Added fuel consumption associated with congestion delays was estimated as 0.7 gallons of fuel per vehicle-hour of delay. That value was updated based on changes in fleet fuel economy and Mn/DOT’s standard value of time for benefit/cost analysis was applied to convert delays to road user costs.
11 http://www.fhwa.dot.gov/policy/otps/costallocation.htm.
F-12 Cambridge Systematics, Inc.

Minnesota Truck Size and Weight Project
Table F.4 Added Delay to Other Vehicles Per 1,000 Passenger Car Equivalent (PCE) Vehicle-Miles
Added Delay (Hours) Rural
Interstate 0.69
Other Principal Arterial 1.55
Minor Arterial 1.61
Major Collector 1.14
Minor Collector 1.14
Local 1.14
Urban
Interstate 6.69
Other Freeways and Expressways 6.77
Other Principal Arterial 7.08
Minor Arterial 4.87
Collector 2.76 Local 2.76
Source: Analysis of external costs performed for 1997 FHWA Highway Cost Allocation Study.
The FHWA external costs study also developed PCE values for trucks as a function of con-figuration and operating weight. These values were used to convert changes in VMT by truck type and operating weight to changes in PCE VMT.
Conclusions
Application of Analysis Methodology for the Proposed Minnesota TS&W Changes
Based on the analyses conducted for this study, the package of TS&W law changes that Mn/DOT proposes is expected to have significant net statewide benefits as shown in Table F.5 and described below:
Cambridge Systematics, Inc. F-13

Minnesota Truck Size and Weight Project
Impacts of Proposed Vehicle Configurations
• Increased payloads and fewer truck trips will lower transport costs significantly.
• Additional axles and fewer truck trips will result in less pavement wear.
• A modest increase in bridge postings and future design costs will be necessary.
• Proposed trucks have slightly higher crash rates but, given fewer overall truck miles (due to increased payloads) than would be experienced otherwise under existing weight limits, safety would improve slightly.
Impacts of Changing Spring Load Restrictions and Increasing Nine-Ton System to 80,000 Pounds
• Increased payloads and fewer truck trips will lower transport costs significantly.
• Pavement costs will increase somewhat due to increased weights carried on existing truck configurations.
F-14 Cambridge Systematics, Inc.

Minnesota Truck Size and Weight Project
Table F.5 Truck Size and Weight Proposal Benefits Benefits in Millions of Dollars per Year; Negative Values Represent Increased Costs
Truck Size and Weight Package Elements
Transport Savings
Bridge Inspection, Rating, and Posting
Bridge Fatigue and Decks
Increased Bridge Design Loads
Total Net Benefits Pavements Safety Congestion
Proposed Vehicle Configurations
Six-Axle 90,000-Pound Semi $3.68 $1.27 $-0.05 $0.15 $-0.96 $0.15 $0.18 $4.43
Seven-Axle 97,000-Pound Semi 4.00 2.24 -0.01 0.22 -0.64 0.23 0.23 6.27
Eight-Axle Twin 108,000-Pound 2.01 1.25 -0.01 0.14 -0.72 0.05 0.08 2.79
SU up to 80,000-Pound 6.27 0.55 0.00 0.10 -0.13 0.06 0.05 6.90
Subtotal $15.96 $5.31 $-0.07 $0.61 $-2.45 $0.49 $0.54 $20.39
Spring Load Restrictions and Other Legislative Policy Issues
Change SLR $8.82 $-2.34 $0.00 $0.04 $0.00 $0.44 $0.17 $7.12
80,000-Pound on 9-Ton System 24.82 -8.49 0.00 -0.83 0.00 1.65 0.72 17.87
Subtotal $33.64 $-10.83 $0.00 $-0.79 $0.00 $2.09 $0.89 $24.99
Total Package $49.60 $-5.52 $-0.07 $-0.18 $-2.45 $2.57 $1.43 $45.38
Cambridge Systematics, Inc. 15
Appendix G Outreach Efforts for Minnesota Truck Size and Weight Project

Minnesota Truck Size and Weight Project
Outreach Efforts for Minnesota Truck Size and Weight Project
Summary
An extensive outreach process was conducted for the Minnesota Truck Size and Weight Project. More than 35 outreach meetings were held around the State, including regional meetings and individual meetings with stakeholder organizations. The outreach process culminated in a Northstar Workshop held on October 25, 2005, where project findings and candidate truck size and weight (TS&W) proposals were presented and discussed by a broad cross section of about 140 stakeholders. Based on early feedback from stakeholders, a set of guiding principles was established early in cooperation with the project’s advisory committees. These guiding principles set the parameters for analysis of proposed alterna-tives. In summary, the principles provided that any changes would: be in concert with Federal law, seek to protect highway infrastructure and safety, provide benefit to Minnesota’s industries and economy, promote ease and uniformity of application, and seek to cover costs imposed on the system. These guiding principles help narrow the final set of TS&W proposals.
Objective
To provide extensive opportunity for stakeholder input to the Minnesota TS&W Project.
Methodology
An extensive outreach process was conducted for the project. Regional meetings were held around the State. Numerous meetings were held with stakeholder organizations leading up to the October Northstar Workshop. The stakeholder and regional meetings are listed below. The outreach process culminated in a Northstar Workshop held on October 25, 2005, where project findings and candidate TS&W proposals were presented and discussed by a broad cross section of about 140 stakeholders. Minnesota Department of Transportation (Mn/DOT) also conducted an extensive analysis of TS&W alternatives in cooperation with the policy and technical advisory committees developed for the study who represent a vari-ety of industries, all levels of government, and other interested organizations.
Cambridge Systematics, Inc. G-1

Minnesota Truck Size and Weight Project
Findings
Outreach efforts were conducted throughout the State for the Minnesota Truck Size and Weight Project. The feedback provided by stakeholders helped establish a set of guiding principles, in cooperation with the project’s advisory committees, which set the parame-ters for analysis of proposed alternatives.
Stakeholder Meetings
Following is a listing of stakeholder meetings and the discussion guide used for the meetings.
Date Industry
July 12, 2005 Class 1 Railroads (Minnesota)
July 19, 2005 Minnesota Shortline and Regional Rail Association
August 8, 2005 Aggregate and Redi-Mix Association of Minnesota
August 9, 2005 Minnesota Grain and Feed Industry/Midwest Shippers Association
August 11, 2005 Railroads
August 11, 2005 Minnesota Chamber of Commerce
August 16, 2005 Waste Haulers Industry
August 16, 2005 Minnesota Department of Public Safety
August 17, 2005 Rural Electric Association of Minnesota
August 22, 2005 Soybean Growers Association of Minnesota
August 22, 2005 Pork Producers Association of Minnesota
August 25, 2005 Sugar Beet Industry
August 26, 2005 Associated General Contractors
August 26, 2005 American Automobile Association of Iowa and Minnesota
September 1, 2005 Forest Products/Timber Producers and Associated Contract Loggers
September 2, 2005 Minnesota Utility Contractors
September 7, 2005 Sugarbeet Producers/Haulers
September 8, 2005 Coalition Against Bigger Trucks & Minnesota Alliance for Safe Highways
September 8, 2005 Minnesota Trucking Association
September 14, 2005 South Dakota Department of Transportation and Department of Motor Vehicles
September 16, 2005 Dairy Cooperative
September 20, 2005 Minnesota Farm Bureau
G-2 Cambridge Systematics, Inc.
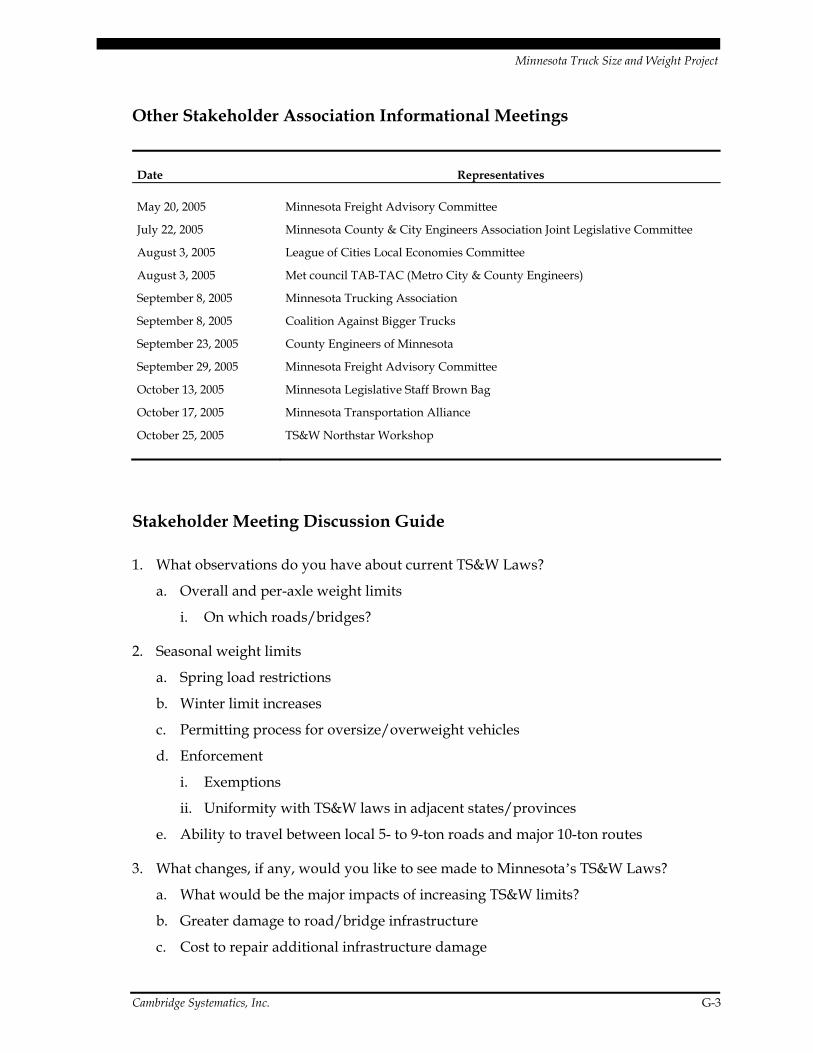
Minnesota Truck Size and Weight Project
Other Stakeholder Association Informational Meetings
Date Representatives
May 20, 2005 Minnesota Freight Advisory Committee
July 22, 2005 Minnesota County & City Engineers Association Joint Legislative Committee
August 3, 2005 League of Cities Local Economies Committee
August 3, 2005 Met council TAB-TAC (Metro City & County Engineers)
September 8, 2005 Minnesota Trucking Association
September 8, 2005 Coalition Against Bigger Trucks
September 23, 2005 County Engineers of Minnesota
September 29, 2005 Minnesota Freight Advisory Committee
October 13, 2005 Minnesota Legislative Staff Brown Bag
October 17, 2005 Minnesota Transportation Alliance
October 25, 2005 TS&W Northstar Workshop
Stakeholder Meeting Discussion Guide
1. What observations do you have about current TS&W Laws?
a. Overall and per-axle weight limits
i. On which roads/bridges?
2. Seasonal weight limits
a. Spring load restrictions
b. Winter limit increases
c. Permitting process for oversize/overweight vehicles
d. Enforcement
i. Exemptions
ii. Uniformity with TS&W laws in adjacent states/provinces
e. Ability to travel between local 5- to 9-ton roads and major 10-ton routes
3. What changes, if any, would you like to see made to Minnesota’s TS&W Laws?
a. What would be the major impacts of increasing TS&W limits?
b. Greater damage to road/bridge infrastructure
c. Cost to repair additional infrastructure damage
Cambridge Systematics, Inc. G-3

Minnesota Truck Size and Weight Project
d. Cost of additional enforcement
e. Need to post bridges and associated cost
f. Incomplete system of 10-ton roads to accommodate weight increases
g. Proportionately greater damage to local roads
h. Increase in truck-related crashes and fatalities
i. Reduction in payload ton-miles/number of trips
j. Lower weight per axle if more axles used
k. Increase in state’s ability to compete (nationally/internationally)
4. If TS&W limits are increased, should additional restrictions or conditions be considered?
a. Allow higher limits only on primary truck freight routes
b. Require additional axles
c. Reduce or eliminate exemptions. Include as permitted vehicles
d. Increase permit fees to pay for infrastructure damage
e. Require better safety equipment
f. Increase enforcement and truck inspections
5. What other infrastructure changes would be necessary if TS&W limits are increased?
a. Designate all 7- to 9-ton routes as 10-ton routes
b. Modify spring load restriction rules
c. Designate a primary truck freight route system
6. What business/industry trends might affect TS&W?
Regional Meeting Location and Agenda
Following is a listing of regional meetings and the agenda used for the meetings.
G-4 Cambridge Systematics, Inc.

Minnesota Truck Size and Weight Project
Regional Meeting Locations
Date Regional Location
August 22, 2005 Rochester, Minnesota
August 23, 2005 Duluth, Minnesota
August 23, 2005 Bemidji, Minnesota
August 24, 2005 Windom, Minnesota
August 25, 2005 Detroit Lakes, Minnesota
August 29, 2005 St. Cloud, Minnesota
August 30, 2005 (a.m.) Metro, Minnesota
August 30, 2005 (p.m.) Metro, Minnesota September 1, 2005 Redwood Falls, Minnesota
Agenda
1. Welcome and Introductions (District Engineer) 10 minutes
a. Agenda Objective: Introduce facilitators and participants to each other and “break the ice.”
i. Mn/DOT and Consultant introductions
ii. Participants introductions
iii. Review of day’s agenda
2. Project Background (OFCVO/SRF) 10 Minutes
a. Agenda Objective: Describe project need and objectives, and provide background informa-tion regarding TS&W laws and issues.
i. Purpose – What project is about and what it isn’t.
ia. Process – Role of District Stakeholder Meetings
ib. Timeline – Expected meeting outcomes
3. Open Discussion (Moderated) (OFCVO/SRF) 95 minutes
a. Agenda Objective: Understand from the “ground up,” what TS&W issues mean for stake-holders in Minnesota.
i. Facilitated discussion on TS&W issues in Minnesota and possible solutions. Use flip chart to write suggestions/actions/recommendations.
4. Summary and Next Steps (OFCVO/SRF) 15 minutes
a. Agenda Objective: Ask for additional comments and describe how, within the process schedule, input can be submitted by stakeholders at a later date.
5. Adjourn.
Cambridge Systematics, Inc. G-5

Minnesota Truck Size and Weight Project
Northstar Workshop
The outreach process culminated in a Northstar Workshop held on October 25, 2005, where project findings and candidate TS&W proposals were presented and discussed by a broad cross section of about 140 stakeholders. A plenary session explained the Mn/DOT TS&W proposals and technical evaluation results. Breakout groups were then organized to discuss and report back regarding their comments on the proposals. Finally, an open session was held in the afternoon to receive feedback from participants. The results are summarized below.
Breakout Sessions Summary Comments and Questions
1. General Configuration Proposals
Six-Axle, 90,000-pound GVW
• This configuration is generally acceptable – benefits are apparent.
• With current axle-weight limits, this configuration can only carry 88,000 pounds. To carry 90,000 pounds, the length would have to be increased to 60 feet (from 53 feet). But even 88,000 would be beneficial.
• This configuration will only marginally help the sugar beet industry since they already can haul 88,000 pounds with the beet exception.
• Single-unit, straight trucks need a GVW increase with additional axles (construction/bulk commodities). These trucks could get up to nearly 80,000 pounds.
• Change in law to allow this change has to be written clearly to ensure compliance (e.g., cannot achieve 90,000 pounds with this configuration).
• Revisit timber-hauler bridge exemption – transition over time.
• Federal limits are still a barrier. Change Federal law (80,000-GVW limit).
• Diversion of trucks to non-Interstate roads is a problem.
• Why is a permit being required? OK if for posting and enforcement. Fold into registration fees.
• More detail regarding safety, rail diversion and localized impacts needed.
• Rail also increasing loads to 286- and 315-ton carload maximums.
• These configurations would be easier to enforce.
G-6 Cambridge Systematics, Inc.

Minnesota Truck Size and Weight Project
• Will extra axle be lift or rigid? Rigid more attractive if used in connection with load sensing.
• Why can’t 6-axle configuration handle 109,000 pounds like Ontario?
• Can 9-ton roads handle the 90,000-pound configuration?
• Need additional funds for retrofitting/repairing bridges.
Six-Axle, 90,000-Pound GVW Container
• Are there heavier containers already coming in from the east coast?
• Special permits should be issued for routes near South Dakota border to compete
2. Specialized Configurations
Seven-Axle, 97,000-pound GVW
• No general objections. Huge productivity gains and highest agency cost savings.
• Consider moving one of tridem axles to middle of trailer.
• Driver education is important to promote safety.
Nine-Axle, 108,000-pound GVW
• Impact on road geometrics, especially in urban areas; allow only on permitted routes.
• Do not allow for HAZMAT transportation.
• Do not permit twin trailer unless using the safer B-train configuration.
• Twin trailers a problem; need longer trucks.
• Need larger network to operate.
• Require special safety equipment and training.
• May need to educate car drivers also.
Ten-Axle, 129,000-pound GVW
• Impact on road geometrics; allow only permitted routes and select routes carefully.
• Do not permit twin trailer unless using the safer B-train configuration.
• With such limited network available, why propose? Concerns about safety out-weigh benefits.
• What if second short trailer is not allowed? What GVW can the first trailer carry and on what network?
Cambridge Systematics, Inc. G-7

Minnesota Truck Size and Weight Project
• South Dakota allows this configuration, but requires a special permit for every trip; have to follow special speed limit law.
• Start with point-to-point permit and evaluate results before allowing its general use.
3. Network
Spring Load Restrictions
County/CSAHs Default to Seven Tons
• Generally supported. Big improvement.
• Need a jurisdiction-blind system.
• Concern about trucks going from seven-ton county roads to five-ton township roads if these are the default weights.
• Why not relate seven tons to paved roads and five tons to unpaved?
• How much county road mileage is gravel?
• Some counties are ready to declare their system as 10 tons; will increase funding needs.
• City/Township Roads Default to Five Tons (No Change)
• Major problem for industry, especially in urban areas (cement/concrete/aggregate/redi-mix)
• Need jurisdiction-blind system
• Why not limit five tons to unpaved roads
• Still a problem for industry
SLR Start/End Dates Uniform Across Jurisdictions
• Strong support.
• Maintain milk-hauler exception.
• Counties/cities not comfortable giving up ability to decide posting dates.
Extend Gravel Road Season by Two Weeks
• This is a problem for agricultural haulers and construction, who would oppose it.
G-8 Cambridge Systematics, Inc.
Minnesota Truck Size and Weight Project
Ten-Ton System Expansion
Expand 10-Ton CSAH by 5,000 Miles
• Strong support from trucking industry; creates more of a seamless system.
• Who will pay for this expansion?
• Many roads, if tested, will turn out already to be 10-ton.
• Build future County Roads to 10 tons.
• Do not do randomly. Use a systematic approach.
• Would help if more trucks stay legal.
Remove 73,280-pound GVW Cap for 9-Ton Roads
• Strong support. Would create a lot of goodwill and support for other changes.
4. Related Policy Issues
2006
• Include liability for implements of husbandry.
• Obtain agricultural industry input.
• Need reasonable access clarification.
• Elimination of 73,280-pound limit on 9-ton roads makes the reasonable access issue moot.
• Eliminate statutory weight tolerances over 90,000 pounds.
• Keep axle weight tolerances.
• Keep civil weight enforcement.
• Yes, keep civil weight enforcement, but eliminate portable scales.
• Need to put cap or penalty.
• Include in package.
Eliminate Seasonal Harvest Permit.
• Yes.
Expand compliance education and training.
• Include information on routing, posted bridges, permit information, etc.
No tolerances/exceptions for agricultural/forest above 99,000 pounds.
• Equip vehicles with devices to weigh trucks in the field to eliminate uncertainty when loading.
Cambridge Systematics, Inc. G-9

Minnesota Truck Size and Weight Project
2007
• Update permit fees in 2006. Relate fees to damage done, but not so high as to dis-courage use.
• Revise bridge formula to match Federal formula.
• Has Canada looked at who benefits and who pays for damage?
Long Term
• General support for centralized permitting, but many prefer use of registration fees or taxes because of simplicity.
• Improve posting and signs even before TS&W changes are made.
5. Packaging of Candidate Proposals and Policy-Related Issues
• Use packaging to project goals identified.
• Need to examine Federal TS&W limits on the interstate system.
Northstar Workshop Synthesis
Truck Configuration Proposals
• The 6-axle, 90,000-pound GVW configuration is generally acceptable.
• The 7-axle, 97,000-pound GVW specialized configuration is acceptable provided it meets the bridge formula. Consider moving one of the tridem axles to the middle of the trailer. Require driver education to promote safety.
• The 9-axle 108,000 pound GVW specialized twin-trailer configuration is acceptable provided it meets the bridge formula. For safety reasons, should use the B-train cou-pling technique and other safety equipment to improve handling. Require driver edu-cation to promote safety.
• The 10-axle, 129,000-pound GVW configuration lacks a continuous network on which to operate, and is a long-combination vehicle (LCV). Its benefits may not outweigh safety concerns if adopted. Should use the B-trail hitch. Require special permit for every trip and select routes based on safety and geometrics.
• Lots of support for eliminating the 73,280-pound limit on 9-ton roads and allowing 80,000 pounds.
• Project has not yet addressed straight-truck weight/axle configuration, including issue of Spring Load Restrictions (SLR) for concrete/aggregate/redi-mix/utility trucks.
• Develop better pictures of truck configurations.
G-10 Cambridge Systematics, Inc.

Minnesota Truck Size and Weight Project
Network Proposals
• Strong support for the county road system to default to seven tons during the SLR period, but agencies need to retain the ability to post down as needed.
• Strong support for uniform SLR dates across jurisdictions (within zones), but counties not comfortable with giving up ability to decide posting dates.
• Construction and agricultural industries would oppose extending the SLR for gravel roads by two weeks.
• Strong support for an expanded 10-ton road system, but also strong agreement that more funds are needed to expand the 10-ton system and to improve state and local bridges.
Policy-Related Issues
• No consensus on elimination of liability exemption for agricultural implements of hus-bandry; need to obtain agricultural industry input.
• Lifting the 73,280-pound weight limit on 9-ton roads makes concerns about “reason-able access” moot since the law related to 9-ton (access) roads.
• No consensus on elimination of statutory weight tolerances; retain axle-weight tolerances.
• General agreement on preserving civil weight enforcement.
• Agreement on eliminating seasonal harvest permits.
• Strong support for expanding compliance education and training.
• Not much discussion on eliminating weight tolerances and exceptions for agricultural and forest products above the proposed 99,000-pound limit. As an option, equip vehi-cles with devices for weighing trucks in the field to eliminate uncertainty when loading.
• Support for updating existing permit fees in 2006.
• Support for revising Minnesota bridge formula to match Federal formula.
• Strong support for increasing enforcement, and using permit or registration fees to help fund increase.
• Strong support for centralizing permitting process and for developing a central source of information.
Cambridge Systematics, Inc. G-11

Minnesota Truck Size and Weight Project
• Support for centralized permitting, but some preference for using registration fees or raising taxes to do away with the permitting hassle.
• Improve postings and signs even before TS&W changes are made.
Packaging of Proposals (Including Conditions)
• Implement configuration and network proposals simultaneously with the following actions/conditions:
• Relate packaging to project goals identified.
• Implement configuration proposal at the same time; not one now and one later.
• Select routes for specialized vehicles based on pavement and bridge strength, geome-try, and safety.
• Ensure that minimum safety performances are met before increasing TS&W.
• Consider using registration fees and/or permit fees to fund increased enforcement lev-els and cover bridge inspection, posting, and damage costs.
• Implement centralized permitting.
• Preserve civil weight enforcement.
• Allow a transition period for industry to plan and adapt to the changes.
• Need to look at Federal TS&W limits on the interstate system.
Conclusions
Key findings of the overall outreach process were:
• The variations in TS&W laws across Minnesota road systems (i.e., different weight limits for different types of roads) work against freight productivity. A more exten-sive “10-ton” road system is needed.
• The complexity of TS&W laws results in added cost to industry and complicates com-pliance. TS&W laws need to be simplified and industry training provided.
• Lack of consistency among states creates barriers to cross-border freight movement.
• Enforcement of TS&W laws, and the permitting process for heavy trucks, is inconsis-tent across jurisdictions; a centralized system may be needed.
G-12 Cambridge Systematics, Inc.

Minnesota Truck Size and Weight Project
• Spring load restrictions cause circuity of travel and loss of business.
• There needs to be increased flexibility of weight limits and vehicle configurations to allow greater payloads.
• There are concerns about the infrastructure impacts of increased weight limits, par-ticularly on local roads and bridges.
• There are safety concerns about proposed increases in truck weight or length.
• There needs to be more investment in infrastructure and improved operations to achieve a more productive freight system.
• The proliferation of exemptions, exceptions, and tolerances in TS&W laws creates inequities and adversely impacts enforcement and infrastructure.
Cambridge Systematics, Inc. G-13