Embed Size (px)
Citation preview
9Population Growth
and Regulation
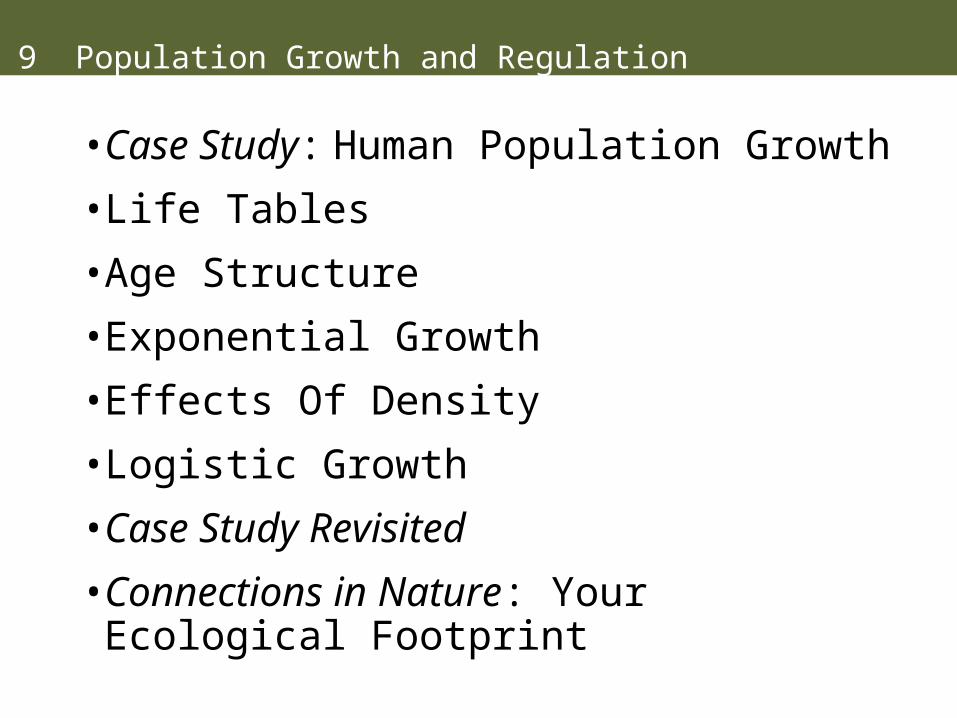
9 Population Growth and Regulation
• Case Study: Human Population Growth
• Life Tables
• Age Structure
• Exponential Growth
• Effects Of Density
• Logistic Growth
• Case Study Revisited
• Connections in Nature: Your Ecological Footprint
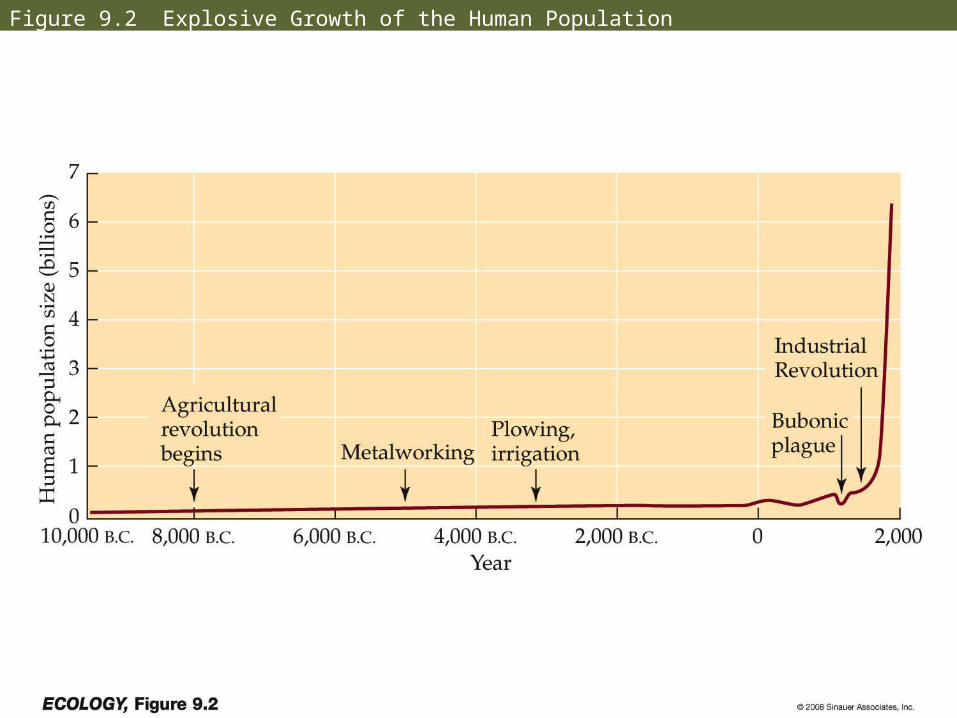
Figure 9.2 Explosive Growth of the Human Population
Introduction
One of the ecological maxims is “No population can increase in size forever.”
Ecologists try to understand the factors that limit or promote population growth.
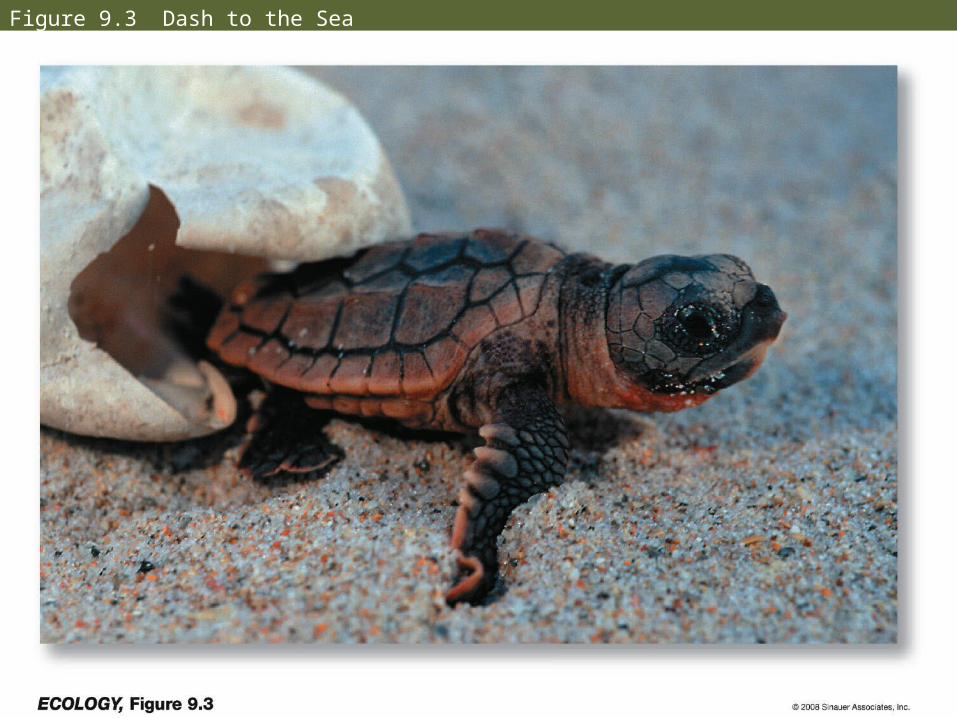
Figure 9.3 Dash to the Sea
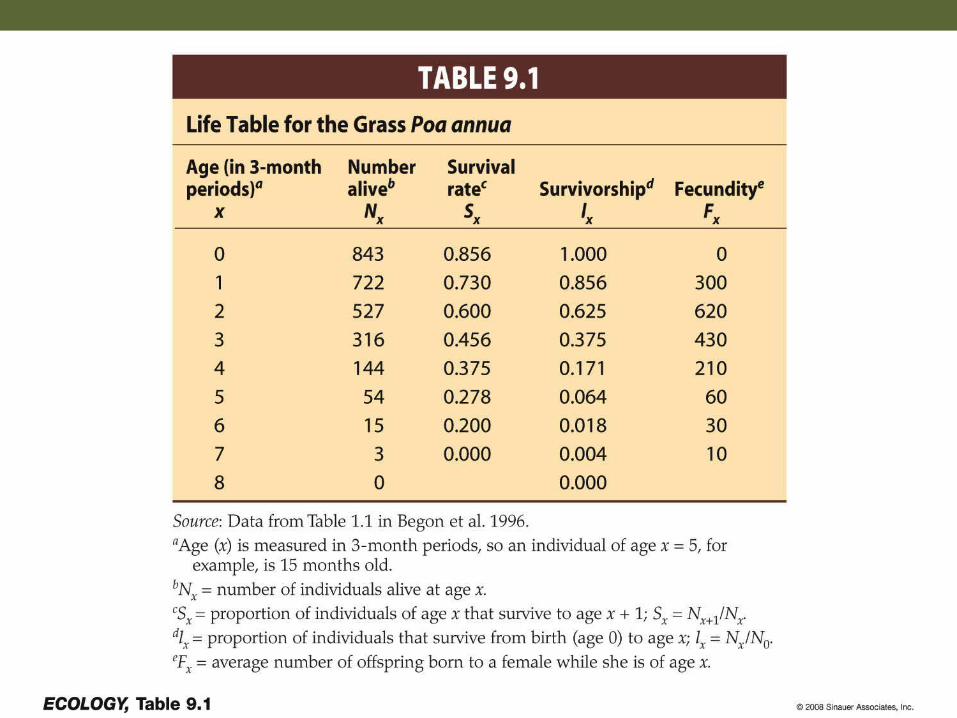
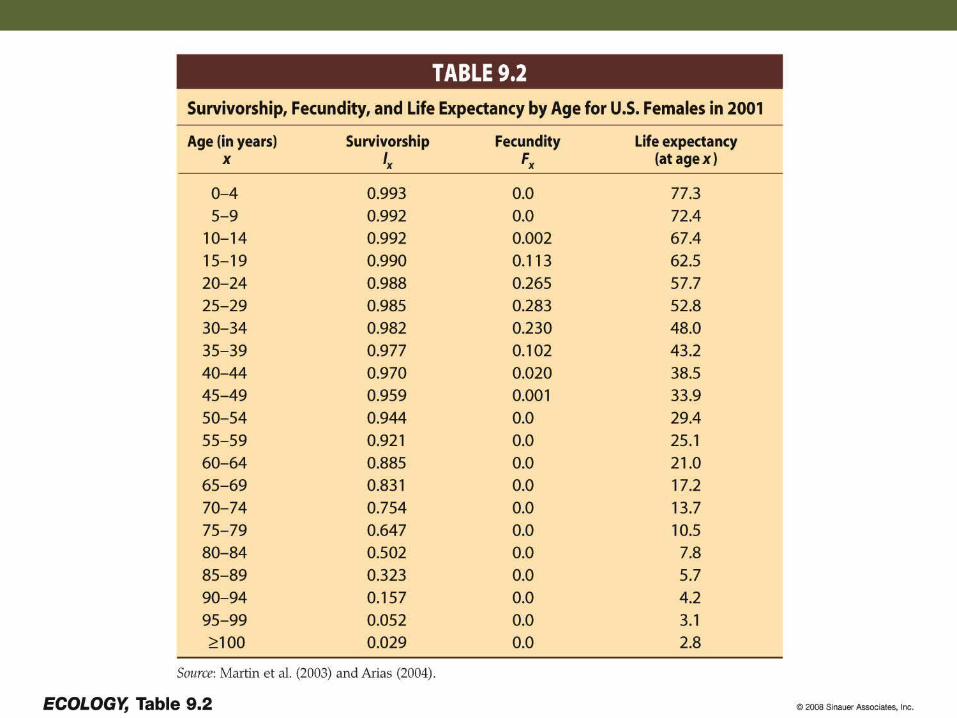
Life Tables
Information about births and deaths is essential to predict trends or future population size.
Concept 9.1: Life tables show how survival and reproductive rates vary with age, size, or life cycle stage.
Life Tables
A survivorship curve is a plot of the number of individuals from a hypothetical cohort that will survive to reach different ages.
Survivorship curves can be classified into three general types.
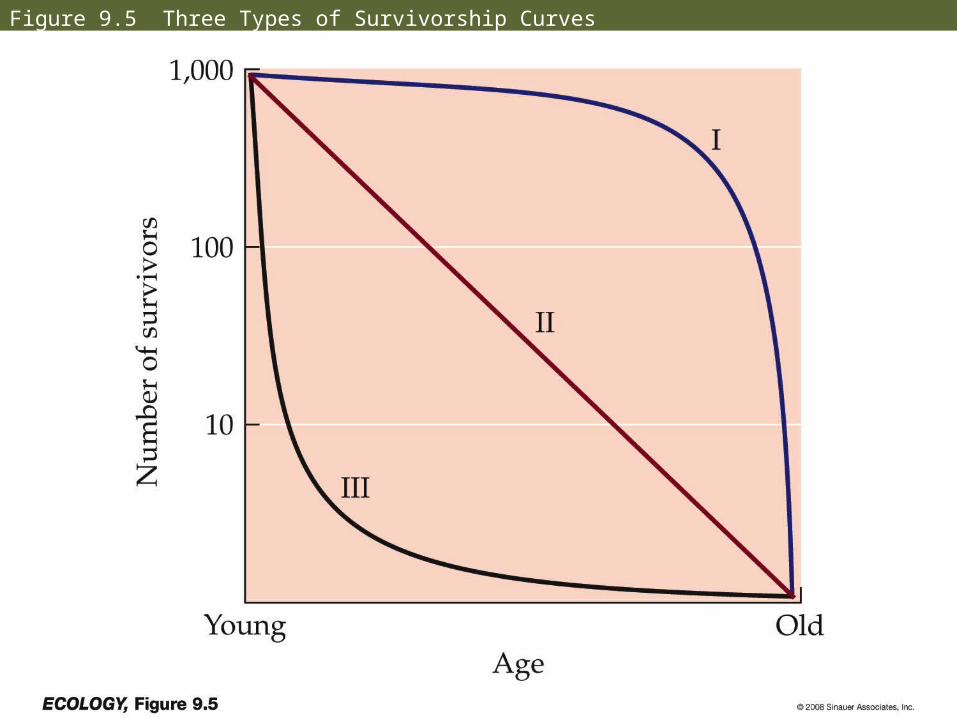
Figure 9.5 Three Types of Survivorship Curves
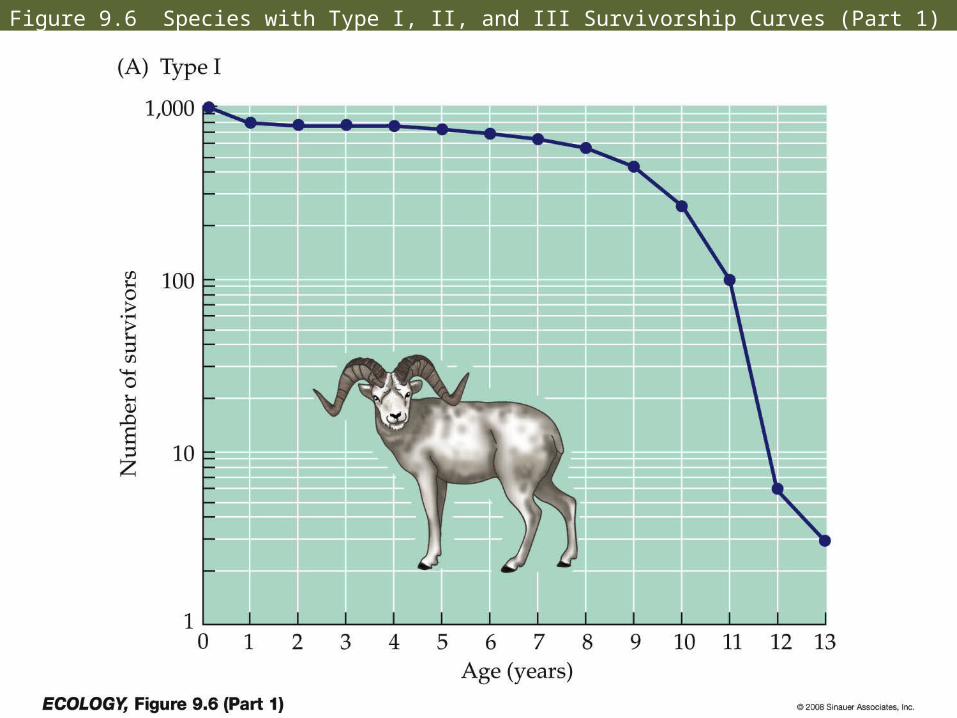
Figure 9.6 Species with Type I, II, and III Survivorship Curves (Part 1)
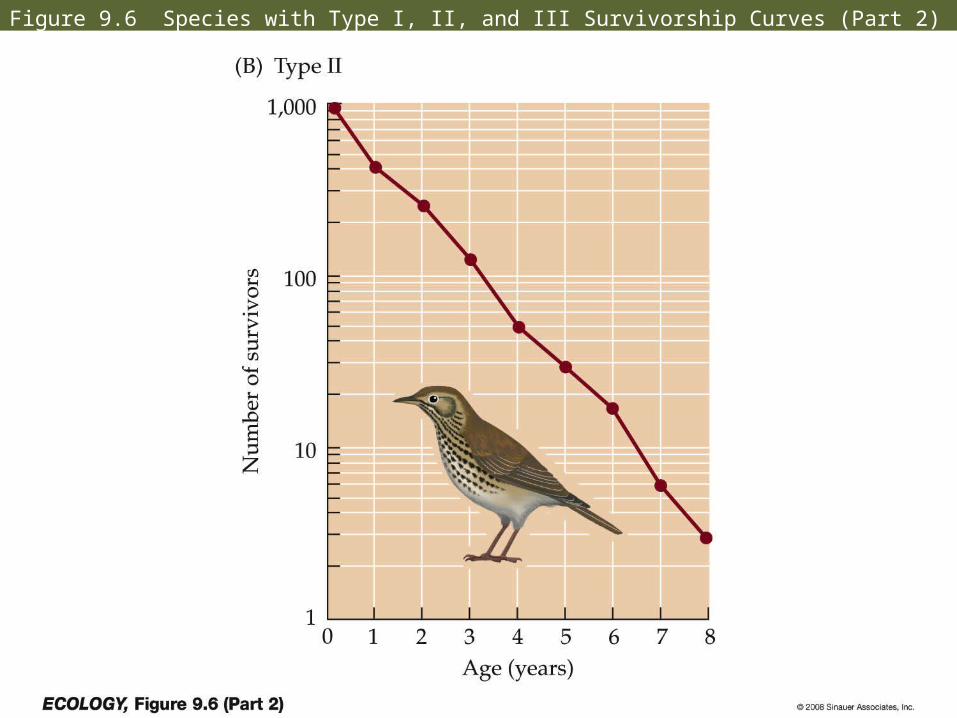
Figure 9.6 Species with Type I, II, and III Survivorship Curves (Part 2)
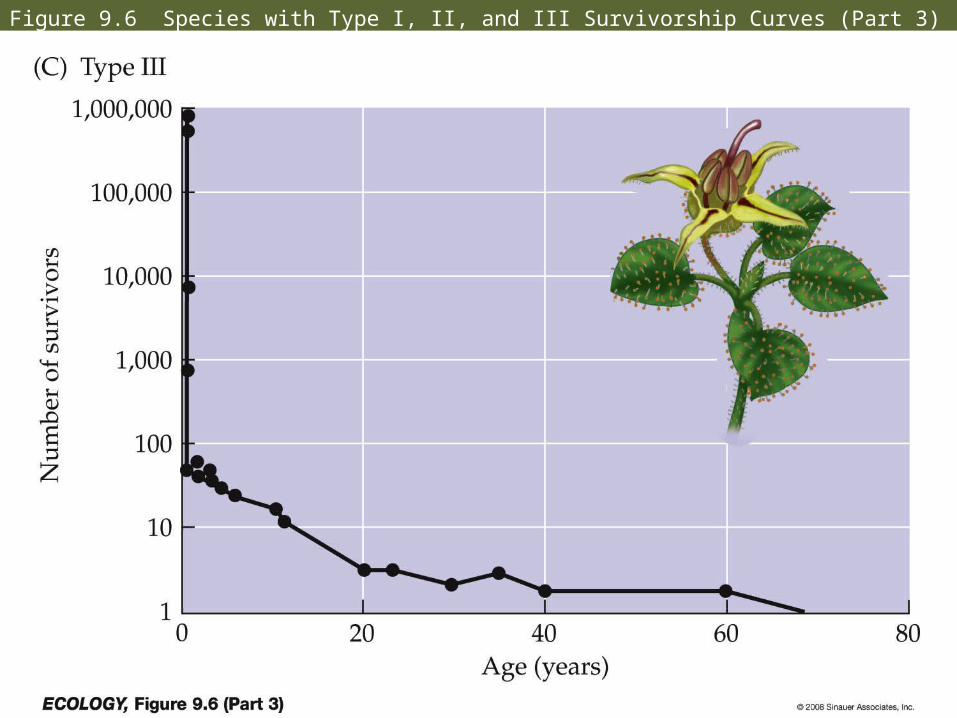
Figure 9.6 Species with Type I, II, and III Survivorship Curves (Part 3)
Age Structure
A population can be characterized by its age structure—the proportion of the population in each age class.
Age structure influences whether a population will increase or decrease in size.
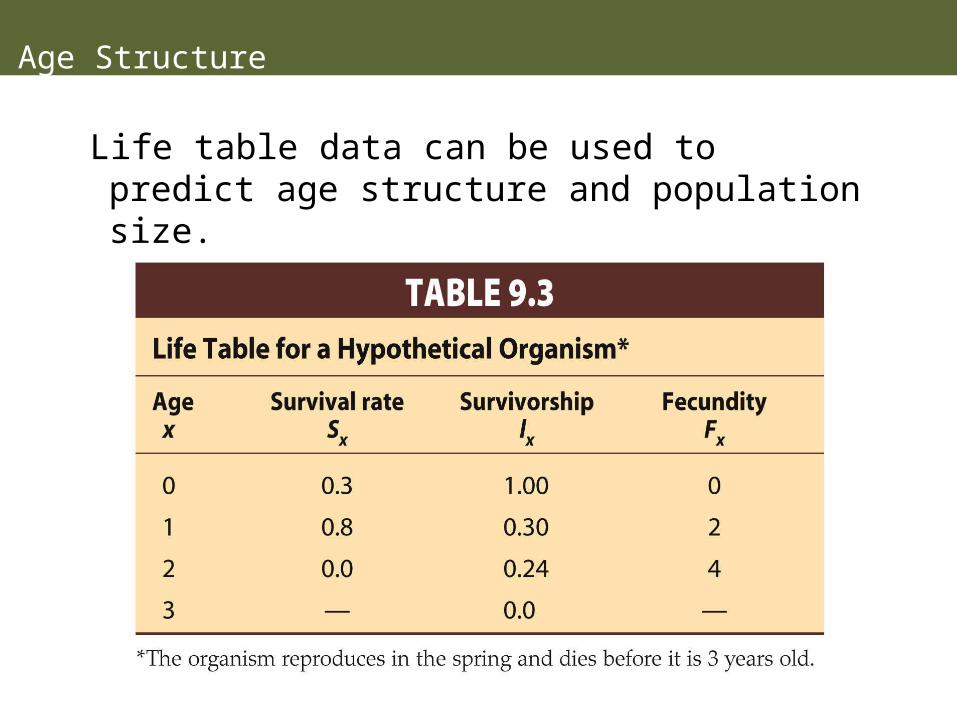
Concept 9.2: Life table data can be used to project the future age structure, size, and growth rate of a population.
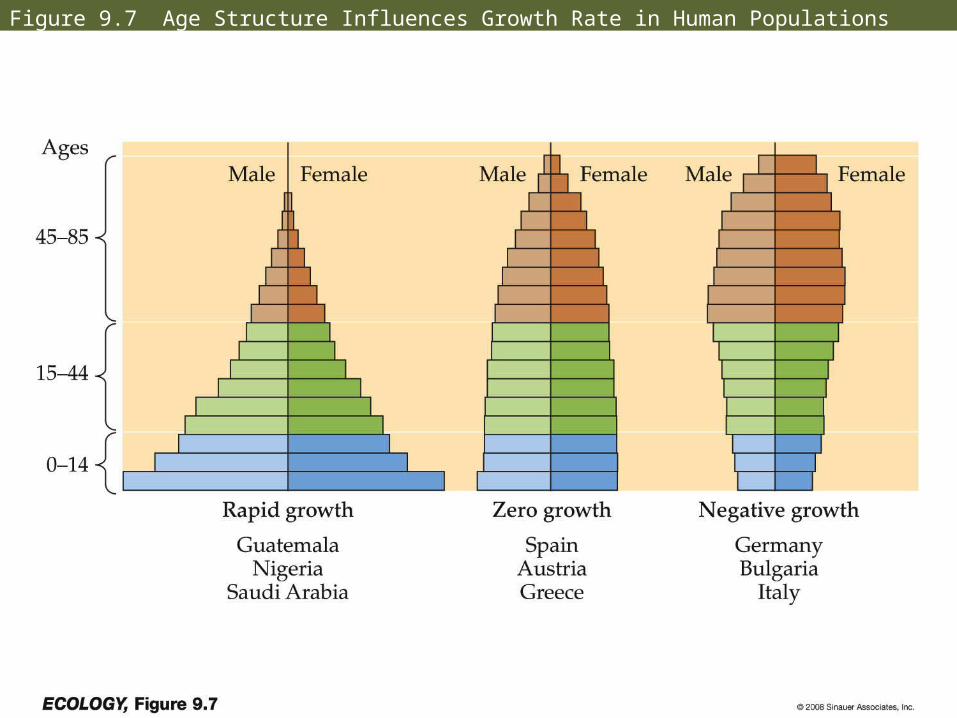
Figure 9.7 Age Structure Influences Growth Rate in Human Populations
Age Structure
Life table data can be used to predict age structure and population size.
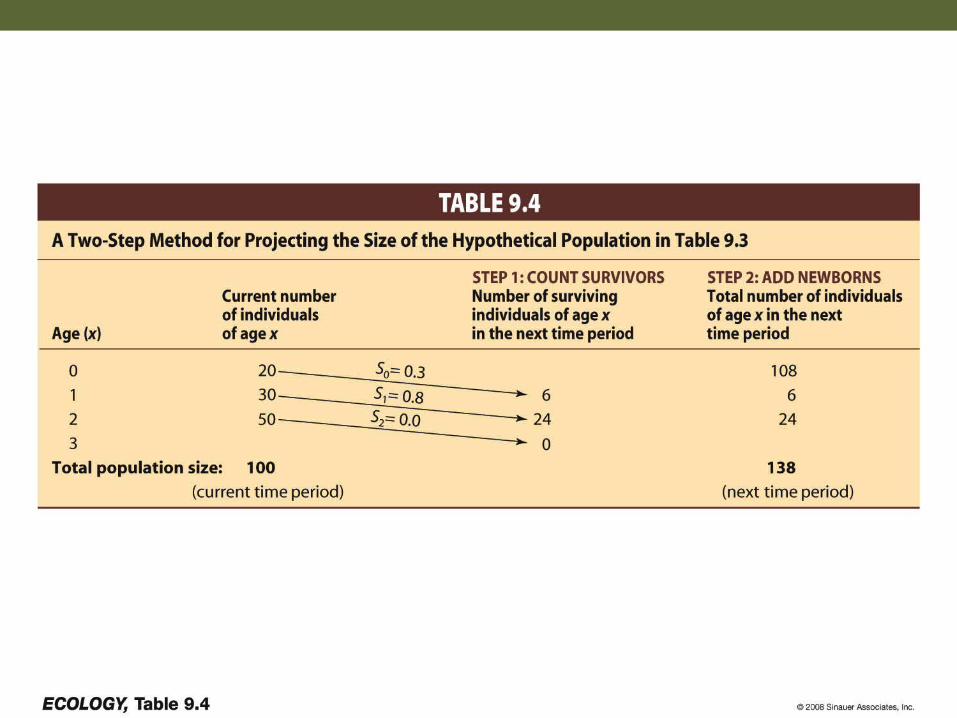
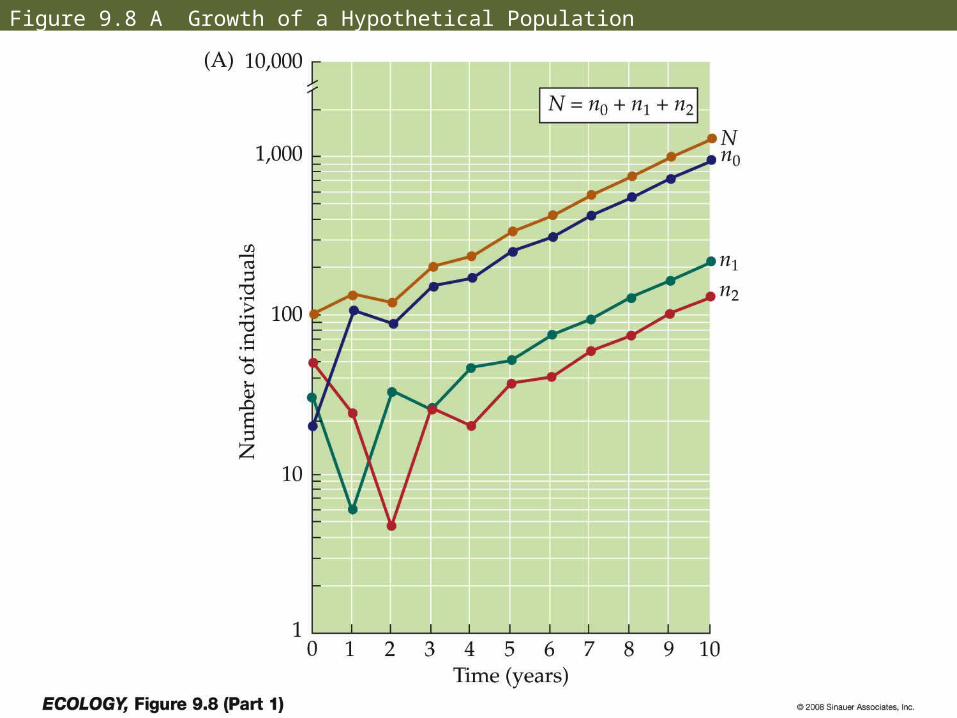
Figure 9.8 A Growth of a Hypothetical Population
Age Structure
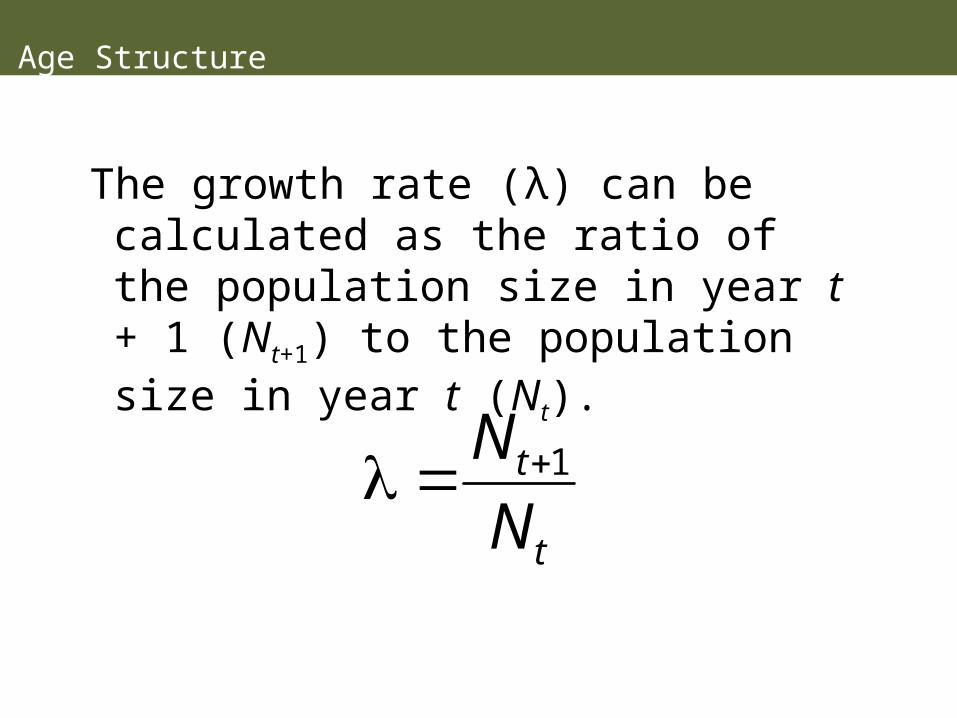
The growth rate (λ) can be calculated as the ratio of the population size in year t + 1 (Nt+1) to the population size in year t (Nt).
t
t
N
N 1
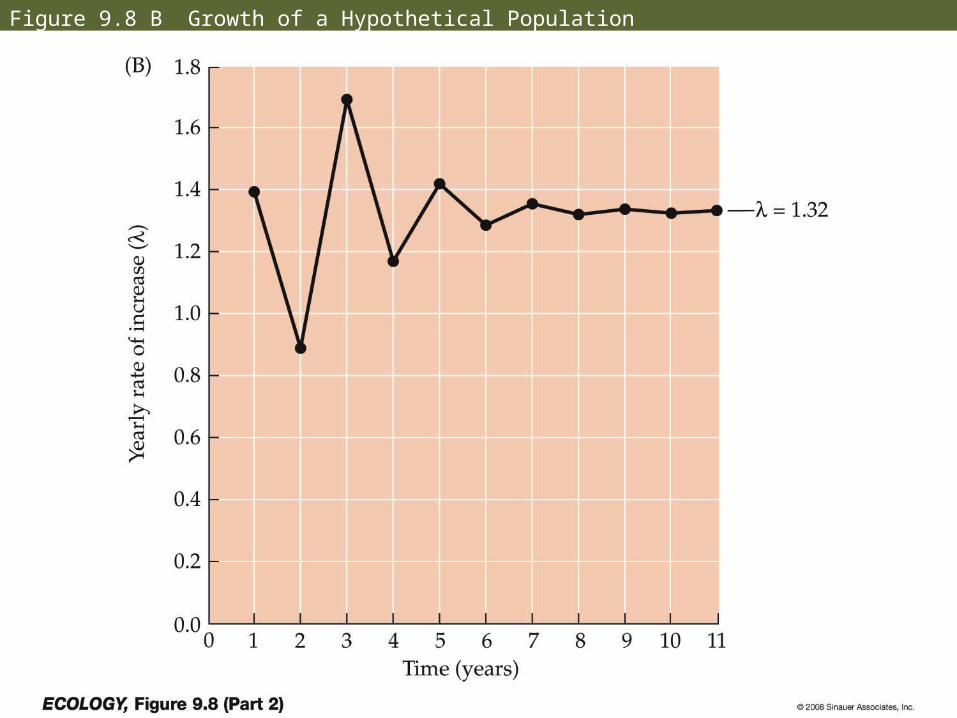
Figure 9.8 B Growth of a Hypothetical Population
Age Structure
When age-specific survival and fecundity rates are constant over time, the population ultimately grows at a fixed rate.
The age structure does not change from one year to the next—it has a stable age distribution.
Loggerheads – protect eggs, but even w/ 100% protection, species would still decline. Have to protect juveniles and adults.
Exponential Growth
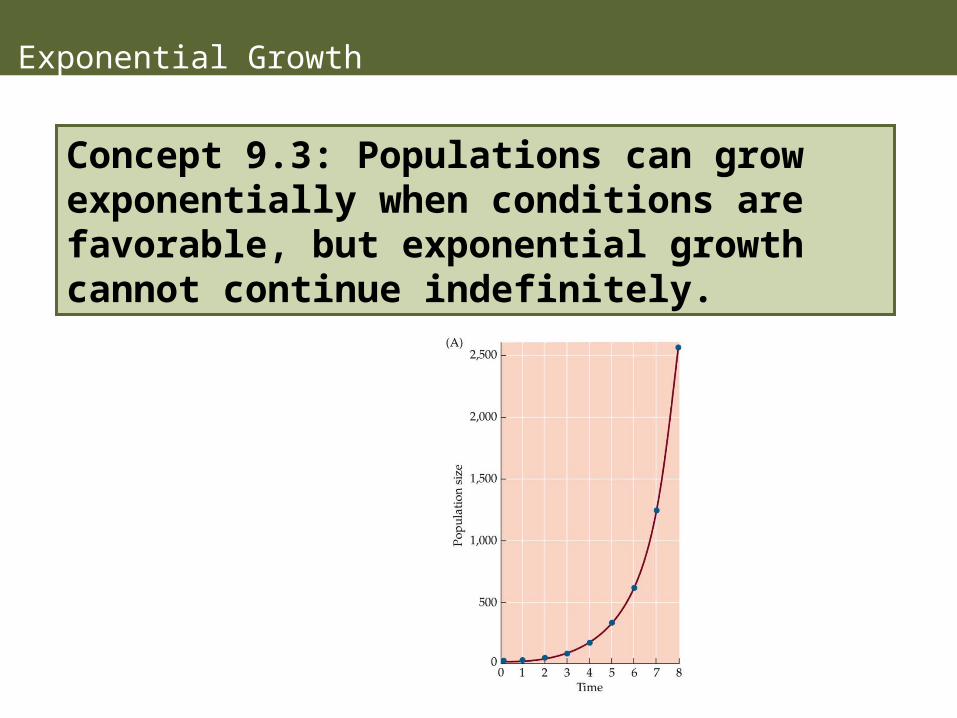
Concept 9.3: Populations can grow exponentially when conditions are favorable, but exponential growth cannot continue indefinitely.
Exponential Growth
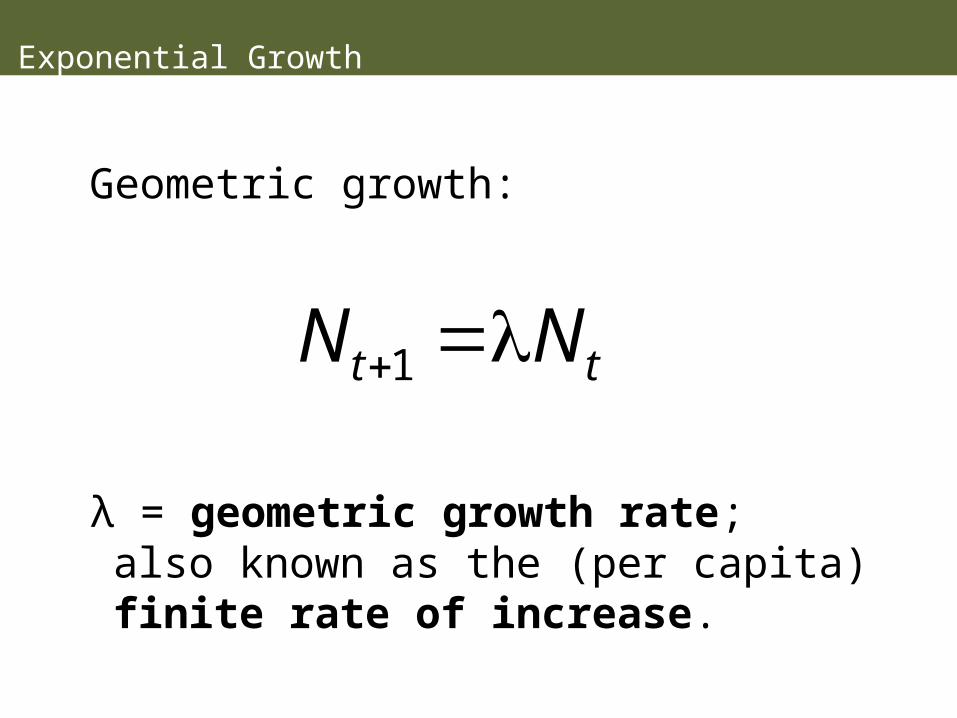
Geometric growth:
λ = geometric growth rate; also known as the (per capita) finite rate of increase.
tt NN 1
Exponential Growth
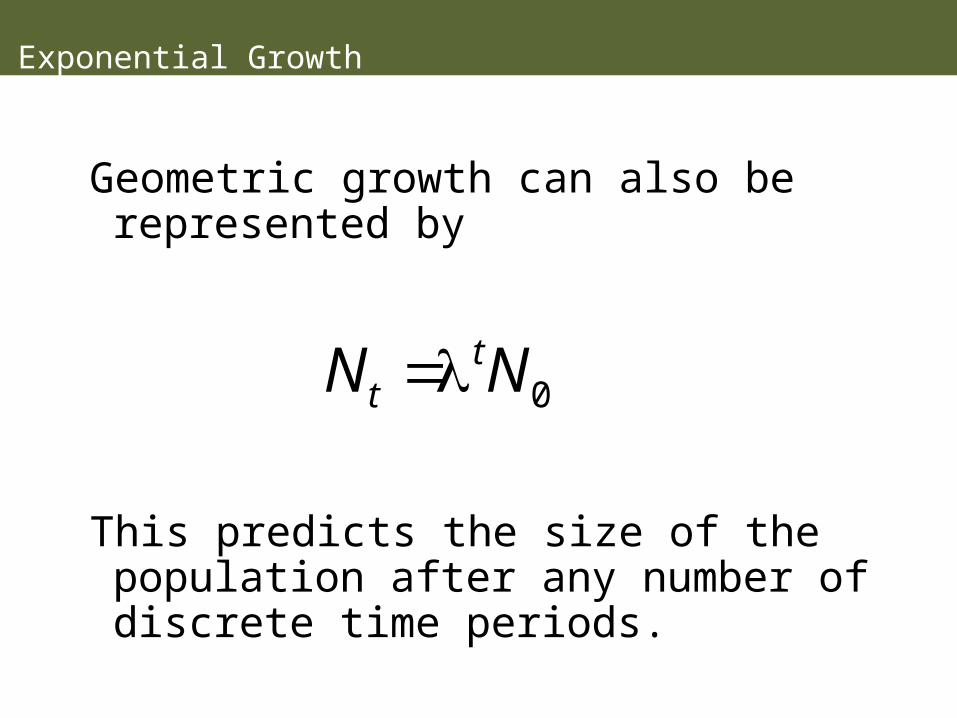
Geometric growth can also be represented by
This predicts the size of the population after any number of discrete time periods.
0NN tt
Exponential Growth
In many species, individuals do not reproduce at discrete time intervals, they reproduce continuously
The growth in these populations is exponential growth.
Exponential Growth
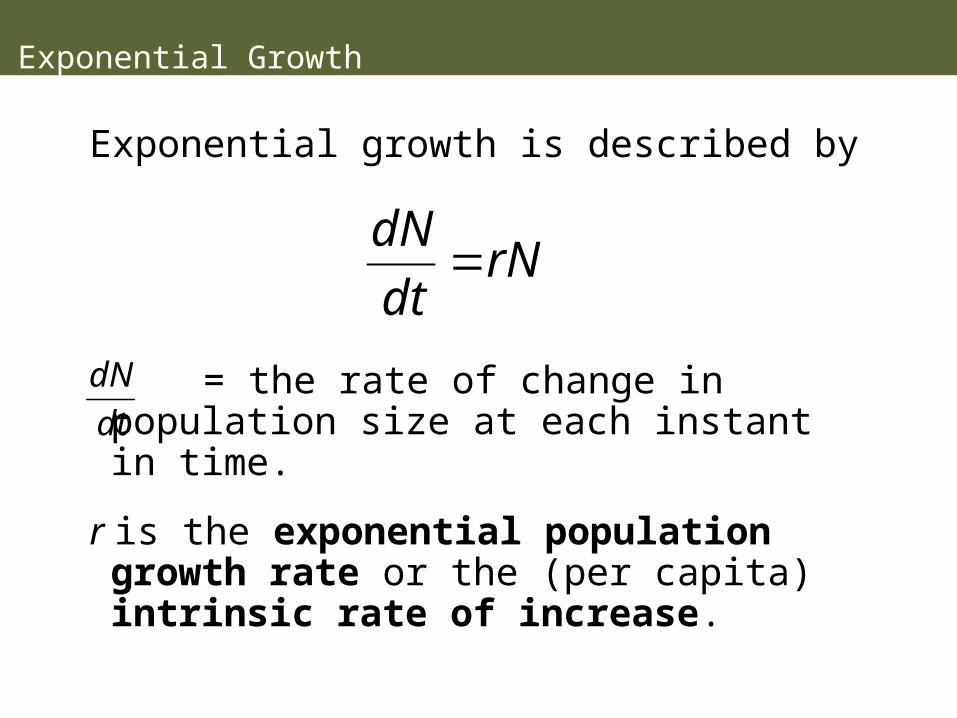
Exponential growth is described by
= the rate of change in population size at each instant in time.
r is the exponential population growth rate or the (per capita) intrinsic rate of increase.
rNdt
dN
dt
dN
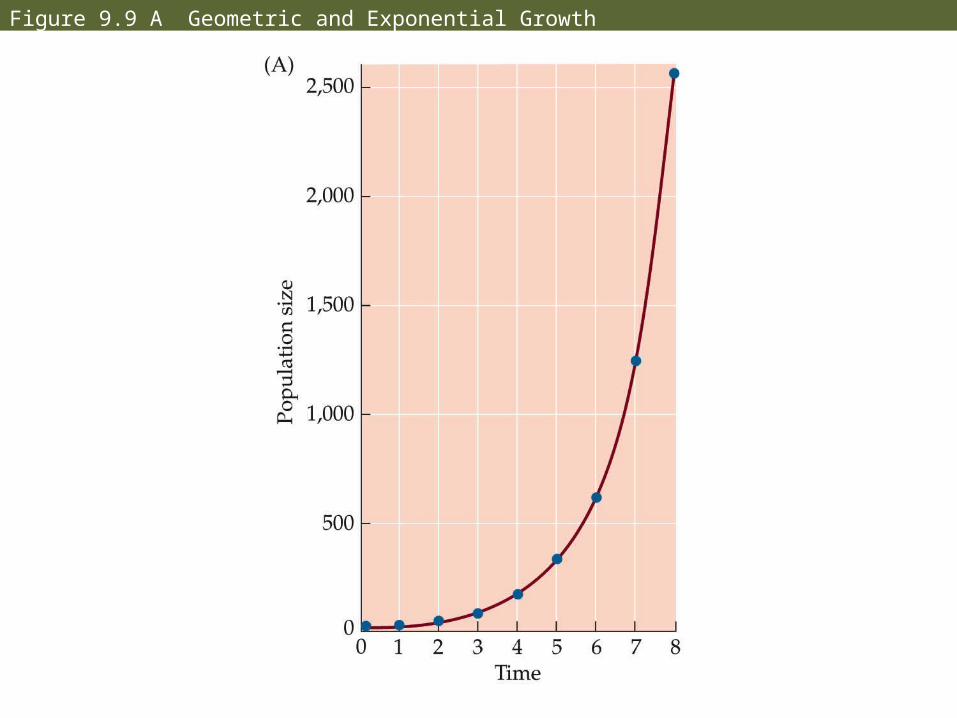
Figure 9.9 A Geometric and Exponential Growth
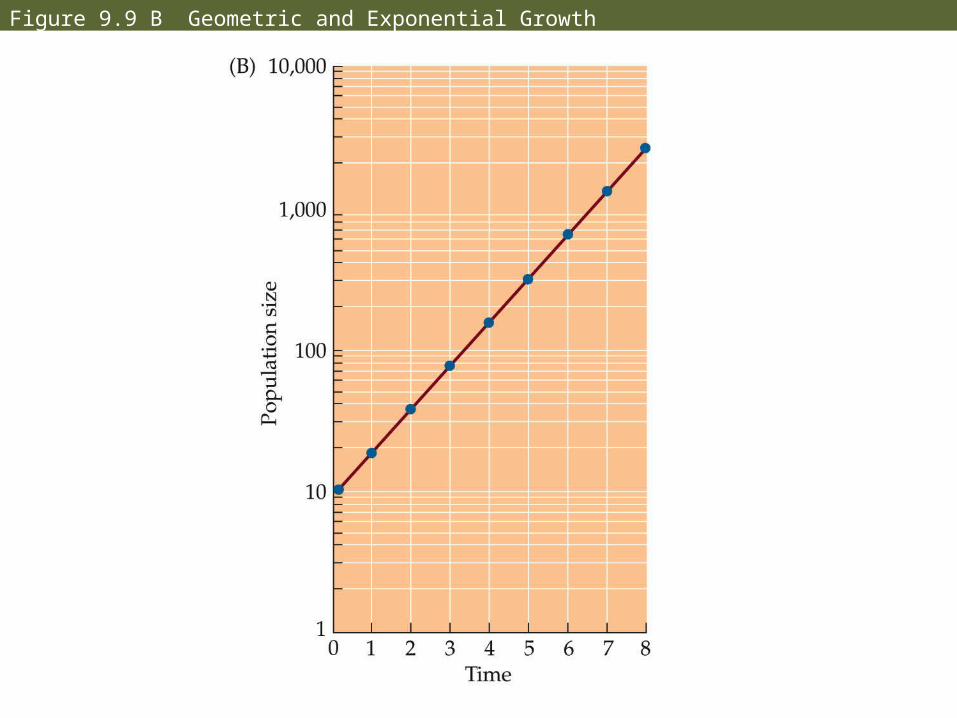
Figure 9.9 B Geometric and Exponential Growth
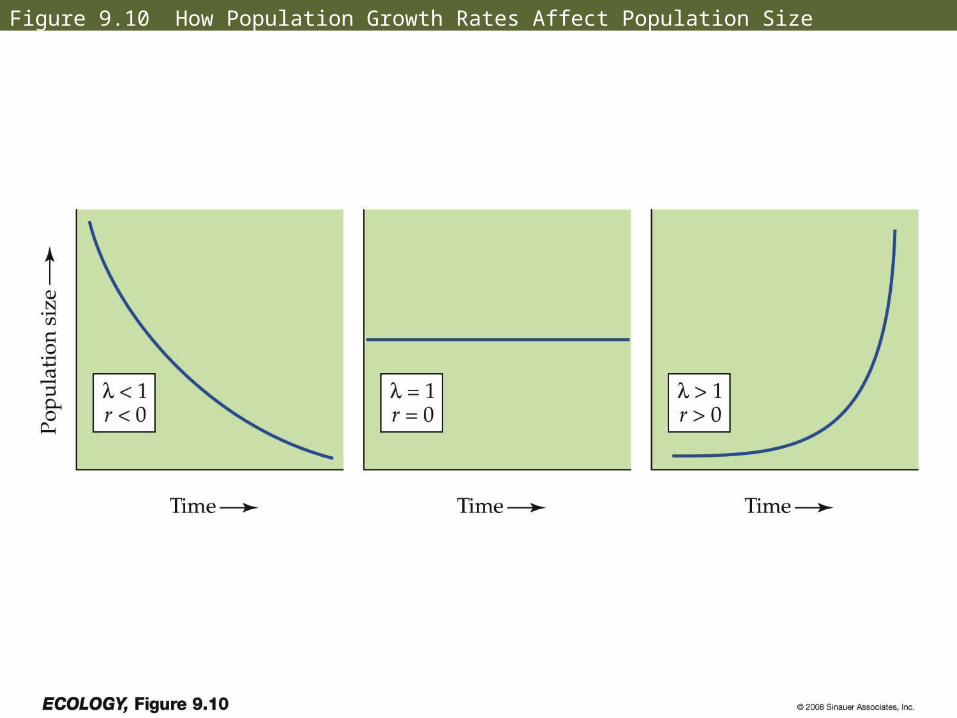
Figure 9.10 How Population Growth Rates Affect Population Size
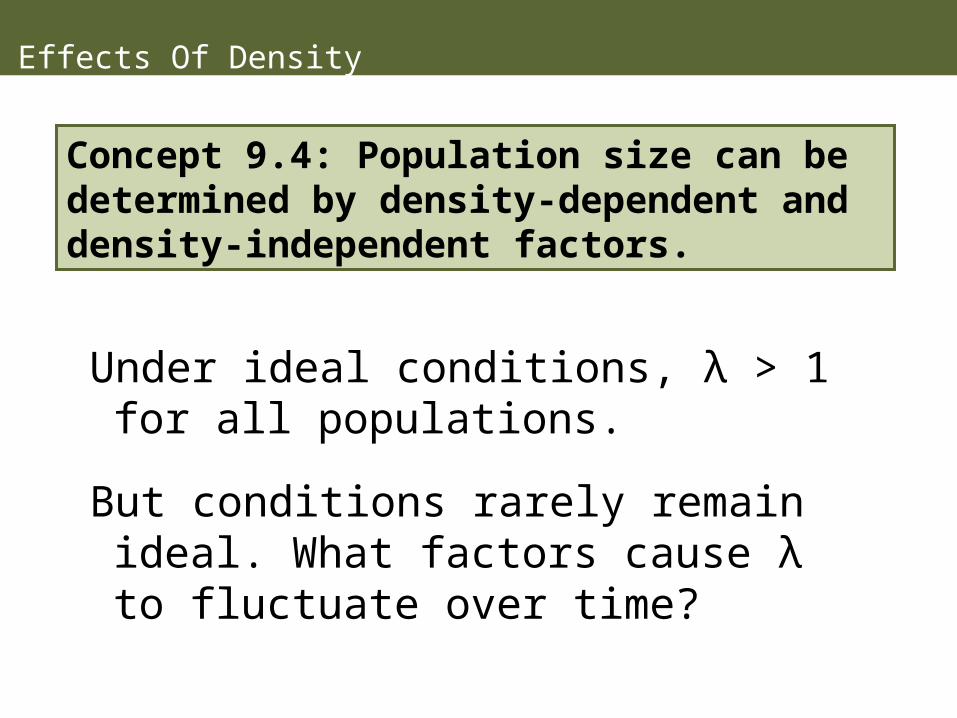
Effects Of Density
Under ideal conditions, λ > 1 for all populations.
But conditions rarely remain ideal. What factors cause λ to fluctuate over time?
Concept 9.4: Population size can be determined by density-dependent and density-independent factors.
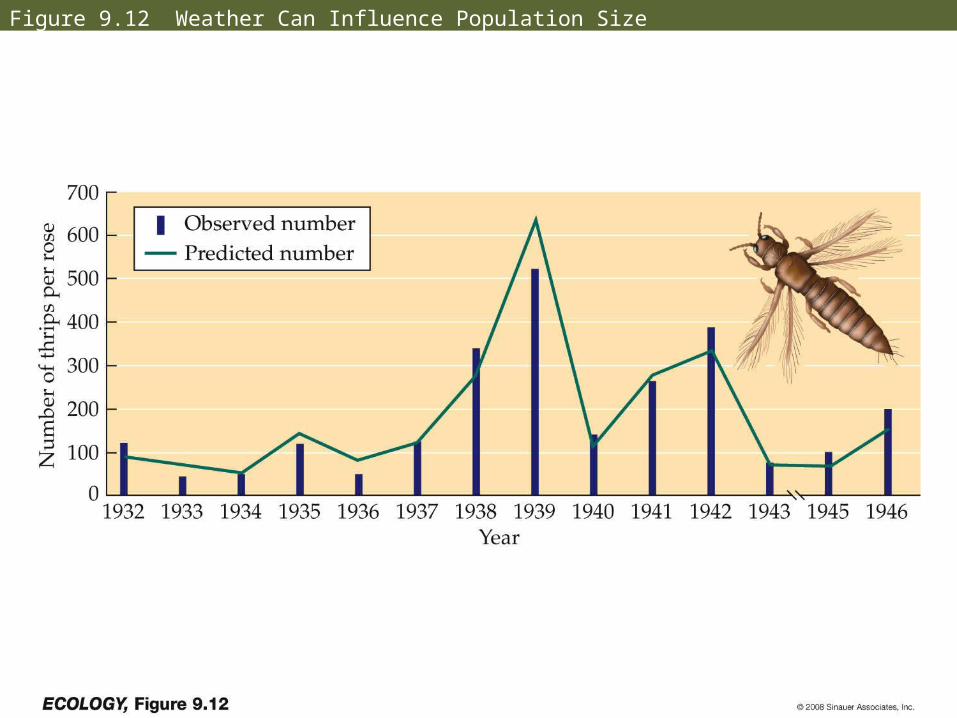
Figure 9.12 Weather Can Influence Population Size
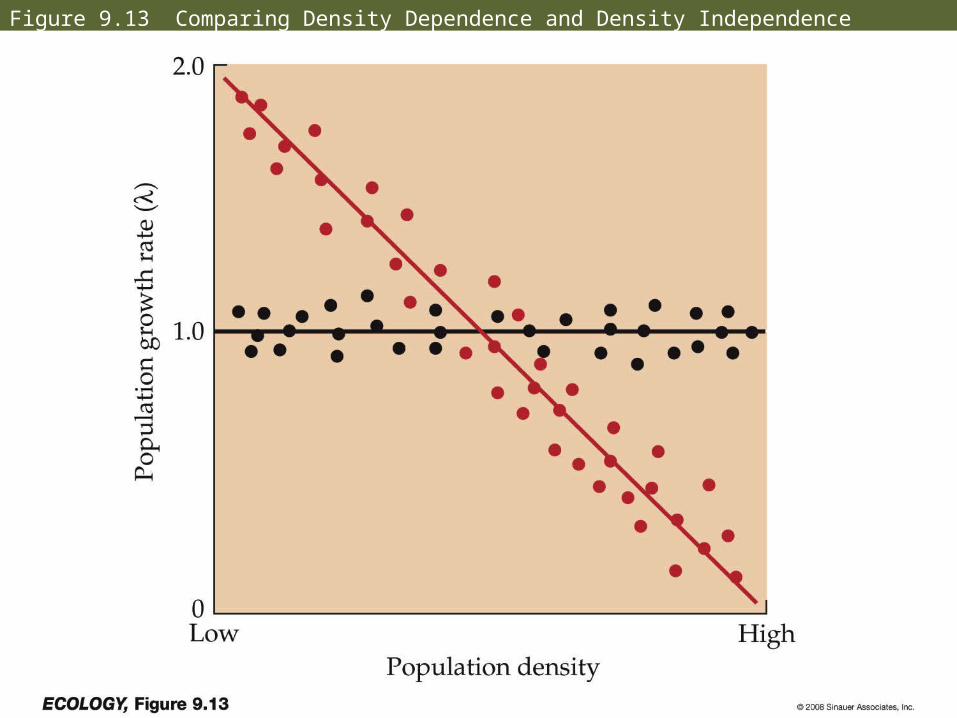
Figure 9.13 Comparing Density Dependence and Density Independence
Effects Of Density
In an experiment where eggs of the flour beetle Tribolium confusum were placed in glass tubes, death rates increased as the density of eggs increased.
Logistic Growth
Logistic growth: Population increases rapidly at first, then stabilizes at the carrying capacity (maximum population size that can be supported indefinitely by the environment).
Concept 9.5: The logistic equation incorporates limits to growth and shows how a population may stabilize at a maximum size, the carrying capacity.
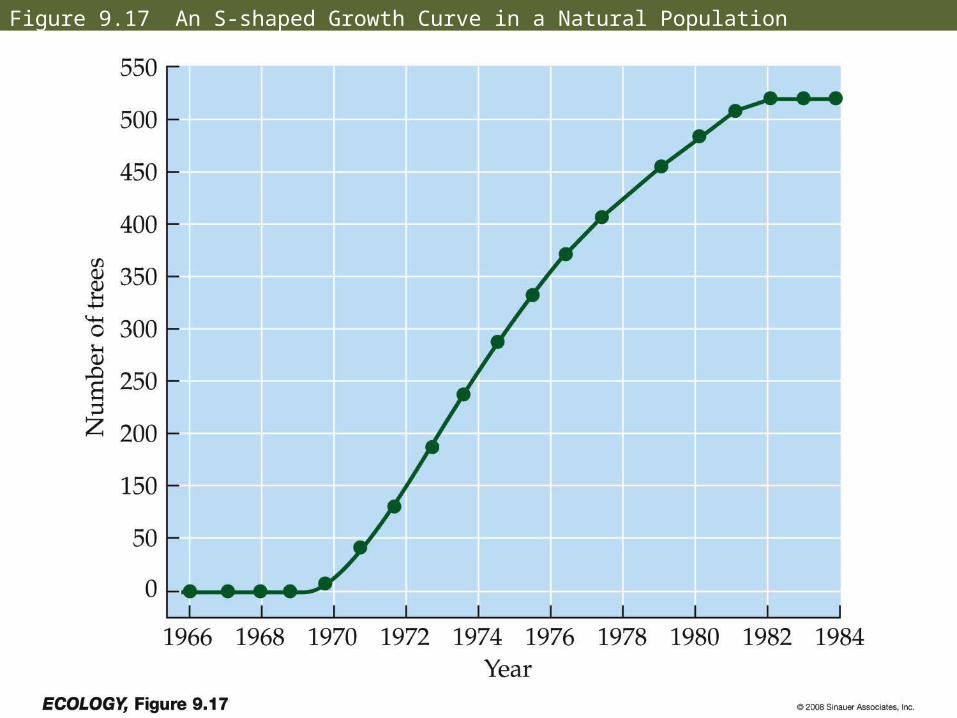
Figure 9.17 An S-shaped Growth Curve in a Natural Population
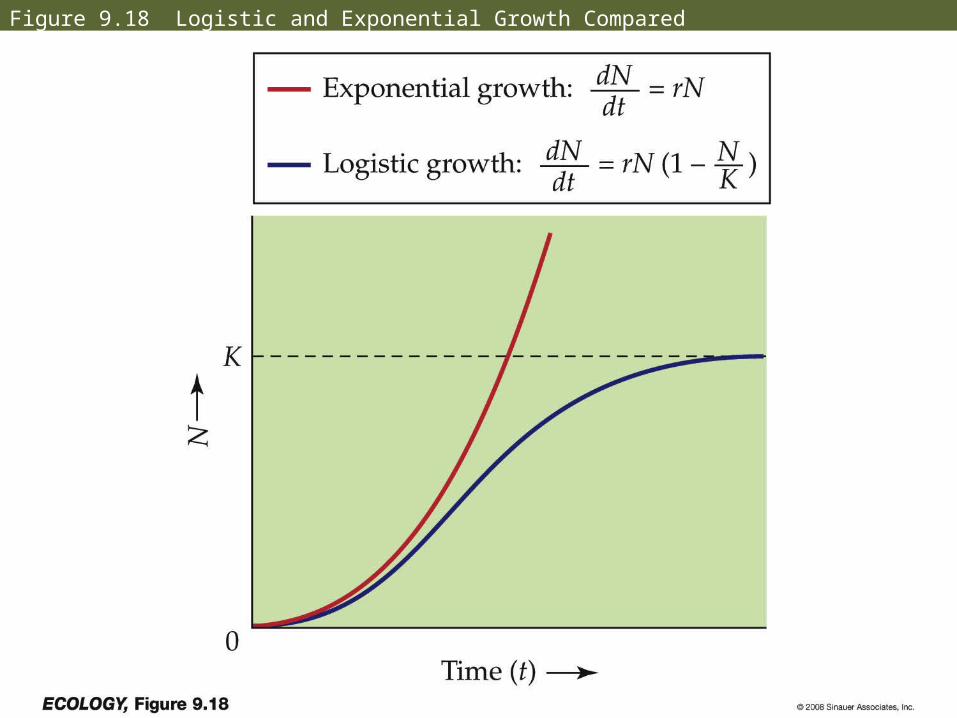
Figure 9.18 Logistic and Exponential Growth Compared
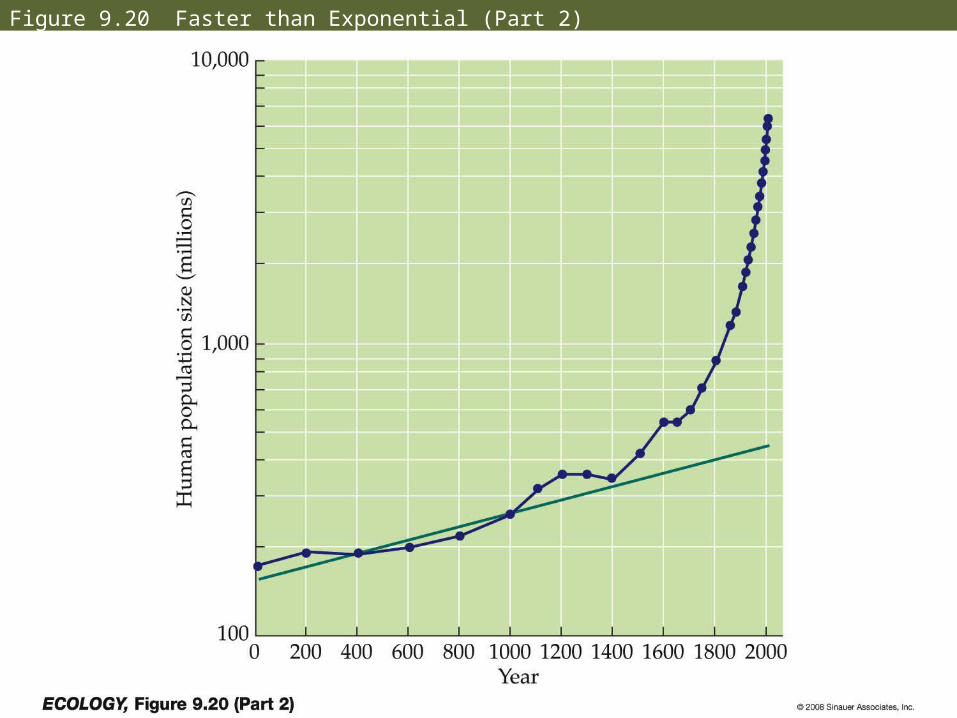
Figure 9.20 Faster than Exponential (Part 2)
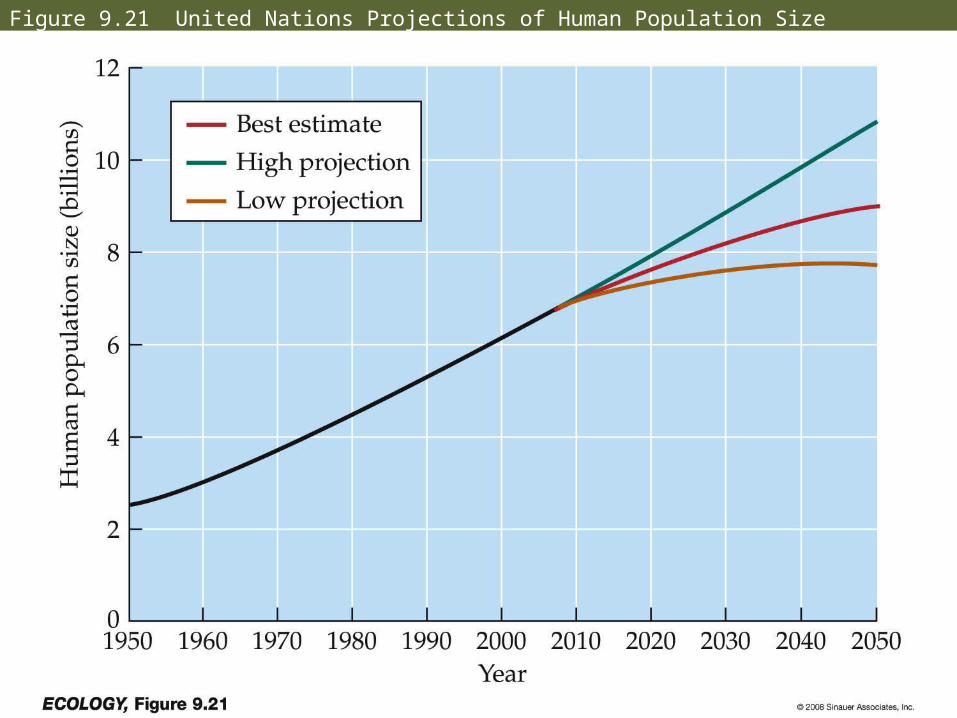
Figure 9.21 United Nations Projections of Human Population Size
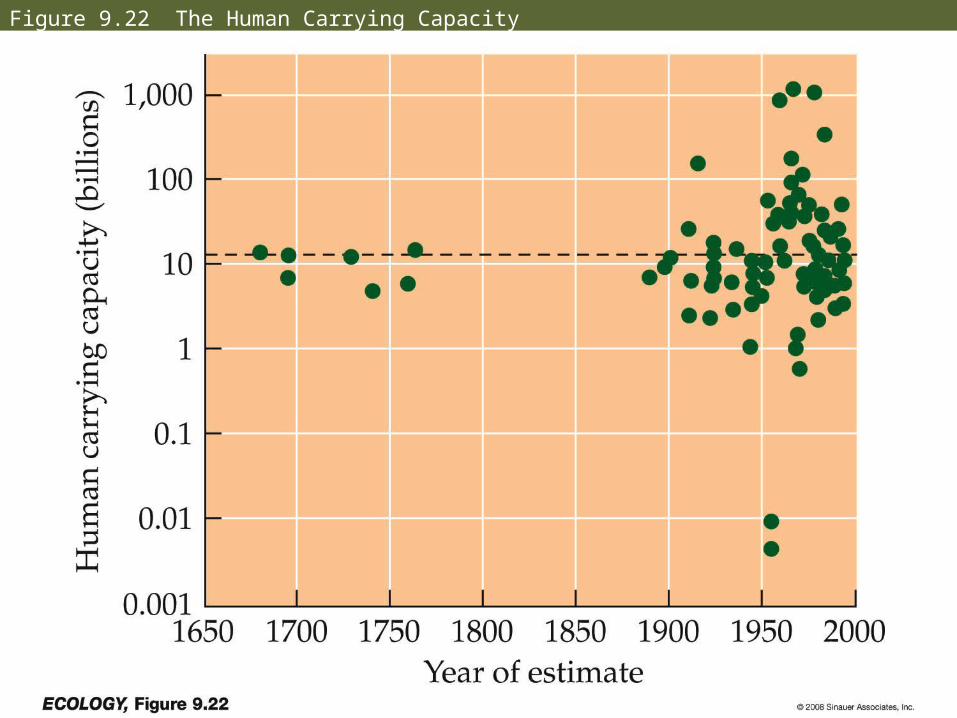
Figure 9.22 The Human Carrying Capacity
Connection in Nature: Your Ecological Footprint
The environmental impact of a population is called its ecological footprint.
Ultimately, every aspect of our economy depends on the ecosystems of Earth.
Connection in Nature: Your Ecological Footprint
The ecological footprint approach highlights the fact that all of our actions depend on and affect the natural world.
Find yours at
http://www.conservation.org/act/live_green/Pages/ecofootprint.aspx