Embed Size (px)
Citation preview
988043-OP
SAFE SECURING OF TRAILERS AND DECK CARGO
By: R.P. Dallinga
March 1994
RORO'94
SAFE SECURING OF TRAILERS AND DECK CARGO
By: R.P. Dallinga
March 1994
SAFE SECURING OF TRAILERS AND DECK CARGO
Ir. R.P. Dallinga, MARIN, Wageningen, The Netherlands
1. INTRODUCTION
Securing of trailers and deck cargo on board ro-ro vessels is an important aspect of good seamanship. Failure of lashings and subsequent shifting of cargo elements provide a serious safety hazard.
The paper investigates the loading of lashing gear on board Ro-Ro ships. First the nature of the lashing loads, with important effects of the lashing geometry is explored. Based on work by Andersson et.al [1982] a linear model, accounting for the mutuat phasing of the external loads, is derived. Secondly the external loads, with important effects of the position on the ship and the ship heading with respect to the waves, are discussed. Based on a typical wave climate the risk of lashing failure is quantified. For an interesting case the applicability of Standard lashing arrangements on board ships with increased stability characteristics is discussed. The applied calculation method as such is not an alternative for the existing rules and recommendations, like IMO (resolution A.581(14), 1985) or the recommendations at the UK Nautical Institute [Knott, 1985]. Using it in a comparative way it may be particularly useful in the evaluation of special transports or a comparison of alternative ships, ship arrangements or the climates prevailing on various ship routes.
2. CALCULATION METHOD
2.1. Introduction
Incidents due to seafastening problems on board roll-on roll-off ships lead to investigations to support the development of general rules. In the UK work was carried out on behalf of the Department of Transport [Turnbull, 1989], used in the UK Code of Practice [HMSO, 1991]. In Sweden Mariterm AB [Andersson, 1982] performed a study on behalf of a group of com-panies, institutes and governmental bodies.
Both studies address the problem of deriving seafastening loads from local acceleration levels. The general model treats the main body of the vehicle as a rigid structure supported and restrained by elements of various stiffness. Both studies conclude that technical problems are quite large. Complicating factors are:
* the fact that normally the number of variables exceeds the number of constraints (an ill-conditioned problem), which implies that the results are quite sensitive to the adjusted pre-tensions.
* the unknown stiffness of the various supports and restraints. In particular the stiffness of the wheel suspension and the tires.
* the non-linear characteristics of the restraints (dynamic behaviour with slack lashings, Coulomb type friction forces). Also these aspects make the results very sensitive to the adjusted pre-tension.
Both developments suggest the use of time-domain simulations to establish the dynamic loads as the only practical solution. These models are not readily available, nor can they easily be developed or applied.
1
Andersson [1982] recognized the limits of a complicated theoretical model and suggested a simpler approach to estimate the seafastening loads. This quasi-static approach neglects dynamic amplificatión effects. It is based on the identification of a number of relatively simple "failure modes" for which the lashing loads can readily be established. For the extemal loads assumptions regarding the mutual phasing of the various force components are made.
In the absence of a detailed and practical prediction tooi Andersson's relatively straightforward approach is quite attractive. In the present work it is slightty simplified by considering only two dimensions. This allows a full treatment in the frequency dom ai n, avoiding the undesirable assumptions regarding the mutual phasing of the extemal forces. This facilitates a direct evaluation of the risk of lashing failure by means of linear seakeeping theory and an accurate insight in the nature of the most unfavourable ship conditions (for instance the heading).
2.2. Extemal Loads
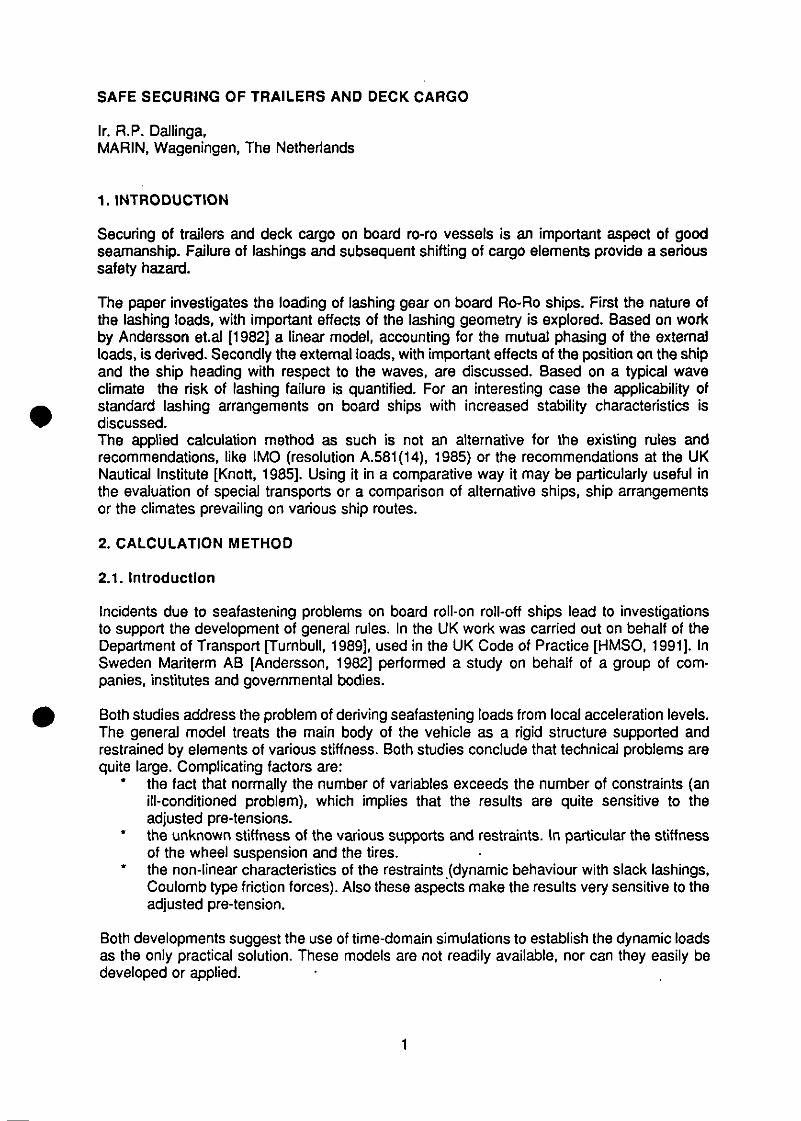
The problem considers the transverse loads experienced by a vehicle on board a ship in waves. Treating the loads in a ship-bound system of co-ordinates the loads in the transverse plane consist of a transverse force, a vertical force and a roll moment. The linear forces are governed by the local acceleration and the gravity component along the deck, the roll moment by the angular roll acceleration of the vessel. In terms of linear theory the loads are given by:
FY - m (yP +g 4) = m (ycoG - $ ZP + ¥ XP + 9 $)
F2 «m (zP +g)
= m (zCoG + * yp - ö xP +g) Mx = l x x $
in which CoG denotes the centre of gravity of the vessel, P the centre of gravity of the vehicle, xp , yp and zp the location of P forward, to port and above the CoG, and $, 6 and y as the angular motions roll, pitch and yaw. The weight of the vehicle G is the product of it's mass m and the acceleration of gravity g.
The above relations express the important effects of the height and the longitudinal positi-on on the local acceleration levels.
Fig. 1: Extemal Loads 2.3. Lashing Loads
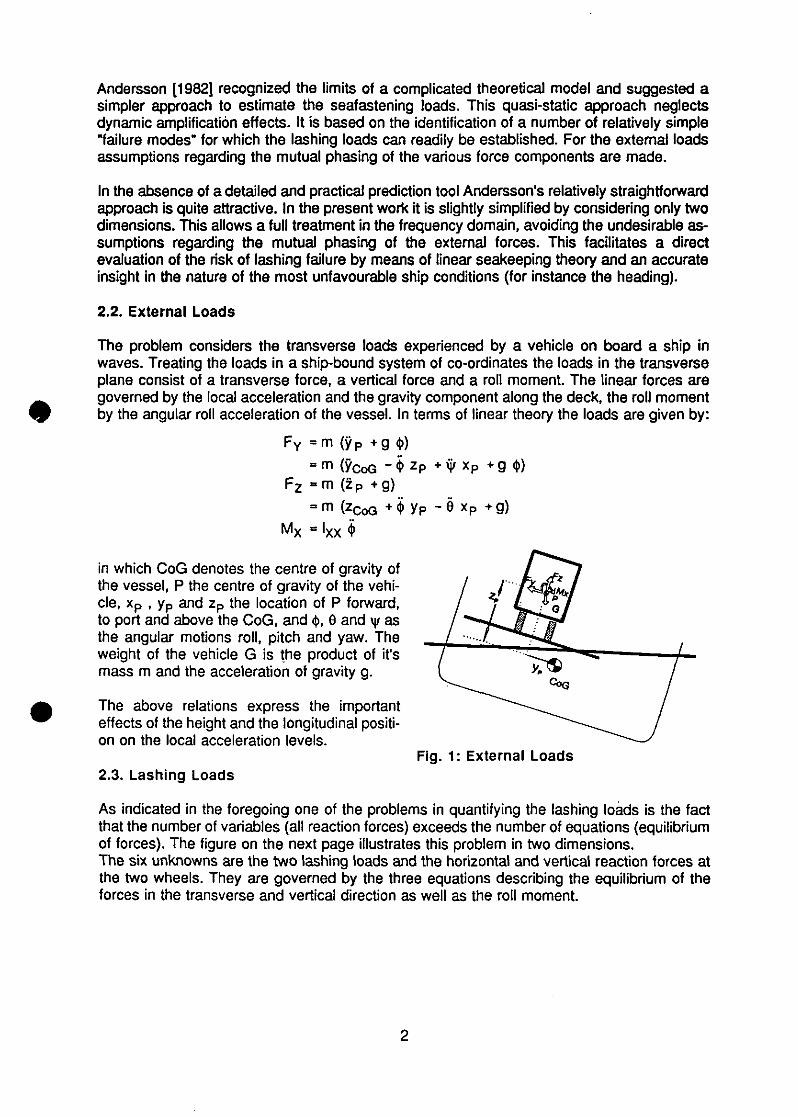
As indicated in the foregoing one of the problems in quantifying the lashing loads is the fact that the number of variables (all reaction forces) exceeds the number of equations (equilibrium of forces). The figure on the next page illustrates this problem in two dimensions. The six unknowns are the two lashing loads and the horizontal and vertical reaction forces at the two wheels. They are governed by the three equations describing the equilibrium of the forces in the transverse and vertical direction as well as the roll moment.
2
In order to reduce the problem to manageable proportions two quasi-static "failure" modes are introduced. Both modes assume that the vehicle including it's suspension can be treated as a rigid body, they also assume a certain degree of slack in the lashings, such that only the windward lashing will be considered. The "tipping" mode assumes that the friction is sufficiënt to make the "windward" support lose contact with the deck; the "sliding" mode assumes that the vehicle shifts along the deck.
Fig. 2: Lashing Loads
Tipping
In the tipping mode on wheel loses contact with the deck. The remaining forces in the tipping mode are outlined in Figure 3. Necessary conditions for the occurrence of the tipping mode are positive value for the tension and the vertical reaction at the remaining wheel. The conditions are non-exceedance of the available friction in the deck-wheel interface. The resulting lashing forces {see Fig. 7) become: Fig. 3: Tipping
T SB
H
V
PS
PS
d.Fv+ — . F 2 - M x y o
a.sin(cc) + Ü I 5 I .cos(a)
- d.Fy- L .F z + Mx
a.sin(a) + *e ' .cos(a)
d . F y + | . F 2 - M x
a.sin(a) + i i l H i .cos(a)
.sin(a) + Fy
.cos(a) - F.
Conditions for which the above expressions are valid are:
T S B > 0 V P S > 0
-p.VpS<HpS<u.VP S
with u being the friction coëfficiënt.
3
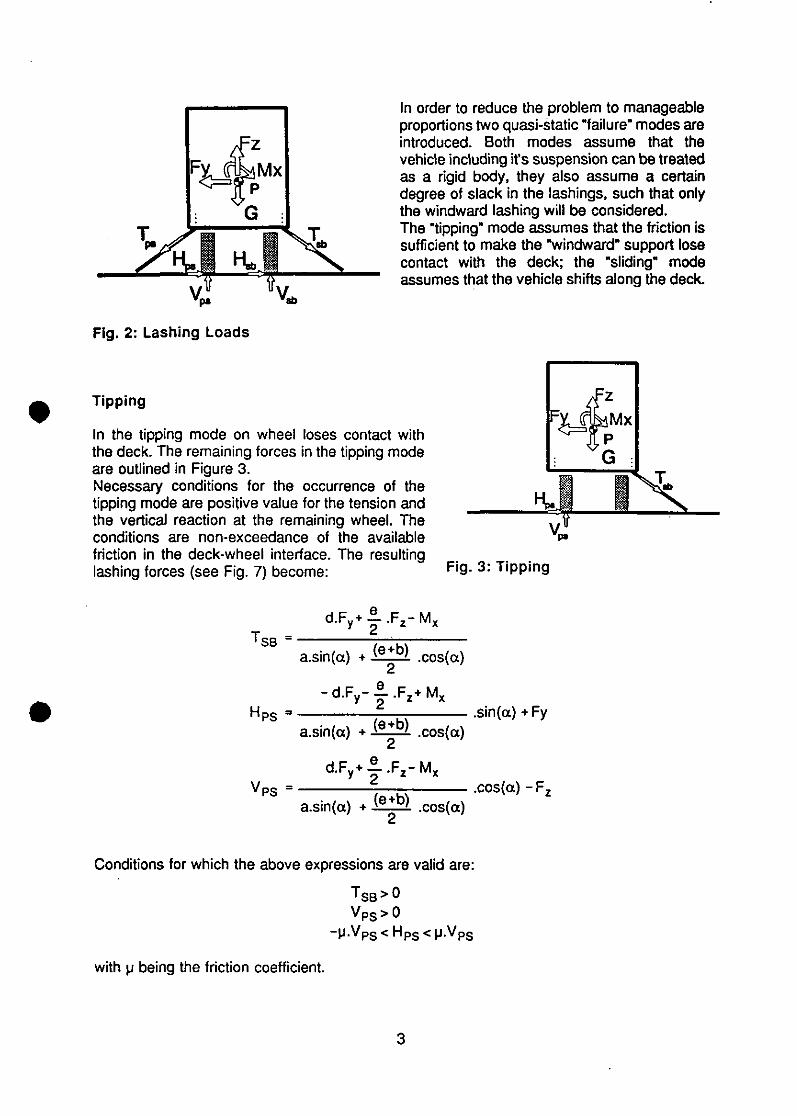
Neglecting the moment Mx the first condition reduces to the condition that the combined vector of the transverse and vertical force point outside the wheel base of the truck:
•y , e
-F. 2d
Sliding
In the sliding mode both wheels remain in contact with the deck. Both contribute to the horizontal reaction force being the product of the friction coëfficiënt and the vertical fore. Necessary conditions are positive reaction forces at both supports and a positive value of the tension.The tension becomes:
Fig. 4: Sliding
T Fv + u.F.
SB ~ TT _ ' y
Fv + u.F.
sin(cc) + u.cos(a)
1 r /d-a,
R -u.d+-l
VSB - j - E - < ^ ) - s i n ( a ) + ( ^ 1 ) . cos(a)].Fy
+ 1 H 1 . Pfosia)) (_p d+|,.Jiifa) 8 in (a ) ]>Fa
e H d H
*—.Mx e
-M.d-± VPS = 1 . [H~) • sln(a)-( R
2 ) . cos(o)].Fy
+ i [ + ( 1 . M ^ l a I ) . ( . M . d . e ) + ü ö .sin(a)].F2 e H c w
- 1 .M V
Assumptions underlying the sliding mode prevail as long as the tension and the two vertica] reactions remain positive.
T S B > 0 v S B > o v P S > o
4
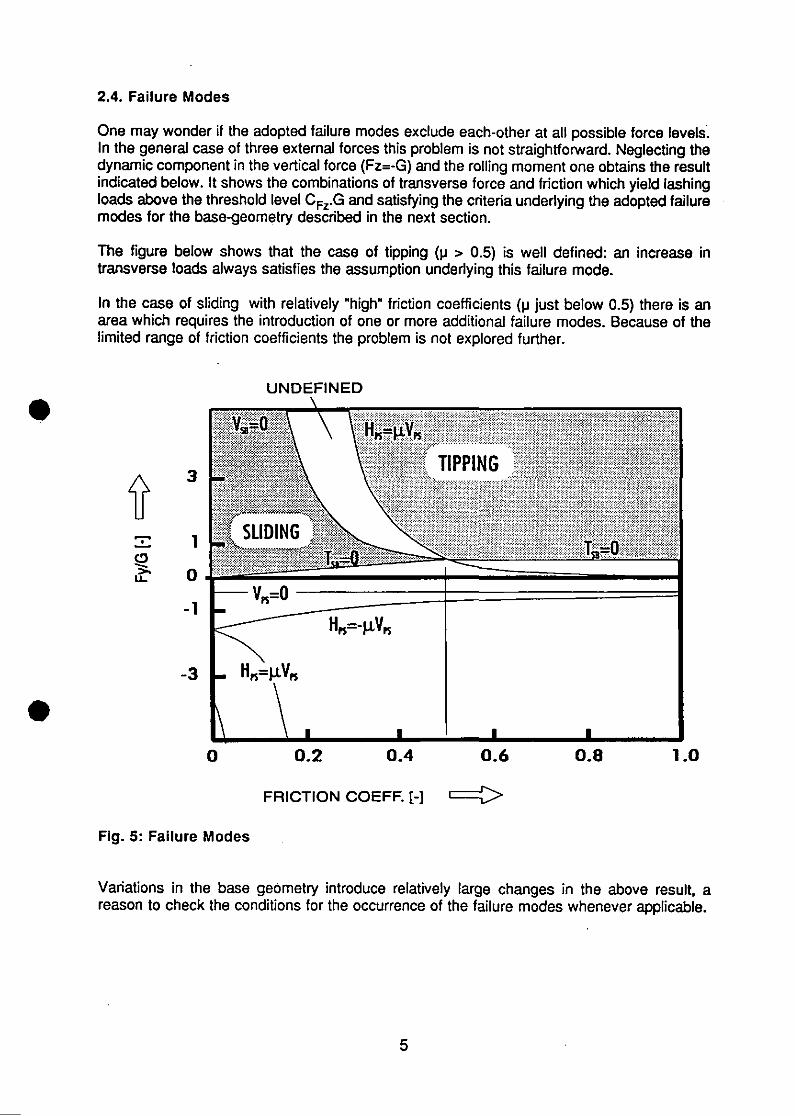
2.4. Failure Modes
One may wonder if the adopted failure modes exclude each-other at ali possible force levels. In the general case of three external forces thïs problem is not straightforward. Neglecting the dynamic component in the vertical force (Fz=-G) and the rolling moment one obtains the result indicated below. It shows the combinations of transverse force and friction which yield lashing loads above the threshold level CFz.G and satisfying the criteria underlying the adopted failure modes for the base-geometry described in the next sectïon.
The figure below shows that the case of tipping (u > 0.5) is well defined: an increase in transverse loads always satisfies the assumption underlying this failure mode.
In the case of sliding with relatively "high" friction coefficients (u just betow 0.5) there is an area which requires the introduction of one or more additional failure modes. Because of the limited range of friction coefficients the problem is not explored further.
UNDEFINED
0.2 0.4
FRICTION COEFF. [-]
1.0
Fig. 5: Failure Modes
Variations in the base geómetry introducé relatively large changes in the above result, a reason to check the conditions for the occurrence of the failure modes whenever applicable.
5
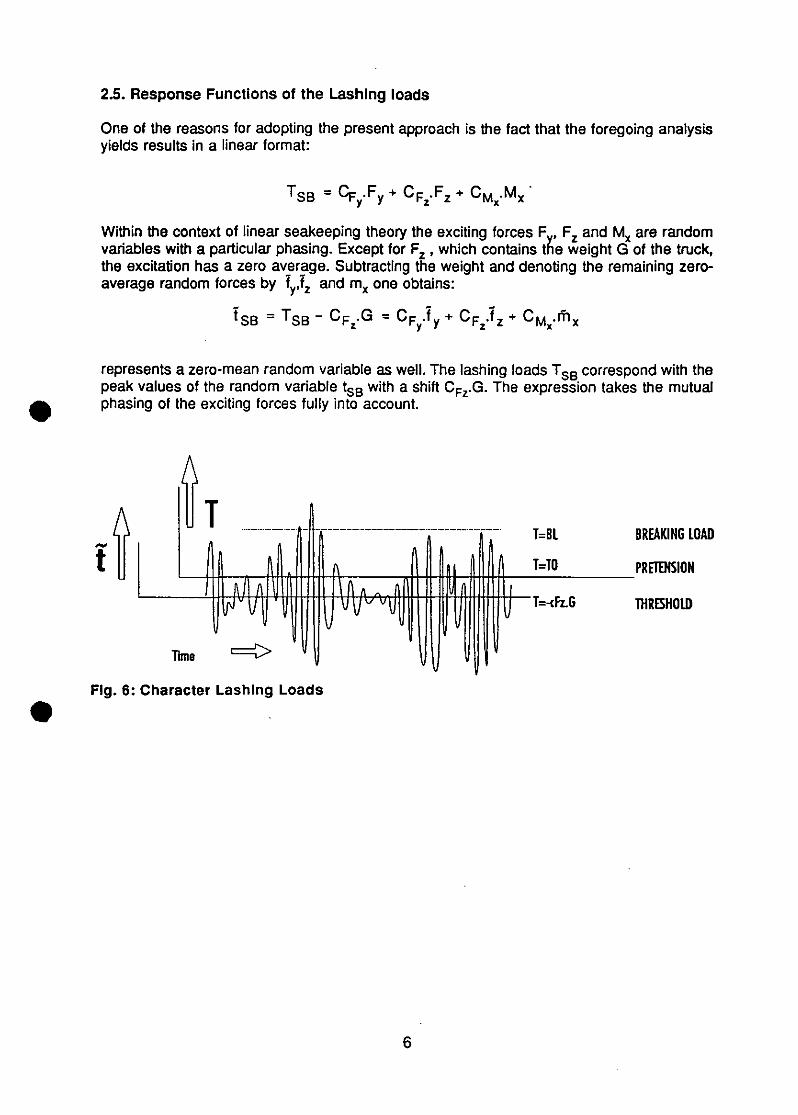
2.5. Response Functions of the Lashing loads
One of the reasons for adopting the present approach is the fact that the foregoing analysis yields results in a linear format:
TSB - p F y . F y + C F i . F 2 + C u . M , 'M,
Within the context of linear seakeeping theory the exciting forces Fy, Fz and Mx are random variables with a particular phasing. Except for Fz , which contains the weight G of the truck, the excitation has a zero average. Subtracting the weight and denoting the remaining zeroaverage random forces by fytf2 and mx one obtains:
= TOD - Cc .G = Cr -fu + Cc .f-* + e** .m SB - ' S B ' ^ F z - « = ^F/'y"*- ^F2 - 'z ^ ^ M x
represents a zero-mean random variable as well. The lashing loads TSB correspond with the peak values of the random variable tSB with a shift CFz.G. The expression takes the mutual phasing of the exciting forces fully into account.
BREAKING LOAD
PRETENSION
THRE5H0LD
Fig. 6: Character Lashing Loads
6
3. RESULTS
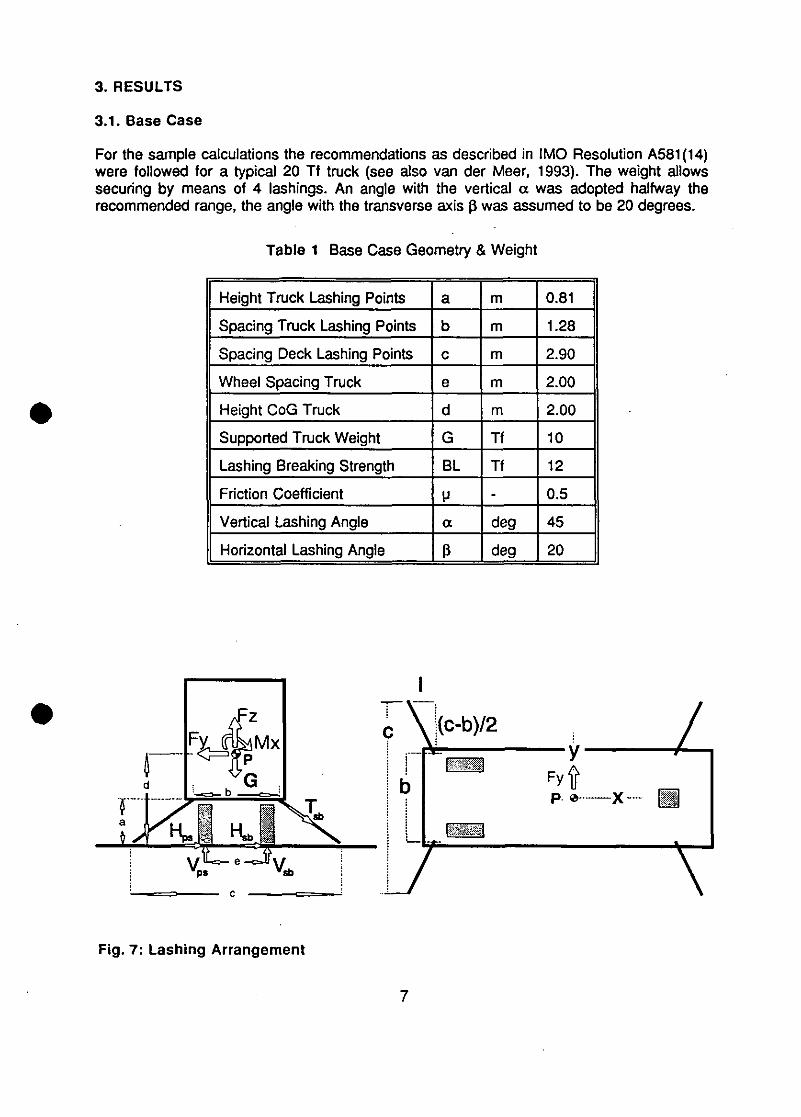
3.1. Base Case
For the sample calculations the recommendations as described in IMO Resolution A581(14) were foliowed for a typical 20 Tf truck (see also van der Meer, 1993). The weight aliows securing by means of 4 lashings. An angle with the vertical et was adopted halfway the recommended range, the angle with the transverse axis (3 was assumed to be 20 degrees.
Table 1 Base Case Geometry & Weight
Height Truck Lashing Points a m 0.81
Spacing Truck Lashing Points b m 1.28
Spacing Deck Lashing Points c m 2.90
Wheel Spacing Truck e m 2.00
Height CoG Truck d m 2.00
Supported Truck Weight G Tf 10
Lashing Breaking Strength BL Tf 12
Friction Coëfficiënt P - 0.5
Vertical Lashing Angle a deg 45
Horizontal Lashing Angle P deg 20
Fig. 7: Lashing Arrangement
7
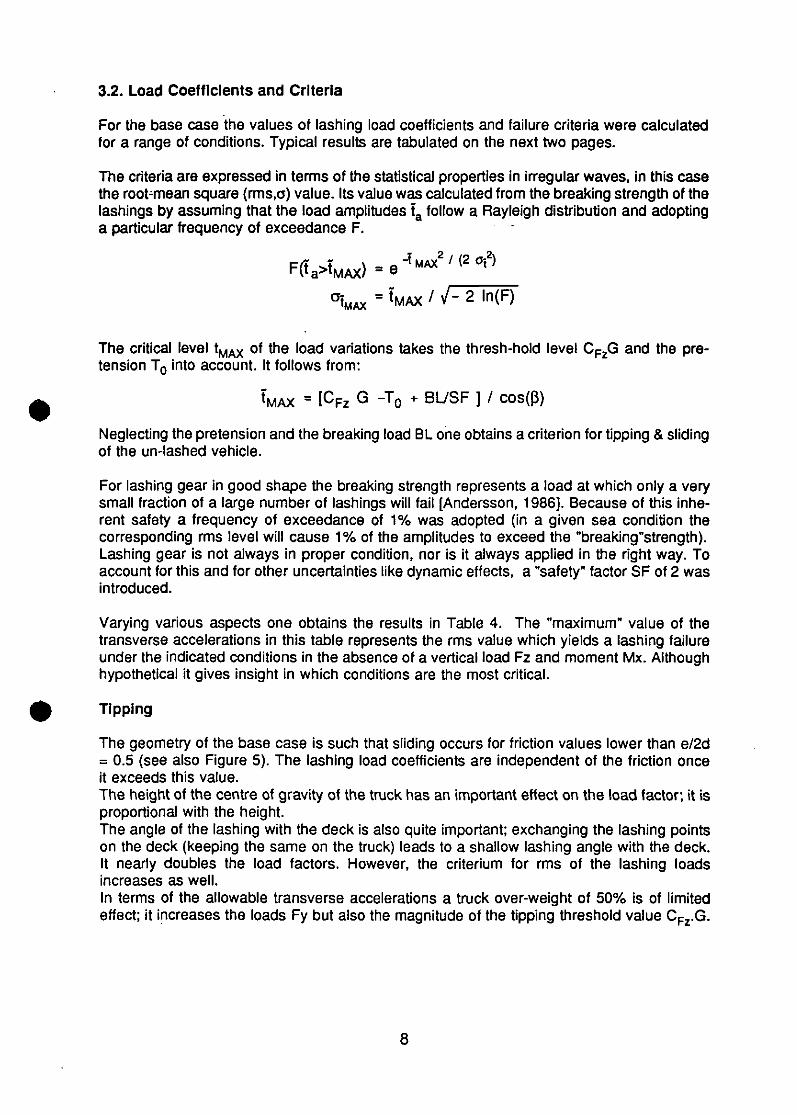
3.2. Load Coefftcients and Criteria
For the base case the values of lashing load coefficients and failure criteria were calculated for a range of conditions. Typical results are tabulated on the next two pages.
The criteria are expressed in terms of the statistical properties in irregular waves, in this case the root̂ mean square (rms,a) value. lts value was calculated from the breaking strength of the lashings by assuming that the load amplitudes ta follow a Rayleigh distribution and adopting a particular frequency of exceedance F.
F ( t a > t M A x ) = e - ? - 2 / < 2 ^
% A * • W / • " 2 ln(F)
The critical level tMAX of the load variations takes the thresh-hold level CF2G and the pre-tension T0 into account. It follows from:
W - [CFz Q -T0 + BL7SF ] / cos(P)
Neglecting the pretension and the breaking load Bl_ one obtains a criterion for tipping & sliding of the un-lashed vehicle.
For lashing gear in good shape the breaking strength represents a load at which only a very small fraction of a large number of lashings will fail [Andersson, 1986]. Because of this inherent safety a frequency of exceedance of 1% was adopted (in a given sea condition the corresponding rms level will cause 1% of the amplitudes to exceed the "breaking"strength). Lashing gear is not always in proper condition, nor is it always applied in the right way. To account for this and for other uncertainties like dynamic effects, a "safety" factor SF of 2 was introduced.
Varying various aspects one obtains the results in Table 4. The "maximum" value of the transverse acceierations in this table represents the rms value which yields a lashing failure under the indicated conditions in the absence of a vertical load Fz and moment Mx. Although hypothetical it gives insight in which conditions are the most critical.
Tipping
The geometry of the base case is such that sliding occurs for friction values lower than e/2d = 0.5 (see also Figure 5). The lashing load coefficients are independent of the friction once it exceeds this value. The height of the centre of gravity of the truck has an important effect on the load factor; it is proportional with the height. The angle of the lashing with the deck is also quite important; exchanging the lashing points on the deck (keeping the same on the truck) leads to a shallow lashing angle with the deck. It nearly doubles the load factors. However, the criterium for rms of the lashing loads increases as well. In terms of the allowable transverse acceierations a truck over-weight of 50% is of limited effect; it increases the loads Fy but also the magnitude of the tipping threshold value CFz.G.
8
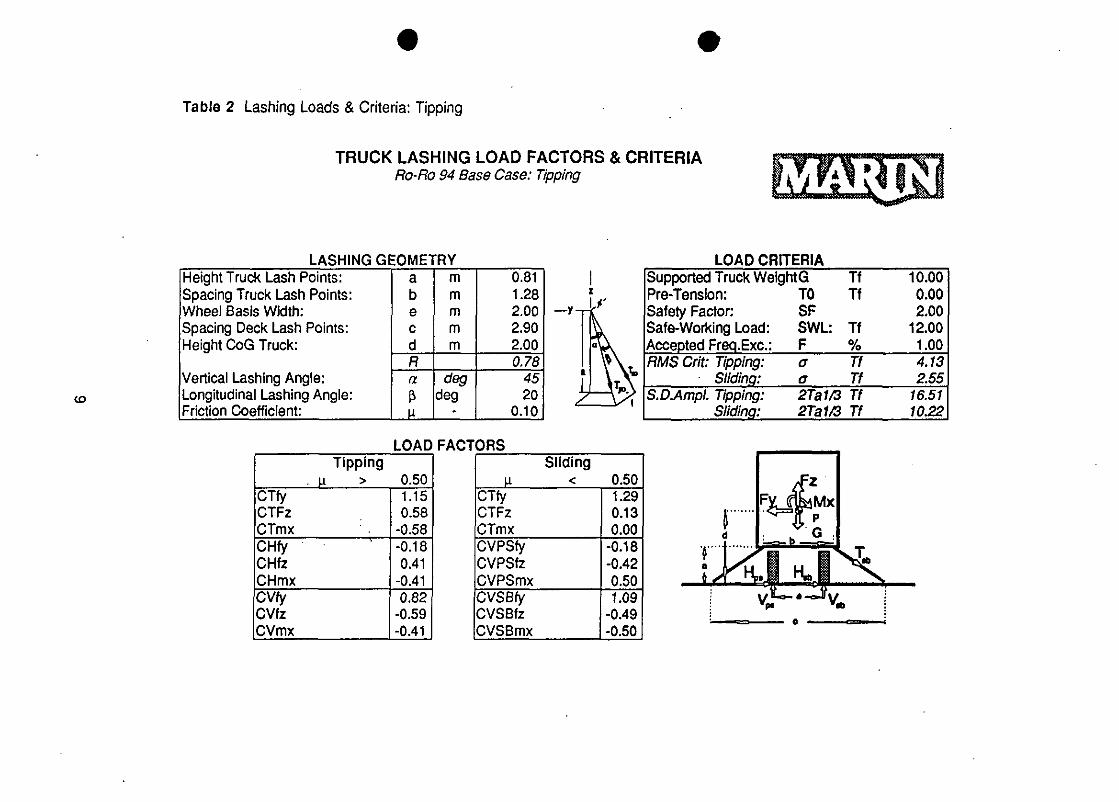
Table 2 Lashing Loads & Criteria: Tipping
TRUCK LASHING LOAD FACTORS & CRITERIA Ro-Ro 94 Base Case: Tipping
LASHING GEOMETRY LOAD CRITERIA Height Truck Lash Points: Spacing Truck Lash Points: Wheel Basis Width: Spacing Deck Lash Points: Height CoG Truck:
Vertical Lashing Angle: Longitudinal Lashing Angle: Friction Coëfficiënt:
a b e c d
m m m m m
0.81 1.28 2.00 2.90 2.00
Height Truck Lash Points: Spacing Truck Lash Points: Wheel Basis Width: Spacing Deck Lash Points: Height CoG Truck:
Vertical Lashing Angle: Longitudinal Lashing Angle: Friction Coëfficiënt:
R 0.78
Height Truck Lash Points: Spacing Truck Lash Points: Wheel Basis Width: Spacing Deck Lash Points: Height CoG Truck:
Vertical Lashing Angle: Longitudinal Lashing Angle: Friction Coëfficiënt:
(X deg deg
45 20
0.10
Supported Truck WeightG Tf 10.00 Pre-Tension: T0 Tf 0.00 Safety Factor: SF 2.00 Safe-Working Load: SWL: Tf 12.00 Accepted Freq.Exc: F % 1.00 RMS Crit: Tipping: o Tf 4.13
Sliding: a Tf 2.55 S.DAmpl. Tipping: 2Ta1/3 Tf 16.51
Slidinp: 2Ta1/3 Tf 10.22
LOAD FACTORS Tipping
. u > 0.50 CTfy CTFz CTmx
1.15 0.58
-0.58 CHfy CHfz CHmx
-0.18 0.41
-0.41 CVfy CVfz CVmx
0.82 -0.59 -0.41
Sliding H < 0.50
CTfy CTFz CTmx
1.29 0.13 0.00
CVPSfy CVPSfz CVPSmx
-0.18 -0.42 0.50
CVSBfy CVSBfz CVSBmx
1.09 -0.49 -0.50
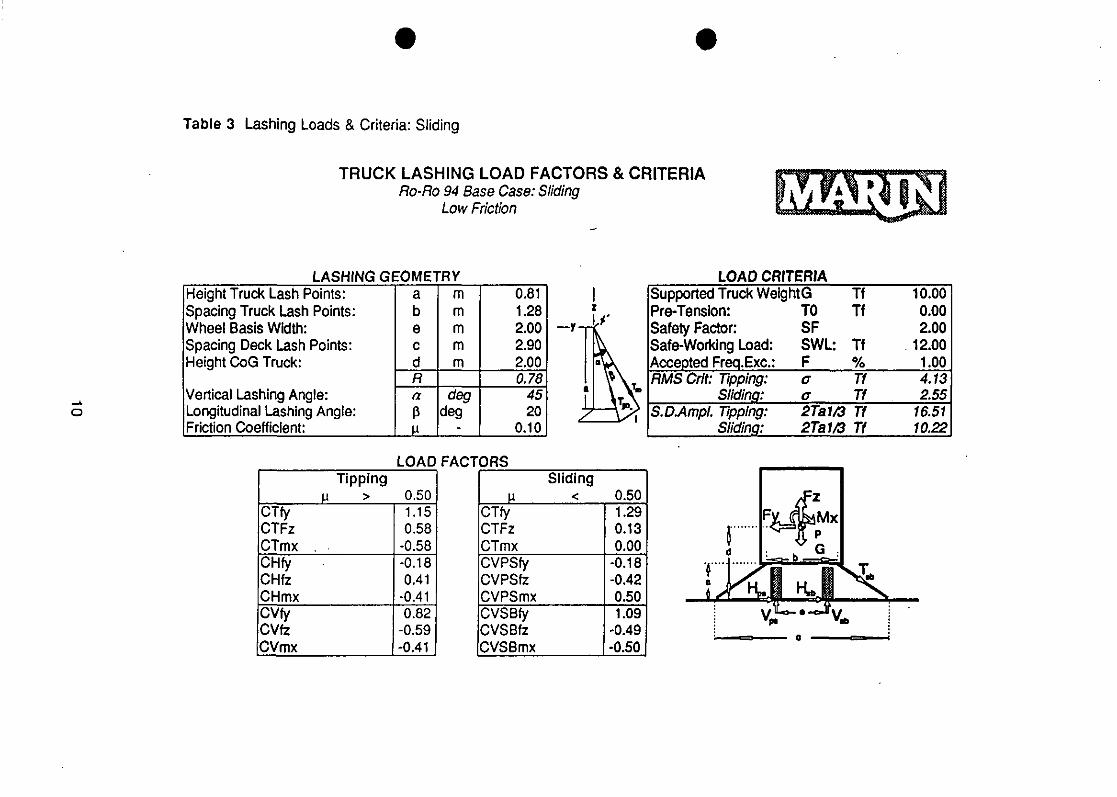
Table 3 Lashing Loads & Criteria: Sliding
TRUCK LASHING LOAD FACTORS & CRITERIA Ro-Ro 94 Base Case: Sliding
Low Friction
LASHING GEOME1 FRY Height Truck Lash Points: Spacing Truck Lash Points: Wheel Basis Width: Spacing Deck Lash Points: Height CoG Truck:
Vertical Lashing Angle: Longitudinal Lashing Angle: Friction Coëfficiënt:
a b e c d
E E
E E
E
0.81 1.28 2.00 2.90 2.00
Height Truck Lash Points: Spacing Truck Lash Points: Wheel Basis Width: Spacing Deck Lash Points: Height CoG Truck:
Vertical Lashing Angle: Longitudinal Lashing Angle: Friction Coëfficiënt:
R 0.78
Height Truck Lash Points: Spacing Truck Lash Points: Wheel Basis Width: Spacing Deck Lash Points: Height CoG Truck:
Vertical Lashing Angle: Longitudinal Lashing Angle: Friction Coëfficiënt:
a deg deg
45 20
0.10
LOAD CRITERIA Supported Truck WeightG Tf 10.00 Pre-Tenslon: T0 Tf 0.00 Safety Factor: SF 2.00 Safe-Working Load: SWL: Tf 12.00 Accepted Freq.Exc: F % 1.00 RMS Crit: Tipping: o Tf 4.13
Slidinp: G Tf 2.55 S.DAmpl. Tipping: 2Ta1/3 Tf 16.51
Slidinp: 2Ta1/3 Tf 10.22
LOAD FACTORS Tipping
JJ > 0.50 CTfy CTFz CTmx .
1.15 0.58
-0.58 CHfy CHfz CHmx
-0.18 0.41
-0.41 CVfy CVfz CVmx
0.82 -0.59 -0.41
Sliding M < 0.50
CTfy CTFz CTmx
1.29 0.13 0.00
CVPSfy CVPSfz CVPSmx
-0.18 -0.42 0.50
CVSBfy CVSBfz CVSBmx
1.09 -0.49 -0.50
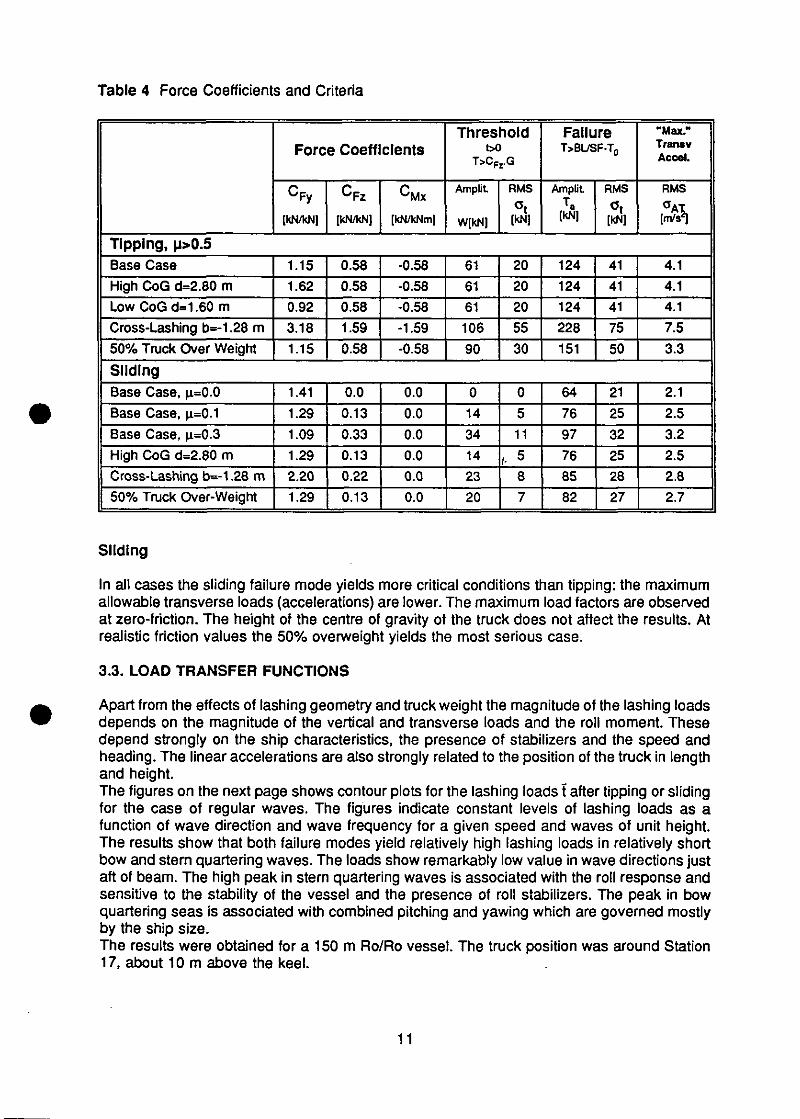
Table 4 Force Coefficients and Criteria
Force Coefficients Threshold
t>0 T>CF rG
Fallure T>BUSF-T0
"Max." Transv Accel.
C F y
[kN/kN] [kN/kN] [kN/kNm]
Amplit
W[kNJ
RMS
[kN]
Amplit
[kNl
RMS
[kN]
RMS
[m/s2]
Tipping, p>0.5 Base Case 1.15 0.58 -0.58 61 20 124 41 4.1
High CoG d=2.80 m 1.62 0.58 -0.58 61 20 124 41 4.1
Low CoGd»1.60 m 0.92 0.58 -0.58 61 20 124 41 4.1
Cross-Lashing b=-1.28 m 3.18 1.59 -1.59 106 55 228 75 7.5
50% Truck Over Weight 1.15 0.58 -0.58 90 30 151 50 3.3
Sliding Base Case, |i=0.0 1.41 0.0 0.0 0 0 64 21 2.1
Base Case, p.=0.1 1.29 0.13 0.0 14 5 76 25 2.5
Base Case, |i=0.3 1.09 0.33 0.0 34 11 97 32 3.2
High CoG d=2.80 m 1.29 0.13 0.0 14 /• 5 76 25 2.5
Cross-Lashing b=-1.28 m 2.20 0.22 0.0 23 8 85 28 2.8
50% Truck Over-Weight 1.29 0.13 0.0 20 7 82 27 2.7
Sliding
In all cases the sliding failure mode yields more critical conditions than tipping: the maximum allowabte transverse loads (accelerations) are iower. The maximum load factors are observed at zero-friction. The height of the centre of gravity of the truck does not affect the results. At realistic friction values the 50% overweight yields the most serious case.
3.3. LOAD TRANSFER FUNCTIONS
Apart from the effects of lashing geometry and truck weight the magnitude of the lashing loads depends on the magnitude of the vertical and transverse loads and the roll moment. These depend strongly on the ship characteristics, the presence of stabilizers and the speed and heading. The linear accelerations are also strongly related to the position of the truck in length and height. The figures on the next page shows contour plots for the lashing loads t after tipping or sliding for the case of regular waves. The figures indicate constant levels of lashing loads as a function of wave direction and wave frequency for a given speed and waves of unit height. The results show that both failure modes yield relatively high lashing loads in relatively short bow and stern quartenng waves. The loads show remarkably low value in wave directions just aft of beam. The high peak in stem quartering waves is associated with the roll response and sensitive to the stability of the vessel and the presence of roll stabilizers. The peak in bow quartering seas is associated with combined pitching and yawing which are governed mostly by the ship size. The results were obtained for a 150 m Ro/Ro vessel. The truck position was around Station 17, about 10 m above the keel.
11
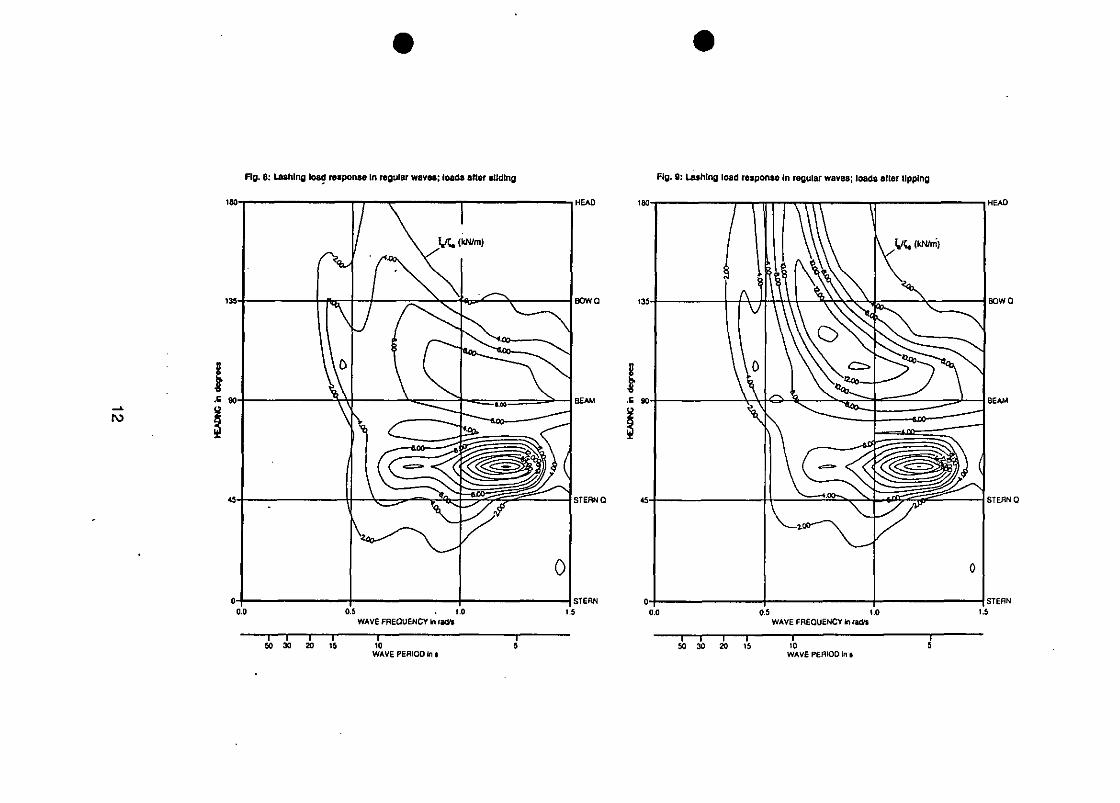
Rg. 8: Laahlng load response In regular waves; loads aftor sllding
ro
HEAD
0.0 OS . 1.0 WAVE FBEOUENCY In rac»
n—i—i—r 50 30 20 15
10 WAVE PEflIOD In I
BOWQ
BE AM
STERNQ
STERN
1.5
Fig. 9: Lasrtlng load response In regular wavea; loada alïer llpplng
1B0 I I i il I ] t I i | • i T I HEAD
0.5 1-0 WAVE FREQUENCY kt rad/s
n—i—i r 50 30 20 15
BOWQ
BEAM
STERN Q
STERN
to WAVE PEHIOD in •
3.4. Risk of failure
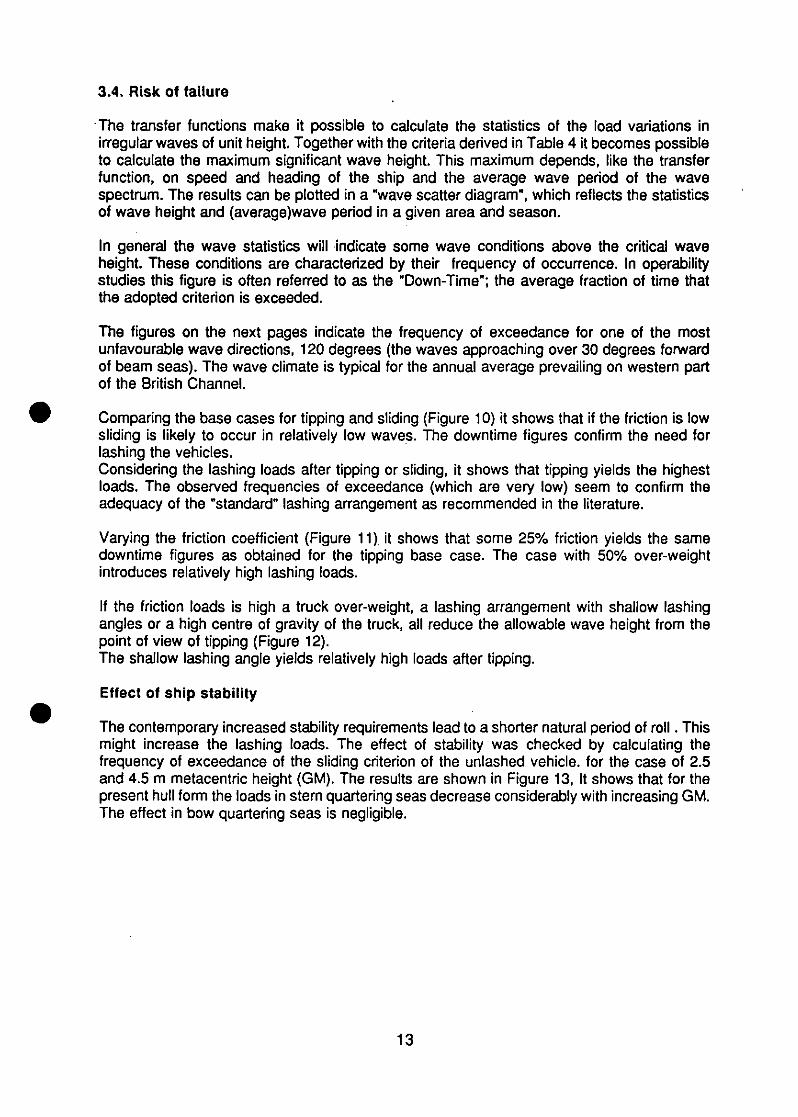
The transfer functions make it possible to calculate the statistics of the load variations in irregular waves of unit height. Together with the criteria derived in Table 4 it becomes possible to calculate the maximum significant wave height. This maximum depends, like the transfer function, on speed and heading of the ship and the average wave period of the wave spectrum. The results can be plotted in a "wave scatter diagram", which reflects the statistics of wave height and (average)wave period in a given area and season.
In general the wave statistics will indicate some wave conditions above the critica! wave height. These conditions are characterized by their frequency of occurrence. In operability studies this figure is often referred to as the "Down-Time"; the average fraction of time that the adopted criterion is exceeded.
The figures on the next pages indicate the frequency of exceedance for one of the most unfavourable wave directions, 120 degrees (the waves approaching over 30 degrees forward of beam seas). The wave climate is typical for the annual average prevailing on western part of the British Channel.
Comparing the base cases for tipping and sliding (Figure 10) it shows that if the friction is low sliding is likely to occur in relatively low waves. The downtime figures confirm the need for lashing the vehicles. Considering the lashing loads after tipping or sliding, it shows that tipping yields the highest loads. The observed frequencies of exceedance (which are very low) seem to confirm the adequacy of the "Standard" lashing arrangement as recommended in the literature.
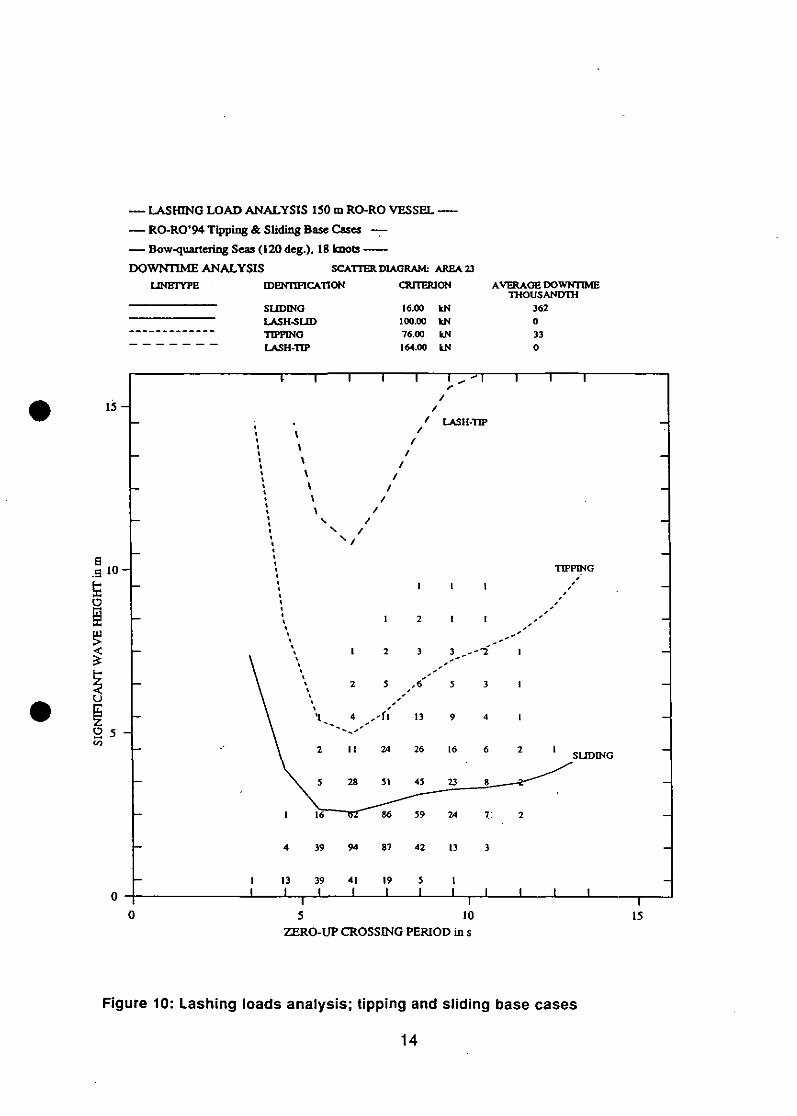
Varying the friction coëfficiënt (Figure 11) it shows that some 25% friction yields the same downtime figures as obtained for the tipping base case. The case with 50% over-weight introduces relatively high lashing loads.
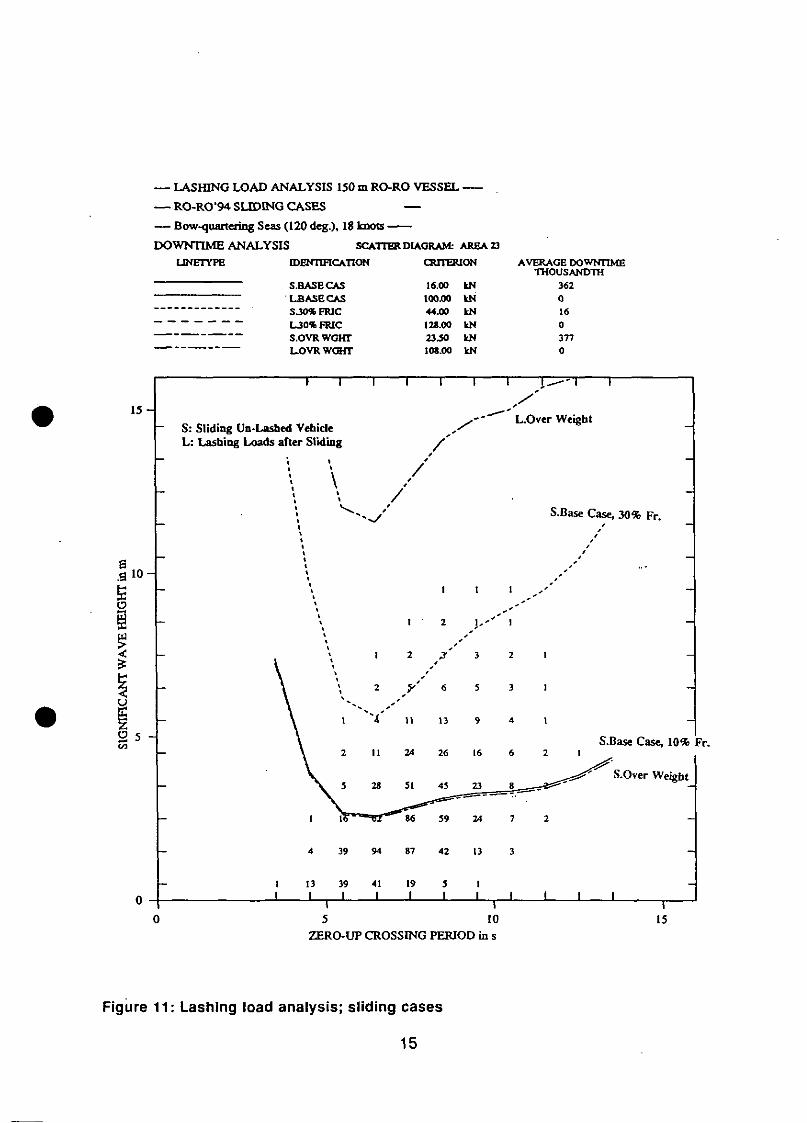
If the friction loads is high a truck over-weight, a lashing arrangement with shallow lashing angles or a high centre of gravity of the truck, all reduce the allowable wave height from the point of view of tipping (Figure 12). The shallow lashing angle yields relatively high loads after tipping.
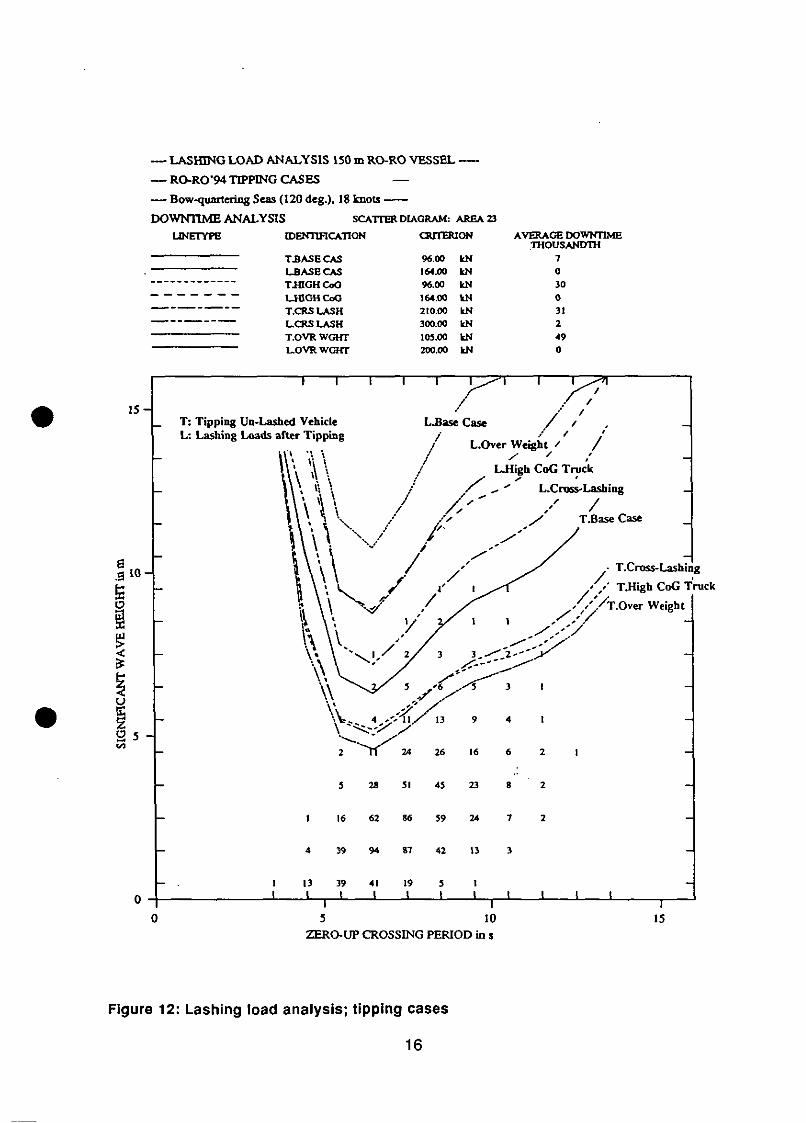
Effect of ship stability
The contemporary increased stability requirements lead to a shorter natural period of roll. This might increase the lashing loads. The effect of stability was checked by calculating the frequency of exceedance of the sliding criterion of the unlashed vehicle. for the case of 2.5 and 4.5 m metacentric height (GM). The results are shown in Figure 13, It shows that for the present huil form the loads in stern quartering seas decrease considerably with increasing GM. The effect in bow quartering seas is negligible.
13
— LASHING LOAD ANALYSIS 150 m RO-RO VESSEL
— RO-RO'94 Tipping & Sliding Base Cases —
— Bow-quartering Seas (120 deg.), 18 knots
DOWNTIME ANALYSIS SCATTER DIAGRAM: AREA23 UNETYPE IDENTIFICATION CRITERION AVERAGE DOWNTIME
THOUSANDTH
SUDINO 16.00 kN 362 LASH-SLID 100.00 kN 0 TIPPINO 76.00 kN 33 LASH-TTP 164.00 kN 0
T 1 r T r
f LASH-TTP
1 13
39 94 87 42 13
39 I
41 I
19 5 1
J L
TIPPING
SUDING
r~ r 5 10
ZERO-UP CROSSING PERIOD in s 15
Figure 10: Lashing loads analysis; tipping and sliding base cases
14
— LASHING LOAD ANALYSIS 150 m RO-RO VESSEL
— RO-RO'94 SLIDING CASES —
— Bow-quartcring Seas (120 deg.), 18 knots
DOWNTIME ANALYSIS SCATTER DIAGRAM: AREA23 LINETYPE IDENTIFICATION OUTERION AVERAGE DO WNTTME
THOUSANDTH S.BASE CAS 16.00 kN 362 L.BASECAS 100.00 kN 0 SJOflfcFRIC 44.00 kN 16
L 3 0 « F R I C 128.00 kN 0 S.OVRWGHT 23.50 kN 377 LOVRWGHT 108.00 kN 0
T 1 1 r T ^ T r
L.Over Weight 1 5 -
8 g 10
Ë o
<
u
2 5 co
S: Sliding Un-Lasbed Vehicle L: Lasbing Loads after Sliding /
\ /
^ /
*>S S.Base Case, 30% Fr.
1 1
1 , - ' 1
86 59 24
39 94 87 42 13
13 39 41 _ L
19
S.Base Case, 10% Fr.
S.Over Weight
i ~r 5 10
ZERO-UP CROSSING PERIOD in s
J L
15
Figure 11: Lashing load analysis; sliding cases
15
— LASHING LOAD ANALYSIS 150 m RO-RO VESSEL
— RO-RO'94 TIPPING CASES —
— Bow-quaitering Seas (120 deg.), 18 knots
DOWNÜME ANALYSIS SCATTER DIAGRAM: AREA23 UNETYPE [DENTIFICATION OUTERION AVERAGE DOWNTOffi
THOUSANDTH
T.BASECAS 96.00 kN 7 L-BASECAS 164.00 kN 0
TJOGHCoQ 96.00 kN 30
LHIGHCoO 164.00 kN 0 T.CRSLASH 210.00 kN 31 L.CRSLASH 300.00 kN 2 T.OVR WGHT 103.00 kN 49 L.OVRWGHT 200.00 kN 0
1 5 -
a g 10
Ë
<
u
O 5
T: Tipping Un-Lashed Vehicle L: Lashing Loads after Tipping
M
/ / ' UBaseCase / /
L.Over Weight / /
L.High CoG Tnick y '
i s *,* L.Cross-Lasbing / / ' ' / / r
y T.Base Case
• T.Cross-Lashing
' / T.High CoG Truck
/ / / T . O v e r Weight y //
y y/
28 51 45 23
l 16 62 86 59 24
39 94 87 42 13
13 39 I
41
_1_ 19 I
r 5 10
ZERO-UP CROSSING PERIOD in s
15
FIgure 12: Lashing load analysis; tipping cases
16
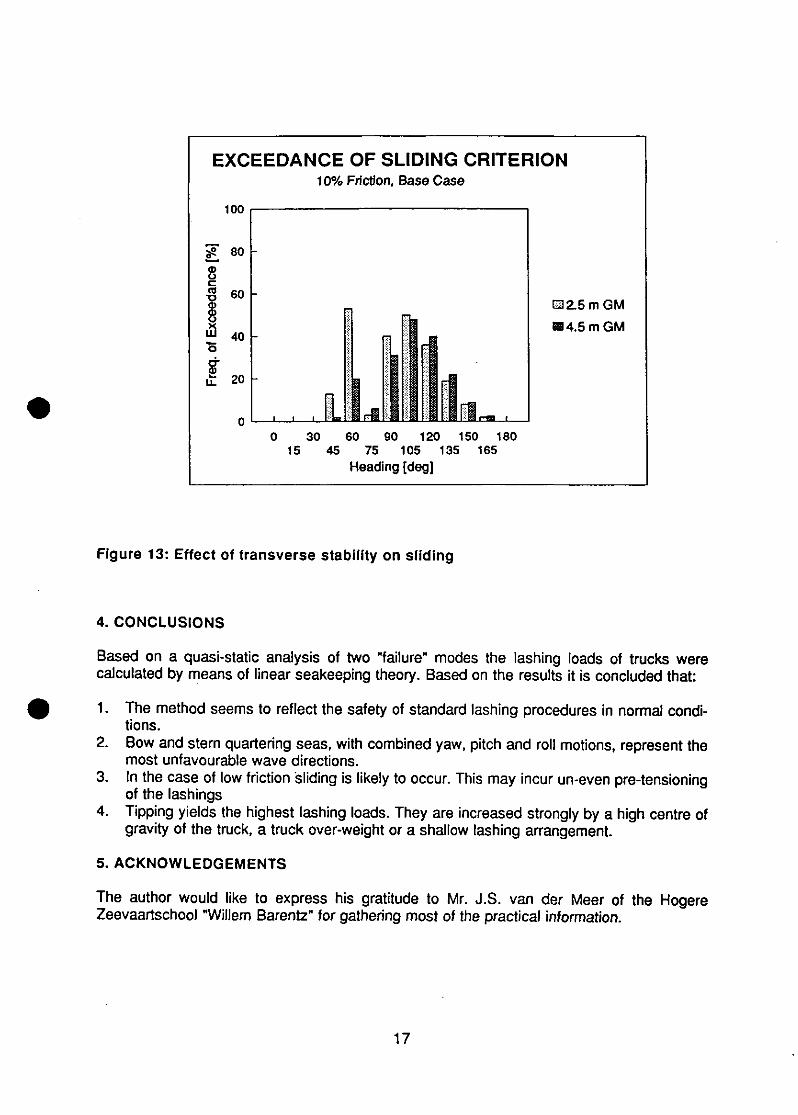
EXCEEDANCE OF SLIDING CRITERION 10% Friction, Base Case
100
£ 80
o
I 60 O
'S 40
20
E32.5mGM
H4.5 mGM
0 30 60 90 120 150 180 15 45 75 105 135 165
Heading [deg]
Figure 13: Effect of transverse stability on sliding
4. CONCLUSIONS
Based on a quasi-static analysis of two "failure" modes the lashing loads of trucks were calculated by means of linear seakeeping theory. Based on the results it is concluded that:
1. The method seems to reflect the safety of Standard lashing procedures in normal condi-tions.
2. Bow and stern quartering seas, with combined yaw, pitch and roll motions, represent the most unfavourable wave directions.
3. In the case of low friction sliding is likely to occur. This may incur un-even pre-tensioning of the lashings
4. Tipping yields the highest lashing loads. They are increased strongly by a high centre of gravity of the truck, a truck over-weight or a shallow lashing arrangement.
5. ACKNOWLEDGEMENTS
The author would like to express his gratitude to Mr. J.S. van der Meer of the Hogere Zeevaartschool "Willem Barentz" for gathering most of the practical information.
17
Literature
Andersson P., Allenström, B. and Niileksela M., Safe Stowage and Securing of Cargo on Board Ships, MariTerm AB, Göteborg, Sweden 1982.
Andersson P., Optimum Safety Factors for Securing of Cargo Onboard Ships, The Latest Findings and Experience of Reliability of Different Types of Securing Equipment, ROR086, Gothenburg, Sweden, 1986 ISBN 0904 930 36X.
HSMO, Roll-on/Roll-off Ships - Stowage and Securing of Vehicles, Code of Practice, HSMO, 1991 ISBN 011 550 995X.
IMO Resolution A581(14), Guidelines for Securing Arrangement for the Transport of Road Vehicles on RoRo Ships, IMO, 1985.
Knott J.R., Lashing and securing Deck Cargoes, The Nautical Institute, London, 1985.
Meer J.S. van der, Het vervoer van trailers op Ro/Ro schepen, Hogere zeevaartschool "Willem Barentz", 1993.
Turnbull S.R., Dawson, D., The safety of Roll-On/Roll-Off Passenger Ships - Proposed Regulations and Code of Practice relating to the Stowage and Securing of Cargo Units and Vehicles, St. Peters College, Oxford, 1989.
18