Embed Size (px)
Citation preview
1 | P a g e
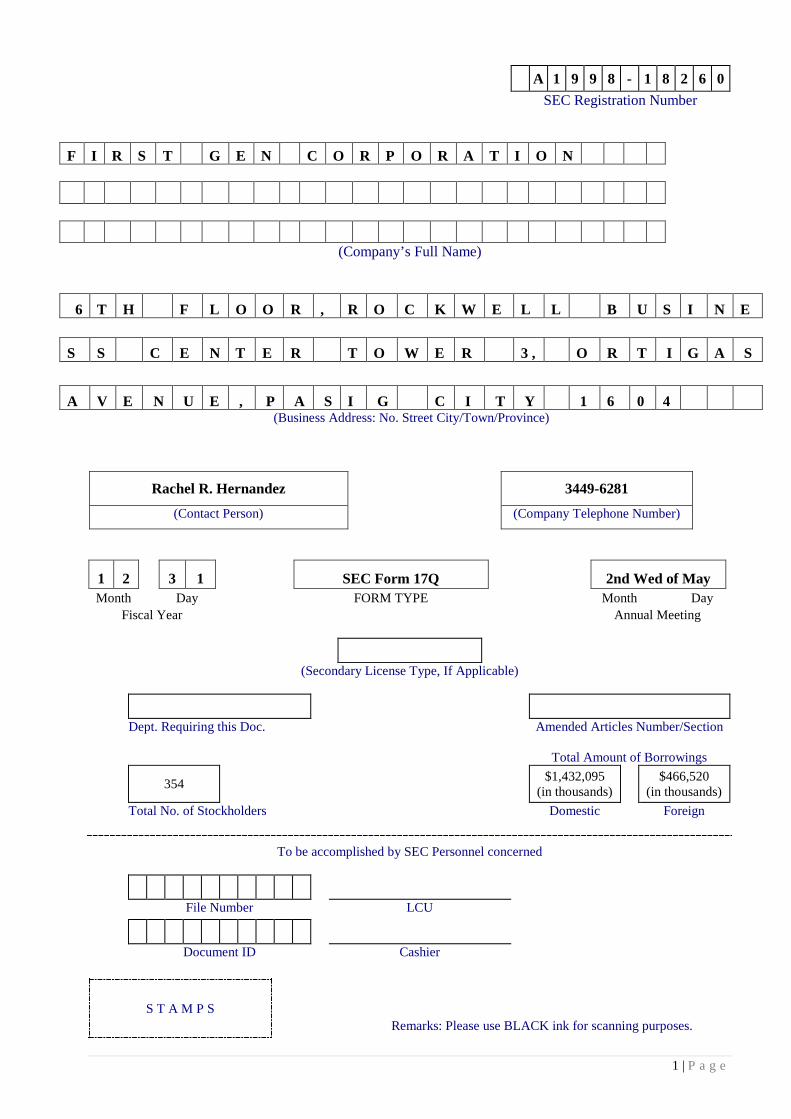
A 1 9 9 8 - 1 8 2 6 0 SEC Registration Number
F I R S T G E N C O R P O R A T I O N
(Company’s Full Name)
6 T H F L O O R , R O C K W E L L B U S I N E
S S C E N T E R T O W E R 3 , O R T I G A S
A V E N U E , P A S I G C I T Y 1 6 0 4 (Business Address: No. Street City/Town/Province)
Rachel R. Hernandez 3449-6281 (Contact Person) (Company Telephone Number)
1 2 3 1 SEC Form 17Q 2nd Wed of May Month Day FORM TYPE Month Day
Fiscal Year Annual Meeting
(Secondary License Type, If Applicable)
Dept. Requiring this Doc. Amended Articles Number/Section
Total Amount of Borrowings
354 $1,432,095 (in thousands)
$466,520 (in thousands)
Total No. of Stockholders Domestic Foreign
To be accomplished by SEC Personnel concerned
File Number LCU
Document ID Cashier
S T A M P S Remarks: Please use BLACK ink for scanning purposes.
1 | P a g e
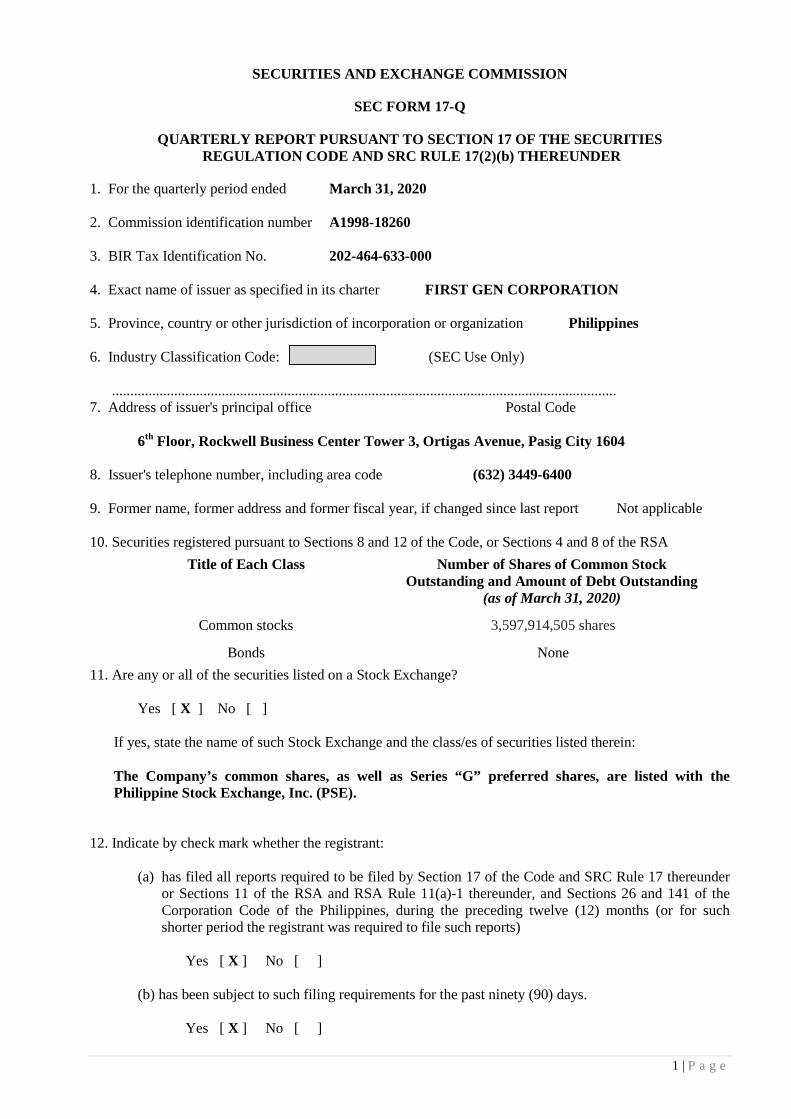
SECURITIES AND EXCHANGE COMMISSION
SEC FORM 17-Q
QUARTERLY REPORT PURSUANT TO SECTION 17 OF THE SECURITIES REGULATION CODE AND SRC RULE 17(2)(b) THEREUNDER
1. For the quarterly period ended March 31, 2020 2. Commission identification number A1998-18260 3. BIR Tax Identification No. 202-464-633-000 4. Exact name of issuer as specified in its charter FIRST GEN CORPORATION 5. Province, country or other jurisdiction of incorporation or organization Philippines 6. Industry Classification Code: (SEC Use Only) .......................................................................................................................................... 7. Address of issuer's principal office Postal Code
6th Floor, Rockwell Business Center Tower 3, Ortigas Avenue, Pasig City 1604 8. Issuer's telephone number, including area code (632) 3449-6400 9. Former name, former address and former fiscal year, if changed since last report Not applicable 10. Securities registered pursuant to Sections 8 and 12 of the Code, or Sections 4 and 8 of the RSA
Title of Each Class Number of Shares of Common Stock Outstanding and Amount of Debt Outstanding
(as of March 31, 2020)
Common stocks 3,597,914,505 shares
Bonds None 11. Are any or all of the securities listed on a Stock Exchange? Yes [ X ] No [ ]
If yes, state the name of such Stock Exchange and the class/es of securities listed therein:
The Company’s common shares, as well as Series “G” preferred shares, are listed with the Philippine Stock Exchange, Inc. (PSE).
12. Indicate by check mark whether the registrant:
(a) has filed all reports required to be filed by Section 17 of the Code and SRC Rule 17 thereunder or Sections 11 of the RSA and RSA Rule 11(a)-1 thereunder, and Sections 26 and 141 of the Corporation Code of the Philippines, during the preceding twelve (12) months (or for such shorter period the registrant was required to file such reports)
Yes [ X ] No [ ]
(b) has been subject to such filing requirements for the past ninety (90) days. Yes [ X ] No [ ]
1 | P a g e
TABLE OF CONTENTS PART I – FINANCIAL INFORMATION 1
Item 1. Unaudited Interim Condensed Consolidated Financial Statements 1 Item 2. Management’s Discussion and Analysis of Financial Condition and Results of Operations 1
Business Overview 2 Description of the nature and scope of the Business including products or services and
distribution methods
2 New products or services 6 Competition 6 Raw materials and suppliers 7 Dependence on one or few major customers 7 Financial Highlights and Ratios 8 Review of March 31, 2020 operations vs. March 31, 2019 operations 8 Material Changes in Financial Condition 10 Results of operation 10 Financial position 16 Liquidity and Capital Resources 18 Operating activities 19 Investing activities 20 Financing activities 20 Off-Balance Sheet Arrangements 20 Financial Soundness Indicators 21 Discussion of Major Subsidiaries 22 FGPC 22 FGP 23 FNPC 24 PMPC 25 EDC 26 FG Hydro 27 Factors Affecting the Company’s Results of Operations 28 Impact of coal 28 Exchange rate fluctuation 28 Major risks 28 Interest rate risk 29 Foreign currency risk 29 Credit risk 29 Liquidity risk 30 Merchant risk 31 PART II – OTHER INFORMATION 31
Related Party Transactions 31 Other Relevant Information 31
ANNEXES Aging of Receivables 34 Map of Relationships of the Companies within the Group 35
SIGNATURES S-1

1 | P a g e
PART I – FINANCIAL INFORMATION
Item 1. Financial Statements.
Attached to this report as Annex “A” is the Corporation’s unaudited interim condensed consolidated financial statements as of March 31, 2020 (with comparative audited figures as at December 31, 2019) and for the three-month periods ended March 31, 2020 and 2019. The unaudited interim condensed consolidated financial statements for the period ended March 31, 2020 have been prepared in accordance with Philippine Financial Reporting Standards (“PFRS”) specific to Philippine Accounting Standard 34, Interim Financial Reporting, and hence do not include all of the information required in the December 31, 2019 annual audited consolidated financial statements. Item 2. Management's Discussion and Analysis (MD&A) of Financial Condition and Results of Operations. In the following discussion and analysis of our financial condition and results of operations, unless the context indicates or otherwise requires, any references to “we”, “us”, “our”, “Company”, “First Gen Group” means First Gen Corporation and its consolidated subsidiaries and references to “First Gen” pertains to the Parent Company, First Gen Corporation, not including its subsidiaries (please see Note 2 – Summary of Significant Accounting Policies to the accompanying unaudited interim condensed consolidated financial statements for the list of these subsidiaries, including a description of their respective principal business activities and First Gen’s direct and/or indirect equity interest). The following discussion and analysis of the Company’s consolidated financial performance for the period ended March 31, 2020 should be read in conjunction with its unaudited interim condensed consolidated financial statements and the accompanying notes as at March 31, 2020 and the audited consolidated financial statements as at December 31, 2019. The primary objective of this MD&A is to help the readers understand the dynamics of the Company’s business and the key factors underlying its financial results. Hence, our MD&A is comprised of a discussion of its core business, and analysis of the results of operations for each business segment. This section also focuses on key statistics from the unaudited interim condensed consolidated financial statements and pertains to known risks and uncertainties relating to the power industry in the Philippines where we operate up to the stated reporting period. This report also contains information that may constitute "forward-looking statements." Generally, the words "believe," "expect," "intend," "estimate," "anticipate," "plan," "foresee," "will," and similar expressions identify forward-looking statements, which generally are not historical in nature. However, the absence of these words or similar expressions does not mean that a statement is not forward-looking. All statements that address operating performance, events or developments that we expect or anticipate will occur in the future - including statements relating to revenue growth and statements expressing general views about future operating results - are forward-looking statements. Such forward-looking statements are made based on management’s current expectations or beliefs as well as assumptions made by, and information currently available to, management. First Gen does not make express or implied representations or warranties as to the accuracy and completeness of the information contained herein and shall not accept any responsibility or liability (including any third party liability) for any loss or damage, whether or not arising from any error or omission in compiling such information or as a result of any party’s reliance or use of such information. In addition, forward-looking statements are subject to certain risks and uncertainties that could cause actual results to differ materially from our Company's historical experience and our present expectations or projections. These risks and uncertainties include, but are not limited to, those described in Risk Factors Affecting the Company’s Results of Operations and elsewhere in this report and in our Annual Report on Form 17-A for the year ended December 31, 2019, and those described from time to time in our future reports filed with the Philippine Securities and Exchange Commission (SEC). The financial information appearing in this report and in the accompanying audited consolidated financial statements is stated in United States dollars. All references to “U.S. dollars,” “US$” or “dollars” are to the lawful currency of the United States; all references to “Philippine pesos,” “Php” or “pesos” are to the lawful currency of the Philippines; and all references to “Euro” or “€” are to the lawful currency of the European Union. Unless otherwise indicated, translations of Philippine peso amounts into U.S. dollars in this report and in the accompanying audited consolidated financial statements were made based on the exchange rate quoted through the Banker’s Association of the Philippines as at March 31, 2020. Additional information about the Company, including annual and quarterly reports, can be found on our corporate website www.firstgen.com.ph.
2 | P a g e
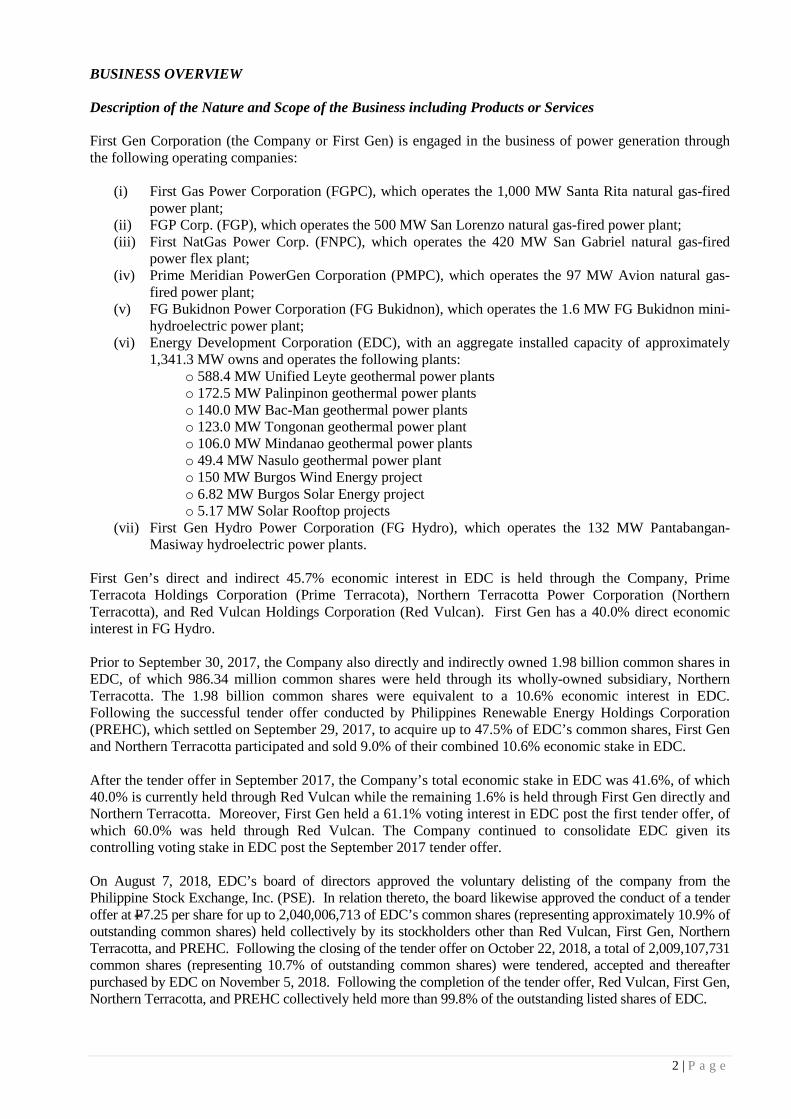
BUSINESS OVERVIEW
Description of the Nature and Scope of the Business including Products or Services
First Gen Corporation (the Company or First Gen) is engaged in the business of power generation through the following operating companies:
(i) First Gas Power Corporation (FGPC), which operates the 1,000 MW Santa Rita natural gas-firedpower plant;
(ii) FGP Corp. (FGP), which operates the 500 MW San Lorenzo natural gas-fired power plant;(iii) First NatGas Power Corp. (FNPC), which operates the 420 MW San Gabriel natural gas-fired
power flex plant;(iv) Prime Meridian PowerGen Corporation (PMPC), which operates the 97 MW Avion natural gas-
fired power plant;(v) FG Bukidnon Power Corporation (FG Bukidnon), which operates the 1.6 MW FG Bukidnon mini-
hydroelectric power plant;(vi) Energy Development Corporation (EDC), with an aggregate installed capacity of approximately
1,341.3 MW owns and operates the following plants:o 588.4 MW Unified Leyte geothermal power plantso 172.5 MW Palinpinon geothermal power plantso 140.0 MW Bac-Man geothermal power plantso 123.0 MW Tongonan geothermal power planto 106.0 MW Mindanao geothermal power plantso 49.4 MW Nasulo geothermal power planto 150 MW Burgos Wind Energy projecto 6.82 MW Burgos Solar Energy projecto 5.17 MW Solar Rooftop projects
(vii) First Gen Hydro Power Corporation (FG Hydro), which operates the 132 MW Pantabangan-Masiway hydroelectric power plants.
First Gen’s direct and indirect 45.7% economic interest in EDC is held through the Company, Prime Terracota Holdings Corporation (Prime Terracota), Northern Terracotta Power Corporation (Northern Terracotta), and Red Vulcan Holdings Corporation (Red Vulcan). First Gen has a 40.0% direct economic interest in FG Hydro.
Prior to September 30, 2017, the Company also directly and indirectly owned 1.98 billion common shares in EDC, of which 986.34 million common shares were held through its wholly-owned subsidiary, Northern Terracotta. The 1.98 billion common shares were equivalent to a 10.6% economic interest in EDC. Following the successful tender offer conducted by Philippines Renewable Energy Holdings Corporation (PREHC), which settled on September 29, 2017, to acquire up to 47.5% of EDC’s common shares, First Gen and Northern Terracotta participated and sold 9.0% of their combined 10.6% economic stake in EDC.
After the tender offer in September 2017, the Company’s total economic stake in EDC was 41.6%, of which 40.0% is currently held through Red Vulcan while the remaining 1.6% is held through First Gen directly and Northern Terracotta. Moreover, First Gen held a 61.1% voting interest in EDC post the first tender offer, of which 60.0% was held through Red Vulcan. The Company continued to consolidate EDC given its controlling voting stake in EDC post the September 2017 tender offer.
On August 7, 2018, EDC’s board of directors approved the voluntary delisting of the company from the Philippine Stock Exchange, Inc. (PSE). In relation thereto, the board likewise approved the conduct of a tender offer at P7.25 per share for up to 2,040,006,713 of EDC’s common shares (representing approximately 10.9% of outstanding common shares) held collectively by its stockholders other than Red Vulcan, First Gen, Northern Terracotta, and PREHC. Following the closing of the tender offer on October 22, 2018, a total of 2,009,107,731 common shares (representing 10.7% of outstanding common shares) were tendered, accepted and thereafter purchased by EDC on November 5, 2018. Following the completion of the tender offer, Red Vulcan, First Gen, Northern Terracotta, and PREHC collectively held more than 99.8% of the outstanding listed shares of EDC.
3 | P a g e
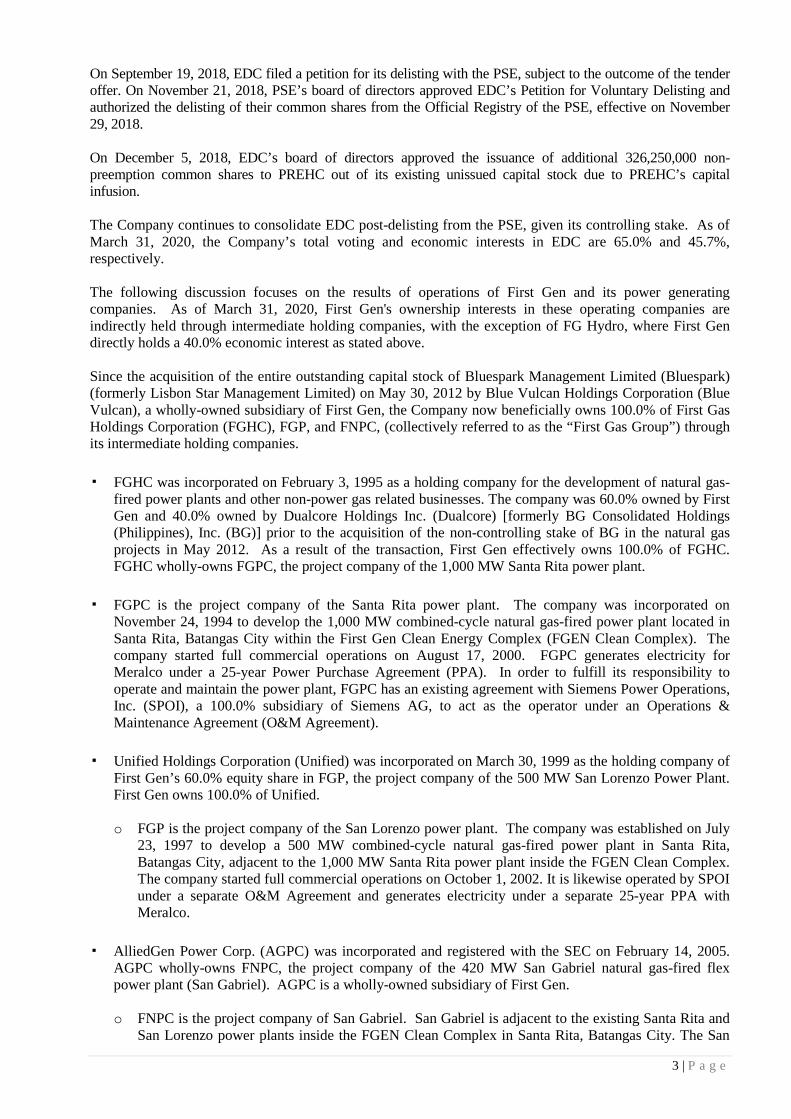
On September 19, 2018, EDC filed a petition for its delisting with the PSE, subject to the outcome of the tender offer. On November 21, 2018, PSE’s board of directors approved EDC’s Petition for Voluntary Delisting and authorized the delisting of their common shares from the Official Registry of the PSE, effective on November 29, 2018. On December 5, 2018, EDC’s board of directors approved the issuance of additional 326,250,000 non-preemption common shares to PREHC out of its existing unissued capital stock due to PREHC’s capital infusion. The Company continues to consolidate EDC post-delisting from the PSE, given its controlling stake. As of March 31, 2020, the Company’s total voting and economic interests in EDC are 65.0% and 45.7%, respectively. The following discussion focuses on the results of operations of First Gen and its power generating companies. As of March 31, 2020, First Gen's ownership interests in these operating companies are indirectly held through intermediate holding companies, with the exception of FG Hydro, where First Gen directly holds a 40.0% economic interest as stated above. Since the acquisition of the entire outstanding capital stock of Bluespark Management Limited (Bluespark) (formerly Lisbon Star Management Limited) on May 30, 2012 by Blue Vulcan Holdings Corporation (Blue Vulcan), a wholly-owned subsidiary of First Gen, the Company now beneficially owns 100.0% of First Gas Holdings Corporation (FGHC), FGP, and FNPC, (collectively referred to as the “First Gas Group”) through its intermediate holding companies.
▪ FGHC was incorporated on February 3, 1995 as a holding company for the development of natural gas-
fired power plants and other non-power gas related businesses. The company was 60.0% owned by First Gen and 40.0% owned by Dualcore Holdings Inc. (Dualcore) [formerly BG Consolidated Holdings (Philippines), Inc. (BG)] prior to the acquisition of the non-controlling stake of BG in the natural gas projects in May 2012. As a result of the transaction, First Gen effectively owns 100.0% of FGHC. FGHC wholly-owns FGPC, the project company of the 1,000 MW Santa Rita power plant.
▪ FGPC is the project company of the Santa Rita power plant. The company was incorporated on
November 24, 1994 to develop the 1,000 MW combined-cycle natural gas-fired power plant located in Santa Rita, Batangas City within the First Gen Clean Energy Complex (FGEN Clean Complex). The company started full commercial operations on August 17, 2000. FGPC generates electricity for Meralco under a 25-year Power Purchase Agreement (PPA). In order to fulfill its responsibility to operate and maintain the power plant, FGPC has an existing agreement with Siemens Power Operations, Inc. (SPOI), a 100.0% subsidiary of Siemens AG, to act as the operator under an Operations & Maintenance Agreement (O&M Agreement).
▪ Unified Holdings Corporation (Unified) was incorporated on March 30, 1999 as the holding company of
First Gen’s 60.0% equity share in FGP, the project company of the 500 MW San Lorenzo Power Plant. First Gen owns 100.0% of Unified.
o FGP is the project company of the San Lorenzo power plant. The company was established on July
23, 1997 to develop a 500 MW combined-cycle natural gas-fired power plant in Santa Rita, Batangas City, adjacent to the 1,000 MW Santa Rita power plant inside the FGEN Clean Complex. The company started full commercial operations on October 1, 2002. It is likewise operated by SPOI under a separate O&M Agreement and generates electricity under a separate 25-year PPA with Meralco.
▪ AlliedGen Power Corp. (AGPC) was incorporated and registered with the SEC on February 14, 2005.
AGPC wholly-owns FNPC, the project company of the 420 MW San Gabriel natural gas-fired flex power plant (San Gabriel). AGPC is a wholly-owned subsidiary of First Gen. o FNPC is the project company of San Gabriel. San Gabriel is adjacent to the existing Santa Rita and
San Lorenzo power plants inside the FGEN Clean Complex in Santa Rita, Batangas City. The San
4 | P a g e
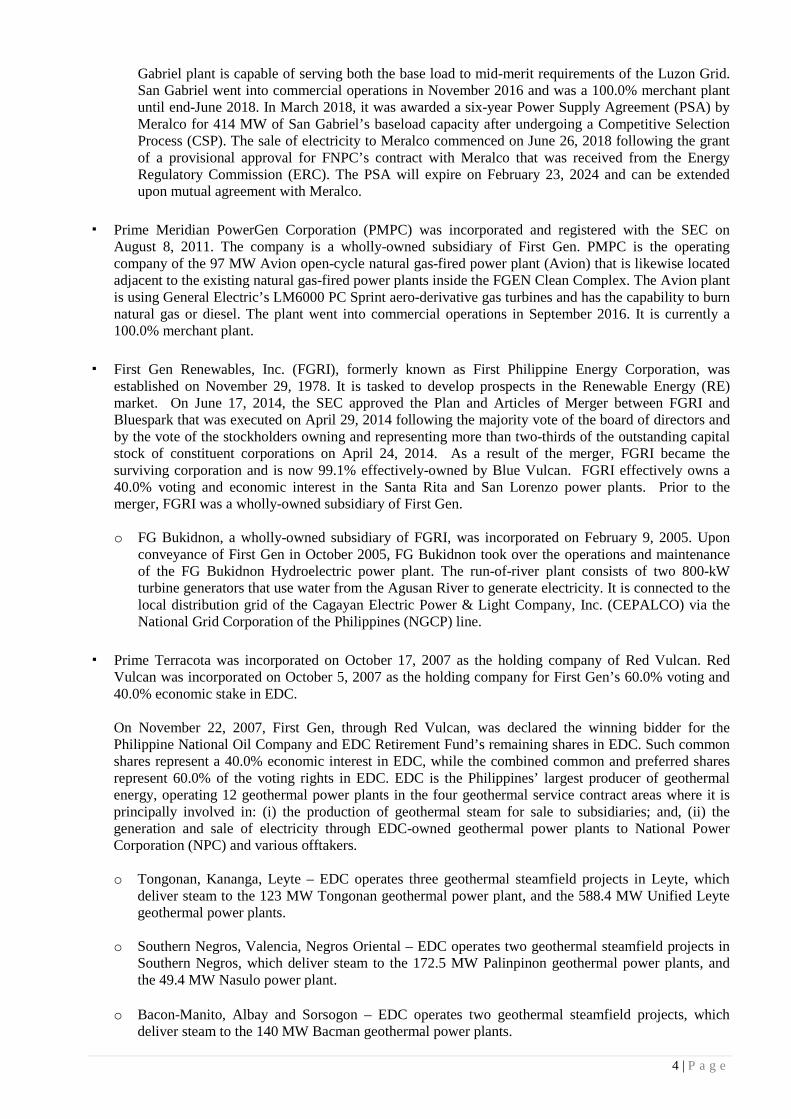
Gabriel plant is capable of serving both the base load to mid-merit requirements of the Luzon Grid. San Gabriel went into commercial operations in November 2016 and was a 100.0% merchant plant until end-June 2018. In March 2018, it was awarded a six-year Power Supply Agreement (PSA) by Meralco for 414 MW of San Gabriel’s baseload capacity after undergoing a Competitive Selection Process (CSP). The sale of electricity to Meralco commenced on June 26, 2018 following the grant of a provisional approval for FNPC’s contract with Meralco that was received from the Energy Regulatory Commission (ERC). The PSA will expire on February 23, 2024 and can be extended upon mutual agreement with Meralco.
▪ Prime Meridian PowerGen Corporation (PMPC) was incorporated and registered with the SEC on
August 8, 2011. The company is a wholly-owned subsidiary of First Gen. PMPC is the operating company of the 97 MW Avion open-cycle natural gas-fired power plant (Avion) that is likewise located adjacent to the existing natural gas-fired power plants inside the FGEN Clean Complex. The Avion plant is using General Electric’s LM6000 PC Sprint aero-derivative gas turbines and has the capability to burn natural gas or diesel. The plant went into commercial operations in September 2016. It is currently a 100.0% merchant plant.
▪ First Gen Renewables, Inc. (FGRI), formerly known as First Philippine Energy Corporation, was
established on November 29, 1978. It is tasked to develop prospects in the Renewable Energy (RE) market. On June 17, 2014, the SEC approved the Plan and Articles of Merger between FGRI and Bluespark that was executed on April 29, 2014 following the majority vote of the board of directors and by the vote of the stockholders owning and representing more than two-thirds of the outstanding capital stock of constituent corporations on April 24, 2014. As a result of the merger, FGRI became the surviving corporation and is now 99.1% effectively-owned by Blue Vulcan. FGRI effectively owns a 40.0% voting and economic interest in the Santa Rita and San Lorenzo power plants. Prior to the merger, FGRI was a wholly-owned subsidiary of First Gen. o FG Bukidnon, a wholly-owned subsidiary of FGRI, was incorporated on February 9, 2005. Upon
conveyance of First Gen in October 2005, FG Bukidnon took over the operations and maintenance of the FG Bukidnon Hydroelectric power plant. The run-of-river plant consists of two 800-kW turbine generators that use water from the Agusan River to generate electricity. It is connected to the local distribution grid of the Cagayan Electric Power & Light Company, Inc. (CEPALCO) via the National Grid Corporation of the Philippines (NGCP) line.
▪ Prime Terracota was incorporated on October 17, 2007 as the holding company of Red Vulcan. Red
Vulcan was incorporated on October 5, 2007 as the holding company for First Gen’s 60.0% voting and 40.0% economic stake in EDC.
On November 22, 2007, First Gen, through Red Vulcan, was declared the winning bidder for the Philippine National Oil Company and EDC Retirement Fund’s remaining shares in EDC. Such common shares represent a 40.0% economic interest in EDC, while the combined common and preferred shares represent 60.0% of the voting rights in EDC. EDC is the Philippines’ largest producer of geothermal energy, operating 12 geothermal power plants in the four geothermal service contract areas where it is principally involved in: (i) the production of geothermal steam for sale to subsidiaries; and, (ii) the generation and sale of electricity through EDC-owned geothermal power plants to National Power Corporation (NPC) and various offtakers. o Tongonan, Kananga, Leyte – EDC operates three geothermal steamfield projects in Leyte, which
deliver steam to the 123 MW Tongonan geothermal power plant, and the 588.4 MW Unified Leyte geothermal power plants.
o Southern Negros, Valencia, Negros Oriental – EDC operates two geothermal steamfield projects in Southern Negros, which deliver steam to the 172.5 MW Palinpinon geothermal power plants, and the 49.4 MW Nasulo power plant.
o Bacon-Manito, Albay and Sorsogon – EDC operates two geothermal steamfield projects, which deliver steam to the 140 MW Bacman geothermal power plants.

5 | P a g e
o Mt. Apo, Kidapawan, Cotabato – EDC operates one geothermal steamfield project, which delivers
steam to the 106 MW Mindanao power plants. Likewise, EDC owns the 150 MW Burgos Wind Power Plant (Burgos Wind) and the 6.82 MW Burgos Solar Project (Burgos Solar) both situated in Burgos, Ilocos Norte. As of March 31, 2020, EDC likewise has a 5.17 MW total of solar rooftop projects. As mentioned in the preceding section regarding the equity transactions of EDC in 2018, the Company continues to consolidate EDC after its delisting from the PSE, given its controlling stake. As of March 31, 2020, the Company’s total voting and economic interests in EDC are 65.0% and 45.7%, respectively.
▪ FG Hydro was incorporated on March 13, 2006 as a wholly-owned subsidiary of First Gen. On September 8, 2006, FG Hydro emerged as the winning bidder for the then 100 MW Pantabangan and the 12 MW Masiway Hydroelectric Power Plants (PMHEPP). PMHEPP was transferred to FG Hydro on November 18, 2006, representing the first major generating asset of NPC to be successfully transferred to the private sector. On October 15, 2008, First Gen’s Board of Directors (BOD) approved the sale of 60.0% of FG Hydro to EDC and the divestment was completed in November 2008. As a result of the divestment, First Gen’s direct voting and economic interests in FG Hydro were reduced to 40.0%. Moreover, the completion of the rehabilitation and upgrade project of Pantabangan hydroelectric power plant’s Units 1 and 2 in 2010 increased the power generation capacity of PMHEPP by 20 MW to 132 MW. FG Hydro likewise rehabilitated the Masiway plant to address equipment obsolescence specifically on the excitation, protection and generator systems, as well as the main step-up transformer of Masiway. Following the developments in EDC’s shares in 2017 and 2018, the Company’s effective economic stake in FG Hydro is equivalent to 67.4% as of March 31, 2020.
▪ First Gen Energy Solutions, Inc. (FGES) was incorporated and registered with the SEC on November 24,
2006. As a wholly-owned subsidiary of First Gen, FGES markets and sells electricity generated by First Gen and EDC to address the power requirements of Contestable Customers. In addition, it provides value-added services relevant to its core business. FGES holds a Retail Electricity Supplier (RES) license effective for a period of five years from May 2016 until May 2021. FGES’ RES business has a total contracted demand of 43.9 MW from 7 contestable customers as of March 31, 2020.
Principal Products or Services First Gen and its subsidiaries are primarily involved in the power generation business. It owns power plants which utilize natural gas, geothermal, wind, hydro, and solar power. The electricity generated is primarily sold to Meralco, NPC, electric cooperatives, privately-owned distribution utilities (DUs), large industrial clients, and NGCP, pursuant to long-term PPAs, Power Supply Contracts (PSCs), PSAs, Wholesale Electricity Spot Market (WESM), Ancillary Services Procurement Agreement (ASPA), and the Feed-In-Tariff (FiT). The following is a summary of First Gen’s products/services and their markets as of March 31, 2020:
Company
Principal products/services
Market
Effective Contribution to Consolidated
Revenues* of First Gen
FGPC - Power generation MERALCO US$158.6 million
FGP - Power generation MERALCO US$80.7 million
FNPC - Power generation MERALCO US$46.2 million
PMPC - Power generation WESM US$1.0 million (or P49.5 million)
FG Bukidnon - Power generation CEPALCO US$0.1 million (or P4.0 million)
FG Hydro - Power generation WESM / NGCP/ PSAs with industrial customers
US$13.0 million (or P662.0 million)

6 | P a g e
EDC EDC holds service contracts with the Department of Energy (DOE) corresponding to 15 geothermal contract areas
EDC, through its subsidiary,
EDC Burgos Wind Power Corporation (EBWPC), operates the 150 MW wind project in Burgos, Ilocos Norte. EDC also owns and operates the 6.82 MW Burgos Solar Power Plant.
EDC operates the 5.17 MW
Gaisano Rooftop Solar project located in Iloilo, Leyte, Aklan, and Sorsogon.
NPC (for power generation & steam sales), WESM, NGCP, electric cooperatives and industrial customers pursuant to the PPAs, PSAs and contracts, and Feed-in Tariff (FiT)
US$178.0 million** (or P9,039.5 million)
FGES - Retail energy supply Contestable Customers US$3.9 million (or P196.4 million)
* Pertains to revenues from sale of electricity only ** Pertains to EDC’s consolidated revenues from sale of electricity, excluding FG Hydro
Note: The Philippine Peso balances of PMPC, FG Bukidnon, FG Hydro, EDC, and FGES were translated to U.S. Dollar using the weighted average rate of US$1.00:P50.786 for the period ended March 31, 2020. FGPC, FGP and FNPC’s functional currency is the U.S. Dollar..
New Product / Service First Gen intends to expand into businesses that complement its power generation operations. In particular, the Company expects to play a major role in the development of downstream natural gas transmission and distribution facilities, and other projects using renewable sources of energy. Competition The implementation of the Electric Power Industry Reform Act of 2001 (EPIRA) by the Government paved the way for a more independent and market-driven Philippine power industry. This has allowed for competition not limited by location, and driven by market forces. As such, selling power and, consequently, the dispatch of power plants depend on the ability to offer competitively-priced power to the market. As a group, First Gen has multiple power plants and projects in Luzon, Visayas, and Mindanao. The successful privatization of NPC assets and NPC-IPP contracts in Luzon and Visayas, coupled with the integration of the Luzon and Visayas grids under the WESM, and the initial commercial operations of the RCOA in June 2013, introduced new players and opened competition in the power industry. The Aboitiz group and the San Miguel group are the Company’s closest competitors, while conglomerates, such as the Ayala Group, have entered the industry. The performance of the Philippine economy and the historical high returns of power projects in the country have attracted many potential competitors, including multinational corporations and equipment suppliers, to explore opportunities in the development of electric power generation projects in the Philippines. Accordingly, competition for and from new power projects has increased in line with the economic growth in the Philippines. Moving forward, the First Gen Group continues to face competition both in the development of new power generation facilities and in the acquisition of existing power plants (if there are any). The First Gen Group believes that it will be able to compete because of its track record, competitively-priced portfolio of power generating assets, the reliability of its power plants, its use of clean and renewable fuels, and its expertise and experience in power supply contracting and trading.
7 | P a g e
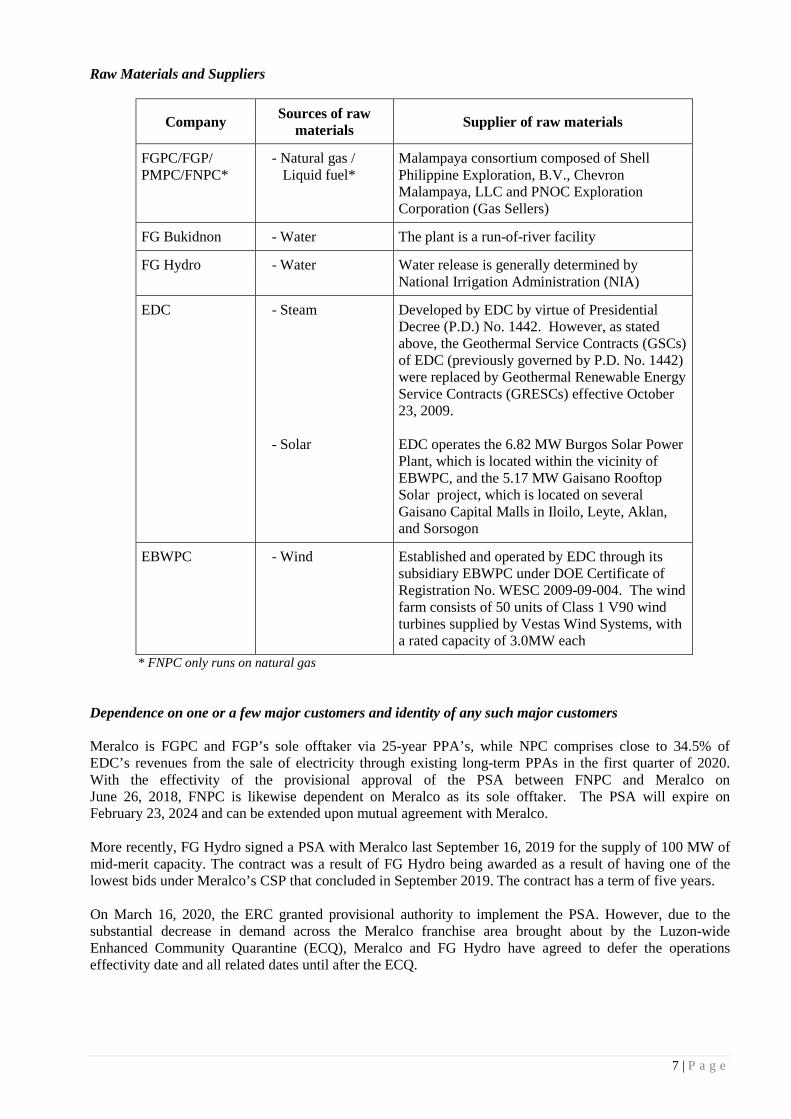
Raw Materials and Suppliers
Company Sources of raw materials Supplier of raw materials
FGPC/FGP/ PMPC/FNPC*
- Natural gas / Liquid fuel*
Malampaya consortium composed of Shell Philippine Exploration, B.V., Chevron Malampaya, LLC and PNOC Exploration Corporation (Gas Sellers)
FG Bukidnon - Water The plant is a run-of-river facility
FG Hydro - Water Water release is generally determined by National Irrigation Administration (NIA)
EDC - Steam - Solar
Developed by EDC by virtue of Presidential Decree (P.D.) No. 1442. However, as stated above, the Geothermal Service Contracts (GSCs) of EDC (previously governed by P.D. No. 1442) were replaced by Geothermal Renewable Energy Service Contracts (GRESCs) effective October 23, 2009. EDC operates the 6.82 MW Burgos Solar Power Plant, which is located within the vicinity of EBWPC, and the 5.17 MW Gaisano Rooftop Solar project, which is located on several Gaisano Capital Malls in Iloilo, Leyte, Aklan, and Sorsogon
EBWPC - Wind Established and operated by EDC through its subsidiary EBWPC under DOE Certificate of Registration No. WESC 2009-09-004. The wind farm consists of 50 units of Class 1 V90 wind turbines supplied by Vestas Wind Systems, with a rated capacity of 3.0MW each
* FNPC only runs on natural gas Dependence on one or a few major customers and identity of any such major customers Meralco is FGPC and FGP’s sole offtaker via 25-year PPA’s, while NPC comprises close to 34.5% of EDC’s revenues from the sale of electricity through existing long-term PPAs in the first quarter of 2020. With the effectivity of the provisional approval of the PSA between FNPC and Meralco on June 26, 2018, FNPC is likewise dependent on Meralco as its sole offtaker. The PSA will expire on February 23, 2024 and can be extended upon mutual agreement with Meralco. More recently, FG Hydro signed a PSA with Meralco last September 16, 2019 for the supply of 100 MW of mid-merit capacity. The contract was a result of FG Hydro being awarded as a result of having one of the lowest bids under Meralco’s CSP that concluded in September 2019. The contract has a term of five years. On March 16, 2020, the ERC granted provisional authority to implement the PSA. However, due to the substantial decrease in demand across the Meralco franchise area brought about by the Luzon-wide Enhanced Community Quarantine (ECQ), Meralco and FG Hydro have agreed to defer the operations effectivity date and all related dates until after the ECQ.
8 | P a g e
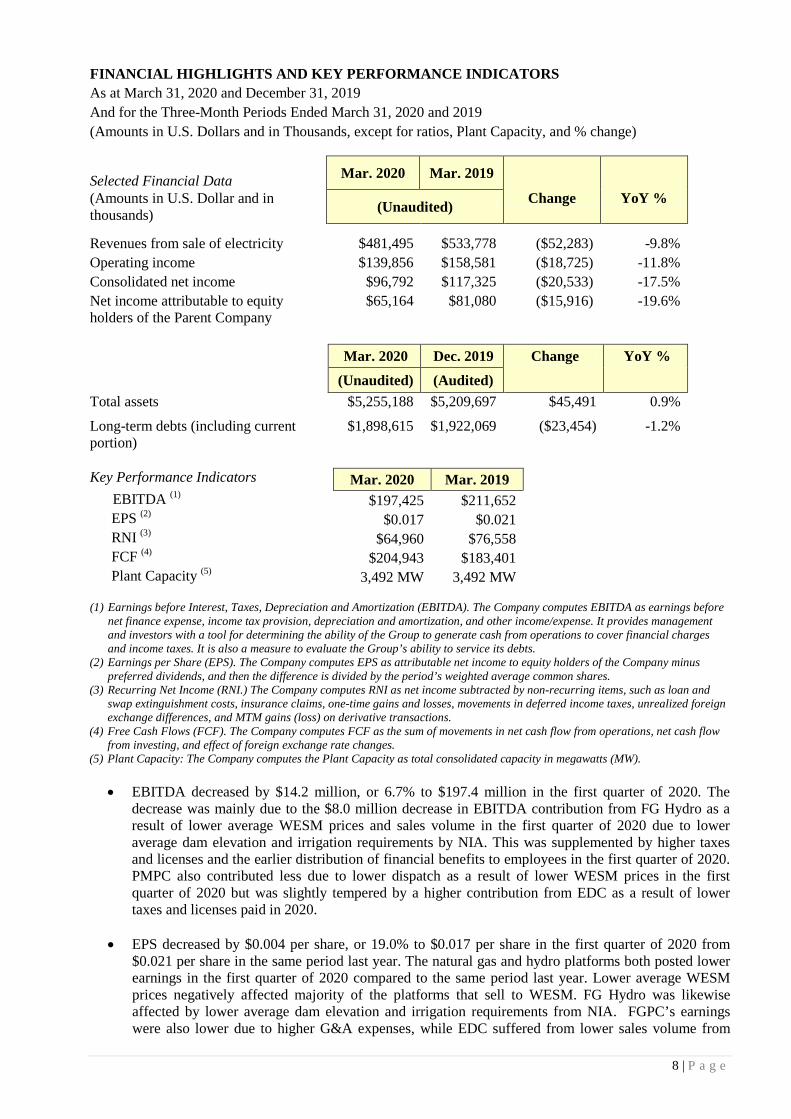
FINANCIAL HIGHLIGHTS AND KEY PERFORMANCE INDICATORS As at March 31, 2020 and December 31, 2019 And for the Three-Month Periods Ended March 31, 2020 and 2019 (Amounts in U.S. Dollars and in Thousands, except for ratios, Plant Capacity, and % change)
Selected Financial Data Mar. 2020 Mar. 2019
Change YoY % (Amounts in U.S. Dollar and in thousands) (Unaudited)
Revenues from sale of electricity $481,495 $533,778 ($52,283) -9.8% Operating income $139,856 $158,581 ($18,725) -11.8% Consolidated net income $96,792 $117,325 ($20,533) -17.5% Net income attributable to equity holders of the Parent Company
$65,164 $81,080 ($15,916) -19.6%
Mar. 2020 Dec. 2019 Change YoY % (Unaudited) (Audited)
Total assets $5,255,188 $5,209,697 $45,491 0.9%
Long-term debts (including current portion)
$1,898,615 $1,922,069 ($23,454) -1.2%
Key Performance Indicators Mar. 2020 Mar. 2019
EBITDA (1) $197,425 $211,652 EPS (2) $0.017 $0.021 RNI (3) $64,960 $76,558 FCF (4) $204,943 $183,401 Plant Capacity (5) 3,492 MW 3,492 MW
(1) Earnings before Interest, Taxes, Depreciation and Amortization (EBITDA). The Company computes EBITDA as earnings before
net finance expense, income tax provision, depreciation and amortization, and other income/expense. It provides management and investors with a tool for determining the ability of the Group to generate cash from operations to cover financial charges and income taxes. It is also a measure to evaluate the Group’s ability to service its debts.
(2) Earnings per Share (EPS). The Company computes EPS as attributable net income to equity holders of the Company minus preferred dividends, and then the difference is divided by the period’s weighted average common shares.
(3) Recurring Net Income (RNI.) The Company computes RNI as net income subtracted by non-recurring items, such as loan and swap extinguishment costs, insurance claims, one-time gains and losses, movements in deferred income taxes, unrealized foreign exchange differences, and MTM gains (loss) on derivative transactions.
(4) Free Cash Flows (FCF). The Company computes FCF as the sum of movements in net cash flow from operations, net cash flow from investing, and effect of foreign exchange rate changes.
(5) Plant Capacity: The Company computes the Plant Capacity as total consolidated capacity in megawatts (MW). • EBITDA decreased by $14.2 million, or 6.7% to $197.4 million in the first quarter of 2020. The
decrease was mainly due to the $8.0 million decrease in EBITDA contribution from FG Hydro as a result of lower average WESM prices and sales volume in the first quarter of 2020 due to lower average dam elevation and irrigation requirements by NIA. This was supplemented by higher taxes and licenses and the earlier distribution of financial benefits to employees in the first quarter of 2020. PMPC also contributed less due to lower dispatch as a result of lower WESM prices in the first quarter of 2020 but was slightly tempered by a higher contribution from EDC as a result of lower taxes and licenses paid in 2020.
• EPS decreased by $0.004 per share, or 19.0% to $0.017 per share in the first quarter of 2020 from
$0.021 per share in the same period last year. The natural gas and hydro platforms both posted lower earnings in the first quarter of 2020 compared to the same period last year. Lower average WESM prices negatively affected majority of the platforms that sell to WESM. FG Hydro was likewise affected by lower average dam elevation and irrigation requirements from NIA. FGPC’s earnings were also lower due to higher G&A expenses, while EDC suffered from lower sales volume from
9 | P a g e
their geothermal plants in 2020. In addition, FNPC had lower capacity fees billed to Meralco due to its scheduled maintenance outage, which coincided with the end of its PSA Contract year 2 in January 2020, and higher G&A expenses for the period.
• RNI decreased by $11.6 million, or 15.1% to $65.0 million in the first quarter of 2020 from $76.6 million in the same period last year. This was primarily attributable to FG Hydro due to the aforementioned reasons in the first quarter of 2020. In addition, FGPC contributed lower RNI primarily due to lower operating income for the period as a result of early release of staff benefits and payment of taxes and licenses. Furthermore, FNPC contributed lower RNI due to lower capacity fees billed to Meralco due to its scheduled maintenance outage which coincided with the end of its PSA Contract year 2 in January 2020. In addition, PMPC’s RNI contribution was less due to lower WESM prices and dispatch.
• FCF increased by $21.5 million, or 11.7% to $204.9 million in the first quarter of 2020 from $183.4 million in the same period last year. This was primarily due to net redemptions of financial assets at FVPL, lower short-term investments and DSRA funding booked this period, augmented by lower additions to property, plant, & equipment for EDC, PMPC, and FNPC, which spent for various plant improvements in 2019. The increase was partially offset by lower EBITDA from FG Hydro and the natural gas assets.
Review of March 31, 2020 operations vs. March 31, 2019 operations The First Gen Group generated a consolidated net income of $96.8 million in the first quarter of 2020, a $20.5 million or 17.5% decrease from $117.3 million posted in the same period last year. Consolidated revenues from the sale of electricity reached $481.5 million in the first quarter of 2020, $52.3 million or 9.8% lower than the $533.8 million posted in the same period last year due to lower revenues from the natural gas platform, FG Hydro, and EDC as a result of the aforementioned reasons. Net Income Attributable to Equity Holders of the Parent Company Net income attributable to the equity holders of the Parent Company decreased by $15.9 million, or 19.6% to $65.2 million in the first quarter of 2020, compared to $81.1 million recognized in the same period last year. The decrease in attributable net income was mainly due to the lower contributions of the following subsidiaries:
• FG Hydro’s net income contribution decreased by $4.9 million, or 50.2% to $4.8 million in the first quarter of 2020 compared to $9.7 million in the same period last year. The decrease was driven by lower average WESM selling price at P2.93/kWh in the first quarter of 2020 compared to P4.94/kWh in the same period last year, which was accompanied by lower generation of 194 GWh during the period compared to 217 GWh for the same period in 2019, on account of lower dam elevation and irrigation requirements of NIA. This was partially offset by higher revenues from ancillary services in the first quarter of 2020 compared to the same period last year.
• FGPC’s net income contribution decreased by $4.7 million, or 17.6% to $21.8 million in the first quarter of 2020 from $26.5 million in the same period last year. This was a result of higher staff costs and taxes and licenses. This was partially offset by lower interest expenses as a result of a decrease in LIBOR rates, a reversal from a foreign exchange loss in 2019 to a foreign exchange gain in 2020.
• PMPC’s net loss contribution increased by $2.0 million to a $2.2 million loss in the first quarter of 2020 from a $0.2 million loss in the same period last year. This was a result of lower average WESM prices of P4.73/kWh in the first quarter of 2020 from P9.03/kWh in the same period last year. This resulted from lower dispatch at 4.9% for the first quarter of 2020 compared to 15.7% in the same period in 2019 but was partially offset by lower fuel prices and the absence of maintenance works performed in the same period last year.
• EDC’s net income contribution (ex-hydro) only slightly decreased by $1.9 million, or 6.7% to $25.8 million in the first quarter of 2020 from $27.7 million in the same period last year. This was mainly due to lower sales volume from Unified Leyte, Palinpinon, and Mindanao. The ULGEI, Nasulo, and

10 | P a g e
Tongonan plants also suffered from lower average selling prices in 2020. Net income was further reduced by lower insurance claim proceeds received in 2020 compared to the same period last year. The above decreases were partially offset by lower interest expenses due to a partial redemption of EDC’s $211.0 million Bond amounting to $29.9 million in February 2019 and the full repayment of EDC’s term loans with various banks totaling to P3.7 billion in 2019.
• FNPC’s net income contribution decreased by $1.2 million, or 11.6% to $8.8 million in the first quarter of 2020 from $10.0 million in the same period last year largely driven by San Gabriel’s lower capacity fees billed to Meralco due to its scheduled maintenance outage, which coincided with the end of its PSA Contract year 2 in January 2020, and higher G&A expenses for the period. These were partially offset by the absence of replacement power purchases during its extended maintenance outage in the first quarter of 2019.
FIRST GEN MATERIAL CHANGES IN FINANCIAL CONDITION (March 31, 2020 vs. March 31, 2019)
CONSOLIDATED STATEMENTS OF INCOME
Horizontal and Vertical Analyses of Material Changes for the periods ended March 31, 2020 and 2019
HORIZONTAL ANALYSIS
2020 2019 2020 vs. 2019 2020 vs. 2019 2020 2019
Revenues from sale of electricity $481,495 $533,778 ($52,283) -9.8% 100.0% 100.0%TOTAL REVENUES 481,495 533,778 (52,283) -9.8% 100.0% 100.0%
OPERATING EXPENSESCosts of sale of electricity (295,105) (331,704) 36,599 -11.0% -61.3% -62.1%General and administrative expenses (46,534) (43,493) (3,041) 7.0% -9.7% -8.1%
Sub-total (341,639) (375,197) 33,558 -8.9% -71.0% -70.3%
FINANCIAL INCOME (EXPENSE)Interest income 2,736 5,216 (2,480) -47.5% 0.6% 1.0%Interest expense and financing charges (26,729) (33,437) 6,708 -20.1% -5.6% -6.3%
Sub-total (23,993) (28,221) 4,228 -15.0% -5.0% -5.3%
OTHER INCOME (CHARGES)Mark-to-market gain on derivatives – net 313 78 235 301.3% 0.1% 0.0%Mark-to-market gain on financial assets at FVPL – net 44 610 (566) -92.8% 0.0% 0.1%Proceeds from insurance claims 19 7,061 (7,042) -99.7% 0.0% 1.3%Foreign exchange gains (losses) – net (97) 1,459 (1,556) -106.6% 0.0% 0.3%Loss on extinguishment of long-term debts - (1,764) 1,764 -100.0% 0.0% -0.3%Others – net 219 (614) 833 135.7% 0.0% -0.1%
Sub-total 498 6,830 (6,332) -92.7% 0.1% 1.3%
INCOME BEFORE INCOME TAX 116,361 137,190 (20,829) -15.2% 24.2% 25.7%Provision for (benefit from) income tax:
Current 17,840 21,095 (3,255) -15.4% 3.7% 4.0%Deferred 1,729 (1,230) 2,959 240.6% 0.4% -0.2%
19,569 19,865 (296) -1.5% 4.1% 3.7%NET INCOME $96,792 $117,325 ($20,533) -17.5% 20.1% 22.0%
Net income attributable to:Equity holders of the Parent Company $65,164 $81,080 ($15,916) -19.6% 13.5% 15.2%Non-controlling Interests $31,628 $36,245 ($4,617) -12.7% 6.6% 6.8%
VERTICAL ANALYSIS
11 | P a g e
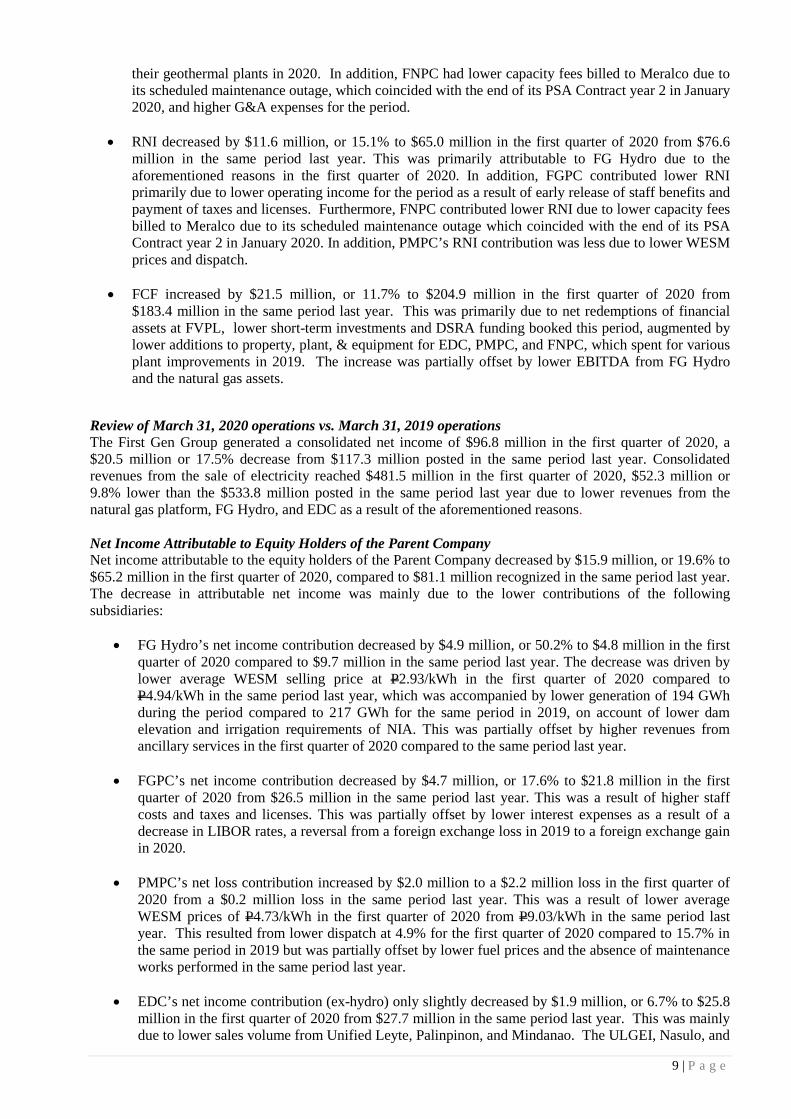
Revenues from sale of electricity The following table shows the composition of First Gen Group's consolidated revenues by platform for the periods ended March 31, 2020 and 2019:
Revenue Mix Mar. 2020 % Mar. 2019 % Changes % Natural gas $286,523 59.5% $327,579 61.4% ($41,056) -12.5% Geothermal/Wind/Solar* 177,647 36.9% 179,794 33.7% (2,147) -1.2% Hydro 13,458 2.8% 21,209 4.0% (7,751) -36.5% Others* 3,867 0.8% 5,196 1.0% (1,329) -25.6%
$481,495 100.0% $533,778 100.0% ($52,283) -9.8% *Net of intercompany transactions
Revenues for the first quarter of 2020 decreased by $52.3 million, or 9.8% to $481.5 million compared to $533.8 million in 2019. The decrease was due to the movements per platform as explained in detail below:
Natural Gas Revenues from the natural gas platform decreased by $41.1 million, or 12.5% from $327.6 million in the first quarter of 2019 to $286.5 million in 2020. This was largely driven by FNPC’s lower contribution of $46.2 million in the first quarter of 2020, a $13.5 million or 22.5% decrease from $59.7 million in the same period last year. The decrease was mainly due to lower capacity fees billed to Meralco due to its scheduled maintenance outage in January 2020, supplemented by lower dispatch in the first quarter of 2020 at 49.4% compared to 67.8% in the same period last year. FGPC and FGP likewise recognized lower revenues of $23.0 million, or a decrease of 8.7%, to $239.3 million in the first quarter of 2020 compared $262.3 million in the same period last year, mainly due to lower fuel costs following lower average gas prices at $8.3/MMBtu for the first quarter of 2020 compared to $9.3/MMBtu for the same period in 2019, supplemented by a lower combined dispatch of 70.4% in 2020 compared to 73.1% last year. The decrease was partially offset by the higher average NDC of both plants at 1,662 MW in 2020 compared to 1,649 MW in 2019. In addition, PMPC recognized lower revenues by $4.7 million, or a decrease of 82.8%, to $1.0 million in the first quarter of 2020 compared to $5.7 million in the same period last year due to lower average WESM prices at P4.30/kWh in the first quarter of 2020 compared to P9.03/kWh for the same period in 2019 coupled with lower dispatch at 4.9% in 2020 compared to 15.7% in 2019.
Geothermal/Wind/Solar (“GWS”) There was a $2.2 million decrease in revenues from the GWS platform (EDC consolidated revenues ex-FG Hydro), or a 1.2% decrease from $179.8 million in the first quarter of 2019 to $177.6 million in the first quarter of 2020. The decrease was driven by lower sales volume from Unified Leyte, Palinpinon, and Mindanao. This was made worse by lower average WESM selling prices for ULGEI Strips, Tongonan, Bacman, and Nasulo plants. These decreases were partially offset by higher revenues from Burgos Wind and Burgos Solar on account of higher generation in the first quarter of 2020.
Hydro Revenues from the Hydro platform decreased by $7.7 million, or 36.5% from $21.2 million in the first quarter of 2019 to $13.5 million in the same period in 2020. The decrease was driven by a lower average WESM selling price at P2.93/kWh in the first quarter of 2020 compared to P4.94/kWh in the same period last year, which was accompanied by lower generation of 194 GWh in the period compared to 217 GWh for the same period in 2019, on account of lower starting dam elevation and irrigation requirements of NIA. This was partially offset by higher revenues from ancillary services in the first quarter of 2020 compared to the same period last year, with FG Bukidnon posting higher revenues as well due to higher generation in the first quarter of 2020.
Others FGES’ revenues decreased by $1.3 million, or 25.6% from $5.2 million in the first quarter of 2019 to $3.9 million in same period in 2020 as a result of lower sales volume, which decreased by 7.6 GWh, or 12.6% from 60.5 GWh in the first quarter of 2019 to 52.9 GWh in 2020. FGES’ revenues
12 | P a g e
are from supply charges and power sold to contestable customers, which are sourced from electricity generated by EDC and FG Hydro. FGES had 7 contracted customers by end-March 2020 compared to 12 customers by end-March 2019. The number of customers decreased due to contracts which expired and some customers that were renewed under an affiliate – BacMan Geothermal Inc. (BGI) RES.
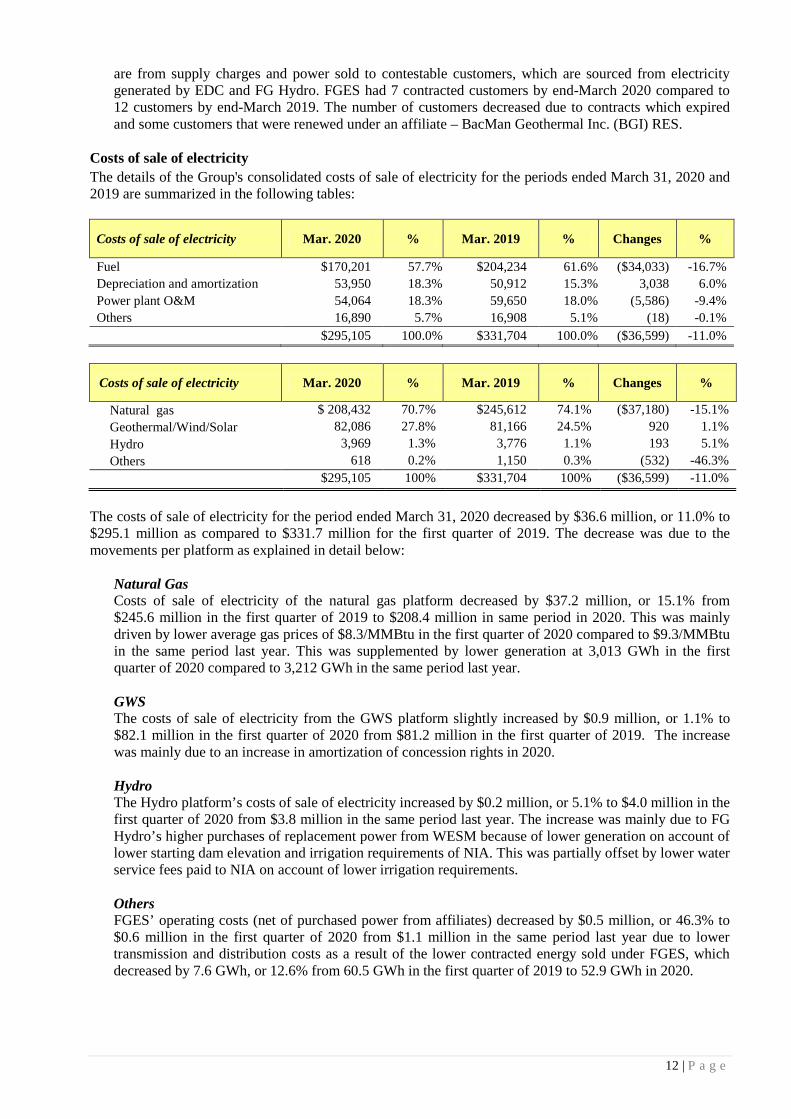
Costs of sale of electricity The details of the Group's consolidated costs of sale of electricity for the periods ended March 31, 2020 and 2019 are summarized in the following tables:
Costs of sale of electricity Mar. 2020 % Mar. 2019 % Changes %
Fuel $170,201 57.7% $204,234 61.6% ($34,033) -16.7% Depreciation and amortization 53,950 18.3% 50,912 15.3% 3,038 6.0% Power plant O&M 54,064 18.3% 59,650 18.0% (5,586) -9.4% Others 16,890 5.7% 16,908 5.1% (18) -0.1%
$295,105 100.0% $331,704 100.0% ($36,599) -11.0%
Costs of sale of electricity Mar. 2020 % Mar. 2019 % Changes %
Natural gas $ 208,432 70.7% $245,612 74.1% ($37,180) -15.1% Geothermal/Wind/Solar 82,086 27.8% 81,166 24.5% 920 1.1% Hydro 3,969 1.3% 3,776 1.1% 193 5.1% Others 618 0.2% 1,150 0.3% (532) -46.3%
$295,105 100% $331,704 100% ($36,599) -11.0%
The costs of sale of electricity for the period ended March 31, 2020 decreased by $36.6 million, or 11.0% to $295.1 million as compared to $331.7 million for the first quarter of 2019. The decrease was due to the movements per platform as explained in detail below:
Natural Gas Costs of sale of electricity of the natural gas platform decreased by $37.2 million, or 15.1% from $245.6 million in the first quarter of 2019 to $208.4 million in same period in 2020. This was mainly driven by lower average gas prices of $8.3/MMBtu in the first quarter of 2020 compared to $9.3/MMBtu in the same period last year. This was supplemented by lower generation at 3,013 GWh in the first quarter of 2020 compared to 3,212 GWh in the same period last year.
GWS The costs of sale of electricity from the GWS platform slightly increased by $0.9 million, or 1.1% to $82.1 million in the first quarter of 2020 from $81.2 million in the first quarter of 2019. The increase was mainly due to an increase in amortization of concession rights in 2020.
Hydro The Hydro platform’s costs of sale of electricity increased by $0.2 million, or 5.1% to $4.0 million in the first quarter of 2020 from $3.8 million in the same period last year. The increase was mainly due to FG Hydro’s higher purchases of replacement power from WESM because of lower generation on account of lower starting dam elevation and irrigation requirements of NIA. This was partially offset by lower water service fees paid to NIA on account of lower irrigation requirements. Others FGES’ operating costs (net of purchased power from affiliates) decreased by $0.5 million, or 46.3% to $0.6 million in the first quarter of 2020 from $1.1 million in the same period last year due to lower transmission and distribution costs as a result of the lower contracted energy sold under FGES, which decreased by 7.6 GWh, or 12.6% from 60.5 GWh in the first quarter of 2019 to 52.9 GWh in 2020.

13 | P a g e
G&A Expenses G&A expenses increased by $3.0 million, or 7.0% to $46.5 million in the first quarter of 2020 from $43.5 million in the same period last year. The increase is primarily due to higher staff costs related to financial assistance gratuity to employees in light of the COVID-19 health crisis. This was supplemented by EDC’s increased amortization of right-of-use of assets from the adoption of PFRS 16, Leases, as well as the Group’s donations for COVID-19 relief. This was partially offset by a decrease in EDC’s taxes and licenses and lower professional fees. Interest expense and financing charges Interest expense and financing charges decreased by $6.7 million, or 20.1% to $26.7 million in the first quarter of 2020 from $33.4 million in the same period last year. The decrease was primarily due to the Company’s lower outstanding debt due to several aforementioned loan prepayments. This was supplemented by the lower outstanding debt balances of FGPC, FGP, the Parent, and FNPC as a result of regular principal repayments. Foreign exchange gains (losses) – net The First Gen Group recognized foreign exchange losses amounting to $0.1 million in the first quarter of 2020, a $1.6 million or 106.6% decrease from a $1.5 million gain in the same period last year. The reversal primarily relates to EDC’s foreign exchange losses on transactions denominated in the Chilean Peso. This movement was supplemented by lower foreign exchange gains from FNPC, FGP, and the Parent due to the depreciation of the Philippine Peso against the U.S. Dollar in the first quarter of 2020. MTM gain (loss) on derivatives and MTM gain (loss) on financial assets at FVPL For the first quarter of 2020, the net MTM gain on derivatives and financial assets at FVPL stood at $0.4 million, a decrease of $0.3 million from the $0.7 million net gain booked in the first quarter of 2019. The decrease was mainly due to a $0.5 million decline in the MTM gains from EDC's financial assets at FVPL compared to 2019, partially offset by an increase of $0.2 million in the MTM derivative gains compared to 2019. Other Income / Charges – net Other income stood at $0.2 million in the first quarter of 2020, a $4.5 million or 93.6% decrease from $4.7 million booked in the first quarter of 2019. This decrease in other income was mainly due to EDC’s lower insurance claim proceeds, slightly offset by the absence of a one-time debt extinguishment cost of $1.8 million following the partial redemption of its $211.0 million bond in February 2019. Provision for Income Tax The provision for income tax decreased by $0.3 million, or 1.5% to $19.6 million for the first quarter of 2020 from $19.9 million in the same period last year. The decrease was primarily to a result of EDC, FG Hydro, and FGPC’s lower taxable income in the first quarter of 2020 compared to the same period last year. This was offset by the reversal of the benefit from deferred income tax recognized in 2019 to a provision for deferred income tax in 2020 as a result of depreciation of the Philippine Peso against the U.S. Dollar during the period. Net Income The First Gen Group generated a consolidated net income of $96.8 million in the first quarter of 2020, $20.5 million or 17.5% lower than the $117.3 million in the first quarter of 2019. The decrease in net income was mainly due to the lower contributions of the following subsidiaries:
• FG Hydro’s net income contribution decreased by $7.2 million, or 50.2% to $7.2 million in the first quarter of 2020 compared to $14.4 million in the same period last year. The decrease was driven by lower average WESM selling price at P2.93/kWh in the first quarter of 2020 compared to P4.94/kWh in the same period last year, which was accompanied by lower generation of 194 GWh in the period compared to 217 GWh for the same period in 2019, on account of lower dam elevation and irrigation requirements of NIA. This was partially offset by higher revenues from ancillary services in the first quarter of 2020 compared to the same period last year.
• FGPC’s net income contribution decreased by $4.7 million, or 17.6% to $21.8 million in the first quarter of 2020 from $26.5 million in the same period last year. This was a result of higher staff

14 | P a g e
costs and taxes and licenses. This was partially offset by lower interest expenses as a result of a decrease in LIBOR rates and the reversal from a foreign exchange loss in 2019 to a foreign exchange gain in 2020.
• EDC’s net income contribution (ex-hydro) decreased by $4.2 million, or 7.2% to $54.0 million in the first quarter of 2020 from $58.2 million in the same period last year. This was mainly due to lower sales volume from Unified Leyte, Palinpinon, and Mindanao. The ULGEI, Nasulo, and Tongonan plants also suffered from lower average contracted and WESM selling prices in 2020. Net income was further reduced by lower insurance claim proceeds received in 2020 compared to the same period last year. The above decreases were partially offset by lower interest expenses due to a partial redemption of EDC’s $211.0 million Bond amounting to $29.9 million in February 2019 and the full repayment of EDC’s term loans with various banks totaling to P3.7 billion in 2019.
• PMPC’s net loss contribution increased by $2.0 million to a $2.2 million loss in the first quarter of 2020 from a $0.2 million loss in the same period last year. This was a result of lower average WESM prices of P4.73/kWh in the first quarter of 2020 from P9.03/kWh in the same period last year. This resulted from lower dispatch at 4.9% for the first quarter of 2020 compared to 15.7% in the same period in 2019 but was partially offset by lower fuel prices and the absence of maintenance works performed in the same period last year.
• FNPC’s net income contribution decreased by $1.2 million, or 11.6% to $8.8 million in the first
quarter of 2020 from $10.0 million in the same period last year largely driven by San Gabriel’s lower capacity fees billed to Meralco due to its scheduled maintenance outage in January 2020 and incurred higher G&A expenses for the period. These were partially offset by the absence of replacement power purchases during its extended maintenance outage in the first quarter of 2019.
Net Income Attributable to Equity Holders of the Parent Company Net income attributable to the equity holders of the Parent Company decreased by $15.9 million, or 19.6% to $65.2 million in the first quarter of 2020, compared to $81.1 million recognized in the same period last year. The decrease in attributable net income was mainly due to the lower contributions of the following subsidiaries:
• The Company’s wholly owned subsidiaries for its natural gas platform; namely, FGPC, FNPC, and PMPC recognized lower income in the first quarter of 2020 compared to the same period in 2019, as discussed above.
• EDC’s contribution to net income attributable to the Parent Company decreased by $1.9 million, or
6.7% to $25.8 million in the first quarter of 2020 from $27.7 million in the same period last year, as discussed above.
• FG Hydro’s contribution to net income attributable to the Parent Company decreased by
$4.9 million, or 50.2% to $4.8 million in the first quarter of 2020 compared to $9.7 million in the same period last year, as discussed above.
15 | P a g e
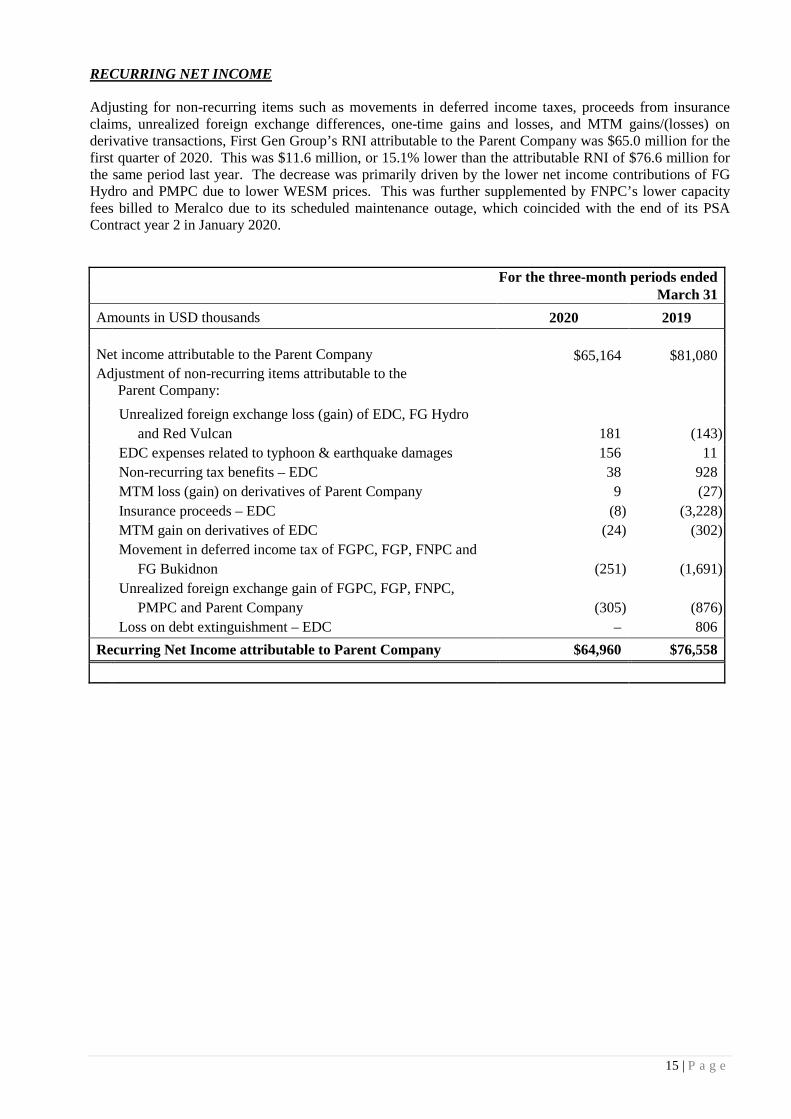
RECURRING NET INCOME Adjusting for non-recurring items such as movements in deferred income taxes, proceeds from insurance claims, unrealized foreign exchange differences, one-time gains and losses, and MTM gains/(losses) on derivative transactions, First Gen Group’s RNI attributable to the Parent Company was $65.0 million for the first quarter of 2020. This was $11.6 million, or 15.1% lower than the attributable RNI of $76.6 million for the same period last year. The decrease was primarily driven by the lower net income contributions of FG Hydro and PMPC due to lower WESM prices. This was further supplemented by FNPC’s lower capacity fees billed to Meralco due to its scheduled maintenance outage, which coincided with the end of its PSA Contract year 2 in January 2020.
For the three-month periods ended March 31
Amounts in USD thousands 2020 2019 Net income attributable to the Parent Company $65,164 $81,080 Adjustment of non-recurring items attributable to the
Parent Company:
Unrealized foreign exchange loss (gain) of EDC, FG Hydro and Red Vulcan
181
(143)
EDC expenses related to typhoon & earthquake damages 156 11 Non-recurring tax benefits – EDC 38 928 MTM loss (gain) on derivatives of Parent Company 9 (27) Insurance proceeds – EDC (8) (3,228) MTM gain on derivatives of EDC (24) (302)
Movement in deferred income tax of FGPC, FGP, FNPC and
FG Bukidnon
(251)
(1,691)
Unrealized foreign exchange gain of FGPC, FGP, FNPC, PMPC and Parent Company
(305)
(876)
Loss on debt extinguishment – EDC – 806
Recurring Net Income attributable to Parent Company $64,960 $76,558

16 | P a g e
CONSOLIDATED STATEMENTS OF FINANCIAL POSITION
Horizontal and Vertical Analyses of Material Changes as of March 31, 2020 and December 31, 2019
Cash and cash equivalents Cash and cash equivalents increased by $106.6 million, or 17.1% to $730.5 million as of March 31, 2020 from $623.9 million as of December 31, 2019 mainly due to higher cash generated from operating activities, redemptions of financial assets at FVPL during the period and lower debt and interest payments. This was partially offset by a payment of preferred dividends in January and payment of dividends to EDC’s minority shareholders.
March 31, 2020 Dec. 31, 2019 HORIZONTAL ANALYSIS VERTICAL ANALYSIS
(Amounts in US$ and in Thousands) (Unaudited) (Audited) 2020 vs. 2019 2020 vs. 2019 March 31, 2020 Dec. 31, 2019ASSETSCurrent AssetsCash and cash equivalents $730,483 $623,881 $106,602 17.1% 13.9% 12.0%Receivables 445,347 434,689 10,658 2.5% 8.5% 8.3%Inventories 131,724 128,876 2,848 2.2% 2.5% 2.5%Financial assets at fair value through profit or loss (FVPL) 16,310 30,848 (14,538) -47.1% 0.3% 0.6%Other current assets 56,875 82,071 (25,196) -30.7% 1.1% 1.6%Total Current Assets 1,380,739 1,300,365 80,374 6.2% 26.3% 25.0%Noncurrent AssetsProperty, plant and equipment – net 2,513,000 2,549,930 (36,930) -1.4% 47.8% 48.9%Goodwill and intangible assets 996,668 1,000,853 (4,185) -0.4% 19.0% 19.2%Deferred income tax assets – net 22,376 24,383 (2,007) -8.2% 0.4% 0.5%Other noncurrent assets 342,405 334,166 8,239 2.5% 6.5% 6.4%Total Noncurrent Assets 3,874,449 3,909,332 (34,883) -0.9% 73.7% 75.0%TOTAL ASSETS $5,255,188 $5,209,697 $45,491 0.9% 100.0% 100.0%
LIABILITIES AND EQUITYCurrent LiabilitiesAccounts payable and accrued expenses $482,708 $462,122 $20,586 4.5% 9.2% 8.9%Income tax payable 22,137 9,335 12,802 137.1% 0.4% 0.2%Loans payable 12,493 12,493 - 0.0% 0.2% 0.2%Dividends payable - 53,784 (53,784) -100.0% 0.0% 1.0%Current portion of:
Long-term debts 491,177 300,100 191,077 63.7% 9.3% 5.8%Lease liabilities 3,965 4,006 (41) -1.0% 0.1% 0.1%Derivative liabilities 1,250 425 825 194.1% 0.0% 0.0%
Total Current Liabilities 1,013,730 842,265 171,465 20.4% 19.3% 16.2%Noncurrent Liabilities Long-term debts – net of current portion 1,407,438 1,621,969 (214,531) -13.2% 26.8% 31.1%Retirement and other post-employment benefits 39,982 38,437 1,545 4.0% 0.8% 0.7%Derivative liabilities – net of current portion 12,556 5,125 7,431 145.0% 0.2% 0.1%Deferred income tax liabilities – net 22,669 23,062 (393) -1.7% 0.4% 0.4%Other noncurrent liabilities 88,141 87,340 801 0.9% 1.7% 1.7%Total Noncurrent Liabilities 1,570,786 1,775,933 (205,147) -11.6% 29.9% 34.1%Total Liabilities 2,584,516 2,618,198 (33,682) -1.3% 49.2% 50.3%Equity Attributable to Equity Holders of the Parent CompanyRedeemable preferred stock 77,926 77,926 0 0.0% 1.5% 1.5%Common stock 75,123 75,123 0 0.0% 1.4% 1.4%Additional paid-in capital 1,242,294 1,242,294 0 0.0% 23.6% 23.8%Cumulative translation adjustments (153,360) (151,094) (2,266) 1.5% -2.9% -2.9%Accumulated unrealized gain on financial assets at fair value through other comprehensive income (FVOCI) 607 617 (10) -1.6% 0.0% 0.0%Equity reserve (232,965) (232,965) 0 0.0% -4.4% -4.5%Retained earnings 1,543,343 1,478,179 65,164 4.4% 29.4% 28.4%Cost of stocks held in treasury: 0.0%
Redeemable preferred stock (325,999) (325,999) 0 0.0% -6.2% -6.3%Common stock (43,609) (39,102) (4,507) 11.5% -0.8% -0.8%
Sub-total 2,183,360 2,124,979 58,381 2.7% 41.5% 40.8%Non-controlling Interests 487,312 466,520 20,792 4.5% 9.3% 9.0%Total Equity 2,670,672 2,591,499 79,173 3.1% 50.8% 49.7%TOTAL LIABILITIES AND EQUITY $5,255,188 $5,209,697 $45,491 0.9% 100.0% 100.0%
17 | P a g e
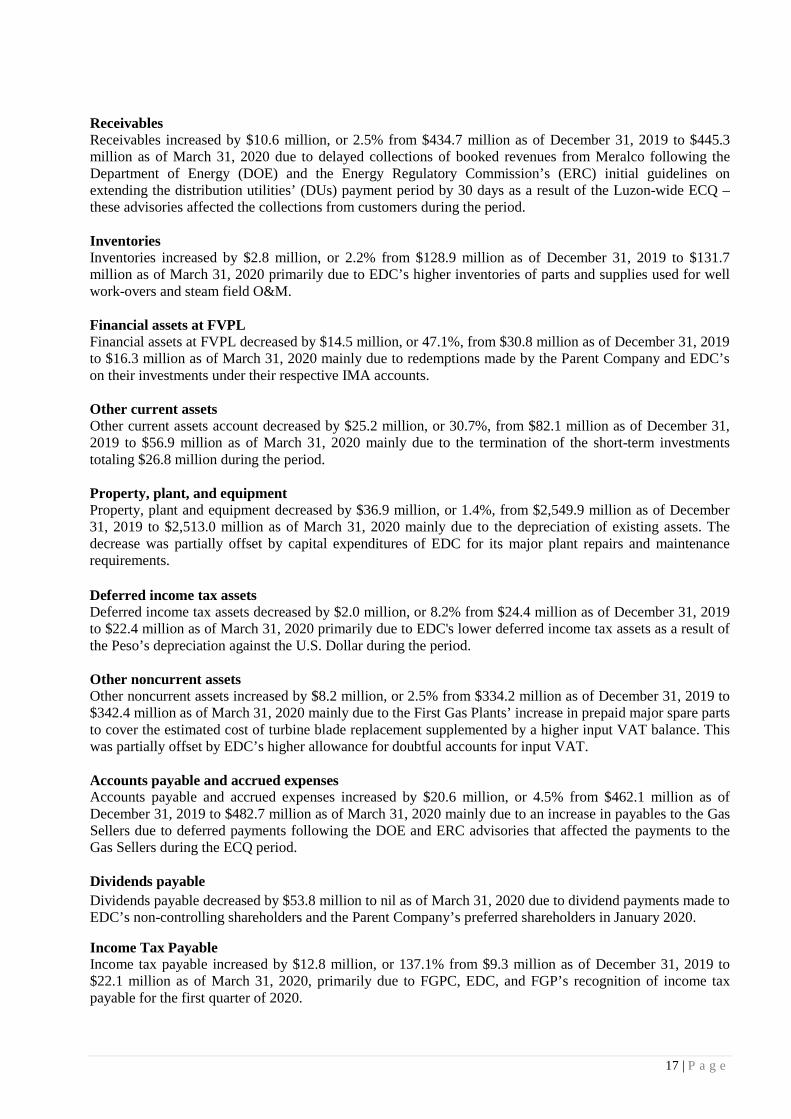
Receivables Receivables increased by $10.6 million, or 2.5% from $434.7 million as of December 31, 2019 to $445.3 million as of March 31, 2020 due to delayed collections of booked revenues from Meralco following the Department of Energy (DOE) and the Energy Regulatory Commission’s (ERC) initial guidelines on extending the distribution utilities’ (DUs) payment period by 30 days as a result of the Luzon-wide ECQ – these advisories affected the collections from customers during the period. Inventories Inventories increased by $2.8 million, or 2.2% from $128.9 million as of December 31, 2019 to $131.7 million as of March 31, 2020 primarily due to EDC’s higher inventories of parts and supplies used for well work-overs and steam field O&M. Financial assets at FVPL Financial assets at FVPL decreased by $14.5 million, or 47.1%, from $30.8 million as of December 31, 2019 to $16.3 million as of March 31, 2020 mainly due to redemptions made by the Parent Company and EDC’s on their investments under their respective IMA accounts. Other current assets Other current assets account decreased by $25.2 million, or 30.7%, from $82.1 million as of December 31, 2019 to $56.9 million as of March 31, 2020 mainly due to the termination of the short-term investments totaling $26.8 million during the period. Property, plant, and equipment Property, plant and equipment decreased by $36.9 million, or 1.4%, from $2,549.9 million as of December 31, 2019 to $2,513.0 million as of March 31, 2020 mainly due to the depreciation of existing assets. The decrease was partially offset by capital expenditures of EDC for its major plant repairs and maintenance requirements. Deferred income tax assets Deferred income tax assets decreased by $2.0 million, or 8.2% from $24.4 million as of December 31, 2019 to $22.4 million as of March 31, 2020 primarily due to EDC's lower deferred income tax assets as a result of the Peso’s depreciation against the U.S. Dollar during the period. Other noncurrent assets Other noncurrent assets increased by $8.2 million, or 2.5% from $334.2 million as of December 31, 2019 to $342.4 million as of March 31, 2020 mainly due to the First Gas Plants’ increase in prepaid major spare parts to cover the estimated cost of turbine blade replacement supplemented by a higher input VAT balance. This was partially offset by EDC’s higher allowance for doubtful accounts for input VAT. Accounts payable and accrued expenses Accounts payable and accrued expenses increased by $20.6 million, or 4.5% from $462.1 million as of December 31, 2019 to $482.7 million as of March 31, 2020 mainly due to an increase in payables to the Gas Sellers due to deferred payments following the DOE and ERC advisories that affected the payments to the Gas Sellers during the ECQ period. Dividends payable Dividends payable decreased by $53.8 million to nil as of March 31, 2020 due to dividend payments made to EDC’s non-controlling shareholders and the Parent Company’s preferred shareholders in January 2020.
Income Tax Payable Income tax payable increased by $12.8 million, or 137.1% from $9.3 million as of December 31, 2019 to $22.1 million as of March 31, 2020, primarily due to FGPC, EDC, and FGP’s recognition of income tax payable for the first quarter of 2020.

18 | P a g e
Long-term debt – current portion The current portion of long-term debt increased by $191.1 million, or 63.7%, from $300.1 million as of December 31, 2019 to $491.2 million as of March 31, 2020 mainly due to the reclassification of EDC’s $181.1 million Note from the noncurrent portion of long-term debt partially offset by the scheduled loan payments of EDC and FNPC. Derivative liabilities –current portion The current portion of derivative liabilities increased by $0.8 million, or 194.1%, from $0.4 million as of December 31, 2019 to $1.2 million as of March 31, 2020 due to the unfavorable MTM valuation adjustment of EDC‘s derivative assets which are used to hedge against possible foreign exchange losses and interest rate risks resulting in a net liability position. Long-term debt – net of current portion Long-term debt decreased by $214.5 million, or 13.2%, from $1,622.0 million as of December 31, 2019 to $1,407.5 million as of March 31, 2020 mainly due to the reclassification of EDC’s $181.1 million Note from to the current portion of long-term debt as mentioned above. Retirement and other post-employment benefits This account increased by $1.6 million, or 4.0%, from $38.4 million as of December 31, 2019 to $40.0 million as of March 31, 2020 mainly due to the recognition of retirement expense provisions during the period. Derivative liabilities – net of current portion Derivative liabilities increased by $7.4 million from $5.1 million as of December 31, 2019 to $12.5 million as of March 31, 2020 mainly due to the unfavorable MTM valuation adjustment of EDC’s derivative assets which hedge against possible foreign exchange and interest rate risks resulting to a net liability position. Retained earnings Retained earnings increased by $65.2 million, or 4.4%, from $1,478.1 million as of December 31, 2019 to $1,543.3 million as of March 31, 2020. The increase was due to the First Gen Group’s attributable earnings to the Parent Company of $65.2 million for the first quarter of 2020. LIQUIDITY AND CAPITAL RESOURCES
We rely largely on operating cash flows, borrowings, and capital-raising to provide our liquidity requirements. Due to our significant operating cash flows as well as our financial assets, access to capital markets, available lines of credit, and revolving credit agreements, we believe that we have, and will maintain, the ability to meet our liquidity needs for the foreseeable future, which include:
• the working capital requirements of our operations; • investments in our business; • dividend payments; • share repurchases; • paying down outstanding debt; • contributions to our retirement plans and other post-employment benefits; and • business development activities.
The near-term outlook for our business remains sound, and we expect to generate sufficient cash flows from operations and financing activities, which will give us significant flexibility to meet our financial commitments. We normally use debt financing to lower our overall cost of capital and increase our return on stockholders' equity. We have a history of borrowing funds domestically and internationally, and continue to have the ability to borrow funds at reasonable interest rates.

19 | P a g e
The following table shows our consolidated cash flows for the periods ended March 31, 2020 and 2019, and provides certain relevant measures of our liquidity and capital resources as of March 31, 2020 and December 31, 2019:
(in Thousand U.S. Dollars except for For the periods ended March 31 financial ratios and % change 2020 2019 Change YoY % Consolidated Cash Flows Net cash flows from operating activities $212,666 $194,655 $18,011 9.3% Net cash flows used in investing activities (7,738) (12,052) 4,314 -35.8% Net cash flows used in financing activities (98,341) (118,906) 20,565 -17.3% Total Capital Expenditures1 $17,292 $23,168 ($5,876) -25.4% Effect of foreign exchange rate changes in cash & cash equivalents $15 $798 ($783) -98.1%
1 Total capital expenditures include additions to property, plant and equipment, exploration and evaluation assets, intangible assets, and
capitalized borrowing costs for the year regardless of whether payment was made or not.
Capitalization March 2020 Dec. 2019 Change YoY % Interest-bearing debts:
Loans payable $12,493 $12,493 $0 0.0% Current portion 491,177 300,100 191,077 63.7% Noncurrent portion 1,407,438 1,621,969 (214,531) -13.2%
Total interest-bearing long-term debt 1,911,108 1,934,562 (23,454) -1.2% Total equity attributable to equity holders of the Parent Company 2,183,360 2,124,979 58,381 2.7% $4,094,468 $4,059,541 $34,927 0.9% Other Selected Financial Data March 2020 Dec. 2019 Total assets $5,255,188 $5,209,697 Cash and cash equivalents $730,483 $623,881 Financial assets at FVPL 16,310 30,848
$746,793 $654,729
The First Gen Group's total consolidated assets as of March 31, 2020 amounted to $5.3 billion, which is slightly higher by $45.5 million or 0.9%, compared to $5.2 billion as of December 31, 2019. Consolidated cash and cash equivalents and financial assets at FVPL amounted to $746.8 million as of March 31, 2020, $92.1 million or 14.1% higher compared to $654.7 million as of December 31, 2019. Principal sources of cash and cash equivalents in the first quarter of 2020 were cash generated from operations, which were partially offset by the scheduled and voluntary principal and interest payments on First Gen Group’s existing loans, payments of dividends to preferred stockholders, capital expenditures, and the buyback of common stocks. Cash Flows from Operating Activities Net cash flows from operating activities increased by $18.0 million, or 9.3% to $212.7 million in the first quarter of 2020 from $194.7 million in the same period last year. This was primarily due to the absence of short-term investments and DSRA funding booked as current assets this year, both of which reduced cash flows from operating activities last year. This was partially offset by lower EBITDA from FG Hydro, FGPC, FNPC, PMPC, and FGP.
20 | P a g e
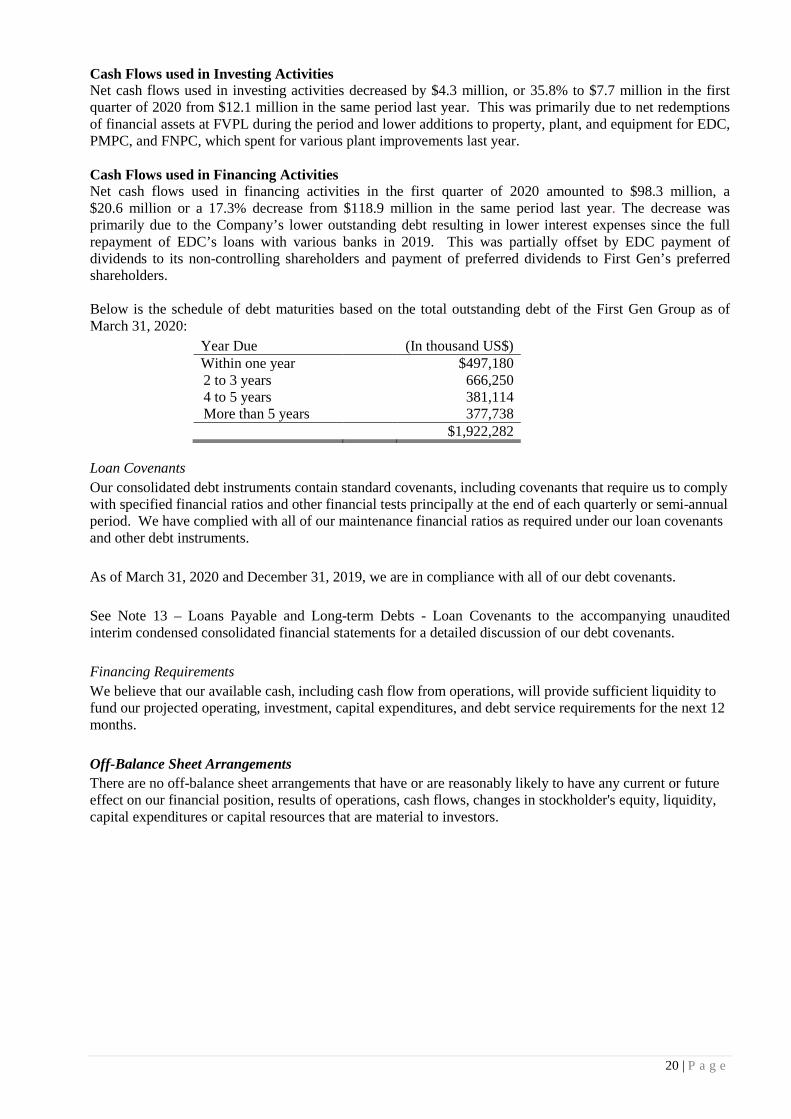
Cash Flows used in Investing Activities Net cash flows used in investing activities decreased by $4.3 million, or 35.8% to $7.7 million in the first quarter of 2020 from $12.1 million in the same period last year. This was primarily due to net redemptions of financial assets at FVPL during the period and lower additions to property, plant, and equipment for EDC, PMPC, and FNPC, which spent for various plant improvements last year. Cash Flows used in Financing Activities Net cash flows used in financing activities in the first quarter of 2020 amounted to $98.3 million, a $20.6 million or a 17.3% decrease from $118.9 million in the same period last year. The decrease was primarily due to the Company’s lower outstanding debt resulting in lower interest expenses since the full repayment of EDC’s loans with various banks in 2019. This was partially offset by EDC payment of dividends to its non-controlling shareholders and payment of preferred dividends to First Gen’s preferred shareholders. Below is the schedule of debt maturities based on the total outstanding debt of the First Gen Group as of March 31, 2020:
Year Due (In thousand US$) Within one year $497,180 2 to 3 years 666,250 4 to 5 years 381,114 More than 5 years 377,738 $1,922,282
Loan Covenants Our consolidated debt instruments contain standard covenants, including covenants that require us to comply with specified financial ratios and other financial tests principally at the end of each quarterly or semi-annual period. We have complied with all of our maintenance financial ratios as required under our loan covenants and other debt instruments. As of March 31, 2020 and December 31, 2019, we are in compliance with all of our debt covenants. See Note 13 – Loans Payable and Long-term Debts - Loan Covenants to the accompanying unaudited interim condensed consolidated financial statements for a detailed discussion of our debt covenants. Financing Requirements We believe that our available cash, including cash flow from operations, will provide sufficient liquidity to fund our projected operating, investment, capital expenditures, and debt service requirements for the next 12 months. Off-Balance Sheet Arrangements There are no off-balance sheet arrangements that have or are reasonably likely to have any current or future effect on our financial position, results of operations, cash flows, changes in stockholder's equity, liquidity, capital expenditures or capital resources that are material to investors.
21 | P a g e
FINANCIAL SOUNDNESS INDICATORS
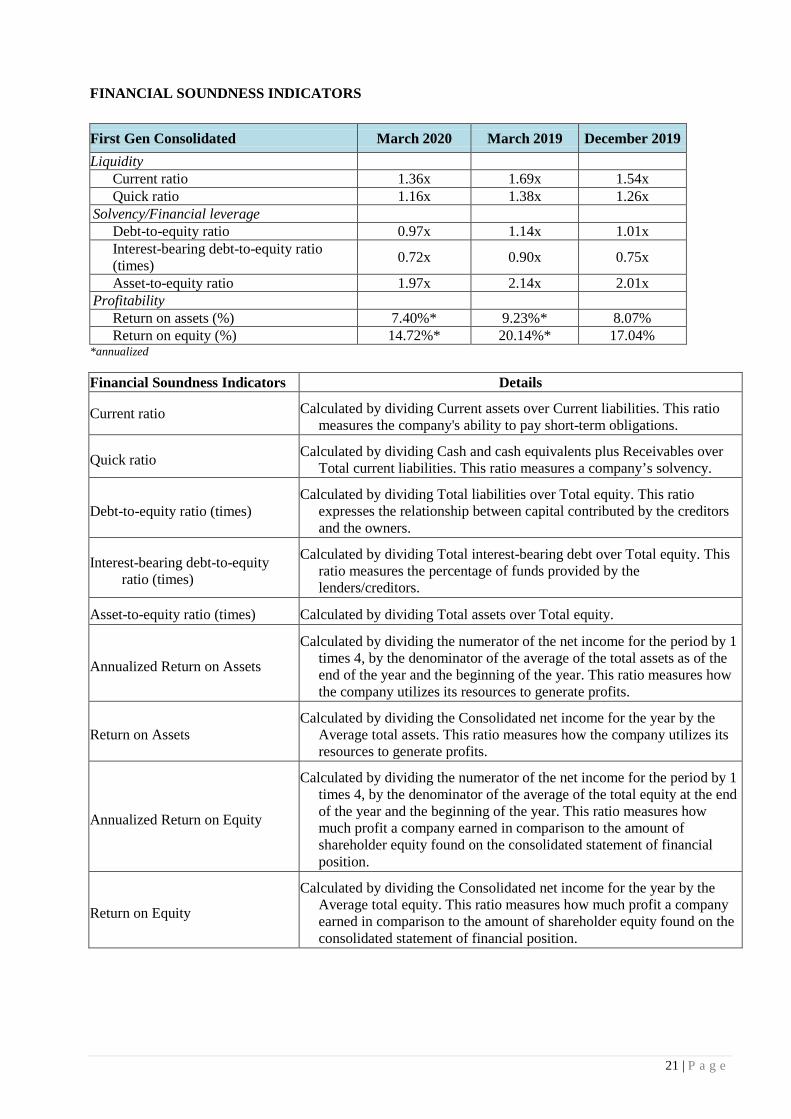
First Gen Consolidated March 2020 March 2019 December 2019 Liquidity
Current ratio 1.36x 1.69x 1.54x Quick ratio 1.16x 1.38x 1.26x
Solvency/Financial leverage Debt-to-equity ratio 0.97x 1.14x 1.01x Interest-bearing debt-to-equity ratio (times) 0.72x 0.90x 0.75x
Asset-to-equity ratio 1.97x 2.14x 2.01x Profitability
Return on assets (%) 7.40%* 9.23%* 8.07% Return on equity (%) 14.72%* 20.14%* 17.04%
*annualized Financial Soundness Indicators Details
Current ratio Calculated by dividing Current assets over Current liabilities. This ratio measures the company's ability to pay short-term obligations.
Quick ratio Calculated by dividing Cash and cash equivalents plus Receivables over Total current liabilities. This ratio measures a company’s solvency.
Debt-to-equity ratio (times) Calculated by dividing Total liabilities over Total equity. This ratio
expresses the relationship between capital contributed by the creditors and the owners.
Interest-bearing debt-to-equity ratio (times)
Calculated by dividing Total interest-bearing debt over Total equity. This ratio measures the percentage of funds provided by the lenders/creditors.
Asset-to-equity ratio (times) Calculated by dividing Total assets over Total equity.
Annualized Return on Assets
Calculated by dividing the numerator of the net income for the period by 1 times 4, by the denominator of the average of the total assets as of the end of the year and the beginning of the year. This ratio measures how the company utilizes its resources to generate profits.
Return on Assets Calculated by dividing the Consolidated net income for the year by the
Average total assets. This ratio measures how the company utilizes its resources to generate profits.
Annualized Return on Equity
Calculated by dividing the numerator of the net income for the period by 1 times 4, by the denominator of the average of the total equity at the end of the year and the beginning of the year. This ratio measures how much profit a company earned in comparison to the amount of shareholder equity found on the consolidated statement of financial position.
Return on Equity
Calculated by dividing the Consolidated net income for the year by the Average total equity. This ratio measures how much profit a company earned in comparison to the amount of shareholder equity found on the consolidated statement of financial position.

22 | P a g e
DISCUSSIONS OF MAJOR SUBSIDIARIES
FGPC
For the periods ended March 31 (Unaudited)
(in USD thousands) 2020 2019 Revenues from sale of electricity 158,633 171,591 Operating income 32,582 37,927 Net income 21,790 26,456 As of the periods ended
(in USD thousands) March 31, 2020 (Unaudited)
Dec. 31, 2019 (Audited)
Total Assets 779,243 724,515 Debt - net of debt issuance costs 331,867 331,632 Other Liabilities 188,461 151,304 Total Equity 258,915 241,579
March 2020 vs. March 2019 Results FGPC’s revenues decreased by $13.0 million, or 7.6% to $158.6 million in the first quarter of 2020 from $171.6 million in the same period in 2019. The decrease in revenues was primarily attributable to lower fuel revenues from natural gas consumption and lower average gas prices ($8.3/MMBtu in 2020 from $9.30/MMBtu in 2019) coupled with Sta. Rita’s lower average plant dispatch (69.8% in 2020 compared to 71.5% in 2019). However, the decrease was partially offset by Sta. Rita’s slightly higher average NDC (1,095 MW in 2020 compared to 1,091 MW in 2019). Operating income decreased by $5.3 million, or 14.1% to $32.6 million in the first quarter of 2020 primarily due to higher G&A expenses, compared to $37.9 million in the same period last year. FGPC posted a net income of $21.8 million in the first quarter of 2020, lower by $4.7 million or 17.6% from the $26.5 million of income generated in the same period in 2019. The decrease in net income was mainly due to lower operating income and lower benefit from deferred income tax. ASSETS FGPC’s total assets as of March 31, 2020 stood at $779.2 million, an increase of $54.7 million, or 7.6% higher than the balance of $724.5 million as of December 31, 2019 due to the movement in the following accounts:
• Higher ending cash balances from operations; • Higher level of trade and other receivables; and • Increase in prepaid major spare parts pending the installation of new turbine blades in the plant.
These were partially offset by:
• Depreciation and amortization of property, plant and equipment; and • Lower financial assets at Fair Value through Other Comprehensive Income (FVOCI) due to
unfavorable movements in their MTM valuation. LIABILITIES AND EQUITY FGPC’s total liabilities amounted to $520.3 million as of March 31, 2020, higher by $37.4 million or 7.7% from $482.9 million as of December 31, 2019. The increase in liabilities is primarily due to the recognition of additional income tax payable for the first quarter of 2020, interest accrual on long-term debts, and increase in outstanding accounts payable to suppliers.

23 | P a g e
Total equity increased by $17.3 million, or 7.2% to $258.9 million as of March 31, 2020 as compared to $241.6 million at the beginning of year. The increase was mainly due to the net income earned during the period.
FGP Corp.
For the periods ended March 31 (Unaudited)
(in USD thousands) 2020 2019 Revenues from sale of electricity 80,707 90,672 Operating income 17,272 18,085 Net income 11,730 11,915 As of the periods ended
(in USD thousands) March 31, 2020 (Unaudited)
Dec. 31, 2019 (Audited)
Total Assets 480,013 460,854 Debt - net of debt issuance costs 205,268 205,174 Other Liabilities 136,234 128,276 Total Equity 138,511 127,404
March 2020 vs. March 2019 Results FGP’s revenues decreased by $10.0 million, or 11.0% to $80.7 million for the first quarter of 2020 from $90.7 million for the same period in 2019. The decrease in revenues was primarily due to lower fuel revenues from natural gas consumption and lower average gas prices ($8.3/MMBtu in 2020 as compared to $9.3/MMBtu in 2019) coupled with San Lorenzo’s lower average plant dispatch (71.5% in 2020 compared to 76.2% in 2019). However, the decrease was partially offset by San Lorenzo’s higher average NDC (567 MW in 2020 compared to 558 MW in 2019). Operating income decreased by $0.8 million, or 4.5% to $17.3 million for the first quarter of 2020 primarily due to higher G&A expenses compared to $18.1 million for the same period in 2019. Net income decreased by $0.2 million, or 1.6% to $11.7 million for the first quarter of 2020 from $11.9 million in the same period last year due to lower operating income and lower benefit from deferred income tax. ASSETS FGP’s total assets as of March 31, 2020 stood at $480.0 million, which increased by $19.2 million, or 4.2% from $460.8 million as of December 31, 2019 mainly due to the movement in the following accounts:
• Higher ending cash balances from operations; • Higher level of trade and other receivables; and • Increase in prepaid major spare parts pending installation of new turbine blades in the plant.
These were partially offset by depreciation and amortization of property, plant and equipment. LIABILITIES AND EQUITY
As of March 31, 2020, total liabilities increased by $8.1 million, or 2.4% to $341.5 million from $333.4 million as of December 31, 2019 mainly due the recognition of an income tax payable for the first quarter of 2020, interest accrual on long-term debts, and an increase in outstanding accounts payable to suppliers partially offset by the payment of dividends payable. Total equity increased by $11.1 million, or 8.7% to $138.5 million as of March 31, 2020 as compared to $127.4 million as of December 31, 2019. The increase in equity was mainly due to the net income earned during the period partially offset by an unfavorable movement in the MTM valuation of financial assets at FVOCI recognized under “Accumulated other comprehensive income” account.

24 | P a g e
FNPC
For the periods ended March 31 (Unaudited)
(in USD thousands) 2020 2019 Revenues from sale of electricity 46,209 59,654 Cost of sales 33,169 46,094 General and administrative expenses 3,057 2,339 Operating income 9,983 11,221 Net income 8,076 9,237 As of the periods ended
(in USD thousands) March 31, 2020 (Unaudited)
Dec. 31, 2019 (Audited)
Total assets 458,815 464,782 Debt - net of debt issuance costs 142,358 151,309 Other liabilities 42,002 47,093 Total equity 274,455 266,380
March 2020 vs. March 2019 Results FNPC recognized lower revenues by $13.5 million, or 22.5% to $46.2 million for the first quarter of 2020 compared to $59.7 million for the same period last year. The decrease was mainly due to lower capacity fees billed to Meralco due to its scheduled maintenance outage, which coincided with the end of its PSA Contract year 2 in January 2020, supplemented by lower dispatch in the first quarter of 2020 at 49.4% compared to 67.8% in the same period last year. For the first quarter of 2020, operating income stood at $10.0 million - a decrease of $1.2 million or 11.0% from the operating income earned during the same period in 2019. This is mainly due to lower electricity sales though partially offset by lower cost of sales during the period. FNPC posted a net income of $8.1 million in the first quarter in 2020, lower by $1.1 million, or 12.6% compared to $9.2 million in the same period in 2019 due to lower operating income and less foreign exchange gains, and recognition of provision for deferred income taxes (reversal of benefit from deferred income taxes in 2019). ASSETS FNPC’s total assets as of March 31, 2020 decreased by $6.0 million, or 1.3% to $458.8 million from a balance of $464.8 million as of December 31, 2019 due to the movement in the following accounts:
• Decrease in short-term investments; • Depreciation of property, plant and equipment • Amortization of right-of-use asset; and • Amortization of the project’s O&M mobilization fee for the period.
The decrease was partially offset by an increase in trade receivables. LIABILITIES AND EQUITY FNPC’s total liabilities amounted to $184.4 million as of March 31, 2020, lower by $14.0 million or 7.1%, from the December 31, 2019 balance of $198.4 million. This was due to a decrease in accounts payable and accrued expenses and a regular debt service payment in March 2020. Total equity increased by $8.1 million, or 3.0%, to $274.5 million as of March 31, 2020 as compared to $266.4 million as of December 31, 2019 mainly due to net income earned during the period.
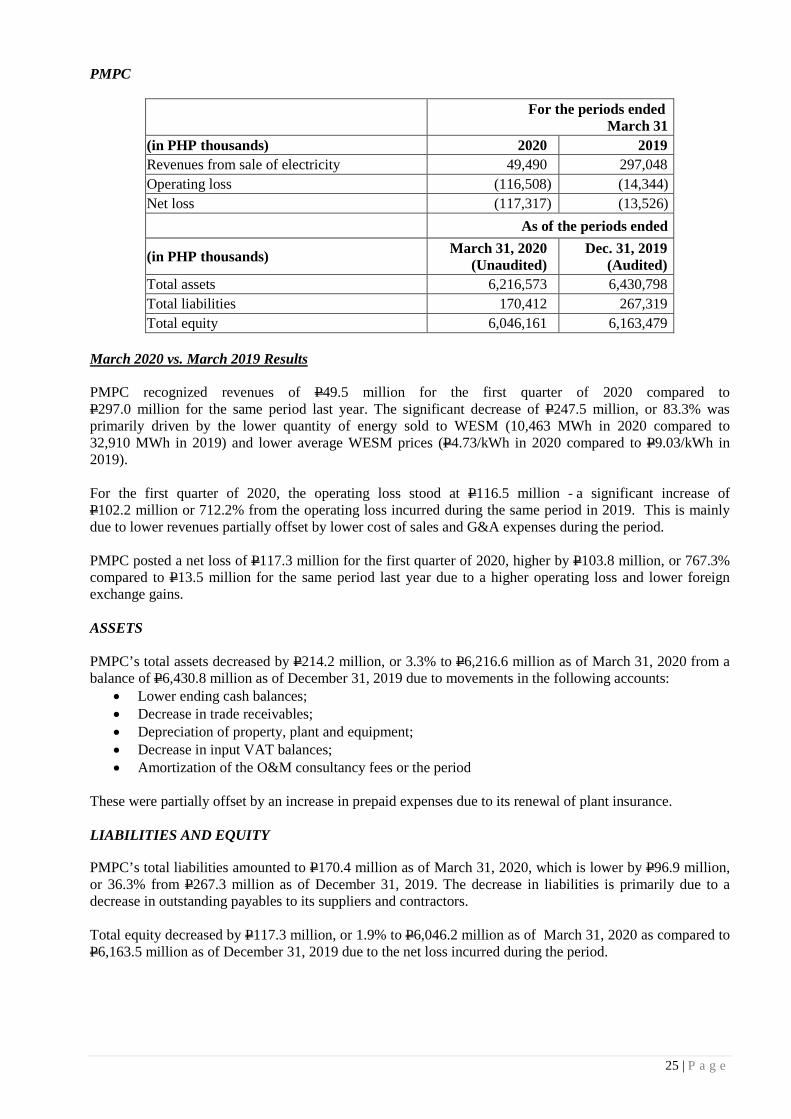
25 | P a g e
PMPC
For the periods ended March 31
(in PHP thousands) 2020 2019 Revenues from sale of electricity 49,490 297,048 Operating loss (116,508) (14,344) Net loss (117,317) (13,526)
As of the periods ended
(in PHP thousands) March 31, 2020 (Unaudited)
Dec. 31, 2019 (Audited)
Total assets 6,216,573 6,430,798 Total liabilities 170,412 267,319 Total equity 6,046,161 6,163,479
March 2020 vs. March 2019 Results
PMPC recognized revenues of P49.5 million for the first quarter of 2020 compared to P297.0 million for the same period last year. The significant decrease of P247.5 million, or 83.3% was primarily driven by the lower quantity of energy sold to WESM (10,463 MWh in 2020 compared to 32,910 MWh in 2019) and lower average WESM prices (P4.73/kWh in 2020 compared to P9.03/kWh in 2019).
For the first quarter of 2020, the operating loss stood at P116.5 million - a significant increase of P102.2 million or 712.2% from the operating loss incurred during the same period in 2019. This is mainly due to lower revenues partially offset by lower cost of sales and G&A expenses during the period.
PMPC posted a net loss of P117.3 million for the first quarter of 2020, higher by P103.8 million, or 767.3% compared to P13.5 million for the same period last year due to a higher operating loss and lower foreign exchange gains.
ASSETS
PMPC’s total assets decreased by P214.2 million, or 3.3% to P6,216.6 million as of March 31, 2020 from a balance of P6,430.8 million as of December 31, 2019 due to movements in the following accounts:
• Lower ending cash balances;• Decrease in trade receivables;• Depreciation of property, plant and equipment;• Decrease in input VAT balances;• Amortization of the O&M consultancy fees or the period
These were partially offset by an increase in prepaid expenses due to its renewal of plant insurance.
LIABILITIES AND EQUITY
PMPC’s total liabilities amounted to P170.4 million as of March 31, 2020, which is lower by P96.9 million, or 36.3% from P267.3 million as of December 31, 2019. The decrease in liabilities is primarily due to a decrease in outstanding payables to its suppliers and contractors.
Total equity decreased by P117.3 million, or 1.9% to P6,046.2 million as of March 31, 2020 as compared to P6,163.5 million as of December 31, 2019 due to the net loss incurred during the period.

26 | P a g e
EDC Consolidated
For the periods ended
March 31 (in PHP millions) 2020 2019 Revenues from sale of electricity 9,856.3 10,740.3 Foreign exchange gains (losses) – net (20.1) 15.7 Income before income tax 3,575.2 4,350.9 Net income 3,194.0 3,885.6 Net income attributable to Equity
holders of the Parent Company 3,048.5 3,583.3 Recurring Net Income (RNI) 3,212.3 3,662.3 RNI attributable to Equity holders of the
Parent Company 3,067.7 3,360.2 As of the periods ended
(in PHP millions) March 31, 2020
(Unaudited) Dec. 31,2019
(Audited) Total Assets 132,298.5 134,876.8 Total Liabilities 69,956.4 75,071.8 Total Equity 62,342.1 59,805.0
March 2020 vs. March 2019 Results
EDC posted a net income of P3,194.0 million for the first quarter of 2020, a 17.8% or P691.6 million decrease from the P3,885.6 million for the same period last year. The decrease was mainly driven by a P884.0 million decrease in revenues, a P119.8 million decrease in interest income, and a P369.4 million decrease in proceeds from insurance claims, which was partly offset by a combined decrease in costs of sales and G&A expenses amounting to P316.7 million. Total revenues from the sale of electricity in the first quarter of 2020 decreased by 8.2% or P884.0 million to P9,856.3 million, from P10,740.3 million in the same period last year primarily due to the lower sales volume of the EDC geothermal plants and lower WESM average prices. EDC’s recurring net income decreased by 12.3%, or P450.0 million from P3,662.3 million for the first quarter of 2019 to P3,212.3 million for same period in 2020. The decrease is attributable to a decrease in revenues by P884.0 million, partly offset by a combined decrease in cost of sales and G&A expenses by P316.7 million and a decrease in provision for current income tax by P165.0 million. ASSETS EDC’s total assets as of March 31, 2020 stood at P132,298.5 million, a decrease of P2,578.3 million, or 1.9% from P134,876.8 million as of December 31, 2019 mainly due to movements in the following accounts:
• Decrease in financial assets as FVPL accounts due to a termination of a money market placement; and
• Lower trade and other receivables as a result of a decrease in trade receivables from NPC and other receivables from insurance claims.
LIABILITIES AND EQUITY Total liabilities amounted to P69,956.4 million as of March 31, 2020, lower by P5,115.4 million or 6.8% from P75,071.8 million as of December 31, 2019 primarily due to payments to suppliers and payments of dividends to common stockholders last January 2020. Total equity amounted to P62,342.1 million as of March 31, 2020, which increased by P2,537.1 million or 4.2% from P59,805.0 million as of December 31, 2019, mainly due to net income earned during the period though partially offset by an unfavorable movement of the cumulative translation adjustment of foreign currency denominated subsidiaries.

27 | P a g e
FG Hydro
(Amounts in PHP millions)
For the periods ended March 31 (Unaudited)
2020 2019 Operating revenues 679.5 1,109.2 Cost of sales 196.6 192.7 General and administrative expenses 80.3 76.7 Operating profit 402.6 839.8 Other (income) expenses – net (2.7) (1.6) Income before tax 405.3 841.4 Provision for income tax 41.1 84.3 Net income 364.2 757.1 As of the periods ended March 31, 2020
(Unaudited) Dec. 31, 2019
(Audited) Total assets 5,464.2 5,136.5 Total liabilities 175.7 212.1 Total equity 5,288.5 4,924.4
March 2020 vs. March 2019 Results
FG Hydro’s revenues decreased by 38.7% or P429.7 million to P679.5 million for the first quarter of 2020 from the revenues of P1,109.2 million for the same period in 2019. The unfavorable variance was mainly on account of a 40.7% drop in average WESM spot prices and a 10.5% decrease in electricity generated during the period. The decline in generated electricity was due to the lower Pantabangan reservoir elevation. The unfavorable variance was partly offset by the higher amount of revenues from ancillary services, which increased by 86% or P41.1 million to P88.9 million as compared to P47.8 million for the same period in 2019. Cost of sales for the first quarter of 2020 of P196.6 million was P3.9 million or 2.0% higher than the P192.7 million in 2019. The unfavorable variance was mainly due to an increase in replacement power purchases from WESM in 2020. G&A expenses also increased by P3.6 million or 4.7% to P80.3 million during the period as compared to P76.7 million in 2019. The unfavorable variance was mainly due to a higher insurance expense. Provision for income tax in the first quarter of 2020 of P41.1 million is 51.2% or P43.2 million lower than the P84.3 million in the same period in 2019 mainly due to lower income from operations in 2020. Overall, FG Hydro’s net income dropped by 51.9% or P392.9 million to P364.2 million in the first quarter of 2020 from the P757.1 million reported income in the same period last year. ASSETS Total assets as of March 31, 2020 stood at P5,464.2 million, P327.7 million or 6.4% higher than the December 31, 2019 level of P5,136.5 million. The favorable variance was mainly on account of higher available funds invested in money markets and accounts receivable balance in 2020. LIABILITIES AND EQUITY As of March 31, 2020, total liabilities stood at P175.7 million, P36.4 million or 17.2% lower than the December 31, 2019 level of P212.1 million. The favorable variance is mainly on account of lower balance of trade payables for the period ended March 31, 2020. Total equity as of March 31, 2020 rose to P5,288.5 million, P364.1 million or 7.4% better than the December 31, 2019 level of P4,924.4 million mainly from net income earned during the period.

28 | P a g e
FACTORS AFFECTING THE COMPANY’S RESULTS OF OPERATIONS
Set out below are some of the more significant factors that have affected and continue to affect the Company’s results of operations. Impact of Coal Philippine power supply is dominated by coal plants due to readily available coal supply globally. Substantially large supplies of natural gas that can be drilled, low natural gas prices, and mounting environmental regulations have weakened demand for coal globally. While the rest of the world is using the least amount of coal to make electricity, “cheap” coal has established itself as the Philippines’ main power generating fuel, where coal-fired plants constitute 77.5% of DOE’s announced incoming capacities up to 2025. With electric power industry policy and decision makers tolerant of the fact that the heavy reliance on imported fossil fuel, such as coal, exposes the Philippines to volatile fuel prices and huge environmental costs, the country appears to be moving towards a coal-dominated future. This dictates many things in the industry, such as benchmark pricing of power, dispatch protocols, and bidding behavior in the WESM, among others. Exchange Rate Fluctuations The functional and presentation currency of some of the Company’s subsidiaries is the Philippine Peso. However, its payments for debt service and major inputs and services are denominated substantially in U.S. Dollars. Foreign exchange rate fluctuations affect the cost of borrowings, as well as the Philippine Peso value of such in their respective financial statements. The unit prices for majority of the SSA and PPA of EDC are indexed to the U.S. Dollar vis-à-vis the Philippine Peso. Major Risks The First Gen Group’s principal financial liabilities are comprised of loans payable and long-term debt, among others. The main purpose of these financial liabilities is to raise financing for the First Gen Group’s growth and operations. The First Gen Group has other various financial assets and liabilities such as cash and cash equivalents, receivables, amounts due to and from related parties, and accounts payable and accrued expenses, which arise directly from its operations. As a matter of policy, the First Gen Group does not trade its financial instruments. However, the First Gen Group enters into derivative and hedging transactions, primarily interest rate swaps, cross-currency swaps and foreign currency forwards, as needed, for the sole purpose of managing the relevant financial risks that are associated with the First Gen Group’s borrowing activities and as required by lenders in certain cases. The First Gen Group has an Enterprise-Wide Risk Management Program, which is aimed at identifying risks based on the likelihood of occurrence and impact to the business, formulate risk management strategies, assess risk management capabilities and continuously monitor the risk management efforts. The main financial risks arising from the First Gen Group’s financial instruments are interest rate risk, foreign currency risk, credit risk and liquidity risk. The Board of Directors reviews and approves policies for managing each of these risks as summarized below. Interest Rate Risk The First Gen Group’s exposure to the risk of changes in market interest rate relates primarily to the First Gen Group’s long-term debt obligations that are subject to floating interest rates, derivative assets, derivative liabilities, and financial assets at FVOCI and FVPL. The First Gen Group believes that prudent management of its interest cost will entail a balanced mix of fixed and variable rate debt. On a regular basis, the Finance team of the First Gen Group monitors the interest rate exposure and presents it to management by way of a compliance report. To manage the exposure to floating interest rates in a cost-efficient manner, the First Gen Group may consider prepayment, refinancing, or hedging the risks as deemed necessary and feasible. In 2013, FGP entered into three interest rate swap (IRS) agreements to cover interest payments up to 24.3% of its Term Loan Facility. In the last quarter of 2014, EBWPC entered into four (4) IRS with aggregate notional amount of $150.0 million. This is to partially hedge the interest rate risks on its ECA and
29 | P a g e
Commercial Debt Facilities (the Foreign Facility) that is benchmarked against U.S. LIBOR and with flexible interest reset feature that allows EBWPC to select the interest reset frequency to be applied. In 2016, EBWPC entered into three (3) additional IRS with aggregate notional amount of $30.0 million. Under these swap agreements, FGP and EBWPC agreed to exchange, at specific intervals, the difference between fixed and variable rate interest amounts calculated by reference to the agreed-upon notional principal amounts. As of March 31, 2020, approximately 60.4% of First Gen Group’s borrowings are subject to fixed interest rate after considering the effect of its IRS agreements. Foreign Currency Risk Foreign Currency Risk with Respect to Philippine Peso, Euro and Other Foreign Currencies The First Gen Group’s exposure to foreign currency risk arises as the functional currency of the Company and certain subsidiaries, the U.S. Dollar, is not the local currency in its country of operations. Certain financial assets and liabilities as well as some costs and expenses are denominated in various foreign currencies. To manage the foreign currency risk, the First Gen Group may consider entering into derivative transactions, as necessary. Foreign Currency Risk with Respect to U.S. Dollar In the case of entities within the First Gen Group with the Philippine Peso as its functional currency, they are mainly exposed to foreign currency risk through monetary assets and liabilities denominated in U.S. Dollar. Any depreciation of the Philippine Peso against the U.S. Dollar posts foreign exchange losses relating to its monetary assets and liabilities. In the case of EDC, its exposure to foreign currency risk is mitigated to some degree by some provisions of its GRESC’s, SSA’s, PPA’s and Renewable Energy Payment Agreement (REPA). The service contracts allow full cost recovery while its sales contracts include billing adjustments covering the movements in Philippine Peso and the U.S. Dollar rates, U.S. Price and Consumer Indices, and other inflation factors. To further mitigate the effects of foreign currency risk, EDC will prepay, refinance, enter into derivative contracts, or hedge its foreign currency denominated loans whenever deemed feasible. In January 2018, EDC entered into two (2) Call Spread Swaps (CSS) with an aggregate notional amount of $10.0 million and another two (2) CSS in August 2018 with an aggregate notional amount of $20.0 million. An additional two (2) CSS were entered by EDC in November 2018 with an aggregate amount of $10.0 million. These derivative contracts are designated to hedge any possible foreign exchange movement of its $181.0 million Notes. Credit Risk The First Gen Group trades only with recognized, reputable and creditworthy third parties and/or transacts only with institutions and/or banks which have demonstrated financial soundness. It is the First Gen Group’s policy that all customers who wish to trade on credit terms are subject to credit verification procedures. In addition, receivable balances are monitored on an on-going basis and the level of the allowance account is reviewed on an on-going basis to ensure that the First Gen Group’s exposure to doubtful accounts is not significant. In the case of EDC, the geothermal and power generation businesses trade with two major customers, NPC and TransCo, both are government-owned and -controlled corporations. Any failure on the part of NPC and TransCo to pay their obligations to EDC would significantly affect EDC’s business operations. As a practice, EDC closely monitors its collections from NPC and TransCo, and may charge interest on delayed payments following the provisions in its PPAs and REPA, respectively. Receivable balances are monitored on an on-going basis to ensure that EDC’s exposure to bad debts is not significant. The maximum exposure of trade receivable is equal to the carrying amount. With respect to credit risk arising from the other financial assets of the First Gen Group, which comprise of cash and cash equivalents, excluding cash on hand, trade and other receivables, financial assets at FVPL and FVOCI, and AFS financial assets, the First Gen Group’s exposure to credit risk arises from a possible

30 | P a g e
default of the counterparties with a maximum exposure equal to the carrying amount of these instruments before taking into account any collateral and other credit enhancements. Concentration of Credit Risk The Company, through its operating subsidiaries FGPC, FGP and FNPC (starting June 26, 2018), earns substantially all of its revenues from Meralco. Meralco is the largest distribution utility in the Philippines. Meralco is committed to take or pay for the capacity and energy generated by the natural gas power plants under the existing long-term PPAs and PSAs which are due to expire in February 2024, August 2025 and September 2027. While the PPAs and PSAs provide mechanisms by which certain costs and obligations including fuel costs, among others, are pass-through to Meralco or are otherwise recoverable from Meralco, it is the intention of the Company, FGP, FGPC and FNPC to ensure that the pass-through mechanisms, as provided for in their respective PPAs and PSAs, are followed. EDC’s geothermal and power generation businesses trade with two major customers, namely NPC and TransCo. Any failure on the part of NPC and TransCo to pay their obligations to EDC would significantly affect EDC’s business operations. More recently, FG Hydro signed a PSA with Meralco last September 16, 2019 for the supply of 100 MW of mid-merit capacity. The contract was a result of FG Hydro being awarded as a result of having one of the lowest bids under Meralco’s CSP that concluded in September 2019. The contract has a term of five years. On March 16, 2020, the ERC granted provisional authority to implement the PSA. However, due to the substantial decrease in demand across the Meralco franchise area brought about by the Luzon-wide ECQ, Meralco and FG Hydro have agreed to defer the operations effectivity date and all related dates until after the ECQ. The First Gen Group’s exposure to credit risk arises from default of the counterparties, with a maximum exposure equal to the carrying amounts of the receivables from Meralco, in the case of FGP, FGPC and FNPC, and the receivables from NPC and TransCo, in the case of EDC. Liquidity Risk The First Gen Group’s exposure to liquidity risk refers to the lack of funding needed to finance its growth and capital expenditures, service its maturing loan obligations in a timely fashion, and meet its working capital requirements. To manage this exposure, the First Gen Group maintains an amount of internally generated funds on hand and prudently manages the proceeds obtained from sales of assets and fund-raising. On a regular basis, the First Gen Group’s Treasury department monitors the available cash balances by preparing cash position reports. In addition, the First Gen Group has short-term deposits and available credit lines with certain banking institutions. As part of its liquidity risk management, the First Gen Group regularly evaluates its projected and actual cash flows. It also continuously assesses the financial market conditions for opportunities to pursue fund raising activities.
31 | P a g e
Merchant Risk The Company’s fully-merchant natural gas power plant, Avion, is exposed to the volatility of spot prices because of supply and demand changes, which are mostly driven by factors that are outside of the First Gen Group’s control. These factors include (but are not limited to) unexpected outages, weather conditions, transmission constraints, and changes in fuel prices. These have caused and are expected to cause instability in the operating results of the Avion plant.
The First Gen Group plans to mitigate these risks by having a balanced portfolio of contracted and spot capacities. As of March 31 2020, the First Gen Group is 90.0% contracted in terms of installed capacity.
PART II – OTHER INFORMATION
RELATED PARTY TRANSACTIONS
For a detailed discussion of the related party transactions, see Note 18 – Related Party Transactions to the accompanying unaudited interim condensed consolidated financial statements.
OTHER RELEVANT INFORMATION
Discussion and analysis of material event/s and uncertainties known to management that would address the past and would have an impact on future operations of the following:
(i) Any events that will trigger direct or contingent financial obligation that is material to the company,including any default or acceleration of an obligation.
The Company has never been in a default position. The Company’s current financing arrangementsinclude standard provisions relating to events of default (e.g. non-payment, cross default, crossacceleration, insolvency, attachment). Any breach of a loan covenant or any material adverse change tothe Company's operations or financial standing could trigger an event of default. The Company does nothave contingent financial obligation during the reporting period.
(ii) Any material off-balance sheet transactions, arrangements, obligations (including contingentobligations), and other relationships of the company with unconsolidated entities or other personscreated during the period.
The Company did not enter into any material off-balance sheet transactions, arrangements, obligations(including contingent obligations), and other relationships with unconsolidated entities or other personsduring the reporting period.
(iii) Any known trends or any known demands, commitments, events or uncertainties that will result in orthat are reasonably likely to result in the Company's liquidity increasing or decreasing in any materialway.
In response to the COVID-19 pandemic, the Philippine government imposed stringent social distancingmeasures in the National Capital Region effective March 15, 2020. These measures have resulted inserious disruptions to businesses and economic activities, and could have a material impact on theCompany's financial results. Considering the evolving nature of the outbreak, the Company cannotdetermine at this time the impact on its consolidated financial position, performance and cash flows.
(iv) Any material commitments for capital expenditures, general purpose of such commitments, and theexpected sources of funds for such expenditures should be described.
The Company has projects in the pipeline at varying degrees of development. These projects are beingundertaken through the following platforms:

32 | P a g e
a. Pumped Storage: The Company is currently developing a pumped-storage facility designed toincrease the capacity of the Pantabangan-Masiway plant by 100MW. The facility is expected tostore and generate electricity by moving water between the Pantabangan reservoir and theMasiway reservoir, which are situated at different elevations. The project is designed to allowfull year operations independent of the irrigation demands from NIA.
b. Run-of-river hydro: The Company is strengthening its expertise in hydroelectric power plantconstruction and development in order to start the construction of the 32 MW Bubunawan run-of-river hydro power project, subject to clarity in the Philippine market and regulatory regime.This project is located in Mindanao. Moreover, First Gen has licenses to develop at least four (4)run-of-river hydro projects in Mindanao; namely, the 32 MW Bubunawan, 33 MW Tagoloan, 30MW Puyo, and the Cagayan 1N.
c. LNG terminal: The Company continues to pursue and employ its pioneering efforts for naturalgas in developing the FGEN Batangas LNG Terminal Project (Project). Its planned constructionand operation is in preparation for the eventual exhaustion of the Malampaya gas field and alsoto support the development of the Philippine gas industry. The Company continues to work onvarious development activities to be able to advance the project and make a final investmentdecision.
On August 19, 2019 the Project was declared as an “Energy Project of National Significance”(EPNS) in accordance with Executive Order No. 30 on the basis that the Project will require thedevelopment of significant infrastructure and capital investment involving complex technicalprocesses and engineering designs that will result in a substantial positive impact on theenvironment.
On August 30, 2019, the Company announced that it had selected JGC Corporation of Japan asthe Preferred tenderer in respect of the engineering, procurement, and construction (EPC) of the(Project). This marks the conclusion of an extensive EPC tendering phase which commenced in2014, during which around 22 companies were invited and 18 expressed an interest toparticipate in the tender process and work on the Project.
The Company’s immediate focus is to complete a detailed study focusing on the modificationsthat can be made to the Company’s existing jetty that would allow the Company to bring in aFloating Storage Regasification Unit (FSRU) on an interim basis, and receive LNG as early as2021, even prior to the expiration of Malampaya gas contracts in 2024.
On October 17, 2019 the DOE approved the extension of the Notice to Proceed (NTP) permit forthe Project (originally issued on March 7, 2019) allowing for the continuation of work andactivities required to fulfill the NTP conditions. On March 4, 2020, the FGEN LNG submittedits application to the DOE for a Permit to Construct, Expand, Rehabilitate and Modify(PCERM).
Once completed, this will allow the Company to bring in a Floating Storage & RegasificationUnit (FSRU) on an interim basis and thus accelerate the Company’s ability to introduce LNG tothe Philippines. This innovation can readily serve the natural gas requirements of existing andfuture gas-fired power plants of third parties and Company affiliates, and bring the countrycloser to its goals of energy security, expanded energy access and low-carbon future, which areamong the stated objectives of the Philippine Energy Plan 2017-2040. An FSRU is an LNGstorage ship that has an on-board regasification plant capable of returning LNG back into agaseous state.
The Company anticipates that, if the PCERM is granted by the DOE, FGEN LNG will be able tocommence construction of the Project as early as August of this year, in order to be able toreceive LNG as early as Q3 of 2022.
The Project represents the initial phase of the FGEN Batangas LNG Terminal which wasdeclared on August 19, 2019 by the Energy Investment Coordinating Council (EICC) through

33 | P a g e
the DOE as an “Energy Project of National Significance” (EPNS) under Executive Order No. 30 (EO 30).
d. Natural gas: First Gen continues to work on the development of the Santa Maria and Saint Joseph projects. Final implementation of these projects, however, is also reliant on and in coordination with the on-going efforts to develop the LNG Terminal. Given advancements in Combined Cycle Gas Turbine (CCGT) technology, new gas plants can potentially provide additional capacity with even higher levels of efficiency and flexibility. The plants would be designed to more appropriately provide the needs of a grid that is expected to be increasingly dependent on intermittent renewable energy sources.
e. Geothermal: The Company, thru EDC, is currently pursuing several local expansion projects in
locations spanning Luzon, Visayas, and Mindanao. Moreover, it is continuing the exploration and assessment of growth prospects in Indonesia, Chile, Peru, and other countries in the Asia-Pacific and Latin American regions.
f. Wind and Solar: The Company and its subsidiaries has 10 wind energy service contracts, nine
of which are undergoing feasibility studies while one (1) is operational. Moreover, it has two (2) solar energy service contracts that are operational.
(v) Any known trends, events or uncertainties that have had or that are reasonably expected to have a
material favorable or unfavorable impact on net sales or revenues or income from continuing operations should be described.
The uncontracted portion of the Company’s generation capacity could have a significant impact on the Company’s overall financial performance should spot market prices of electricity become unfavorable. Spot prices are mostly determined by the supply and demand situation prevailing in the market. The expiration of the Company’s PPA’s could likewise expose the Company’s portfolio more to the WESM or result in the Company entering into PSA’s with more contestable customers.
(vi) Any significant elements of income or loss that did not arise from the registrant's continuing operations. There were no significant elements of income or loss that arose from continuing operations.
(vii) Any seasonal aspects that had a material effect on the financial condition or results of operations. FG Hydro’s and FG Bukidnon’s sale of electricity, as well as the Company’s merchant plants, are affected by seasonality or cyclicality of interim operations. For EDC’s Burgos Wind, higher revenue and operating profits are expected in the first and last quarters of the year based on the wind generation profile of Burgos. Meanwhile, EDC’s solar projects are expected to generate higher revenues during the summer months.
(viii) Any material events subsequent to the end of interim period that have not been reflected in the financial adjustments of the interim period. In response to the COVID-19 pandemic, the Philippine government imposed stringent social distancing measures in the National Capital Region effective March 15, 2020. These measures have resulted in serious disruptions to businesses and economic activities, and could have a material impact on the First Gen Group's financial results going forward.
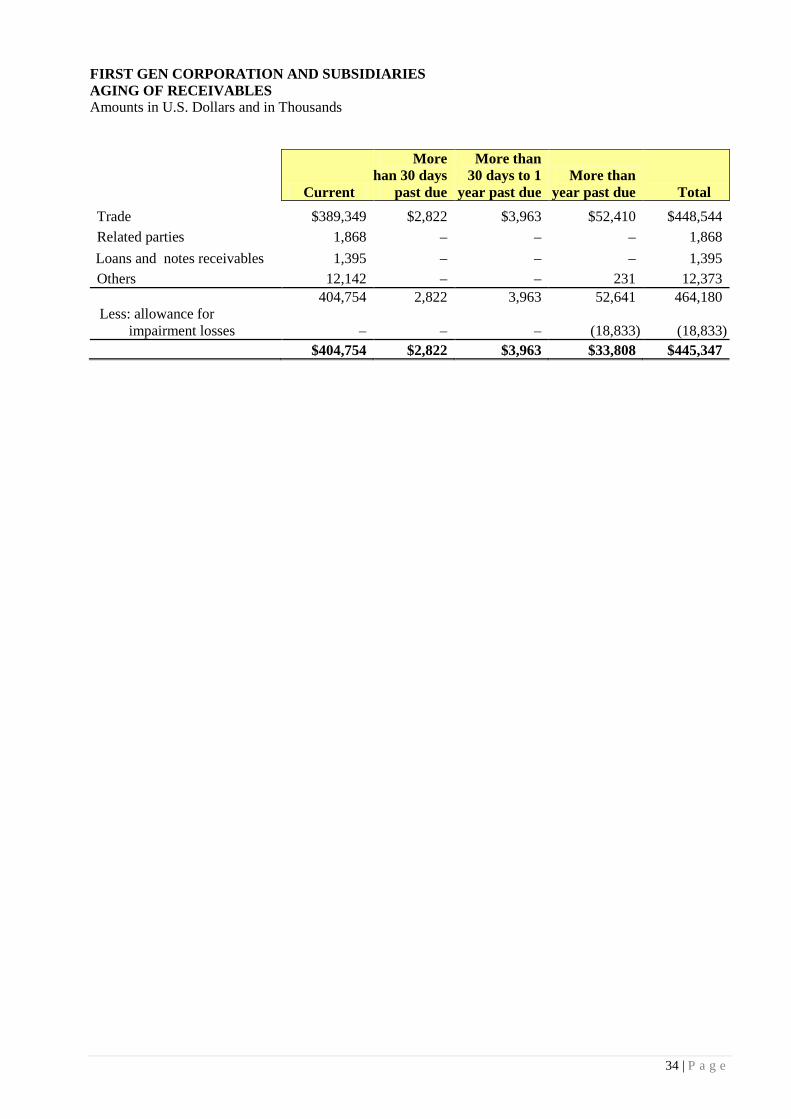
34 | P a g e
FIRST GEN CORPORATION AND SUBSIDIARIES AGING OF RECEIVABLES Amounts in U.S. Dollars and in Thousands
Current
More han 30 days
past due
More than 30 days to 1
year past due More than
year past due Total Trade $389,349 $2,822 $3,963 $52,410 $448,544 Related parties 1,868 – – – 1,868 Loans and notes receivables 1,395 – – – 1,395 Others 12,142 – – 231 12,373
404,754 2,822 3,963 52,641 464,180 Less: allowance for
impairment losses – – – (18,833) (18,833) $404,754 $2,822 $3,963 $33,808 $445,347
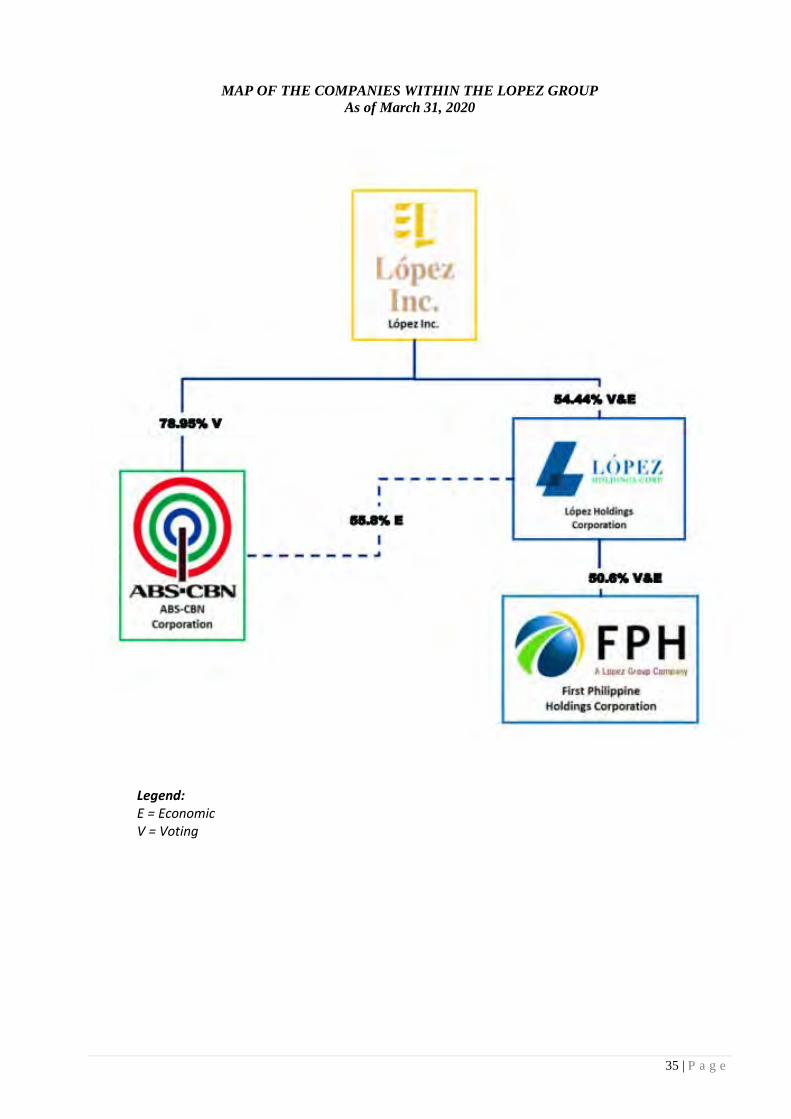
35 | P a g e
MAP OF THE COMPANIES WITHIN THE LOPEZ GROUP As of March 31, 2020
Legend: E = Economic V = Voting
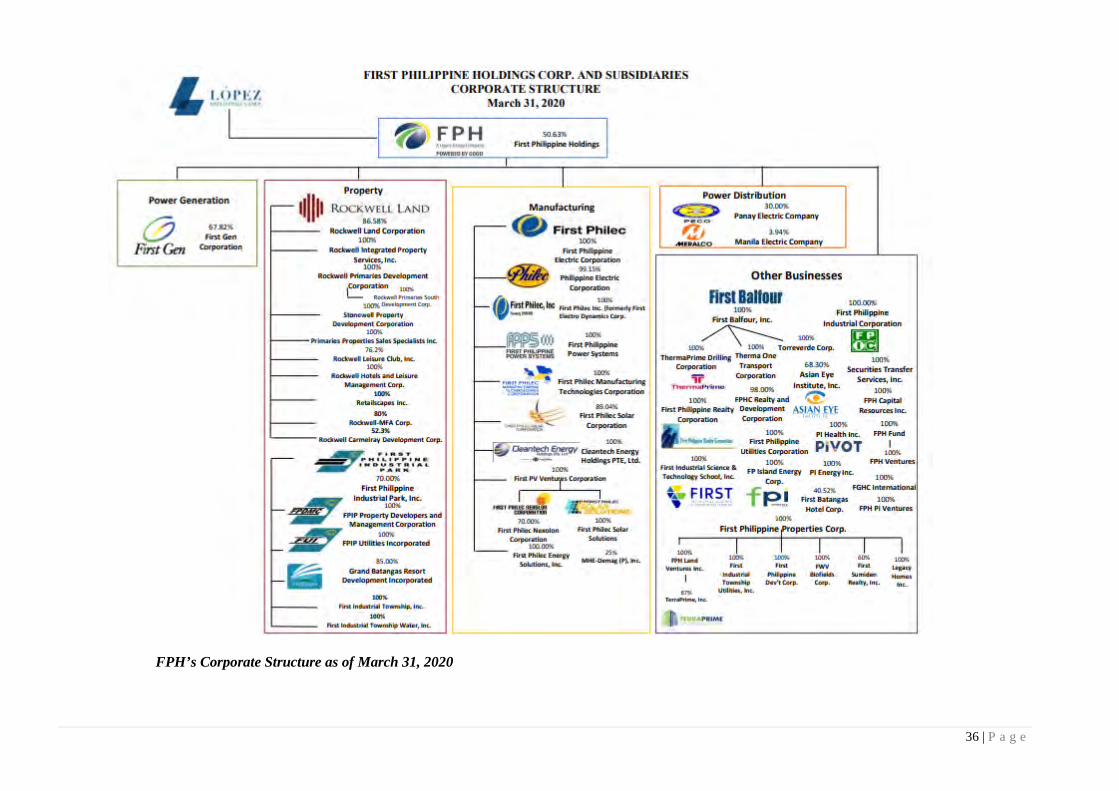
36 | P a g e
FPH’s Corporate Structure as of March 31, 2020

37 | P a g e
FGEN’s Corporate Structure as of March 31, 2020
Economic = 67.82%
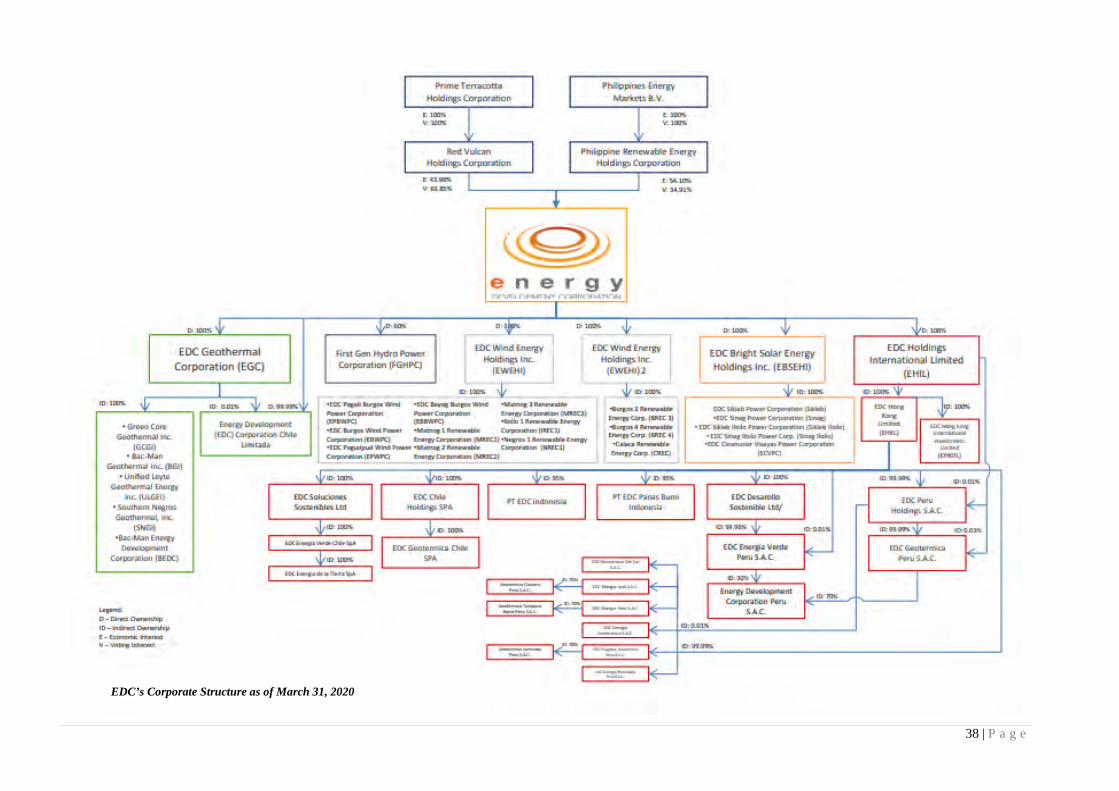
38 | P a g e
EDC’s Corporate Structure as of March 31, 2020

SIGNATURES
Pursuant to the requirements of Section 17 of the Code and Section 177 of the Revised Corporation Code, the issuer has duly caused this report to be signed on its behalf by the undersigned thereunto duly authorized.
FIRST GEN CORPORATION
_______________________________ MARIA CARMINA Z. UBAÑA
Vice President and Comptroller
______________________________EMMANUEL P. SINGSON SVP, CFO and Treasurer
May 18, 2020

First Gen Corporation and Subsidiaries Unaudited Interim Condensed Consolidated Financial Statements March 31, 2020 (With Comparative Audited Figures as at December 31, 2019) and For the Three-Month Periods Ended March 31, 2020 and 2019 (In U.S. Dollars)
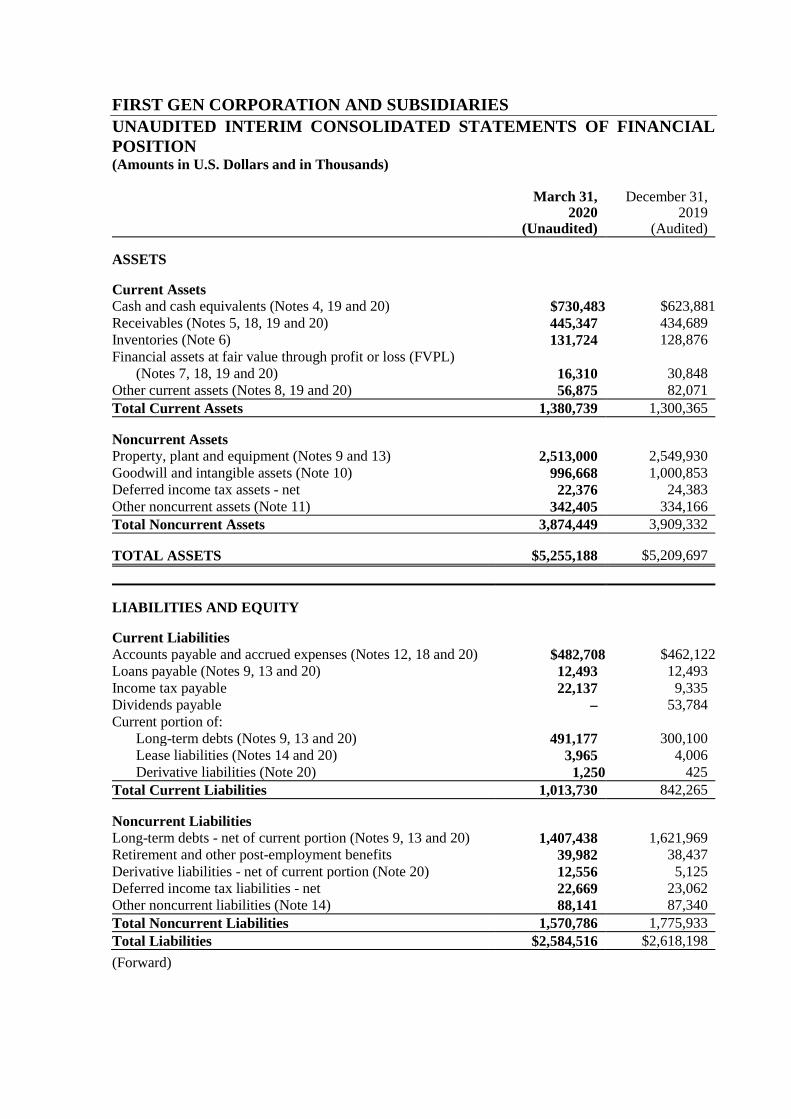
FIRST GEN CORPORATION AND SUBSIDIARIES UNAUDITED INTERIM CONSOLIDATED STATEMENTS OF FINANCIAL POSITION (Amounts in U.S. Dollars and in Thousands)
March 31, 2020
(Unaudited)
December 31, 2019
(Audited)
ASSETS
Current Assets Cash and cash equivalents (Notes 4, 19 and 20) $730,483 $623,881 Receivables (Notes 5, 18, 19 and 20) 445,347 434,689 Inventories (Note 6) 131,724 128,876 Financial assets at fair value through profit or loss (FVPL)
(Notes 7, 18, 19 and 20) 16,310 30,848 Other current assets (Notes 8, 19 and 20) 56,875 82,071 Total Current Assets 1,380,739 1,300,365
Noncurrent Assets Property, plant and equipment (Notes 9 and 13) 2,513,000 2,549,930 Goodwill and intangible assets (Note 10) 996,668 1,000,853 Deferred income tax assets - net 22,376 24,383 Other noncurrent assets (Note 11) 342,405 334,166 Total Noncurrent Assets 3,874,449 3,909,332
TOTAL ASSETS $5,255,188 $5,209,697
LIABILITIES AND EQUITY
Current Liabilities Accounts payable and accrued expenses (Notes 12, 18 and 20) $482,708 $462,122 Loans payable (Notes 9, 13 and 20) 12,493 12,493 Income tax payable 22,137 9,335 Dividends payable – 53,784 Current portion of: Long-term debts (Notes 9, 13 and 20) 491,177 300,100 Lease liabilities (Notes 14 and 20) 3,965 4,006 Derivative liabilities (Note 20) 1,250 425 Total Current Liabilities 1,013,730 842,265
Noncurrent Liabilities Long-term debts - net of current portion (Notes 9, 13 and 20) 1,407,438 1,621,969 Retirement and other post-employment benefits 39,982 38,437 Derivative liabilities - net of current portion (Note 20) 12,556 5,125 Deferred income tax liabilities - net 22,669 23,062 Other noncurrent liabilities (Note 14) 88,141 87,340 Total Noncurrent Liabilities 1,570,786 1,775,933 Total Liabilities $2,584,516 $2,618,198 (Forward)
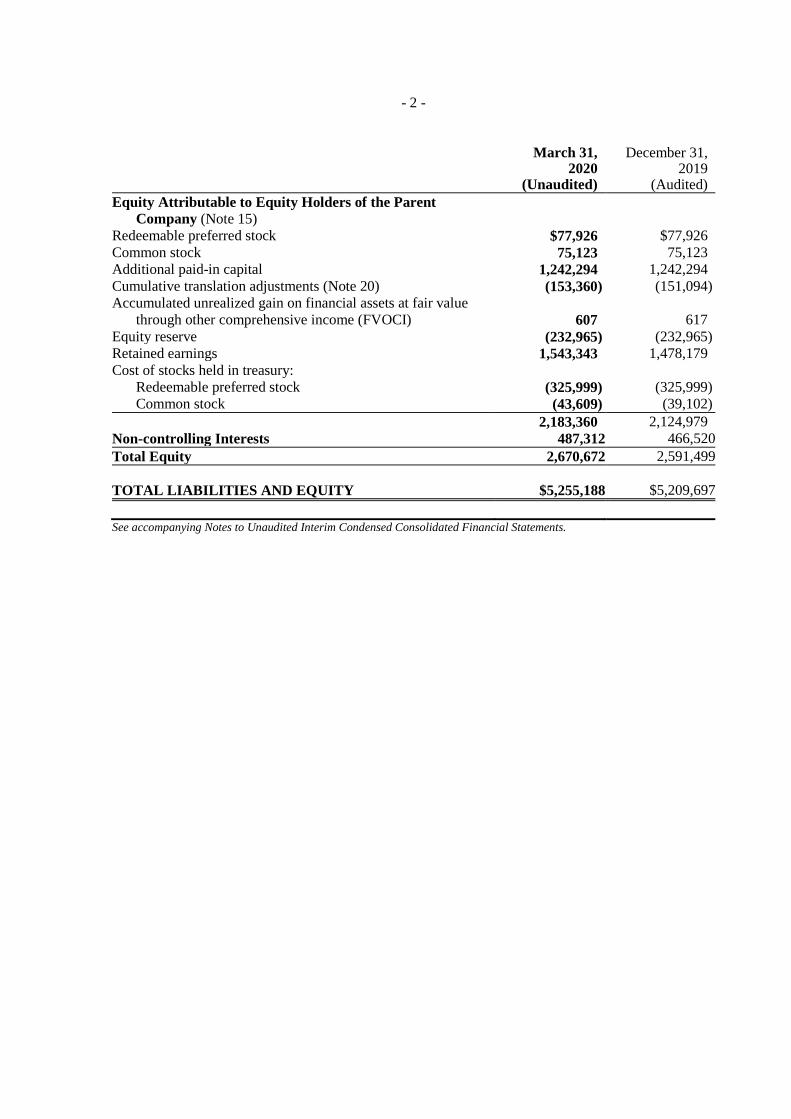
- 2 -
March 31, 2020
(Unaudited)
December 31, 2019
(Audited) Equity Attributable to Equity Holders of the Parent
Company (Note 15) Redeemable preferred stock $77,926 $77,926 Common stock 75,123 75,123 Additional paid-in capital 1,242,294 1,242,294 Cumulative translation adjustments (Note 20) (153,360) (151,094) Accumulated unrealized gain on financial assets at fair value
through other comprehensive income (FVOCI) 607 617 Equity reserve (232,965) (232,965) Retained earnings 1,543,343 1,478,179 Cost of stocks held in treasury: Redeemable preferred stock (325,999) (325,999) Common stock (43,609) (39,102) 2,183,360 2,124,979 Non-controlling Interests 487,312 466,520 Total Equity 2,670,672 2,591,499
TOTAL LIABILITIES AND EQUITY $5,255,188 $5,209,697 See accompanying Notes to Unaudited Interim Condensed Consolidated Financial Statements.

FIRST GEN CORPORATION AND SUBSIDIARIES UNAUDITED INTERIM CONSOLIDATED STATEMENTS OF INCOME (Amounts in U.S. Dollars and in Thousands, Except per Share Data)
For the Three-Month Periods Ended March 31
2020 2019
REVENUES FROM SALE OF ELECTRICITY $481,495 $533,778
COSTS OF SALE OF ELECTRICITY (Note 16) (295,105) (331,704)
GENERAL AND ADMINISTRATIVE EXPENSES (Note 16) (46,534) (43,493)
FINANCIAL INCOME (EXPENSE) Interest income 2,736 5,216 Interest expense and financing charges (Note 16) (26,729) (33,437) (23,993) (28,221)
OTHER INCOME (CHARGES) Mark-to-market gain on derivatives - net (Note 20) 313 78 Mark-to-market gain on financial assets at FVPL (Notes 7 and 20) 44 610 Proceeds from insurance claims 19 7,061 Foreign exchange gains (losses) - net (97) 1,459 Loss on extinguishment of long-term debts (Note 13) – (1,764) Others (Note 20) 219 (614) 498 6,830
INCOME BEFORE INCOME TAX 116,361 137,190
PROVISION FOR (BENEFIT FROM) INCOME TAX Current 17,840 21,095 Deferred 1,729 (1,230) 19,569 19,865
NET INCOME $96,792 $117,325
Net income attributable to: Equity holders of the Parent Company $65,164 $81,080 Non-controlling interests 31,628 36,245 $96,792 $117,325
Basic/Diluted Earnings per Share for Net Income Attributable to Equity Holders of the Parent Company (Note 17) $0.017 $0.021
See accompanying Notes to Unaudited Interim Condensed Consolidated Financial Statements.

FIRST GEN CORPORATION AND SUBSIDIARIES UNAUDITED INTERIM CONSOLIDATED STATEMENTS OF COMPREHENSIVE INCOME (Amounts in U.S. Dollars and in Thousands)
For the Three-Month Periods Ended March 31
2020 2019
NET INCOME $96,792 $117,325
OTHER COMPREHENSIVE INCOME (LOSS): Other comprehensive income (loss) to be reclassified to profit or
loss in subsequent periods: Exchange gains (losses) on foreign currency translation (21,999) 8,014 Net gains (losses) on cash flow hedge - net of tax (Note 20) 9,049 (6,223) Unrealized gains (losses) on debt instruments at FVOCI (44) 369 (12,994) 2,160 Other comprehensive income not to be reclassified to profit or
loss in subsequent periods: Unrealized gains on equity instruments at FVOCI 22 69
Total other comprehensive income (loss) - net of tax (12,972) 2,229
TOTAL COMPREHENSIVE INCOME $83,820 $119,554
Total comprehensive income attributable to: Equity holders of the Parent Company $62,888 $86,228 Non-controlling interests 20,932 33,326 $83,820 $119,554 See accompanying Notes to Unaudited Interim Condensed Consolidated Financial Statements.
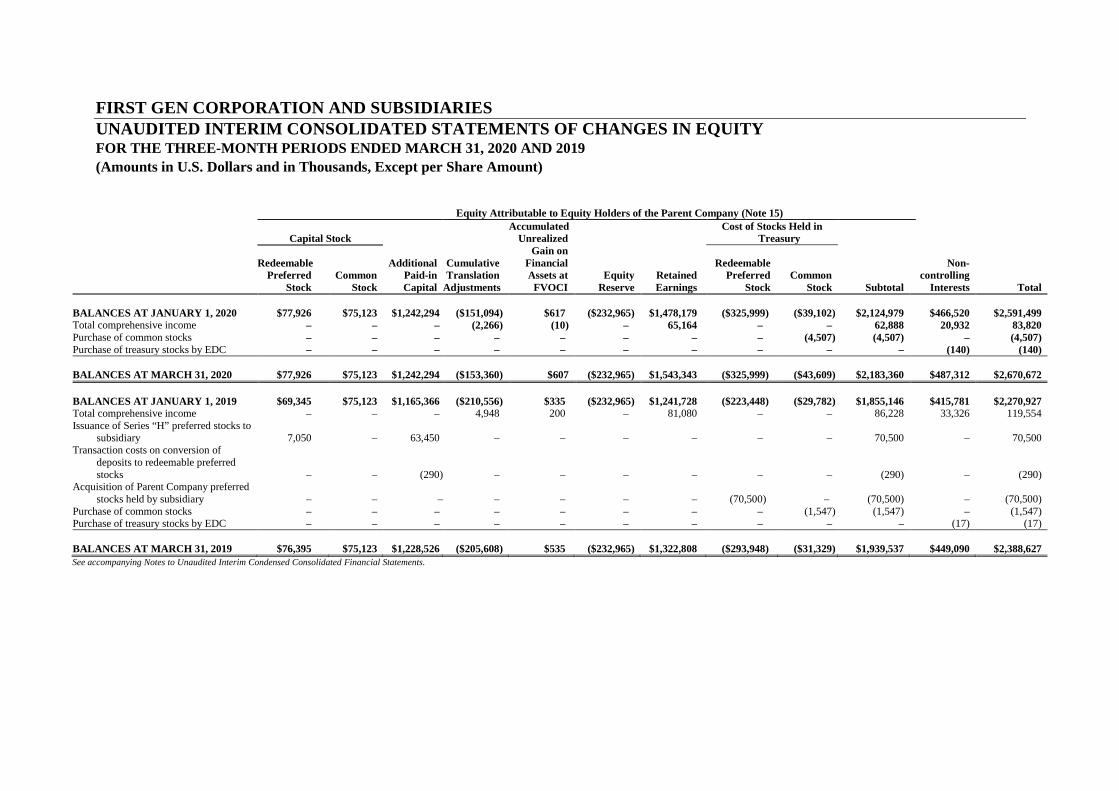
FIRST GEN CORPORATION AND SUBSIDIARIES UNAUDITED INTERIM CONSOLIDATED STATEMENTS OF CHANGES IN EQUITY FOR THE THREE-MONTH PERIODS ENDED MARCH 31, 2020 AND 2019 (Amounts in U.S. Dollars and in Thousands, Except per Share Amount)
Equity Attributable to Equity Holders of the Parent Company (Note 15)
Capital Stock
Cumulative Translation
Adjustments
Accumulated Unrealized
Gain on Financial Assets at
FVOCI Equity
Reserve Retained Earnings
Cost of Stocks Held in Treasury
Redeemable Preferred
Stock Common
Stock
Additional Paid-in Capital
Redeemable Preferred
Stock Common
Stock Subtotal
Non- controlling
Interests Total BALANCES AT JANUARY 1, 2020 $77,926 $75,123 $1,242,294 ($151,094) $617 ($232,965) $1,478,179 ($325,999) ($39,102) $2,124,979 $466,520 $2,591,499 Total comprehensive income – – – (2,266) (10) – 65,164 – – 62,888 20,932 83,820 Purchase of common stocks – – – – – – – – (4,507) (4,507) – (4,507) Purchase of treasury stocks by EDC – – – – – – – – – – (140) (140) BALANCES AT MARCH 31, 2020 $77,926 $75,123 $1,242,294 ($153,360)
$607 ($232,965) $1,543,343 ($325,999) ($43,609) $2,183,360 $487,312 $2,670,672
BALANCES AT JANUARY 1, 2019 $69,345 $75,123 $1,165,366 ($210,556) $335 ($232,965) $1,241,728 ($223,448) ($29,782) $1,855,146 $415,781 $2,270,927 Total comprehensive income – – – 4,948 200 – 81,080 – – 86,228 33,326 119,554 Issuance of Series “H” preferred stocks to subsidiary 7,050 – 63,450 – – – – – – 70,500 – 70,500 Transaction costs on conversion of deposits to redeemable preferred stocks – – (290) – – – – – – (290) – (290) Acquisition of Parent Company preferred stocks held by subsidiary – – – – – – – (70,500) – (70,500) – (70,500) Purchase of common stocks – – – – – – – – (1,547) (1,547) – (1,547) Purchase of treasury stocks by EDC – – – – – – – – – – (17) (17) BALANCES AT MARCH 31, 2019 $76,395 $75,123 $1,228,526 ($205,608)
$535 ($232,965) $1,322,808 ($293,948) ($31,329) $1,939,537 $449,090 $2,388,627
See accompanying Notes to Unaudited Interim Condensed Consolidated Financial Statements.
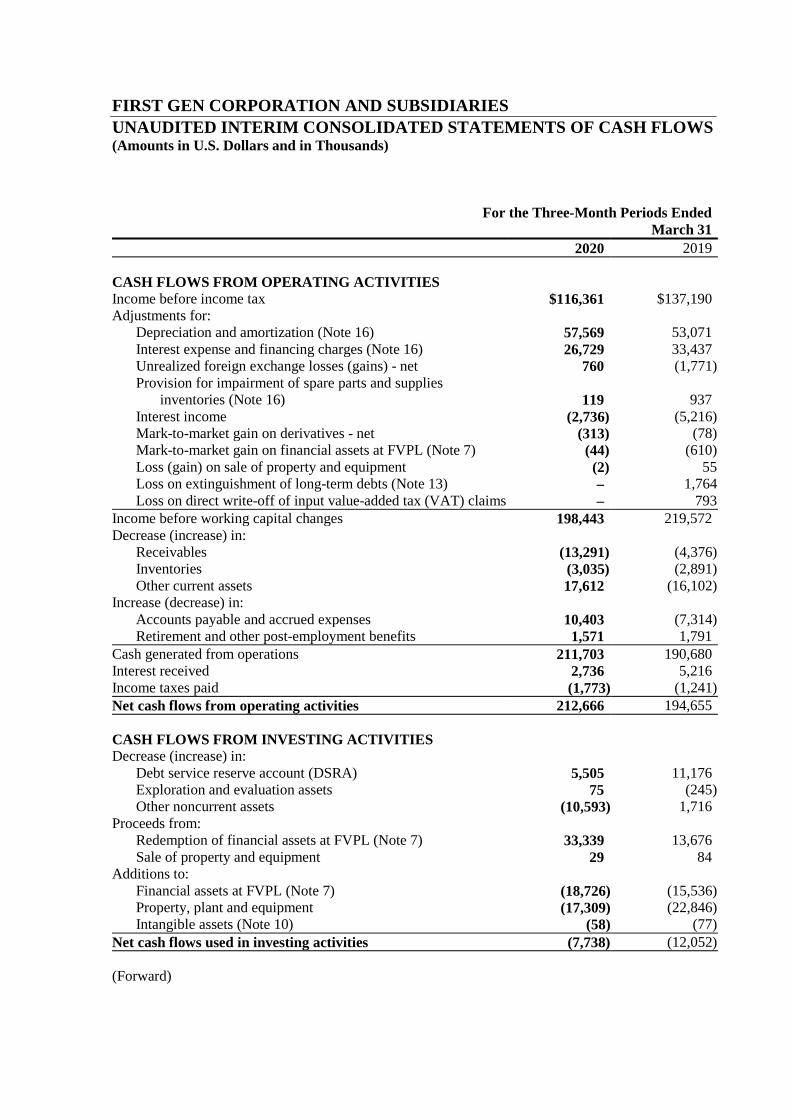
FIRST GEN CORPORATION AND SUBSIDIARIES UNAUDITED INTERIM CONSOLIDATED STATEMENTS OF CASH FLOWS (Amounts in U.S. Dollars and in Thousands)
For the Three-Month Periods Ended March 31
2020 2019
CASH FLOWS FROM OPERATING ACTIVITIES Income before income tax $116,361 $137,190 Adjustments for: Depreciation and amortization (Note 16) 57,569 53,071 Interest expense and financing charges (Note 16) 26,729 33,437 Unrealized foreign exchange losses (gains) - net 760 (1,771) Provision for impairment of spare parts and supplies
inventories (Note 16) 119 937 Interest income (2,736) (5,216) Mark-to-market gain on derivatives - net (313) (78) Mark-to-market gain on financial assets at FVPL (Note 7) (44) (610) Loss (gain) on sale of property and equipment (2) 55 Loss on extinguishment of long-term debts (Note 13) – 1,764 Loss on direct write-off of input value-added tax (VAT) claims – 793 Income before working capital changes 198,443 219,572 Decrease (increase) in: Receivables (13,291) (4,376) Inventories (3,035) (2,891) Other current assets 17,612 (16,102) Increase (decrease) in: Accounts payable and accrued expenses 10,403 (7,314) Retirement and other post-employment benefits 1,571 1,791 Cash generated from operations 211,703 190,680 Interest received 2,736 5,216 Income taxes paid (1,773) (1,241) Net cash flows from operating activities 212,666 194,655
CASH FLOWS FROM INVESTING ACTIVITIES Decrease (increase) in: Debt service reserve account (DSRA) 5,505 11,176 Exploration and evaluation assets 75 (245) Other noncurrent assets (10,593) 1,716 Proceeds from: Redemption of financial assets at FVPL (Note 7) 33,339 13,676 Sale of property and equipment 29 84 Additions to: Financial assets at FVPL (Note 7) (18,726) (15,536) Property, plant and equipment (17,309) (22,846) Intangible assets (Note 10) (58) (77) Net cash flows used in investing activities (7,738) (12,052)
(Forward)

- 2 -
For the Three-Month Periods Ended March 31
2020 2019
CASH FLOWS FROM FINANCING ACTIVITIES Payments of: Dividends to non-controlling shareholders of subsidiaries ($45,170) $– Long-term debts (24,341) (81,161) Interest expense and financing charges (15,661) (23,460) Cash dividends to preferred shareholders (8,614) (8,891) Purchase of Parent Company common treasury stocks (4,507) (1,547) Lease liabilities (1,034) – Acquisition of Parent Company preferred stocks held by
subsidiary – (70,500) Purchase of treasury stocks by EDC (140) (17) Transaction costs incurred related to conversion of deposits to preferred stocks – (290) Issuance of Series “H” preferred stocks to subsidiaries – 70,500 Increase (decrease) in other noncurrent liabilities 1,126 (3,540) Net cash flows used in financing activities (98,341) (118,906)
EFFECT OF FOREIGN EXCHANGE RATE CHANGES ON CASH AND CASH EQUIVALENTS 15 798
NET INCREASE IN CASH AND CASH EQUIVALENTS 106,602 64,495
CASH AND CASH EQUIVALENTS AT BEGINNING OF PERIOD 623,881 554,761
CASH AND CASH EQUIVALENTS AT END OF PERIOD (Note 4) $730,483 $619,256
See accompanying Notes to Unaudited Interim Condensed Consolidated Financial Statements.

FIRST GEN CORPORATION AND SUBSIDIARIES SELECTED NOTES TO UNAUDITED INTERIM CONDENSED CONSOLIDATED FINANCIAL STATEMENTS (Amounts in U.S. Dollars and in Thousands, Unless Otherwise Stated) 1. Corporate Information
First Gen Corporation (the Parent Company or First Gen) is incorporated in the Philippines and registered with the Philippine Securities and Exchange Commission (SEC) on December 22, 1998. The Parent Company and its subsidiaries (collectively referred to as “First Gen Group”) are involved in the power generation business. All subsidiaries, except for certain subsidiaries of Energy Development Corporation (EDC), are incorporated in the Philippines. These certain subsidiaries of EDC are incorporated in BVI, Hong Kong, Peru, Chile and Indonesia (see Note 2). On February 10, 2006, the Parent Company successfully completed the Initial Public Offering (IPO) in the Philippines of 193,412,600 common stocks, including the exercised greenshoe option of 12,501,700 common stocks, at an IPO price of P=47.00 per share. The common stocks of the Parent Company are currently listed and traded on the First Board of the Philippine Stock Exchange, Inc. (PSE). First Gen is considered a public company under Section 17.2 of the Securities Regulation Code (SRC). On January 22, 2010, the Parent Company likewise completed the Stock Rights Offering (the Rights Offering) of 2,142,472,791 rights shares in the Philippines at the proportion of 1.756 rights shares for every one existing common stock held as of the record date of December 29, 2009 at the offer price of P=7.00 per rights share. The total proceeds from the Rights Offering amounted to P=15.0 billion ($319.2 million). On July 25, 2011, the Parent Company issued P=10.0 billion Series “F” Preferred Shares at a dividend rate of 8.0%. The Parent Company approved and authorized the issuance by way of private placement or issuance to Qualified Buyers of One Hundred Million (100,000,000) of its Series “F” Preferred Shares with a par value of P=10.0 a share and an issue price of P=100.0 a share. The Series “F” Preferred Shares were listed and traded on the First Board of the PSE until its full redemption in July 2018. Total proceeds of the issuance of the Series “F” Preferred Shares amounted to P=10.0 billion ($235.7 million). Transaction costs amounting to P=53.0 million ($1.2 million) was incurred and deducted against additional paid-in capital. On May 28, 2012, the Parent Company completed the Public Offering of the 100,000,000 Series “G” Preferred Shares in the Philippines at an issue price of P=100.0 per share. The Series “G” Preferred Shares are currently listed and traded on the First Board of the PSE. The total proceeds from the issuance of the Series “G” Preferred Shares amounted to P=10.0 billion ($234.4 million), net of transaction costs amounting to P=95.2 million ($2.2 million). On January 20, 2015, the Parent Company authorized the issuance and sale of an aggregate of 297,029,800 common stocks to be taken from its unissued capital stock and treasury stock at an identical issue price of P=25.25 per share (the “Offer Price”). The price represents a 2.9% discount to the last traded price of P=26.00 per share. The placement was conducted via an accelerated bookbuilding process. First Gen’s parent company, First Philippine Holdings Corporation (FPH), which has a 66.2% stake in First Gen’s issued and outstanding common stocks, agreed to subscribe to its pro-rata share in the transaction. The Parent Company issued to FPH 179,127,900 common stocks from treasury stock, as well as 17,623,100 common stocks from unissued capital stock, at the Offer Price. The total proceeds from the issuance of the common stocks amounted
- 2 -
to P=7.4 billion ($166.5 million), net of transaction costs amounting to P=62.1 million ($1.4 million). Following the subscription, FPH maintained its 66.2% stake in the Parent Company’s issued and outstanding common stock. On May 11, 2016, the Board of Directors (BOD) of the Parent Company approved a two-year extension of the buy-back programs from June 1, 2016 to May 31, 2018. The two-year extension covered the: (i) common stock buy-back program covering up to 300.0 million of the Parent Company’s common stocks; and (ii) Series “F” and “G” Preferred Shares buyback program covering up to P=10.0 billion worth of said redeemable preferred stocks. In 2016, the Parent Company purchased from the open market 10,010 and 5,026,280 Series “F” and Series “G” redeemable preferred stocks, respectively. Total payments for the buyback of the Series “F” and Series “G” redeemable preferred stocks amounted to P=1.1 million ($0.02 million) and P=598.8 million ($12.2 million). In 2017, the Parent Company purchased from the open market 422,830 and 1,868,200 Series “F” and Series “G” redeemable preferred stocks, respectively. Total payments for the buyback of the Series “F” and Series “G” redeemable preferred stocks amounted to P=45.8 million ($0.9 million) and P=211.7 million ($4.2 million), respectively. On June 14, 2018, the BOD of the Parent Company approved during its board meeting the two-year extension of the buy-back programs from June 15, 2018 to June 14, 2020. The two-year extension covers the: (i) common stock buy-back program covering up to 300.0 million of the Parent Company’s common stocks; and (ii) Series “G” Preferred Shares buyback program covering up to P=10.0 billion worth of said redeemable preferred stocks. On the same date, the BOD of the Parent Company approved during its board meeting, in accordance with the terms and condition of the Parent Company’s Series “F” Preferred Shares, the redemption of all outstanding Series “F” Preferred Shares on July 25, 2018 at the applicable redemption value of P=100.0 a share. On July 25, 2018, the Parent Company redeemed all outstanding Series “F” Preferred Shares amounting to P=6,320.2 million ($119.1 million). In 2018, the Parent Company purchased from the open market 659,720 Series “G” redeemable preferred stocks and 17,981,000 common stocks. Total payments for the buyback of Series “G” redeemable preferred stocks and common stocks amounted to P=69.5 million ($1.3 million) and P=270.3 million ($5.2 million), respectively. In 2019, the Parent Company purchased from the open market 8,045,000 Series “G” redeemable preferred stocks and 33,039,352 common stocks. Total payments for the buyback of Series “G” redeemable preferred stocks and common stocks amounted to P=871.8 million ($16.7 million) and P=813.8 million ($15.7 million), respectively. From the total common stocks purchased from the open market, a total of 16,429,352 common stocks are held by subsidiaries (see Note 15). In 2020, the Parent Company purchased from the open market 12,008,700 common stocks for P=228.9 million ($4.5 million) (see Note 15).
As of March 31, 2020, FPH directly and indirectly owns 67.82% of the common stocks of First Gen and 100% of First Gen’s voting preferred stocks. FPH is 50.63%-owned by Lopez Holdings Corporation (Lopez Holdings), a publicly-listed Philippine-based entity, as at March 31, 2020. Majority of Lopez Holdings is owned by Lopez, Inc. Lopez, Inc. is the ultimate parent of First Gen. FPH, Lopez Holdings and Lopez, Inc. are all incorporated in the Philippines. As of March 31, 2020, there are 354 common stockholders of record of First Gen, and 3,552,681,457 common stocks issued and outstanding as of March 31, 2020 (see Note 15).
- 3 -
Corporate Address The registered principal office address of the Parent Company is 6th Floor, Rockwell Business Center Tower 3, Ortigas Avenue, Pasig City.
2. Summary of Significant Accounting Policies
Basis of Preparation The unaudited interim condensed consolidated financial statements of First Gen Group as of March 31, 2020, and for the three-month periods ended March 31, 2020 and 2019 have been prepared on a historical cost basis, except for certain financial assets and liabilities that have been measured at fair value. The unaudited interim condensed consolidated financial statements are presented in United States (U.S.) dollar, which is the Parent Company’s functional currency, and are rounded to the nearest thousands, except when otherwise indicated. Statement of Compliance The unaudited interim condensed consolidated financial statements of First Gen Group have been prepared in accordance with Philippine Financial Reporting Standards (PFRSs) Philippine Accounting Standards (PAS) 34, Interim Financial Reporting. Accordingly, the unaudited interim condensed consolidated financial statements do not include all of the information and footnotes required in the annual consolidated financial statements, and should be read in conjunction with First Gen Group’s annual consolidated financial statements as at and for the year ended December 31, 2019.
Significant Accounting and Financial Reporting Policies The accounting policies adopted in the preparation of the unaudited interim condensed consolidated financial statements are consistent with those followed in the preparation of the annual consolidated financial statements as at and for the year ended December 31, 2019, except for the adoption of the following amended accounting standards that became effective beginning January 1, 2020. The nature and the effect of these changes are disclosed below. Although these amendments apply for the first time in 2020, they do not have a material impact on the unaudited interim condensed consolidated financial statements of the Parent Company. The nature and the impact of each amendment are described below: • Amendments to PFRS 3, Definition of a Business
The amendments to PFRS 3 clarify the minimum requirements to be a business, remove the assessment of a market participant’s ability to replace missing elements, and narrow the definition of outputs. The amendments also add guidance to assess whether an acquired process is substantive and add illustrative examples. An optional fair value concentration test is introduced which permits a simplified assessment of whether an acquired set of activities and assets is not a business. These amendments have no impact on First Gen Group’s unaudited interim condensed consolidated financial statements but will apply on future business combinations of First Gen Group.

- 4 -
• Amendments to PAS 1, Presentation of Financial Statements, and PAS 8, Accounting Policies, Changes in Accounting Estimates and Errors, Definition of Material The amendments refine the definition of material in PAS 1 and align the definitions used across PFRSs and other pronouncements. They are intended to improve the understanding of the existing requirements rather than to significantly impact an entity’s materiality judgements. These amendments have no impact on First Gen Group’s unaudited interim condensed consolidated financial statements.
Basis of Consolidation The unaudited interim condensed consolidated financial statements comprise the financial statements of the Parent Company and its subsidiaries. First Gen Group controls an investee if and only if First Gen Group has: • Power over the investee (i.e. existing rights that give it the current ability to direct the relevant
activities of the investee); • Exposure, or rights, to variable returns from its involvement with the investee, and • The ability to use its power over the investee to affect its returns. When First Gen Group has less than a majority of the voting or similar rights of an investee, First Gen Group considers all relevant facts and circumstances in assessing whether it has power over an investee, including: • The contractual arrangement with the other vote holders of the investee; • Rights arising from other contractual arrangements; and • First Gen Group’s voting rights and potential voting rights. First Gen Group re-assesses whether or not it controls an investee if facts and circumstances indicate that there are changes to one or more of the three elements of control. Consolidation of a subsidiary begins when First Gen Group obtains control over the subsidiary and ceases when First Gen Group losses control over the subsidiary. Assets, liabilities, income and expenses of a subsidiary acquired or disposed of during the period are included in the unaudited interim condensed consolidated financial statements from the date First Gen Group gains control until the First Gen Group ceases to control the subsidiary. Profit or loss and each component of other comprehensive income are attributed to the equity holders of the Parent Company and to the non-controlling interests, even if this results in the non-controlling interests having a deficit balance. When necessary, adjustments are made to the financial statements of subsidiaries to bring their accounting policies in line with First Gen Group’s accounting policies. All significant intra-group assets and liabilities, equity, income and expenses, and cash flows relating to transactions between members of First Gen Group are eliminated in full on consolidation. A change in the ownership interest of a subsidiary, without a loss of control, is accounted for as an equity transaction. If First Gen Group loses control over a subsidiary, it derecognizes the carrying amounts of the assets (including goodwill) and liabilities of the subsidiary, derecognizes the carrying amount of any non-controlling interest (including any attributable components of other comprehensive income recorded in equity), derecognizes the cumulative translation differences recorded in equity, recognizes the fair value of the consideration received, recognizes the fair

- 5 -
value of any investment retained, and any surplus or deficit is recognized in the unaudited interim consolidated statement of comprehensive income. First Gen Group also reclassifies the Parent Company’s share of components previously recognized in other comprehensive income to profit or loss or retained earnings, as appropriate, as would be required if First Gen Group had directly disposed of the related assets or liabilities. Non-controlling Interests Non-controlling interests represent the portion of total comprehensive income or loss and net assets not held by First Gen Group. Non-controlling interests are presented separately in the unaudited interim consolidated statement of income, unaudited interim consolidated statement of comprehensive income, and within equity in the unaudited interim consolidated statement of financial position, separate from equity attributable to equity holders of the Parent Company. The acquisition of an additional ownership interest in a subsidiary without a change of control is accounted for as an equity transaction in accordance with PAS 27. In transactions where the non-controlling interest is acquired or sold without loss of control, any excess or deficit of consideration paid over the carrying amount of the non-controlling interest is recognized as part of “Equity reserve” account in the equity attributable to the equity holders of the Parent Company. For the three-month periods ended March 31, 2020 and 2019, the non-controlling interests arise from the profits or losses and net assets not held by First Gen Group in EDC and Subsidiaries. Subsidiaries The following is a list of the companies on which the Parent Company has control:
March 31,
2020 December 31,
2019 First Gen Renewables, Inc. (FGRI) 100 100 Unified Holdings Corporation (Unified) 100 100 AlliedGen Power Corp. (AlliedGen) 100 100 First Gen Luzon Power Corp. (FG Luzon)14 100 100 First Gen Visayas Hydro Power Corporation (FG Visayas)14 100 100 First Gen Mindanao Hydro Power Corporation (FG Mindanao) 100 100 First Gen Ecopower Solutions, Inc. (FG Ecopower)1 100 100 First Gen Energy Solutions Inc. (FGES) 100 100 First Gen Premier Energy Corp. (FG Premier)14 100 100 First Gen Prime Energy Corporation (FG Prime) 100 100 First Gen Visayas Energy, Inc. (FG Visayas Energy) 100 100 FG Bukidnon Power Corporation (FG Bukidnon)2 100 100 Northern Terracotta Power Corp. 100 100 Blue Vulcan Holdings Corporation (Blue Vulcan) 100 100 Prime Meridian Powergen Corporation (Prime Meridian)3 100 100 Goldsilk Holdings Corporation7 100 100 Dualcore Holdings Inc.7 100 100 Onecore Holdings Inc.7 100 100 FG Mindanao Renewables Corp. (FMRC)8 100 100 FGen Northern Mindanao Holdings, Inc. (FNMHI)8 100 100 FGen Tagoloan Hydro Corporation (FG Tagoloan)9 100 100 FGen Tumalaong Hydro Corporation (FG Tumalaong)9 100 100 FGen Puyo Hydro Corporation (FG Puyo)10 100 100 FGen Bubunawan Hydro Corporation (FG Bubunawan)10 100 100 FGen Cabadbaran Hydro Corporation (FG Cabadbaran)10 100 100 First Gas Holdings Corporation (FGHC) 100 100 FGP4 100 100 First NatGas Power Corp. (FNPC)5 100 100 First Gas Power Corporation (FGPC)6 100 100
- 6 -
March 31,
2020 December 31,
2019 First Gas Pipeline Corporation (FG Pipeline)6 100 100 FGLand Corporation (FG Land)6 100 100 FGEN LNG Corporation (FGEN LNG)11 100 100 First Gen LNG Holdings Corporation (LNG Holdings) 100 100 First Gen Meridian Holdings, Inc. (FGEN Meridian) 100 100 FGen Power Ventures, Inc. (FGEN Power Ventures) 100 100 FGen Casecnan Hydro Power Corp. (FGEN Casecnan)14 100 100 FGen San Isidro Hydro Power Corporation (FGEN San Isidro), formerly FGen Power Holdings, Inc.15 100 100 FGen Prime Holdings, Inc. (Prime Holdings) 100 100 FGen Eco Solutions Holdings, Inc. (FGESHI) 100 100 FGen Liquefied Natural Gas Holdings, Inc. (Liquefied Holdings) 100 100 FGen Reliable Energy Holdings, Inc. (FG Reliable Energy) 100 100 FGen Power Solutions, Inc. (FG Power Solutions) 100 100 FGen Vibrant Blue Sky Holdings, Inc. (FGVBSHI) 100 100 FGen Aqua Power Holdings, Inc. (FG Aqua Power) 100 100 FGen Natural Gas Supply, Inc. (FGen NatGas Supply)13 100 100 FGen Power Operations, Inc. (FPOI) 100 100 FGen Fuel Line Systems, Inc. (FGen Fuel Line) 100 100 Prime Terracota Holdings Corp. (Prime Terracota) 100 100 First Gen Northern Power Corp. (FGen Northern Power)16 100 100 First Gen Hydro Power Corporation (FG Hydro)12 40 40 1Through FGESHI 2Through FGRI 3Through FGEN Meridian 460% through Unified and 40% through Onecore
5Through AlliedGen 6Through FGHC 7Through Blue Vulcan 8Through FG Mindanao 9Through FMRC 10Through FNMHI 11Through LNG Holdings 12The Parent Company has 40% direct voting interest in FG Hydro while its effective economic interest is 67.4% through Prime Terracota as of
March 31, 2020. 13Through Liquefied Holdings 14On September 19, 2018, FGEN Casecnan’s BOD and stockholders approved a resolution to amend the Articles of Incorporation changing the corporate term from
“fifty (50) years from and after the date of issuance of the certificate of incorporation” to “until March 31, 2020”. On November 19, 2018, FG Luzon, FG Visayas and FG Premier’s BOD and stockholders approved a resolution to amend the Articles of Incorporation changing the corporate term from “fifty (50) years from and after the date of issuance of the certificate of incorporation” to “until March 31, 2020”.
15On June 24, 2019, the BOD and stockholders approved the amendment of the corporate name of FGen Power Holdings, Inc. to FGEN San Isidro Hydro Power Corporation. The Philippine SEC approved the change of the corporate name on December 17, 2019.
16On July 7, 2015, Conal Holdings Corp. (Conal) subscribed to 37,500 common stocks of FGen Northern Power at par value of P=1.00 per share. As a result of the subscription, Conal now owns 60% economic and voting interest in FGen Northern Power while the Parent Company’s interest was reduced from 100% to 40%. On September 27, 2019, Conal and the Parent Company executed a Deed of Sale for the purchase of the 37,500 common stocks owned by Conal at par value of P=1.00 per share. As a result, the Parent Company now owns 100% of FGEN Northern Power.
All of the foregoing subsidiaries are incorporated in the Philippines. As of March 31, 2020, FG Luzon, FG Visayas, FG Mindanao, FG Ecopower, FG Premier, FG Prime, FG Visayas Energy, Northern Terracotta, FMRC, FNMHI, FG Tagoloan, FG Tumalaong, FG Puyo, FG Bubunawan, FG Cabadbaran, FG Pipeline, FG Land, FGEN LNG, LNG Holdings, FGen Northern Power, FGEN Power Ventures, FGEN Casecnan, FGEN San Isidro, Prime Holdings, FGESHI, Liquefied Holdings, FG Reliable Energy, FG Power Solutions, FGVBSHI, FG Aqua Power, FGen NatGas Supply, FPOI, and FGen Fuel Line have not started commercial operations. Prime Terracota As of March 31, 2020 and December 31, 2019, Prime Terracota’s subsidiaries include the following companies:

- 7 -
Percentage of Voting Interest
March 31,
2020 December 31,
2019 Red Vulcan Holdings Corporation (Red Vulcan) 100 100 EDC1 64 64 First Gen Hydro Power Corporation (FG Hydro) 38 38 EDC Geothermal Corp. (EGC)3 64 64 Green Core Geothermal Inc. (GCGI) 64 64 Bac-Man Geothermal Inc. (BGI) 64 64 Unified Leyte Geothermal Energy Inc. (ULGEI) 64 64 Southern Negros Geothermal, Inc. (SNGI)2 64 64 Bac-Man Energy Development Corporation (BEDC) 2 64 64 EDC Wind Energy Holdings, Inc. (EWEHI) 2 64 64 EDC Burgos Wind Power Corporation (EBWPC) 64 64 EDC Pagudpud Wind Power Corporation (EPWPC) 2 64 64 EDC Bayog Burgos Wind Power Corporation (EBBWPC) 2 64 64 EDC Pagali Burgos Wind Power Corporation (EPBWPC) 2 64 64 Matnog 1 Renewable Energy Corporation (M1REC) 2 64 64 Matnog 2 Renewable Energy Corporation (M2REC) 2 64 64 Matnog 3 Renewable Energy Corporation (M3REC) 2 64 64 Iloilo 1 Renewable Energy Corporation (I1REC) 2 64 64 Negros 1 Renewable Energy Corporation (N1REC) 2 64 64 EDC Bright Solar Energy Holdings, Inc. (EBSEHI)3 64 64 EDC Siklab Power Corporation (EDC Siklab)2 64 64 EDC Sinag Power Corporation (Sinag)2 64 64 EDC Sinag Iloilo Power Corporation (EDC Sinag Iloilo)2 64 64 EDC Siklab Iloilo Power Corporation (Siklab Iloilo)2 64 64 EDC Clean Solar Visayas Power Corporation (ECSVPC2 64 64 EDC Chile Limitada2 64 64 EDC Holdings International Limited (EHIL) 3 64 64
Energy Development Corporation Hong Kong International Investment Limited (EDC HKIIL) 2 64 64
Energy Development Corporation Hong Kong Limited (EDC HKL) 3 64 64 EDC Chile Holdings SPA2 64 64 EDC Geotermica Chile2 64 64 EDC Peru Holdings S.A.C. 2 64 64 EDC Geotermica Peru S.A.C. 2 64 64 Energy Development Corporation Peru S.A.C.2 64 64 EDC Geotermica Del Sur S.A.C. 2 64 64 EDC Energia Azul S.A.C. 2 64 64 Geotermica Crucero Peru S.A.C. 2 45 45 EDC Energía Perú S.A.C. 2 64 64 Geotermica Tutupaca Norte Peru S.A.C. 2 45 45 EDC Energía Geotérmica S.A.C. 2 64 64 EDC Progreso Geotérmica Perú S.A.C. 2 64 64 Geotermica Loriscota Peru S.A.C. 2 45 45 EDC Energía Renovable Perú S.A.C. 2 64 64 EDC Soluciones Sostenibles Ltd 64 64 EDC Energia Verde Chile SpA 64 64 EDC Energia de la Tierra SpA 64 64 EDC Desarollo Sostenible Ltd. 64 64 EDC Energia Verde Peru SAC 64 64 PT EDC Indonesia3 61 61 PT EDC Panas Bumi Indonesia 3 61 61 EDC Wind Energy Holdings 2 Inc. (EWEHI2) 2,3 64 64 Calaca Renewable Energy Corporation (CREC) 2 64 64 Burgos 3 Renewable Energy Corporation (BREC3) 2 64 64 Burgos 4 Renewable Energy Corporation (BREC4) 2 64 64 Burgos 4 Renewable Energy Corporation (BREC4) 2 64 64 1The Parent Company’s effective economic and voting interest in EDC is 45.7% and 65.0% as of March 31, 2020. 2Incorporated before 2020 and has not yet started commercial operations as of March 31, 2020. 3Serves as an investment holding company. EDC On August 3, 2017, the Parent Company entered into an Implementation Agreement with Philippines Renewable Energy Holdings Corporation (“PREHC”), Red Vulcan and Northern Terracotta. PREHC is a company incorporated in the Philippines.

- 8 -
Under the Implementation Agreement, PREHC will conduct a voluntary tender offer for a minimum of 6.6 billion common stocks and up to a maximum of 8.9 billion common stocks of EDC, representing approximately up to 31.7% of the total outstanding voting shares of EDC, from the shareholders of EDC at a price of P=7.25 per share. On September 29, 2017, Red Vulcan entered into a Shareholders’ Agreement with Philippine Energy Markets B.V. (PEMBV), PREHC and EDC. PEMBV is a private company existing under the laws of the Netherlands and is the parent company of PREHC. The agreement sets out the agreement of the parties with respect to the management of EDC. The Parent Company and Northern Terracotta tendered to PREHC their 991.8 million and 986.3 million common stocks, respectively, subject to scale-back provisions under applicable regulations. Following the implementation of the scale back announced by PREHC, the tendered shares were 842.9 million and 838.2 million common stocks for the Parent Company and Northern Terracotta, respectively. Red Vulcan did not participate in the tender offer process and retained its existing common stocks and voting preferred stocks, which correspond to a 60.0% voting stake in EDC. The Parent Company continues to consolidate EDC given its current controlling stake. However, the Parent Company’s economic interest in EDC was reduced from 50.6% as of December 31, 2016 to 41.6% after the transaction. On August 7, 2018, the BOD of EDC approved the petition for voluntary delisting (the Delisting) of its common stocks from the Main Board of the PSE and, in accordance with the PSE’s delisting rules and regulations, to conduct a tender offer (the Tender Offer) for up to 2.04 billion common stocks held collectively by all shareholders of EDC other than Red Vulcan, the Parent Company, Northern Terracotta, and PREHC, at a price of P=7.25 per common stock (the Tender Offer Price).
On September 19, 2018, EDC filed a petition for the Delisting with the PSE. The Tender Offer began on September 25, 2018 and ended on October 22, 2018. Following the completion of the Tender Offer, a total of 2.0 billion common stocks, representing approximately 10.72% of EDC outstanding voting shares were tendered pursuant to the Tender Offer, accepted and thereafter purchased by EDC via a block sale through the facilities of the PSE on November 5, 2018. The shares were purchased at the Tender Offer Price with a total transaction value of $277.6 million (P=14,566.0 million).
On November 14, 2018, the BOD of the PSE granted the petition for voluntary delisting filed by EDC, and accordingly, ordered the delisting of EDC’s common stocks from the official registry of the PSE (electronic board and ticker) effective on November 29, 2018. On December 3, 2018, the BOD of EDC approved the issuance of additional 326.3 million non-preemption common stocks to PREHC out of its unissued capital stock for a total consideration of $45.1 million (P=2,365.3 million) or at an issue price of P=7.25 per common stock. As of March 31, 2020 and December 31, 2019, PREHC owns 34.9% of EDC’s outstanding voting stocks. Red Vulcan still holds the controlling voting interest with 63.9% ownership of EDC’s outstanding voting stocks. The Parent Company continues to consolidate EDC given its current controlling stake. As of March 31, 2020 and December 31, 2019, the Parent Company has 65.0% effective voting
- 9 -
interest in EDC through Prime Terracota. Investments in Associates An associate is an entity over which First Gen Group has significant influence. Significant influence is the power to participate in the financial and operating policy decisions of the investee but is not in control or in joint control of those policies. First Private Power Corporation (FPPC) has 93.25% voting and economic interest in Bauang Private Power Corporation (BPPC). By virtue of the merger, FPPC transferred its assets and liabilities at their carrying values to BPPC on December 15, 2010. On November 24, 2017, BPPC’s BOD and stockholders approved a resolution to amend BPPC’s articles of incorporation shortening the term of the Company’s existence from “fifty (50) years from the date of incorporation hereof” to “until June 30, 2019”. As of March 31, 2020 and December 31, 2019, the Parent Company has 37% effective economic and voting interest in BPPC. As of March 31, 2020 and December 31, 2019, the investment in BPPC amounted to nil.
3. Operating Segment Information Operating segments are components of First Gen Group that are engaged in business activities from which they may earn revenues and incur expenses, whose operating results are regularly reviewed by First Gen Group’s Chief Operating Decision Maker (CODM) to make decisions about how resources are to be allocated to the segment and assess their performances, and for which discrete financial information is available. For purposes of management reporting, First Gen Group’s operating businesses are organized and managed separately on a per company basis, with each company representing a strategic business segment. First Gen’s identified operating segments, which are consistent with the segments reported to the BOD, which is the CODM of First Gen, are as follows:
• FGPC, which operates the 1,000 megawatt (MW) combined cycle, natural gas-fired Santa Rita
power plant, and where the Parent Company now has a 100% equity interest;
• FGP, which operates the 500 MW combined cycle, natural gas-fired San Lorenzo power plant, and where the Parent Company now has a 100% equity interest;
• EDC and Subsidiaries, which holds service contracts with the DOE corresponding to 11 geothermal contract areas each granting EDC exclusive rights to explore, develop, and utilize the corresponding resources in the relevant contract area. EDC conducts commercial operations in four (4) out of its 11 geothermal contract areas. Likewise, EDC owns the 150 MW Burgos Wind Power Plant (Burgos Wind) and the 6.82 MW Burgos Solar Power Plant Phase 1 and Phase 2 (Burgos Solar) both situated in Burgos, Ilocos Norte. As of March 31, 2020, Burgos Wind and Burgos Solar power plants are entitled to the FIT rates. Also, EDC, through EDC Siklab, earns revenue from its solar rooftop PPAs and lease agreements. As of March 31, 2020, the Parent Company has a 100.0% direct voting interest in Prime Terracota and 45.7% effective economic interest in EDC through Prime Terracota;
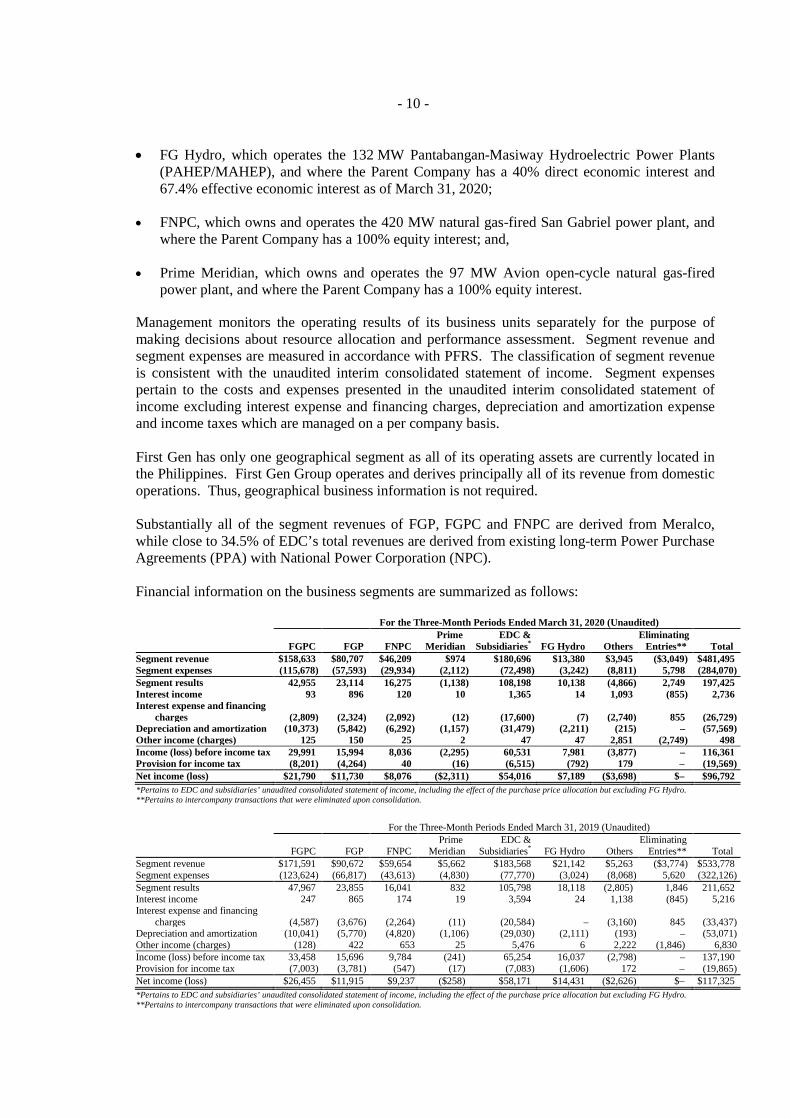
- 10 -
• FG Hydro, which operates the 132 MW Pantabangan-Masiway Hydroelectric Power Plants (PAHEP/MAHEP), and where the Parent Company has a 40% direct economic interest and 67.4% effective economic interest as of March 31, 2020;
• FNPC, which owns and operates the 420 MW natural gas-fired San Gabriel power plant, and
where the Parent Company has a 100% equity interest; and,
• Prime Meridian, which owns and operates the 97 MW Avion open-cycle natural gas-fired power plant, and where the Parent Company has a 100% equity interest.
Management monitors the operating results of its business units separately for the purpose of making decisions about resource allocation and performance assessment. Segment revenue and segment expenses are measured in accordance with PFRS. The classification of segment revenue is consistent with the unaudited interim consolidated statement of income. Segment expenses pertain to the costs and expenses presented in the unaudited interim consolidated statement of income excluding interest expense and financing charges, depreciation and amortization expense and income taxes which are managed on a per company basis. First Gen has only one geographical segment as all of its operating assets are currently located in the Philippines. First Gen Group operates and derives principally all of its revenue from domestic operations. Thus, geographical business information is not required. Substantially all of the segment revenues of FGP, FGPC and FNPC are derived from Meralco, while close to 34.5% of EDC’s total revenues are derived from existing long-term Power Purchase Agreements (PPA) with National Power Corporation (NPC).
Financial information on the business segments are summarized as follows:
For the Three-Month Periods Ended March 31, 2020 (Unaudited)
FGPC FGP FNPC Prime
Meridian EDC &
Subsidiaries* FG Hydro Others Eliminating
Entries** Total Segment revenue $158,633 $80,707 $46,209 $974 $180,696 $13,380 $3,945 ($3,049) $481,495 Segment expenses (115,678) (57,593) (29,934) (2,112) (72,498) (3,242) (8,811) 5,798 (284,070) Segment results 42,955 23,114 16,275 (1,138) 108,198 10,138 (4,866) 2,749 197,425 Interest income 93 896 120 10 1,365 14 1,093 (855) 2,736 Interest expense and financing
charges (2,809) (2,324) (2,092) (12) (17,600) (7) (2,740) 855 (26,729) Depreciation and amortization (10,373) (5,842) (6,292) (1,157) (31,479) (2,211) (215) – (57,569) Other income (charges) 125 150 25 2 47 47 2,851 (2,749) 498 Income (loss) before income tax 29,991 15,994 8,036 (2,295) 60,531 7,981 (3,877) – 116,361 Provision for income tax (8,201) (4,264) 40 (16) (6,515) (792) 179 – (19,569) Net income (loss) $21,790 $11,730 $8,076 ($2,311) $54,016 $7,189 ($3,698) $– $96,792 *Pertains to EDC and subsidiaries’ unaudited consolidated statement of income, including the effect of the purchase price allocation but excluding FG Hydro. **Pertains to intercompany transactions that were eliminated upon consolidation.
For the Three-Month Periods Ended March 31, 2019 (Unaudited)
FGPC FGP FNPC Prime
Meridian EDC &
Subsidiaries* FG Hydro Others Eliminating
Entries** Total Segment revenue $171,591 $90,672 $59,654 $5,662 $183,568 $21,142 $5,263 ($3,774) $533,778 Segment expenses (123,624) (66,817) (43,613) (4,830) (77,770) (3,024) (8,068) 5,620 (322,126) Segment results 47,967 23,855 16,041 832 105,798 18,118 (2,805) 1,846 211,652 Interest income 247 865 174 19 3,594 24 1,138 (845) 5,216 Interest expense and financing charges (4,587) (3,676) (2,264) (11) (20,584) – (3,160) 845 (33,437) Depreciation and amortization (10,041) (5,770) (4,820) (1,106) (29,030) (2,111) (193) – (53,071) Other income (charges) (128) 422 653 25 5,476 6 2,222 (1,846) 6,830 Income (loss) before income tax 33,458 15,696 9,784 (241) 65,254 16,037 (2,798) – 137,190 Provision for income tax (7,003) (3,781) (547) (17) (7,083) (1,606) 172 – (19,865) Net income (loss) $26,455 $11,915 $9,237 ($258) $58,171 $14,431 ($2,626) $– $117,325 *Pertains to EDC and subsidiaries’ unaudited consolidated statement of income, including the effect of the purchase price allocation but excluding FG Hydro. **Pertains to intercompany transactions that were eliminated upon consolidation.
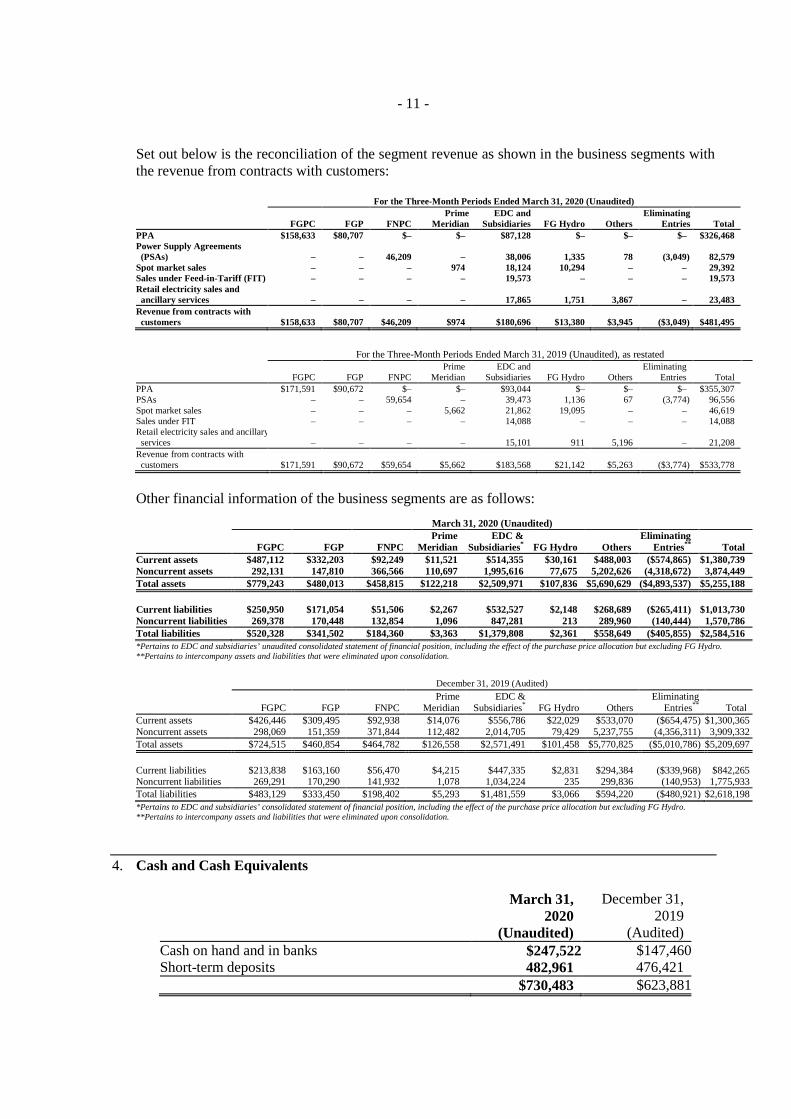
- 11 -
Set out below is the reconciliation of the segment revenue as shown in the business segments with the revenue from contracts with customers: For the Three-Month Periods Ended March 31, 2020 (Unaudited)
FGPC FGP FNPC Prime
Meridian EDC and
Subsidiaries FG Hydro Others Eliminating
Entries Total PPA $158,633 $80,707 $– $– $87,128 $– $– $– $326,468 Power Supply Agreements
(PSAs) – – 46,209 – 38,006 1,335 78 (3,049) 82,579 Spot market sales – – – 974 18,124 10,294 – – 29,392 Sales under Feed-in-Tariff (FIT) – – – – 19,573 – – – 19,573 Retail electricity sales and
ancillary services – – – – 17,865 1,751 3,867 – 23,483 Revenue from contracts with
customers $158,633 $80,707 $46,209 $974 $180,696 $13,380 $3,945 ($3,049) $481,495
For the Three-Month Periods Ended March 31, 2019 (Unaudited), as restated
FGPC FGP FNPC Prime
Meridian EDC and
Subsidiaries FG Hydro Others Eliminating
Entries Total PPA $171,591 $90,672 $– $– $93,044 $– $– $– $355,307 PSAs – – 59,654 – 39,473 1,136 67 (3,774) 96,556 Spot market sales – – – 5,662 21,862 19,095 – – 46,619 Sales under FIT – – – – 14,088 – – – 14,088 Retail electricity sales and ancillary
services – – – – 15,101 911 5,196 – 21,208 Revenue from contracts with
customers $171,591 $90,672 $59,654 $5,662 $183,568 $21,142 $5,263 ($3,774) $533,778
Other financial information of the business segments are as follows: March 31, 2020 (Unaudited)
FGPC FGP FNPC Prime
Meridian EDC &
Subsidiaries* FG Hydro Others Eliminating
Entries** Total Current assets $487,112 $332,203 $92,249 $11,521 $514,355 $30,161 $488,003 ($574,865) $1,380,739 Noncurrent assets 292,131 147,810 366,566 110,697 1,995,616 77,675 5,202,626 (4,318,672) 3,874,449 Total assets $779,243 $480,013 $458,815 $122,218 $2,509,971 $107,836 $5,690,629 ($4,893,537) $5,255,188 Current liabilities $250,950 $171,054 $51,506 $2,267 $532,527 $2,148 $268,689 ($265,411) $1,013,730 Noncurrent liabilities 269,378 170,448 132,854 1,096 847,281 213 289,960 (140,444) 1,570,786 Total liabilities $520,328 $341,502 $184,360 $3,363 $1,379,808 $2,361 $558,649 ($405,855) $2,584,516 *Pertains to EDC and subsidiaries’ unaudited consolidated statement of financial position, including the effect of the purchase price allocation but excluding FG Hydro. **Pertains to intercompany assets and liabilities that were eliminated upon consolidation.
December 31, 2019 (Audited)
FGPC FGP FNPC Prime
Meridian EDC &
Subsidiaries* FG Hydro Others Eliminating
Entries** Total Current assets $426,446 $309,495 $92,938 $14,076 $556,786 $22,029 $533,070 ($654,475) $1,300,365 Noncurrent assets 298,069 151,359 371,844 112,482 2,014,705 79,429 5,237,755 (4,356,311) 3,909,332 Total assets $724,515 $460,854 $464,782 $126,558 $2,571,491 $101,458 $5,770,825 ($5,010,786) $5,209,697 Current liabilities $213,838 $163,160 $56,470 $4,215 $447,335 $2,831 $294,384 ($339,968) $842,265 Noncurrent liabilities 269,291 170,290 141,932 1,078 1,034,224 235 299,836 (140,953) 1,775,933 Total liabilities $483,129 $333,450 $198,402 $5,293 $1,481,559 $3,066 $594,220 ($480,921) $2,618,198 *Pertains to EDC and subsidiaries’ consolidated statement of financial position, including the effect of the purchase price allocation but excluding FG Hydro. **Pertains to intercompany assets and liabilities that were eliminated upon consolidation.
4. Cash and Cash Equivalents
March 31, 2020
(Unaudited)
December 31, 2019
(Audited) Cash on hand and in banks $247,522 $147,460 Short-term deposits 482,961 476,421 $730,483 $623,881
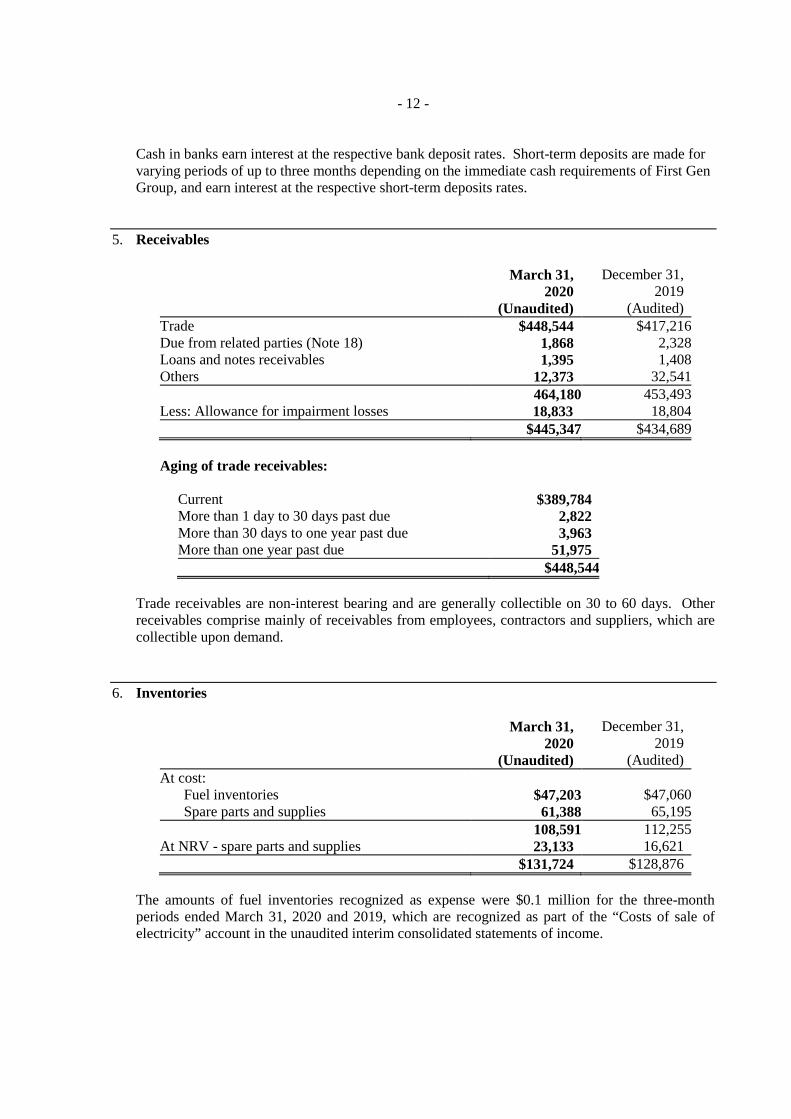
- 12 -
Cash in banks earn interest at the respective bank deposit rates. Short-term deposits are made for varying periods of up to three months depending on the immediate cash requirements of First Gen Group, and earn interest at the respective short-term deposits rates.
5. Receivables
March 31, 2020
(Unaudited)
December 31, 2019
(Audited) Trade $448,544 $417,216 Due from related parties (Note 18) 1,868 2,328 Loans and notes receivables 1,395 1,408 Others 12,373 32,541 464,180 453,493 Less: Allowance for impairment losses 18,833 18,804 $445,347 $434,689
Aging of trade receivables:
Current $389,784 More than 1 day to 30 days past due 2,822 More than 30 days to one year past due 3,963 More than one year past due 51,975 $448,544
Trade receivables are non-interest bearing and are generally collectible on 30 to 60 days. Other receivables comprise mainly of receivables from employees, contractors and suppliers, which are collectible upon demand.
6. Inventories
March 31, 2020
(Unaudited)
December 31, 2019
(Audited) At cost: Fuel inventories $47,203 $47,060 Spare parts and supplies 61,388 65,195 108,591 112,255 At NRV - spare parts and supplies 23,133 16,621 $131,724 $128,876
The amounts of fuel inventories recognized as expense were $0.1 million for the three-month periods ended March 31, 2020 and 2019, which are recognized as part of the “Costs of sale of electricity” account in the unaudited interim consolidated statements of income.
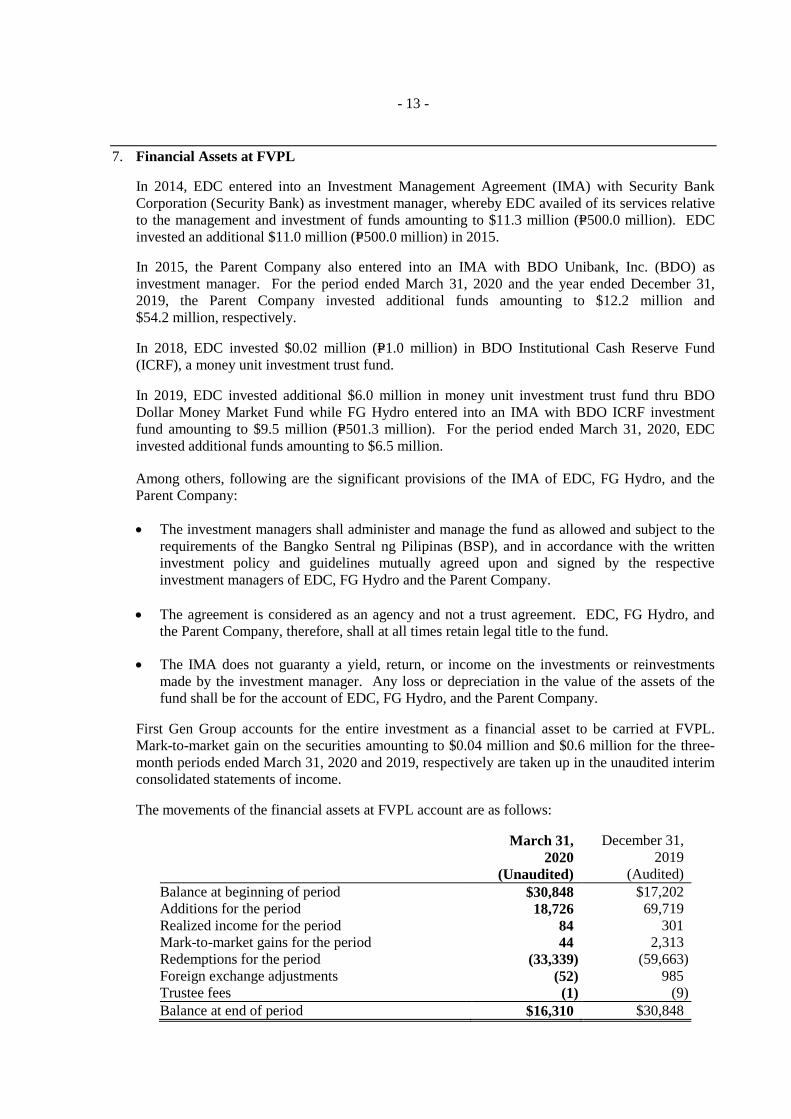
- 13 -
7. Financial Assets at FVPL
In 2014, EDC entered into an Investment Management Agreement (IMA) with Security Bank Corporation (Security Bank) as investment manager, whereby EDC availed of its services relative to the management and investment of funds amounting to $11.3 million (P=500.0 million). EDC invested an additional $11.0 million (P=500.0 million) in 2015.
In 2015, the Parent Company also entered into an IMA with BDO Unibank, Inc. (BDO) as investment manager. For the period ended March 31, 2020 and the year ended December 31, 2019, the Parent Company invested additional funds amounting to $12.2 million and $54.2 million, respectively. In 2018, EDC invested $0.02 million (P=1.0 million) in BDO Institutional Cash Reserve Fund (ICRF), a money unit investment trust fund. In 2019, EDC invested additional $6.0 million in money unit investment trust fund thru BDO Dollar Money Market Fund while FG Hydro entered into an IMA with BDO ICRF investment fund amounting to $9.5 million (P=501.3 million). For the period ended March 31, 2020, EDC invested additional funds amounting to $6.5 million.
Among others, following are the significant provisions of the IMA of EDC, FG Hydro, and the Parent Company:
• The investment managers shall administer and manage the fund as allowed and subject to the requirements of the Bangko Sentral ng Pilipinas (BSP), and in accordance with the written investment policy and guidelines mutually agreed upon and signed by the respective investment managers of EDC, FG Hydro and the Parent Company.
• The agreement is considered as an agency and not a trust agreement. EDC, FG Hydro, and the Parent Company, therefore, shall at all times retain legal title to the fund.
• The IMA does not guaranty a yield, return, or income on the investments or reinvestments
made by the investment manager. Any loss or depreciation in the value of the assets of the fund shall be for the account of EDC, FG Hydro, and the Parent Company.
First Gen Group accounts for the entire investment as a financial asset to be carried at FVPL. Mark-to-market gain on the securities amounting to $0.04 million and $0.6 million for the three-month periods ended March 31, 2020 and 2019, respectively are taken up in the unaudited interim consolidated statements of income.
The movements of the financial assets at FVPL account are as follows:
March 31, 2020
(Unaudited)
December 31, 2019
(Audited) Balance at beginning of period $30,848 $17,202 Additions for the period 18,726 69,719 Realized income for the period 84 301 Mark-to-market gains for the period 44 2,313 Redemptions for the period (33,339) (59,663) Foreign exchange adjustments (52) 985 Trustee fees (1) (9) Balance at end of period $16,310 $30,848
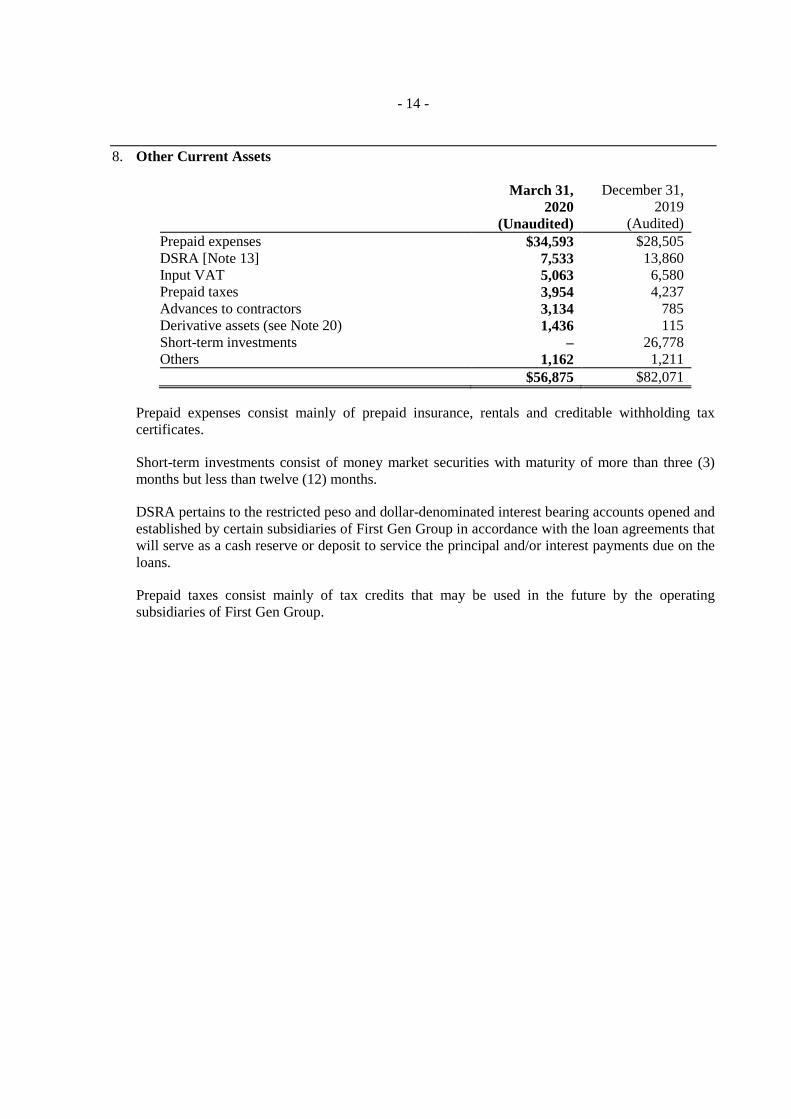
- 14 -
8. Other Current Assets
March 31, 2020
(Unaudited)
December 31, 2019
(Audited) Prepaid expenses $34,593 $28,505 DSRA [Note 13] 7,533 13,860 Input VAT 5,063 6,580 Prepaid taxes 3,954 4,237 Advances to contractors 3,134 785 Derivative assets (see Note 20) 1,436 115 Short-term investments – 26,778 Others 1,162 1,211 $56,875 $82,071
Prepaid expenses consist mainly of prepaid insurance, rentals and creditable withholding tax certificates.
Short-term investments consist of money market securities with maturity of more than three (3) months but less than twelve (12) months.
DSRA pertains to the restricted peso and dollar-denominated interest bearing accounts opened and established by certain subsidiaries of First Gen Group in accordance with the loan agreements that will serve as a cash reserve or deposit to service the principal and/or interest payments due on the loans.
Prepaid taxes consist mainly of tax credits that may be used in the future by the operating subsidiaries of First Gen Group.

- 15 -
9. Property, Plant and Equipment Movements in the account are as follows: March 31, 2020 (Unaudited)
Land
Power Plants, Buildings,
Improvements and Other Structures
Exploration, Machinery and
Equipment
Fluid Collection and Recycling
System (FCRS) and Production
Wells
Furniture, Fixtures and
Equipment Transportation
Equipment Leasehold
Improvements Construction
in Progress Total Costs: Balances at December 31, 2019 $58,871 $2,040,009 $1,362,181 $912,172 $41,487 $5,654 $5,257 $166,875 $4,592,506 Additions 2 267 200 − 90 142 − 16,472 17,173 Retirements/write-off − − (64) − (109) (37) − (210) Reclassifications/adjustments − 1,309 176 5,806 (316) (12) − (6,601) 362 Foreign exchange adjustments (36) (1,034) (143) (798) (13) (1) − (128) (2,153) Balances at March 31, 2020 58,837 2,040,551 1,362,350 917,180 41,139 5,746 5,257 176,618 4,607,678 Accumulated Depreciation, Amortization and Impairment Losses: Balances at December 31, 2019 348 863,126 873,061 264,555 33,061 3,906 4,149 370 2,042,576 Depreciation and amortization − 23,878 19,801 7,756 1,216 165 228 − 53,044 Retirements/write-off − − (62) − (88) (33) − − (183) Reclassifications/adjustments − 62 110 − (201) (8) − − (37) Foreign exchange adjustments − (430) (52) (217) (22) (1) − − (722) Balances at March 31, 2020 348 886,636 892,858 272,094 33,966 4,029 4,377 370 2,094,678 Net Book Values $58,489 $1,153,915 $469,492 $645,086 $7,173 $1,717 $880 $176,248 $2,513,000 December 31, 2019 (Audited)
Land
Power Plants, Buildings,
Improvements and Other Structures
Exploration, Machinery and
Equipment
Fluid Collection and Recycling
System (FCRS) and Production
Wells
Furniture, Fixtures and
Equipment Transportation
Equipment Leasehold
Improvements Construction
in Progress Total Costs: Balances at December 31, 2018 $57,560 $1,956,414 $1,348,251 $822,307 $38,130 $5,944 $5,063 $145,644 $4,379,313 Additions 48 10,419 2,246 − 1,222 723 48 109,904 124,610 Retirements/write-off − (85) (3,083) − (1,546) (1,018) − − (5,732) Reclassifications/adjustments (221) 30,156 8,805 56,797 2,558 (66) 125 (94,572) 3,582 Foreign exchange adjustments 1,484 43,105 5,962 33,068 1,123 71 21 5,899 90,733 Balances at December 31, 2019 58,871 2,040,009 1,362,181 912,172 41,487 5,654 5,257 166,875 4,592,506 Accumulated Depreciation, Amortization and Impairment Losses: Balances at December 31, 2018 335 748,462 796,970 226,195 29,116 3,862 3,220 356 1,808,516 Depreciation and amortization − 95,673 77,085 28,961 4,618 987 914 − 208,238 Retirements/write-off − (62) (2,998) − (1,504) (913) − − (5,477) Reclassifications/adjustments − 330 (225) (44) (34) (84) − − (57) Foreign exchange adjustments 13 18,723 2,229 9,443 865 54 15 14 31,356 Balances at December 31, 2019 348 863,126 873,061 264,555 33,061 3,906 4,149 370 2,042,576 Net Book Values $58,523 $1,176,883 $489,120 $647,617 $8,426 $1,748 $1,108 $166,505 $2,549,930

- 16 -
Property, plant and equipment with net book values of $300.7 million and $304.5 million as of March 31, 2020 and December 31, 2019, respectively, have been pledged as security for long-term debt (see Note 13).
Depreciation and Amortization Details of depreciation and amortization charges recognized in the unaudited interim consolidated statements of income are shown below:
For the Three-Month Periods Ended
March 31 2020 2019 Property, plant and equipment $53,044 $50,007 Intangible assets 3,363 3,064 Right-of-use of assets 1,162 − $57,569 $53,071
For the Three-Month Periods Ended
March 31 2020 2019 Costs of sale of electricity (see Note 16) $53,950 $50,912 General and administrative (see Note 16) 3,619 2,159 $57,569 $53,071
10. Goodwill and Intangible Assets
March 31, 2020 (Unaudited)
Goodwill
Concession Rights for Contracts Acquired
Water Rights
Pipeline Rights
Rights to Use
Transmission Line
Other Intangible
Assets Total Cost Balances at December 31, 2019 $954,702 $164,644 $47,493 $13,253 $1,152 $10,331 $1,191,575 Additions – – – – – 58 58 Foreign exchange adjustments (837) (146) (42) – – (37) (1,062) Balances at March 31, 2020 953,865 164,498 47,451 13,253 1,152 10,352 1,190,571 Accumulated Amortization: Balances at December 31, 2019 − 149,487 24,933 10,389 480 5,433 190,722 Amortization (see Note 9) – 2,311 474 151 30 397 3,363 Foreign exchange adjustments – (128) (21) – – (33) (182) Balances at March 31, 2020 – 151,670 25,386 10,540 510 5,797 193,903 Net Book Values $953,865 $12,828 $22,065 $2,713 $642 $4,555 $996,668
December 31, 2018 (Audited)
Goodwill
(Note 3)
Concession Rights for Contracts Acquired
Water Rights
Pipeline Rights
Rights to Use
Transmission Line
Other Intangible
Assets Total Costs: Balances at December 31, 2018 $919,817 $158,553 $45,736 $13,253 $1,152 $7,394 $1,145,905 Additions − − − − − 2,586 2,586 Foreign exchange adjustments 34,885 6,091 1,757 − − 351 43,084 Balances at December 31, 2019 954,702 164,644 47,493 13,253 1,152 10,331 1,191,575 Accumulated Amortization: Balances at December 31, 2018 − 135,013 22,182 9,786 360 4,363 171,704 Amortization − 9,052 1,851 603 120 880 12,506 Foreign exchange adjustments − 5,422 900 − − 190 6,512 Balances at December 31, 2019 − 149,487 24,933 10,389 480 5,433 190,722 Net Book Values $954,702 $15,157 $22,560 $2,864 $672 $4,898 $1,000,853
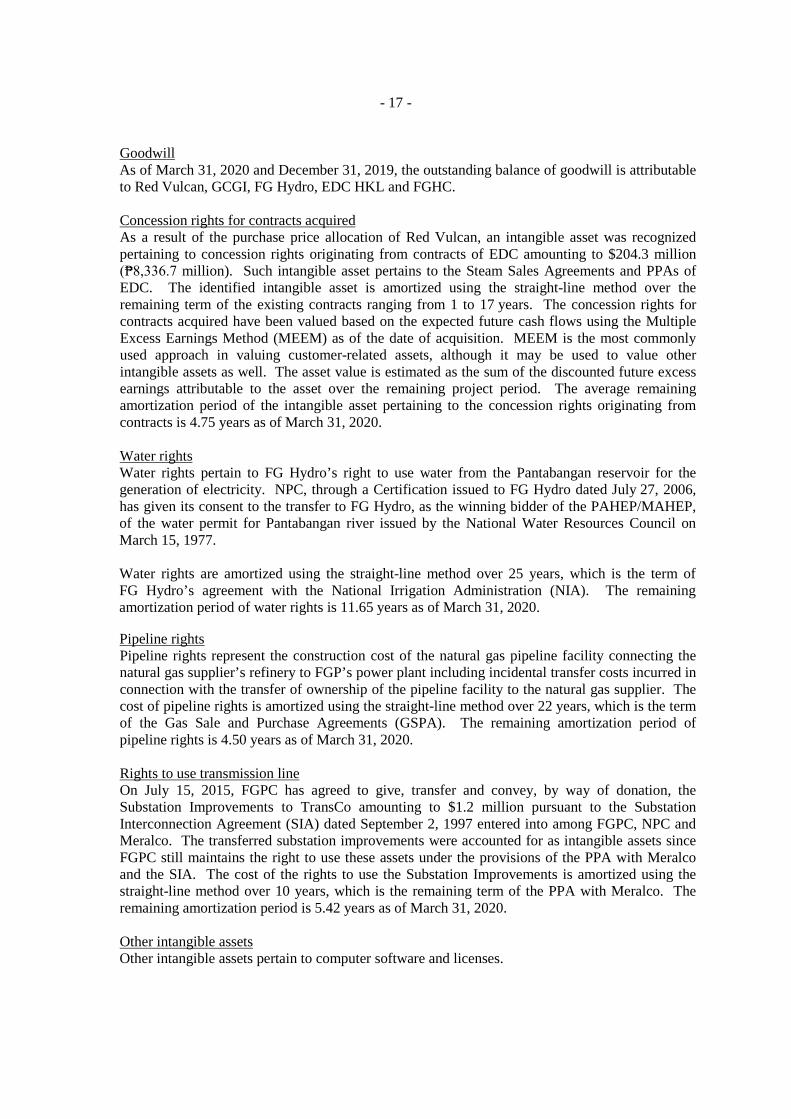
- 17 -
Goodwill As of March 31, 2020 and December 31, 2019, the outstanding balance of goodwill is attributable to Red Vulcan, GCGI, FG Hydro, EDC HKL and FGHC. Concession rights for contracts acquired As a result of the purchase price allocation of Red Vulcan, an intangible asset was recognized pertaining to concession rights originating from contracts of EDC amounting to $204.3 million (₱8,336.7 million). Such intangible asset pertains to the Steam Sales Agreements and PPAs of EDC. The identified intangible asset is amortized using the straight-line method over the remaining term of the existing contracts ranging from 1 to 17 years. The concession rights for contracts acquired have been valued based on the expected future cash flows using the Multiple Excess Earnings Method (MEEM) as of the date of acquisition. MEEM is the most commonly used approach in valuing customer-related assets, although it may be used to value other intangible assets as well. The asset value is estimated as the sum of the discounted future excess earnings attributable to the asset over the remaining project period. The average remaining amortization period of the intangible asset pertaining to the concession rights originating from contracts is 4.75 years as of March 31, 2020.
Water rights Water rights pertain to FG Hydro’s right to use water from the Pantabangan reservoir for the generation of electricity. NPC, through a Certification issued to FG Hydro dated July 27, 2006, has given its consent to the transfer to FG Hydro, as the winning bidder of the PAHEP/MAHEP, of the water permit for Pantabangan river issued by the National Water Resources Council on March 15, 1977.
Water rights are amortized using the straight-line method over 25 years, which is the term of FG Hydro’s agreement with the National Irrigation Administration (NIA). The remaining amortization period of water rights is 11.65 years as of March 31, 2020.
Pipeline rights Pipeline rights represent the construction cost of the natural gas pipeline facility connecting the natural gas supplier’s refinery to FGP’s power plant including incidental transfer costs incurred in connection with the transfer of ownership of the pipeline facility to the natural gas supplier. The cost of pipeline rights is amortized using the straight-line method over 22 years, which is the term of the Gas Sale and Purchase Agreements (GSPA). The remaining amortization period of pipeline rights is 4.50 years as of March 31, 2020. Rights to use transmission line On July 15, 2015, FGPC has agreed to give, transfer and convey, by way of donation, the Substation Improvements to TransCo amounting to $1.2 million pursuant to the Substation Interconnection Agreement (SIA) dated September 2, 1997 entered into among FGPC, NPC and Meralco. The transferred substation improvements were accounted for as intangible assets since FGPC still maintains the right to use these assets under the provisions of the PPA with Meralco and the SIA. The cost of the rights to use the Substation Improvements is amortized using the straight-line method over 10 years, which is the remaining term of the PPA with Meralco. The remaining amortization period is 5.42 years as of March 31, 2020.
Other intangible assets Other intangible assets pertain to computer software and licenses.
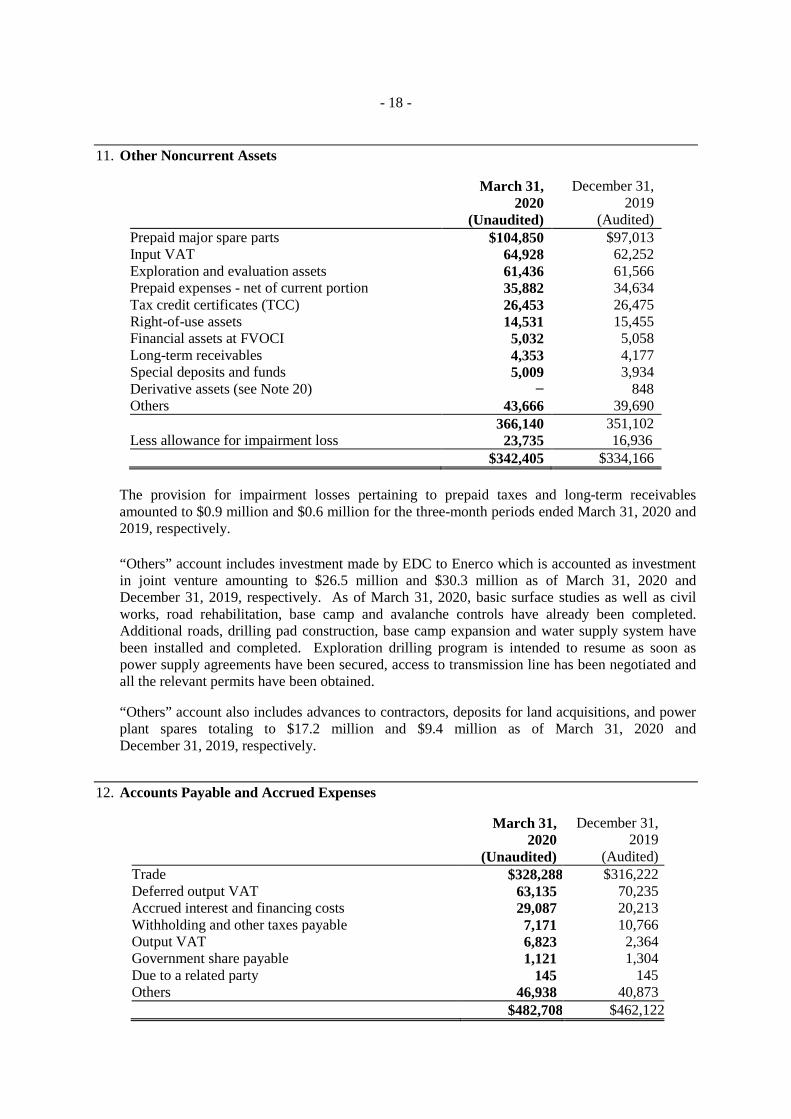
- 18 -
11. Other Noncurrent Assets
March 31, 2020
(Unaudited)
December 31, 2019
(Audited) Prepaid major spare parts $104,850 $97,013 Input VAT 64,928 62,252 Exploration and evaluation assets 61,436 61,566 Prepaid expenses - net of current portion 35,882 34,634 Tax credit certificates (TCC) 26,453 26,475 Right-of-use assets 14,531 15,455 Financial assets at FVOCI 5,032 5,058 Long-term receivables 4,353 4,177 Special deposits and funds 5,009 3,934 Derivative assets (see Note 20) − 848 Others 43,666 39,690 366,140 351,102 Less allowance for impairment loss 23,735 16,936 $342,405 $334,166
The provision for impairment losses pertaining to prepaid taxes and long-term receivables amounted to $0.9 million and $0.6 million for the three-month periods ended March 31, 2020 and 2019, respectively. “Others” account includes investment made by EDC to Enerco which is accounted as investment in joint venture amounting to $26.5 million and $30.3 million as of March 31, 2020 and December 31, 2019, respectively. As of March 31, 2020, basic surface studies as well as civil works, road rehabilitation, base camp and avalanche controls have already been completed. Additional roads, drilling pad construction, base camp expansion and water supply system have been installed and completed. Exploration drilling program is intended to resume as soon as power supply agreements have been secured, access to transmission line has been negotiated and all the relevant permits have been obtained. “Others” account also includes advances to contractors, deposits for land acquisitions, and power plant spares totaling to $17.2 million and $9.4 million as of March 31, 2020 and December 31, 2019, respectively.
12. Accounts Payable and Accrued Expenses
March 31, 2020
(Unaudited)
December 31, 2019
(Audited) Trade $328,288 $316,222 Deferred output VAT 63,135 70,235 Accrued interest and financing costs 29,087 20,213 Withholding and other taxes payable 7,171 10,766 Output VAT 6,823 2,364 Government share payable 1,121 1,304 Due to a related party 145 145 Others 46,938 40,873 $482,708 $462,122
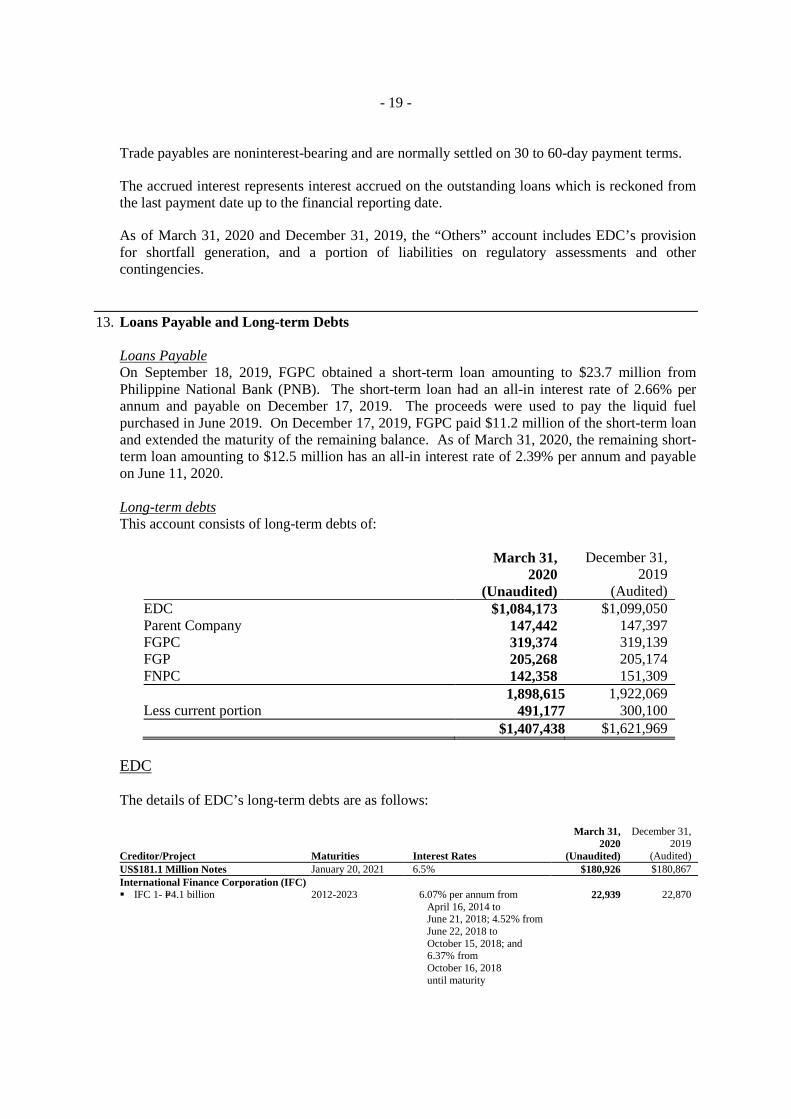
- 19 -
Trade payables are noninterest-bearing and are normally settled on 30 to 60-day payment terms.
The accrued interest represents interest accrued on the outstanding loans which is reckoned from the last payment date up to the financial reporting date.
As of March 31, 2020 and December 31, 2019, the “Others” account includes EDC’s provision for shortfall generation, and a portion of liabilities on regulatory assessments and other contingencies.
13. Loans Payable and Long-term Debts
Loans Payable On September 18, 2019, FGPC obtained a short-term loan amounting to $23.7 million from Philippine National Bank (PNB). The short-term loan had an all-in interest rate of 2.66% per annum and payable on December 17, 2019. The proceeds were used to pay the liquid fuel purchased in June 2019. On December 17, 2019, FGPC paid $11.2 million of the short-term loan and extended the maturity of the remaining balance. As of March 31, 2020, the remaining short-term loan amounting to $12.5 million has an all-in interest rate of 2.39% per annum and payable on June 11, 2020. Long-term debts This account consists of long-term debts of:
March 31, 2020
(Unaudited)
December 31, 2019
(Audited) EDC $1,084,173 $1,099,050 Parent Company 147,442 147,397 FGPC 319,374 319,139 FGP 205,268 205,174 FNPC 142,358 151,309 1,898,615 1,922,069 Less current portion 491,177 300,100 $1,407,438 $1,621,969
EDC The details of EDC’s long-term debts are as follows:
Creditor/Project Maturities Interest Rates
March 31, 2020
(Unaudited)
December 31, 2019
(Audited) US$181.1 Million Notes January 20, 2021 6.5% $180,926 $180,867 International Finance Corporation (IFC) IFC 1- P=4.1 billion 2012-2023 6.07% per annum from
April 16, 2014 to June 21, 2018; 4.52% from June 22, 2018 to October 15, 2018; and 6.37% from October 16, 2018 until maturity
22,939 22,870

- 20 -
Creditor/Project Maturities Interest Rates
March 31, 2020
(Unaudited)
December 31, 2019
(Audited) IFC 2 - P=3.3 billion 2013-2025 6.98% per annum from
April 16, 2016 to June 21, 2018; and 4.78% from June 22, 2018 until next repricing date
$27,904 $27,787
IFC 3 - P=4.8 billion March 15, 2033 7.80% 83,596 86,895 Fixed Rate Note Facility (FXCN) P=4.0 billion 2012-2022 5.25% 63,312 63,313 P=3.0 billion 2012-2022 5.25% 47,477 47,477 2013 Peso Fixed-Rate Bonds (FXR) P=4.0 billion May 3, 2023 4.7312% 77,953 77,994 P=3.0 billion May 3, 2020 4.1583% 59,183 59,204 EBWPC Loans:
$37.5M Commercial Debt Facility October 23, 2029 LIBOR plus 2.0% margin 28,788 28,762 $150.0M ECA Debt Facility October 23, 2029 LIBOR plus 2.35% margin 114,448 114,310 P=5.6 B Commercial Debt Facility October 23, 2029 PDST-R2 rate plus 2.0%
margin 85,697 85,726
P=8.5 Billion GCGI Term Loan March 18, 2022 5.25% 65,179 76,942 P=5.0 Billion BGI Term Loan October 7, 2025 5.25% 51,102 51,113 P=291.2 Million Term Loan December 17, 2030 5.5% 4,836 4,840 P=1.5 billion Term Loan December 5, 2026 5.25% 26,547 26,565 P=1.0 billion Term Loan December 5, 2031 5.5788% 19,227 19,241 UBP P=2.0 Billion Term Loan April 12, 2032 5.44% 32,721 32,745 SBC P=3.0 Billion Term Loan May 4, 2027 5.32% 47,150 47,180 PNB P=500 Million Term Loan June 1, 2022 4.74% 4,922 4,924 BPI P=1.0 Billion Term Loan June 1, 2027 5.21% 15,727 15,738 SBC P=1.0 Billion Term Loan May 4, 2032 5.43% 16,360 16,372 SBC P=500 Million Term Loan May 4, 2032 5.49% 8,179 8,185 Total 1,084,173 1,099,050 Less current portion 332,276 151,343 Noncurrent portion $751,897 $947,707
The long-term debts are presented net of unamortized debt issuance costs. A rollforward analysis of unamortized debt issuance costs is as follows:
March 31, 2020
(Unaudited)
December 31, 2019
(Audited) Balances at beginning of period $9,763 $12,550 Accretion during the period charged to “Interest expense
and financing charges” account (see Note 16) (573) (2,391) Unamortized debt issuance costs charged to “Interest
expense and financing charges” account (see Note 16) − (500) Foreign exchange differences (20) 104 Balances at end of period $9,170 $9,763
On February 20, 2019, EDC made a partial redemption on its $211.0 Million Notes amounting to $29.9 million in nominal amount for $31.7 million, resulting to a loss on extinguishment of $1.8 million. The amount of loss is presented as part of “Other income (charges)” account in the unaudited interim consolidated statement of income. On March 28, 2019, EDC’s P=2.0 Billion Term Loan with Bank of Commerce with outstanding principal balance amounting to P=900.0 million was fully settled.
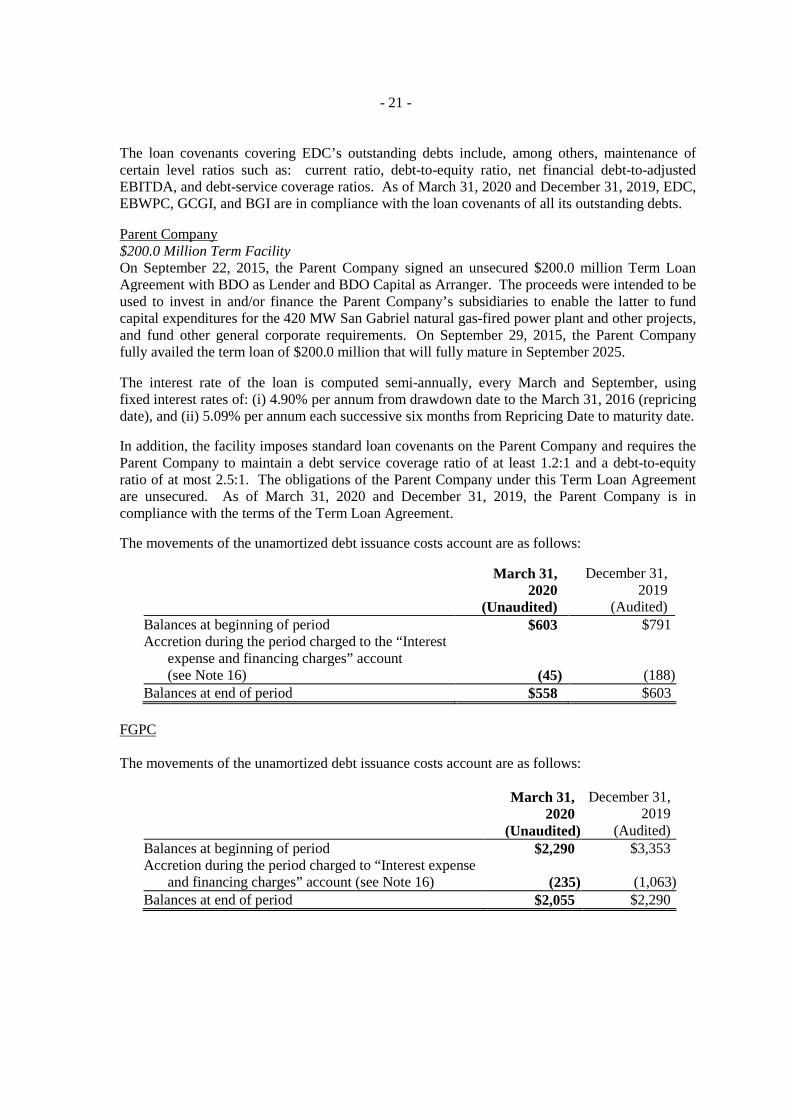
- 21 -
The loan covenants covering EDC’s outstanding debts include, among others, maintenance of certain level ratios such as: current ratio, debt-to-equity ratio, net financial debt-to-adjusted EBITDA, and debt-service coverage ratios. As of March 31, 2020 and December 31, 2019, EDC, EBWPC, GCGI, and BGI are in compliance with the loan covenants of all its outstanding debts. Parent Company $200.0 Million Term Facility On September 22, 2015, the Parent Company signed an unsecured $200.0 million Term Loan Agreement with BDO as Lender and BDO Capital as Arranger. The proceeds were intended to be used to invest in and/or finance the Parent Company’s subsidiaries to enable the latter to fund capital expenditures for the 420 MW San Gabriel natural gas-fired power plant and other projects, and fund other general corporate requirements. On September 29, 2015, the Parent Company fully availed the term loan of $200.0 million that will fully mature in September 2025. The interest rate of the loan is computed semi-annually, every March and September, using fixed interest rates of: (i) 4.90% per annum from drawdown date to the March 31, 2016 (repricing date), and (ii) 5.09% per annum each successive six months from Repricing Date to maturity date.
In addition, the facility imposes standard loan covenants on the Parent Company and requires the Parent Company to maintain a debt service coverage ratio of at least 1.2:1 and a debt-to-equity ratio of at most 2.5:1. The obligations of the Parent Company under this Term Loan Agreement are unsecured. As of March 31, 2020 and December 31, 2019, the Parent Company is in compliance with the terms of the Term Loan Agreement.
The movements of the unamortized debt issuance costs account are as follows:
March 31, 2020
(Unaudited)
December 31, 2019
(Audited) Balances at beginning of period $603 $791 Accretion during the period charged to the “Interest
expense and financing charges” account (see Note 16) (45) (188)
Balances at end of period $558 $603 FGPC The movements of the unamortized debt issuance costs account are as follows:
March 31, 2020
(Unaudited)
December 31, 2019
(Audited) Balances at beginning of period $2,290 $3,353 Accretion during the period charged to “Interest expense
and financing charges” account (see Note 16) (235) (1,063) Balances at end of period $2,055 $2,290
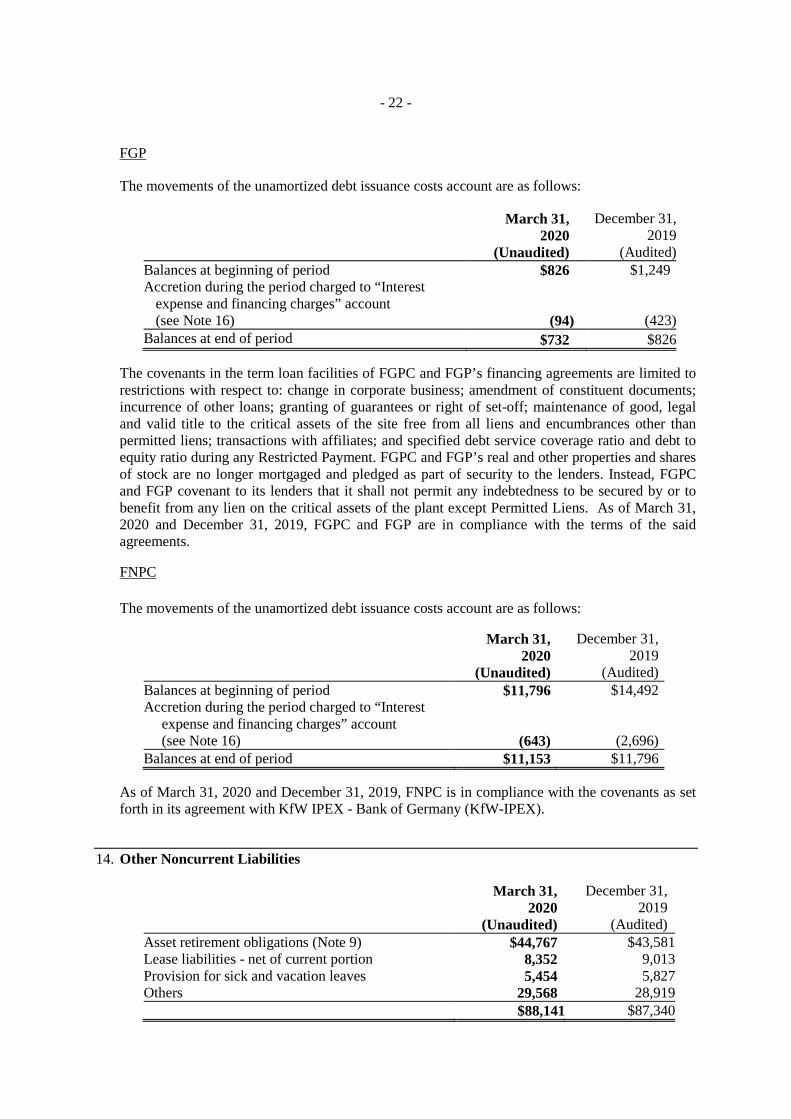
- 22 -
FGP
The movements of the unamortized debt issuance costs account are as follows:
March 31, 2020
(Unaudited)
December 31, 2019
(Audited) Balances at beginning of period $826 $1,249 Accretion during the period charged to “Interest
expense and financing charges” account (see Note 16) (94) (423)
Balances at end of period $732 $826
The covenants in the term loan facilities of FGPC and FGP’s financing agreements are limited to restrictions with respect to: change in corporate business; amendment of constituent documents; incurrence of other loans; granting of guarantees or right of set-off; maintenance of good, legal and valid title to the critical assets of the site free from all liens and encumbrances other than permitted liens; transactions with affiliates; and specified debt service coverage ratio and debt to equity ratio during any Restricted Payment. FGPC and FGP’s real and other properties and shares of stock are no longer mortgaged and pledged as part of security to the lenders. Instead, FGPC and FGP covenant to its lenders that it shall not permit any indebtedness to be secured by or to benefit from any lien on the critical assets of the plant except Permitted Liens. As of March 31, 2020 and December 31, 2019, FGPC and FGP are in compliance with the terms of the said agreements.
FNPC The movements of the unamortized debt issuance costs account are as follows:
March 31, 2020
(Unaudited)
December 31, 2019
(Audited) Balances at beginning of period $11,796 $14,492 Accretion during the period charged to “Interest
expense and financing charges” account (see Note 16) (643) (2,696)
Balances at end of period $11,153 $11,796 As of March 31, 2020 and December 31, 2019, FNPC is in compliance with the covenants as set forth in its agreement with KfW IPEX - Bank of Germany (KfW-IPEX).
14. Other Noncurrent Liabilities
March 31, 2020
(Unaudited)
December 31, 2019
(Audited) Asset retirement obligations (Note 9) $44,767 $43,581 Lease liabilities - net of current portion 8,352 9,013 Provision for sick and vacation leaves 5,454 5,827 Others 29,568 28,919 $88,141 $87,340
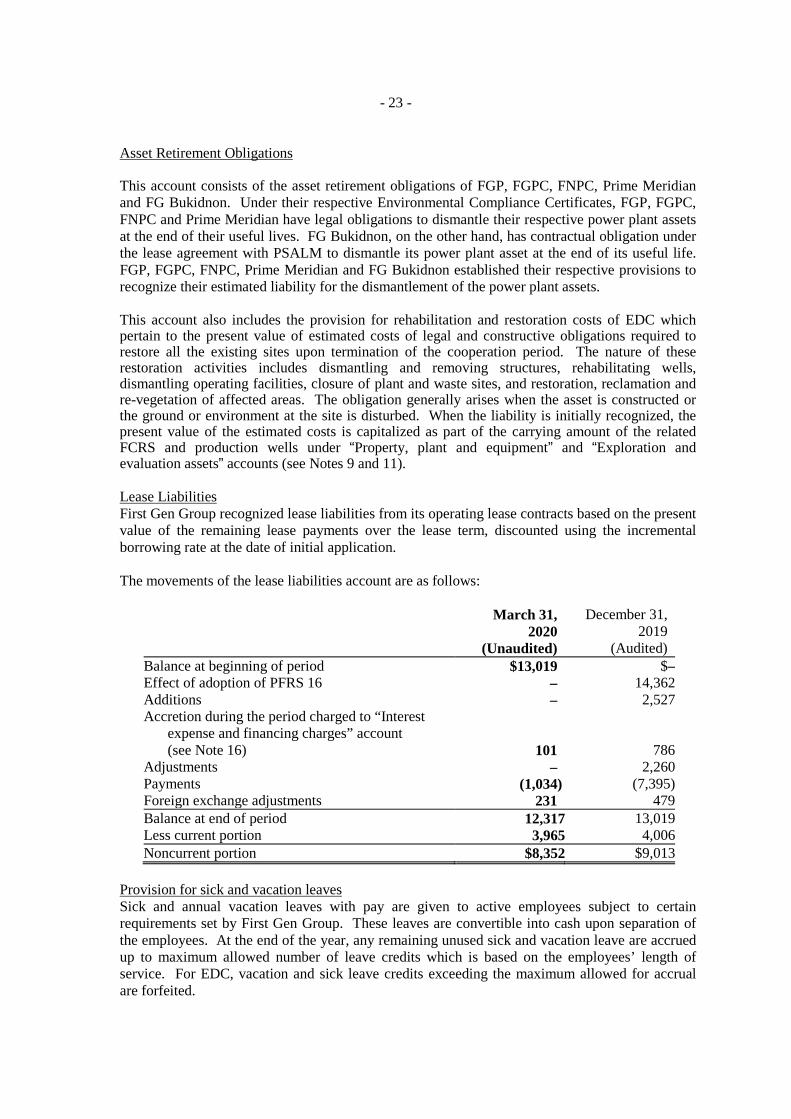
- 23 -
Asset Retirement Obligations
This account consists of the asset retirement obligations of FGP, FGPC, FNPC, Prime Meridian and FG Bukidnon. Under their respective Environmental Compliance Certificates, FGP, FGPC, FNPC and Prime Meridian have legal obligations to dismantle their respective power plant assets at the end of their useful lives. FG Bukidnon, on the other hand, has contractual obligation under the lease agreement with PSALM to dismantle its power plant asset at the end of its useful life. FGP, FGPC, FNPC, Prime Meridian and FG Bukidnon established their respective provisions to recognize their estimated liability for the dismantlement of the power plant assets. This account also includes the provision for rehabilitation and restoration costs of EDC which pertain to the present value of estimated costs of legal and constructive obligations required to restore all the existing sites upon termination of the cooperation period. The nature of these restoration activities includes dismantling and removing structures, rehabilitating wells, dismantling operating facilities, closure of plant and waste sites, and restoration, reclamation and re-vegetation of affected areas. The obligation generally arises when the asset is constructed or the ground or environment at the site is disturbed. When the liability is initially recognized, the present value of the estimated costs is capitalized as part of the carrying amount of the related FCRS and production wells under “Property, plant and equipment” and “Exploration and evaluation assets” accounts (see Notes 9 and 11). Lease Liabilities First Gen Group recognized lease liabilities from its operating lease contracts based on the present value of the remaining lease payments over the lease term, discounted using the incremental borrowing rate at the date of initial application.
The movements of the lease liabilities account are as follows:
March 31, 2020
(Unaudited)
December 31, 2019
(Audited) Balance at beginning of period $13,019 $– Effect of adoption of PFRS 16 – 14,362 Additions – 2,527 Accretion during the period charged to “Interest
expense and financing charges” account (see Note 16) 101 786
Adjustments – 2,260 Payments (1,034) (7,395) Foreign exchange adjustments 231 479 Balance at end of period 12,317 13,019 Less current portion 3,965 4,006 Noncurrent portion $8,352 $9,013
Provision for sick and vacation leaves Sick and annual vacation leaves with pay are given to active employees subject to certain requirements set by First Gen Group. These leaves are convertible into cash upon separation of the employees. At the end of the year, any remaining unused sick and vacation leave are accrued up to maximum allowed number of leave credits which is based on the employees’ length of service. For EDC, vacation and sick leave credits exceeding the maximum allowed for accrual are forfeited.
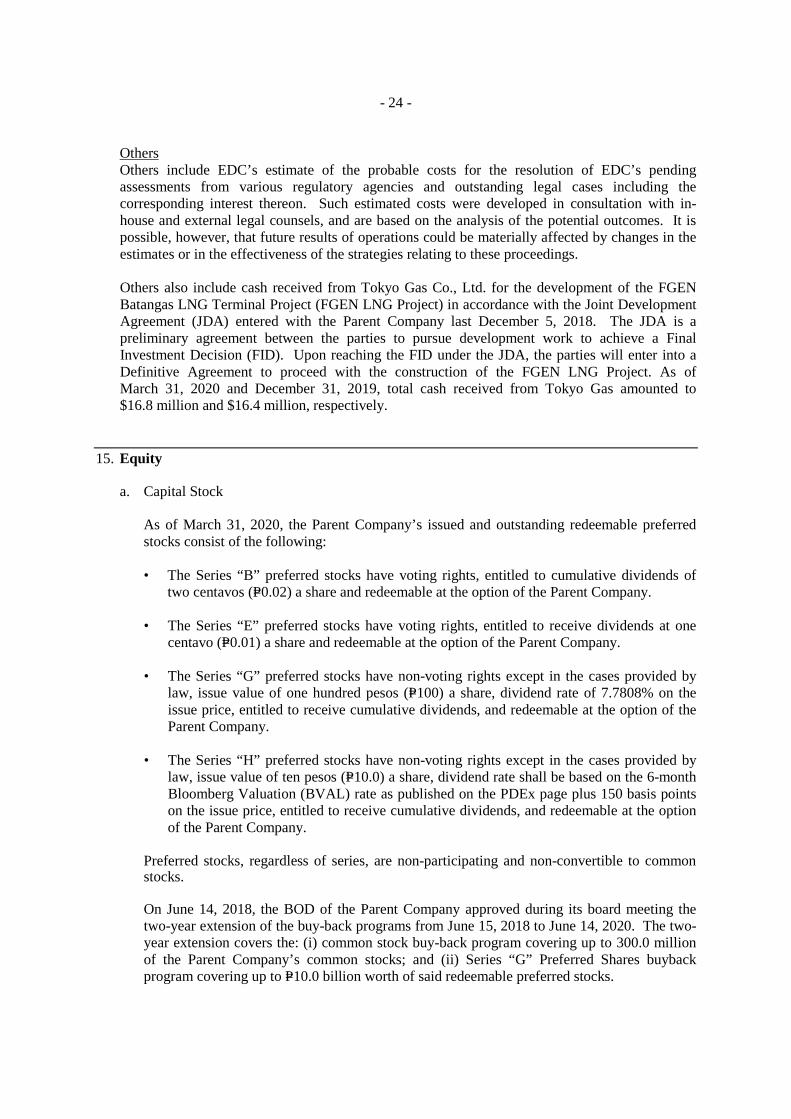
- 24 -
Others Others include EDC’s estimate of the probable costs for the resolution of EDC’s pending assessments from various regulatory agencies and outstanding legal cases including the corresponding interest thereon. Such estimated costs were developed in consultation with in-house and external legal counsels, and are based on the analysis of the potential outcomes. It is possible, however, that future results of operations could be materially affected by changes in the estimates or in the effectiveness of the strategies relating to these proceedings.
Others also include cash received from Tokyo Gas Co., Ltd. for the development of the FGEN Batangas LNG Terminal Project (FGEN LNG Project) in accordance with the Joint Development Agreement (JDA) entered with the Parent Company last December 5, 2018. The JDA is a preliminary agreement between the parties to pursue development work to achieve a Final Investment Decision (FID). Upon reaching the FID under the JDA, the parties will enter into a Definitive Agreement to proceed with the construction of the FGEN LNG Project. As of March 31, 2020 and December 31, 2019, total cash received from Tokyo Gas amounted to $16.8 million and $16.4 million, respectively.
15. Equity
a. Capital Stock As of March 31, 2020, the Parent Company’s issued and outstanding redeemable preferred stocks consist of the following: • The Series “B” preferred stocks have voting rights, entitled to cumulative dividends of
two centavos (P=0.02) a share and redeemable at the option of the Parent Company.
• The Series “E” preferred stocks have voting rights, entitled to receive dividends at one centavo (P=0.01) a share and redeemable at the option of the Parent Company.
• The Series “G” preferred stocks have non-voting rights except in the cases provided by
law, issue value of one hundred pesos (P=100) a share, dividend rate of 7.7808% on the issue price, entitled to receive cumulative dividends, and redeemable at the option of the Parent Company.
• The Series “H” preferred stocks have non-voting rights except in the cases provided by law, issue value of ten pesos (P=10.0) a share, dividend rate shall be based on the 6-month Bloomberg Valuation (BVAL) rate as published on the PDEx page plus 150 basis points on the issue price, entitled to receive cumulative dividends, and redeemable at the option of the Parent Company.
Preferred stocks, regardless of series, are non-participating and non-convertible to common stocks. On June 14, 2018, the BOD of the Parent Company approved during its board meeting the two-year extension of the buy-back programs from June 15, 2018 to June 14, 2020. The two-year extension covers the: (i) common stock buy-back program covering up to 300.0 million of the Parent Company’s common stocks; and (ii) Series “G” Preferred Shares buyback program covering up to P=10.0 billion worth of said redeemable preferred stocks.

- 25 -
On the same date, the BOD of the Parent Company approved during its board meeting, in accordance with the terms and condition of the Parent Company’s Series “F” Preferred Shares, the redemption of all outstanding Series “F” Preferred Shares on July 25, 2018 at the applicable redemption value of P=100.0 a share. On July 25, 2018, the Parent Company redeemed all outstanding Series “F” Preferred Shares amounting to P=6,320.2 million ($119.1 million).
In 2018, the Parent Company purchased from the open market 659,720 Series “G” redeemable preferred stocks and 17,981,000 common stocks. Total payments for the buyback of Series “G” redeemable preferred stocks and common stocks amounted to P=69.5 million ($1.3 million) and P=270.3 million ($5.2 million), respectively. In 2019, the Parent Company purchased from the open market 8,045,000 Series “G” redeemable preferred stocks and 33,039,352 common stocks. Total payments for the buyback of Series “G” redeemable preferred stocks and common stocks amounted to P=871.8 million ($16.7 million) and P=813.8 million ($15.7 million), respectively. From the total common stocks purchased from the open market, a total of 16,429,352 common stocks are held by subsidiaries.
In 2020, the Parent Company purchased from the open market 12,008,700 common stocks for P=228.9 million ($4.5 million).
On March 15, 2018, the BOD of the Parent Company approved the amendment to Article Seventh of the Parent Company’s Amended Articles of Incorporation to increase the authorized capital stock from P=8,600.0 million to P=11,600.0 million by way of creating 300.0 million Series “H” preferred stocks with a par value of P=10.0 a share. On December 28, 2018, the Parent Company submitted to the Philippine SEC an application for the increase of its authorized capital stock. The increase will be paid through the conversion of FGPC’s existing deposits for future stocks subscriptions amounting to $70.5 million (P=3,766.3 million) as partial payment for its subscription to 75,000,000 Series “H” redeemable preferred stocks. On March 27, 2019, the Philippine SEC approved the Parent Company’s application.
On April 10, 2019 and July 11,2019, the Parent Company issued a total of 7,986,740 Series “H” redeemable preferred stocks at P=100.0 issue price to Prime Meridian totaling to P=798.7 million ($15.3 million).
On February 10, 2020, the BOD of the Parent Company approved the amendment to Article Seventh of the Parent Company’s Amended Articles of Incorporation to increase the authorized capital stock from P=11,600.0 million to P=13,200.0 million by way of creating 160.0 million Series ”I” preferred stocks with a par value of P=10.0 a share.
b. Retained Earnings
Following are the dividends declared and paid by the Parent Company in 2019:
Declaration date Record date Payment date Shareholders Description
Dividend per share
Total amount
(in USD)
Total amount
(in PHP) Nov. 29, 2019 Dec. 27, 2019 Jan. 27, 2020 Series “B” Preferred Regular P=0.02 $389 P=20,000 Nov. 29, 2019 Dec. 27, 2019 Jan. 27, 2020 Series “E” Preferred Regular 0.01 91 4,686 Nov. 29, 2019 Dec. 27, 2019 Jan. 27, 2020 Series “G” Preferred Regular 3.8904 7,892 406,161 Nov. 29, 2019 Dec. 27, 2019 Jan. 27, 2020 Series “G” Preferred* Regular 0.38904 104 5,349

- 26 -
Declaration date Record date Payment date Shareholders Description
Dividend per share
Total amount
(in USD)
Total amount
(in PHP) June 17, 2019 July 3, 2019 July 25, 2019 Series “G” Preferred Regular P=3.8904 $8,370 $437,459 June 17, 2019 July 3, 2019 July 25, 2019 Series “G” Preferred* Regular 0.38904 102 5,349 May 8, 2019 May 23, 2019 June 19, 2019 Common Regular 0.55 38,393 1,999,638
$55,341 P=2,878,642 *Pertains to the 13,750,000 Series “G” preferred stocks issued to FPH by way of private placement. The retained earnings balance is restricted to the extent of: (a) acquisition price of the treasury shares amounting to $369.6 million and $365.1 million as of March 31, 2020 and December 31, 2019, respectively, and (b) the undistributed net earnings of investee companies (including consolidated subsidiaries) amounting to $686.5 million and $670.4 million as of March 31, 2020 and December 31, 2019, respectively. Undistributed earnings of the investee companies are not available for dividend distribution until such time that the Parent Company receives the dividends from these investee companies.
c. Treasury Stocks
(i) Common Stocks
Movements of common stocks held in treasury are as follows: March 31,2020 (Unaudited) December 31, 2019 (Audited)
Number of
Shares Cost Number of
Shares Cost Balances at beginning of period 96,753,900 $39,102 80,143,900 $29,782 Common stocks acquired through
market during the period 12,008,700 4,507 16,610,000 9,320 Balances at end of period 108,762,600 $43,609 96,753,900 $39,102 As of March 31, 2020 and December 31, 2019, the number of common stocks of Parent Company held by subsidiaries totaled to 45,733,548. The cost of these Parent Company common stocks held by subsidiaries amounted to $17.2 million as of March 31, 2020 and December 31, 2019. These are included as part of “Cost of stocks held in treasury” account in the equity section of the unaudited interim consolidated statements of financial position.
(ii) Redeemable Preferred Stocks Movements of redeemable preferred stocks held in treasury are as follows: March 31, 2020 (Unaudited) December 31, 2019 (Audited)
Number of
Shares Cost Number of
Shares Cost Redeemable Preferred Stock Series “F”: Balances at beginning of period 100,000,000 $205,713 100,000,000 $205,713 Redemption during the period – – – – Balances at end of period 100,000,000 $205,713 100,000,000 $205,713 Redeemable Preferred Stock Series “G”: Balances at beginning of period 15,599,200 $34,472 7,554,200 $17,735 Redemption during the period – – 8,045,000 16,737 Balances at end of period 15,599,200 $34,472 15,599,200 $34,472 Redeemable Preferred Stock Series “H”: Balances at beginning of period 45,649,250 $85,814 – $– Acquisition during the year – – 45,649,250 85,814 Balances at end of period 45,649,250 $85,814 45,649,250 $85,814
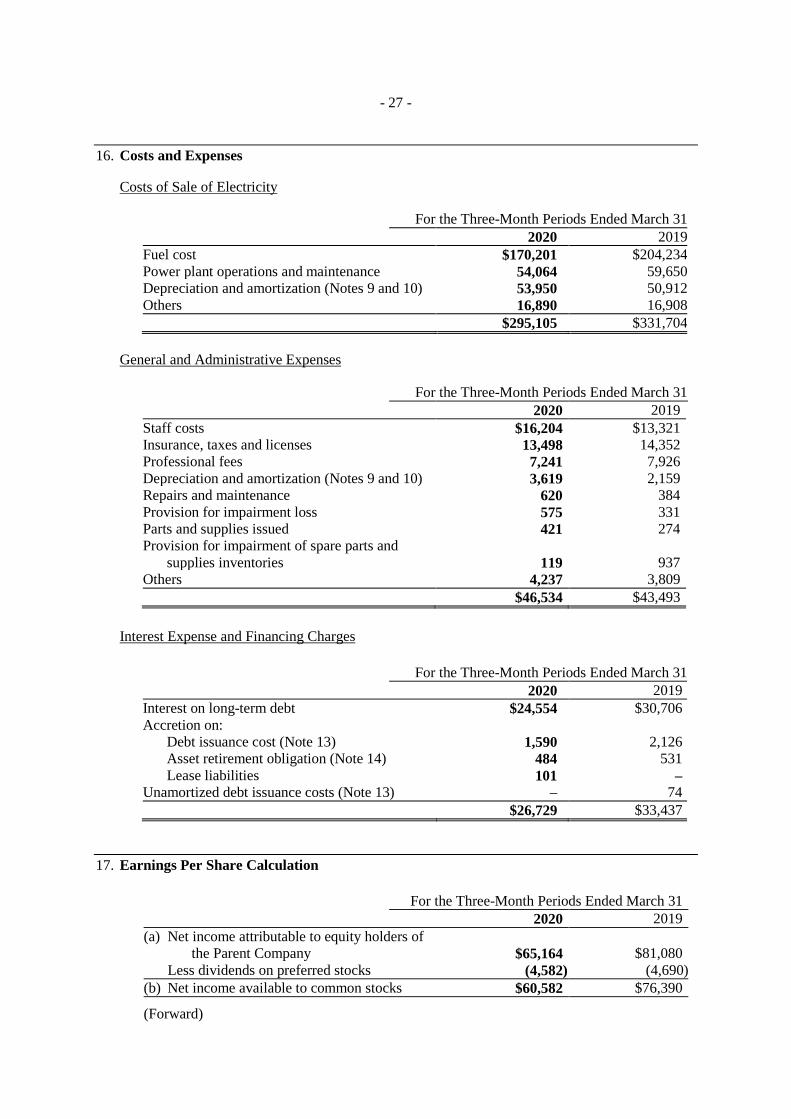
- 27 -
16. Costs and Expenses Costs of Sale of Electricity
For the Three-Month Periods Ended March 31 2020 2019 Fuel cost $170,201 $204,234 Power plant operations and maintenance 54,064 59,650 Depreciation and amortization (Notes 9 and 10) 53,950 50,912 Others 16,890 16,908 $295,105 $331,704
General and Administrative Expenses
For the Three-Month Periods Ended March 31 2020 2019 Staff costs $16,204 $13,321 Insurance, taxes and licenses 13,498 14,352 Professional fees 7,241 7,926 Depreciation and amortization (Notes 9 and 10) 3,619 2,159 Repairs and maintenance 620 384 Provision for impairment loss 575 331 Parts and supplies issued 421 274 Provision for impairment of spare parts and
supplies inventories 119 937 Others 4,237 3,809 $46,534 $43,493
Interest Expense and Financing Charges
For the Three-Month Periods Ended March 31 2020 2019 Interest on long-term debt $24,554 $30,706 Accretion on:
Debt issuance cost (Note 13) 1,590 2,126 Asset retirement obligation (Note 14) 484 531 Lease liabilities 101 –
Unamortized debt issuance costs (Note 13) – 74 $26,729 $33,437
17. Earnings Per Share Calculation
For the Three-Month Periods Ended March 31 2020 2019 (a) Net income attributable to equity holders of
the Parent Company $65,164 $81,080 Less dividends on preferred stocks (4,582) (4,690) (b) Net income available to common stocks $60,582 $76,390
(Forward)
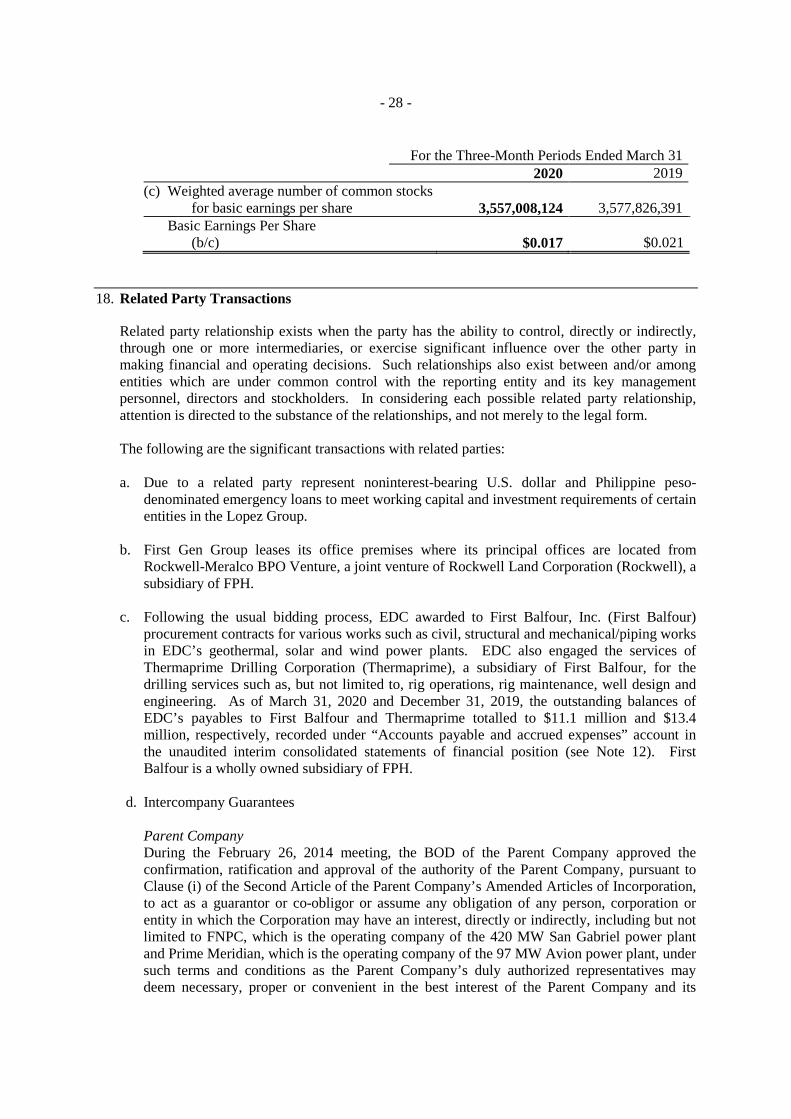
- 28 -
For the Three-Month Periods Ended March 31 2020 2019 (c) Weighted average number of common stocks
for basic earnings per share 3,557,008,124 3,577,826,391 Basic Earnings Per Share
(b/c) $0.017 $0.021
18. Related Party Transactions Related party relationship exists when the party has the ability to control, directly or indirectly, through one or more intermediaries, or exercise significant influence over the other party in making financial and operating decisions. Such relationships also exist between and/or among entities which are under common control with the reporting entity and its key management personnel, directors and stockholders. In considering each possible related party relationship, attention is directed to the substance of the relationships, and not merely to the legal form. The following are the significant transactions with related parties: a. Due to a related party represent noninterest-bearing U.S. dollar and Philippine peso-
denominated emergency loans to meet working capital and investment requirements of certain entities in the Lopez Group.
b. First Gen Group leases its office premises where its principal offices are located from Rockwell-Meralco BPO Venture, a joint venture of Rockwell Land Corporation (Rockwell), a subsidiary of FPH.
c. Following the usual bidding process, EDC awarded to First Balfour, Inc. (First Balfour) procurement contracts for various works such as civil, structural and mechanical/piping works in EDC’s geothermal, solar and wind power plants. EDC also engaged the services of Thermaprime Drilling Corporation (Thermaprime), a subsidiary of First Balfour, for the drilling services such as, but not limited to, rig operations, rig maintenance, well design and engineering. As of March 31, 2020 and December 31, 2019, the outstanding balances of EDC’s payables to First Balfour and Thermaprime totalled to $11.1 million and $13.4 million, respectively, recorded under “Accounts payable and accrued expenses” account in the unaudited interim consolidated statements of financial position (see Note 12). First Balfour is a wholly owned subsidiary of FPH.
d. Intercompany Guarantees Parent Company During the February 26, 2014 meeting, the BOD of the Parent Company approved the confirmation, ratification and approval of the authority of the Parent Company, pursuant to Clause (i) of the Second Article of the Parent Company’s Amended Articles of Incorporation, to act as a guarantor or co-obligor or assume any obligation of any person, corporation or entity in which the Corporation may have an interest, directly or indirectly, including but not limited to FNPC, which is the operating company of the 420 MW San Gabriel power plant and Prime Meridian, which is the operating company of the 97 MW Avion power plant, under such terms and conditions as the Parent Company’s duly authorized representatives may deem necessary, proper or convenient in the best interest of the Parent Company and its
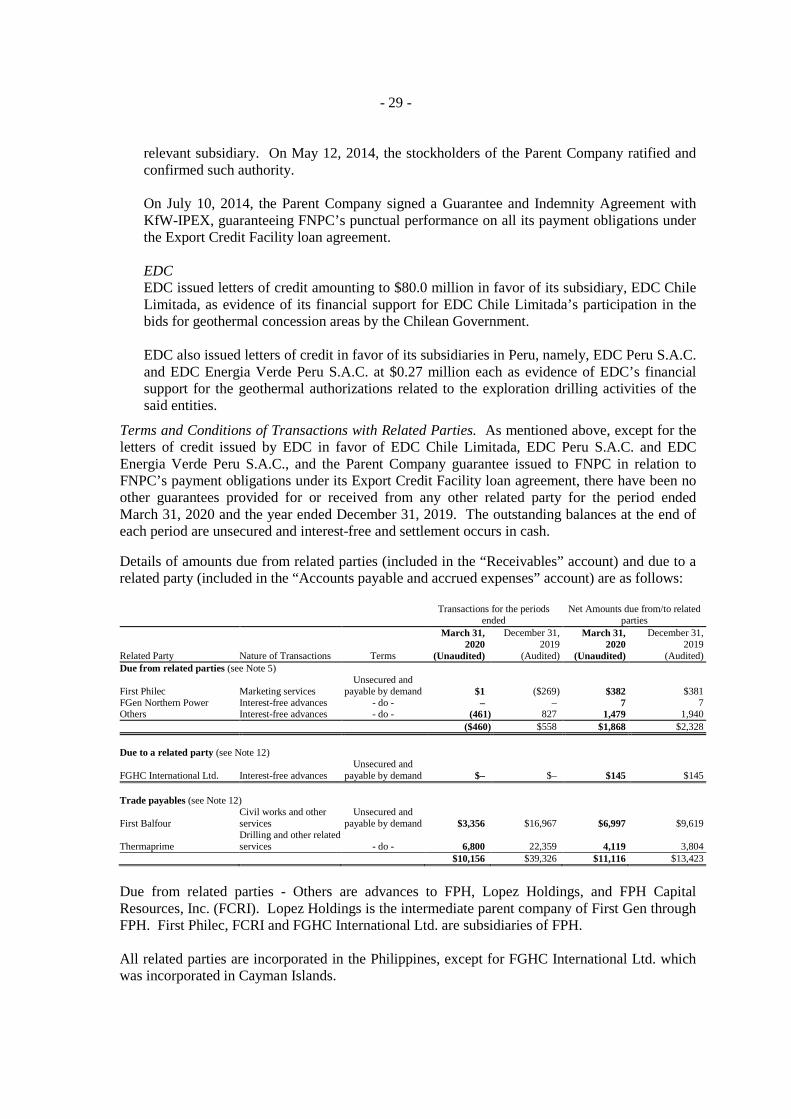
- 29 -
relevant subsidiary. On May 12, 2014, the stockholders of the Parent Company ratified and confirmed such authority.
On July 10, 2014, the Parent Company signed a Guarantee and Indemnity Agreement with KfW-IPEX, guaranteeing FNPC’s punctual performance on all its payment obligations under the Export Credit Facility loan agreement. EDC EDC issued letters of credit amounting to $80.0 million in favor of its subsidiary, EDC Chile Limitada, as evidence of its financial support for EDC Chile Limitada’s participation in the bids for geothermal concession areas by the Chilean Government. EDC also issued letters of credit in favor of its subsidiaries in Peru, namely, EDC Peru S.A.C. and EDC Energia Verde Peru S.A.C. at $0.27 million each as evidence of EDC’s financial support for the geothermal authorizations related to the exploration drilling activities of the said entities.
Terms and Conditions of Transactions with Related Parties. As mentioned above, except for the letters of credit issued by EDC in favor of EDC Chile Limitada, EDC Peru S.A.C. and EDC Energia Verde Peru S.A.C., and the Parent Company guarantee issued to FNPC in relation to FNPC’s payment obligations under its Export Credit Facility loan agreement, there have been no other guarantees provided for or received from any other related party for the period ended March 31, 2020 and the year ended December 31, 2019. The outstanding balances at the end of each period are unsecured and interest-free and settlement occurs in cash.
Details of amounts due from related parties (included in the “Receivables” account) and due to a related party (included in the “Accounts payable and accrued expenses” account) are as follows:
Transactions for the periods ended
Net Amounts due from/to related parties
Related Party Nature of Transactions Terms
March 31, 2020
(Unaudited)
December 31, 2019
(Audited)
March 31, 2020
(Unaudited)
December 31, 2019
(Audited) Due from related parties (see Note 5)
First Philec Marketing services Unsecured and
payable by demand $1 ($269) $382 $381 FGen Northern Power Interest-free advances - do - – – 7 7 Others Interest-free advances - do - (461) 827 1,479 1,940 ($460) $558 $1,868 $2,328 Due to a related party (see Note 12)
FGHC International Ltd. Interest-free advances Unsecured and
payable by demand $– $– $145 $145 Trade payables (see Note 12)
First Balfour Civil works and other services
Unsecured and payable by demand $3,356 $16,967 $6,997 $9,619
Thermaprime Drilling and other related services - do - 6,800 22,359 4,119 3,804
$10,156 $39,326 $11,116 $13,423
Due from related parties - Others are advances to FPH, Lopez Holdings, and FPH Capital Resources, Inc. (FCRI). Lopez Holdings is the intermediate parent company of First Gen through FPH. First Philec, FCRI and FGHC International Ltd. are subsidiaries of FPH. All related parties are incorporated in the Philippines, except for FGHC International Ltd. which was incorporated in Cayman Islands.

- 30 -
19. Financial Risk Management Objectives and Policies
First Gen Group’s principal financial liabilities are comprised of loans payable and long-termdebts, among others. The main purpose of these financial liabilities is to raise financing for FirstGen Group’s growth and operations. First Gen Group has other various financial assets andliabilities such as cash and cash equivalents, receivables, amounts due to and from related partiesand accounts payable and accrued expenses, which arise directly from its operations.
As a matter of policy, First Gen Group does not trade its financial instruments. However, FirstGen Group enters into derivative and hedging transactions, primarily interest rate swaps and crosscurrency swaps, as needed, for the sole purpose of managing the relevant financial risks that areassociated with First Gen Group’s borrowing activities and as required by the lenders in certaincases.
First Gen Group has an Enterprise Wide Risk Management Program which is aimed to identifyrisks based on the likelihood of occurrence and impact to the business, formulate riskmanagement strategies, assess risk management capabilities and continuously monitor the riskmanagement efforts.
The main financial risks arising from First Gen Group’s financial instruments are interest raterisk, foreign currency risk, credit risk and liquidity risk. The BOD reviews and approves policiesfor managing each of these risks.
Credit RiskFirst Gen Group trades only with recognized, reputable and creditworthy third parties and/ortransacts only with institutions and/or banks which have demonstrated financial soundness. It isFirst Gen Group’s policy that all customers who wish to trade on credit terms are subject to creditverification procedures. In addition, receivable balances are monitored on an ongoing basis andthe level of the allowance account is reviewed on an ongoing basis to ensure that First GenGroup’s exposure to doubtful accounts is not significant.
For EDC, the geothermal and power generation businesses trade with two major customers, NPCand National Transmission Corporation (TransCo), both are government-owned-and-controlledcorporations. Any failure on the part of NPC and TransCo to pay their obligations to EDC wouldsignificantly affect EDC’s business operations. As a practice, EDC monitors closely itscollections from NPC and TransCo, and may charge interest on delayed payments following theprovisions of the PPAs and Renewable Energy Payment Agreement (REPA), respectively.Receivable balances are monitored on an on-going basis to ensure that EDC’s exposure to baddebts is not significant. The maximum exposure of trade receivable is equal to the carryingamount.
Set out below is the information about the credit risk exposure on EDC’s trade receivables using aprovision matrix:
March 31, 2020 Current
Days past due Total <30 days 30-60 days 61-90 days >91 days Past Due
Expected credit loss rate 0.0% 3.2% 2.5% 23.1% 9.0% 100.0% 13.2% Estimated total gross carrying
amount at default $115,895 $2,818 $399 $26 $3,533 $18,167 $140,838 Expected credit loss 11 89 10 6 319 18,167 18,602
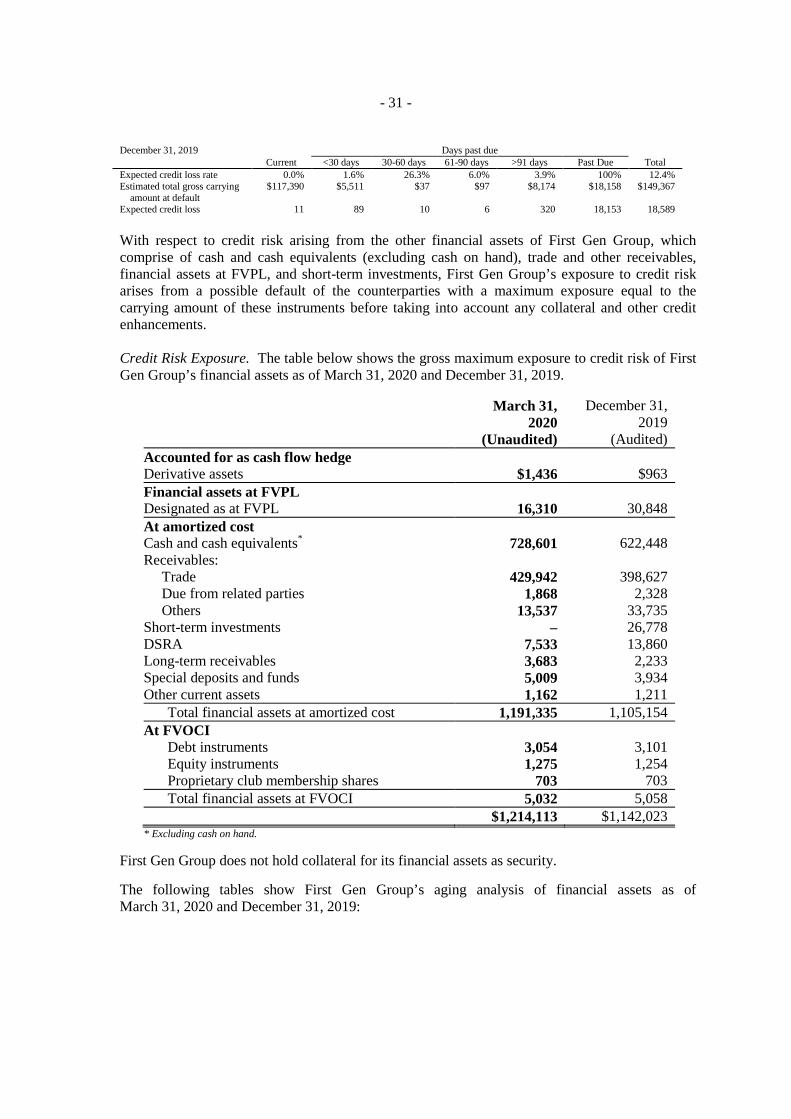
- 31 -
December 31, 2019 Current
Days past due Total <30 days 30-60 days 61-90 days >91 days Past Due
Expected credit loss rate 0.0% 1.6% 26.3% 6.0% 3.9% 100% 12.4% Estimated total gross carrying
amount at default $117,390 $5,511 $37 $97 $8,174 $18,158 $149,367
Expected credit loss 11 89 10 6 320 18,153 18,589 With respect to credit risk arising from the other financial assets of First Gen Group, which comprise of cash and cash equivalents (excluding cash on hand), trade and other receivables, financial assets at FVPL, and short-term investments, First Gen Group’s exposure to credit risk arises from a possible default of the counterparties with a maximum exposure equal to the carrying amount of these instruments before taking into account any collateral and other credit enhancements.
Credit Risk Exposure. The table below shows the gross maximum exposure to credit risk of First Gen Group’s financial assets as of March 31, 2020 and December 31, 2019.
March 31, 2020
(Unaudited)
December 31, 2019
(Audited) Accounted for as cash flow hedge Derivative assets $1,436 $963 Financial assets at FVPL Designated as at FVPL 16,310 30,848 At amortized cost Cash and cash equivalents* 728,601 622,448 Receivables: Trade 429,942 398,627 Due from related parties 1,868 2,328 Others 13,537 33,735 Short-term investments – 26,778 DSRA 7,533 13,860 Long-term receivables 3,683 2,233 Special deposits and funds 5,009 3,934 Other current assets 1,162 1,211 Total financial assets at amortized cost 1,191,335 1,105,154 At FVOCI
Debt instruments 3,054 3,101 Equity instruments 1,275 1,254
Proprietary club membership shares 703 703 Total financial assets at FVOCI 5,032 5,058 $1,214,113 $1,142,023 * Excluding cash on hand.
First Gen Group does not hold collateral for its financial assets as security. The following tables show First Gen Group’s aging analysis of financial assets as of March 31, 2020 and December 31, 2019:
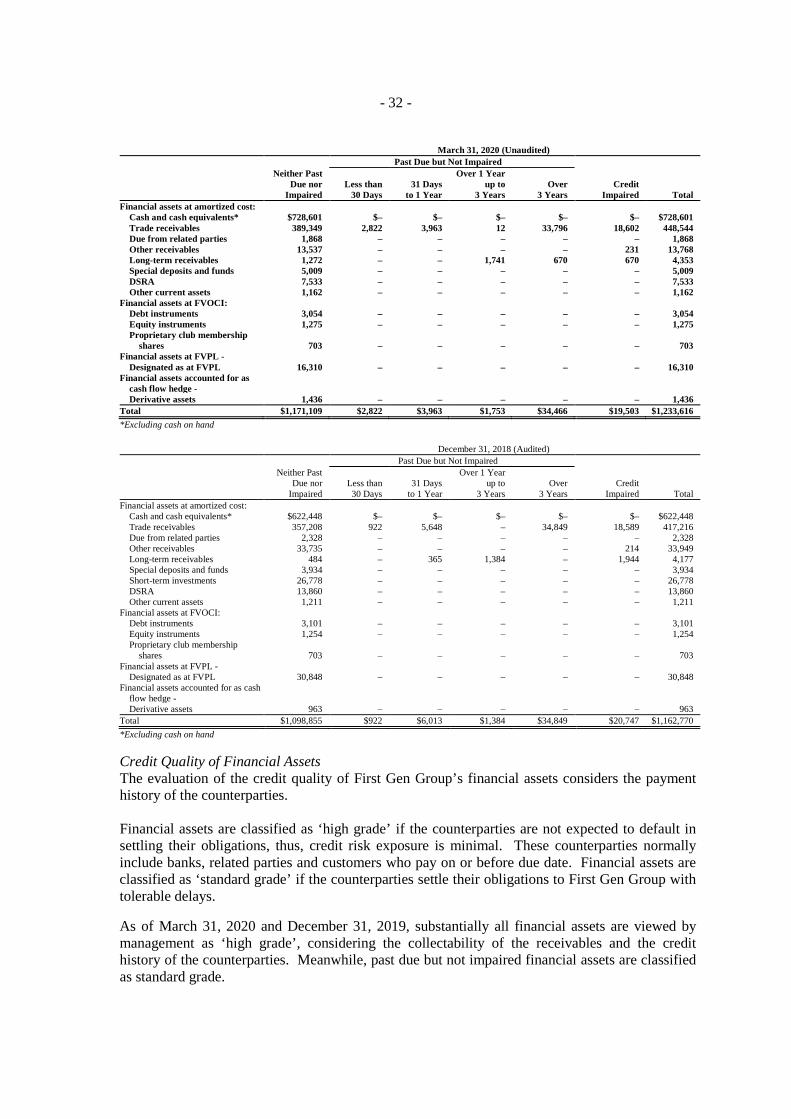
- 32 -
March 31, 2020 (Unaudited) Past Due but Not Impaired
Neither Past Due nor
Impaired Less than
30 Days 31 Days
to 1 Year
Over 1 Year up to
3 Years Over
3 Years Credit
Impaired Total Financial assets at amortized cost: Cash and cash equivalents* $728,601 $– $– $– $– $– $728,601 Trade receivables 389,349 2,822 3,963 12 33,796 18,602 448,544 Due from related parties 1,868 – – – – – 1,868 Other receivables 13,537 – – – – 231 13,768 Long-term receivables 1,272 – – 1,741 670 670 4,353 Special deposits and funds 5,009 – – – – – 5,009 DSRA 7,533 – – – – – 7,533 Other current assets 1,162 – – – – – 1,162 Financial assets at FVOCI: Debt instruments 3,054 – – – – – 3,054 Equity instruments 1,275 – – – – – 1,275 Proprietary club membership
shares 703 – – – – – 703 Financial assets at FVPL - Designated as at FVPL 16,310 – – – – – 16,310 Financial assets accounted for as
cash flow hedge - Derivative assets 1,436 – – – – – 1,436 Total $1,171,109 $2,822 $3,963 $1,753 $34,466 $19,503 $1,233,616
*Excluding cash on hand
December 31, 2018 (Audited) Past Due but Not Impaired
Neither Past Due nor
Impaired Less than 30 Days
31 Days to 1 Year
Over 1 Year up to
3 Years Over
3 Years Credit
Impaired Total Financial assets at amortized cost: Cash and cash equivalents* $622,448 $– $– $– $– $– $622,448 Trade receivables 357,208 922 5,648 – 34,849 18,589 417,216 Due from related parties 2,328 – – – – – 2,328 Other receivables 33,735 – – – – 214 33,949 Long-term receivables 484 – 365 1,384 – 1,944 4,177 Special deposits and funds 3,934 – – – – – 3,934 Short-term investments 26,778 – – – – – 26,778 DSRA 13,860 – – – – – 13,860 Other current assets 1,211 – – – – – 1,211 Financial assets at FVOCI: Debt instruments 3,101 – – – – – 3,101 Equity instruments 1,254 – – – – – 1,254 Proprietary club membership
shares 703 – – – – – 703 Financial assets at FVPL - Designated as at FVPL 30,848 – – – – – 30,848 Financial assets accounted for as cash
flow hedge - Derivative assets 963 – – – – – 963 Total $1,098,855 $922 $6,013 $1,384 $34,849 $20,747 $1,162,770 *Excluding cash on hand
Credit Quality of Financial Assets The evaluation of the credit quality of First Gen Group’s financial assets considers the payment history of the counterparties. Financial assets are classified as ‘high grade’ if the counterparties are not expected to default in settling their obligations, thus, credit risk exposure is minimal. These counterparties normally include banks, related parties and customers who pay on or before due date. Financial assets are classified as ‘standard grade’ if the counterparties settle their obligations to First Gen Group with tolerable delays.
As of March 31, 2020 and December 31, 2019, substantially all financial assets are viewed by management as ‘high grade’, considering the collectability of the receivables and the credit history of the counterparties. Meanwhile, past due but not impaired financial assets are classified as standard grade.

- 33 -
Concentration of Credit Risk The Parent Company, through its operating subsidiaries FGP and FGPC, earns substantially all of its revenue from Meralco. Meralco is committed to pay for the capacity and energy generated by the San Lorenzo and Santa Rita power plants under the existing long-term PPAs which are due to expire in September 2027 and August 2025, respectively. While the PPAs provide for the mechanisms by which certain costs and obligations including fuel costs, among others, are pass-through to Meralco or are otherwise recoverable from Meralco, it is the intention of the Parent Company, FGP and FGPC to ensure that the pass-through mechanisms, as provided for in their respective PPAs, are followed. On June 26, 2018, the San Gabriel Plant has started delivering power to Meralco following the grant of an Interim Relief by the ERC for the implementation of the PSA between FNPC and Meralco. The PSA will expire on February 23, 2024 and can be extended upon mutual agreement of the parties.
EDC’s geothermal and power generation businesses trade with two major customers, namely NPC and TransCo. Any failure on the part of NPC and TransCo to pay their obligations to EDC would significantly affect EDC’s business operations.
First Gen Group’s exposure to credit risk arises from default of the counterparties, with a maximum exposure equal to the carrying amounts of the receivables from Meralco, in the case of FGP, FGPC and FNPC, and the receivables from NPC and TransCo, in the case of EDC.
The table below shows the risk exposure in respect to credit concentration of First Gen Group as of March 31, 2020 and December 31, 2019:
March 31, 2020
(Unaudited)
December 31, 2019
(Audited) Trade receivables from Meralco $219,223 $193,390 Trade receivables from NPC and TransCo 52,978 66,649 Total credit concentration risk $272,201 $260,039 Total receivables $445,347 $434,689 Credit concentration percentage 61.12% 59.82%
Merchant Risk First Gen Group has Prime Meridian’s Avion Plant, which is a fully-merchant plant. The gas plant is exposed to the volatility of spot prices because of supply and demand changes, which are mostly driven by factors that are outside of First Gen Group’s control. These factors include (but are not limited to) unexpected outages, weather conditions, transmission constraints, and changes in fuel prices. These have caused and are expected to cause variability in the operating results of the Avion Plant. First Gen Group plans to mitigate these risks by having a balanced portfolio of contracted and spot capacities. As of March 31, 2020 and December 31, 2019, First Gen Group was 90% contracted in terms of installed capacity.
Capital Management The primary objective of First Gen Group’s capital management is to ensure that it maintains a strong credit rating and healthy capital ratios in order to support its business, comply with its financial loan covenants and maximize shareholder value. Core capital includes long-term debt and equity.
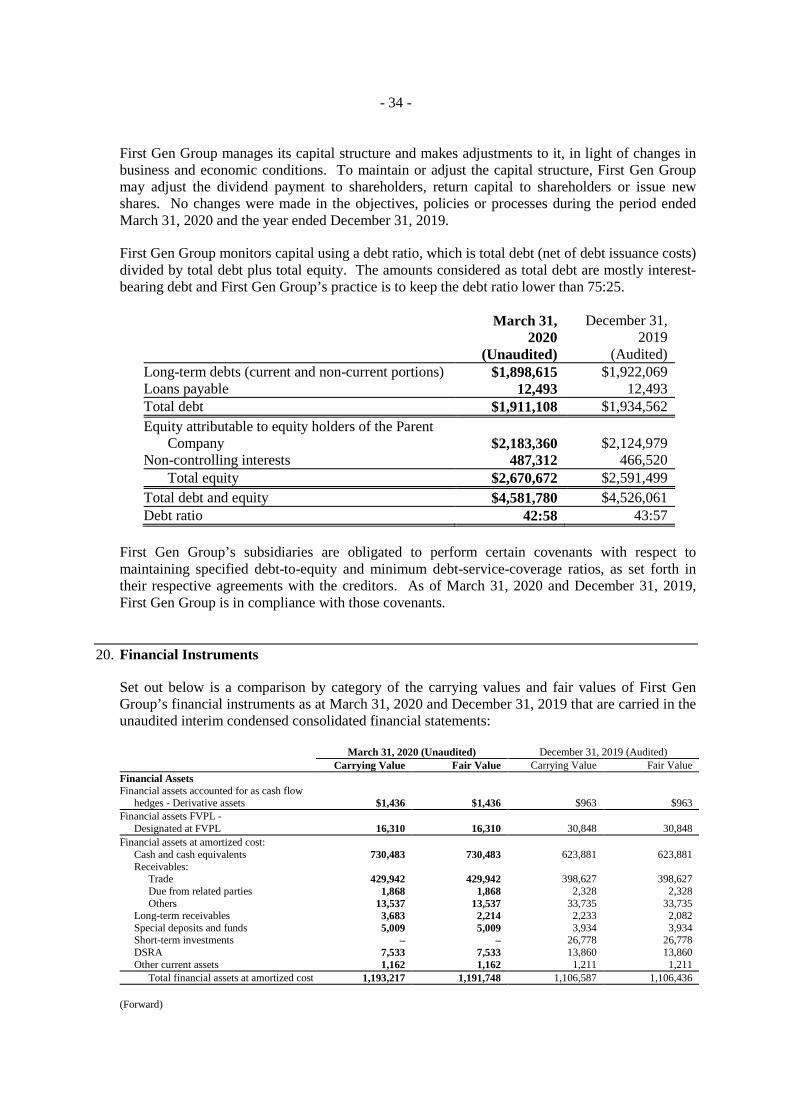
- 34 -
First Gen Group manages its capital structure and makes adjustments to it, in light of changes in business and economic conditions. To maintain or adjust the capital structure, First Gen Group may adjust the dividend payment to shareholders, return capital to shareholders or issue new shares. No changes were made in the objectives, policies or processes during the period ended March 31, 2020 and the year ended December 31, 2019.
First Gen Group monitors capital using a debt ratio, which is total debt (net of debt issuance costs) divided by total debt plus total equity. The amounts considered as total debt are mostly interest-bearing debt and First Gen Group’s practice is to keep the debt ratio lower than 75:25.
March 31, 2020
(Unaudited)
December 31, 2019
(Audited) Long-term debts (current and non-current portions) $1,898,615 $1,922,069 Loans payable 12,493 12,493 Total debt $1,911,108 $1,934,562 Equity attributable to equity holders of the Parent
Company $2,183,360
$2,124,979 Non-controlling interests 487,312 466,520 Total equity $2,670,672 $2,591,499 Total debt and equity $4,581,780 $4,526,061 Debt ratio 42:58 43:57
First Gen Group’s subsidiaries are obligated to perform certain covenants with respect to maintaining specified debt-to-equity and minimum debt-service-coverage ratios, as set forth in their respective agreements with the creditors. As of March 31, 2020 and December 31, 2019, First Gen Group is in compliance with those covenants.
20. Financial Instruments
Set out below is a comparison by category of the carrying values and fair values of First Gen Group’s financial instruments as at March 31, 2020 and December 31, 2019 that are carried in the unaudited interim condensed consolidated financial statements: March 31, 2020 (Unaudited) December 31, 2019 (Audited) Carrying Value Fair Value Carrying Value Fair Value Financial Assets Financial assets accounted for as cash flow
hedges - Derivative assets $1,436 $1,436 $963 $963 Financial assets FVPL - Designated at FVPL 16,310 16,310 30,848 30,848 Financial assets at amortized cost: Cash and cash equivalents 730,483 730,483 623,881 623,881 Receivables: Trade 429,942 429,942 398,627 398,627 Due from related parties 1,868 1,868 2,328 2,328 Others 13,537 13,537 33,735 33,735 Long-term receivables 3,683 2,214 2,233 2,082 Special deposits and funds 5,009 5,009 3,934 3,934 Short-term investments – – 26,778 26,778 DSRA 7,533 7,533 13,860 13,860 Other current assets 1,162 1,162 1,211 1,211 Total financial assets at amortized cost 1,193,217 1,191,748 1,106,587 1,106,436
(Forward)

- 35 -
March 31, 2020 (Unaudited) December 31, 2019 (Audited) Carrying Value Fair Value Carrying Value Fair Value Financial assets at FVOCI: Debt instruments $3,054 $3,054 $3,101 $3,101 Equity instruments 1,275 1,275 1,254 1,254 Proprietary club membership shares 703 703 703 703 Total financial assets at FVOCI 5,032 5,032 5,058 5,058 $1,215,995 $1,214,526 $1,143,456 $1,143,305 Financial Liabilities Financial liabilities carried at amortized cost: Accounts payable and accrued expenses* $411,629 $411,629 $377,453 $377,453 Dividends payable – – 53,784 53,784 Loans payable 12,493 12,493 12,493 12,493 Lease liabilities 12,317 12,423 13,019 12,598 Long - term debts 1,898,615 2,087,190 1,922,069 2,098,933 Total financial liabilities at amortized cost 2,335,054 2,523,735 2,378,818 2,555,261 Financial liability accounted for as cash flow
hedges - Derivative liabilities 13,806 13,806 5,550 5,550 $2,348,860 $2,537,541 $2,384,368 $2,560,811 *Excluding payables to government agencies
Fair Value and Categories of Financial Instruments The fair values of cash and cash equivalents, receivables, other current assets, accounts payable and accrued expenses, dividends payable, loans payable and amounts due to/from related parties approximate the carrying values at financial reporting date, due to the short-term maturities of the transactions.
Long-term receivables The fair value of long-term receivables was computed by discounting the expected cash flow using the applicable rates of 4.36% and 3.58% as of March 31, 2020 and December 31, 2019, respectively.
Financial assets at FVOCI Fair values of quoted debt and equity securities are based on quoted market prices and other observable data. Financial instruments at FVPL The fair values of financial instruments at FVPL are based on quotations provided by the investment manager. FGP and FGPC long-term debts The fair values of long-term debts were computed by discounting the instruments’ expected future cash flows using the prevailing credit adjusted U.S. dollar interest rates ranging from 0.5239% to 1.4505% and 1.4556% to 1.7695% as of March 31, 2020 and December 31, 2019, respectively.
Parent Company and FNPC long-term debts The fair values of the Parent Company’s and FNPC’s U.S. dollar-denominated long-term debts were computed by discounting the instruments’ expected future cash flows using the prevailing credit adjusted U.S. dollar interest rates on March 31, 2020 and December 31, 2019 ranging from 0.240% to 0.691% and 1.584% to 1.928%, respectively.
Long-term debts of EDC The fair values of EDC’s long-term debts were estimated using the discounted cash flow methodology with the applicable rates ranging from 1.75% to 2.90% and 1.75% to 3.07% as of March 31, 2020 and December 31, 2019, respectively.
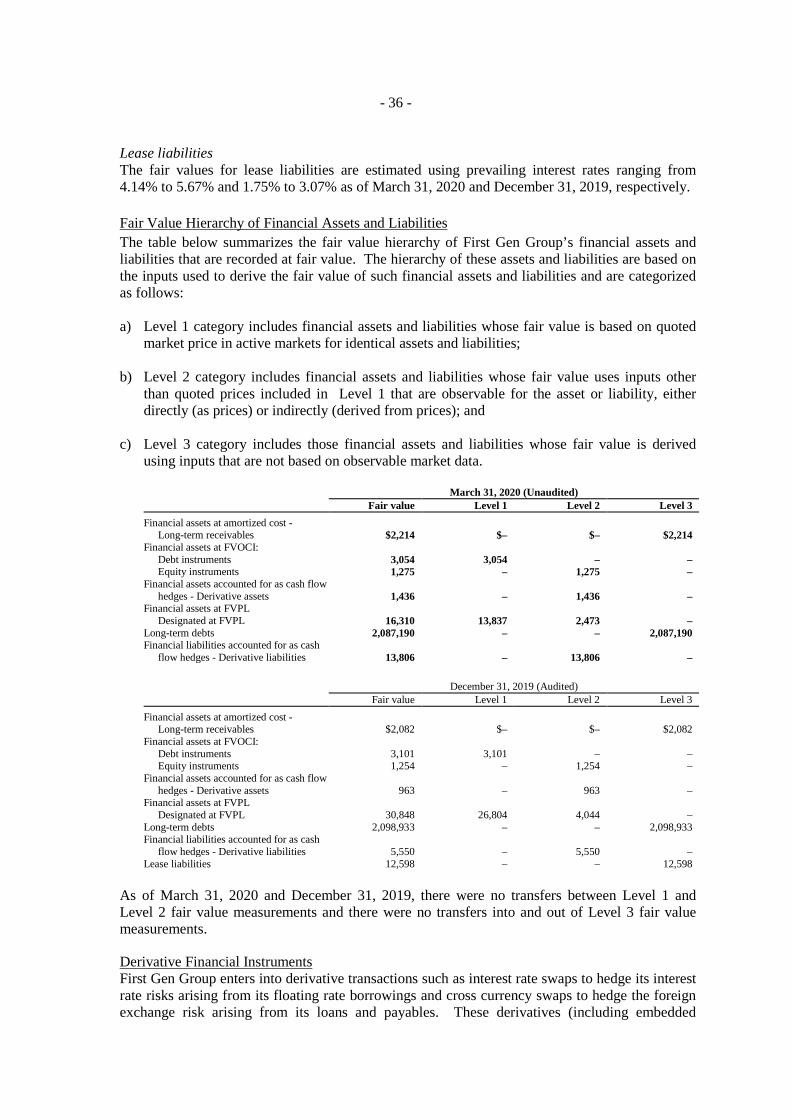
- 36 -
Lease liabilities The fair values for lease liabilities are estimated using prevailing interest rates ranging from 4.14% to 5.67% and 1.75% to 3.07% as of March 31, 2020 and December 31, 2019, respectively. Fair Value Hierarchy of Financial Assets and Liabilities The table below summarizes the fair value hierarchy of First Gen Group’s financial assets and liabilities that are recorded at fair value. The hierarchy of these assets and liabilities are based on the inputs used to derive the fair value of such financial assets and liabilities and are categorized as follows:
a) Level 1 category includes financial assets and liabilities whose fair value is based on quoted
market price in active markets for identical assets and liabilities;
b) Level 2 category includes financial assets and liabilities whose fair value uses inputs other than quoted prices included in Level 1 that are observable for the asset or liability, either directly (as prices) or indirectly (derived from prices); and
c) Level 3 category includes those financial assets and liabilities whose fair value is derived using inputs that are not based on observable market data.
March 31, 2020 (Unaudited) Fair value Level 1 Level 2 Level 3 Financial assets at amortized cost - Long-term receivables $2,214 $– $– $2,214 Financial assets at FVOCI: Debt instruments 3,054 3,054 – – Equity instruments 1,275 – 1,275 – Financial assets accounted for as cash flow
hedges - Derivative assets 1,436 – 1,436 – Financial assets at FVPL Designated at FVPL 16,310 13,837 2,473 – Long-term debts 2,087,190 – – 2,087,190 Financial liabilities accounted for as cash
flow hedges - Derivative liabilities 13,806 – 13,806 –
December 31, 2019 (Audited) Fair value Level 1 Level 2 Level 3 Financial assets at amortized cost - Long-term receivables $2,082 $– $– $2,082 Financial assets at FVOCI: Debt instruments 3,101 3,101 – – Equity instruments 1,254 – 1,254 – Financial assets accounted for as cash flow
hedges - Derivative assets
963
–
963
– Financial assets at FVPL Designated at FVPL 30,848 26,804 4,044 – Long-term debts 2,098,933 – – 2,098,933 Financial liabilities accounted for as cash
flow hedges - Derivative liabilities
5,550
–
5,550
– Lease liabilities 12,598 – – 12,598
As of March 31, 2020 and December 31, 2019, there were no transfers between Level 1 and Level 2 fair value measurements and there were no transfers into and out of Level 3 fair value measurements.
Derivative Financial Instruments First Gen Group enters into derivative transactions such as interest rate swaps to hedge its interest rate risks arising from its floating rate borrowings and cross currency swaps to hedge the foreign exchange risk arising from its loans and payables. These derivatives (including embedded

- 37 -
derivatives) are accounted for either as derivatives not designated as accounting hedges or derivatives designated as accounting hedges.
The tables below show the fair values of First Gen Group’s outstanding derivative financial instruments, reported as assets or liabilities, together with their notional amounts as of March 31, 2020 and December 31, 2019. The notional amount is the basis upon which changes in the value of derivatives are measured.
March 31, 2020 (Unaudited) December 31, 2019 (Audited)
Derivative
Assets Derivative Liabilities
Notional Amount
Derivative Assets
Derivative Liabilities
Notional Amount
Derivatives Designated as Accounting Hedges
Freestanding derivatives: Interest rate swaps $90 $13,690 $191,422 $116 $5,133 $191,422 Call spread swaps 1,346 116 $60,000 847 417 $60,000 Total derivatives $1,436 $13,806 $963 $5,550 Presented as: Current $1,436 $1,250 $115 $425 Noncurrent – 12,556 848 5,125 Total derivatives $1,436 $13,806 $963 $5,550
Derivatives Designated as Accounting Hedges First Gen Group has interest rate swaps (IRS) accounted for as cash flow hedges for its floating rate loans and cross-currency swaps accounted for as cash flow hedges of its Philippine peso and U.S. dollar denominated borrowings, respectively. Under a cash flow hedge, the effective portion of changes in fair value of the hedging instrument is recognized as cumulative translation adjustments in other comprehensive income (loss) until the hedged item affects earnings.
Interest Rate Swap - FGP In April 2013, FGP entered into two IRS agreements with ING Bank and SCB to hedge its floating rate exposure on $80.0 million of its $420.0 million term loan facility (see Note 13). Under the IRS agreements, FGP pays a fixed rate of 1.425% and receives a floating rate of U.S. LIBOR, on a semi-annual basis, simultaneous with the interest payments every June and December on the hedged loan.
In May 2013, FGP entered into another IRS agreement with RCBC to hedge its floating rate exposure on another $20.0 million of the $420.0 million term loan facility. Under the IRS agreement, FGP pays a fixed rate of 1.28% and receives a floating rate of U.S. LIBOR, on a semi-annual basis, simultaneous with the interest payment every June and December on the hedged loan. The notional amounts of interest rate swaps are amortizing based on the repayment schedule of the hedged loan. The interest rate swaps were designated as cash flow hedges and will mature on June 10, 2020.
On June 10, 2013, FGP designated the IRS as hedging instruments to hedge the variability in the cash flows from the Term Loan Facility, attributable to the movements of six-month U.S. LIBOR. The hedges are accounted for as cash flow hedges.
As of March 31, 2020 and December 31, 2019, the positive fair values of the interest rate swaps that were deferred to “Cumulative translation adjustments” account in the unaudited interim consolidated statements of financial position amounted to $0.02 million (net of related deferred income tax effect of $0.01 million) and $0.7 million (net of related deferred income tax effect of $0.3 million), respectively.

- 38 -
There was no ineffective portion recognized in the unaudited interim consolidated statements of income for the three-month periods ended March 31, 2020 and 2019. The outstanding aggregate notional amount and the related cumulative mark-to-market gains and losses of the interest rate swaps designated as cash flow hedges as of March 31, 2020 and December 31, 2019 are as follows:
March 31, 2020
(Unaudited)
December 31, 2019
(Audited) Notional amount $50,122 $50,122 Cumulative mark-to-market gains 90 115
The net movements in the fair value of the interest rate swaps of FGP are as follows:
March 31, 2020
(Unaudited)
December 31, 2019
(Audited) Fair value at beginning of period $115 $1,130 Fair value changes taken into equity during the
period 37
(322) Fair value changes realized during the period (62) (693) Fair value at end of period 90 115 Deferred income tax effect on cash flow hedges (27) (34) Fair value deferred into equity $63 $81
Fair value changes during the period, net of deferred income tax, are recorded in the unaudited interim consolidated statements of comprehensive income, and under the “Cumulative translation adjustments” account in the unaudited interim consolidated statements of financial position. The fair value changes realized during the period were taken into “Interest expense and financing charges” account in the unaudited interim consolidated statements of income. This pertains to the net difference between the fixed interest paid/accrued and the floating interest received/accrued on the interest rate swap agreements as at financial reporting date. For the three-month periods ended March 31, 2020 and 2019, the fair value changes taken to the unaudited interim consolidated statements of income amounted to $0.1 million. Interest Rate Swap - EBWPC In the last quarter of 2014, EBWPC entered into four (4) IRS with aggregate notional amount of $150.0 million. This is to partially hedge the interest rate risks on its ECA and Commercial Debt Facility (Foreign Facility) that is benchmarked against U.S. LIBOR and with flexible interest reset feature that allows EBWPC to select what interest reset frequency to apply. Under the IRS agreement, EBWPC will receive semi-annual interest of 6-month U.S. LIBOR and will pay fixed interest. EBWPC designated the IRS as hedging instruments in cash flow hedge against the interest rate risks arising from the Foreign Facility. In the first quarter of 2016, EBWPC entered into three (3) additional IRS with aggregate notional amount of $30.0 million. Under the IRS agreement, EBWPC will receive semi-annual interest of 6-month USD-LIBOR and will pay fixed interest. EBWPC designated the IRS as hedging instruments in cash flow hedge against the interest rate risks arising from the Foreign Facility.

- 39 -
As of March 31, 2020 and December 31, 2019, the outstanding aggregate notional amount of EBWPC’s IRS amounted to $142.3 million. The aggregate negative fair value changes on these IRS amounted to $0.3 million and $8.6 million, were recognized under “Cumulative translation adjustments” account in the unaudited interim consolidated statements of financial position as of March 31, 2020 and December 31, 2019, respectively. Call Spread Swap - EDC In July 2017, EDC entered into four (4) call spread swaps (CSS) with an aggregate notional amount of $20.0 million. These derivative contracts are designed to hedge the possible foreign exchange loss of its $300.0 million Notes.
In January 2018, EDC entered into two (2) additional CSS with an aggregate notional amount of $10.0 million and another two (2) CSS in August 2018 with an aggregate notional amount of $20.0 million. An additional two (2) CSS were entered by EDC in November 2018 with an aggregate amount of $10.0 million. These derivative contracts are designated to hedge the possible foreign exchange loss of its $181.0 million Notes.
The aggregate fair value changes on these call spread contracts amounted to $1.2 million and $0.9 million as of March 31, 2020 and December 31, 2019, respectively.
Hedge Effectiveness Results As of March 31, 2020 and December 31, 2019, the net movements of changes made to the “Cumulative translation adjustments” account pertaining to EDC’s cash flow hedges are as follows:
March 31, 2020
(Unaudited)
December 31, 2019
(Audited) Balances at beginning of period ($10,322) $1,114 Fair value changes taken into equity during the period 9,066 (11,746) Fair value changes realized during the period – 310 (1,256) (10,322) Deferred income tax effect on cash flow hedges – 1,480 Fair value deferred into equity ($1,256) ($8,842)
21. Event After the Financial Reporting Date
EDC On April 2, 2020, EDC secured a loan agreement with BPI amounting to P=6,000.0 million.
COVID-19 outbreak
In a move to contain the COVID-19 outbreak, on March 13, 2020, the Office of the President of the Philippines issued a Memorandum directive to impose stringent social distancing measures in the National Capital Region (NCR) effective March 15, 2020. On March 16, 2020, Presidential Proclamation No. 929 was issued, declaring a State of Calamity throughout the Philippines for a period of six (6) months and imposed an enhanced community quarantine (ECQ) throughout the island of Luzon until April 12, 2020, which was further extended to May 15, 2020 in selected areas including the NCR. Starting May 16 to May 31, 2020, the NCR and other selected areas will be placed under Modified ECQ. These measures have caused disruptions to businesses and economic activities, and its impact on businesses continues to evolve.

- 40 -
Considering the evolving nature of this outbreak, First Gen Group will continue to monitor the situation in subsequent periods.
22. Other Matters Explanatory comments about the seasonality or cyclicality of interim operations Except for FG Hydro’s and FG Bukidnon’s sale of electricity coming from hydroelectric power/operations, seasonality or cyclicality of interim operations is not applicable to First Gen Group’s type of business because of the nature of its contracts with Meralco and NPC, which includes guaranteed volume under the applicable take-or-pay, minimum energy off-take or contracted energy provisions. BGI’s and GCGI’s sales to cooperatives and industries are also not subject to seasonality or cyclicality. For EDC’s Burgos Wind, higher revenue and operating profits are expected in the last quarter of the year based on the generation profile of Burgos. Meanwhile, EDC’s Burgos Solar is expected to generate its highest revenue during the summer months. The nature and amount of items affecting assets, liabilities, equity, net income, or cash flows that are unusual because of their nature, size or incidence There are no assets, liabilities, equity, net income or cash flows that are unusual because of their nature, size or incidence during the current period. The nature and amount of changes in estimates of amounts reported in prior interim periods of the current fiscal year or changes in estimates of amounts reported in prior financial years, if those changes have a material effect in the current interim period. The key assumptions concerning the future and other key sources of estimation used in the preparation of the unaudited interim condensed consolidated financial statements are consistent with those followed in the preparation of First Gen Group’s annual consolidated financial statements as of and for the year ended December 31, 2019. The effect of changes in the composition of the issuer during the interim period, including business combinations, acquisition or disposal of subsidiaries and long-term investments, restructurings, and discontinuing operations. There are no material changes in the composition of the issuer during the interim period. Changes in contingent liabilities or contingent assets since the last annual reporting date There are no material changes in the contingent liabilities or contingent assets since the last annual financial reporting date. Existence of material contingencies and any other events or transactions that are material to an understanding of the current interim period In response to the COVID-19 pandemic, the Philippine government imposed stringent social distancing measures in the NCR effective March 15, 2020. These measures have resulted in serious disruptions to businesses and economic activities, and could have a material impact on First Gen Group’s financial results. Considering the evolving nature of the outbreak, First Gen Group cannot determine at this time the impact on its consolidated financial position, performance and cash flows.