Embed Size (px)
Citation preview
A 14 500 year record of the accumulation of atmosphericmercury in peat: volcanic signals, anthropogenic in£uences
and a correlation to bromine accumulation
F. Roos-Barraclough a, A. Martinez-Cortizas b, Eduardo Garc|¤a-Rodeja b,W. Shotyk a;�
a Institute of Geological Sciences, University of Berne, Baltzerstrasse 1^3, 3012 Berne, Switzerlandb Departamento de Edafolog|¤a y Qu|¤mica Agr|¤cola, Facultad de Biolog|¤a, Campus Sur s/n, 15706 Santiago de Compostela, Spain
Received 8 November 2001; received in revised form 27 March 2002; accepted 27 June 2002
Abstract
A 14 500 calendar year record of mercury accumulation rates has been obtained from an ombrotrophic peat bog in theSwiss Jura mountains. The range of natural (pre-industrial) mercury accumulation rates varied from 0.3 to 8.0 Wg m32
yr31. During the Late Glacial and Holocene, climatic and volcanic signals were evident in the mercury record. Mercuryaccumulation rates increased by a factor of ca 5 during the Younger Dryas cold period. Short-term spikes in mercuryaccumulation rates, which correspond in time to known volcanic eruptions, occur during the late Boreal and OlderAtlantic periods, when volcanic influences on mercury deposition appear to have been intensified due to increasedatmospheric humidity. A correlation of mercury to bromine accumulation is observed throughout the pre-anthropogenic period. During the Holocene, mercury accumulation only exceeded the range of this correlation for afew short periods of elevated mercury deposition which correspond to known volcanic eruptions during the OlderAtlantic. During historical times, mercury accumulation rates have exceeded the range of the correlation of mercury tobromine continuously since ca 1330 AD. This excess in mercury accumulation is interpreted as an indication ofpollution. During the industrial period, mercury accumulation rates reached 107.6 Wg m32 yr31, of which 84% wasmercury that exceeded the correlation range. Mercury accumulation rates peaked again during the 1970s, with 78.8 Wgm32 yr31. Early 20th century pollution appears to have been dominated by non-Swiss emissions from coal burning,whereas Swiss mercury emissions appear to have been the dominant pollution source during the mid and late 20thcentury. Current mercury accumulation rates at the site are similar to those ca 10 years ago, with modern depositionrates being ca 15 times their prehistorical average. Anthropogenic emissions of reactive brominated compounds could becontributing to increased atmospheric deposition rates of mercury. A 2002 Elsevier Science B.V. All rights reserved.
Keywords: atmosphere; mercury; peat bogs; climate; bromine; volcanism
0012-821X / 02 / $ ^ see front matter A 2002 Elsevier Science B.V. All rights reserved.PII: S 0 0 1 2 - 8 2 1 X ( 0 2 ) 0 0 8 0 5 - 1
* Corresponding author. Present address: Institute of Environmental Geochemistry, University of Heidelberg, Im NeuenheimerFeld 236, 69120 Heidelberg, Germany. Tel. : +49-6221-54-4801; Fax: +49-6221-54-5228.E-mail addresses: ¢[email protected] (F. Roos-Barraclough), [email protected] (A. Martinez-Cortizas), [email protected]
(E. Garc|¤a-Rodeja), [email protected] (W. Shotyk).
EPSL 6334 29-8-02
Earth and Planetary Science Letters 202 (2002) 435^451
www.elsevier.com/locate/epsl
1. Introduction
Mercury is a long-range, potentially toxic pol-lutant which is bioaccumulated in the environ-ment [1]. Due to its high volatility, low chemicalreactivity and low solubility in water, elementalmercury, which makes up approximately 98% oftotal atmospheric mercury, has a residence time inthe atmosphere of up to 2 yr, which means mer-cury vapour can be transported far beyond theregions in which it is emitted [2]. Mercury hasbeen found in Arctic biota [3] at concentrationsso high that they present a threat to human health[4,5]. It has been suggested that these unexpect-edly high levels in remote regions are due to thelong-range transport of mercury emitted fromanthropogenic sources in more industrialised re-gions and that the atmospheric mercury budgethas tripled since pre-industrial times[6]. However,it is impossible to determine the true impact ofanthropogenic emissions on the global mercurybudget without knowledge of the natural budgetand its variations. The natural component of mer-cury in the environment and its dependence onclimate change [7] and geological processes [8]must be known before the e¡ect of anthropogenicemissions on environmental mercury can be quan-ti¢ed.
For instance, it has been suggested that the coldcondensation e¡ect [9], originally conceived forvolatile persistent organic pollutants, may alsoapply to mercury [10]. This e¡ect allows substan-ces within a certain range of volatility to ‘grass-hop’ around the Earth ^ that is, to be repeatedlydeposited and re-volatilised ^ until they are ¢nallydeposited in cold regions where they become con-centrated. Martinez-Cortizas et al. [7] found a linkbetween thermal fractions of mercury in peat andthe temperature at the time of deposition, suggest-ing that more mercury was accumulated in thepeat during cold periods than during warm peri-ods.
Geological processes such as soil erosion anddegassing can supply mercury to the atmospherein its particulate and elemental forms, respec-tively. Soil erosion rates are in£uenced naturallyby climate change, with decreases in precipitation/vegetation and increases in windspeeds increasing
erosion, but today soil erosion is also in£uencedby anthropogenic activities such as deforestationand ploughing. Degassing of mercury from soils isdependent on vegetation cover, temperature, inci-dent radiation and air turbulence as well as soiltype and the soil mercury concentration [11^13].Particulate mercury released to the atmospherehas a short residence time (ca 5 days [14]) com-pared to the elemental mercury released by soildegassing and so is mainly deposited locallyrather than contributing to the global atmospher-ic mercury pool.
Other geological processes which act as naturalsources of mercury to the atmosphere are volcanicand marine emissions. Volcanic mercury emis-sions through both degassing and volcanic erup-tions are considered to be a major natural sourceof mercury to the atmosphere but have proveddi⁄cult to quantify [15], with the quantity andspeciation of mercury emitted di¡ering from vol-cano to volcano [16] as well as at di¡erent emis-sion points on one volcano [17]. Marine emissionsfrom the surface ocean are thought to be in equi-librium with atmospheric deposition to the ocean[2], but can be increased due to increased oceanicproductivity (encouraged by upwelling, turbulenceand soil dust input [18,19]). Increased oceanicemissions of mercury may be the reason for thepeak in mercury concentrations in the Vostock icecore during the Last Glacial Maximum [20^22],another example of climate change a¡ecting themercury cycle.
The wide range of factors controlling mercuryemissions from geological sources such as soilsand water bodies, and the apparent variabilityof volcanic outputs, has made the quantity ofmercury released naturally from geological sour-ces di⁄cult to calculate. Therefore, attempts todetermine the natural and anthropogenic fractionsof the current atmospheric and surface oceanicmercury pools involve considerable error [23].However, using long-term archives of atmosphericmetal deposition such as lake sediment and peatbog cores allow us to compare pre-industrial withpost-industrial deposition rates and therefore toquantify the e¡ect of anthropogenic emissionson mercury deposition and also to study varia-tions in the natural cycles of these elements.
EPSL 6334 29-8-02
F. Roos-Barraclough et al. / Earth and Planetary Science Letters 202 (2002) 435^451436
As bogs are ombrotrophic, i.e. they obtain alltheir inputs from the atmosphere [24], and be-cause mercury is e¡ectively immobile in the peatcolumn [25,26], peat bog cores can be used asarchives of atmospheric mercury deposition[7,25^28]. In this paper, bromine is also discussed.Although the geochemistry of bromine in peat isnot well known, mass balances indicate that it toois at least semi-quantitatively retained in the peat(see Section 5.3). Here we report on a study ofmercury in two peat cores from the same bog,which together provide a complete record of theaccumulation of atmospheric mercury in the peatfor the last 14 500 yr.
2. Study site
Etang de la Grue're is situated ca 1005 m above
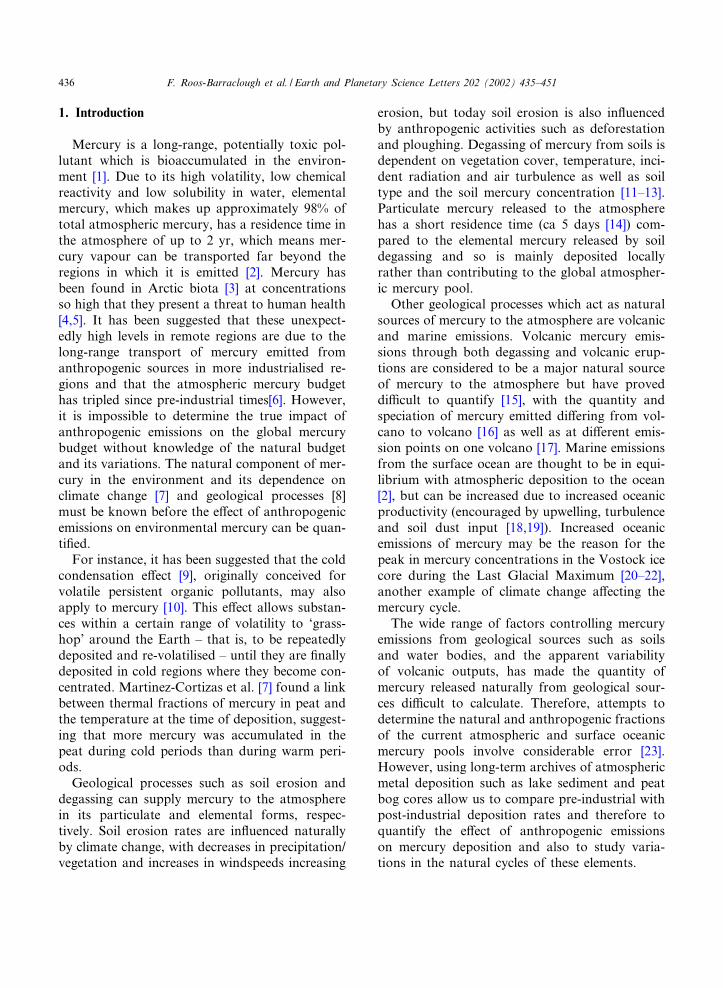
sea level in a protected area of the karstic Fran-ches-Montagnes region of the Swiss Jura moun-tains [29]. Peat formation at the site began ca14 500 calendar years ago (12 490 V 85 14C yr BP,ETH-23535) in a hollow underlain by Oxfordianclays and marls. The present climate is moist con-tinental, with an average temperature of 5.5‡Cand average annual rainfall exceeding 1300 mm.On the dome of the peninsula, where the coresfor this study were taken, the peat has nowgrown to a thickness of 6.5 m. Although partsof the bog have been damaged by drainage, theombrotrophic bog on the peninsula is consid-ered to have developed with little or no anthro-pogenic in£uence as no drainage, peat-cutting orsigni¢cant wood-cutting has taken place there[30]. Fig. 1 shows the location of the coring siteand its stratigraphy.
Fig. 1. Situation and stratigraphy of the coring site of cores EGR2G and EGR2A at Etang de la Grue're. The cores were takenin 1991 and 1990, respectively, at the location shown on the top of the dome on the peninsula at Etang de la Grue're in the SwissJura mountains. The depth ranges of EGR2G and EGR2A are indicated by arrows to the left of the stratigraphy diagram. Detailconstructed using data from Steinmann and Shotyk [29].
EPSL 6334 29-8-02
F. Roos-Barraclough et al. / Earth and Planetary Science Letters 202 (2002) 435^451 437
3. Methods
3.1. Sample collection
Two peat cores were taken on the top of thedome of the bog at coordinates CH 570525/232150 in 1990 and 1991. The shorter, surfacecore EGR2G (1991, 0^67 cm depth) was takenusing a Wardenaar corer [31] and the longerEGR2A core (1990, 45^656 cm) with a Living-stone corer [32]. The cores were wrapped in plas-tic and kept frozen at 318‡C until analysis.
3.2. Analysis
The surface core, EGR2G, was cut frozen into1 cm slices using a stainless steel bandsaw, and thelonger EGR2A core was cut into 2 cm slices. Theedges of each slice were trimmed o¡, dried at105‡C overnight and pulverised using an Ultra-centrifugal Mill ZM 1-T (F.K. Retsch, Germany).These powdered samples were analysed for traceelements including Br and Ti by X-ray £uores-cence spectroscopy (XRF). Titanium was mea-sured using a new analytical spectrometer for Ti(NASTIA [33]). The instrument was calibrated inthe low Ti concentration range using liquidatomic absorption spectroscopy (AAS) standards.For higher Ti concentrations, the instrument wascalibrated using NIST 1632b and NIST 1635 stan-
dard reference materials (SRMs). The lower limitof detection (LLD) for Ti using NASTIA is 5 Wg/gand precision is ca 10% at concentrations 10ULLD. Br was measured using the energy-disper-sive miniprobe multielement analyzer (EMMA)[34]. The instrument was calibrated in the concen-tration range 2^20 Wg/g using information valuesfor Br from NIST SRMs and this yielded a linearcalibration curve. Previous analyses of Br in peatcores from both continental and maritime peatbogs using both XRF and INAA were generallyfound to be in excellent agreement (Shotyk, un-published). The agreement between the two meth-ods of analysis was typically better than 10%and often better than 5%. However, the LLDfor Br by EMMA XRF is 0.7 Wg/g, comparedto 10 Wg/g using INAA. Given that the concen-trations of Br in peat from EGR can be as low as8 Wg/g, the XRF technique is preferred as theconcentrations in the samples are always at least10ULLD.
The core centres were subsampled and analysedfor bulk density, water content and Hg concen-tration by AAS using a Leco AMA 254 accordingto the procedure for the determination of Hg con-centrations in solid peat samples described in [35].The detection limit of the Leco AMA 254 instru-ment is 0.01 ng Hg, with repeatability 6 1.5%.Calibration for Hg measurement was performedusing liquid standards prepared from Merck Hg
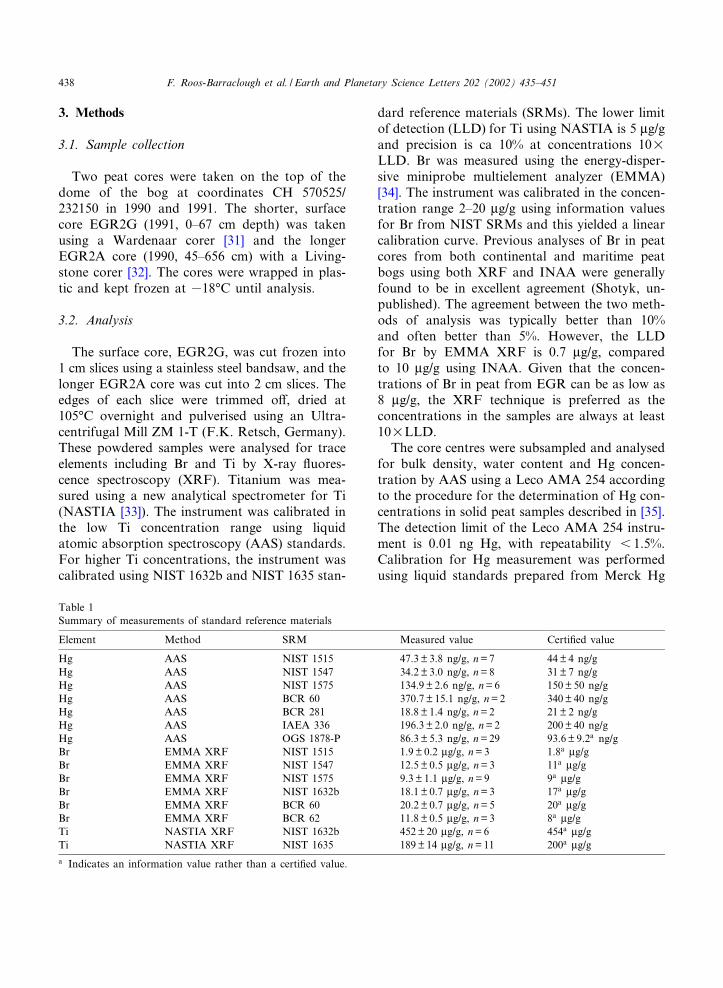
Table 1Summary of measurements of standard reference materials
Element Method SRM Measured value Certi¢ed value
Hg AAS NIST 1515 47.3V 3.8 ng/g, n=7 44V4 ng/gHg AAS NIST 1547 34.2V 3.0 ng/g, n=8 31V7 ng/gHg AAS NIST 1575 134.9V 2.6 ng/g, n=6 150V50 ng/gHg AAS BCR 60 370.7V 15.1 ng/g, n=2 340V40 ng/gHg AAS BCR 281 18.8V 1.4 ng/g, n=2 21V2 ng/gHg AAS IAEA 336 196.3V 2.0 ng/g, n=2 200V40 ng/gHg AAS OGS 1878-P 86.3V 5.3 ng/g, n=29 93.6V 9.2a ng/gBr EMMA XRF NIST 1515 1.9 V 0.2 Wg/g, n= 3 1.8a
Wg/gBr EMMA XRF NIST 1547 12.5V 0.5 Wg/g, n=3 11a
Wg/gBr EMMA XRF NIST 1575 9.3 V 1.1 Wg/g, n= 9 9a
Wg/gBr EMMA XRF NIST 1632b 18.1V 0.7 Wg/g, n=3 17a
Wg/gBr EMMA XRF BCR 60 20.2V 0.7 Wg/g, n=5 20a
Wg/gBr EMMA XRF BCR 62 11.8V 0.5 Wg/g, n=3 8a
Wg/gTi NASTIA XRF NIST 1632b 452V 20 Wg/g, n=6 454a
Wg/gTi NASTIA XRF NIST 1635 189V 14 Wg/g, n=11 200a
Wg/ga Indicates an information value rather than a certi¢ed value.
EPSL 6334 29-8-02
F. Roos-Barraclough et al. / Earth and Planetary Science Letters 202 (2002) 435^451438
standard solution. Both XRF and AAS methodswere validated by measurement of SRMs. SRMmeasurements are summarised in Table 1.
3.3. Dating
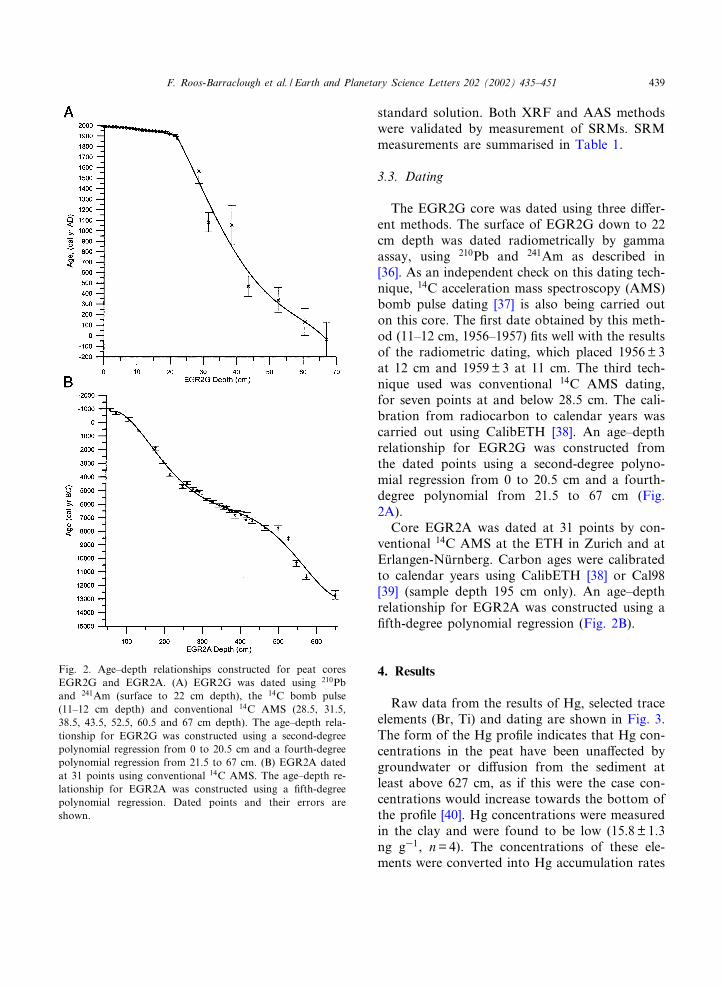
The EGR2G core was dated using three di¡er-ent methods. The surface of EGR2G down to 22cm depth was dated radiometrically by gammaassay, using 210Pb and 241Am as described in[36]. As an independent check on this dating tech-nique, 14C acceleration mass spectroscopy (AMS)bomb pulse dating [37] is also being carried outon this core. The ¢rst date obtained by this meth-od (11^12 cm, 1956^1957) ¢ts well with the resultsof the radiometric dating, which placed 1956 V 3at 12 cm and 1959V 3 at 11 cm. The third tech-nique used was conventional 14C AMS dating,for seven points at and below 28.5 cm. The cali-bration from radiocarbon to calendar years wascarried out using CalibETH [38]. An age^depthrelationship for EGR2G was constructed fromthe dated points using a second-degree polyno-mial regression from 0 to 20.5 cm and a fourth-degree polynomial from 21.5 to 67 cm (Fig.2A).
Core EGR2A was dated at 31 points by con-ventional 14C AMS at the ETH in Zurich and atErlangen-Nu«rnberg. Carbon ages were calibratedto calendar years using CalibETH [38] or Cal98[39] (sample depth 195 cm only). An age^depthrelationship for EGR2A was constructed using a¢fth-degree polynomial regression (Fig. 2B).
4. Results
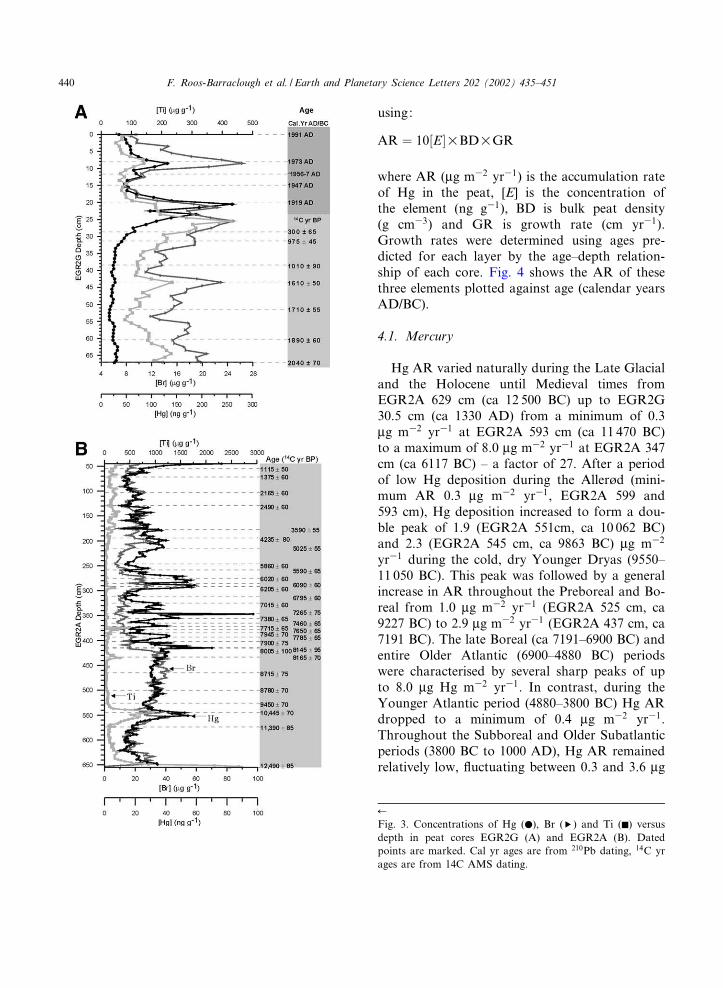
Raw data from the results of Hg, selected traceelements (Br, Ti) and dating are shown in Fig. 3.The form of the Hg pro¢le indicates that Hg con-centrations in the peat have been una¡ected bygroundwater or di¡usion from the sediment atleast above 627 cm, as if this were the case con-centrations would increase towards the bottom ofthe pro¢le [40]. Hg concentrations were measuredin the clay and were found to be low (15.8 V 1.3ng g31, n= 4). The concentrations of these ele-ments were converted into Hg accumulation rates
Fig. 2. Age^depth relationships constructed for peat coresEGR2G and EGR2A. (A) EGR2G was dated using 210Pband 241Am (surface to 22 cm depth), the 14C bomb pulse(11^12 cm depth) and conventional 14C AMS (28.5, 31.5,38.5, 43.5, 52.5, 60.5 and 67 cm depth). The age^depth rela-tionship for EGR2G was constructed using a second-degreepolynomial regression from 0 to 20.5 cm and a fourth-degreepolynomial regression from 21.5 to 67 cm. (B) EGR2A datedat 31 points using conventional 14C AMS. The age^depth re-lationship for EGR2A was constructed using a ¢fth-degreepolynomial regression. Dated points and their errors areshown.
EPSL 6334 29-8-02
F. Roos-Barraclough et al. / Earth and Planetary Science Letters 202 (2002) 435^451 439
using:
AR ¼ 10½E�UBDUGR
where AR (Wg m32 yr31) is the accumulation rateof Hg in the peat, [E] is the concentration ofthe element (ng g31), BD is bulk peat density(g cm33) and GR is growth rate (cm yr31).Growth rates were determined using ages pre-dicted for each layer by the age^depth relation-ship of each core. Fig. 4 shows the AR of thesethree elements plotted against age (calendar yearsAD/BC).
4.1. Mercury
Hg AR varied naturally during the Late Glacialand the Holocene until Medieval times fromEGR2A 629 cm (ca 12 500 BC) up to EGR2G30.5 cm (ca 1330 AD) from a minimum of 0.3Wg m32 yr31 at EGR2A 593 cm (ca 11 470 BC)to a maximum of 8.0 Wg m32 yr31 at EGR2A 347cm (ca 6117 BC) ^ a factor of 27. After a periodof low Hg deposition during the Aller\d (mini-mum AR 0.3 Wg m32 yr31, EGR2A 599 and593 cm), Hg deposition increased to form a dou-ble peak of 1.9 (EGR2A 551cm, ca 10 062 BC)and 2.3 (EGR2A 545 cm, ca 9863 BC) Wg m32
yr31 during the cold, dry Younger Dryas (9550^11 050 BC). This peak was followed by a generalincrease in AR throughout the Preboreal and Bo-real from 1.0 Wg m32 yr31 (EGR2A 525 cm, ca9227 BC) to 2.9 Wg m32 yr31 (EGR2A 437 cm, ca7191 BC). The late Boreal (ca 7191^6900 BC) andentire Older Atlantic (6900^4880 BC) periodswere characterised by several sharp peaks of upto 8.0 Wg Hg m32 yr31. In contrast, during theYounger Atlantic period (4880^3800 BC) Hg ARdropped to a minimum of 0.4 Wg m32 yr31.Throughout the Subboreal and Older Subatlanticperiods (3800 BC to 1000 AD), Hg AR remainedrelatively low, £uctuating between 0.3 and 3.6 Wg
6
Fig. 3. Concentrations of Hg (b), Br (T) and Ti (F) versusdepth in peat cores EGR2G (A) and EGR2A (B). Datedpoints are marked. Cal yr ages are from 210Pb dating, 14C yrages are from 14C AMS dating.
EPSL 6334 29-8-02
F. Roos-Barraclough et al. / Earth and Planetary Science Letters 202 (2002) 435^451440
m32 yr31 (with the 3.6 Wg m32 yr31 maximumduring the Roman period, EGR2G 62.5 cm, ca86 AD). However, during the Middle Ages, start-ing at approximately 1332 AD, Hg AR began toincrease. The average Hg AR from EGR2G65.5 cm (the beginning of the Christian era) upto the start of the increase at EGR2G 30.5 cm (ca1332 AD) was 1.8 V 0.7 Wg m32 yr31. This in-crease continued up to a peak in Hg AR of107.6 Wg m32 yr31 at EGR2G 20.5 cm (ca 1911AD). The Hg AR observed at EGR2G 20.5 cm isthe highest of the entire pro¢le and is over 13times its highest natural value.
Hg AR decreased during the ¢rst part of the20th century to a minimum of 9.4 Wg m32 yr31 atEGR2G 16.5 cm (ca 1937 AD) but increasedagain from EGR2G 14.5 cm (ca 1948 AD) up-wards, to peak again at EGR2G 8.5 cm (ca1973 AD), with 78.8 Wg m32 yr31. A smallerpeak, of 63.1 Wg m32 yr31, is seen at EGR2G1.5 cm (ca 1988). Sphagnum moss samples col-lected at the same location in the year 2000 hadHg concentrations very similar to that of theEGR2G core surface (34.7 V 5.0 (n= 5) and35.5 V 2.2 (n= 3) ng g31, respectively), indicatingthat Hg accumulation has not changed appreci-ably in the last ten years.
4.2. Titanium
Titanium, an indicator of soil dust input to thebog, had basic AR of ca 2.4 V 0.8 mg m32 yr31
during much of the Holocene but also showedperiods of elevated accumulation. These were dur-ing the Younger Dryas (a double peak of 30.6 and44.7 mg m32 yr31 at EGR2A 553 cm (ca 10 128BC) and EGR2A 543 cm (ca 9797 BC) respec-tively), several peaks during the late Boreal andOlder Atlantic, most notably at EGR2A 435 cm(ca 7160 BC, 23.0 mg m32 yr31), EGR2A 429 cm(ca 7069 BC, 15.1 mg m32 yr31), EGR2A 387 cm(ca 6545 BC, 13.4 mg m32 yr31), EGR2A 379 cm(ca 6458 BC, 18.1 mg m32 yr31), EGR2A 375 cm(ca 6416 BC, 45.3 mg m32 yr31) and EGR2A295 cm (ca 5419 BC, 16.9 mg m32 yr31). A gen-eral increase in Ti AR began at EGR2A 218 cm(ca 3600 BC) and continued until a peak duringthe Roman period at EGR2G 64.5 cm of 24.21
mg m32 yr31. This increase is anthropogenic andwas caused by increased soil dust inputs dueto the clearing, burning and ploughing of land[41].
Ti AR remained relatively constant during theDark and early Middle Ages (8.5 V 2.6 mg m32
yr31 from EGR2G 48.5^30.5 cm, ca 422^1332AD), followed by a period of slight elevationfrom EGR2G 29.5^23.5 cm (ca 1400^1800 AD,15.1 V 4.2 mg m32 yr31). The industrial period ismarked by a peak in Ti AR of 74.0 mg m32 yr31
at 20.5 cm (ca 1911 AD), followed by two further20th century peaks of 84.4 and 88.6 mg m32 yr31
at EGR2G 8.5 and 1.5 cm (ca 1973 and 1988AD), respectively.
4.3. Bromine
The Br AR pro¢le is very similar to that of Hgthroughout most of the pro¢le, with peaks of 1.9and 1.6 mg m32 yr31 during the Younger Dryasat EGR2A 553 and 545 cm (ca 10 128 and 9863BC), respectively, followed by a general increaseduring the Preboreal and early Boreal. The lateBoreal and Older Atlantic periods are not charac-terised by large peaks for Br AR as they are forHg. However, some peaks in Br AR do occurduring this period (most notably the peaks atEGR2A 393 cm (ca 6611 BC) and EGR2A 293cm (ca 5385 BC) of 2.4 and 2.5 mg m32 yr31,respectively, all of which are associated with asimultaneous peak in Hg AR. Throughout theYounger Atlantic, Subboreal and Older Subatlan-tic periods, the Br AR pro¢le again mimics that ofHg.
Like Ti and Hg, Br AR also peaked during theRoman period at EGR2G 64.5 cm (ca 37 AD,2.2 mg m32 yr31) but remained low during sub-sequent historical times until it increased from apre-industrial average of 1.0 V 0.3 mg m32 yr31
from EGR2G 48.5^23.5 cm (ca 400^1800 AD)to 7.8 mg m32 yr31 at EGR2G 20.5 cm (ca1911 AD). Unlike the AR pro¢le of Hg, this in-dustrial period peak was not the highest of the BrAR pro¢le. Rather, the most elevated period ofBr AR occurred from EGR2G 9.5^1.5 cm (ca1970^1988 AD), with the highest value occurringat EGR2G 8.5 cm (ca 1973).
EPSL 6334 29-8-02
F. Roos-Barraclough et al. / Earth and Planetary Science Letters 202 (2002) 435^451 441
5. Discussion
5.1. Mercury
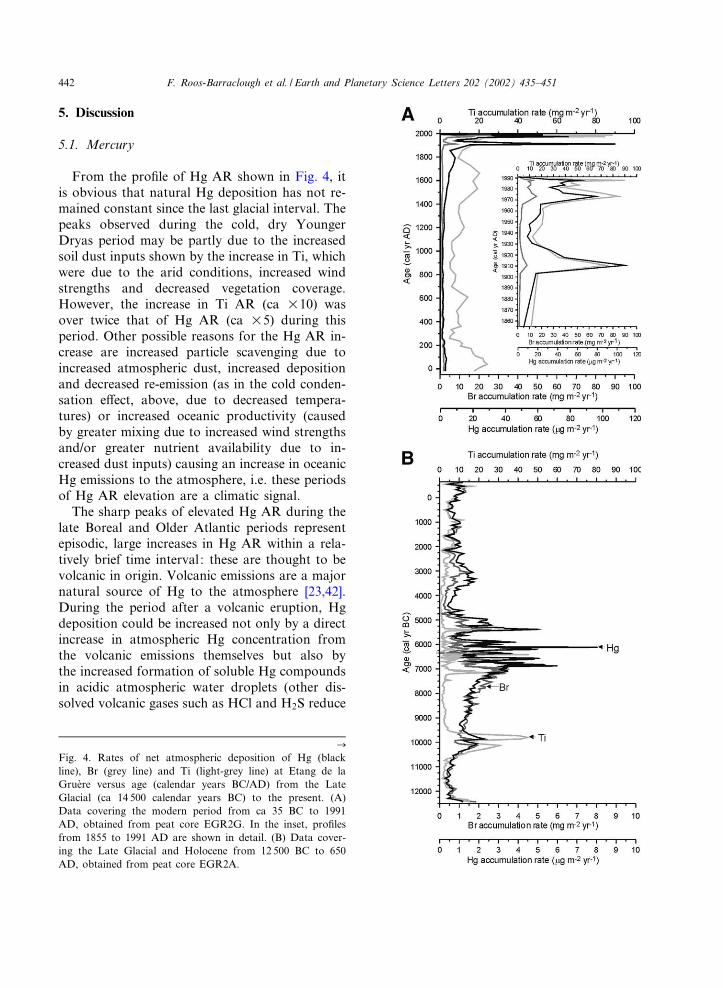
From the pro¢le of Hg AR shown in Fig. 4, itis obvious that natural Hg deposition has not re-mained constant since the last glacial interval. Thepeaks observed during the cold, dry YoungerDryas period may be partly due to the increasedsoil dust inputs shown by the increase in Ti, whichwere due to the arid conditions, increased windstrengths and decreased vegetation coverage.However, the increase in Ti AR (ca U10) wasover twice that of Hg AR (ca U5) during thisperiod. Other possible reasons for the Hg AR in-crease are increased particle scavenging due toincreased atmospheric dust, increased depositionand decreased re-emission (as in the cold conden-sation e¡ect, above, due to decreased tempera-tures) or increased oceanic productivity (causedby greater mixing due to increased wind strengthsand/or greater nutrient availability due to in-creased dust inputs) causing an increase in oceanicHg emissions to the atmosphere, i.e. these periodsof Hg AR elevation are a climatic signal.
The sharp peaks of elevated Hg AR during thelate Boreal and Older Atlantic periods representepisodic, large increases in Hg AR within a rela-tively brief time interval : these are thought to bevolcanic in origin. Volcanic emissions are a majornatural source of Hg to the atmosphere [23,42].During the period after a volcanic eruption, Hgdeposition could be increased not only by a directincrease in atmospheric Hg concentration fromthe volcanic emissions themselves but also bythe increased formation of soluble Hg compoundsin acidic atmospheric water droplets (other dis-solved volcanic gases such as HCl and H2S reduce
C
Fig. 4. Rates of net atmospheric deposition of Hg (blackline), Br (grey line) and Ti (light-grey line) at Etang de laGrue're versus age (calendar years BC/AD) from the LateGlacial (ca 14 500 calendar years BC) to the present. (A)Data covering the modern period from ca 35 BC to 1991AD, obtained from peat core EGR2G. In the inset, pro¢lesfrom 1855 to 1991 AD are shown in detail. (B) Data cover-ing the Late Glacial and Holocene from 12 500 BC to 650AD, obtained from peat core EGR2A.
EPSL 6334 29-8-02
F. Roos-Barraclough et al. / Earth and Planetary Science Letters 202 (2002) 435^451442
the pH of atmospheric water droplets). The peaksmatch the time periods of known eruptions [43].For example, during the late Boreal, from ca 7191to 7099 BC, a period of elevated Hg AR occurs(431^437 cm, 2.6^3.5 Wg m32 yr31) which corre-sponds in time to a cluster of European erup-tions; Hengill (Iceland) ca 7180 BC, NemrutDagi (Turkey) ca 7087 BC, the West Eifel Vol-canic Field (Germany) and Pantelleria (Italy) ca7050 BC [43] as well as the Massif Central(France) at 8230V 140 14C yr BP [44]. The peakof 3.4^6.0 Wg m32 yr31 at ca 6876^6825 BC (415^411 cm depth) is likely to have been caused byeruptions of Kra£a (Iceland) ca 6850 and 6800BC and the peak of 4.2 Wg m32 yr31 at 405 cm(ca 6751 BC) by an eruption of unknown originobserved in the GISP2 sulphate record at ca 6721BC. The peak of 3.6^5.0 Wg m32 yr31 (393^389cm, ca 6611^6587 BC) could have been caused bytwo eruptions of unknown origin which appear inthe GISP2 sulphate record at ca 6614 and 6555BC and/or an eruption of Chaine des Puys,France, ca 6550 BC. Two more eruptions of un-known origin which appear in the GISP2 sulphaterecord at ca 6397 and 6360 BC could have causedthe peak (3.6 Wg m32 yr31) at 371 cm (6374 BC).The largest peak of the entire pro¢le (3.1^8.0 Wgm32 yr31, 355^347 cm depth, ca 6204^6117 BC)corresponds in time to another cluster of Euro-pean eruptions: Nemrut Dagi ca 6213 BC, Kar-apinar Field (Turkey) ca 6200 BC, Etna (Italy) ca6190 BC, Kra£a ca 6150 BC and Pantelleria ca6130 BC. The timing of the peak at 337 cm (3.0 Wgm32 yr31, ca 6003 BC) corresponds to an erup-tion of Chaine des Puys ca 6020 BC. The peak at329 cm (3.8 Wg m32 yr31, 5906 BC) was probablycaused by the eruption of Vesuvius ca 5960 BC,which was one of the largest eruptions of the last10 000 yr. The peak at 325 cm (2.8 Wg m32 yr31,ca 5856 BC) matches the time period of an erup-tion of Hekla, Iceland, ca 5850 BC. Another erup-tion of Nemrut Dagi, ca 5320 BC, could havecaused the peak at 293 cm depth (5.0 Wg m32
yr31, ca 5385 BC). Eruptions of Etna, Italy, ca5150, and Nemrut Dagi, ca 5085 and 5152 BC,correspond in time to the broad Hg peak (2.0^2.5 Wg m32 yr31) from 277^281 cm (ca 5092^5169 BC). However, because of the uncertainties
in the dating of both the peat samples and thevolcanic eruptions, it is not possible to say withcertainty which eruption caused which peak in HgAR.
Concentration peaks generally do not occur forother elements during this period, except for theaforementioned peaks in Ti and at 435 cm (ca7160 BC), where there is also an increase in zir-conium and rubidium concentrations, possiblydue to the eruption of the Massif Central at8230 V 140 14C yr BP [44], and at 375 cm (ca6416 BC), where zinc, zirconium, iron, manga-nese, nickel, lead and rubidium concentrationsare also high. At 295 cm, small peaks in zirco-nium and rubidium concentration are also pres-ent. In a replicate core from the same bog, apeak in gold concentration was found at 360cm [45], which corresponds well to the EGR2AHg peak at 355 cm. Except for the sets ofpeaks mentioned above, the peaks in Hg donot correspond to peaks in these other elements.Also, the ratios between lithogenic elements donot show any speci¢c change for the periods ofincreased Hg accumulation, which indicates thatdust deposition at EGR has the same mineralcomposition during periods with and without vol-canic eruptions. This indicates that Hg does notshare the fate of other elements emitted by vol-canic eruptions, with Hg being emitted as a gasand transported further from the source whereasthe other elements mentioned above form part ofthe ash fraction and are mostly regionally depos-ited.
Several regional volcanic eruptions are knownto have occurred during other periods covered bythe pro¢le apart from the late Boreal and OlderAtlantic. However, eruptions during the other pe-riods appear to have had much less in£uence onHg AR at Etang de la Grue're. The humi¢cationpro¢le from the EGR2A core (Roos-Barracloughet al., in preparation) shows that the late Borealand Older Atlantic were periods of unusually highe¡ective precipitation (precipitation^evapotrans-piration). Thus, it appears that the increased at-mospheric humidity during these periods intensi-¢ed the e¡ect of regional volcanic eruptions onHg AR, either by increasing the probability of aprecipitation event during the period of increased
EPSL 6334 29-8-02
F. Roos-Barraclough et al. / Earth and Planetary Science Letters 202 (2002) 435^451 443
atmospheric Hg concentration after an eruption,or more likely by providing additional atmospher-ic water droplets in which Hg is more readilyoxidised than it is in the gas phase. Hg oxidationrates have been shown to increase in humid air[46].
The rapidity of the increase and subsequent de-cline in Hg concentrations and AR indicated bythese sharp peaks indicates that there has beennegligible diagenetic migration of Hg in the peatpro¢le subsequent to its deposition from the at-mosphere. Thus, these peak forms support theargument that peat bogs faithfully preserve therecord of atmospheric Hg deposition, as suggestedby other workers [25,26].
Moving on to historical times, the most notablepeak in the Hg pro¢le is that of the industrialperiod at ca 1911 AD. Hg emission estimatesfor Switzerland [47] do not indicate high emis-sions during this time, so it is assumed that thisincrease was due to transboundary pollution,probably from coal burning, which peaked inFrance, the UK, Belgium, Austria and Germanyin 1912^1915 and then declined due to the out-break of the ¢rst world war (WWI)[48]. Theassumption that this peak in Hg pollution wasdominated by emissions from coal burning issupported by the existence of matching peaks (at20.5 cm, ca 1911) in Pb and As AR (44.7 and 7.5mg m32 yr31, respectively). Lead peaks at similardepths were also found in three replicate coresfrom Etang de la Grue're [49].
Coal production increased again in France, Bel-gium, Germany and the UK between the wars,whereas the Etang de la Grue're record shows rel-atively low Hg AR during this period. This is asurprising discrepancy, as pollution from coalburning would be expected to be dominated bythese major coal-producing nations, particularlyGermany, which borders Switzerland to the northand produced over 5 000 000 000 tons of coalbetween 1919 and 1937. Two of the countriesbordering Switzerland, Italy and Austria, pro-duced relatively little coal during this period.Italian coal production was low prior to WWI,peaked in 1918, decreased until 1931, then in-creased sharply to its 20th century maximum of4 908 000 tons in 1942 [48]. Thus, the Italian rec-
ord of coal production also does not ¢t well to theEtang de la Grue're Hg AR record. However,Austrian coal production peaked in 1915 at38 354 thousand metric tons per annum, butthen dropped dramatically to 2830 tons in 1920and, in contrast to that of other European coun-tries, remained low for the rest of the century.Minimum production was reached in 1945 (2138tons), followed by a slight increase until 1957(7029 tons) and then further decline [48]. There-fore one possible explanation for the form of theHg AR record at Etang de la Grue're is that Hgdeposition at the site was dominated by eastern/northeastern sources. Northeasterly is one oftwo dominant wind directions at Etang de laGrue're, forming ca 21% of the total [50]. Morestudies are required before this hypothesis can becon¢rmed.
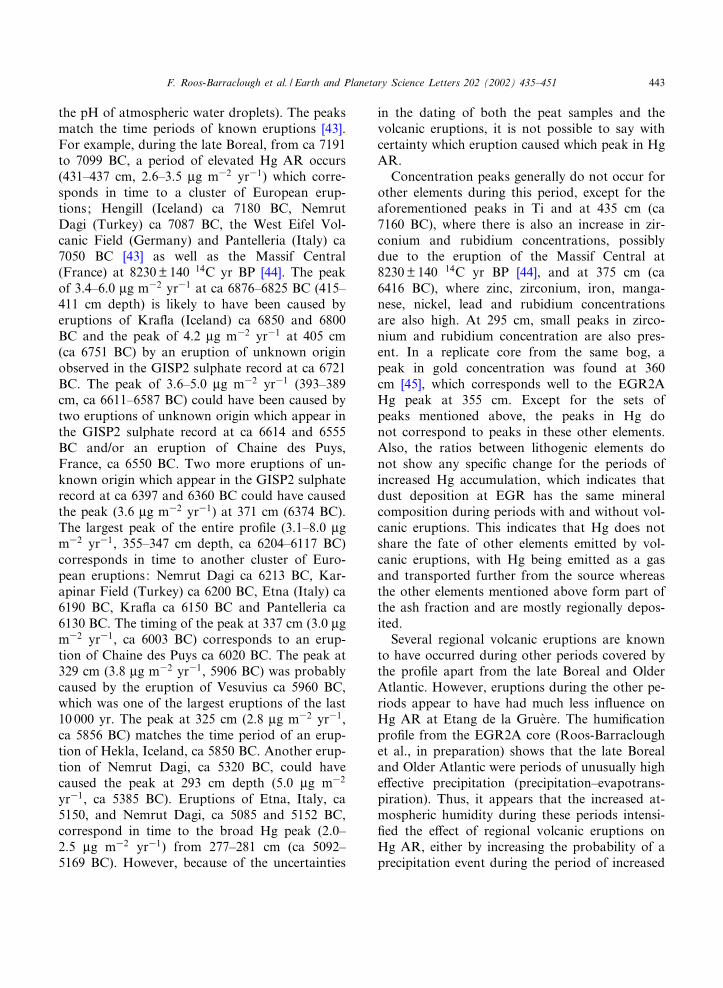
The Hg AR pro¢le ¢ts well with Swiss emissionestimates for the rest of the 20th century after theindustrial period peak at ca 1911, which supportsthe indication of the predominance of easterlypollution sources provided by the agreement ofthe pro¢le with the history of Austrian coal pro-duction. During the ¢rst part of the century afterthe peak at ca 1911, a slow increase in Hg AR isobserved in the pro¢le, corresponding to a grad-ual increase in Swiss emission estimates. Ca 20%of Swiss Hg emissions during this period arethought to have originated from coal burning inhomes [47]. The chlor-alkali industry and steelproduction were the main industrial contributorsto this gradual increase in emissions. High Hg ARduring the 1970s was caused by municipal rubbishincinerators, where measures to reduce emissionshave since been taken. Modern Hg emissionsfrom Switzerland are dominated by municipalrubbish incineration and the steel industry. Aus-trian emissions are presently ca a factor of 2 lessthan Swiss emissions [47,51]. Fig. 5 shows theagreement between the form of the Hg AR pro¢leat Etang de la Grue're and northeastern/easternpollution sources.
5.2. Titanium
The Ti pro¢le is shown in Fig. 4 to demonstratethat Hg AR is not greatly a¡ected by soil dust
EPSL 6334 29-8-02
F. Roos-Barraclough et al. / Earth and Planetary Science Letters 202 (2002) 435^451444
inputs. During the Younger Dryas, a 10-fold in-crease in soil dust (in combination with other ef-fects, such as lower temperature and probable in-creased oceanic emissions) resulted in a less than¢ve-fold increase in Hg AR, indicating that lessthan half of the Hg deposition was connectedwith soil dust inputs. Also, the increase in TiAR caused by the development of agriculturalpractices in Switzerland from ca 3600 BC didnot cause an increase in Hg AR.
5.3. Bromine
Of the 19 trace elements studied by XRF, onlyBr showed a correlation to the Hg pro¢le. (Nei-ther single nor multiple correlations of lithogenicelements to Hg were signi¢cant and adding litho-genic elements to the Hg^Br regression did notincrease the correlation signi¢cantly.) Br is pri-
marily supplied to the bog by precipitation [52].Although the geochemistry of Br in peat is notwell known, it appears to be retained in thepeat. A mass balance was used to compare themass of Br stored in four Etang de la Grue'repeat cores, including the EGR2A and EGR2Gcores, to the input of Br from precipitation. Usingthe concentration of chlorine in rainwater atEtang de la Grue're [29] and the ratio of Cl toBr in seawater [53], the concentration of Br inrainwater was calculated. This was multiplied bythe average annual precipitation at the site to givethe annual Br input from precipitation to 1 m2 ofthe bog surface. The average mass of Br stored by1 m2 of peat per year was calculated by multiply-ing the peat bulk density (g cm33) by the peat Brconcentration (Wg g31) for each slice, then sum-ming the result for the entire core and ¢nally di-viding the result by the number of years the corespanned. The results of the mass balances fromthe four Etang de la Grue're cores showed Br re-tention of between 55 and 70% over the last ca14 000 yr. This is an acceptable indicator of reten-tion when variations in precipitation over the timeperiod are taken into account (Roos-Barracloughet al., in preparation). The remainder is thoughtto be lost in runo¡ or as volatile organic com-pounds [54].
The majority of Br supplied to the bog is ex-pected to be oceanic in origin. The oceans supplythe atmosphere with Br not only from acidi¢edsea salt aerosols but also through biogenic (mac-roalgae) emissions of reactive organic Br spe-cies such as bromoform (CH3Br), CHBr2Cl,CHBr2Cl2, CH2BrCl and CH2Br2, compoundswhich dissociate by photolysis and reaction withOH on timescales of 2^3 weeks to several months.The resulting Br atoms react rapidly with ozone(O3) to form Br oxide radicals (BrOc) [55]although some reactive organic Br persists nearthe tropopause [56]. There are, however, also ter-restrial sources of atmospheric Br such as the re-lease of volatile methyl bromide (CH3Br) duringlitter decay due to the halogen-methylating abilityof wood-rotting fungi [57], biomass burning [58]and abiotic oxidation of organic matter [54].This abiotic production of volatile organic Brcompounds from Br3 has been observed in peat
Fig. 5. The record of Hg accumulation at Etang de laGrue're for the 20th century from core EGR2G (black line)is shown to match well with emission records of northeast-ern/eastern pollution sources. Austrian coal production [48](dotted shading) matches the form of the Hg AR record atEtang de la Grue're during the early part of the century,whereas Swiss Hg emissions [47] (solid shading) match theform of peat core record during the latter part of the cen-tury.
EPSL 6334 29-8-02
F. Roos-Barraclough et al. / Earth and Planetary Science Letters 202 (2002) 435^451 445
waters and is a possible re-release mechanism ofBr from peat.
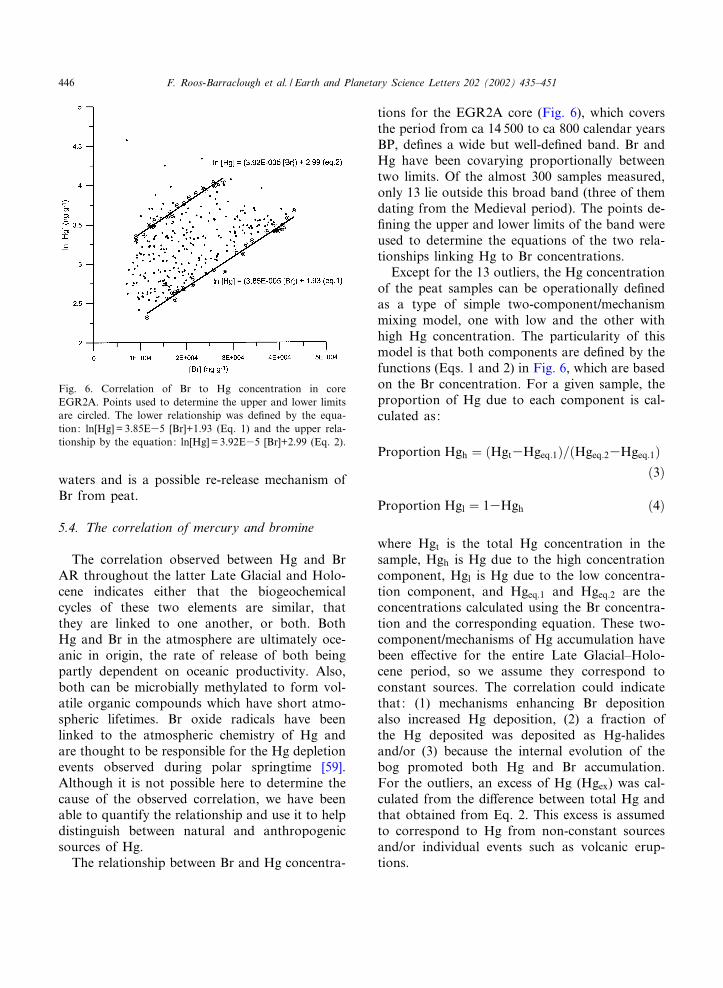
5.4. The correlation of mercury and bromine
The correlation observed between Hg and BrAR throughout the latter Late Glacial and Holo-cene indicates either that the biogeochemicalcycles of these two elements are similar, thatthey are linked to one another, or both. BothHg and Br in the atmosphere are ultimately oce-anic in origin, the rate of release of both beingpartly dependent on oceanic productivity. Also,both can be microbially methylated to form vol-atile organic compounds which have short atmo-spheric lifetimes. Br oxide radicals have beenlinked to the atmospheric chemistry of Hg andare thought to be responsible for the Hg depletionevents observed during polar springtime [59].Although it is not possible here to determine thecause of the observed correlation, we have beenable to quantify the relationship and use it to helpdistinguish between natural and anthropogenicsources of Hg.
The relationship between Br and Hg concentra-
tions for the EGR2A core (Fig. 6), which coversthe period from ca 14 500 to ca 800 calendar yearsBP, de¢nes a wide but well-de¢ned band. Br andHg have been covarying proportionally betweentwo limits. Of the almost 300 samples measured,only 13 lie outside this broad band (three of themdating from the Medieval period). The points de-¢ning the upper and lower limits of the band wereused to determine the equations of the two rela-tionships linking Hg to Br concentrations.
Except for the 13 outliers, the Hg concentrationof the peat samples can be operationally de¢nedas a type of simple two-component/mechanismmixing model, one with low and the other withhigh Hg concentration. The particularity of thismodel is that both components are de¢ned by thefunctions (Eqs. 1 and 2) in Fig. 6, which are basedon the Br concentration. For a given sample, theproportion of Hg due to each component is cal-culated as:
Proportion Hgh ¼ ðHgt3Hgeq:1Þ=ðHgeq:23Hgeq:1Þð3Þ
Proportion Hgl ¼ 13Hgh ð4Þ
where Hgt is the total Hg concentration in thesample, Hgh is Hg due to the high concentrationcomponent, Hgl is Hg due to the low concentra-tion component, and Hgeq:1 and Hgeq:2 are theconcentrations calculated using the Br concentra-tion and the corresponding equation. These two-component/mechanisms of Hg accumulation havebeen e¡ective for the entire Late Glacial^Holo-cene period, so we assume they correspond toconstant sources. The correlation could indicatethat: (1) mechanisms enhancing Br depositionalso increased Hg deposition, (2) a fraction ofthe Hg deposited was deposited as Hg-halidesand/or (3) because the internal evolution of thebog promoted both Hg and Br accumulation.For the outliers, an excess of Hg (Hgex) was cal-culated from the di¡erence between total Hg andthat obtained from Eq. 2. This excess is assumedto correspond to Hg from non-constant sourcesand/or individual events such as volcanic erup-tions.
Fig. 6. Correlation of Br to Hg concentration in coreEGR2A. Points used to determine the upper and lower limitsare circled. The lower relationship was de¢ned by the equa-tion: ln[Hg]= 3.85E35 [Br]+1.93 (Eq. 1) and the upper rela-tionship by the equation: ln[Hg] = 3.92E35 [Br]+2.99 (Eq. 2).
EPSL 6334 29-8-02
F. Roos-Barraclough et al. / Earth and Planetary Science Letters 202 (2002) 435^451446
The correlation to Br does not rule out theimportance of other atmospheric oxidants ofHg. It is possible that one of the relationshipsHgh or Hgl represents the variation of both Brand Hg input to the bog with variations in pre-cipitation. Precipitation can in£uence Hg deposi-tion not only because precipitation causes wash-out of particulate Hg from the atmosphere butalso because most oxidation reactions of atmo-spheric Hg (e.g. by O3, OHc, HOCl and OCl3)occur in atmospheric water [60]. The other rela-tionship may represent a true link between the Hgand Br cycles, involving the oxidation of atmo-spheric Hg (facilitating its removal from the at-mosphere) by reactive Br species such as BrOc.The deposition rates of other halogens couldalso be linked to those of Hg. However, at thistime we have no data for other halogens in con-tinental peats. Details of reactions of atmosphericHg with species of other halogens such as HOCland OCl3 are outlined in [60].
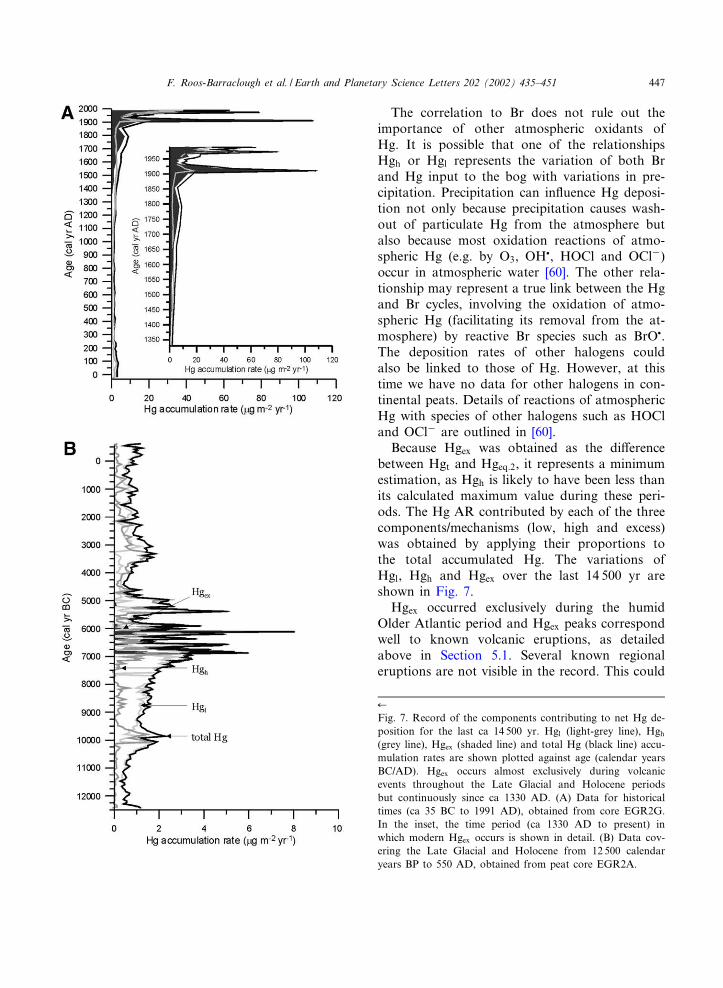
Because Hgex was obtained as the di¡erencebetween Hgt and Hgeq:2, it represents a minimumestimation, as Hgh is likely to have been less thanits calculated maximum value during these peri-ods. The Hg AR contributed by each of the threecomponents/mechanisms (low, high and excess)was obtained by applying their proportions tothe total accumulated Hg. The variations ofHgl, Hgh and Hgex over the last 14 500 yr areshown in Fig. 7.
Hgex occurred exclusively during the humidOlder Atlantic period and Hgex peaks correspondwell to known volcanic eruptions, as detailedabove in Section 5.1. Several known regionaleruptions are not visible in the record. This could
6
Fig. 7. Record of the components contributing to net Hg de-position for the last ca 14 500 yr. Hgl (light-grey line), Hgh
(grey line), Hgex (shaded line) and total Hg (black line) accu-mulation rates are shown plotted against age (calendar yearsBC/AD). Hgex occurs almost exclusively during volcanicevents throughout the Late Glacial and Holocene periodsbut continuously since ca 1330 AD. (A) Data for historicaltimes (ca 35 BC to 1991 AD), obtained from core EGR2G.In the inset, the time period (ca 1330 AD to present) inwhich modern Hgex occurs is shown in detail. (B) Data cov-ering the Late Glacial and Holocene from 12 500 calendaryears BP to 550 AD, obtained from peat core EGR2A.
EPSL 6334 29-8-02
F. Roos-Barraclough et al. / Earth and Planetary Science Letters 202 (2002) 435^451 447
simply be due to low Hg emissions but also tometeorological conditions around the time of theeruption. Wind patterns, atmospheric humidityand the timing of precipitation events could a¡ectthe in£uence an eruption had on Hg deposition atthe site.
5.5. Hgex : an indicator of anthropogenic mercurypollution
Hg and Br deposition were correlated withinthe limits of the relationships Hgl and Hgh
throughout the entire ca 14 000 yr period repre-sented by the EGR2A core except for a few shortperiods, which can mainly be attributed to vol-canic in£uences. This means that the relationshipscan be interpreted as de¢ning the range of naturalAR during periods of low volcanic in£uence andcan therefore be used to identify periods of un-naturally high Hg deposition, i.e. to separatenatural from anthropogenic Hg deposition. Theequations determined from the mainly pre-anthro-pogenic EGR2A record were used to calculateHgl, Hgh and Hgex for historical times from theEGR2G data (Fig. 7A).
Metallurgy certainly involved the use of Hgduring the Roman period, such as amalgamationfor gold and silver recovery, which was used asearly as 500 BC [61]. A peat core from the PenidoVello bog in northwest Spain showed a detailedrelationship between the record of accumulatedHg in the peat and mining and metallurgy inSpain back to the Celtic period [7]. Guilding ofsilver or brass using Hg is also described byVitruvius (50^26 BC) [62]. However, these smallindustries were apparently insu⁄cient to drive Hgdeposition in Switzerland beyond its naturalboundaries, as Hgex did not appear during histor-ical times until the Middle Ages, ca 1330 AD.Several contemporary texts [63]) describe variousmedical and industrial uses of Hg during the Mid-dle Ages. After ca 1330 AD, Hgex has been con-stantly present, indicating that Hg pollution hasoccurred ever since.
The period of time in which Hgex has beenpresent is enlarged in Fig. 7, inset to panel A.Hgex peaked at ca 1790 AD (7.0 Wg m32 yr31),then again at ca 1911 (90.3 Wg m32 yr31), when it
made up 84% of total Hg AR. After a decrease to4.1 Wg m32 yr31 ca 1937 (43.6% of total Hg), ageneral increase occurred until ca 1973, whenHgex AR is calculated as having been 45.2 Wgm32 yr31 (57.4% of total Hg AR). However,this low percentage of Hgex is caused by highHgh, which is due to an increase in anthropogenic[64] Br deposition during this period. Thus, thetrue component of anthropogenic Hg may behigher than Hgex. The same is true of the peakat ca 1988 (25.3 Wg m32 yr31, 40.1%).
6. Conclusions
A complete, 14 500 yr long record of Hg accu-mulation rates in peat has been obtained from abog in the Swiss Jura mountains. This is the ¢rstcomplete record of Hg accumulation from theLate Glacial to the present. It shows that thenatural component of the Hg cycle is variable,with natural Hg accumulation rates at the siteranging from 0.3 to 8.0 Wg m32 yr31 (a factorof 27) during the Holocene. This is in agreementwith the Penido Vello peat core record fromnorthwest Spain [7], which also indicated naturalvariations in the accumulation of Hg in peat inthe range of 1.5^8.0 Wg m32 yr31. A strong cli-matic signal was observed during the cold, dryYounger Dryas, when Hg accumulation increasedby ca 5 times. Volcanic eruptions appear to havebeen the cause of sharp peaks in Hg accumulationthroughout the late Boreal and Older Atlanticperiods, when high levels of e¡ective precipitationapparently intensi¢ed the e¡ect of regional erup-tions.
The highest Hg accumulation rates of the entirepro¢le were observed during the modern period,ca 1911 (107.6 Wg m32 yr31), 1973 (78.8 Wg m32
yr31) and 1988 (63.12 Wg m32 yr31). Whereas thepeak in the industrial period is thought to havebeen caused primarily by transboundary pollutionfrom coal [48], the upper part of the pro¢le (midand late 20th century) matches well with Swiss Hgemission estimates [47]. Hg accumulation rates atthe site are currently ca 15 times their historicalpre-industrial average.
Hg accumulation was shown to be mainly inde-
EPSL 6334 29-8-02
F. Roos-Barraclough et al. / Earth and Planetary Science Letters 202 (2002) 435^451448
pendent of soil dust accumulation (indicated byTi), but correlated well to Br accumulation forthe entire ca 14 000 yr long pre-anthropogenic pe-riod contained in the record. The limits of therange of this correlation were de¢ned. The fewshort periods during which Hg accumulation ex-ceeded the range of this correlation during pre-industrial times correspond to the dates of knownvolcanic eruptions. The range of net Hg accumu-lation rates de¢ned by the correlation to Br wasinterpreted as being representative of the range ofnatural net Hg accumulation rates during periodsof low volcanic in£uence. The occurrence of Hgex
was interpreted as being indicative of volcanic oranthropogenic in£uence.
The Br^Hg concentration relationships de¢nedin the older peat section were applied to the datafrom the surface peat core, which formed duringhistorical times. Hgex was present in the modernpro¢le from ca 1330 AD onwards, with majorpeaks occurring at ca 1911 (84% of total HgAR), 1973 (57.4%) and 1988 AD (40.1%).
The correlation of Hg to Br deposition suggeststhe possibility of a link between their geochemicalcycles, possibly through oxidation of elementalHg by reactive Br species in the atmosphere.Should this be the case, then anthropogenic emis-sions of reactive, Br-containing species could becontributing to enhanced atmospheric Hg deposi-tion rates.
Acknowledgements
Financial support for this work, including grad-uate student assistantship to F.R.B., was providedby the Swiss National Science Foundation(Grants 21-55669.98 and 21-061688.00) to W.S.The authors gratefully acknowledge Dr. W.O.van der Knaap, Dr. P. Steinmann, B. Eilrich, H.Haas, R. Mader, H.P. Ba«rtschi, C. Ammann, M.Dam, T.S. Hansen, I. Schru«fer-Kolb, Dr. A. Che-burkin, H. Kurzel, Dr. P. Appleby, Prof. J. Hei-nemeier and Dr. G. Bonani for help with ¢eld andlaboratory work and literature research. Thanksalso to Dr. D. Porcella, Prof. S.A. Norton and ananonymous reviewer for their comments, whichhelped to improve this manuscript.[BOYLE]
References
[1] F.M.M. Morel, A.M.L. Kraepiel, M. Amyot, The chem-ical cycle and bioaccumulation of mercury, Annu. Rev.Ecol. Syst. 29 (1998) 543^566.
[2] R. Mason, W. Fitzgerald, F. Morel, The biogeochemicalcycling of elemental mercury: Anthropogenic in£uences,Geochim. Cosmochim. Acta 58 (1994) 3191^3198.
[3] F. Riget, R. Dietz, P. Johansen, G. Asmund, Lead, cad-mium, mercury and selenium in Greenland marine biotaand sediments during AMAP phase 1, Sci. Total Environ.245 (2000) 3^14.
[4] P. Grandjean, P. Weihe, R.F. White, F. Debes, S. Araki,K. Yokoyama, K. Murata, N. S\rensen, R. Dahl, P.J.J\rgensen, Cognitive de¢cit in 7-year-old children withprenatal exposure to methylmercury, Neurotoxicol. Tera-tol. 19 (1997) 417^428.
[5] P. Johansen, T. Pars, P. Bjerregaard, Lead, cadmium,mercury and selenium intake by Greenlanders from localmarine food, Sci. Total Environ. 245 (2000) 187^194.
[6] W.F. Fitzgerald, D.R. Engstrom, R.P. Mason, E.A. Na-ter, The case for atmospheric mercury contamination inremote areas, Environ. Sci. Technol. 32 (1998) 1^7.
[7] A. Martinez-Cortizas, X. Pontevedra-Pombal, E. Garc|¤a-Rodeja, J.C. No¤voa-Mun‹oz, W. Shotyk, Mercury in aSpanish peat bog archive of climate change and atmo-spheric metal deposition, Science 284 (1999) 939^942.
[8] P.E. Rasmussen, Current methods of estimating atmo-spheric mercury £uxes in remote areas, Environ. Sci.Technol. 28 (1994) 2233^2241.
[9] F. Wania, D. Mackay, Tracking the distribution of per-sistent organic pollutants, Environ. Sci. Technol. 30(1996) 390A^396A.
[10] D. Mackay, F. Wania, W. Schroeder, Prospects for mod-elling the behaviour and fate of mercury, globally and inaquatic systems, Water Air Soil Pollut. 80 (1995) 941^950.
[11] M.S. Gustin, G.E.J. Taylor, R.A. Maxey, E¡ect of tem-perature and air movement on the £ux of elemental mer-cury from substrate to the atmosphere, J. Geophys. Res.102 (1997) 3891^3898.
[12] M.S. Gustin, R. Maxey, Mechanisms in£uencing the vol-atile loss of mercury from soil, in: Measurement of Toxicand Related Air Pollutants, Annual Conference Proceed-ings, Air and Waste Management Association, 1998.
[13] S.M. Siegel, B.Z. Siegel, Vegetation and the atmosphericcycling of mercury, Adv. Space Res. 3 (1983) 135^139.
[14] R. Ebinghaus, R.M. Tripathi, D. Wallschla«ger, S.E. Lind-berg, Natural and anthropogenic mercury sources andtheir impact on the air^surface exchange of mercury onregional and global scales, in: R. Ebinghaus, R.R. Turn-er, D. Lacerda, O. Vasiliev, W. Salomons (Eds.), MercuryContaminated Sites, Springer, Heidelberg, 1999.
[15] D.S. Ballantine, D.L. Finnegan, J.M. Phelan, W.H. Zol-ler, Measurement of Hg/S ratios from 5 volcanoes, EOSTrans. Am. Geophys. Union 63 (1982) 1152.
[16] R. Ferrara, B. Mazzloai, B. Lanzillotta, E. Nucaro, N.
EPSL 6334 29-8-02
F. Roos-Barraclough et al. / Earth and Planetary Science Letters 202 (2002) 435^451 449
Pirrone, Volcanoes as emission sources of atmosphericmercury in the Mediterranean basin, Sci. Total Environ.259 (2000) 115^121.
[17] H. Dedeurwaerder, G. Decadt, W. Baeyens, Estimationsof mercury £uxes emitted by Mount Etna volcano, Bull.Volcanol. 45 (1982) 191^196.
[18] J.P. Kim, W.F. Fitzgerald, Sea^air partitioning of mer-cury in the Equatorial Paci¢c Ocean, Science 231 (1986)1131.
[19] R. Pongratz, K.G. Heumann, Production of methylatedmercury, lead, and cadmium by marine bacteria as a sig-ni¢cant natural source for atmospheric heavy metals inpolar regions, Chemosphere 39 (1999) 89^102.
[20] G.M. Vandal, W.F. Fitzgerald, C.F. Boutron, J.P. Can-delone, Variations in mercury deposition to Antarcticaover the past 34,000 years, Nature 362 (1993) 621^623.
[21] G.M. Vandal, W.F. Fitzgerald, C.F. Boutron, J.P. Can-delone, Mercury in ancient ice and recent snow from theAntarctic, NATO ASI Ser., Ser. I 30 (Ice Core Studies ofGlobal Biogeochemical Cycles) (1995) 401^415.
[22] W.F. Fitzgerald, R.P. Mason, Biogeochemical cycling ofmercury in the marine environment, in: A. Sigel, H. Sigel(Eds.), Metal Ions in Biological Systems, Vol. 34: Mer-cury and its E¡ects on Environment and Biology, MarcelDekker, Basel, 1997, pp. 53^102.
[23] J.O. Nriagu, A global assessment of natural sources ofatmospheric trace metals, Nature 338 (1989) 47^49.
[24] W. Shotyk, Organic soils, in: I. Martin, W. Chesworth(Eds.), Weathering, Soils and Paleosols, Elsevier Science,Amsterdam, 1992, pp. 203^224.
[25] P. Phei¡er-Madsen, Peat bog records of atmospheric mer-cury deposition, Nature 293 (1981) 127^130.
[26] J. Benoit, W. Fitzgerald, A. Damman, The biogeochem-istry of an ombrotrophic bog: Evaluation of use as anarchive of atmospheric mercury deposition, Environ.Res. A 78 (1998) 118^133.
[27] S. Norton, G. Evans, J. Kahl, Comparison of Hg and Pb£uxes to hummocks and hollows of ombrotrophic BigHeath Bog and to nearby Sargent Mt. Pond, Maine,USA, Water Air Soil Pollut. 100 (1997) 271^286.
[28] J. Benoit, W. Fitzgerald, A. Damman, Historical atmo-spheric mercury deposition in the mid-continental U.S. asrecorded in an ombrotrophic peat bog, in: C. Watras, J.Huckabee (Eds.), Mercury Pollution: Integration andSynthesis, Lewis, Boca Raton, FL, 1994, pp. 187^202.
[29] P. Steinmann, W. Shotyk, Chemical composition, pH,and redox state of sulfur and iron in complete verticalporewater pro¢les from two Sphagnum peat bogs, Juramountains, Switzerland, Geochim. Cosmochim. Acta 61(1997) 1143^1163.
[30] J. Schulthess, P.D.F. Schweingruber, P.D.G. Furrer, DerEin£uss von Entwa«sserung auf die Bewaldung einesHochmoores, Diplomarbeit, Zurich, 1990.
[31] E. Wardenaar, A new hand tool for cutting peat, Can. J.Bot. 65 (1987) 1772^1773.
[32] E.-S. Deevey, Jr., Sampling lake sediments by use of the
Livingstone sampler, in: B. Kummel, D. Raup (Eds.),Handbook of Paleontological Techniques, W.H. Free-man, San Francisco, 1965, pp. 521^529.
[33] W. Shotyk, D. Weiss, M. Heisterkamp, A.K. Cheburkin,F.C. Adams, Evaluating a peat bog record of atmosphericlead pollution using Pb concentrations, isotopic composi-tion, and organolead species, Environ. Sci. Technol., inpress.
[34] A.K. Cheburkin, W. Shotyk, An Energy-dispersive Min-iprobe Multielement Analyzer (EMMA) for direct analy-sis of Pb and other trace elements in peats, Fresenius J.Anal. Chem. 354 (1996) 688^691.
[35] F. Roos-Barraclough, N. Givelet, A. Martinez-Cortizas,M.E. Goodsite, H. Biester, W. Shotyk, An analytical pro-tocol for the determination of total mercury concentra-tions in solid peat samples, Sci. Tot. Environ. 292(2002) 129^139.
[36] P. Appleby, P. Nolan, F. Old¢eld, N. Richardson, S.Higgitt, 210Pb dating of lake sediments and ombrotrophicpeats by gamma assay, Sci. Total Environ. 69 (1988) 157^177.
[37] M.E. Goodsite, W. Rom, J. Heinemeier, T. Lange, S. Ooi,P.G. Appleby, W. Shotyk, W.O. van der Knaap, C.Lohse, T.S. Hansen, High resolution AMS 14C dating ofpost bomb peat archives of atmospheric pollutants, Ra-diocarbon 43 (2001) 495^515.
[38] Th.R. Niklaus, G. Bonani, M. Simonius, M. Suter, W.Wol¢, CalibETH; an interactive computer program forcalibration of radiocarbon dates, Radiocarbon 34 (1992)483^492.
[39] M. Stuiver, P.J. Reimer, E. Bard, J.W. Beck, G.S. Burr,K.A. Hughen, B. Kromer, F.G. McCormac, J. van derPlicht, M. Spurk, INTCAL98 radiocarbon age calibration24,000^0 cal yr BP, Radiocarbon 40 (1998) 1041^1083.
[40] W. Shotyk, D. Weiss, J.D. Kramers, R. Frei, A.K. Che-burkin, M. Gloor, S. Reese, Geochemistry of the peat bogat Etang de la Grue're, Jura Moutains, Switzerland, andits record of atmospheric Pb and lithogenic trace metals(Sc, Ti, Y, Zr and REE) since 12,370 14C yr BP, Geochim.Cosmochim. Acta 65 (2001) 2337^2360.
[41] C. Burga, R. Perret, Vegetation und Klima der Schweizseit dem ju«ngeren Eiszeitalter, Otto Verlag, Thun, 1998,805 pp.
[42] J.C. Varekamp, P.R. Buseck, Global mercury £ux fromvolcanic and geothermal sources, Appl. Geochem. 1(1986) 65^73.
[43] T. Simkin, L. Siebert, Volcanoes of the World, Geosci-ence Press, Tucson, AZ, 1994, 349 pp.
[44] W. Shotyk, D. Weiss, P. Appleby, A. Cheburkin, R. Frei,M. Gloor, J. Kramers, S. Reese, W. van der Knaap, His-tory of atmospheric lead deposition since 12,370 14C yearBP from a peat bog, Jura Mountains, Switzerland, Sci-ence 281 (1998) 1635^1640.
[45] W. Shotyk, M. Krachler, A. Martinez-Cortizas, A.K.Cheburkin, H. Emons, A peat bog record of natural,pre-anthropogenic enrichments of trace elements in atmo-spheric aerosols since 12, 370 14C yr BP, and their varia-
EPSL 6334 29-8-02
F. Roos-Barraclough et al. / Earth and Planetary Science Letters 202 (2002) 435^451450
tion with Holocene climate change, Earth Planet, Sci.Lett. 199 (2002) 21^37.
[46] O. Lindqvist, H. Rodhe, Atmospheric mercury ^ a review,Tellus 37B (1985) 136^159.
[47] Vom Menschen verursachte Luftschadsto¡-Emissionen inder Schweiz von 1900 bis 2010, Schriftenreihe Umwelt Nr.256, Bundesamt fu«r Umwelt, Wald und Landschaft, Bern,1995, 122 pp.
[48] B.R. Mitchell, European Historical Statistics 1750^1975,Macmillan, London, 1980, 868 pp.
[49] W. Shotyk, Peat bog archives of atmospheric metal depo-sition: geochemical evaluation of peat pro¢les, naturalvariations in metal concentrations and metal enrichmentfactors, Environ. Rev. 4 (1996) 149^183.
[50] M. Joray, L’Etang de la Gruye're, Jura Bernoise: EtudePollenanalytiquue et Stratigraphique de la Tourbie're,Huber, Berne, 1942, 117 pp.
[51] B. Mayr, R. Orthofer, R. Schmidt, H. Steyskal, A. Wind-sperger, W. Winiwarter, Entwicklung der Schwermetal-lenemissionen fu«r Blei, Cadmium und Quecksilber fu«rdie Jahre 1985, 1990 und 1995 gema«ss CORINAIR-Sys-tematik, Seibersdorf Research Report, OEFZS-S-0006(1999) 133 pp.
[52] M. Go«rres, B. Frenzel, The Pb, Br and Ti content in peatbogs as an indicator for recent and past depositions, Na-turwissenschaften 80 (1993) 333^335.
[53] E.D. Goldberg (Ed.), Marine Chemistry, The Sea Vol. 5,J. Wiley, New York, 1974, 895 pp.
[54] F. Keppler, R. Eiden, V. Niedan, J. Pracht, H.F. Scho«ler,Halocarbons produced by natural oxidation processesduring degradation of organic matter, Nature 403 (2000)298^300.
[55] L. Carpenter, P. Liss, On temperate sources of bromo-
form and other reactive organic bromine gases, J. Geo-phys. Res. 105 (2000) 20539^20547.
[56] W.T. Sturges, D.E. Oram, L.J. Carpenter, S.A. Penkett,A. Engel, Bromoform as a source of stratospheric bro-mine, Geophys. Res. Lett. 27 (2000) 2081^2084.
[57] J. Lee-Taylor, E. Holland, Litter decomposition as a po-tential natural source of methyl bromide, J. Geophys.Res. 105 (2000) 8857^8864.
[58] M.O. Andreae, E. Atlas, G.W. Harris, G. Helas, A. deKock, R. Koppmann, W. Maenhaut, S. Man\, W.H. Pol-lock, J. Rudolph, D. Schar¡e, G. Schebeske, M. Welling,Methyl halide emissions from savanna ¢res in southernAfrica, J. Geophys. Res. Atmos. 101 (1996) 23603^23613.
[59] J.Y. Lu, W.H. Schroeder, L.A. Barrie, A. Ste¡en, H.E.Welch, K. Martin, L. Lockhart, R.V. Hunt, G. Boila, A.Richter, Magni¢cation of atmospheric mercury depositionto polar regions in springtime: the link to troposphericozone depletion chemistry, Geophys. Res. Lett. 28 (2001)3219^3222.
[60] C.-J. Lin, S.O. Pehkonen, The chemistry of atmosphericmercury: a review, Atmos. Environ. 33 (1999) 2067^2079.
[61] I. Olmez, M.R. Ames, Atmospheric mercury: How muchdo we really know? Pure Appl. Chem. 69 (1997) 35^40.
[62] J.W. Humphrey, J.P. Oleson, A.N. Sherwood, Greek andRoman Technology: a Sourcebook, Annotated transla-tions of Greek and Latin texts and documents, Routledge,London, 1998, 623 pp.
[63] L.J. Goldwater, Mercury: A History of Quicksilver, YorkPress, Baltimore, MD, 1972, 328 pp.
[64] P. Fraser, D. Oram, C. Reeves, S. Penkett, A. McCulloch,Southern hemispheric halon trends (1978^1998) and glob-al halon emission, J. Geophys. Res. 104 (1999) 15985^15999.
EPSL 6334 29-8-02
F. Roos-Barraclough et al. / Earth and Planetary Science Letters 202 (2002) 435^451 451


![References - Harvard John A. Paulson School of Engineering ...people.seas.harvard.edu/~salil/pseudorandomness/references.pdfInterscience [John Wiley & Sons], Second Edition, 2000](https://img.pdfslide.net/doc/110x75/5ec515d5e03fd12955497884/references-harvard-john-a-paulson-school-of-engineering-salilpseudorandomnessreferencespdf.jpg)