Embed Size (px)
Citation preview
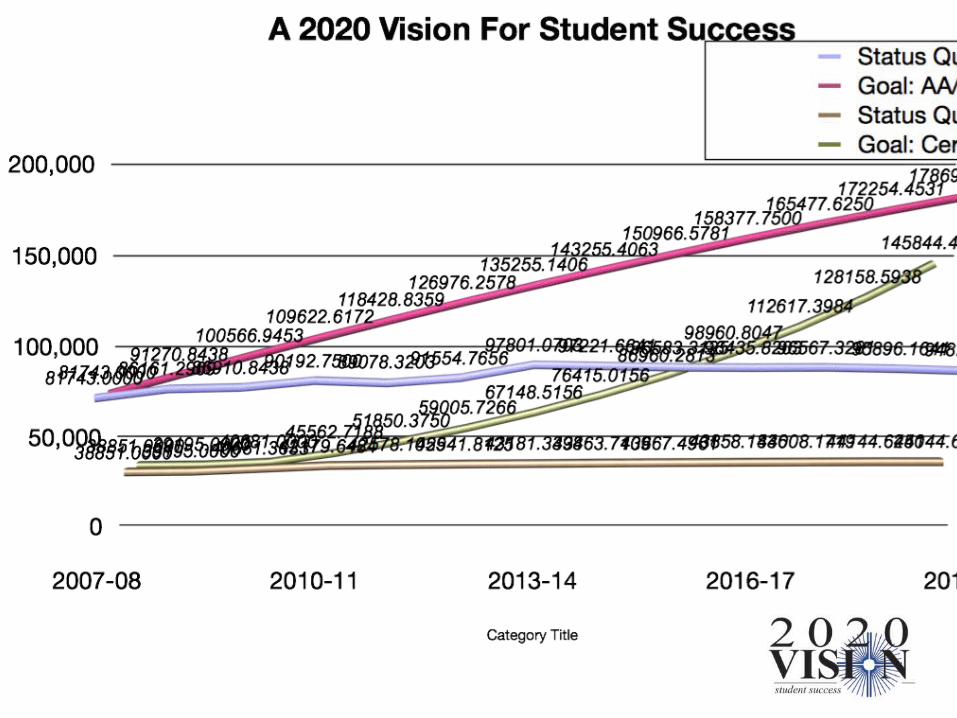
A 2020 Vision for Student Success
A report of the Commission on the Futureof the Community College League of California
The recent focus on student successis not
• an indictment of the work of community college faculty, staff and leaders.
• a political fad.• a rationale for cutting budgets.• pie in the sky.
The recent focus on student success is
• economically necessary• morally incumbent• achievable

Once first in the world, America now ranks 10th in the percentage of young adults with a college degree.
For the first time in our history, the current generation of college-age Americans will be less educated than their parents’ generation – unless things change quickly.
America is losing ground internationally
Economically necessary

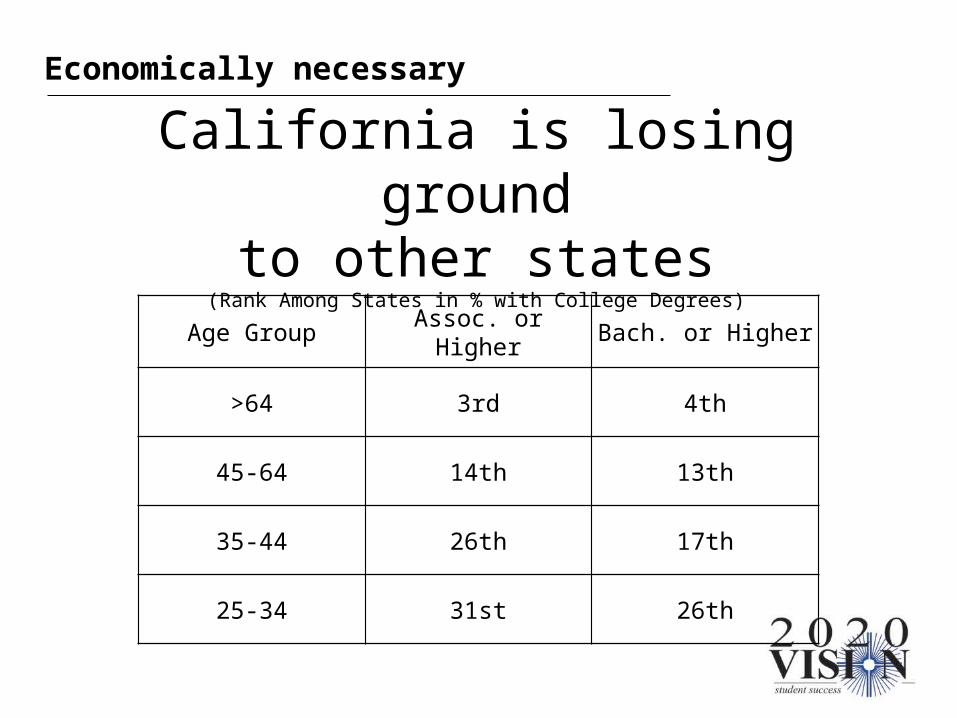
California is losing groundto other states
(Rank Among States in % with College Degrees)
Age Group Assoc. or Higher Bach. or Higher
>64 3rd 4th
45-64 14th 13th
35-44 26th 17th
25-34 31st 26th
Economically necessary
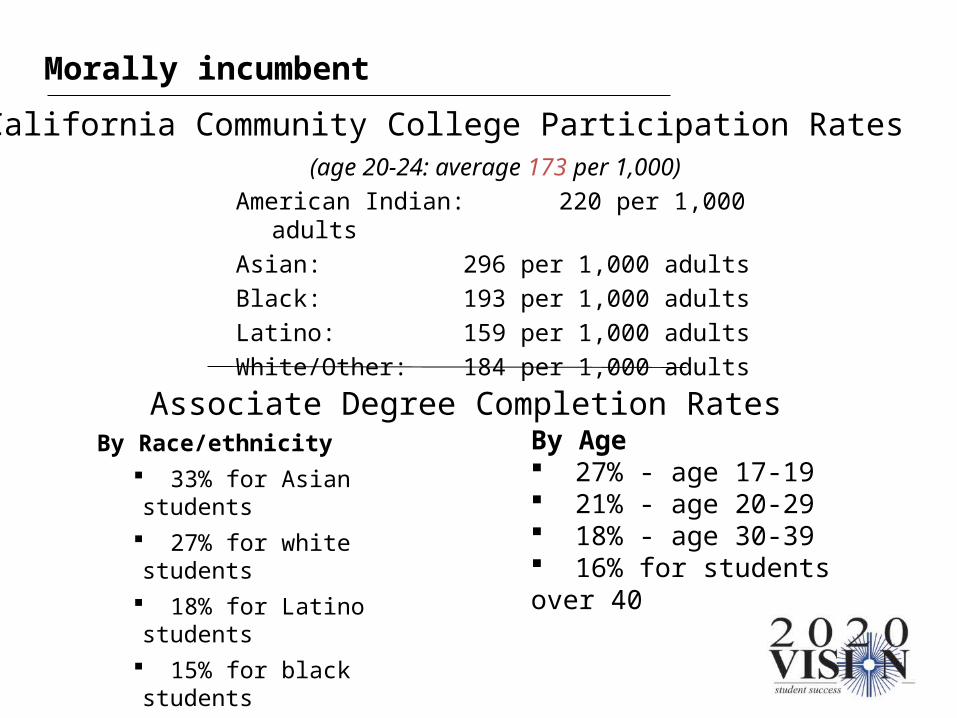
By Race/ethnicity 33% for Asian students 27% for white students 18% for Latino students 15% for black students
Morally incumbent
By Age 27% - age 17-19 21% - age 20-29 18% - age 30-39 16% for students over 40
Associate Degree Completion Rates
California Community College Participation Rates(age 20-24: average 173 per 1,000)
American Indian: 220 per 1,000 adultsAsian: 296 per 1,000 adultsBlack: 193 per 1,000 adultsLatino: 159 per 1,000 adultsWhite/Other: 184 per 1,000 adults


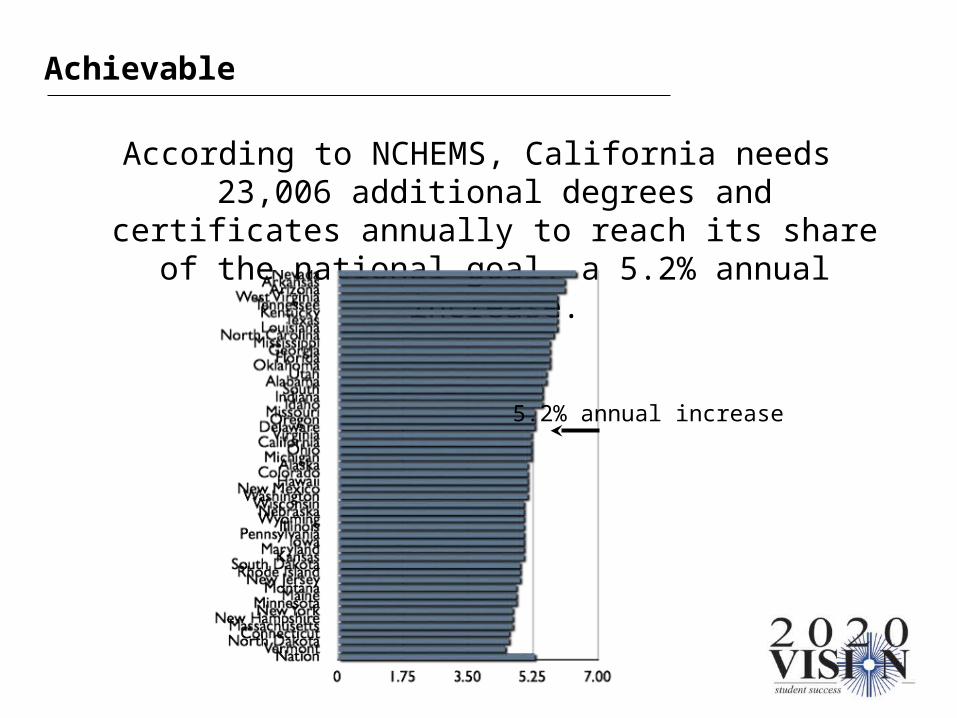
According to NCHEMS, California needs 23,006 additional degrees and certificates annually to
reach its share of the national goal, a 5.2% annual increase.
5.2% annual increase
Achievable
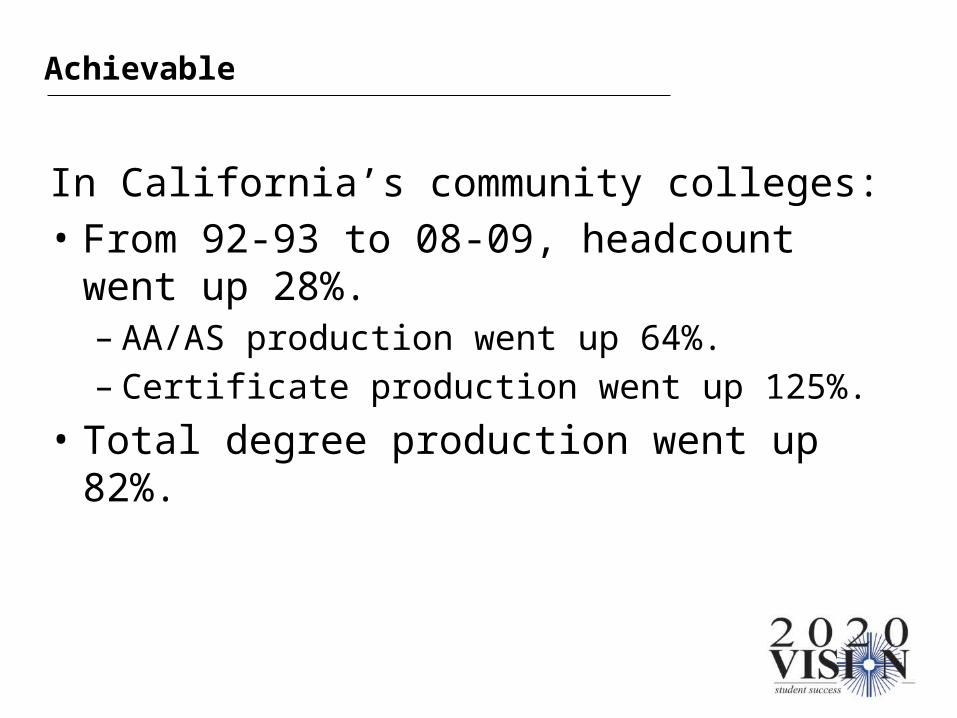
In California’s community colleges:• From 92-93 to 08-09, headcount
went up 28%.– AA/AS production went up 64%.– Certificate production went up 125%.
• Total degree production went up 82%.
Achievable
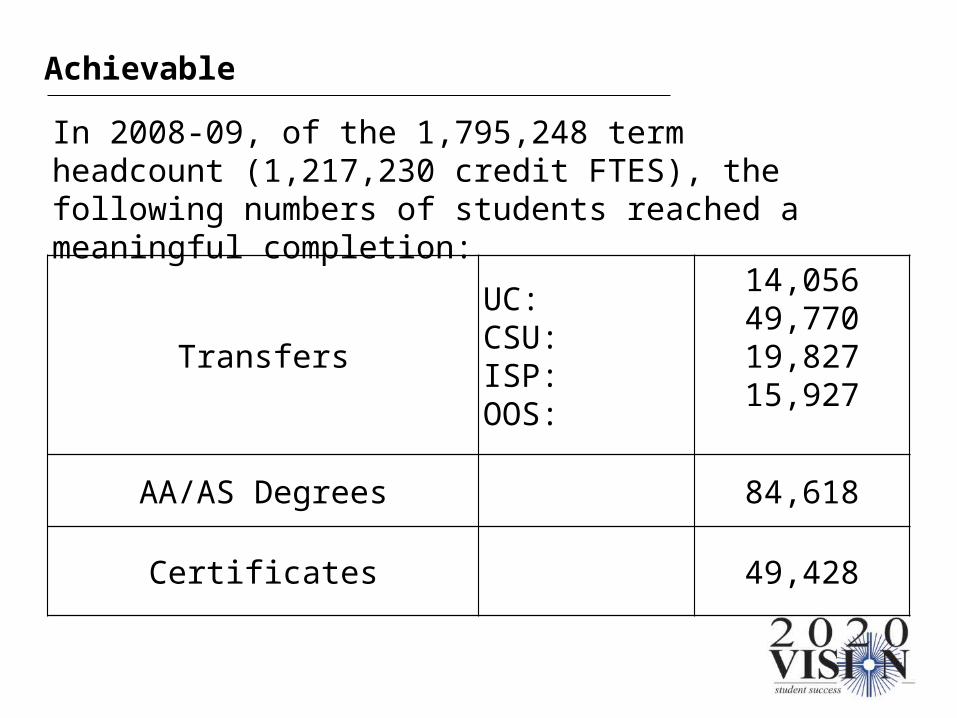
Transfers
UC:CSU:ISP:OOS:
14,05649,77019,82715,927
AA/AS Degrees 84,618
Certificates 49,428
Achievable
In 2008-09, of the 1,795,248 term headcount (1,217,230 credit FTES), the following numbers of students reached a meaningful completion:
Achievable
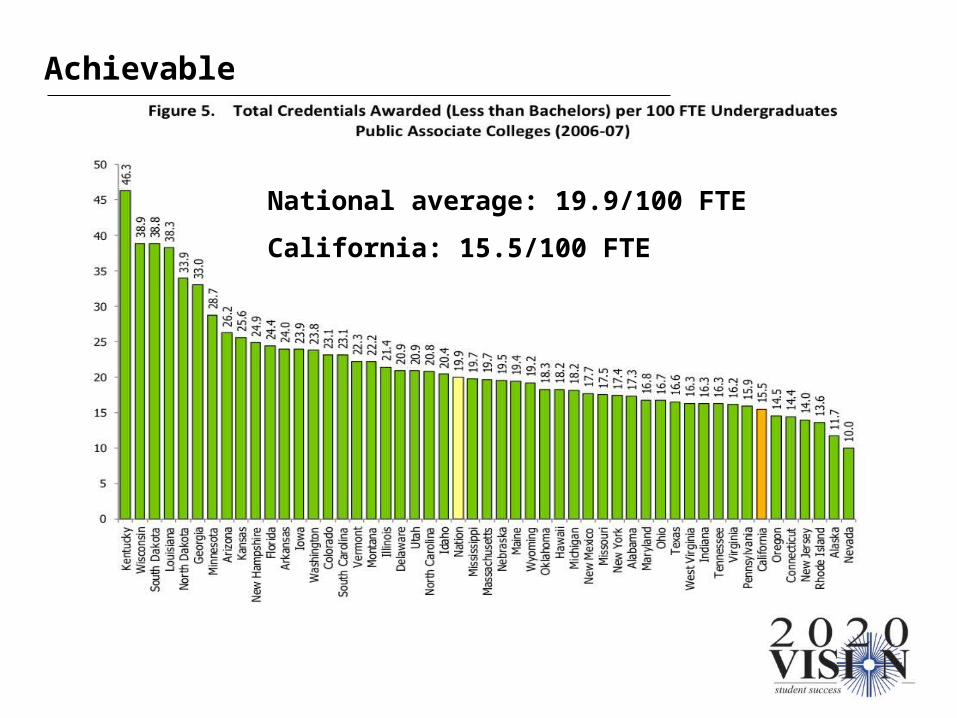
National average: 19.9/100 FTE
California: 15.5/100 FTE
We can improve student success
and maintain access.
California’s advantages• Best network of colleges.• Low baseline.• Huge student population.• High public/legislative respect for
community colleges.
California’s disadvantages
• Complexity of student population, institutions and regions.
• Politically driven system.• Limited funding sources.• Difficulty of statewide and regional
coordination.

Commissionon the Future
Objective
Publish a report identifying policy and practice changes that, if
incorporated, could be reasonably implemented by 2020 and would measurably increase community college student achievement in quality degree, certificate, and
transfer programs.
The Vision:
In California, all residents have the opportunity to complete a quality postsecondary
education in a timely manner.
• Access - California should continue to lead the nation in participation.
• Success - Programs and support services should be designed to maximize the ability of students to complete a postsecondary education.
• Equity - Access and success should regularly be monitored in a disaggregated manner and interventions to close achievement gaps should be a campus priority.
The Goals
• Success: California’s community colleges will increase completions by 1 million by 2020.
• Access: California’s community colleges will close participation rate gaps.
• Equity: California’s community colleges will eliminate the achievement gap among enrolled students.
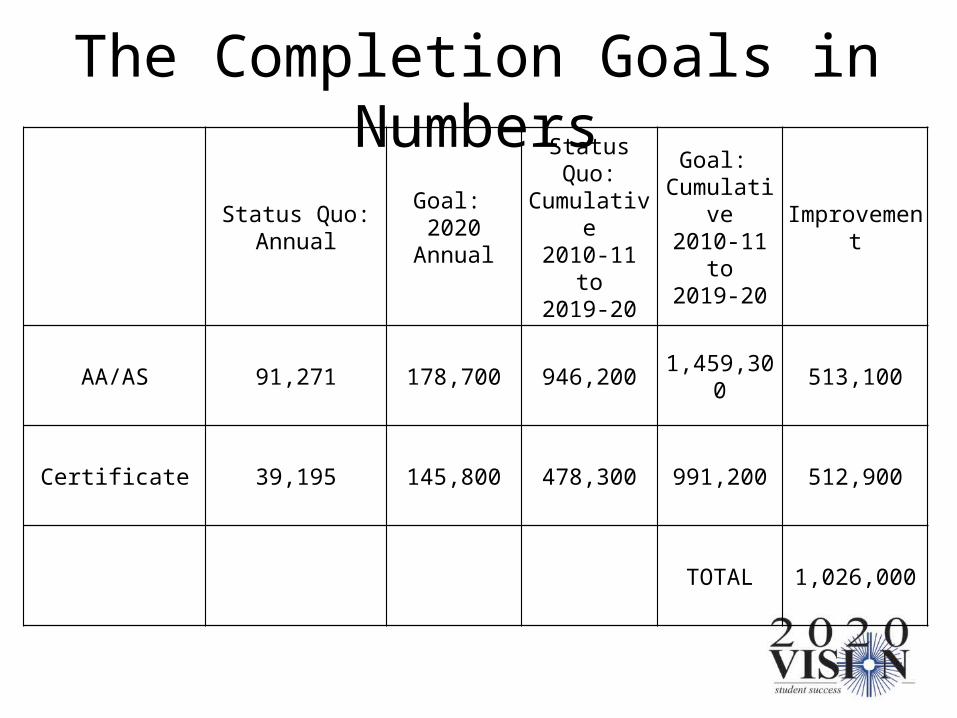
The Completion Goals in Numbers
Status Quo: Annual
Goal: 2020
Annual
Status Quo:
Cumulative
2010-11 to2019-20
Goal: Cumulativ
e2010-11
to2019-20
Improvement
AA/AS 91,271 178,700 946,200 1,459,300 513,100
Certificate 39,195 145,800 478,300 991,200 512,900
TOTAL 1,026,000
Recommendations Process
• Three two-day meetings– Iterative subgroup process, beginning
with a policy matrix of internal and external policy options.
• Confidential voting resulting in recommendations only with significant support.
• Many of the recommendations are “launching points” for more work.
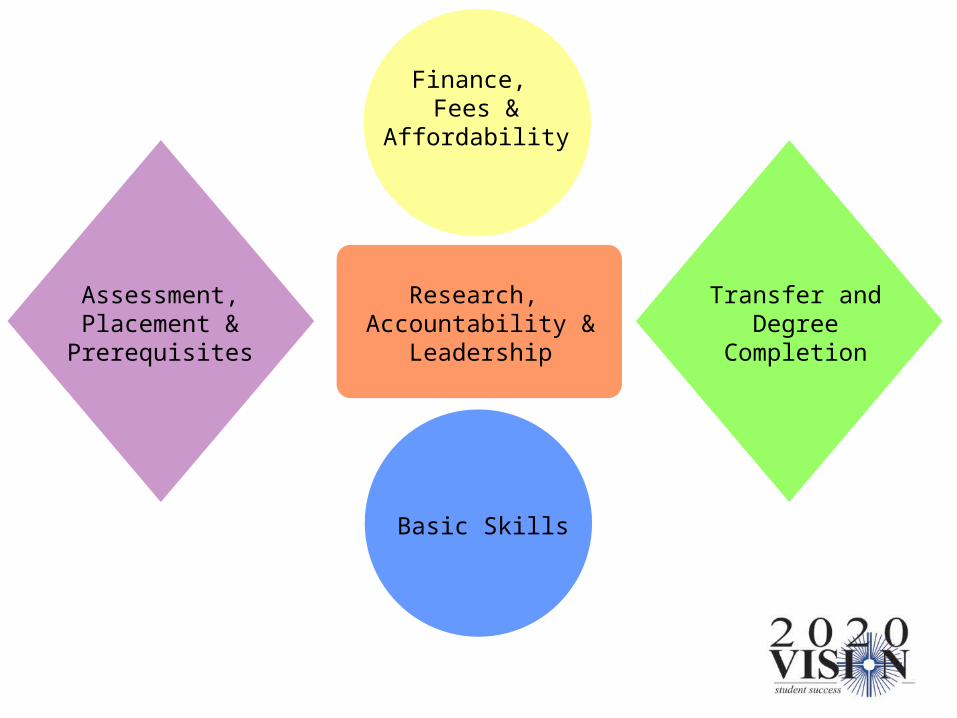
Basic Skills
Transfer andDegree
Completion
Assessment,Placement &Prerequisites
Finance, Fees &
Affordability
Research, Accountability &
Leadership
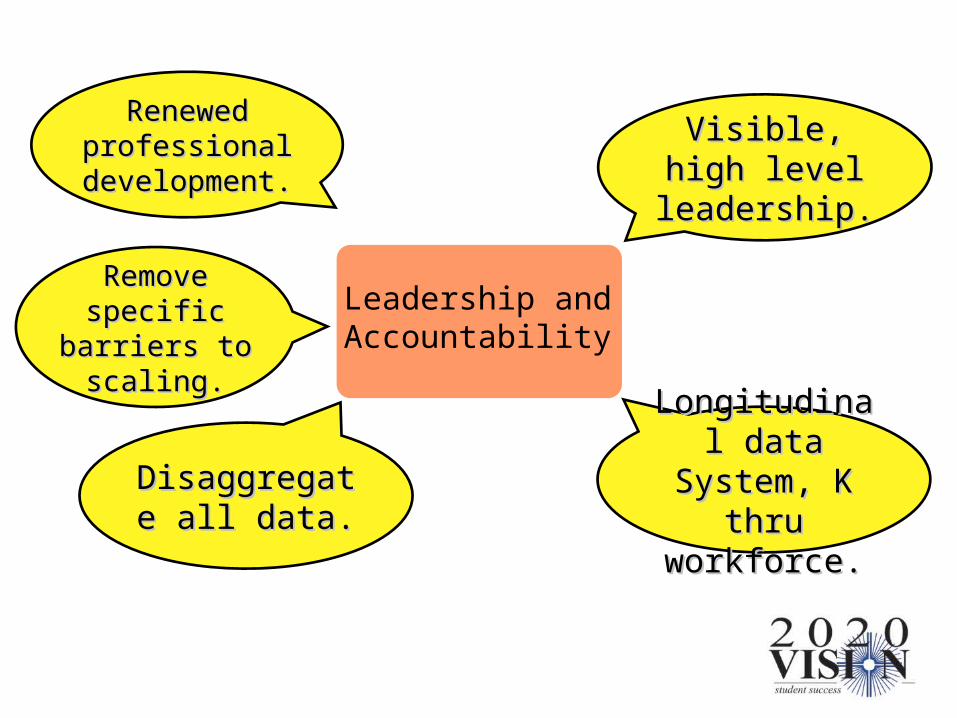
Visible, high level Visible, high level leadership.leadership.
Leadership andAccountability
Longitudinal data Longitudinal data System, K thru System, K thru
workforce.workforce.Disaggregate all Disaggregate all
data.data.
Remove specificRemove specificbarriers to barriers to
scaling.scaling.
Renewed Renewed professional professional
development.development.
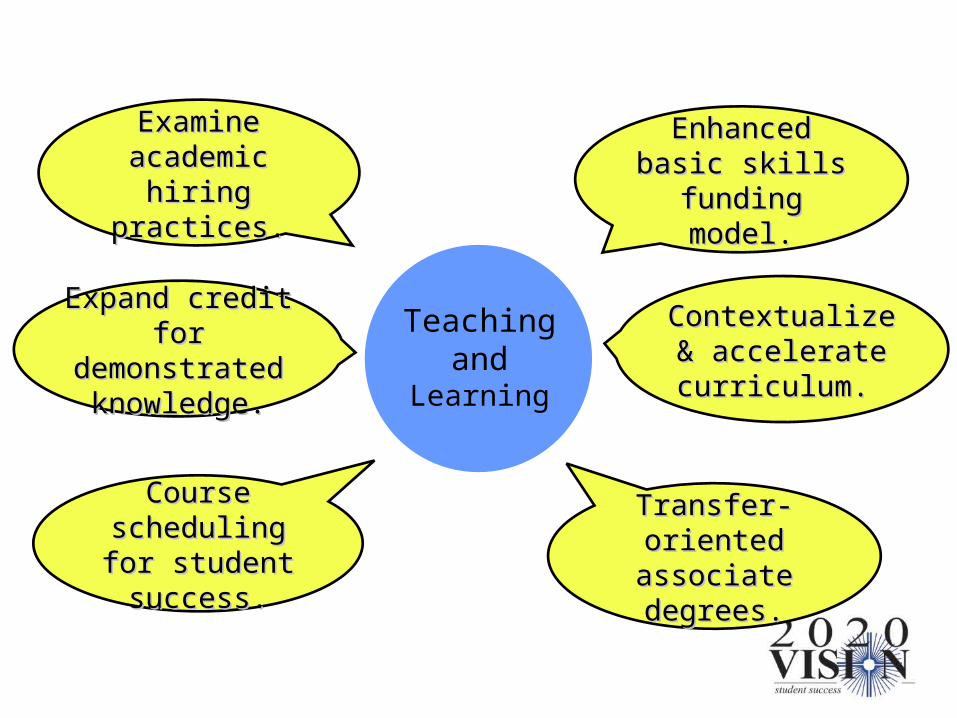
Teaching and
Learning
Enhanced basic Enhanced basic skills funding skills funding
model.model.
Contextualize & Contextualize & accelerate accelerate
curriculum. curriculum.
Transfer-oriented Transfer-oriented associate degrees.associate degrees.
Course scheduling Course scheduling for student for student
success.success.
Expand credit for Expand credit for demonstrated demonstrated
knowledge.knowledge.
Examine academic Examine academic hiring practices.hiring practices.
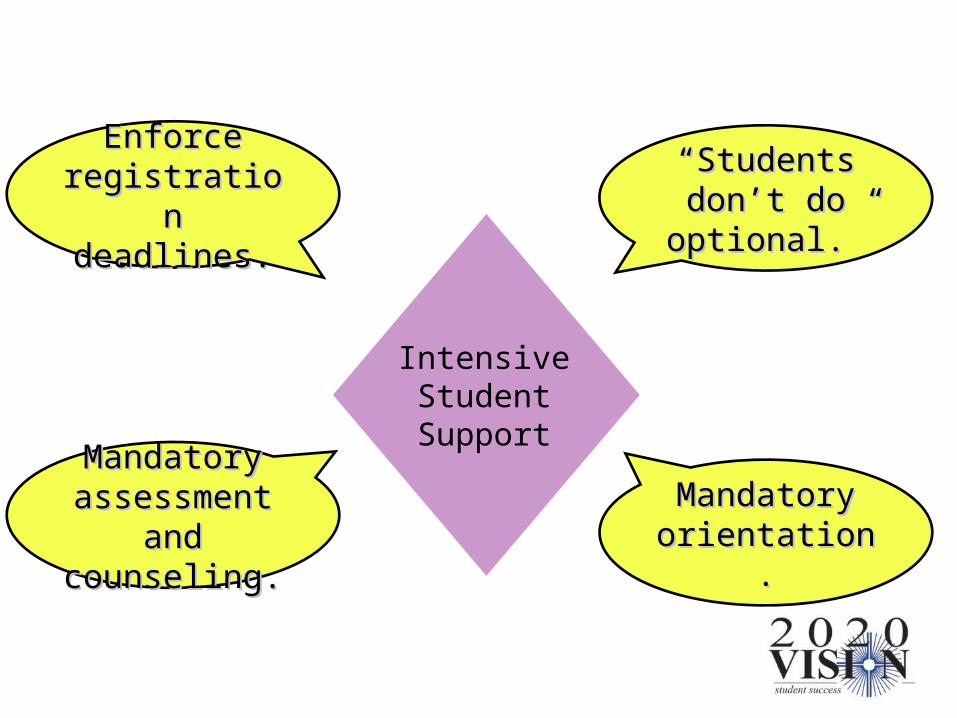
IntensiveStudentSupport
Mandatory Mandatory assessment and assessment and
counseling.counseling.Mandatory Mandatory orientation.orientation.
Enforce Enforce registration registration deadlines.deadlines.
““Students don’t Students don’t do optional.”do optional.”
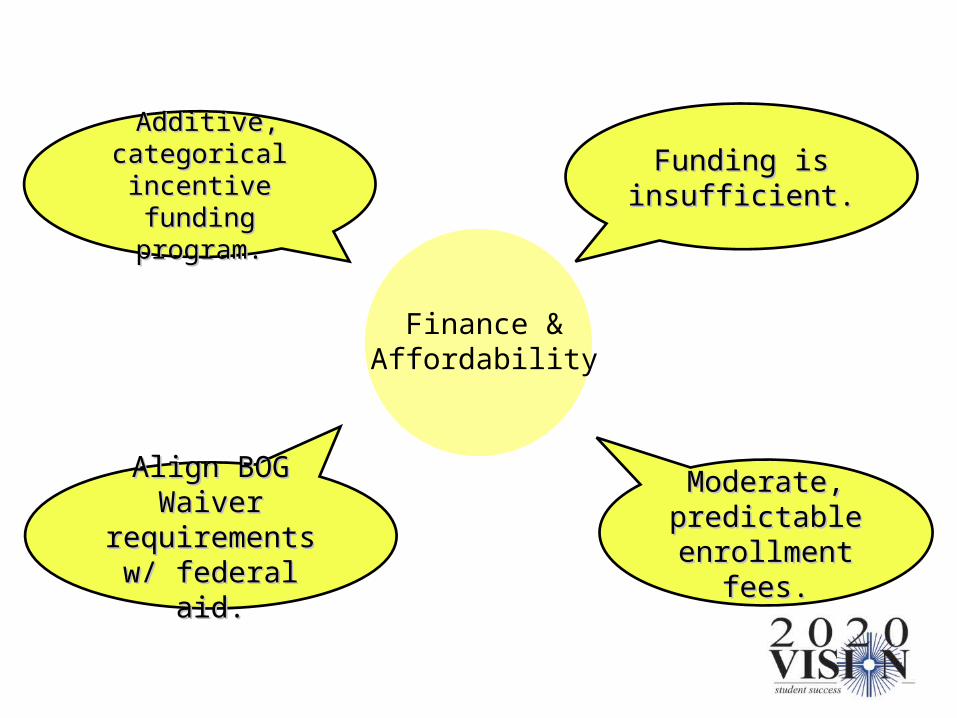
Finance &Affordability
Moderate, Moderate, predictable predictable
enrollment fees.enrollment fees.
Align BOG Waiver Align BOG Waiver requirements w/ requirements w/
federal aid.federal aid.
Additive, categorical Additive, categorical incentive funding incentive funding
program.program.
Funding is Funding is insufficient.insufficient.