Embed Size (px)
Citation preview

1
A BACKGROUND ANALYSIS OF THE NIGERIAN AGRICULTURAL SECTOR (1998 TO 2007)
BY INNOCENT AZIH CONSULTANT
FOR
OXFAM NOVIB ECONOMIC JUSTICE CAMPAIGN IN AGRICULTURE
NOVEMBER, 2008
2
TABLE OF CONTENTS 1.0 Introduction 5
1.1 General Objectives 1.2Specific Objectives and Terms of Reference 5 1.3 Background of the Study
2.0 Methodology 6 3.0 Background of Nigerian Agriculture 7 3.1 Introduction 7 3.2 An overview of Nigeria Agriculture 7 3.2.1 Historical Overview (1960s -1997s) 7 3.2.2 Overview of the Current Period (1998-2008) 8 3.2.3 General and persistent constrains of the sector 8 3.3 Agriculture Policy Review 11 3.3.1 Short Historical overview (1960-1998) 11 3.3.2 Overview of Current Policy Period (1998-2008) 12 3.3.3 Policy Instruments and Programs 13 3.3.4 Subsector policy instruments 15 3.4 National Agricultural Production and Productivity Outlook 18 3.4.1 Output, Growth and Productivity 18 3.4.2 Gender in Agricultural Production in Nigeria 20 3.4.3 Commodity Markets and Food Prices 21 3.4.4 Agricultural Exports and Imports 22 3.4.5 Agricultural Inputs 22 3.5 Agricultural Funding (Public and Private Investment) 24 3.5.1 Public investments and capital budgets for Agriculture 24 3.5.2 Private funding and investment 26 3.5.3 External Sources of finance: Donor intervention 27 3.5.4 Challenges to Donor Funding 28 3.6 Institutional Setting 29 3.6.1 Ministries, Departments and Agencies 29 3.6.1 Research Institutions 29 3.7 The Private sector and Civil Society in Nigerian Agriculture 29 3.7.1 Constraints of Private sector in the Agriculture sector 30 3.7.2 Agro-industrial activities 31 3.7.3 Agricultural Entrepreneurship Development 32 3.7.4 Non-Agricultural Private sector 32 3.7.5 The Civil Society 32 3.8 The Future Development of Nigerian Agriculture 33 3.8.1 The Drivers of Growth 33 3.8.2 Large Scale versus Small scale Agriculture in Nigeria 34 3.8.3 Food Security future 35 4.0 Summary, Conclusions and Recommendations 36 4.1 Summary 36 4.2 Conclusions 40 4.3 Recommendations and Entry Points for Advocacy 41 4.3.1Themes and Topics for EJ Campaign 41 4.3.2 Policy and Other related Issues for Lobby and Advocacy 42 4.3.3 Opportunities and threats in Lobby and Advocacy 43 4.3.4 Sustaining the EJ Campaign/Intervention 43 References 44 Appendix 46
3
Abbreviations/Acronyms ACGS Agricultural Guaranteed Credit Scheme ACP African Caribbean and Pacific countries ACGSF Agricultural Credit Guarantee Scheme Fund ADP Agricultural Development Program AfDB African Development Bank AGOA Africa Growth and Opportunity Act AGRA Alliance for Green Revolution in Africa AIAE African Institute of Applied Economics CAADP Comprehensive African Agriculture Development Programme CBARD Community-based Agriculture and Rural Development Programme CBN Central Bank of Nigeria CBO Community based organization CRIN Cocoa Research Institute of Nigeria CSO Civil Society Organization DFID Department of International Development ECOWAS Economic Community for West African Countries ECOWAP ECOWAS Agricultural Policy EEG Export Expansion Grant EJ Economic Justice EU European Union FAO Food and Agriculture Organization FBN First Bank of Nigeria FFD Federal Fertilizer Department FIF Food and Infrastructure Foundation FMARD Federal Ministry of Agriculture and Rural Development G8 Group of 8 developed nations GDP Gross Domestic Product GSM Global system for mobile communications IAR Institute of Agricultural Research IDA International Development Assistance IFAD International Fund for Agricultural Development IFDC International Fertilizer Development Center IITA International Institute for Tropical Agriculture ILRI International Livestock Research Institute MDA Ministries Departments and Agencies NACRDB Nigerian Agricultural Cooperative and Rural Development Bank NAFPP National Accelerated Food Production Programme NAIC Nigerian Agricultural Insurance Corporation NBS National Bureau of Statistics NCRI National Cereals Research Institute NEEDS National Economic Empowerment and Development Strategy NEPAD New Partnership for African Development NESG Nigerian Economic Summit Group NGO Non-governmental Organization NIFOR Nigerian Institute for Oil palm Research NIHORT Nigerian Institute for Horticultural Research NSS National Seed Service ODA Overseas Development Assistance OECD Overseas Economic Cooperation and Development OFN Operation Feed the Nation OPS Organized Private sector PCU Projects Coordinating Unit RBDA River Basin Development Authority RTEP Root and Tuber crops Expansion Program
4
SAP Structural Adjustment Programme UN United Nations UNDP United Nation Development Program USAID United States Agency for International Development VAT Value-Added Tax WIA Women in Agriculture WTO World Trade Organization List of Tables
Table 1 Sector Growth Rates 8 Table 2 Table 2 % Share of Gross Domestic Product at 1990 Constant Prices 9 Table 3 National and Agricultural Budgets and Fertilizer Subsidy Cost,1990 – 2001 16 Table 4 Index of Agricultural Production by Type of Activity (1990 = 100) in ’million MT 18 Table 5 Smallholder Tuber production and areas cultivated (1999-2007 18 Table 6: Livestock and fishery production in Nigeria (2002-2007) 19 Table 7. Tuber Crops Productivity (‘000 tons/ha) 20 Table 8 Employment in crop farming by sex 21 Table 9. Rice Production versus Importation in Nigeria 22 Table 10. Agriculture Share of Federal Government budget (2003 -2007) in N’ billions 25 Table 11. Agriculture share of Federal sectoral Budget provisions (2005-2007) 26 Table 12 Agriculture Share of States Budgets (2003-2007) 26 Table 13. Matrix of constraints to Agricultural private enterprise in Nigeria 31 Table 14. Community Banks’ Sectoral Distribution of loans and advances (in N’ millions) 40 Table 15 Cash Crops Production & Area planted (2003-2007) 40 Table 16 Summary of Import by Standard International Classification (in %) 40 Table 17 Year wise Fertilizer Import and Private Sector Market Share 41
Table 18 Capital Budget for Agriculture by Federal and 1States governments (N’billions) 46
Table 19 Nat. Maize and Millet Crop, Production, Area, Yield figures and farmgate prices 46
List of Figures Figure 1 Cereals Prices, Dawanu, Kano (August 2003-April, 2008) 21 Figure 2 Fertilizer Production, Importation and Consumption (1993 – 20041) 23 Figure 3 Fertilizer consumption per ha in Nigeria 24 Figure 4 Agriculture Share of total loans of commercial banks in Nigeria 26 Figure 5 ODA Finance of Agriculture in Nigeria 27 Figure 6 Percentage Agriculture ODA in total ODA to Nigeria by Multilateral agencies 28 Figure 7 National Root and Tuber crops production changes (1997-2003) 48 Figure 8 National Cereals production changes (1997-2003) 48 Figure 9 National Legumes production changes (1997-2003) 49 Figure 10 National Crop Productivity (‘000 tons/ha) 49
5
1.0 Introduction OXFAM International, as part of expanding its development-oriented activities in Nigeria and the West Africa sub-region, is embarking on a socio-economic development projects in Nigeria and Burkina Faso. The project, called Economic Justice Campaign, runs from 2008 till 2012 focusing on Sustainable Rural Livelihoods and centering around three core themes: agriculture, trade and climate change as well as the linkages between these issues. In addition, gender issues and gender dimensions as cross cutting features would be mainstreamed throughout all elements of the EJ Campaign. The regional level West Africa EJ campaign, with agriculture as its priority, desires to identify the relevant entry points for an EJ campaign in the Nigerian context by first understanding Nigerian agriculture through background information in the sector as well as the civil society actors working in the sector in Nigeria. This informed this work. A mapping of civil society actors is also considered very essential for the campaign because Oxfam wants to campaign in the South by supporting (both technically and financially) its partners and allies instead of direct intervention with state activities. Southern advocacy and campaign by partners are, in turn, complementary to direct Oxfam campaigns in international fora and discussions such as the G8, WTO, and UN. 1.1. General Objective The general objective is to identify the opportunities and challenges for the future Oxfam International’s Economic Justice (EJ) Campaign in Nigeria and in particular the agricultural agenda of the campaign (taking into account the linkages and interrelationships with the two other pillars- climate change and trade). This initial study, also proposes some relevant and useful issues as targets for lobbying and advocacy activities in an EJ Campaign in the Nigerian context. 1.2. Specific Objectives / Terms of Reference
The specific objectives of this work are in three structured parts, covered under the following:
a. An analysis of the growth and development of the Nigerian agricultural sector emphasized with key statistics on output, productivity, exports and imports, public and private investment, etc with respect to the main agricultural products. It sought to explicitly present some of the key factors that have hampered or promoted growth of the agricultural sector in Nigeria.
b. A description of key public policies and reforms that have shaped the agricultural sector in Nigeria in recent years and a critical assessment of the policies as to their success or failures, and reasons for such development.
c. Discuss the role of the private sector along the different roles of stakeholders under first a public-private sector partnership and of course as an entrepreneurship opportunity sector as well as the place of agribusiness and gender in Nigerian agriculture.
d. Discuss the food security dimension in the light of policy prescriptions and food price instability
e. Finally a discussion of the future development of the agricultural sector was attempted considering the growth drivers and the next most likely evolution trajectory of the sector in the light of current events and dominant policies and dynamics.
6
2.0 Methodology The work has been principally a desk search of existing information on the dynamics of Nigerian agriculture sector over the 1998-2008 in publications and information engines in respect of documented data on the areas proposed for the research. It also embellished it with information on earlier decades of agriculture in Nigeria. This collection of secondary data based on a review of the existing literature was complemented with a simple interview of a few selected key operators, stakeholder individuals and public officials as well as think-tanks and some local academics. Therefore, the first part of the work is a factual background socio-economic analysis of the agricultural sector in Nigeria, covering the development and state of the sector during the last ten years. It has been sub-structured to include
(i) An overview of key public policies and reforms that have shaped the agricultural sector in Nigeria in recent years;
(ii) Key statistics on output, export and imports, and public and private investment; and (iii) A discussion on the future development of the agricultural sector, including key
trends of that sector. The second part (Part 2) of this work is a mapping of civil society and other actors in Nigerian agriculture to segment the actors according to their qualification to act as partners for Oxfam in its agricultural campaign. A list of other organisations and actors (e.g. research institutes and universities) which may be of interest as allies in the agriculture campaign was also made. A simple-questionnaire-based survey was administered on identified nationally active and visible civil society groups to collect information regarding their structure and strength, mandate and mode of operations. There was also a situational interview on the leadership of some of the groups and officials as well as reports by NGOs, international institutions and other organizations. References are provided on the key documents and publications consulted. A set of non-prioritized recommendations on possible entry points and topics in agricultural policy lobby and advocacy is presented based on the analysis while taking into account the need of target groups and civil society landscape. This aims to serve as a guide to taking on the existing opportunities and lines of lobby and advocacy on identified issues/themes. In the process an identification of the opportunities and possible challenges for the future OI Economic Justice (EJ) Campaign in Nigeria and in particular the agricultural pillar of the campaign is recognized that may take into account the linkages and interrelationships with the two other pillars of climate change and trade.
7
3.0 BACKROUND ON NIGERIAN AGRICULTURAL SECTOR 3.1 Introduction Nigeria is a West African nation situated in the Gulf of Guinea, stretching between Latitudes 4 and 14 North. The country has a land mass of 924 000 km2 and is bordered by the Republics of Benin to the west, Niger to the north, Chad to the north-east, and Cameroon to the east, and the Atlantic Ocean to the south. As at 2006, Nigeria’s population was estimated at 140 million, with women constituting about 49.6%. The main rivers include Niger and Benue which have several tributaries and banks that open into the Atlantic Ocean.
Nigeria has diverse ecological zones which comprise the semi arid Sudan (Sahel) zone Guinea Savannah and Derived Savannah zone and Forest and Mangrove (high rainfall, moist sub-humid and very high humidity) zone. There are a few variations within each ecological zone. The type of ecology and the rainfall trends in any particular region dictates the type of farming system, the people’s food preference and the pattern of natural resource utilization in that region. Agriculture, since independence, held the key to Nigeria’s rapid economic transformation, poverty alleviation, stable civil and good governance as well as national and food security. Agriculture employs about two-thirds of Nigeria’s labour force, contributes over 40% of the Gross Domestic Product (GDP) and provides about 88% of non-oil earnings. The crops sector contributes 85% of the agricultural GDP, livestock (10%), Fisheries (4%) and Forestry (1%). Over 90% of the Nigerian agricultural output is accounted for by small-scale and subsistence farmers with less than two (2) hectares farm holding. Generally, it is estimated that about 75% of Nigeria’s total land area amounting to 68 million ha has agricultural use potential while about 33 million ha is actually under cultivation. Also, of the estimated 3.14 million ha irrigable land, only about 220, 000ha or 7% is utilized. With diverse and rich vegetation that can support heavy livestock population, it also has a surface and underground water of about 267.7 billion cubic meter and 57.9 billion cubic meter respectively. 3.2 An Overview of Nigerian Agriculture The Nigerian agricultural sector has remained a resilient sustainer of the economy and the Nigerian people in terms of food supply, employment, national income generation and industrialization. It has also struggled to perform the above functions over the years in spite of declining effectiveness of policy attention since the 1980s. 3.2.1 Historical Overview: 1960s -1997s The exploitation of the agricultural sector since the 1960s provided the main source of employment, income and foreign exchange earnings for Nigeria. This was due to focused regional policies based on commodity comparative advantage. The sector employed over 70 percent of the labor force, fed the population estimated at 55million and 60million in 1963 and 1965 respectively, guaranteeing the greater percentage of the food security of the average household. In the same period, export of cash crops earned 70 and 62.2 percent respectively, of Nigeria’s total foreign exchange and contributed 56.7 and 66.4 percent of GDP in 1960 and 1965 respectively. The dominant position of the agricultural sector in this period in the Nigerian economy was therefore, not in doubt. The advent of commercial exploitation of oil resources, however, turned the trend against agriculture and its downstream industries from the rest of seventies onwards. The oil boom, heralded an era of decay and decline in agricultural output and in the overall contribution of the sector to the economy, evidenced by the Dutch Disease. It lost its foreign exchange earnings capacity, domestic revenue importance, and attracted policy neglect. This neglect turned a threat to national food security leading to massive and continuous food importation with an erosion of value addition gains of the sector as agricultural raw commodities were exported only for finished goods to be imported.
8
Policy neglect affected key indicators of agricultural sector performance, -gross domestic product (GDP), amount of guaranteed loan received by farmers under the agricultural credit guarantee scheme fund (ACGSF), total bank credit to the agricultural sector and the economy as a whole, capital expenditure of federal government on agriculture and all sectors of the economy and the share of labour force employed in agriculture.
In spite of this, the sector still showed some resilience. Its share in both aggregate GDP and non-oil GDP continued to increase. Credit flow to the agricultural sector (an indicator of the sector’s capacity to invest and grow) measured by the amount of guaranteed loan that flowed to the sector under the agricultural credit guarantee scheme fund and the total bank credit to the sector. The nominal flow of guaranteed credit increased but sharply declined in real terms over the sub-periods, from about N44.2 million in the 1981 – 85 sub-periods to about 36.5 million in the 1986-90 sub-periods and to only about 5.6 million in the 1996-2000 sub-period.
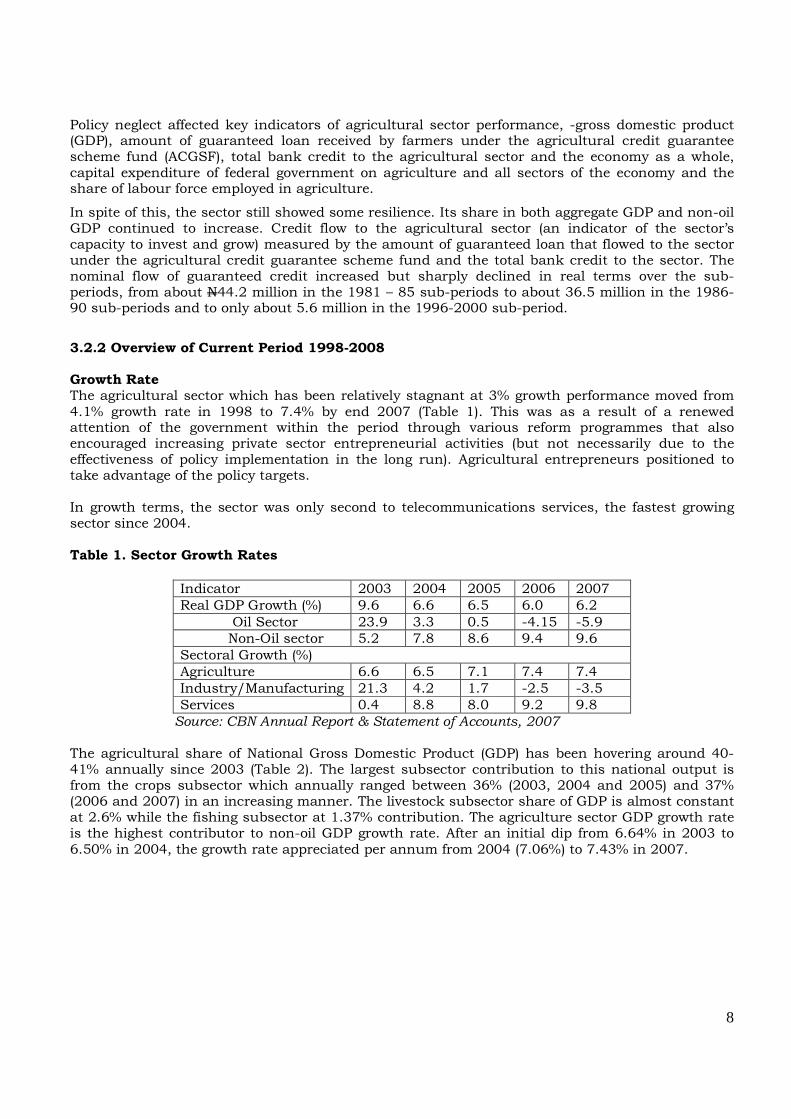
3.2.2 Overview of Current Period 1998-2008 Growth Rate The agricultural sector which has been relatively stagnant at 3% growth performance moved from 4.1% growth rate in 1998 to 7.4% by end 2007 (Table 1). This was as a result of a renewed attention of the government within the period through various reform programmes that also encouraged increasing private sector entrepreneurial activities (but not necessarily due to the effectiveness of policy implementation in the long run). Agricultural entrepreneurs positioned to take advantage of the policy targets. In growth terms, the sector was only second to telecommunications services, the fastest growing sector since 2004. Table 1. Sector Growth Rates
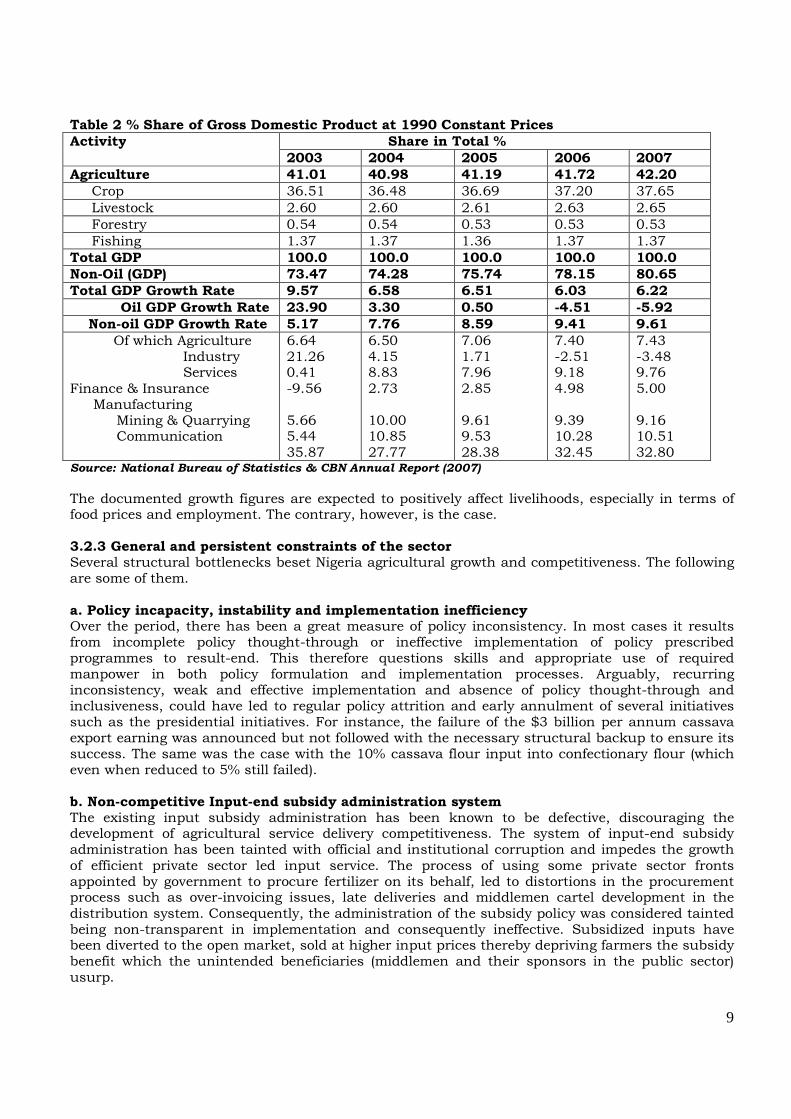
Source: CBN Annual Report & Statement of Accounts, 2007 The agricultural share of National Gross Domestic Product (GDP) has been hovering around 40-41% annually since 2003 (Table 2). The largest subsector contribution to this national output is from the crops subsector which annually ranged between 36% (2003, 2004 and 2005) and 37% (2006 and 2007) in an increasing manner. The livestock subsector share of GDP is almost constant at 2.6% while the fishing subsector at 1.37% contribution. The agriculture sector GDP growth rate is the highest contributor to non-oil GDP growth rate. After an initial dip from 6.64% in 2003 to 6.50% in 2004, the growth rate appreciated per annum from 2004 (7.06%) to 7.43% in 2007.
Indicator 2003 2004 2005 2006 2007 Real GDP Growth (%) 9.6 6.6 6.5 6.0 6.2 Oil Sector 23.9 3.3 0.5 -4.15 -5.9 Non-Oil sector 5.2 7.8 8.6 9.4 9.6 Sectoral Growth (%) Agriculture 6.6 6.5 7.1 7.4 7.4 Industry/Manufacturing 21.3 4.2 1.7 -2.5 -3.5 Services 0.4 8.8 8.0 9.2 9.8
9
Table 2 % Share of Gross Domestic Product at 1990 Constant Prices
Activity Share in Total %
2003 2004 2005 2006 2007
Agriculture 41.01 40.98 41.19 41.72 42.20
Crop 36.51 36.48 36.69 37.20 37.65 Livestock 2.60 2.60 2.61 2.63 2.65 Forestry 0.54 0.54 0.53 0.53 0.53 Fishing 1.37 1.37 1.36 1.37 1.37 Total GDP 100.0 100.0 100.0 100.0 100.0
Non-Oil (GDP) 73.47 74.28 75.74 78.15 80.65
Total GDP Growth Rate 9.57 6.58 6.51 6.03 6.22
Oil GDP Growth Rate 23.90 3.30 0.50 -4.51 -5.92
Non-oil GDP Growth Rate 5.17 7.76 8.59 9.41 9.61
Of which Agriculture Industry Services Finance & Insurance Manufacturing
Mining & Quarrying Communication
6.64 21.26 0.41 -9.56 5.66 5.44 35.87
6.50 4.15 8.83 2.73 10.00 10.85 27.77
7.06 1.71 7.96 2.85 9.61 9.53 28.38
7.40 -2.51 9.18 4.98 9.39 10.28 32.45
7.43 -3.48 9.76 5.00 9.16 10.51 32.80
Source: National Bureau of Statistics & CBN Annual Report (2007) The documented growth figures are expected to positively affect livelihoods, especially in terms of food prices and employment. The contrary, however, is the case. 3.2.3 General and persistent constraints of the sector Several structural bottlenecks beset Nigeria agricultural growth and competitiveness. The following are some of them. a. Policy incapacity, instability and implementation inefficiency Over the period, there has been a great measure of policy inconsistency. In most cases it results from incomplete policy thought-through or ineffective implementation of policy prescribed programmes to result-end. This therefore questions skills and appropriate use of required manpower in both policy formulation and implementation processes. Arguably, recurring inconsistency, weak and effective implementation and absence of policy thought-through and inclusiveness, could have led to regular policy attrition and early annulment of several initiatives such as the presidential initiatives. For instance, the failure of the $3 billion per annum cassava export earning was announced but not followed with the necessary structural backup to ensure its success. The same was the case with the 10% cassava flour input into confectionary flour (which even when reduced to 5% still failed). b. Non-competitive Input-end subsidy administration system The existing input subsidy administration has been known to be defective, discouraging the development of agricultural service delivery competitiveness. The system of input-end subsidy administration has been tainted with official and institutional corruption and impedes the growth of efficient private sector led input service. The process of using some private sector fronts appointed by government to procure fertilizer on its behalf, led to distortions in the procurement process such as over-invoicing issues, late deliveries and middlemen cartel development in the distribution system. Consequently, the administration of the subsidy policy was considered tainted being non-transparent in implementation and consequently ineffective. Subsidized inputs have been diverted to the open market, sold at higher input prices thereby depriving farmers the subsidy benefit which the unintended beneficiaries (middlemen and their sponsors in the public sector) usurp.
10
c. Poor agricultural technology and service delivery environment (inputs, extension, etc) Technology diffusion in farming is low. The low use of appropriate farming technology and poor agricultural service delivery environment combined with lack of incentives for private sector led input chain development to severely hamper the development of competitive farming and agribusiness. This also severely negatively impacted against the growth of local input and equipment manufacturing as well as efficient and cost-effective procurement and distribution system. The immediate outcome is that the sector is a low-input and low output technology enterprise, which further meant that farming is left at farmers’ poor skills, human labour-driven, and lacks processing and value-adding content leading annually to heavy post-harvest losses. d. Weak Infrastructure Base The continued absence of basic infrastructure for agricultural, industrial and social services in the economy is a big disincentive to downstream agribusiness processes and a heavy drawback against agricultural development over this period. The effect has been heavy also on upstream agricultural (irrigation facilities, transport and market information infrastructure) and value chain development. e. Absence of long term finance window for agriculture (credit facility) Given a persisting absence of long term fund dedicated for agricultural development, access to credit facility to support private sector led agricultural investment is also difficult. Over several years, there has practically been a dearth of sustainable funding windows through which investors could borrow capital for agricultural and agribusiness entrepreneurship engagement. There is however smallholder funding windows through the development finance institutions such as the CBN (ACGS), NACRDB, and International Development Assistance (IDA)’s pro-poor target programs that sustained small scale and subsistence farmers in Nigeria. Obviously the access process to these finance sources has been difficult to small farmers, in terms of availability, timing, amount and the lack of security for more formal (private/bank) credit, farm finance remains a persisting constraint. Small farmers’ inability to provide enough collateral since their farms and other assets cannot be leveraged to guarantee private/bank loans, are part of their credit difficulties. f. Weak Market base The market and price of agricultural produce is a motivation for increased production, productivity and competitiveness. The market for agricultural input and output has been weak, undeveloped and atomistic. Access to foreign markets is affected by commodity productivity and price competitiveness as well as low sanitary and phytosantitary standards adherence by local producers. This means export activities are low and raw-commodity based. On the other hand non-remunerative prices for agricultural commodities, worsened by cycles of surplus and low farm production, cause unsteady farm income, poverty and food insecurity among Nigerian farmers, creating an unstable environment of cyclical low and high food prices. Tied to the above is the lack of reliable and sustainable market information system to aid the development of market for both input and output in order to ensure competitive prices for producers and agribusiness operators. Unfortunately, every public sector intervention in addressing this bottleneck brought further distortions and therefore increasing uncompetitive capacity in the sector. For instance, rather than encouraging a private sector directing inputs sector, the government still plays a heavy role in the procurement and distribution of agricultural inputs (especially fertilizer) which discourage the building of private sector capacity, created private cartels (as fronts for government) who continued to make inputs too costly to the farmer and overtly uncompetitive. There is also the creation of the Commodity Development and Marketing companies by the government was meant to encourage the creation of standard and competitive production in key tree crops. It also expected the private sector to buy-in shares and eventually take them over. However, the aversion of private sector in bringing equity into the companies at this point has been linked to the top heavy management structure created for the companies which will not enable them to be competitive in terms of operation and profitability, and which is not attractive to any investor.
11
3.3. Agricultural Policy Review 3.3.1 Short Historical overview (1960-1998) Between 1960 and 1970, Nigerian agricultural development was fully decentralized with the states and regions as centers of activity, while the federal government provided support. This enabled a region/state-specific strategy or approach, but which generally involved a combination of private-sector/small farmer and government direct production approaches. The strategies were highly successful within this period, making agriculture Nigeria’s economic mainstay, providing the greatest employment opportunities, bulk of the raw materials for growing industries and as main source of foreign exchange earning while remaining the food security foundation. However, within the 1970s, a national neglect set in. Earlier public policy instruments included the series of National Development Plans coordinated at the National level from the first (1962-68), the second (1970-74), the third (1975-80) and the fourth (1981-85) National Development Plans. This was followed by the Structural Adjustment Plan (SAP) in 1986 which made efforts at making the sector commercially competitive and remunerative and tried to redress Nigeria’s defective mono-economic imbalance through a diversification programme to reduce dependence on the oil sector and on imports. The policy package, focused on rapid improvement of domestic food production, domestic supply of agricultural raw materials, production of exportable cash crops and rural employment. It only succeeded in creating the awareness to diversify the economy through agriculture and the catalytic and leading role the private sector must play in agricultural development, which renewed a general interest in agriculture.
Pre-SAP policies were generally public sector-driven, and mainly targeted initiatives at improving agricultural production. Some of the specific policies within this period include:
The National Accelerated Food Production Programme (NAFPP) started in 1972 primarily to raise farmers’ income, accelerate the rate of diffusion of new agricultural technology and serve as a medium for testing and adopting agricultural research findings in on-farm conditions. The objectives of this programme were not achieved.
Agricultural Development Projects (ADPs) were set up in various parts of the country starting from 1975. Partly financed by the World Bank, these projects were to promote integrated rural development by providing facilities for intensive extension services, modern input supplies and distribution system and rural infrastructures, especially feeder roads.
Livestock Development Projects were started in 1976 to commercialize beef production by the establishment of large scale public breeding ranches to encourage small scale private ranches development of grazing reserves and the provision of supervised credit for small holder fattening schemes.
Operation Feed the Nation (OFN), which started in 1976, was aimed at curtailing massive food importation into the country. The stated objectives of the programme were to meet the acute shortage in food supply, and restore some respectability to farming with the view to stemming the movement of youths from the rural areas to the cities. Urban dwellers were also encouraged, through the programme, to engage in backyard farming. The operations also attempted raising production and productivity by distributing inorganic fertilizers and improved seedlings.
Agricultural Credit Guarantee Scheme was set up, under the Central Bank to mobilize funds from the banking sector for rural development to guarantee loans by the commercial banks for investment in agriculture in order to minimize the risk involved in financing the sector. The implementation of this policy has been too slow to reach all applying farmers.
The Land Use Act was meant to facilitate an effective utilization and exploitation of the land resources for agricultural purposes. The law sought to bring the existing land tenure system under one common law. This law has been largely abused as public officials with authority for land use approval have expropriated large portions for self-based compromises. Besides the law has become
12
a key bottleneck to land access and alienation for investment uses, necessitating the call for its amendment.
Green Revolution, which was launched in 1980, was essentially a reformulation of “Operation Feed the Nation” Programme but focused on the small farmer and the development of the rural areas. The Green Revolution intended to address agricultural production from a fully mechanized and capacity upgrading perspective. To this effect, the government supported the policy with deliberate program of procuring machineries for full mechanized farming. It also established the universities of Agriculture to enhance the nurturing of a young, educated population of modern farmers learned in mechanized production. A new Green Revolution effort has been launched continentally championed by the Alliance for Green Revolution in Africa (AGRA). 3.3.2 Overview of Current Policy Period (1998-2008) Nigeria introduced an agricultural policy instrument in 1988, and revised it in 2001. The policy, as SAP, re-emphasized the role of agriculture in the overall economic structure of Nigeria. It sought an improved investment into the sector, its competitiveness in local and international market and maintained roles for critical stakeholders in the sector. Other policy instruments that have either direct or indirect bearing on agricultural development include the New National Agricultural Policy, the National Economic Empowerment and Development Strategy (NEEDS), the Presidential Initiatives on Commodities, the Agricultural Trade Policy and the Food Security Policy. There is also the recent President Yar’ Adua’s 7-Point Agenda, the Commerce 44, and the Export Expansion policy instruments. a. General Policy Direction The general policy direction was, in line with national economic objective, to engender a private-sector driven economic growth in all sectors including agriculture. The place of private investment to enhance competitive and export capacity and complementary public investments in infrastructure and rural development was unambiguously stated. It also gives room to a public-private sector partnership arrangement in agricultural infrastructure provision. Generally over the period 1998-2008, the Nigerian government achieved a relatively overall macro-economic stability that supported greater inflow of investments and offered a regime of incentives to stimulate and attract private investments in Nigerian agriculture. These incentives included fiscal measures such as tax rebates/reductions or tariff removals on production inputs and spare parts importation as well as tax holidays and monetary measures that are largely interest rate management and inflation hedging. Also trade related incentives of liberalized trading environment and institutional support for agriculture was intensified including investment promotion, protection and export facilitation especially for non-staple crops.
c. Stakeholder involvement in policy process
There has been little participation of non-state actors in sector policy processes. Stakeholders most times do not get informed about a new policy until after the initiation and development of the key frameworks and contents and during scheduled stakeholder consultations. This, at best, makes stakeholders’ input reactionary and of little or no consequence to the process already initiated. The EJ campaign will need to aid non-state organizations to build capacity to demand their involvement at policy initiation and design stages as well as in areas such as access to finance, inputs and markets (especially external markets). 3.3.3 The Policy Instruments and Programs Presently three broad Policy and economic instruments bear on the agricultural sector. They include: 1. The National Agriculture Policy 2. National Economic Empowerment and Development Strategy (NEEDS). Others are 3. The 7-Point Agenda of the sitting government Some sub-sectoral policies in the agricultural sector include:
13
1. Agricultural Trade Policy 2. National Fertilizer Policy 3. Agricultural Subsidy Policy 4. Food Security Policy Within the frameworks are policy programmes such as: 1. The Presidential Initiatives on commodities 2. National Special Food Security program (NSPFS) 3. Commerce 44 4. Export Expansion Grant (EEG) 5. Agricultural Credit Guarantee Scheme (ACGS) 6. National Fadama Development Programme 7. National Cocoa Development Programme 8. Commodity Development and Marketing Companies
1. The New Agricultural Policy on Agriculture
The revised Agriculture Policy 2001 (or new Agricultural Policy) seeks to attain self-sustaining growth in all sub-sectors of agriculture, a structural transformation of the overall socio-economic development of the country and the improvement of livelihoods. Its strategies also aim at achieving self-sufficiency and improvement of technical and economic efficiency in food production through the introduction and adoption of improved technologies of production, efficient utilization of resources and the enhancement of producer capacities. Its macroeconomic policies include appropriate pricing and trade, exchange rate stability and accessible agricultural land. Sub-sector specific policies covered food production, input supply, subsidy administration and support services
a. Objectives of the Policy
Among its several objectives are the attainment of self-sufficiency in basic food commodities with particular reference to those with high consumer shares, high forex yield and comparative advantage in local production, increased production of raw materials for agro-industrial expansion and for export. It also targets agricultural modernization through technology infusion and the creation of rural employment opportunities and remunerative farming as an attraction for private investment flow all of which will be given appropriate institutional support and facilitation. The thrust of the new policy therefore is creating a macro-environment that will stimulate greater private sector investment in agriculture and encouraging the private sector to assume the lead and main actor role in agriculture and rationalize the roles of the tiers of government and the private sector.
b. Roles of government and the private sector under the Policy The policy defined complementary and synergistic roles for all the stakeholders made up of the three tiers of government: Federal, States and Local Governments; and the private sector in line with the Nigerian Constitution provision for facilitative and promotory roles to all the tiers of government in the exclusive and concurrent legislative lists. It assigned roles to the 3-tiers of Government and Private Sector. The Federal, state and local governments were required to differently and collectively work towards the enthronement of a sound policy framework and strategies for reasonable flow of resources into agricultural and rural development, support rural/agricultural infrastructure development, research and development of appropriate technology for agriculture (including biotechnology) as well as promote markets for products, inputs development, regulations and support agricultural service delivery. Others are to manage Nigeria’s land and water resources, pests and diseases control and bilateral and multilateral Agreements on Agricultural Trade reached between Nigeria and the World Trade Organisation (WTO). The states were to particularly promote the primary production of all commodities (including direct state-funded production), extension services and ensure access to land, irrigation and appropriate
14
farm mechanization systems, etc. Others include credits provision to smallholder farmers, maintenance of buffer stocks of agricultural commodities, rural development (roads and water supplies) and control of forest resources. The local governments should provide effective agricultural extension service and mobilize farmers, cooperative organizations and local institutions for higher production and enhance land access. The private sector role in entrepreneurship investments into all aspects of agricultural production and value chains was maintained. It expects the sector to drive agricultural input chain as well as agricultural mechanization getting involved in enterprise-specific rural infrastructure and support research in all aspects of agriculture. 2. National Economic Empowerment and Development Strategy (NEEDS) and Agriculture development The NEEDS (2004) document is a strategic intent of the Federal Government which sought the diversification of the productive base of the economy away from oil and foster a market-oriented private sector driven economic development with strong local participation also made agriculture a key tool to achieving its strategies given its potentials. Specifically, it seeks to achieve a minimum target annual growth rate of 6% for the agriculture sector in the first instance and attain agricultural exports at minimum $3 billion per annum from the Cassava Initiative alone, drastically reduce food imports to 5% from the present 14.5%. It also targets increasing cultivable arable land by 10% per annum and foster implementation of private sector participation through incentives schemes to achieve agricultural production sustainability. The strategies to achieving the NEEDS Agriculture objectives include such programs as the Presidential Initiatives on chosen competitive commodities and taking advantage of concession arrangements in bilateral and multilateral agreements (WTO, EU-ACP, US-AGOA, and ECOWAS). Others include strengthening agricultural research, training and extension institutions and frameworks. It also seeks a sustainable development of a private sector-led input supply and distribution system, an integrated agriculture-led rural development and the growth of agricultural credit access windows for farmers. NEEDS provided for the participation of various stakeholders -the Federal Government and its agencies, state governments, local governments and private sector –in its implementation. While the strategy objective of 6% sector growth and food import reduction were achieved, others were not. This is obviously because the structures (infrastructure, value chain and standards compliance systems) that could support them were not strictly operative. 3. The Presidential Initiatives There were several Presidential Initiatives on several agricultural commodities aimed at attaining an increased production to bridge the gaps that existed in local supply of these commodities, which had led to their continuous importation. The Presidential Initiatives were on Cassava, Cotton, Rice, Vegetable Oil, Livestock and Dairy, Tree Crops, Tropical Fruits, Rubber and Allanblakia. The Presidential Initiatives succeeded in raising the level of policy awareness once again on agriculture’s role in national economic growth but largely failed because their execution was without preparation for the post-harvest value chain segments. Only vegetable oil programme reported positive development because of prior private sector investments into its production and processing chains. 4. National Special Programme on Food Security (NSPFS) The NSPFS, implemented since 2002, is to assist farmers in achieving their potentials in increasing output and productivity and consequently their incomes on a sustainability basis. The 5-year programme funded by Nigerian government is meant to concentrate knowledge gains and continuity capacity from loan-assisted projects, promote simple technologies and train farmers. It covers projects in Food Security, aquaculture and inland fisheries. Others are animal disease and transboundary pest control, agricultural commodity marketing and food-stock management. The
15
food security project was implemented in the first phase with small scale farmers in the 109 senatorial districts of Nigeria. The second phase has taken off. 5. The 7-Point Agenda Agriculture Strategy The current administration’s policy quest for national food security and self-sufficiency through sustainable agro-allied entrepreneurship seeks to optimize agricultural production and productivity and integrate water resources and attendant sector development. It sees land reforms (especially agricultural land use reforms) as very critical while strengthening monitoring and evaluation management as well research and partnership development. The implementation is yet to be visibly observed. 5. Commerce 44 Instrument This policy initiative sought to develop the export of eleven agricultural commodities, eleven manufactured products and eleven (11) solid minerals, with high export potentials. The idea was to focus on eleven countries or regions of the world taking advantage of the concessions offered by the subsisting Bilateral and Multilateral Agreements as well as memorandums of understanding (MOUs) that will facilitate the smooth export of Nigerian products into their markets. The agricultural commodities include cocoa, cotton, cassava, ginger, Shea nut, Gum Arabic, sesame seed, poultry, cashew nuts, fruits and vegetables and floriculture. The capacity to exploit these opportunities is in the attainment of best practices to enhance their competitiveness. It is still-born. 6. National Fadama Programme The phase 1 of the project launched in 1988 financed by the World Bank at the cost of $45 million was implemented in the northern states and provided support for dry season farming through the supply of small scale irrigation implements and construction of dams for crops and livestock farming. The second phase started in 2004 covering 12 states and incorporating poverty alleviation and farmer income generation strategies as targets. It seeks to address factors in production glut in some parts of the country (even at times that food prices continued to rise in all parts) and sought to raise the capacity of producers through production infrastructure, inputs and advisory services. The Phase 3 of the programme will expand across states that have not benefited, especially the southern parts of the country. The loan package is $450 million, with World Bank providing $250 million. An assessment by IFPRI team8 confirmed that Fadama II was very successful, increasing direct beneficiaries’ real incomes by 58.5%, far beyond the target 20% 3.3.4. Subsector Policy Instruments i. Agricultural Trade Policy The Agricultural Trade Policy seeks to exploit all the trade potentials of agricultural products both within the domestic and external market opportunities. This it seeks to achieve by encouraging sector specialization in terms of commodity-based comparative advantage in production and ecological endowment for cheap and adequate supply of agricultural raw materials necessary for inter-sectoral trade. It also seeks the achievement of competitive quality and standards certified products to satisfy local demands and attain export competitiveness capacity. To this end, it makes demands on export value and linkage with the industrial sector to enhance export promotion and technology application objectives of the policy. Basically, the policy seeks the platform of Nigeria’s bilateral, regional and multilateral trade agreements to explore export market for her agricultural products. This policy is not yet attained because the key fundamentals are still absent. ii. Agricultural Inputs Policy: Fertilizer Policy Before 1976, state governments were responsible for fertilizer procurement and distribution. With the establishment of the Federal Fertilizer Procurement and Distribution Department, the government established fertilizer plants to develop domestic production capacity in order to meet
16
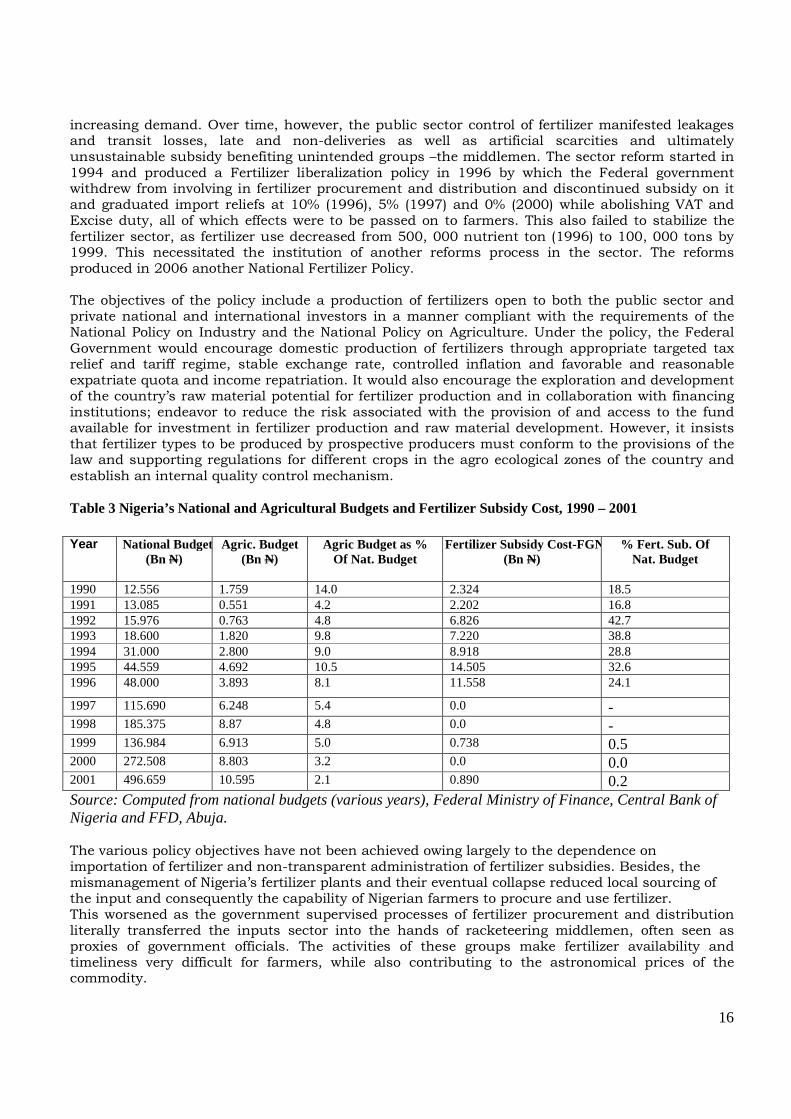
increasing demand. Over time, however, the public sector control of fertilizer manifested leakages and transit losses, late and non-deliveries as well as artificial scarcities and ultimately unsustainable subsidy benefiting unintended groups –the middlemen. The sector reform started in 1994 and produced a Fertilizer liberalization policy in 1996 by which the Federal government withdrew from involving in fertilizer procurement and distribution and discontinued subsidy on it and graduated import reliefs at 10% (1996), 5% (1997) and 0% (2000) while abolishing VAT and Excise duty, all of which effects were to be passed on to farmers. This also failed to stabilize the fertilizer sector, as fertilizer use decreased from 500, 000 nutrient ton (1996) to 100, 000 tons by 1999. This necessitated the institution of another reforms process in the sector. The reforms produced in 2006 another National Fertilizer Policy. The objectives of the policy include a production of fertilizers open to both the public sector and private national and international investors in a manner compliant with the requirements of the National Policy on Industry and the National Policy on Agriculture. Under the policy, the Federal Government would encourage domestic production of fertilizers through appropriate targeted tax relief and tariff regime, stable exchange rate, controlled inflation and favorable and reasonable expatriate quota and income repatriation. It would also encourage the exploration and development of the country’s raw material potential for fertilizer production and in collaboration with financing institutions; endeavor to reduce the risk associated with the provision of and access to the fund available for investment in fertilizer production and raw material development. However, it insists that fertilizer types to be produced by prospective producers must conform to the provisions of the law and supporting regulations for different crops in the agro ecological zones of the country and establish an internal quality control mechanism. Table 3 Nigeria’s National and Agricultural Budgets and Fertilizer Subsidy Cost, 1990 – 2001
Source: Computed from national budgets (various years), Federal Ministry of Finance, Central Bank of Nigeria and FFD, Abuja. The various policy objectives have not been achieved owing largely to the dependence on importation of fertilizer and non-transparent administration of fertilizer subsidies. Besides, the mismanagement of Nigeria’s fertilizer plants and their eventual collapse reduced local sourcing of the input and consequently the capability of Nigerian farmers to procure and use fertilizer. This worsened as the government supervised processes of fertilizer procurement and distribution literally transferred the inputs sector into the hands of racketeering middlemen, often seen as proxies of government officials. The activities of these groups make fertilizer availability and timeliness very difficult for farmers, while also contributing to the astronomical prices of the commodity.
Year National Budget(Bn N)
Agric. Budget (Bn N)
Agric Budget as % Of Nat. Budget
Fertilizer Subsidy Cost-FGN(Bn N)
% Fert. Sub. Of Nat. Budget
1990 12.556 1.759 14.0 2.324 18.5 1991 13.085 0.551 4.2 2.202 16.8 1992 15.976 0.763 4.8 6.826 42.7 1993 18.600 1.820 9.8 7.220 38.8 1994 31.000 2.800 9.0 8.918 28.8 1995 44.559 4.692 10.5 14.505 32.6 1996 48.000 3.893 8.1 11.558 24.1
1997 115.690 6.248 5.4 0.0 - 1998 185.375 8.87 4.8 0.0 - 1999 136.984 6.913 5.0 0.738 0.5 2000 272.508 8.803 3.2 0.0 0.0 2001 496.659 10.595 2.1 0.890 0.2
17
Table 3 above indicates the regime of fertilizer subsidies that have been administered in Nigeria. From 18.5% in 1990 to the highest rate of 42.7% in 1992, coming down to 0% and regimes of no subsidy between 1997 and1998, the policy took effect from 2000 with 0.5% subsidy. The present fertilizer subsidy is at the rate of 25%. The major challenge of the policy has always been getting the intended beneficiaries to access the policy benefits. The subsidy elements always get wiped out as the middlemen take over the fertilizer market and raise prices beyond the reach of most farmers. iii. National Food Security Policy & Programme Given the enormous challenges facing the agricultural sector, Nigeria has continuously been unable to achieve food self-sufficiency and food security. Consequently she spends about $3billion on annual food importation, while the sector subsists on subsistence scale, riddled with low productivity and poor return to investment. A Food Security Policy (2008) and its programmes government was designed to resolve the several bottlenecks to agricultural development and food self sufficiency by promoting modern and large scale agricultural production. The policy thrusts include import substitutions for staple food supply, food security and employment generation to reduce rural-urban drift. The import substitution objective requires the production of food and cash crops domestically in quantities and qualities (and value addition) that will close the gaps necessitating importation demand. The target commodities include cassava, rice, millet and wheat. Others are sugar, tomato, cotton, cocoa, palm oil and rubber and livestock -poultry, goat, sheep and goat, cattle, pigs and fisheries. A combination of many policy strategies (monetary, fiscal, sectoral, etc) has been used to encourage local production and discourage importation of food commodities. The inconsistency and non-transparency in implementing many of such measures have limited their results such that occasional high tariff on imported food commodities, subsidy on agricultural inputs, and single digit interest on agricultural credit have not yielded as expected. It also makes provision for the creation of the National Food Reserve Agency saddled with the functions of developing and implementing programs for strategic food storage for emergency and food security. The strategic food reserve project has been the key fall-back of government in times of food crisis by releasing food items, especially grains from the buffer stock to cushion prices of food during bad agricultural years (bad/poor harvest, pest attack). It is meant to give a sustainable backing to the food reserve programme, initially implemented under the Strategic Grains Reserve (SGR) which provided facilities (silos) for storing grains in different parts of the country for emergency uses. Nigeria’s current food reserve capacity is 300, 000 mt and is, under the new policy planned to increase to 3, 000, 000 mt by 2011. One of the major issues in the strategy is getting states government to also design and implement 9possibly in conjunction with the federal government and private sector their own food reserve programmes especially on commodities of the comparative production advantage. It also advocates public sector appropriation of at least 10% of annual budgets in line with the Maputo Declaration to strengthen agricultural research, provide development finance for extension and market information services as well as agricultural infrastructure. The Federal government appropriation to agriculture as percentage of national budget grew from 1.31% in 2003 to 7.0% in 2007 (see table 11 below). In contrast, states government total appropriation to agriculture as percentage of aggregate of their annual budget shank from 1.9% in 2001 to 1.46% in 2007 (see table 12 below). It is however important to note that budgetary releases in the age of due process have been slow and reduced the utilization of appropriated funds for sector development. It would therefore promote private sector investment and credit access to both large and small scale farming, provide for the establishment of an Agricultural Development Fund and the Natural Resources Fund and encourage public-private sector partnership funding arrangements. Using a 3-phase execution arrangement - short-term (May-December, 2008), medium term (2009-2011) and
18
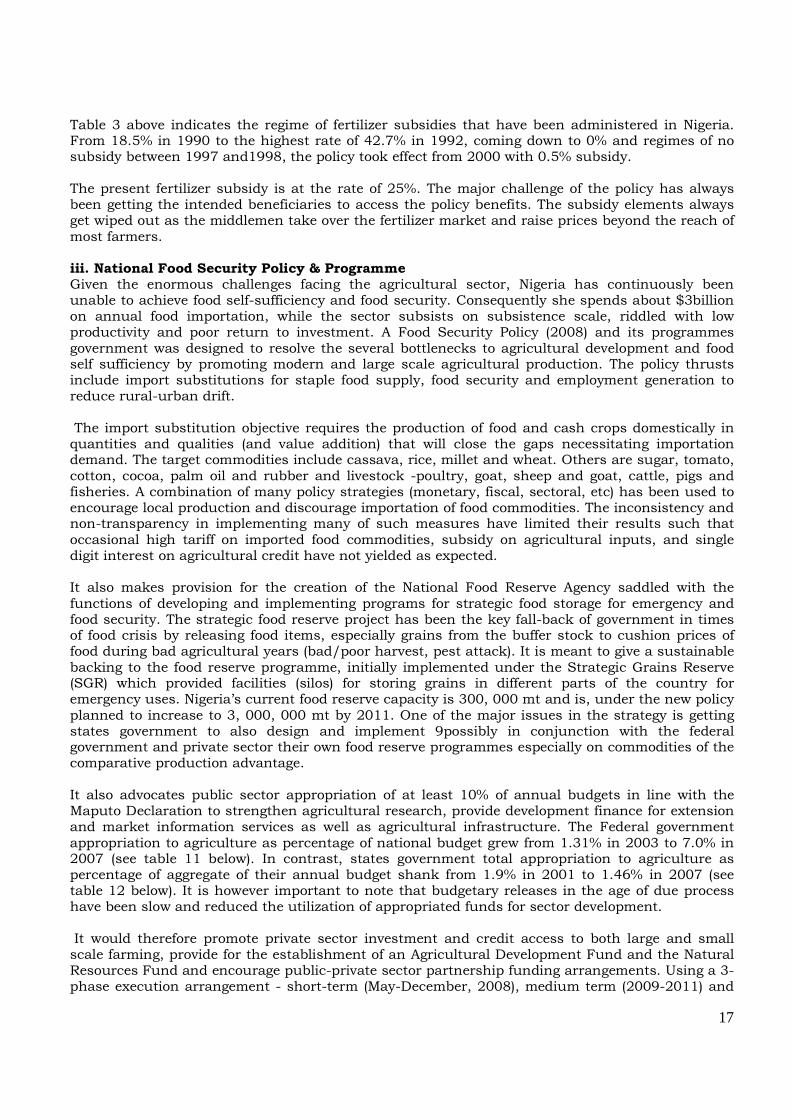
long term (2011-2020), it plans the sector growth rates at 8%, 10-15% and 12% respectively within those phases. 3.4 National Agricultural Production/Productivity Outlook Nigeria has a long list of crops and livestock produced by farmers. The cash crops include cocoa, cotton, rubber and oil palm. Among the food crops are tubers such as cassava, yam, cocoyam, sweet and Irish potato, grains like maize, sorghum, rice, and millet and pulses (cowpea, groundnut, soybean, bambara nuts and pigeon pea). Oil seed crops include sesame seeds and melon, while vegetables include onion, okra, pepper and tomato. Other crops include wheat, sugar cane, ginger, garlic and garden egg. 3.4.1. National Output, Growth & Productivity As earlier shown above, the agricultural sector is characterized by a dominant crops subsector (Table 4) with its long varietal chain, and a growing livestock and fishery subsectors. These subsectors are in dire need of appropriate interventions to attain market competitiveness in order to contribute to overall national economic growth objectives and poverty alleviation. The forestry subsector used to be very vibrant, but there have been reduced commitment to forest resource development. The crops subsector could be divided into major and minor crops depending on whether they are cash or key staple food crops and minor, if otherwise, they are non-cash or purely food crops. Table 4 Index of Agricultural Production by Type of Activity (1990 = 100) in ’million MT
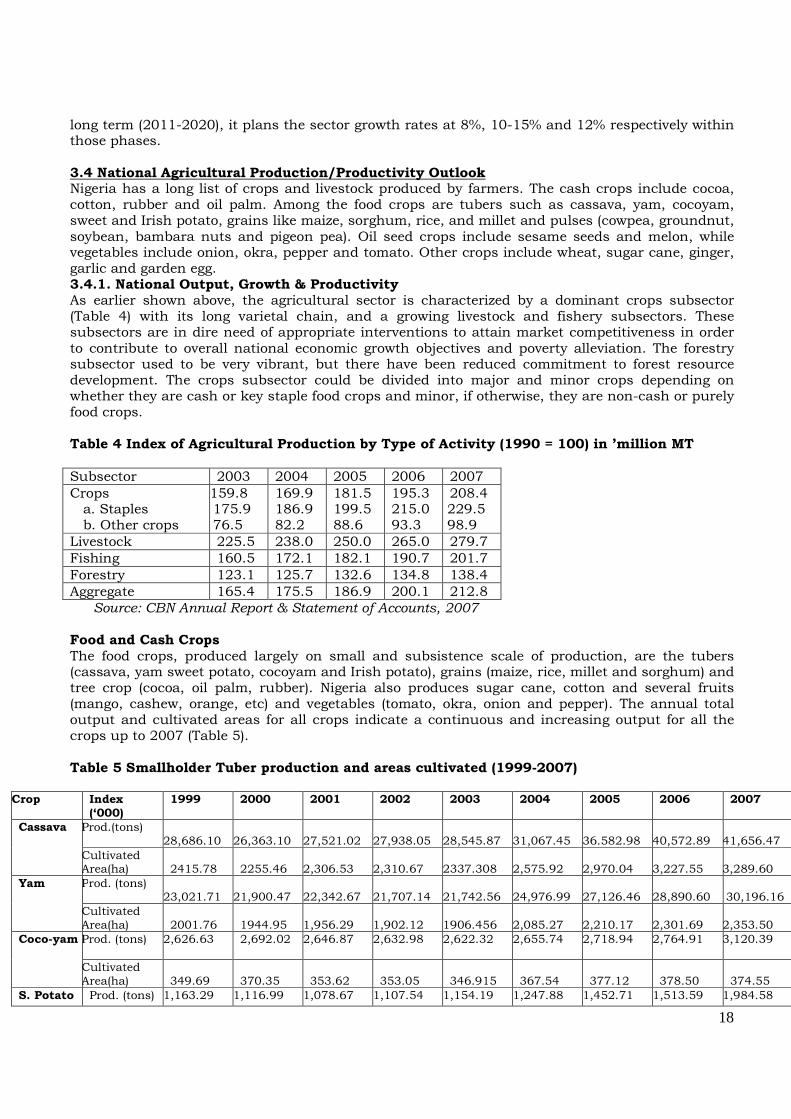
Source: CBN Annual Report & Statement of Accounts, 2007 Food and Cash Crops The food crops, produced largely on small and subsistence scale of production, are the tubers (cassava, yam sweet potato, cocoyam and Irish potato), grains (maize, rice, millet and sorghum) and tree crop (cocoa, oil palm, rubber). Nigeria also produces sugar cane, cotton and several fruits (mango, cashew, orange, etc) and vegetables (tomato, okra, onion and pepper). The annual total output and cultivated areas for all crops indicate a continuous and increasing output for all the crops up to 2007 (Table 5). Table 5 Smallholder Tuber production and areas cultivated (1999-2007)
Crop Index (‘000)
1999 2000 2001 2002 2003 2004 2005 2006 2007
Cassava
Prod.(tons) 28,686.10 26,363.10 27,521.02 27,938.05 28,545.87
31,067.45
36.582.98
40,572.89
41,656.47
Cultivated Area(ha) 2415.78 2255.46 2,306.53 2,310.67 2337.308 2,575.92 2,970.04 3,227.55 3,289.60
Yam Prod. (tons) 23,021.71 21,900.47
22,342.67
21,707.14
21,742.56
24,976.99
27,126.46
28,890.60
30,196.16
Cultivated Area(ha) 2001.76 1944.95 1,956.29 1,902.12 1906.456 2,085.27 2,210.17 2,301.69 2,353.50
Coco-yam Prod. (tons) 2,626.63 2,692.02 2,646.87 2,632.98 2,622.32 2,655.74 2,718.94 2,764.91 3,120.39
Cultivated Area(ha) 349.69 370.35 353.62 353.05 346.915 367.54 377.12 378.50 374.55
S. Potato Prod. (tons) 1,163.29 1,116.99 1,078.67 1,107.54 1,154.19 1,247.88 1,452.71 1,513.59 1,984.58
Subsector 2003 2004 2005 2006 2007 Crops a. Staples b. Other crops
159.8 175.9 76.5
169.9 186.9 82.2
181.5 199.5 88.6
195.3 215.0 93.3
208.4 229.5 98.9
Livestock 225.5 238.0 250.0 265.0 279.7 Fishing 160.5 172.1 182.1 190.7 201.7 Forestry 123.1 125.7 132.6 134.8 138.4 Aggregate 165.4 175.5 186.9 200.1 212.8
19
Cultivated Area(ha) 180.52 173.36 171.60 174.60 181.57 179.57 208.16 212.67 291.19
I. Potato Prod. (tons) 466.37 492.20 556.34 587.12 665.22 699.82 1,044.96 1,142.28 1,202.17
Cultivated Area(ha) 76.52 75.49 79.94 80.01 85.283 95.28 135.28 143.04 169.55
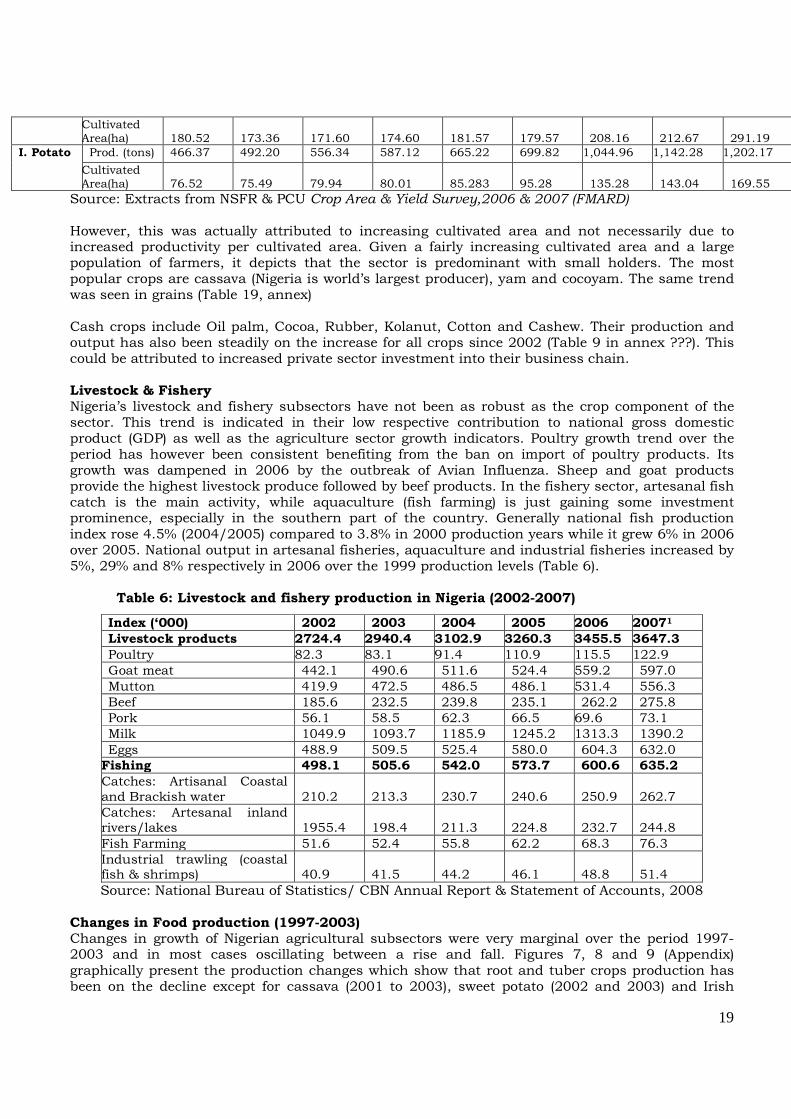
Source: Extracts from NSFR & PCU Crop Area & Yield Survey,2006 & 2007 (FMARD) However, this was actually attributed to increasing cultivated area and not necessarily due to increased productivity per cultivated area. Given a fairly increasing cultivated area and a large population of farmers, it depicts that the sector is predominant with small holders. The most popular crops are cassava (Nigeria is world’s largest producer), yam and cocoyam. The same trend was seen in grains (Table 19, annex) Cash crops include Oil palm, Cocoa, Rubber, Kolanut, Cotton and Cashew. Their production and output has also been steadily on the increase for all crops since 2002 (Table 9 in annex ???). This could be attributed to increased private sector investment into their business chain. Livestock & Fishery Nigeria’s livestock and fishery subsectors have not been as robust as the crop component of the sector. This trend is indicated in their low respective contribution to national gross domestic product (GDP) as well as the agriculture sector growth indicators. Poultry growth trend over the period has however been consistent benefiting from the ban on import of poultry products. Its growth was dampened in 2006 by the outbreak of Avian Influenza. Sheep and goat products provide the highest livestock produce followed by beef products. In the fishery sector, artesanal fish catch is the main activity, while aquaculture (fish farming) is just gaining some investment prominence, especially in the southern part of the country. Generally national fish production index rose 4.5% (2004/2005) compared to 3.8% in 2000 production years while it grew 6% in 2006 over 2005. National output in artesanal fisheries, aquaculture and industrial fisheries increased by 5%, 29% and 8% respectively in 2006 over the 1999 production levels (Table 6).
Table 6: Livestock and fishery production in Nigeria (2002-2007)
Source: National Bureau of Statistics/ CBN Annual Report & Statement of Accounts, 2008 Changes in Food production (1997-2003) Changes in growth of Nigerian agricultural subsectors were very marginal over the period 1997-2003 and in most cases oscillating between a rise and fall. Figures 7, 8 and 9 (Appendix) graphically present the production changes which show that root and tuber crops production has been on the decline except for cassava (2001 to 2003), sweet potato (2002 and 2003) and Irish
Index (‘000) 2002 2003 2004 2005 2006 20071
Livestock products 2724.4 2940.4 3102.9 3260.3 3455.5 3647.3
Poultry 82.3 83.1 91.4 110.9 115.5 122.9 Goat meat 442.1 490.6 511.6 524.4 559.2 597.0 Mutton 419.9 472.5 486.5 486.1 531.4 556.3 Beef 185.6 232.5 239.8 235.1 262.2 275.8 Pork 56.1 58.5 62.3 66.5 69.6 73.1 Milk 1049.9 1093.7 1185.9 1245.2 1313.3 1390.2 Eggs 488.9 509.5 525.4 580.0 604.3 632.0 Fishing 498.1 505.6 542.0 573.7 600.6 635.2
Catches: Artisanal Coastal and Brackish water 210.2 213.3 230.7 240.6 250.9 262.7 Catches: Artesanal inland rivers/lakes 1955.4 198.4 211.3 224.8 232.7 244.8 Fish Farming 51.6 52.4 55.8 62.2 68.3 76.3 Industrial trawling (coastal fish & shrimps) 40.9 41.5 44.2 46.1 48.8 51.4
20
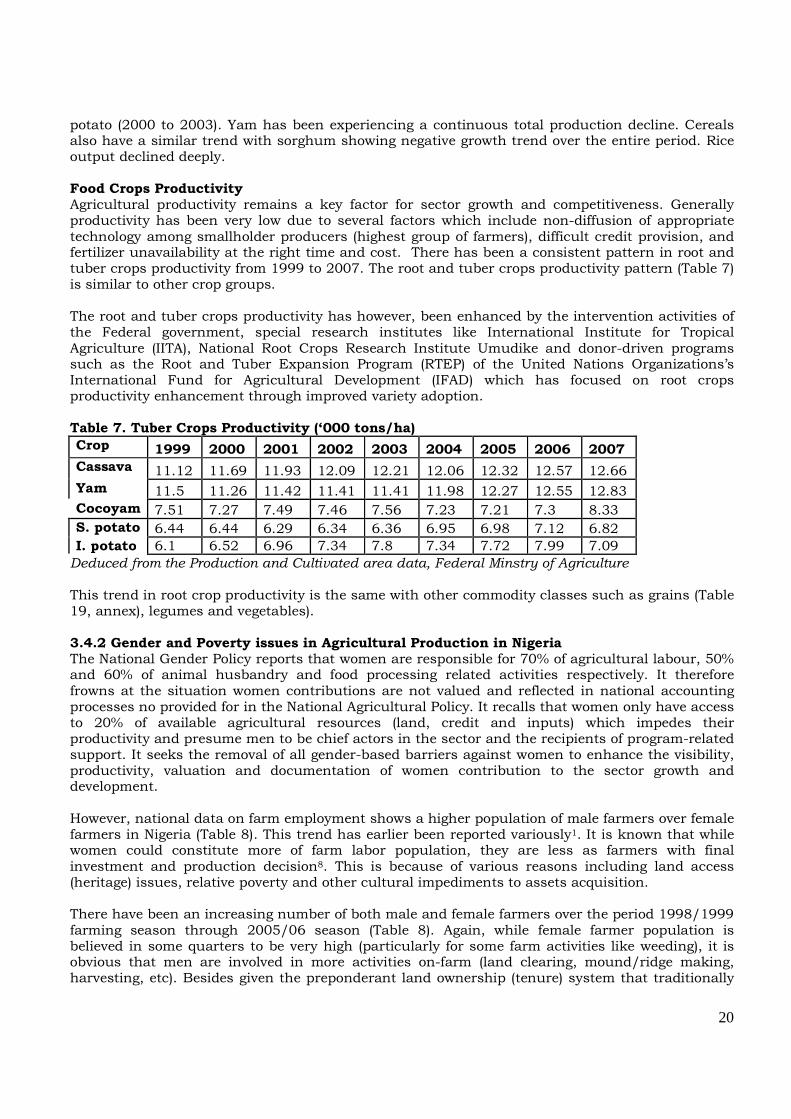
potato (2000 to 2003). Yam has been experiencing a continuous total production decline. Cereals also have a similar trend with sorghum showing negative growth trend over the entire period. Rice output declined deeply. Food Crops Productivity Agricultural productivity remains a key factor for sector growth and competitiveness. Generally productivity has been very low due to several factors which include non-diffusion of appropriate technology among smallholder producers (highest group of farmers), difficult credit provision, and fertilizer unavailability at the right time and cost. There has been a consistent pattern in root and tuber crops productivity from 1999 to 2007. The root and tuber crops productivity pattern (Table 7) is similar to other crop groups. The root and tuber crops productivity has however, been enhanced by the intervention activities of the Federal government, special research institutes like International Institute for Tropical Agriculture (IITA), National Root Crops Research Institute Umudike and donor-driven programs such as the Root and Tuber Expansion Program (RTEP) of the United Nations Organizations’s International Fund for Agricultural Development (IFAD) which has focused on root crops productivity enhancement through improved variety adoption. Table 7. Tuber Crops Productivity (‘000 tons/ha)
Crop 1999 2000 2001 2002 2003 2004 2005 2006 2007
Cassava 11.12 11.69 11.93 12.09 12.21 12.06 12.32 12.57 12.66 Yam 11.5 11.26 11.42 11.41 11.41 11.98 12.27 12.55 12.83 Cocoyam 7.51 7.27 7.49 7.46 7.56 7.23 7.21 7.3 8.33 S. potato 6.44 6.44 6.29 6.34 6.36 6.95 6.98 7.12 6.82 I. potato 6.1 6.52 6.96 7.34 7.8 7.34 7.72 7.99 7.09 Deduced from the Production and Cultivated area data, Federal Minstry of Agriculture This trend in root crop productivity is the same with other commodity classes such as grains (Table 19, annex), legumes and vegetables). 3.4.2 Gender and Poverty issues in Agricultural Production in Nigeria The National Gender Policy reports that women are responsible for 70% of agricultural labour, 50% and 60% of animal husbandry and food processing related activities respectively. It therefore frowns at the situation women contributions are not valued and reflected in national accounting processes no provided for in the National Agricultural Policy. It recalls that women only have access to 20% of available agricultural resources (land, credit and inputs) which impedes their productivity and presume men to be chief actors in the sector and the recipients of program-related support. It seeks the removal of all gender-based barriers against women to enhance the visibility, productivity, valuation and documentation of women contribution to the sector growth and development. However, national data on farm employment shows a higher population of male farmers over female farmers in Nigeria (Table 8). This trend has earlier been reported variously1. It is known that while women could constitute more of farm labor population, they are less as farmers with final investment and production decision8. This is because of various reasons including land access (heritage) issues, relative poverty and other cultural impediments to assets acquisition. There have been an increasing number of both male and female farmers over the period 1998/1999 farming season through 2005/06 season (Table 8). Again, while female farmer population is believed in some quarters to be very high (particularly for some farm activities like weeding), it is obvious that men are involved in more activities on-farm (land clearing, mound/ridge making, harvesting, etc). Besides given the preponderant land ownership (tenure) system that traditionally
21
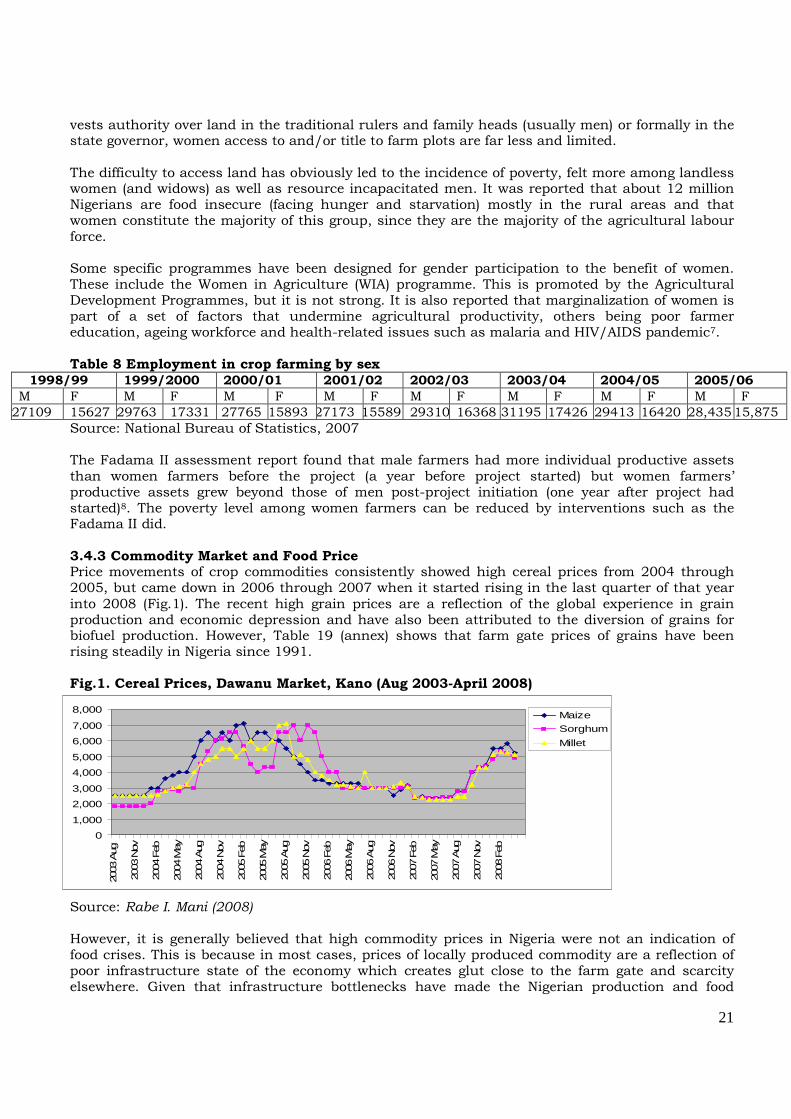
vests authority over land in the traditional rulers and family heads (usually men) or formally in the state governor, women access to and/or title to farm plots are far less and limited. The difficulty to access land has obviously led to the incidence of poverty, felt more among landless women (and widows) as well as resource incapacitated men. It was reported that about 12 million Nigerians are food insecure (facing hunger and starvation) mostly in the rural areas and that women constitute the majority of this group, since they are the majority of the agricultural labour force. Some specific programmes have been designed for gender participation to the benefit of women. These include the Women in Agriculture (WIA) programme. This is promoted by the Agricultural Development Programmes, but it is not strong. It is also reported that marginalization of women is part of a set of factors that undermine agricultural productivity, others being poor farmer education, ageing workforce and health-related issues such as malaria and HIV/AIDS pandemic7. Table 8 Employment in crop farming by sex
1998/99 1999/2000 2000/01 2001/02 2002/03 2003/04 2004/05 2005/06
M F M F M F M F M F M F M F M F 27109 15627 29763 17331 27765 15893 27173 15589 29310 16368 31195 17426 29413 16420 28,435 15,875
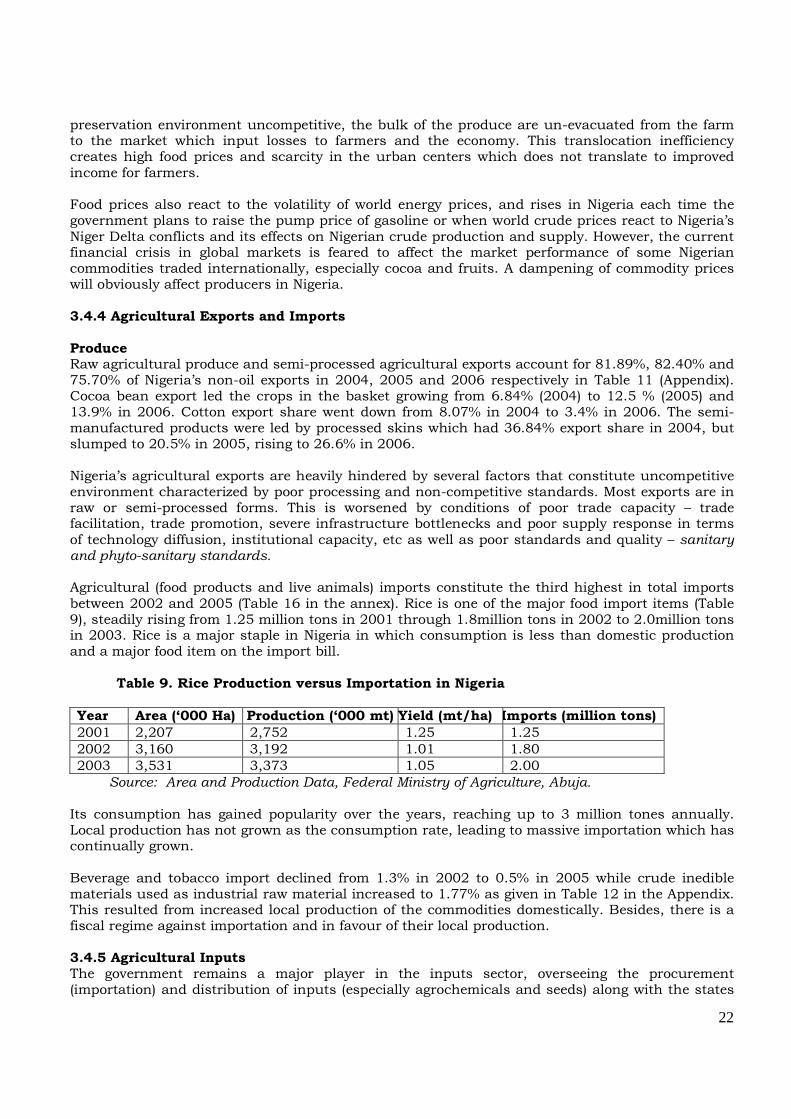
Source: National Bureau of Statistics, 2007 The Fadama II assessment report found that male farmers had more individual productive assets than women farmers before the project (a year before project started) but women farmers’ productive assets grew beyond those of men post-project initiation (one year after project had started)8. The poverty level among women farmers can be reduced by interventions such as the Fadama II did. 3.4.3 Commodity Market and Food Price Price movements of crop commodities consistently showed high cereal prices from 2004 through 2005, but came down in 2006 through 2007 when it started rising in the last quarter of that year into 2008 (Fig.1). The recent high grain prices are a reflection of the global experience in grain production and economic depression and have also been attributed to the diversion of grains for biofuel production. However, Table 19 (annex) shows that farm gate prices of grains have been rising steadily in Nigeria since 1991. Fig.1. Cereal Prices, Dawanu Market, Kano (Aug 2003-April 2008) Source: Rabe I. Mani (2008) However, it is generally believed that high commodity prices in Nigeria were not an indication of food crises. This is because in most cases, prices of locally produced commodity are a reflection of poor infrastructure state of the economy which creates glut close to the farm gate and scarcity elsewhere. Given that infrastructure bottlenecks have made the Nigerian production and food
0
1,000
2,000
3,000
4,000
5,000
6,000
7,000
8,000
2003
Aug
2003
Nov
2004
Feb
2004
May
2004
Aug
2004
Nov
2005
Feb
2005
May
2005
Aug
2005
Nov
2006
Feb
2006
May
2006
Aug
2006
Nov
2007
Feb
2007
May
2007
Aug
2007
Nov
2008
Feb
Maize
Sorghum
Millet
22
preservation environment uncompetitive, the bulk of the produce are un-evacuated from the farm to the market which input losses to farmers and the economy. This translocation inefficiency creates high food prices and scarcity in the urban centers which does not translate to improved income for farmers. Food prices also react to the volatility of world energy prices, and rises in Nigeria each time the government plans to raise the pump price of gasoline or when world crude prices react to Nigeria’s Niger Delta conflicts and its effects on Nigerian crude production and supply. However, the current financial crisis in global markets is feared to affect the market performance of some Nigerian commodities traded internationally, especially cocoa and fruits. A dampening of commodity prices will obviously affect producers in Nigeria. 3.4.4 Agricultural Exports and Imports Produce Raw agricultural produce and semi-processed agricultural exports account for 81.89%, 82.40% and 75.70% of Nigeria’s non-oil exports in 2004, 2005 and 2006 respectively in Table 11 (Appendix). Cocoa bean export led the crops in the basket growing from 6.84% (2004) to 12.5 % (2005) and 13.9% in 2006. Cotton export share went down from 8.07% in 2004 to 3.4% in 2006. The semi-manufactured products were led by processed skins which had 36.84% export share in 2004, but slumped to 20.5% in 2005, rising to 26.6% in 2006. Nigeria’s agricultural exports are heavily hindered by several factors that constitute uncompetitive environment characterized by poor processing and non-competitive standards. Most exports are in raw or semi-processed forms. This is worsened by conditions of poor trade capacity – trade facilitation, trade promotion, severe infrastructure bottlenecks and poor supply response in terms of technology diffusion, institutional capacity, etc as well as poor standards and quality – sanitary and phyto-sanitary standards. Agricultural (food products and live animals) imports constitute the third highest in total imports between 2002 and 2005 (Table 16 in the annex). Rice is one of the major food import items (Table 9), steadily rising from 1.25 million tons in 2001 through 1.8million tons in 2002 to 2.0million tons in 2003. Rice is a major staple in Nigeria in which consumption is less than domestic production and a major food item on the import bill.
Table 9. Rice Production versus Importation in Nigeria Year Area (‘000 Ha) Production (‘000 mt) Yield (mt/ha) Imports (million tons)
2001 2,207 2,752 1.25 1.25 2002 3,160 3,192 1.01 1.80 2003 3,531 3,373 1.05 2.00 Source: Area and Production Data, Federal Ministry of Agriculture, Abuja. Its consumption has gained popularity over the years, reaching up to 3 million tones annually. Local production has not grown as the consumption rate, leading to massive importation which has continually grown. Beverage and tobacco import declined from 1.3% in 2002 to 0.5% in 2005 while crude inedible materials used as industrial raw material increased to 1.77% as given in Table 12 in the Appendix. This resulted from increased local production of the commodities domestically. Besides, there is a fiscal regime against importation and in favour of their local production. 3.4.5 Agricultural Inputs The government remains a major player in the inputs sector, overseeing the procurement (importation) and distribution of inputs (especially agrochemicals and seeds) along with the states
23
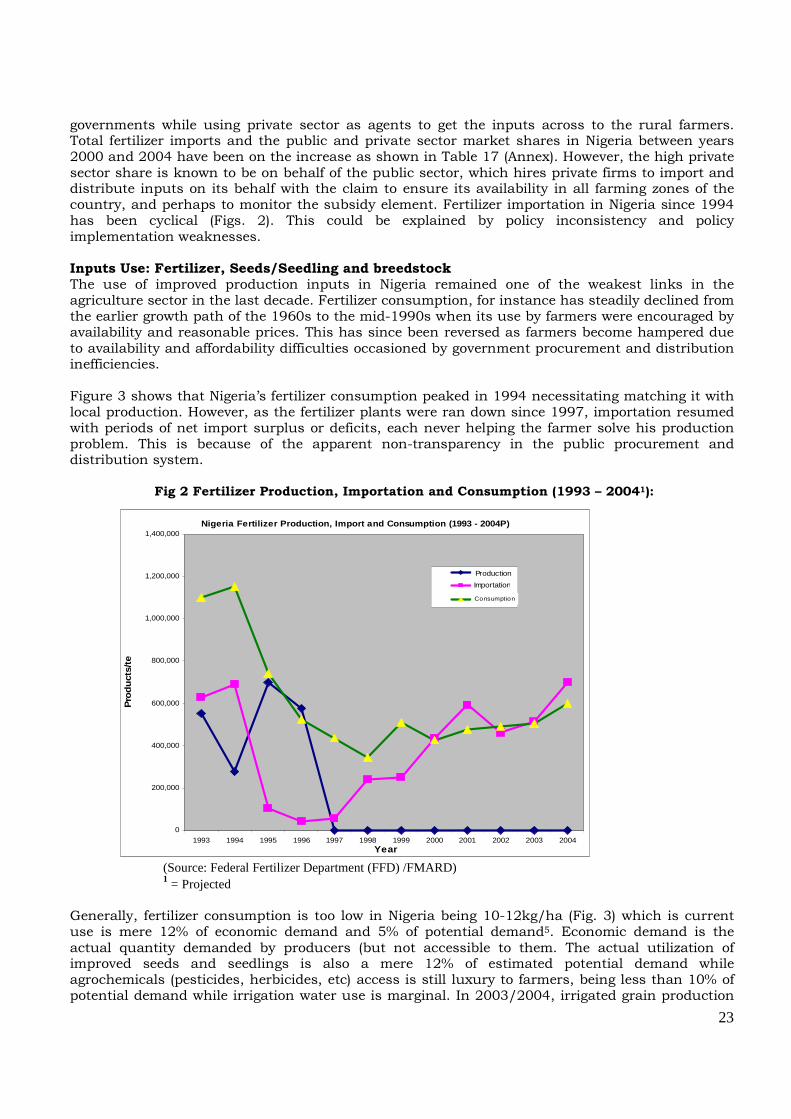
governments while using private sector as agents to get the inputs across to the rural farmers. Total fertilizer imports and the public and private sector market shares in Nigeria between years 2000 and 2004 have been on the increase as shown in Table 17 (Annex). However, the high private sector share is known to be on behalf of the public sector, which hires private firms to import and distribute inputs on its behalf with the claim to ensure its availability in all farming zones of the country, and perhaps to monitor the subsidy element. Fertilizer importation in Nigeria since 1994 has been cyclical (Figs. 2). This could be explained by policy inconsistency and policy implementation weaknesses. Inputs Use: Fertilizer, Seeds/Seedling and breedstock The use of improved production inputs in Nigeria remained one of the weakest links in the agriculture sector in the last decade. Fertilizer consumption, for instance has steadily declined from the earlier growth path of the 1960s to the mid-1990s when its use by farmers were encouraged by availability and reasonable prices. This has since been reversed as farmers become hampered due to availability and affordability difficulties occasioned by government procurement and distribution inefficiencies. Figure 3 shows that Nigeria’s fertilizer consumption peaked in 1994 necessitating matching it with local production. However, as the fertilizer plants were ran down since 1997, importation resumed with periods of net import surplus or deficits, each never helping the farmer solve his production problem. This is because of the apparent non-transparency in the public procurement and distribution system.
Fig 2 Fertilizer Production, Importation and Consumption (1993 – 20041):
Nigeria Fertilizer Production, Import and Consumpti on (1993 - 2004P)
0
200,000
400,000
600,000
800,000
1,000,000
1,200,000
1,400,000
1993 1994 1995 1996 1997 1998 1999 2000 2001 2002 2003 2004Year
Pro
duct
s/te
Series1
Series2
Series3
Production
Importation
Consumption
(Source: Federal Fertilizer Department (FFD) /FMARD) 1 = Projected
Generally, fertilizer consumption is too low in Nigeria being 10-12kg/ha (Fig. 3) which is current use is mere 12% of economic demand and 5% of potential demand5. Economic demand is the actual quantity demanded by producers (but not accessible to them. The actual utilization of improved seeds and seedlings is also a mere 12% of estimated potential demand while agrochemicals (pesticides, herbicides, etc) access is still luxury to farmers, being less than 10% of potential demand while irrigation water use is marginal. In 2003/2004, irrigated grain production
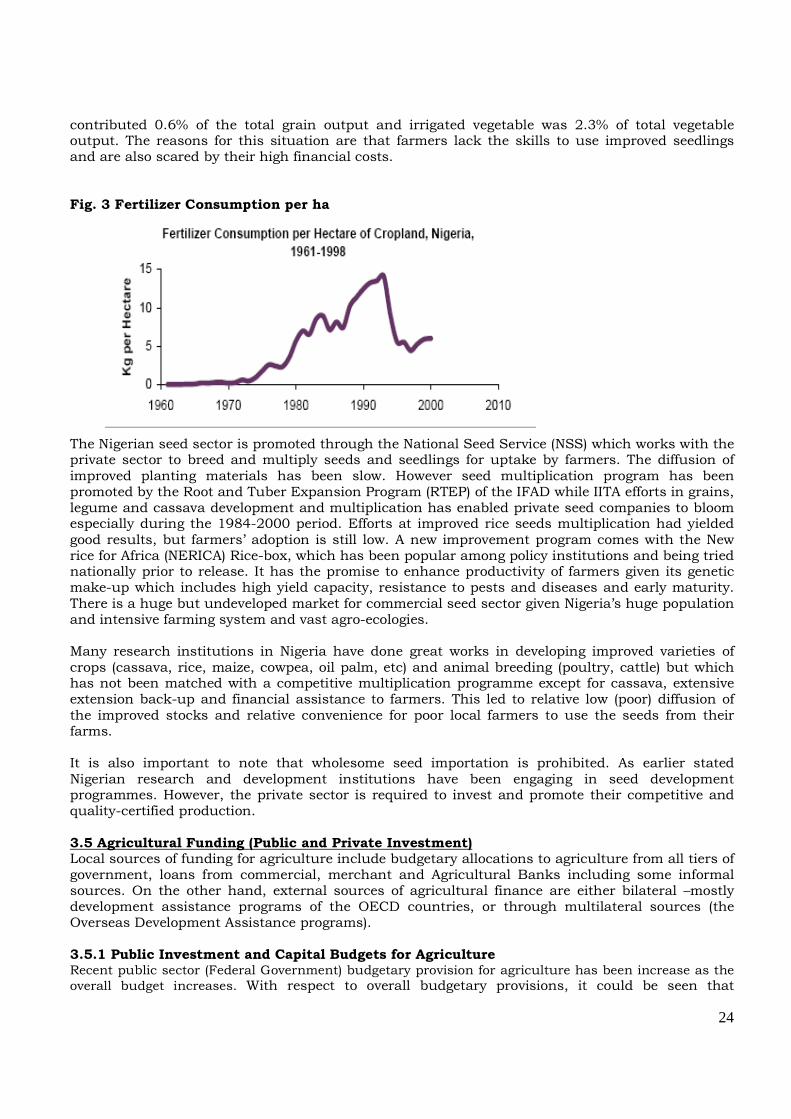
24
contributed 0.6% of the total grain output and irrigated vegetable was 2.3% of total vegetable output. The reasons for this situation are that farmers lack the skills to use improved seedlings and are also scared by their high financial costs. Fig. 3 Fertilizer Consumption per ha The Nigerian seed sector is promoted through the National Seed Service (NSS) which works with the private sector to breed and multiply seeds and seedlings for uptake by farmers. The diffusion of improved planting materials has been slow. However seed multiplication program has been promoted by the Root and Tuber Expansion Program (RTEP) of the IFAD while IITA efforts in grains, legume and cassava development and multiplication has enabled private seed companies to bloom especially during the 1984-2000 period. Efforts at improved rice seeds multiplication had yielded good results, but farmers’ adoption is still low. A new improvement program comes with the New rice for Africa (NERICA) Rice-box, which has been popular among policy institutions and being tried nationally prior to release. It has the promise to enhance productivity of farmers given its genetic make-up which includes high yield capacity, resistance to pests and diseases and early maturity. There is a huge but undeveloped market for commercial seed sector given Nigeria’s huge population and intensive farming system and vast agro-ecologies. Many research institutions in Nigeria have done great works in developing improved varieties of crops (cassava, rice, maize, cowpea, oil palm, etc) and animal breeding (poultry, cattle) but which has not been matched with a competitive multiplication programme except for cassava, extensive extension back-up and financial assistance to farmers. This led to relative low (poor) diffusion of the improved stocks and relative convenience for poor local farmers to use the seeds from their farms. It is also important to note that wholesome seed importation is prohibited. As earlier stated Nigerian research and development institutions have been engaging in seed development programmes. However, the private sector is required to invest and promote their competitive and quality-certified production. 3.5 Agricultural Funding (Public and Private Investment) Local sources of funding for agriculture include budgetary allocations to agriculture from all tiers of government, loans from commercial, merchant and Agricultural Banks including some informal sources. On the other hand, external sources of agricultural finance are either bilateral –mostly development assistance programs of the OECD countries, or through multilateral sources (the Overseas Development Assistance programs). 3.5.1 Public Investment and Capital Budgets for Agriculture Recent public sector (Federal Government) budgetary provision for agriculture has been increase as the overall budget increases. With respect to overall budgetary provisions, it could be seen that
25
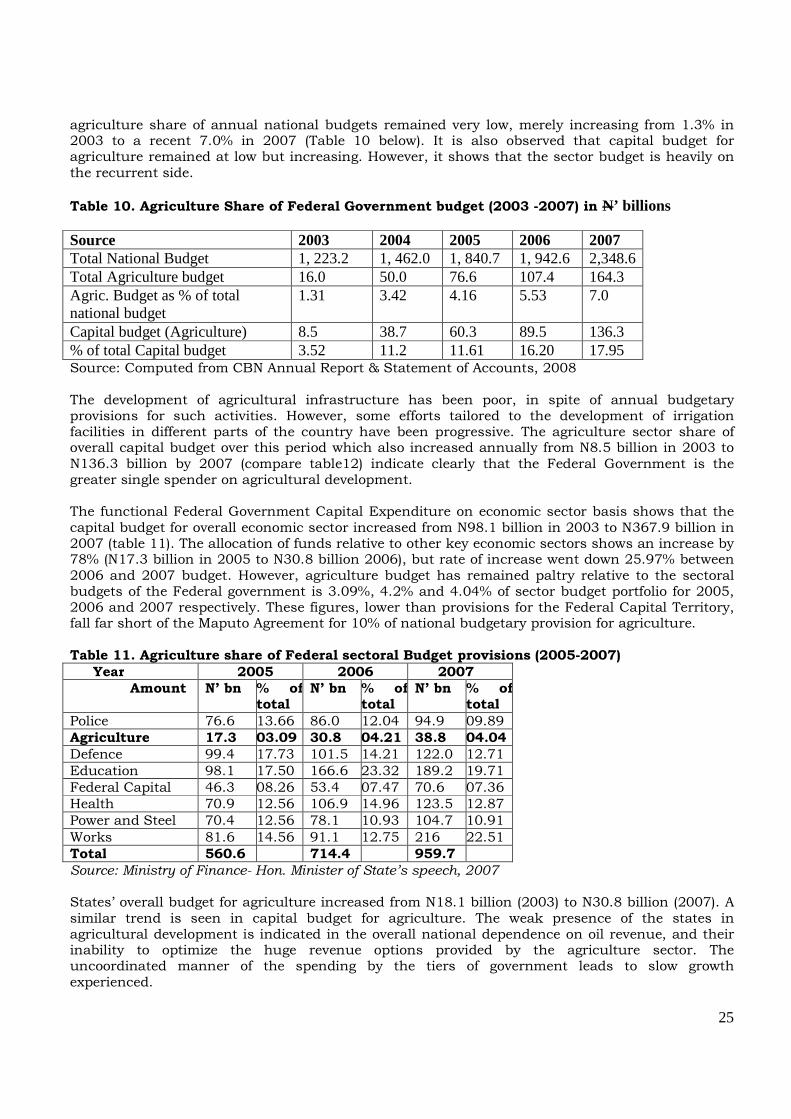
agriculture share of annual national budgets remained very low, merely increasing from 1.3% in 2003 to a recent 7.0% in 2007 (Table 10 below). It is also observed that capital budget for agriculture remained at low but increasing. However, it shows that the sector budget is heavily on the recurrent side.
Table 10. Agriculture Share of Federal Government budget (2003 -2007) in N’ billions
Source 2003 2004 2005 2006 2007 Total National Budget 1, 223.2 1, 462.0 1, 840.7 1, 942.6 2,348.6 Total Agriculture budget 16.0 50.0 76.6 107.4 164.3 Agric. Budget as % of total national budget
1.31 3.42 4.16 5.53 7.0
Capital budget (Agriculture) 8.5 38.7 60.3 89.5 136.3 % of total Capital budget 3.52 11.2 11.61 16.20 17.95 Source: Computed from CBN Annual Report & Statement of Accounts, 2008 The development of agricultural infrastructure has been poor, in spite of annual budgetary provisions for such activities. However, some efforts tailored to the development of irrigation facilities in different parts of the country have been progressive. The agriculture sector share of overall capital budget over this period which also increased annually from N8.5 billion in 2003 to N136.3 billion by 2007 (compare table12) indicate clearly that the Federal Government is the greater single spender on agricultural development. The functional Federal Government Capital Expenditure on economic sector basis shows that the capital budget for overall economic sector increased from N98.1 billion in 2003 to N367.9 billion in 2007 (table 11). The allocation of funds relative to other key economic sectors shows an increase by 78% (N17.3 billion in 2005 to N30.8 billion 2006), but rate of increase went down 25.97% between 2006 and 2007 budget. However, agriculture budget has remained paltry relative to the sectoral budgets of the Federal government is 3.09%, 4.2% and 4.04% of sector budget portfolio for 2005, 2006 and 2007 respectively. These figures, lower than provisions for the Federal Capital Territory, fall far short of the Maputo Agreement for 10% of national budgetary provision for agriculture. Table 11. Agriculture share of Federal sectoral Budget provisions (2005-2007)
Year 2005 2006 2007
Amount N’ bn % of total
N’ bn % of total
N’ bn % of total
Police 76.6 13.66 86.0 12.04 94.9 09.89 Agriculture 17.3 03.09 30.8 04.21 38.8 04.04
Defence 99.4 17.73 101.5 14.21 122.0 12.71 Education 98.1 17.50 166.6 23.32 189.2 19.71 Federal Capital 46.3 08.26 53.4 07.47 70.6 07.36 Health 70.9 12.56 106.9 14.96 123.5 12.87 Power and Steel 70.4 12.56 78.1 10.93 104.7 10.91 Works 81.6 14.56 91.1 12.75 216 22.51 Total 560.6 714.4 959.7
Source: Ministry of Finance- Hon. Minister of State’s speech, 2007 States’ overall budget for agriculture increased from N18.1 billion (2003) to N30.8 billion (2007). A similar trend is seen in capital budget for agriculture. The weak presence of the states in agricultural development is indicated in the overall national dependence on oil revenue, and their inability to optimize the huge revenue options provided by the agriculture sector. The uncoordinated manner of the spending by the tiers of government leads to slow growth experienced.
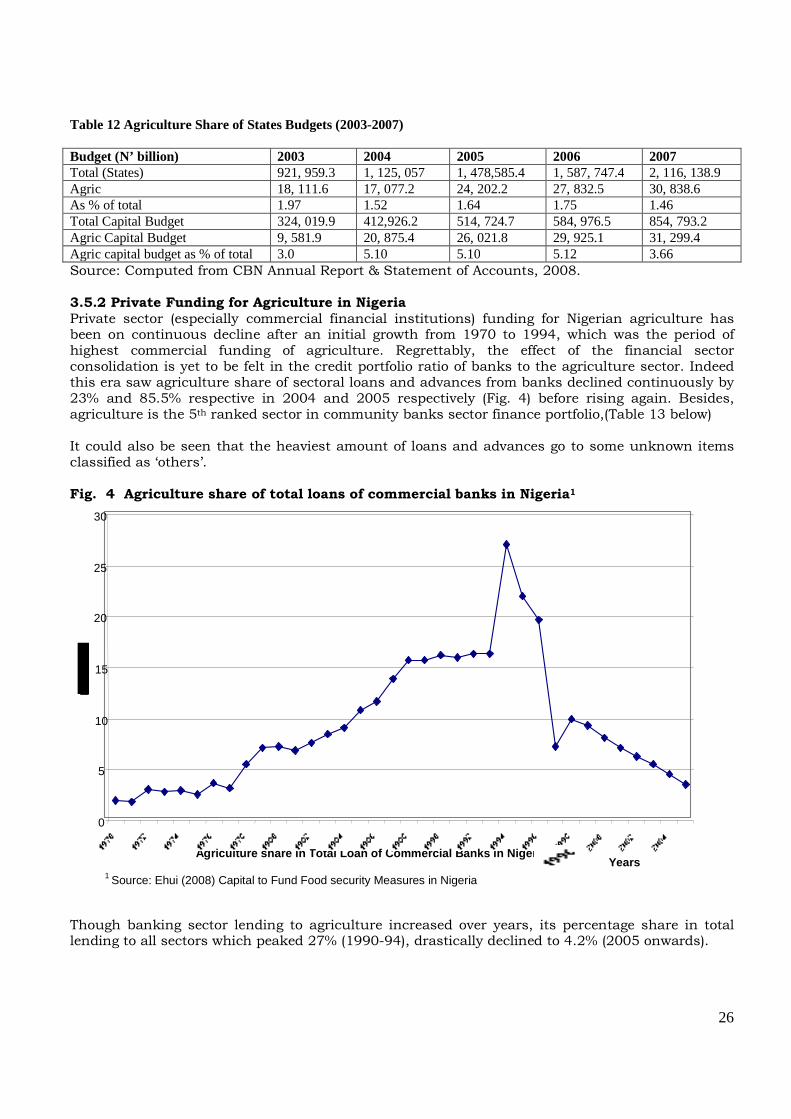
26
Table 12 Agriculture Share of States Budgets (2003-2007) Budget (N’ billion) 2003 2004 2005 2006 2007 Total (States) 921, 959.3 1, 125, 057 1, 478,585.4 1, 587, 747.4 2, 116, 138.9 Agric 18, 111.6 17, 077.2 24, 202.2 27, 832.5 30, 838.6 As % of total 1.97 1.52 1.64 1.75 1.46 Total Capital Budget 324, 019.9 412,926.2 514, 724.7 584, 976.5 854, 793.2 Agric Capital Budget 9, 581.9 20, 875.4 26, 021.8 29, 925.1 31, 299.4 Agric capital budget as % of total 3.0 5.10 5.10 5.12 3.66 Source: Computed from CBN Annual Report & Statement of Accounts, 2008. 3.5.2 Private Funding for Agriculture in Nigeria Private sector (especially commercial financial institutions) funding for Nigerian agriculture has been on continuous decline after an initial growth from 1970 to 1994, which was the period of highest commercial funding of agriculture. Regrettably, the effect of the financial sector consolidation is yet to be felt in the credit portfolio ratio of banks to the agriculture sector. Indeed this era saw agriculture share of sectoral loans and advances from banks declined continuously by 23% and 85.5% respective in 2004 and 2005 respectively (Fig. 4) before rising again. Besides, agriculture is the 5th ranked sector in community banks sector finance portfolio,(Table 13 below) It could also be seen that the heaviest amount of loans and advances go to some unknown items classified as ‘others’. Fig. 4 Agriculture share of total loans of commercial banks in Nigeria1
Though banking sector lending to agriculture increased over years, its percentage share in total lending to all sectors which peaked 27% (1990-94), drastically declined to 4.2% (2005 onwards).
Agriculture share in Total Loan of Commercial Banks in Nigeria 1 Source: Ehui (2008) Capital to Fund Food security Measures in Nigeria
0
5
10
15
20
25
30
Years
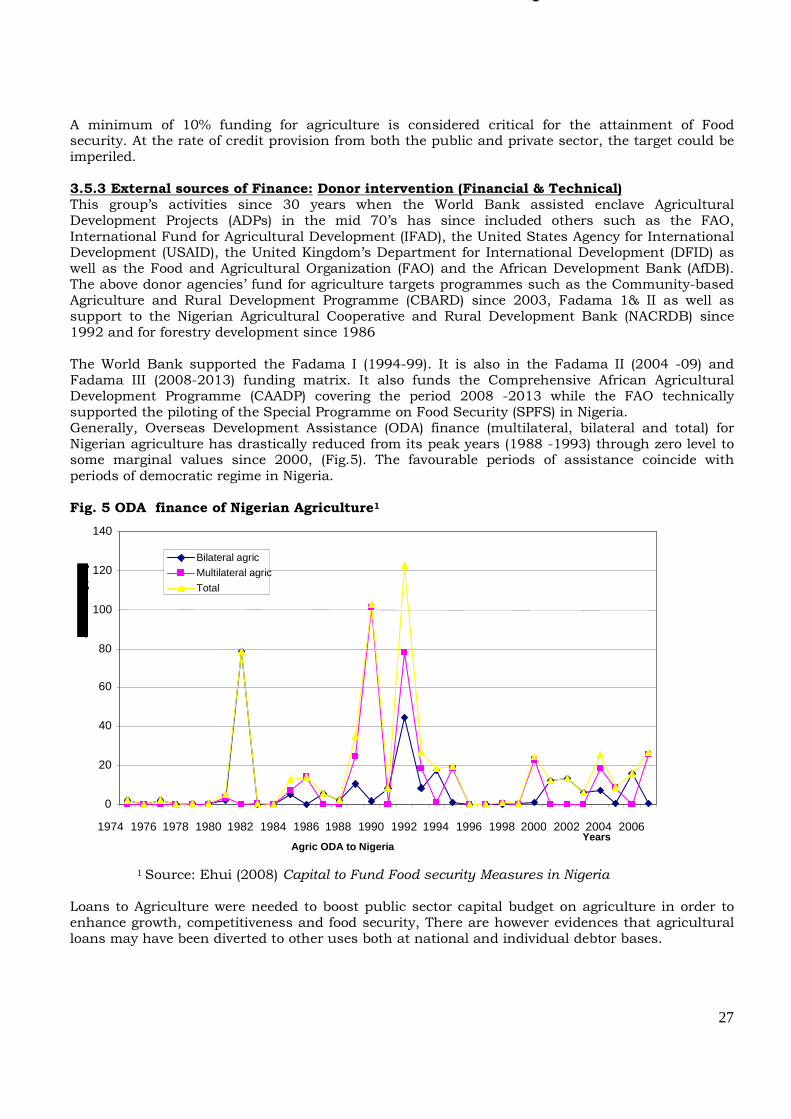
27
A minimum of 10% funding for agriculture is considered critical for the attainment of Food security. At the rate of credit provision from both the public and private sector, the target could be imperiled. 3.5.3 External sources of Finance: Donor intervention (Financial & Technical) This group’s activities since 30 years when the World Bank assisted enclave Agricultural Development Projects (ADPs) in the mid 70’s has since included others such as the FAO, International Fund for Agricultural Development (IFAD), the United States Agency for International Development (USAID), the United Kingdom’s Department for International Development (DFID) as well as the Food and Agricultural Organization (FAO) and the African Development Bank (AfDB). The above donor agencies’ fund for agriculture targets programmes such as the Community-based Agriculture and Rural Development Programme (CBARD) since 2003, Fadama 1& II as well as support to the Nigerian Agricultural Cooperative and Rural Development Bank (NACRDB) since 1992 and for forestry development since 1986 The World Bank supported the Fadama I (1994-99). It is also in the Fadama II (2004 -09) and Fadama III (2008-2013) funding matrix. It also funds the Comprehensive African Agricultural Development Programme (CAADP) covering the period 2008 -2013 while the FAO technically supported the piloting of the Special Programme on Food Security (SPFS) in Nigeria. Generally, Overseas Development Assistance (ODA) finance (multilateral, bilateral and total) for Nigerian agriculture has drastically reduced from its peak years (1988 -1993) through zero level to some marginal values since 2000, (Fig.5). The favourable periods of assistance coincide with periods of democratic regime in Nigeria. Fig. 5 ODA finance of Nigerian Agriculture1
1 Source: Ehui (2008) Capital to Fund Food security Measures in Nigeria Loans to Agriculture were needed to boost public sector capital budget on agriculture in order to enhance growth, competitiveness and food security, There are however evidences that agricultural loans may have been diverted to other uses both at national and individual debtor bases.
Agric ODA to Nigeria
0
20
40
60
80
100
120
140
1974 1976 1978 1980 1982 1984 1986 1988 1990 1992 1994 1996 1998 2000 2002 2004 2006Years
Bilateral agric
Multilateral agric
Total
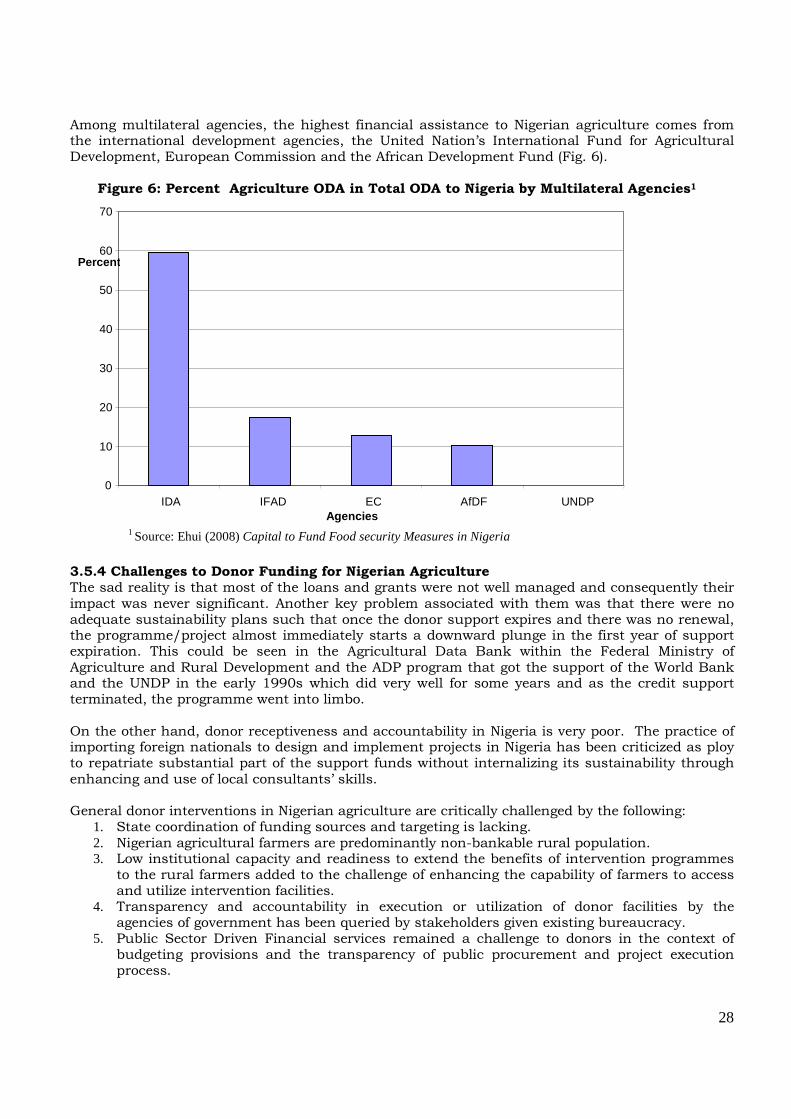
28
Among multilateral agencies, the highest financial assistance to Nigerian agriculture comes from the international development agencies, the United Nation’s International Fund for Agricultural Development, European Commission and the African Development Fund (Fig. 6). Figure 6: Percent Agriculture ODA in Total ODA to Nigeria by Multilateral Agencies1
3.5.4 Challenges to Donor Funding for Nigerian Agriculture The sad reality is that most of the loans and grants were not well managed and consequently their impact was never significant. Another key problem associated with them was that there were no adequate sustainability plans such that once the donor support expires and there was no renewal, the programme/project almost immediately starts a downward plunge in the first year of support expiration. This could be seen in the Agricultural Data Bank within the Federal Ministry of Agriculture and Rural Development and the ADP program that got the support of the World Bank and the UNDP in the early 1990s which did very well for some years and as the credit support terminated, the programme went into limbo. On the other hand, donor receptiveness and accountability in Nigeria is very poor. The practice of importing foreign nationals to design and implement projects in Nigeria has been criticized as ploy to repatriate substantial part of the support funds without internalizing its sustainability through enhancing and use of local consultants’ skills. General donor interventions in Nigerian agriculture are critically challenged by the following:
1. State coordination of funding sources and targeting is lacking. 2. Nigerian agricultural farmers are predominantly non-bankable rural population. 3. Low institutional capacity and readiness to extend the benefits of intervention programmes
to the rural farmers added to the challenge of enhancing the capability of farmers to access and utilize intervention facilities.
4. Transparency and accountability in execution or utilization of donor facilities by the agencies of government has been queried by stakeholders given existing bureaucracy.
5. Public Sector Driven Financial services remained a challenge to donors in the context of budgeting provisions and the transparency of public procurement and project execution process.
0
10
20
30
40
50
60
70
IDA IFAD EC AfDF UNDPAgencies
Percent
1 Source: Ehui (2008) Capital to Fund Food security Measures in Nigeria
29
6. Poor infrastructure and market value added diminish the impact of donor interventions in the growth and competitive development of the sector. The market is characterized by poor competitive capacity, absence of market information infrastructure
7. The capacity of non-state actors/civil society organizations is weak to become effective vehicles for the donor projects.
3.6 Sector Institutional Setting There are many institutions that service this sector. All of these are funded and controlled by the government at the federal, state and local governments. Some of these institutions include the Federal Ministry of Agriculture and Rural Development and its many departments and agencies (MDAs) including research institutes and educational institutions, and the federal ministry of Commerce and Industry (some of which agencies have tangential beneficial roles for agriculture). At the states level also, there are similar setting. However, the plethoras of institutions that promote the sector’s development have not made the required complementary impact. This is attested by continuing sector difficulties, uncompetitive and weak chain linkages and poor quality products leaving agricultural export products to be raw commodities. Producers are in turn trapped in a vicious cycle of poverty. 3.6.1 Ministries, Departments and Agencies The ministries and agencies with mandate on the development of aspects of the agriculture sector include the Federal Ministries of Agriculture and Rural Development (FMARD), Commerce and Industry and Finance. Some of the very important departments of FMARD include the Planning, Research and Statistics, the Projects Coordinating Unit (PCU) and the Federal Fertilizer Department (FFD), Department of Irrigation and the Rural Development Department. Agencies include the National Strategic Food Reserve and the River Basin Development Authorities (RBDA). Others are the financial and risk-mitigation institutions – the Nigerian Agricultural Cooperative and Development Banks (NACRDB) and Nigerian Agricultural Insurance Corporation (NAIC). 3.6.2 Research Institutions There are several agricultural research institutions in Nigeria. Some of them include the National Cereals Research Institute (NCRI), the National Root Crops Research Institute (NRCRI) and the Institute of Agricultural Research (IAR). Others are the Cocoa Research Institute of Nigeria (CRIN), the Rubber Research Institute of Nigeria, the National Institute for Horticultural Research (NIHORT), National Institute for Oil palm Research (NIFOR) and National Agricultural Extension Research and Liaison Service. Others still include the National Veterinary Research Institute, Kainji Lake Research Institute, Leather Research Institute, Lake Chad Research Institute, the Nigerian Stored Products Research Institute, the Nigerian Institute of Trypanosomiasis Research, Nigerian Institute of Oceanography and Marine Research and Institute of Agricultural Research and Training. There is also the National Center for Agricultural Mechanization.
The impact of the several institutions and research institutes is yet to be assessed. It has been argued that the absence of the Agricultural Research Council has largely negatively affected the influence of these institutions on agricultural sector development. There are three special universities of Agriculture in Abeokuta, Makurdi and Umudike while almost all 27 Federal universities have faculties that train and graduate students in agriculture. 3.7 The Private sector and Civil Society in Nigeria’s agricultural development The term Private Sector refers to the part of the economy of the country that is not under the direct control of the government. They include direct producers or investors (farmers, processors, marketers/exporters) and policy activists/think tanks (NESG, FIF, AIAE) and some international research institutions (IITA, IFDC, and the International Livestock Research Institute (ILRI).
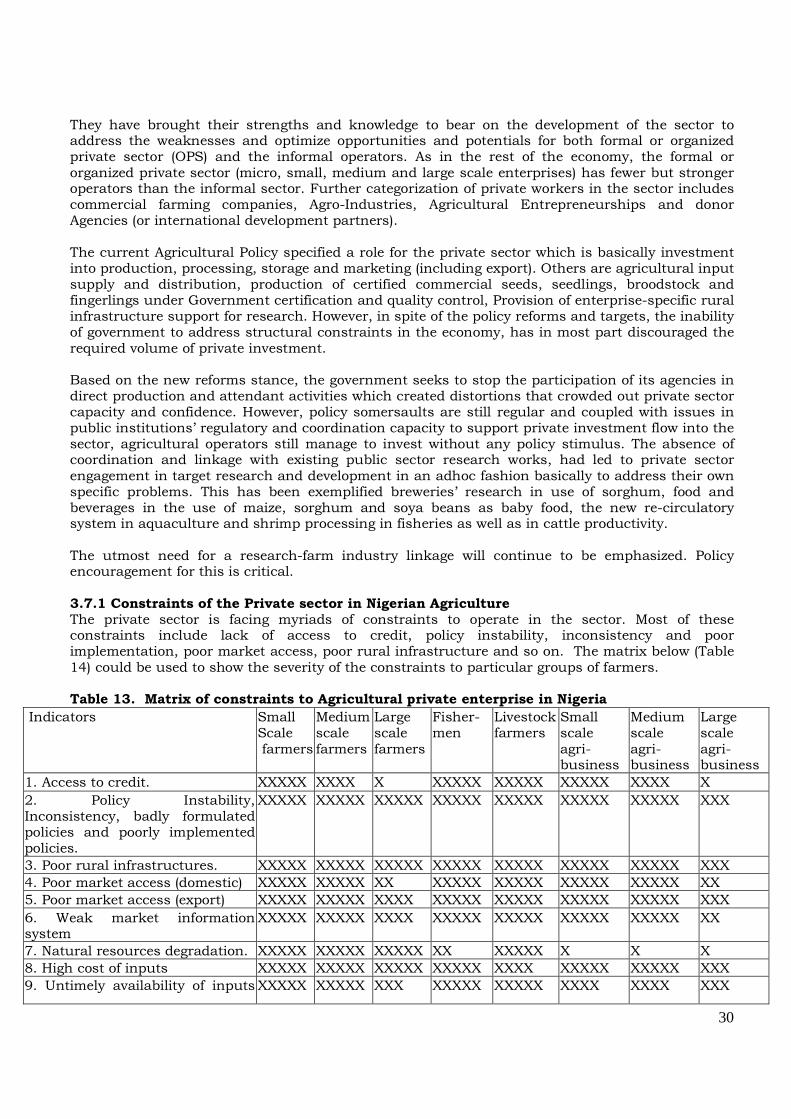
30
They have brought their strengths and knowledge to bear on the development of the sector to address the weaknesses and optimize opportunities and potentials for both formal or organized private sector (OPS) and the informal operators. As in the rest of the economy, the formal or organized private sector (micro, small, medium and large scale enterprises) has fewer but stronger operators than the informal sector. Further categorization of private workers in the sector includes commercial farming companies, Agro-Industries, Agricultural Entrepreneurships and donor Agencies (or international development partners). The current Agricultural Policy specified a role for the private sector which is basically investment into production, processing, storage and marketing (including export). Others are agricultural input supply and distribution, production of certified commercial seeds, seedlings, broodstock and fingerlings under Government certification and quality control, Provision of enterprise-specific rural infrastructure support for research. However, in spite of the policy reforms and targets, the inability of government to address structural constraints in the economy, has in most part discouraged the required volume of private investment. Based on the new reforms stance, the government seeks to stop the participation of its agencies in direct production and attendant activities which created distortions that crowded out private sector capacity and confidence. However, policy somersaults are still regular and coupled with issues in public institutions’ regulatory and coordination capacity to support private investment flow into the sector, agricultural operators still manage to invest without any policy stimulus. The absence of coordination and linkage with existing public sector research works, had led to private sector engagement in target research and development in an adhoc fashion basically to address their own specific problems. This has been exemplified breweries’ research in use of sorghum, food and beverages in the use of maize, sorghum and soya beans as baby food, the new re-circulatory system in aquaculture and shrimp processing in fisheries as well as in cattle productivity. The utmost need for a research-farm industry linkage will continue to be emphasized. Policy encouragement for this is critical. 3.7.1 Constraints of the Private sector in Nigerian Agriculture The private sector is facing myriads of constraints to operate in the sector. Most of these constraints include lack of access to credit, policy instability, inconsistency and poor implementation, poor market access, poor rural infrastructure and so on. The matrix below (Table 14) could be used to show the severity of the constraints to particular groups of farmers. Table 13. Matrix of constraints to Agricultural private enterprise in Nigeria
Indicators Small Scale farmers
Medium scale farmers
Large scale farmers
Fisher- men
Livestock farmers
Small scale agri- business
Medium scale agri- business
Large scale agri- business
1. Access to credit. XXXXX XXXX X XXXXX XXXXX XXXXX XXXX X
2. Policy Instability, Inconsistency, badly formulated policies and poorly implemented policies.
XXXXX XXXXX XXXXX XXXXX XXXXX XXXXX XXXXX XXX
3. Poor rural infrastructures. XXXXX XXXXX XXXXX XXXXX XXXXX XXXXX XXXXX XXX 4. Poor market access (domestic) XXXXX XXXXX XX XXXXX XXXXX XXXXX XXXXX XX 5. Poor market access (export) XXXXX XXXXX XXXX XXXXX XXXXX XXXXX XXXXX XXX
6. Weak market information system
XXXXX XXXXX XXXX XXXXX XXXXX XXXXX XXXXX XX
7. Natural resources degradation. XXXXX XXXXX XXXXX XX XXXXX X X X 8. High cost of inputs XXXXX XXXXX XXXXX XXXXX XXXX XXXXX XXXXX XXX 9. Untimely availability of inputs XXXXX XXXXX XXX XXXXX XXXXX XXXX XXXX XXX
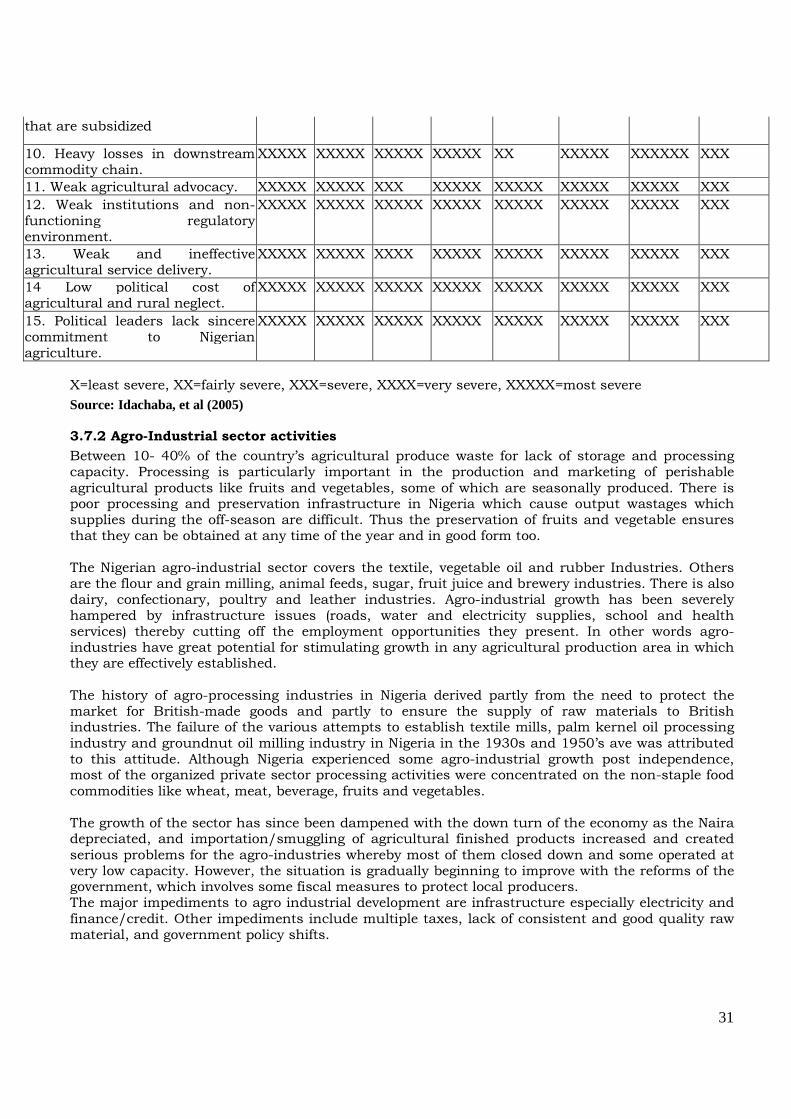
31
that are subsidized
10. Heavy losses in downstream commodity chain.
XXXXX XXXXX XXXXX XXXXX XX XXXXX XXXXXX XXX
11. Weak agricultural advocacy. XXXXX XXXXX XXX XXXXX XXXXX XXXXX XXXXX XXX
12. Weak institutions and non-functioning regulatory environment.
XXXXX XXXXX XXXXX XXXXX XXXXX XXXXX XXXXX XXX
13. Weak and ineffective agricultural service delivery.
XXXXX XXXXX XXXX XXXXX XXXXX XXXXX XXXXX XXX
14 Low political cost of agricultural and rural neglect.
XXXXX XXXXX XXXXX XXXXX XXXXX XXXXX XXXXX XXX
15. Political leaders lack sincere commitment to Nigerian agriculture.
XXXXX XXXXX XXXXX XXXXX XXXXX XXXXX XXXXX XXX
X=least severe, XX=fairly severe, XXX=severe, XXXX=very severe, XXXXX=most severe
Source: Idachaba, et al (2005)
3.7.2 Agro-Industrial sector activities
Between 10- 40% of the country’s agricultural produce waste for lack of storage and processing capacity. Processing is particularly important in the production and marketing of perishable agricultural products like fruits and vegetables, some of which are seasonally produced. There is poor processing and preservation infrastructure in Nigeria which cause output wastages which supplies during the off-season are difficult. Thus the preservation of fruits and vegetable ensures that they can be obtained at any time of the year and in good form too. The Nigerian agro-industrial sector covers the textile, vegetable oil and rubber Industries. Others are the flour and grain milling, animal feeds, sugar, fruit juice and brewery industries. There is also dairy, confectionary, poultry and leather industries. Agro-industrial growth has been severely hampered by infrastructure issues (roads, water and electricity supplies, school and health services) thereby cutting off the employment opportunities they present. In other words agro-industries have great potential for stimulating growth in any agricultural production area in which they are effectively established. The history of agro-processing industries in Nigeria derived partly from the need to protect the market for British-made goods and partly to ensure the supply of raw materials to British industries. The failure of the various attempts to establish textile mills, palm kernel oil processing industry and groundnut oil milling industry in Nigeria in the 1930s and 1950’s ave was attributed to this attitude. Although Nigeria experienced some agro-industrial growth post independence, most of the organized private sector processing activities were concentrated on the non-staple food commodities like wheat, meat, beverage, fruits and vegetables. The growth of the sector has since been dampened with the down turn of the economy as the Naira depreciated, and importation/smuggling of agricultural finished products increased and created serious problems for the agro-industries whereby most of them closed down and some operated at very low capacity. However, the situation is gradually beginning to improve with the reforms of the government, which involves some fiscal measures to protect local producers. The major impediments to agro industrial development are infrastructure especially electricity and finance/credit. Other impediments include multiple taxes, lack of consistent and good quality raw material, and government policy shifts.
32
3.7.3 Agricultural Entrepreneurship Development in Nigeria
In the last several years, agricultural entrepreneurship growth in Nigeria has grown more slowly and developed less because of the structural bottlenecks that affect the overall business sector. This also includes the overbearing and skewed presence of government in productive segments. Consequently young people and modern skills are not attracted to the farm, being associated with poverty. The myriads of problems confronting entrepreneurship in the sector generally includes low technology application, lack of infrastructure and lack of finance which paints the wrong picture that Nigerian agriculture is not meant for big ticket entrepreneurship.
3.7.4 Non-Agricultural Private sector Activities
The Nigerian agricultural sector relies on a number of other sectors for its effective performance. Among these are infrastructure, transportation, input supply, telecommunication, commerce, financial institutions and education, etc. sectors. It would be appropriate to examine how some of these sectors have performed relative to Nigeria’s agricultural development Infrastructure and Transport: The absence of railway transport system causes critical difficulties in moving agricultural produce. The colonial days in Nigeria saw the extensive use of the railway system to move agricultural produce. Rural and urban transport and market infrastructures have been in very bad condition, negatively affecting agricultural growth. Input supply and distribution: Government heavy presence in agrochemicals procurement and seeds development (NSS) has already been noted. However, the observed inefficiencies appear to be receiving some policy attention with recent rescaling of the procurement companies and the procedures. Since the private sector is believed to more efficiently provide input supply functions in the sector, the government is expected to deepen the visibility capacity of competitive private supply of all agricultural inputs, strengthen its regulatory and coordinating functions and create the environment of policy consistency to further attract private investment and competition. Telecommunications: This is very basic in reducing over head cost of agricultural business. The recent boom in the wireless system of telecommunication (GSM) has indeed permeated the rural areas. However, it is known if has helped to remove middlemen exploitation of the rural farmer by paying very low farm gate prices given an uncoordinated market information system. Financial Institutions: The role of financial sector operators in agricultural development has been in a subdued manner. Peasant and small-scale farmers still groan under poor remunerative production and incapacity to save from their low farm income to invest in their agricultural enterprise. On the other hand Nigeria’s banking sector interest in mobilizing capital for agriculture is still very low (figure 5) due to the fear of high risk in the sector. The development institutions like the Nigerian Agricultural Cooperative and Rural Development Bank (NACRDB), Bank of Industry (BOI) and the Central Bank of Nigeria (CBN) to cater for farm finance in ways that are to marginal in solving the financial needs of farmers. However, a few private financial institutions like Union Bank, First Bank and Bank of the North, have taken the risks over the years to support the sector, without any regret. Firs Bank for instance reported over 90% repayment of its agricultural loans in some years.
3.7.5 Civil Society Organizations
There are basically four classes of non-governmental organizations working in the agriculture sector of Nigeria. They include local farmer/producer organizations, policy advocacy organizations, development partner institutions and international Non-Governmental Organizations (refer to the CSO Mapping document). These groups of organizations have been increasing their visibility and vibrancy in the sector for some years now, increasingly positioning to be more relevantly involved in government policy implementation processes and even with the development partners helping to improve the space for policy and programmes implementation interactions: discussion, exchange, sharing experience and implementing programmes to promote food security and poverty reduction.
33
The development partner agencies such as DFID, USAID, CIDA and GTZ have enough financial and other resource capacity for influencing the government policy processes. They however always tried to do this with local private and civil society organizations (PSO and CSOs) thereby enabling them to also build advocacy capacity. Similarly international organizations such as Oxfam, UN, UNDP, FAO, IFAD, CGIAR (IITA, IFPRI, etc) also With the assistance of Government and other Stakeholders they stand a good chance of being good representatives of the rural populace who still have a better foundation for accountability and principle of inclusiveness. These organizations lack organizational ability, sincerity of purpose, and may not be business oriented. They have also demonstrated very low advocacy skills to be able to influence the policy agenda. 3.8 The future development of the Nigerian agricultural sector: the Growth drivers Nigeria’s economic prospects as forecasted economic growth rates show it will continue to rely heavily on the support of the agricultural sector. It still has the employment and wealth creation potential, remains the most opportunistic to enhance employment and enterprise development as well as poverty reduction as well as the achievement of the millennium development goals (MDGs) since 60% of the Nigerian poor is in agriculture and 70% of agricultural population is poor. Besides non-oil export revenue and economic diversification prospects show that more than 80% of non-oil foreign exchange earnings come from agricultural exports. 3.8.1 Drivers of Growth The sector growth drivers will include a committed and informed farming population engaged on full exploitation of the large cultivable land mass. Strong domestic markets, a virile and growing agribusiness subsector serviced by strong and efficient input supply systems to create the appropriate and cost competitive environment and an increasing investment (private and public sectors) are critical. Importantly, effective implementation of policy strategies will drive growth in the future. The replication of the Zimbabwean Farmers model in Kwara State, increased and improved financial sector intervention (credit and insurance) and agricultural and rural infrastructure (e.g. irrigation facility) provision will create a dynamo effect. The agriculture sector potential is yet to exploited as a major driver of the Nigerian economy. The future trajectory of the sector will be to achieve increased productivity. Some efforts in rice have shown the capacity to achieve international yields in Nigeria even on small farms which necessarily requires increased use of improved technology in production and efficient services delivery. In the near future, it is expected that small farmers’ access to inputs in the right time and quality will have to improve. The optimism in this direction is due to the government’s plan to withdraw fully from inputs procurement and distribution in the next five years in a phased manner. This has been a major problem of small farms productivity. The sector obviously tends to commercial and large scale farming orientation. Given the structure of the population of small farmers and their incapacity to adopt improved production practices, the Nigerian agriculture sector must be commercial and large scale oriented to attain high productivity and competitive levels. This is already happening with the Nigerian Zimbabwean Farmers model in Kwara State and the adoption of such model by some states. This will enable existing commercial farms to upgrade capacity. It must be noted that the initial displacement of some population of peasant farmers by the evolution of large scale farming will provide several employment niches for the displaced small on-farm producers to play and earn higher remunerative income. Secondly, the farmers that still play along with large scale operator will acquire increased knowledge in farming, quality production and the benefit of ready market knowledge. Therefore, whether in the short, medium or long run, the evolution of large scale farms is a sustainable means of increased overall national agricultural competitiveness and value chains development. The sector value chain will also develop more robustly as large scale farming schemes emerge and productivity increases are achieved. The development of the agro-industrial sub-sector will be critical to the sector’s domestic and international market competitiveness.
34
Akin to the above is the expansion of irrigation facilities to encourage and enhance productivity and production growth. The market for agricultural produce will need to grow (both domestic and foreign). Given Nigeria’s huge population which serves a one big market, as well as the regional and subregional markets, the sector actually requires high volume and valued activities to exploit the market opportunities. As economic infrastructure provision become more responsive the processing capacity of the sector will grow tremendously and the agro-industrial sector will produce more agro-based manufactures that could compete in the global markets. The achievement of standards and phyto-sanitary standards will also enable the sector to take opportunities presented by bilateral and multi-lateral trade agreement with Nigeria entered with European countries. It is at this point that the influence of external factors (globalization, WTO rules and farm subsidies) become reduced to enable the exploitation of international markets. A strong private sector led inputs supply sector will recreate efficiency and competition which will drive farm productivity up. Consequently, farm efficiency and higher remunerative incomes will help to reduce poverty among rural farmers including women. A success in this will encourage the development of other market mechanism such as the commodity exchange Public investment is critical. An improved public allocation of finance to the sector must be at least 10%, especially when countries like Cote D’Ivoire, Ghana and Ethiopia fund agriculture at 12.6%, 11.01% and 15% respectively. The incentivisation of private financial operators to fund agriculture will be necessary or the application of regulatory measures to that effect, in the light of a successful consolidation. The above will be dependent on the emplacement of appropriate infrastructure (especially power and transportation) and consistent and stable policy that ensure a sustainable cost of business in other to be competitive. For instance, there is still a high input handling cost in Nigeria. The cost of port handling of agrochemicals (including fertilizer) is $566/metric tonne, while it is $212/mt in Indonesia, $221/mt in Bangladesh and $327/mt in Thailand. Above all, the involvement of stakeholders in the policy process and strengthening of producer associations will add immense value to a speedy development of Nigerian agriculture. 3.8.2 Large Scale versus Small scale Agriculture in Nigeria Generally large scale farming is most commonly defined in terms of land area under cultivation – (large farm sizes range over 10 ha), high technology use, large amounts of inputs (modern, improved) and outputs. Small scale and family farms in Nigeria consist of those that generally range 0.2 to 2.0 ha. They still consist over 90% of farm holding and farm employment in the sector, Large scale farms described in terms of pure commercial orientation and technology-heavy (modern mechanical, chemical and biological inputs) activities are very few. Large farms are generally agreed to be more economically efficient, competitive and profitable due to lower average unit costs (economies of scale) than small farms as well as the capacity for commercial market bargains. It is also considered to have higher productivity measured as total yield /ha of usually a mono-crop. On the other hand small farms utility is in total farm out comprising of all commodities in a mix crop or mix-farm model2. Indeed Tables 5 and 7 above indicate that the bulk of agricultural production (both food and cash crops) in Nigeria is at the level of small and family farms. This has, of course, been linked with the low productivity of Nigerian agriculture. It is also a major reason most policy and programmes of the government and the development community are tailored to develop the small farmer. The several farmer/producer associations are also weaved around small farmers. Even the cash crops such as cocoa, rubber, oil palm and cotton are mainly small holder productions (see tables 3, and 9). Over 90% of Nigeria’s agricultural produce is therefore still from the output of the small farmer.
35
Basically, due to high risks in the sector, there is low level of private investment and therefore relatively few large commercial enterprises operate in agriculture. This has been also due to high domestic costs, inadequate and poorly maintained infrastructure (about 60% of rural roads are poor) and other factors such as inadequate storage, processing and marketing facilities which involves heavy costs on operators/investor. There is also the case of high regulatory compliance costs and other official (corruption) and social vices that deter Foreign Direct Investment (FDI) into the sector. However, a few large commercial farmers exist which include those in oil palm production and process (Plantation Owners Forum) and the Mango Growers Association. These are associations of tree crops production and processing operators. Obviously, given the high risk levels in the sector occasioned by lack of small farmers’ capacity -low input access and use (including land), low market orientation/access and weak access to private finance, farmer productivity is not guaranteed in a sustainable manner. This obviously makes small scale farm less preferred if competitiveness will be achieved in the sector. There is, however, a hybrid model that ensures that small farmers are mainstreamed into large scale production architecture. This has been promoted in Nigeria through the private sector directed Nucleus Estate Initiative and the Zimbabwean Commercial Farmers Association project in Kwara and Nassarawa states. The NEI model is designed to create the room for large agricultural investments to be weaved around small farmers’ involvement in contract system enabling them access to modern production inputs, knowledge, extension services and guaranteed market. This has been employed by Olam Nigeria Ltd to a very great extent and has been used to build the capacity of farmers in Benue State, the Best Foods Ltd in poultry production in Edo State and Fuman Juice in the South west of Nigera. The NEI, a variant of the contract growing system has enabled farmers to build quality production capacity and access to efficient input sources and profitable and ready output markets. The Zimbabwean model is a large scale farming enterprise group of individual but professional large scale farmers. In the model, the Kwara State government provided a 25-year lease of community lands (who were resettled), enabling each participating expatriate farmer access to between 800 -1000 ha for farm activities. The Federal and state government also guaranteed credit facilities that some banks offered the farmers. The farmers were able to secure the necessary farm machinery and equipments through their processes and professional contacts, and have since started the processing of their initial farm produce (dairy products) as part of the chain development. They have also been a key source of training for local farmers in modern farming practices. 3.8.3 Food Security in future In a recent conference on food security organized by the Nigerian Economic Summit Group and the First Bank of Nigeria Plc, in the light of rising food prices and the attendant global food crisis, it was agreed that Nigeria must spearhead the launch of a new Green Revolution in Africa. It will be able to do so by achieving a domestic conducive policy and institutional environment that entrenches best practices and processes for stability and sustainability. Therefore Policy support structure and environment for investment in all aspects of agricultural production and its value chain must be addressed to support requisite private-public sector investments into agricultural competitiveness and food security measures. The approach will elicit a dynamic Public Private Partnership strategy. More strategically state governments will need to be involved in the National Food Reserve Agency by establishing their own agencies as part of a national food security framework. This will be great, especially when it has to be based on crop commodities that each state has a comparative and competitive advantage.
36
4.0 SUMMARY, CONCLUSIONS AND RECOMMENDATIONS FOR THE EJ PROJECT 4.1 SUMMARY This analysis has reviewed the historical development of the agricultural sector from the 1960s but more critically the recent period of economic and sector reforms (1998-2007) in Nigeria. It looked at the policy, programmes, institutional and private sector issues over this period. Sector Constraints Some of the several structural bottlenecks that beset Nigeria agricultural growth and competitiveness Policy incapacity, instability and implementation inefficiency, non-competitive Input-end subsidy administration system and poor agricultural technology and service delivery environment (inputs, extension, etc). Others are weak Infrastructure (including agricultural infrastructure) base, absence of long term finance window for agriculture (credit facility) and weak market base. There is also the case of inadequate attention to policy implementation and weak stakeholder consultation mechanism. Besides the existing institutional setting is too weak to drive sector growth and development because a poorly motivated public sector work force, high bureaucratic structures that cause high transaction costs and discourage private investment. There is also lack of managerial and resource capacity for policy and programmes coordination, priorities and target attainment. Sector Growth Following some strategic sector and national reforms efforts, the agricultural sector which hitherto was stagnant at 3% growth rate moved from 4.1% in 1998 to 7.4% by end 2007 (Table 1) and non-oil growth rate 9.61%. This was a result of a renewed attention of the government that also encouraged increasing private sector entrepreneurial activities. The official growth performance recorded however is arguably not necessarily a reflection of the effectiveness of policy implementation in the long run. It may have been due more to democratic environment that encouraged committed agricultural entrepreneurs to take advantage of the policy targets. This is obvious because in spite of the growth statistics, the value chain of the sector is still very rudimentary just as trade in agriculture and related products are also based on raw commodities. Without growth in value-added commodities and products, the recorded sector growth will not be able to unleash the potential of the sector in national economic development. However, agriculture still makes the highest contribution in national Gross Domestic Product at 41% (Table 2). The crops subsector is the biggest contributor (37%) followed by livestock (2.65%) and fisheries (1.37%) to agricultural GDP. It also contributes 80.65% of non-oil GDP. The sector also employs the greatest (over 70%) of employable labour in the economy. It still has unexploited or reserve capacity for grater employment if the value chain is developed, support infrastructure provided and policy made more rigorous and consistent. Policy Development and Programmes Implementation The sector has grown through several policy and programmes regimes. From the 1960s through the period under review several policies and programmes have been enunciated. The policies were put in place over time to guide the growth and development of the sector. The regimes covered the era of public sector involvement in agricultural production, research and marketing when policy focus was productivity and farming systems development. This was followed by the period of agricultural commercialization and private sector lead entrepreneurship in the sector (under SAP). The current period (1998-2007) could be likened to a period of competition development in agricultural production, value addition and trade especially in the light of globalization and WTO unification of the market for agriculture. Some of the programmes that are in place across these periods include the Cooperative and farm settlement establishment programmes (since 1935), establishment of research institutes (since 1964) and the agricultural finance institutions since 1973 (now known as the National Agricultural Cooperative and Rural Development Bank). Others are the Agricultural Development Projects (since 1975), the River Basin Development Authority (since 1977) and the
37
Land Use Act (1978). Other more recent policy instruments include the new National Agriculture Policy (2001), the National Economic Empowerment and Development Strategy (NEEDS), 7-Point Agenda of the sitting government and sub-sectoral policies such as Agricultural Trade Policy, National Fertilizer Policy, Agricultural Subsidy Policy and the Food Security Policy. The key feature of the policy and programmes of the sector disparate document of policy instruments, policy inconsistency and programmes poor implementation which often led to attrition. This could be seen in the National Accelerated Food Production programme (1970s), Operation Feed the Nation (1976-1979), Green Revolution (1980-83), Directorate of Foods, Roads and Rural Infrastructure (1986-1993). Others are the National Agricultural Land Development Authority (1991-1999) and recently the Presidential Initiatives on Cocoa, Cassava, Rice, Tree Crops, Oil seeds, Livestock, Fisheries and Vegetables (from 1999-2007). Recent programmes include the National Special Food Security program (NSPFS), Commerce 44, Export Expansion Grant (EEG) and the CBN’s Agricultural Credit Guarantee Scheme (ACGS). Others include the National Fadama Development Programme, National Cocoa Development Programme and the Commodity Development and Marketing Companies. This inconsistency leads to wastage of funds (and no commensurate result). A milestone was however when a coherent National Policy on Agriculture and its strategies was adopted in 1988, which was reviewed in 2001. The policy made provisions for public sector, private sector and civil society involvement in the sector. However, the provisions have not been fully implemented. Inputs, Outputs and Productivity Agricultural productivity remained an issue in the sector over the years. There is low and negligible productivity across all commodities. This has hampered wealth creation by the sector. The aggregate output of the sector grew from 165.4 million MT in 2003 to 212.8 million MT in 2007. Crops outputs growth is highest followed by livestock and fisheries (Table 4). Production is largely on small and subsistence scale of production, and the commodities include tubers (cassava, yam sweet potato, cocoyam and Irish potato), grains (maize, rice, millet and sorghum) and tree crop (cocoa, oil palm, rubber). Nigeria also produces sugar cane, cotton and several fruits (mango, cashew, orange, etc) and vegetables (tomato, okra, onion and pepper). The annual total output and cultivated areas for all crops indicate a continuous and increasing output for all the crops up to 2007 (Table 5). The inputs sector also remained problematic in terms of efficiency, availability, affordability and timeliness of supplies to farmers. Government maintains a commanding presence in the sector (fertilizer, agrochemicals and seeds). Consumption of inputs (fertilizer and agrochemicals) is on the increase, serviced by importation, while the seeds sector is predominantly domestically supplied. The government inputs subsidy programme is not seen to benefit farmers directly but is alleged to be diverted to unintended beneficiaries (middlemen) due to an inefficient and flawed input procurement, distribution and subsidy administration mechanism. Trade and Market Development Nigeria’s agricultural trade is predominantly domestic driven. This is because of non-competitive export sector caused by high business costs and non-compliance to quality standards specification of produce, which meant they could not gain access to foreign markets. The absence of developed value chains (storage, processing, marketing, etc) caused by poor physical infrastructure base and poor market information system also affected the emplacement of an effective commodity exchange mechanism that would have enhanced domestic market for agricultural produce. Finance The Federal Government is the highest spender in the sector. Recent public sector (Federal Government) budgetary provision for agriculture also increased as the overall budget increases.
38
However agriculture share of annual national budgets remained very low, merely increasing from 1.3% in 2003 to a recent 7.0% in 2007. Capital budget for agriculture was also low but increasing also indicating that sector budget is heavily on the recurrent side. Generally, agriculture budget has remained paltry relative to the sectoral budgets. States’ overall budget for agriculture increased from N18.1 billion (2003) to N30.8 billion (2007). Overall the uncoordinated manner of the spending by the tiers of government leads to slow growth experienced. On the other hand private sector (especially commercial financial institutions) funding for Nigerian agriculture has been on continuous decline. The sector also attracted external finance from bilateral and multilateral funding groups such as the World Bank assisted enclave Agricultural Development Projects (ADPs) in the mid 70’s, the International Fund for Agricultural Development (IFAD) and the United States Agency for International Development (USAID). Others are the United Kingdom’s Department for International Development (DFID) as well as the Food and Agricultural Organization (FAO) and the African Development Bank (AfDB). Some of the funded programmes included Community-based Agriculture and Rural Development Programme (CBARD), the Fadama 1& II as well as support to the Nigerian Agricultural Cooperative and Rural Development Bank (NACRDB), the Comprehensive African Agricultural Development Programme (CAADP) Special Programme on Food Security (SPFS). The favourable periods of assistance (ODA) coincide with periods of democratic regime in Nigeria. Private sector The private sector has been involved in agricultural sector as entrepreneurship promoters. However, entrepreneurship growth in the sector has been severely hindered by a combination of several factors. These include the weak financial windows or access to credit. The level of risks in Nigerian agriculture and near absence of risk mitigation windows for agriculture investment except the limited insurance cover by the poorly capitalized Nigerian Agricultural Insurance Company. Other key factors against private sector development in the sector include policy instability, inconsistency and bad policy formulation and poor implementation. There is also poor rural infrastructures which lead to heavy losses in downstream commodity chain, poor market access (domestic and export), weak market information system and ineffective system of containing natural resources degradation on a sustainable manner. There is also high cost of inputs and untimely availability of subsidized inputs due to diversion and rent tactics. Weak agricultural advocacy is complemented by weak institutions and non-functioning regulatory environment to exacerbate the existing weak and ineffective agricultural service delivery Importantly, low political cost of agricultural sector has led to continuous rural neglect and lack of sincere commitment to Nigerian agriculture by the political leadership. Civil Society in Nigerian agriculture
Four classes of non-governmental organizations work in the Nigerian agriculture sector for advocacy and finance interests. They include local farmer/producer organizations, policy advocacy organizations, development partner institutions and international Non-Governmental Organizations (refer to the CSO Mapping document). The local groups have been making efforts at increasing their visibility and vibrancy in the sector for some years now. These organizations lack organizational ability, sincerity of purpose, and may not be business oriented. They have also demonstrated very low advocacy skills to be able to influence the policy agenda. They increasingly strive to be relevantly involved in government policy implementation processes. This has not been effective because of the shut-out processes of public systems. However, this has began to improve within the democratic period. The other groups are the development partner agencies such as DFID, USAID, CIDA and GTZ which have enough financial and other resource capacity for influencing the government policy processes especially in partnership with local private and civil society organizations (PSO and CSOs) thereby enabling them to also build advocacy capacity. Similarly international organizations such as Oxfam, UN, UNDP, FAO, IFAD, CGIAR (IITA, IFPRI, etc) are also involved in the sector helping to build capacity of the poor farmers (PrOpCom), and producer organizations.
39
Gender and Poverty relations in Nigerian Agriculture The National Gender Policy reports that women are responsible for 70% of agricultural labour, 50% and 60% of animal husbandry and food processing related activities respectively, frowning at the non-reflection of women contributions in national accounting processes. It is also worried that women have access to only 20% of available agricultural resources (land, credit and inputs) which impedes their productivity while men are presumed men to be chief actors in the sector and therefore are main recipients of program-related support. It seeks the removal of all gender-based barriers against women to enhance the visibility, productivity, valuation and documentation of women contribution to the sector growth and development. But national data on farm employment shows a higher population of male farmers over female farmers in Nigeria (Table 8) a trend earlier reported by some workers1. Women could constitute more of farm labor population, but are less as farmers with final investment and production decision8, especially in the light of reasons earlier adduced by the policy document - land access and traditional heritage systems, relative severe poverty among rural women and other cultural impediments to assets acquisition. Again, while female farmer population is believed in some quarters to be very high (particularly for some farm activities like weeding), it is obvious that men are involved in more activities on-farm (land clearing, mound/ridge making, harvesting, etc). However, the number of both male and female farmers has increased over the period 1998/1999 through 2005/06 farming seasons (Table 8). Traditionally, in most parts of rural Nigeria, authority over land is vested in traditional institutions (rulers) and family heads (usually men) or formally in the state governor 9Land Use Act). This limits women access to and/or title to land as farm plots. The difficulty to access land asset obviously leads to the incidence of poverty, felt more among landless women (and widows) and resource incapacitated men. About 12 million Nigerians are reported to be food insecure7, facing hunger and starvation mostly in the rural areas and women constitute the majority of this group. Therefore specific programmes designed for gender participation help to reduce poverty among women. These include the Women in Agriculture (WIA) programme. This is promoted by the Agricultural Development Programmes, but it is not strong. It is also reported that marginalization of women is part of a set of factors that undermine agricultural productivity, others being poor farmer education, ageing workforce and health-related issues such as malaria and HIV/AIDS pandemic7
The Future of Nigerian Agriculture (the Growth Drivers) The future of Nigerian agriculture is very bright given opportunities in the exploitation of the abundant potentials. The sector growth drivers will include an informed and trained farming population, strong and developed domestic markets (huge size of Nigeria) and a virile rapidly growing agribusiness subsector. An effective and responsive service delivery sector with strong and efficient input supply systems to create the appropriate and cost competitive environment and an increasing investment (private and public sectors) are critical. Particularly, an effective implementation of policy strategies will drive growth in the future which could encourage the replication of the Zimbabwean Farmers model in Kwara State, the Nucleus Estate strategy and secure an increased and improved financial sector intermediation (credit and insurance). All of these will not yield expected result until agricultural and rural infrastructure (e.g. irrigation facility) were effectively deployed. Indeed the future trajectory of the sector will be to achieve increased productivity. Some efforts in rice have shown the capacity to achieve international yields levels in Nigeria for all crops and livestock, even on small farms. It requires economic use of improved technology in production. It also requires that small farmers’ access to inputs in the right time and quality will have improved, which makes demand on government plan to fully but gradually withdraw from inputs procurement and distribution (as planned in the next five years) and change the input system administration to aid small farms productivity. In the medium to long term, the sector obviously must nurse commercial and large scale farming
40
orientation. Given the structure of the population of small farmers, their incapacity to adopt improved production practices and the weakness of institutions to comprehensively support the sector the way it is currently, the sector must encourage large scale investments to attain high productivity and competitive levels. The Nigerian Zimbabwean Farmers in Kwara State have shown that this is feasible in short-to=-medium term, and the adoption of such model by some states is required. This will enable existing commercial farms to upgrade capacity, while initially displaced population of peasant farmers will find several operational or employment niches within the chain, to earn higher remunerative income. Secondly, the small farmers that insist on farming will acquire increased knowledge in farming (including quality production and ready market). Small vs Lager scale agriculture Generally large scale farming is most commonly defined in terms of land area under cultivation – (large farm sizes range over 10 ha), high technology use, large amounts of inputs (modern, improved) and outputs. Small scale and family farms in Nigeria consist of those that generally range 0.2 to 2.0 ha and consist over 90% of farm holdings and farm employment in the sector. Large scale farms described in terms of pure commercial orientation and technology-heavy operations (modern mechanical, chemical and biological inputs) activities are still very few. Large farms are generally agreed to be more economically efficient, competitive and profitable due to lower average unit costs (economies of scale) than small farms as well as the capacity for commercial market bargains. It is also considered to have higher productivity measured as total yield /ha of usually a mono-crop. On the other hand small farms utility is in total farm out comprising of all commodities in a mix crop or mix-farm model2. The bulk of Nigerian agricultural production (both food and cash crops) is at the level of small and family farms (Tables 5 and 7) as over 90% of Nigeria’s agricultural produce is projected as output of the small farmer. This has been linked to the low productivity of the sector, and expectedly, most policy and programmes of the government and the development community are, for this reason, tailored towards the development of the small farmer while all the several farmer/producer associations are peopled by small farmers for all crops such as cocoa, rubber, oil palm and cotton whose members are mainly small holder producers (see tables 3, and 9). The high risks fear in the sector caused a low level of private investment and therefore relatively few large commercial enterprises operate in agriculture. Furthermore, high domestic business costs, inadequate and poorly maintained infrastructure (about 60% of rural roads are poor) and other factors such as inadequate storage, processing and marketing facilities which involves heavy costs on operators/investor negatively affect investor decision into the sector. There is also the case of high regulatory compliance costs and other official (corruption) and social vices that deter Foreign Direct Investment (FDI) into the sector. However, a few large commercial farmer operators exist in oil palm production and process (Plantation Owners Forum) and fruit growers and processors. 4.2 CONCLUSIONS It is obvious that a lot of energy has been put into the agricultural sector to ensure its growth and development. It is however obvious that much of the resources expended may not have yielded commensurate benefits over the years. In conclusion, I wish to re-emphasize some of the challenges of the sector and the opportunities to address them.
• Policy inconsistency is a recurring challenge. This will not be solved if public policy processes are not made open to stakeholders during the initiation period. This will enhance a more robust think-through on policy targets and strategies.
• Weak or inadequate Policy and programmes coordination within and between the tiers of government is still inchoate. Without all programmes for agriculture (states and federal) being tied and fitted into overall national development strategy and action plans (Policy) for the sector, the disparate activities remains non-transparent and ineffective.
• It is also necessary to note that poor public investment and inefficient application of
41
budgeted finance into the sector has been a recurrent hindrance to its development. Budget appropriation is till at 7% which is not enough to develop the sector as desired (Ghana spends 11%, Ethiopia 15% and Cote d’Ivoire 12.6%). Agricultural finance from public sector must be raised beyond the present level. In fact getting Nigeria to attain its Vision 2020 requires the support of the agriculture sector which must be growing at minimum 13% per annum from now!
• Accountable, transparent and efficient application of budgetary allocation for the sector in the context existing accounting period, is still a critical challenge to ensuring that required development projects (capital), especially agricultural and rural infrastructure is efficiently provided.
• Efficiency in the inputs sector is still eluding. Without an efficient input and service delivery system in the sector, it is difficult to enhance the productivity of the farms, especially of the preponderant small farmers, attainment of quality production and capacity for market access.
• Private investment is still low. One of the greatest challenges to this is the inefficiency of public institutions in facilitating appropriate business environment, high costs of regulatory compliance as well weakened their capacity and discouraged private sector activism and big ticket investment into the sector.
• The public processes will need to open up to stakeholder involvement and inputs from policy initiation through adoption and implementation. Provision for stakeholder monitoring and evaluation of projects that define the sector strengths is still an issue. This will provide for ‘value for money’ demand from them in all areas of spending in the sector.
4.3 RECOMMENDDATIONS & ENTRY POINTS FOR ADVOCACY 4.3.1 Themes and topics for EJ Campaign Given the situation of Nigerian agriculture, in spite of its great potentials for economic competitiveness, farmer prosperity, employment generation and poverty reduction, it requires that any intervention (domestic and foreign needs of necessity to design programs that brings out these potential in to actual beneficiation. To that extent, the Economic Justice Campaign in Nigeria agriculture will work towards strengthening the farmer and farming capacity to exploit opportunities and make demand on policy institutions for incentives. The themes of the project in Nigeria could revolve around issues covering the following: 1. Small farms productivity and income enhancement program Working on small farmer issues could involve working with farmer associations to find out their immediate needs within their commodity system. However, it is obvious that access to inputs in a timely, affordable way is critical to their productivity and incomes capacity. They will need capacity for cost-effective market information, production incentives and agricultural services delivery (land, finance, agrochemicals, extension, etc). 2. Agricultural budgeting, expenditure/projects execution monitoring for value for money The ability for farmers to make demand and access policy incentives will depend on the level of openness in the execution of agricultural budgets, particularly in a wholesome implementation of capital projects that create multiplier effects on farmer productivity and markets. Monitoring of this process by the EJ Project will add tremendous value. This will however be very difficult and could attract resistance from public sector establishment. It will therefore require entry at the highest level of advocacy preferably the presidency, the Ministers of Agriculture, Finance and the account-General’s office as well as working with the Presidents’ Economic Team. 3. Campaign and Capacity building for agricultural/producers associations’ voice in the policy arena; Tangential to the above, the project will need to project producer associations as a critical leg to the success of public policies. The capacity of these groups for collective voice in the sector is critical.
42
The challenge will be to ensure that a process of getting the different associations to have a common forum for advocacy is created. It will require confidence building within and among the association, capacity for enhanced access to production inputs and technical support (office infrastructure and training) for them. This will also enhance their capacity to access inputs, policy incentives, quality and standards compliance and markets. 4. Land use reforms advocacy and Campaign Access to land remains a major challenge to agricultural enterprises. The Project could find an opportunity to lend its weight on institutions and groups that champion land reforms that benefit land owners. The NESG and USAID Reforms Project made a presentation on this during the last effort to review the constitution. The Land Use Act need first to be removed from the Nigerian Constitution to enable its review as appropriate since it is a capital law. This process has begun with the current review of the Nigerian Constitution by the National Assembly. The Campaign could find space in support agricultural associations and stakeholders in legislative lobby activities that it finds useful to the development of the sector. This includes the Agricultural Development Fund Bill, laws and other useful agricultural laws. Farmers for instance should be aided for easy titling to their land for its use as collateral for access to formal credit. 5. Policy capacity building campaign for state government policy officials In most state agencies the capacity for best practice provision of services to clients of government is nearly absent. This explains the extreme slow pace and near-inactivity at the sub-national level of government. Officials of the states that will be part of this project will need a requisite exposure to the rudiments in public service provision to the stakeholders, budget implementation and public procurement transparency. 6. Campaign for Food security and poverty reduction among rural farmers Food security measures will help to reduce the number of people exposed to hunger and starvation especially women and children. The Project will need to work with the Food Reserve Agency and the state governments participating in the project on how a more robust strategic food security policy will be implemented in a transparent manner to benefit the small farmer. 7. Campaign for Rural Infrastructure (including agricultural infrastructure) development Rural Infrastructure is critical for agricultural development. Tangent to these is agricultural infrastructure provision. These include irrigation facilities and chain development infrastructure – roads and electricity which will encourage private investments into value-addition facilities such as processing, storage and conditioning processes. 8. Campaign for Gender in Agriculture Special care for women and other vulnerable people involved in food production is a good point of impacting this special group. Also policy and legislative actions to empower men and women for access to land, credit and inputs for remunerative farming enterprise is another point of campaign.. To make a visible success of the project, it must target to solve particular farmer needs such as credit access, inputs and technology adoption. Also improved access to land by women will upgrade their visibility in agricultural and national accounts and reduce their vulnerability to poverty. 4.3.2 Policy and other related issues critical for EJ Campaign lobby and advocacy EJ Campaign must be rural domiciled. It should also be built around smallholder farmers. Whereas it will engage nationally visible stakeholders, it must of necessity involve state governments. This is to ensure that state-wide adoption of intervention values is achieved. Policy issues the project needs to tackle include budgetary provision and transparency in the agriculture
43
sector, access of farmers to production incentives and public sector use of inclusive approach in policy evolution and initiation. Policy on agricultural and social infrastructure provision will enhance the productivity of farmers and getting stakeholders to demand their and timely and efficient provision is critical to making project value-added visible. The government (ministry of agriculture and rural development) must therefore commit to policy consistency and commitment in the delivery of necessary services to farmers. The place of private sector in inputs delivery must be more visible through effective official adherence to the policy provision on this. 4.3.3 Opportunities and threats for lobbying and advocacy International organizations usually have greater or positional advantage for lobby and advocacy activities in Nigeria given that existing lobby and advocacy organizations are relatively lacking in technical and financial capacity. Also policy machinery are receptive to external interventions and inputs, in the light of bilateral relationships and the expectations of the capacity of partners to contribute to, or support policy technically and financially. The public opinion has however tilted against situations where project promoters neglect local content and owners in terms of execution. Public officials will also require that projects be mainstreamed within the overall plan of the government as designed by the Federal Ministry of Agriculture. Besides, in most cases, since the project will naturally come to an end with cessation of the promoter funding an arrangement to ensures enough capacity has been built before this period is critical. It therefore requires that the involvement of state governments’ understanding and involvement is secured early. It is also important to note that the rest stakeholders in the sector are ready to participate and make contribution to the success of the project. The involvement of non-state actors confers ownership to the project to the extent there is room for their capacity upgrade and project funding continuity. Given that project value expansion and sustainability is a major challenge to outcomes in the long run, critical non-state actors will also expect that the project is run by indigenous technical expertise with sharpened capacity to reach farmers and more importantly because of their availability for follow-up in the medium to long run period in order to ensure sustainability. A major threat to advocacy is the preponderant influence of a huge bureaucracy that weighs against needed and immediate policy actions that must also be inclusive. Advocacy and lobby engagements must therefore target very high and be focused. It must nevertheless cultivate the key directorate-level officials who wield the bureaucratic capacity to bog down implementation. 4.3.4 Sustaining the Campaign intervention The sustainability of the positive outcomes of the project intervention is particularly important to the long term interest of both the farmers, project promoters and overall sector growth. The key factor in project value sustainability is the usefulness and attainment of its objectives. In this context, the achievement of enhanced productivity and income by small scale farmers through capacity upgrade, market access opportunities (input and output) will of necessity endear them to the innovation or process they learnt. A replication plan for the positive/favourable outcomes is necessary, mainstreamed in sub-national entities (states and local governments). Thier buy-in and acceptance is important given that since farmers are generally unable to maintain a growth path, governments fiscal incentives at that level is necessary to maintain their capacity. The project will encourage state authorities to upgrade relevant rural infrastructure to open access to input availability and outputs market. Gender issues needs to be addressed in the context of sex-linked land access, farm labour contribution and income. Obviously, land use regulation will need to be reworked to ensure access to land by farmers.
44
References:
1. Akanji, Bola.O (2001) Pattern of Gender Responsibility in Tradable Crop Agriculture: A Baseline Study of selected Farming Systems in Nigeria. NISER Mimeograph No. 4. NigeriaN Institute of Social and Economic Research.
2. Azih, Innocent (2004) Policy for small farms productivity and Competitiveness in Nigeria, NESG Economic Indicators, Vol. 10 No. 3.
3. CBN (2008) 2007 Annual Report and Statement of Accounts Abuja 4. Daramola, Adebiyi. G (2004) Competitiveness of Nigerian Agriculture in a global Economy:
Any Dividends of Democracy? Inaugural Lecture Series 36, Federal University of Technology Akure.
5. Eboh, E.C. (2007) Developing Agricultural Value Chain towards Nigeria's Vision 20-2020 in Improving Agricultural Productivity and Value Chain towards Nigeria’s Vision 2020, Report of the 6th NESG Agriculture Summit, 2007
6. Eboh, E.C (2004) Large scale Arable crops farming development in Nigeria: Policy Questions and current challenges in Nigerian Agriculture: Transiting to Large scale Agricultural Competitiveness, Report of 3rd NESG Agriculture Summit, 2004.
7. Edache E.A. (2006) New Strategies for achieving 10% Growth Rate in Nigerian Agriculture in Agriculture and Agribusiness: Achieving the Target Growth, a Report of the 5th NESG Agriculture Summit, 2006.
8. Nkoya, E; D. Philip, T. Mogues, J. Pender, M. Yahaya, G. Adewale and T. Arokoya (2008) Impacts of a Pro-poor Community-Driven Development Project in Nigeria, International Food Policy Research Institute Discussion Ppaer 00756.
9. Federal Ministry of Agriculture and Natural Resources (1993) Investment Opportunities in Nigerian Agriculture, Abuja.
10. Federal Ministry of Agriculture and Rural Development (2000) Report of the Standing Committee on the Problems of Farmers in Nigeria (Implementation Modalities)
11. Federal Ministry of Agriculture and Water Resources (2008) National Food Security Programme, FMAWR, Abuja
12. Federal Miinistry of Women Affairs and Social Development (2007) National Gender Policy, Abuja
13. Idachaba, F.S (2000), Desirable and workable Agricultural Policies for Nigeria. Topical Issues in Nigerian Agriculture, Dept. of Agricultural Economics, University of Ibadan.
14. Idachaba, F.S. , C.I. Ezedinma, S. Talabi and Wole Edun (2005) Review of National Agricultural Policy: A Private Sector Perspective, NESG-Better Business Initiative Report (in Promoting Nigeria’s Non-Oil Private sector: Evidence and Recommendations ed. Eric Eboh)
15. Idachaba, F.S (2003) Can Nigerian Agriculture Compete? In the Report of the 2nd NESG Agriculture Summit.
16. IFDC/IITA/WARDA Report (2000) Agricultural Inputs Markets in Nigeria: An Assessment and a strategy for development.
17. IFPRI Nigeria Strategy Support Program (2008) Enhancing Commodity Value Chains in Nigeria. Workshop Report No. 04
18. Kormawa, P.M, C.I. Ezedinma, A.A. Adekunle and K.O. Makinde (Eds) Promoting market-led Agricultural Technology Transfer and Commercialization in Nigeria. Rural Sector Enhancement Program, IITA, 2003.
19. Mbam, Elias “Growing the Economy: Implications for Budget 2007 for the Manufacturing Sector, presented by the Federal Minster of state for Finance at the Manufacturers Association 2007 Budget Seminar, MAN House Lagos.
20. National Bureau of Statistics ‘Agric: Filling the Gap, 1995-2006’, NBS Abuja. 21. National Planning Commission National Economic Empowerment and Development Strategy
(NEEDS), NPC ABUJA, 2004 22. National Fertilizer Policy for Nigeria , Federal Fertilizer Department, Federal Ministry of
Agriculture and Rural Development, Abuja, 2006 23. NEPAD-CAADP (2004) Nigeria National Medium Term Investment Programme. NEPAD
Comprehensive Africa Agricultural Development Programme (TCP/NIR/2906).
45
24. Olayemi, J.K (1998) Food Security in Nigeria. Research Report No. 2, Development Policy Center Ibadan.
25. Oresajo, Felix (undated) An Assessment of the Fertilizer and Seed Sectors in Nigeria. A consultancy report for the African Trade and Investment Programme.
26. Rabe I. Mani (2008) Sustainable National cum-Regional Food Security: Task Measures and Strategies for Nigeria, FAO Abuja, Paper presented at the International Conference on Food Security, July 2008, Abuja Nigeria
27. Simeon Ehui (2008), Capital to Fund Food security Measures in Nigeria Paper presented at the International Conference on Food Security, July 2008, Abuja Nigeria
28. West African Economic and Monetary Union (2002) Sectoral Polices: the Agricultural Policy
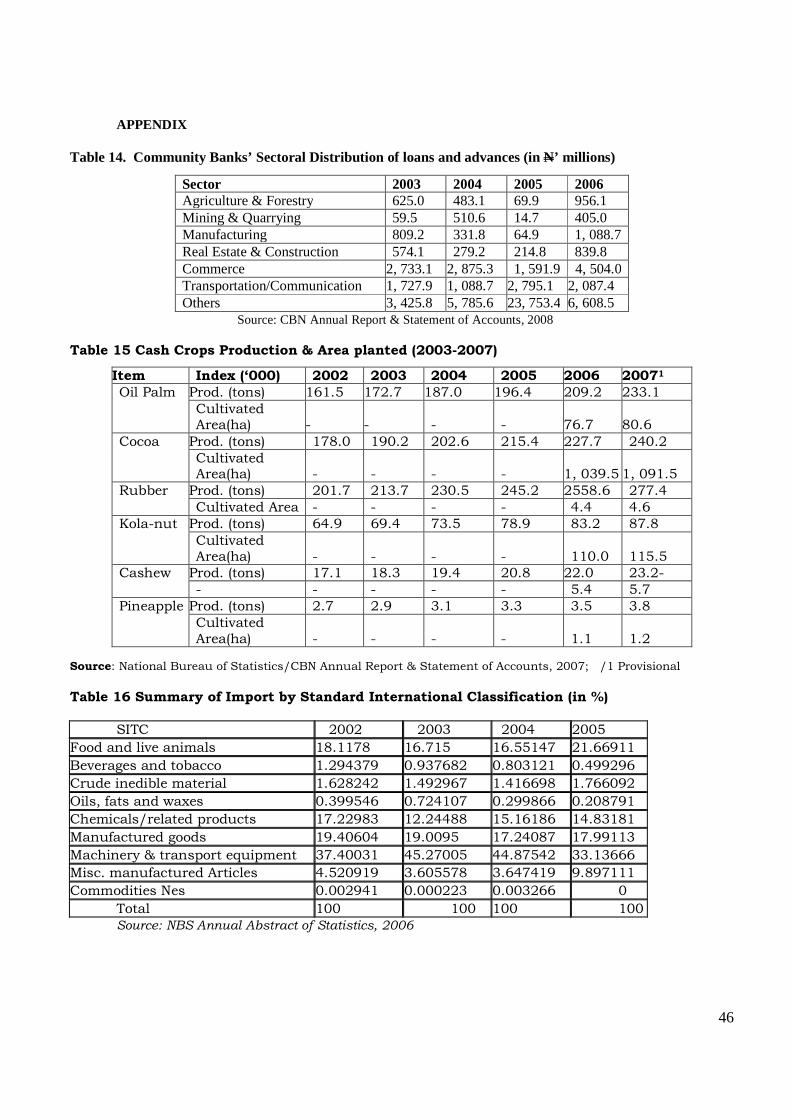
46
APPENDIX Table 14. Community Banks’ Sectoral Distribution of loans and advances (in N’ millions)
Source: CBN Annual Report & Statement of Accounts, 2008
Table 15 Cash Crops Production & Area planted (2003-2007)
Source: National Bureau of Statistics/CBN Annual Report & Statement of Accounts, 2007; /1 Provisional
Table 16 Summary of Import by Standard International Classification (in %) SITC 2002 2003 2004 2005
Food and live animals 18.1178 16.715 16.55147 21.66911
Beverages and tobacco 1.294379 0.937682 0.803121 0.499296
Crude inedible material 1.628242 1.492967 1.416698 1.766092
Oils, fats and waxes 0.399546 0.724107 0.299866 0.208791
Chemicals/related products 17.22983 12.24488 15.16186 14.83181
Manufactured goods 19.40604 19.0095 17.24087 17.99113
Machinery & transport equipment 37.40031 45.27005 44.87542 33.13666
Misc. manufactured Articles 4.520919 3.605578 3.647419 9.897111
Commodities Nes 0.002941 0.000223 0.003266 0
Total 100 100 100 100 Source: NBS Annual Abstract of Statistics, 2006
Sector 2003 2004 2005 2006 Agriculture & Forestry 625.0 483.1 69.9 956.1 Mining & Quarrying 59.5 510.6 14.7 405.0 Manufacturing 809.2 331.8 64.9 1, 088.7 Real Estate & Construction 574.1 279.2 214.8 839.8 Commerce 2, 733.1 2, 875.3 1, 591.9 4, 504.0 Transportation/Communication 1, 727.9 1, 088.7 2, 795.1 2, 087.4 Others 3, 425.8 5, 785.6 23, 753.4 6, 608.5
Item Index (‘000) 2002 2003 2004 2005 2006 20071
Oil Palm Prod. (tons) 161.5 172.7 187.0 196.4 209.2 233.1 Cultivated Area(ha) - - - - 76.7 80.6
Cocoa Prod. (tons) 178.0 190.2 202.6 215.4 227.7 240.2 Cultivated Area(ha) - - - - 1, 039.5 1, 091.5
Rubber Prod. (tons) 201.7 213.7 230.5 245.2 2558.6 277.4 Cultivated Area - - - - 4.4 4.6
Kola-nut Prod. (tons) 64.9 69.4 73.5 78.9 83.2 87.8 Cultivated Area(ha) - - - - 110.0 115.5
Cashew Prod. (tons) 17.1 18.3 19.4 20.8 22.0 23.2- - - - - - 5.4 5.7
Pineapple Prod. (tons) 2.7 2.9 3.1 3.3 3.5 3.8 Cultivated Area(ha) - - - - 1.1 1.2
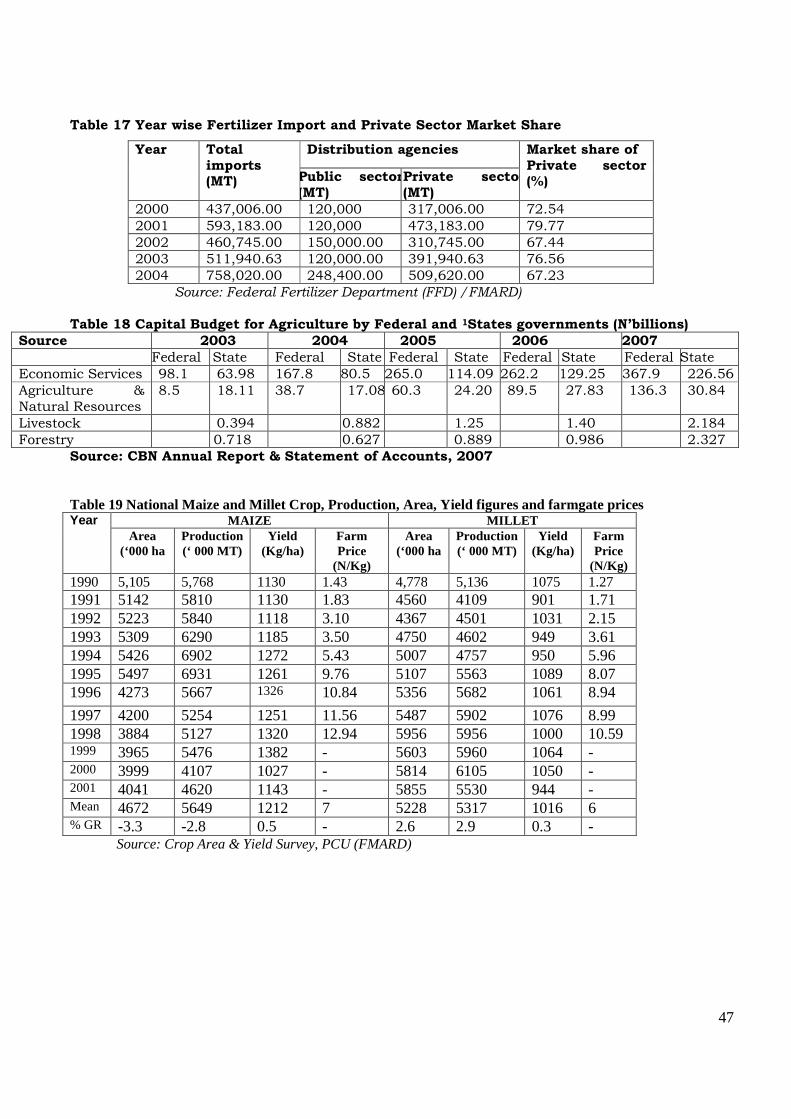
47
Table 17 Year wise Fertilizer Import and Private Sector Market Share
Year Total imports (MT)
Distribution agencies Market share of Private sector (%) Public sector
(MT) Private sector (MT)
2000 437,006.00 120,000 317,006.00 72.54 2001 593,183.00 120,000 473,183.00 79.77 2002 460,745.00 150,000.00 310,745.00 67.44 2003 511,940.63 120,000.00 391,940.63 76.56 2004 758,020.00 248,400.00 509,620.00 67.23
Source: Federal Fertilizer Department (FFD) /FMARD) Table 18 Capital Budget for Agriculture by Federal and 1States governments (N’billions)
Source 2003 2004 2005 2006 2007
Federal State Federal State Federal State Federal State Federal State Economic Services 98.1 63.98 167.8 80.5 265.0 114.09 262.2 129.25 367.9 226.56 Agriculture & Natural Resources
8.5 18.11 38.7 17.08 60.3 24.20 89.5 27.83 136.3 30.84
Livestock 0.394 0.882 1.25 1.40 2.184 Forestry 0.718 0.627 0.889 0.986 2.327
Source: CBN Annual Report & Statement of Accounts, 2007
Table 19 National Maize and Millet Crop, Production, Area, Yield figures and farmgate prices Year MAIZE MILLET
Area (‘000 ha
Production (‘ 000 MT)
Yield (Kg/ha)
Farm Price
(N/Kg)
Area (‘000 ha
Production (‘ 000 MT)
Yield (Kg/ha)
Farm Price
(N/Kg) 1990 5,105 5,768 1130 1.43 4,778 5,136 1075 1.27 1991 5142 5810 1130 1.83 4560 4109 901 1.71 1992 5223 5840 1118 3.10 4367 4501 1031 2.15 1993 5309 6290 1185 3.50 4750 4602 949 3.61 1994 5426 6902 1272 5.43 5007 4757 950 5.96 1995 5497 6931 1261 9.76 5107 5563 1089 8.07 1996 4273 5667 1326 10.84 5356 5682 1061 8.94
1997 4200 5254 1251 11.56 5487 5902 1076 8.99 1998 3884 5127 1320 12.94 5956 5956 1000 10.59 1999 3965 5476 1382 - 5603 5960 1064 - 2000 3999 4107 1027 - 5814 6105 1050 - 2001 4041 4620 1143 - 5855 5530 944 - Mean 4672 5649 1212 7 5228 5317 1016 6 % GR -3.3 -2.8 0.5 - 2.6 2.9 0.3 -
Source: Crop Area & Yield Survey, PCU (FMARD)
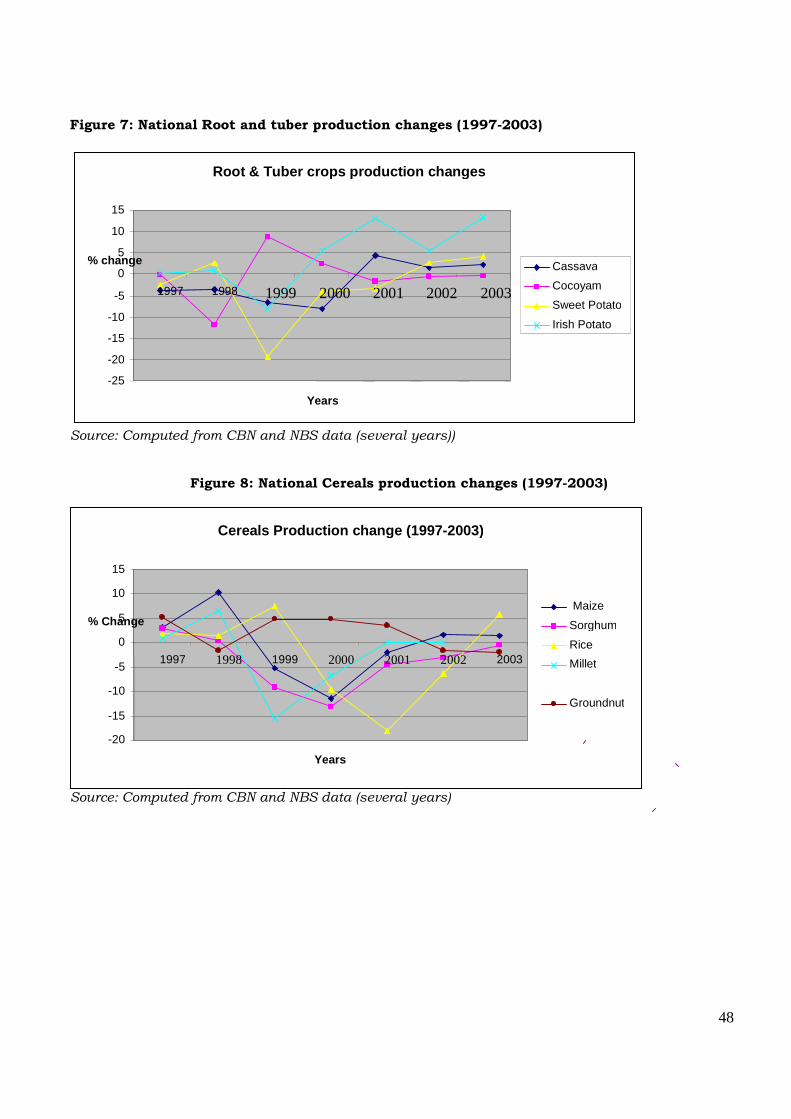
48
Figure 7: National Root and tuber production changes (1997-2003)
Source: Computed from CBN and NBS data (several years)) Figure 8: National Cereals production changes (1997-2003)
Source: Computed from CBN and NBS data (several years)
Root & Tuber crops production changes
-25 -20 -15 -10 -5
0
5
10
15
1997 1998 1999 2000 2001 2002 2003
Years
% change Cassava
Cocoyam
Sweet Potato
Irish Potato
Cereals Production change (1997 -2003)
-20
-15
-10
-5
0
5
10
15
1997 1998 1999 2000 2001 2002 2003
Years
% Change Maize
Sorghum
Rice
Millet
Groundnut
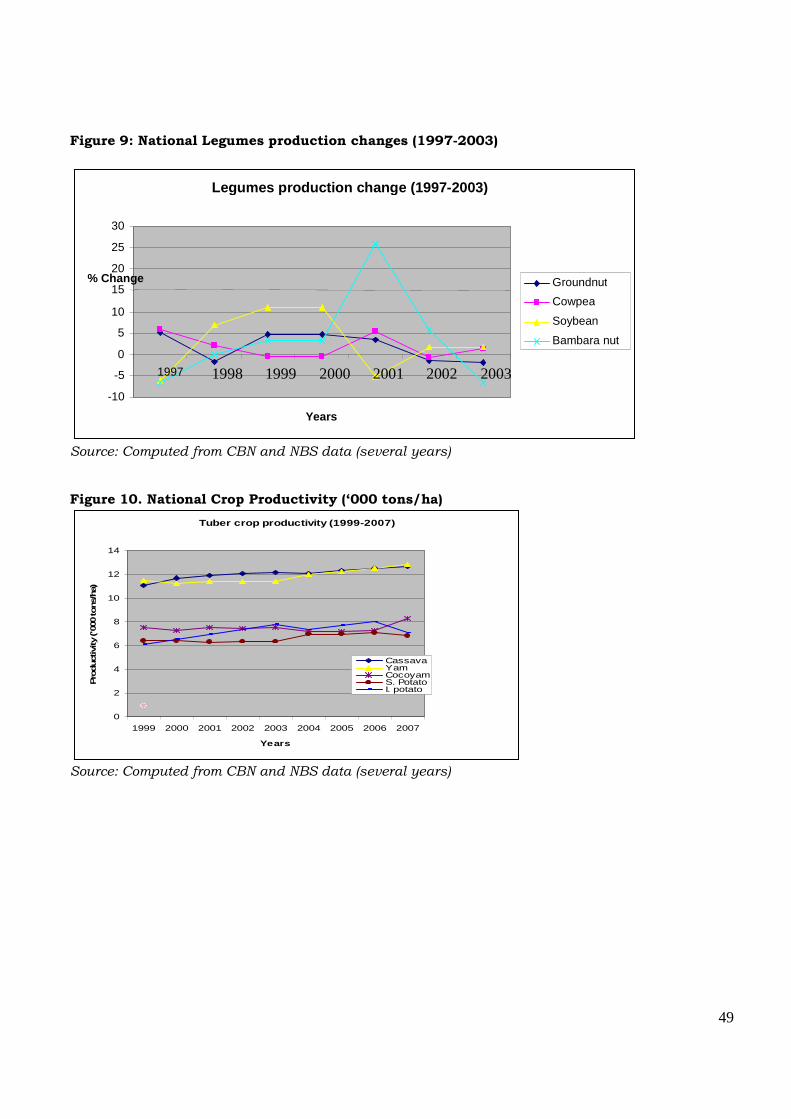
49
Figure 9: National Legumes production changes (1997-2003)
Source: Computed from CBN and NBS data (several years) Figure 10. National Crop Productivity (‘000 tons/ha)
Tuber crop productivity (1999-2007)
0
2
4
6
8
10
12
14
1999 2000 2001 2002 2003 2004 2005 2006 2007
Years
Pro
duct
ivity
('0
00 to
ns/h
a)
CassavaYamCocoyamS. PotatoI. potato
Source: Computed from CBN and NBS data (several years)
Legumes production change (1997 -2003)
-10 -5
0
5
10
15
20
25
30
1997 1998 1999 2000 2001 2002 2003
Years
% Change Groundnut
Cowpea
Soybean
Bambara nut