Embed Size (px)
Citation preview

The Pfeiffer Library Volume 22, 2nd Edition. Copyright © 1998 Jossey-Bass/Pfeiffer ❚❘ 1
❚❘ A BACKGROUND FOR USING INSTRUMENTATIONIN HUMAN RESOURCE DEVELOPMENT
WHAT AN INSTRUMENT IS AND WHAT IT IS NOTDespite the inherent difficulty of measuring psychological variables and processes,many devices are available to assess, appraise, evaluate, describe, classify, andsummarize the various aspects of human behavior. In human resource development(HRD), these devices are called “instruments”; almost all of them are paper-and-pencilfeedback devices that are used to generate data and to personalize theory input within agroup setting. The term that is used to describe any particular instrument dependsprimarily on the format and purpose of the instrument. Typical terms used to describeinstruments include: inventory, test, survey, poll, questionnaire, incomplete-sentenceform, opinionnaire, checklist, rating scale, profile, semantic-differential scale, reactionform, and evaluation. This makes a distinction between a “test,” in which the correctanswers are determined by the test constructor, and a survey, questionnaire, inventory,or rating scale that does not have a specific, “correct” answer for any given item.
For HRD purposes, then, an instrument is used to obtain data and to provideinformation to the respondents/clients about themselves and/or their group or toexemplify points of a particular theory or other conceptual input. For example, aninstrument can collect team members’ perceptions prior to a team-building effort oremployees and managers perceptions prior to an organization-development effort; aninstrument also can be used to provide information to individual respondents on theirparticular “styles” or modes of behaving in a number of areas and for a number ofpurposes such as personal growth, management development, stress or conflictmanagement, communication, and so on. Instrumentation frequently is employed toreinforce the learnings from structured experiences and other group activities, and thedata that are obtained from the instrument serve to make the focus more personal, morereal, and more credible to the participants.
Methods of psychological assessment can be located on a continuum from “soft” to“hard” data. “Soft” refers to highly subjective data that are difficult to measure; “hard”refers to more objective, quantifiable data. Soft data are not necessarily less valid thanhard data, but their validity is more difficult to demonstrate. The instruments mostcommonly used in HRD fall in the middle of the spectrum. They include inventories,questionnaires, surveys, polls, incomplete sentence forms, opinionnaires, checklists,rating scales, profiles, semantic differential scales, and structured interviews. Tests—measurement devices that have items with right and wrong answers—and physiologicalmeasurements, such as the polygraph or biofeedback, are almost never used in training

The Pfeiffer Library Volume 22, 2nd Edition. Copyright © 1998 Jossey-Bass/Pfeiffer2 ❘❚
and development, although the polygraph has been used in some types of personnelwork.
Subjective-Objective Continuum
A RATIONALE FOR USING INSTRUMENTATIONOne of our real dilemmas in the human resource development (HRD) field is that welack a descriptive vocabulary for dealing with other people in a nonpejorative way. Mostpeople can describe their physical world with great precision; our vocabulary fordescribing colors, sizes, shapes, scents, flavors, and the like is well developed. However,we quickly run out of descriptors when we attempt to describe other people, especially ifthe behavior of those others has had an adverse effect on us. One of the principalbenefits of using instrumentation in HRD is that instruments typically provideparticipants with a new, rich vocabulary for describing others. With such a newvocabulary, one can begin to describe another person’s behavior as “stemming from astrong need for inclusion” or “representing a weak economic value commitment” ratherthan in more subjective and emotionally laden terms that interfere with, rather thanenhance, communication (especially communication with the person being described).Thus, instrumented assessment has many advantages in an HRD context. An instrumentis objective and it employs a common language so that participants can givestandardized responses that are quantifiable and economical to score and summarize.Participants in today’s training settings want actionable feedback, not vague andtheoretical models.
In addition to helping participants to identify behavior, the comparison of scoresfrom an instrument provides group members with a convenient and relatively neutralway of exchanging interpersonal feedback. Instruments usually are based on theory andthereby have didactic potential. They promote involvement, leading to increasedparticipation and personalized learning. The involvement with their own scores helpsparticipants to better understand the theory on which the instrument is based—a typicalreason for using an instrument in training.
If members of a group think of themselves as studying their group through anobjective instrument, the activity seems more scientific, less subjective, and more

The Pfeiffer Library Volume 22, 2nd Edition. Copyright © 1998 Jossey-Bass/Pfeiffer ❚❘ 3
acceptable. In a group without a leader, an instrument can be used to put theresponsibility for processing the group’s activities on the members themselves.Instruments also can be used in work teams and meetings to evaluate their effectiveness.
In general, more growth can occur for a group participant if he or she is providedwith a method for focusing specifically on his or her own behavior. In addition, thefeedback received from other group members can contribute to growth on a differentand equally important level. In both cases, the learning is highly specific and cancontribute to decisions concerning behavioral change. In addition, being able to relate tothe particular outcomes of an instrument may serve to reinforce new behavioral patternsand enhance self-concepts when the participant returns to the environment outside thetraining setting and when the impact of fellow participants becomes diffused with theongoing demands of old relationships.
Externally derived data can provide the basis for potentially significant growthexperiences and change, especially if the data are understandable, reflect actualbehavior, and are discrepant from some ideal or desired self-image. Paper-and-pencilinstruments are the most common and convenient approach to gathering such data.They are useful not only to examine the behavior of individuals but also to collect datain groups and organizations.
One reason for the growth of instrumentation in the HRD field is the increasingcomplexity of modern organizations, in which the ability to access information and gaincooperation are critical factors in achieving success. Organizations are adopting morecomplex structures and models as they strive to implement performance systems andmeasures. There is an increasing number of “knowledge workers” who are highlydependent on subjective data to make decisions and evaluate performance. Managerialskills have been recognized as being more important than “position power” in gettingthings done; performance evaluation has become more complicated and subjective asfewer jobs can be evaluated in terms of “pieces produced.” There also is an increase inservice functions, which require efficient, concise feedback with action implications.At the same time, individuals are demanding more from their organizations in terms ofcareer planning, meaningful work, and involvement in the decision-making process.Social and business trends all require that individuals and organizations have access togreater amounts of data in a structured and systematic way. Human resourcedevelopment, in responding to these new requirements, has realized the need for moresophisticated technologies for providing feedback (Peters, 1985).
In addition to providing personal feedback for training purposes, instruments noware used frequently to obtain information that will serve as the basis for organizationalchange and planning efforts. The computer is being utilized more in assessing data, andit allows the processing of more data from multiple sources to provide moresophisticated and objective feedback for assessment and development planning.Software packages now allow users to customize instrumentation to their specific needsand applications, and computerized instrumentation makes it possible to implementlarge-scale assessments over long periods of time (Peters, 1985).

The Pfeiffer Library Volume 22, 2nd Edition. Copyright © 1998 Jossey-Bass/Pfeiffer4 ❘❚
Instruments such as inventories, questionnaires, and surveys also are the best way tocollect information from large numbers of people (i.e., when the available time andresources would not allow for each individual to be interviewed or observed). It takesless time to collect data from an instrument than it would from other processes such asinterviews or verbal surveys. Because the items or questions are standardized and theresults are all tabulated the same way, instruments are less susceptible to bias; it alsotakes less time to analyze the data.
In order to use instruments effectively, HRD practitioners must be aware of theramifications of the technology: the instrument administrator or facilitator must bepersonally familiar with the specific instrument being administered; the instrument mustbe chosen solely on the basis of the expressed needs and goals of the particular clientgroup; and the facilitator must be competent to interpret the data that emerge in orderthat the feedback can be used in functional ways.
Providing Specific Feedback to Individuals
Instrumented feedback can be more useful than the verbal feedback typically received ingroups. Too often participants provide feedback that is absolute; that is, it does notlocate the person in reference to degrees of a trait or to a norm. It is not uncommon tohear statements such as “You talk too much,” “You are too quiet,” or “You are tooaggressive.” The obvious response is “Compared to what?” Well-constructed scales alsocan provide feedback on behavioral extremes that may be equally dysfunctional,providing the respondent with a continuum of behavior from which to choose.
A primary value of instrumentation, then, is as a source of personal feedback forindividuals in a training group. This involves the individual completion, scoring, andinterpretation of scales as the primary step and as the basis for more extensive uses ofinstrumentation. Participants can be asked to predict one another’s scores so thatindividuals become more aware of their facades and of the impact they have on others.If appropriate, participants can complete entire instruments for one another for a morein-depth examination of interpersonal perceptions. An example of this is the set ofLEAD-Self and LEAD-Other instruments (Hersey & Blanchard, 1973), which aredesigned to be completed by a manager and his or her subordinates or peers.
Studying Here-and-Now Processes in Groups
A related use of instruments is to help participants to study here-and-now processeswithin the group and to assist the group in diagnosing its own internal functioning.Instrumented data can focus on what is happening in the life of the group and mayspecify what changes are desirable. In this way, the group can more quickly arrive atoptimal functioning so that more learning can take place. This is useful in teachingawareness of group process and diagnostic skills to intact groups and also as preliminarywork for team building and organizational-change efforts. Again, the unique advantageof specificity with instrumented feedback greatly enhances the probability that the groupwill be able to monitor and manage its own processes effectively.

The Pfeiffer Library Volume 22, 2nd Edition. Copyright © 1998 Jossey-Bass/Pfeiffer ❚❘ 5
Teaching Theories of Behavior and Interpersonal Functioning
Many instruments can be used to teach the theory, concepts, and terminology that areintrinsic to the description and interpretation of a particular set of behaviors, model, etc.In fact, some brief instruments are intended primarily to introduce concepts rather thanto be used as a source of feedback.
Participants learn more when they actively are involved in the learning process.When participants have invested time and energy in an activity such as completing aninventory related to the model being explored, they also have invested in learning thetheory, and the entire process becomes more meaningful in terms of the groupexperience. Participants also can be encouraged to study the items of the instrument indetail, because the items constitute a behavioral definition of the trait being measured.This, and a personal review of their own scores, can result not only in deeperunderstanding but also in their considering specific behavioral change.
Manipulating Group Composition
The facilitator may wish to use instrumented outcomes to manipulate group compositionfor brief, experimental demonstrations of the effects of group composition on taskaccomplishment. Long-term groups that offer promise of demonstrating group-taskcompetencies also can be built. Extremes of both homogeneity and heterogeneity can beavoided through the use of instrumented data.
Researching the Outcomes of Training and Other Interventions
The measurement of human phenomena can be a needed and realistic expectation oflearning and change experiences, contributing toward growth, evolution, and behavioralchange. Instruments also can provide the means of assessing growth and change on bothindividual and group levels. Even scales with relatively low reliability can be usedeffectively to study group behavioral patterns and attitudes in a pre-, post-, and post-postdesign. This measurement of outcome can provide some of the most crucial feedback forindividuals in a training setting and may help to validate the experience for them and forthe group in general. In addition, instrumented research will provide feedback to thefacilitator on the effectiveness of his or her own style and intervention skills and will aidin designing interventions for other groups.
Summary
Instrumented survey-feedback tools (generally inventories or measurement scales) canbe used in a number of ways by trainers and consultants. Data from inventories can beinterpreted normatively or intrapersonally, but it is important that they be coordinatedcarefully with the goals of the training design. Some uses of instrumentation include thefollowing:

The Pfeiffer Library Volume 22, 2nd Edition. Copyright © 1998 Jossey-Bass/Pfeiffer6 ❘❚
■ Providing instrumented feedback to group members. Participants complete, score,and interpret their own scales. They can be asked to predict one another’s scores.They can fill out scales for one another as feedback.
■ Studying hear-and-now processes in groups. It sometimes is helpful to use aninstrument to assist the group in diagnosing its own internal functioning. The datacan be focused on what is happening and what changes are desirable.
■ Teaching theories of interpersonal functioning. Some brief instruments areintended primarily to introduce concepts. Participants are involved with theory byinvesting in an activity such as completing an inventory related to the modelbeing explored.
■ Manipulating group composition. For brief, experimental demonstrations of theeffects of group composition, various mixes of group members can beestablished. Long-term groups can be built that offer the promise of beneficialoutcomes. Extremes of both homogeneity and heterogeneity can be avoided.
■ Researching outcomes of training and other interventions. Even scales withrelatively low reliability can be effective in the study of group phenomena whenused with pretest or follow-up procedures.
TRAITSIt is important in using instrumentation to remember that one is dealing with outcomesbased on visible elements of human behavior, or traits. Prior to using an instrument, thefacilitator should complete his or her understanding of the nature of the traits on whichthe particular instrument is based. The facilitator must be knowledgeable enough to easethe anxiety of the participants concerning what the instrument will “reveal” aboutthem—to help them to anticipate the learning experience in a nonthreatening way. Apresupposition of learning theory is that if the participants are highly anxious, they willbe largely incapable of hearing, seeing, and learning what is presented.
Behavioral scientists, like natural scientists, build taxonomies or ways of namingobservable phenomena. The reason for naming is to provide a common ground forcommunication regarding what may be experienced by individuals. The naming doesnot create the phenomena; it merely attempts to label, in some meaningful way, whatalready exists. Traits, then, are sets of categories invented by behavioral scientists topermit the orderly description of behavior. This definition can be illustrated by thefollowing anecdote.
Three baseball umpires were involved in a heated discussion of what they considered to bestrikes and balls.
First umpire: “Well, it’s easy, fellas. I call ’em as they are: If it’s a strike, I call ita strike; if it’s a ball, I call it a ball.”

The Pfeiffer Library Volume 22, 2nd Edition. Copyright © 1998 Jossey-Bass/Pfeiffer ❚❘ 7
Second umpire: “Wait a minute! I see it different! I call ’em the way I see ’em. If Isee a strike, I call a strike, and if I see a ball, I call a ball!”
Third umpire: “You’re both wrong! They ain’t nothin’ ’till I call ’em! It’s just abaseball that got thrown ’till I holler ‘Strike!’ or ‘Ball!’”
This anecdote gets to the heart of the issue. People do not “have” traits in themselves.They do not, for example, have a trait of inclusion or a trait of affection or a trait ofcontrol, per se. These are labels imposed on people’s behavior to add some order,understanding, and predictability to the behavior. One of the difficulties in usinginstrumentation is that many people tend to infer that the trait being measured is anintegral part of their psychological makeup or behavioral pattern. It is important to stressthat these simply are imposed categories; they do not exist in themselves any more thana strike or a ball exists before it is called by an umpire.
A related concept that may help to debunk the image of infallibility that participantsoften assume about instruments is the story about the Air Force way of dealing withthings: to measure it with a micrometer, mark it with a crayon, and then cut it with anaxe. The final outcome of instrumentation is equally inexact, even though the intent is tobe as precise as humanly possible. The key word here is “humanly.” At best, theoutcomes merely suggest types of behavior; yet, this suggestion can be of great value ifit is seen for what it actually is: an indication.
It is not necessary to adopt a trait-factor theory of personality in order to employinstrumentation effectively. It is possible to process instrumented feedback in terms ofwidely varying theoretical positions, from analytical to existential. The following twostatements illustrate two extreme positions.
“If a thing exists, it exists in some amount. If you haven’t measured it, you don’t knowwhat you are talking about.”
“No number or combination of numbers ever can adequately describe a dynamic,emerging person. The important characteristics of humans are immeasurable.”
In the context of one’s own theoretical frame of reference, it is possible to incorporate“objective” data to good effect so long as one bears in mind that the process simplyabstracts from the mass of information that is available about an individual.
One of the most powerful learnings derived in human resource development is thatpeople are far more alike than they are different. Participants discover that many of thedifferences among people are noncritical. It is a mistake to concentrate so much onindividual differences that we ignore the commonalities. Instrumentation candemonstrate the large overlap across persons of a wide array of human traits. Outcomescan be interpreted in a perspective that acknowledges that, at a humanistic level, alldifferences do not necessarily make a difference. One can use instruments todiscriminate among people, to spread them out for study or instruction. We propose that

The Pfeiffer Library Volume 22, 2nd Edition. Copyright © 1998 Jossey-Bass/Pfeiffer8 ❘❚
it is equally advantageous to use instrumentation to demonstrate graphically thecommon core of humanness that can bind us together.
THE DISADVANTAGES AND ADVANTAGES OFUSING INSTRUMENTSIt is important to recognize both the advantages and disadvantages of using instrumentsin human resource development. These can be dealt with most effectively bydiscovering ways to minimize the problems and maximize the advantages.
Minimizing the Disadvantages
The “Labeling” Effect
One of the key disadvantages of using instruments is that the participants may fear thatsomeone will obtain an indelible fingerprinting of them, that they will be exposed, thatsomebody will get into their minds and “psych them out.” This fear may beaccompanied by resentment and a loss of learning potential. An accompanying problemis that some participants may accept their scores as unquestionably accurate descriptionsof themselves: they are “assertive,” “aggressive,” or “withdrawn.” Some participantsmay attach pathological or quasi-pathological definitions to their traits and turn theminto self-fulfilling prophecies. This problem of labeling also can occur when participantsare dealing with one another. They may still refer to Joe as “at the ninety-eighthpercentile on control” after the group session is over despite the fact that Joe may havespent a great deal of time and energy during the workshop in experimenting with newbehaviors and may have modified his control pattern considerably. This problem of notallowing people out of their old stereotypes is particularly counterproductive in intactgroups. Joe may discover three years later that some individuals are still relating to himas if he were “at the ninety-eighth percentile on control.”
It is extremely important that the facilitator make an effort to reduce this tendencyto overgeneralize the accuracy and stability of the instrument. To avoid havingparticipants interpret the instrument in this manner, the facilitator should discuss themargin of error and other factors that contribute to less-than-absolute results. Aninstrument can be described as analogous to a thermometer; the reading would beexpected to vary from time to time.
Participants also should be encouraged to explore the instrument thoroughly so thatthey can see how it was designed and how their scores were derived. They need toacknowledge the fact that all they have done is to give their best answers, at a particularpoint in time, to the situations or questions in the instrument, and that they addednumbers denoting those answers to come up with a score. If they have troubleunderstanding the scores that resulted, they should be encouraged to go back to eachitem to see how they responded to it and how they scored it and perhaps to comparetheir responses with those of others, item by item.

The Pfeiffer Library Volume 22, 2nd Edition. Copyright © 1998 Jossey-Bass/Pfeiffer ❚❘ 9
It also is useful to show the participants how instrumentation is related to everydaychoices, fraught with inconsistency and subject to influences of all kinds, such as one’spsychological set at the moment, one’s physical state, and so on. Efforts such as thesecan encourage a realistic way of looking at “test” outcomes. Participants should behelped to understand that instrumented feedback, like other forms of feedback, canindicate only what may be true of the individual at a given point in time.
Attempts To Take Flight
Another problem that may arise for the facilitator is that instruments sometimes promoteflight from personal and interpersonal issues for the participants. An instrument maygenerate a rash of nitpicking (inappropriate) responses. Participants sometimes questionitems, reliability, validity, or the value of the instrument rather than choosing to see it asa tool for potential learning. A lot of time can be wasted in arguing about the instrumentitself—a result of the fact that participants have received, or fear that they are about toreceive, information that disturbs them. They may be afraid that others will interprettheir data in a negative fashion, so they attack some aspect of the instrument in order tochange the focus or to minimize the impact of the data. A nonhostile “flight” mayinvolve a tendency to engage in a “psychological” discussion about the traits theinstrument is measuring.
The facilitator can alleviate these flights by dealing thoroughly with the mysticismand reality of instrumentation. He or she also can intervene to refocus the groupdiscussion on the data obtained from the instrument and away from the instrument itselfso that participants become involved once more in the learning process.
It is a great help to establish the expectation prior to the group experience that aninstrument will be part of the design and to discuss why instrumented feedback will helpto meet the group’s needs and goals.
The use of instruments can be a means of dissipating some of the ambiguous butpotentially growth-producing tension that is generated by encountering and reacting toothers face-to-face. It also may tend to pull individuals away from the interpersonalprocesses of the group if data from the instrument have created an emotional overload.Participants may become so preoccupied with integrating the data that their behavior isdysfunctional to the rest of the group. Some of this difficulty can be eased if thefacilitator takes time to process the data from the instrument sufficiently so that theparticipants can “handle” it and integrate it without detracting from the business of thegroup.
A balance must be maintained, consistent with the goals of the group, betweeninstrumentation and the interpersonal learning needs of the participants. Processing thedata can and should include more than the facilitator’s interpretation of scores.Participants should have the opportunity to talk through their scores and to comparethem with the scores of others in the group and with appropriate norm groups, if suchinformation is available. The facilitator should emphasize and legitimize the differentlife perspectives and orientations among people and should encourage participants to

The Pfeiffer Library Volume 22, 2nd Edition. Copyright © 1998 Jossey-Bass/Pfeiffer10 ❘❚
explore these differences. The facilitator may use his or her own scores to illustrate howpersonal orientations govern responses to the instrument and to share with theparticipants the personal impact of the feedback that he or she received from theinstrument scores.
Dependence on the Facilitator
A third disadvantage of the use of instrumentation is the tendency for the activity tofoster dependence on the facilitator. The administration of the instrument and thesubsequent feedback process can put the facilitator in the role of expert rather than ofprocess consultant. Participants who initially find it anxiety producing to be in a groupsituation in which the “leader” does not assume a traditional leadership role may find ithard to let the facilitator out of the directive, authority role. It is particularly importantfor the facilitator to shift the responsibility for learning during the feedback-processingstage back to the participants themselves as early as possible, making the transition froma highly structured activity to minimally structured group processes.
It also is important to emphasize that the responsibility for learning rests with theparticipants. The meaning of the feedback for each individual is within that person, andhe or she integrates the data with a personal understanding of himself or herself. If aparticipant seems to have received more feedback than he or she is ready to handle, thefacilitator can encourage the person to take time to assimilate the information and towork through it in order to put it into perspective.
The “Test” Stigma
The idea of being “tested” may provoke subtle anger or undue anxiety on the part ofparticipants. Instruments can trigger unpleasant memories of school grading practices.The facilitator should avoid using the word “test” and should stress that the instrument isnonevaluative. Virtually all the instruments used in human resource development do nothave “right” or “wrong” answers and are merely tools for obtaining information; thisfact should be made clear to the participants.
Manipulation of Scores
Many instruments are subject to distortion; participants may lie or answer in ways thatthey believe are socially desirable. Most instruments have some degree of transparency,and the more sophisticated the group is in terms of test taking, the more potential there isfor participants to distort their scores. However, if the participants have a commitment totheir own learning, the tendency to distort will be lessened greatly. If the participantshave volunteered for the experience, their level of commitment generally will be high. Ifthe group is an intact, nonvoluntary one, the facilitator should attempt to inspirecommitment to the learning goals of the experience. This commitment must exist if theexperience is to be productive on any level.

The Pfeiffer Library Volume 22, 2nd Edition. Copyright © 1998 Jossey-Bass/Pfeiffer ❚❘ 11
Enhancing the Advantages
Although there are problems in using instruments, there are means of coping with oravoiding these problems. In addition, there are many advantages. Instruments are highlyinvolving because participants are working with information about themselves;however, because they supply most of that information by responding to the instrument,the activity is not as threatening as some other vehicles for feedback.
Early Presentation of Theory
An instrument gives the respondents the opportunity to understand the theory involvedin the dynamics of the group situation—understanding that can increase theirinvolvement. Through judicious use of an appropriate instrument during the first groupsession, the facilitator can offer the participants a theory about personality styles, groupdevelopment, interpersonal relations, or leadership that can be built on throughout therest of the group experience.
If separate theory sessions are part of the training design, participants will find themstimulating and meaningful if they explain the rationale for the instrumented feedbackthat the participants have received. Theory sessions without such a previous activitymight be experienced by the participants as a sudden change from an active, involvedsituation to a passive, listening situation.
Early Understanding of Constructs and Terminology
A related advantage of using an instrument is that it gives the participants someconstructs and terminology early in the group experience that they can use in looking attheir behavior and in categorizing and describing what goes on between individuals orwithin an individual. Participants seem to form commitments to information, constructs,and theories when their instrumented feedback describes them in terms of thoseconstructs and theories. The participants’ learning is crystallized when their “selves” aretied to useful information about interpersonal relations or groups, that is, when it haspersonal impact.
Early Feedback and Time To Practice New Behavior
Through instrumentation, a participant can be given feedback about his or her personalbehavior early in the group experience. It often happens that an individual does notreceive feedback from other participants about his or her style or way of relating toothers until the last day or the last two or three hours of the workshop. It often takes thatlong for the other participants to develop the skills necessary to give effective feedbackand before an atmosphere of trust is developed in the group so that members can feelcomfortable in exchanging personal feedback. In this case, the participant receivesinformation that he or she needs to know but he or she has no time to work on newbehavior. Instruments administered early in the group experience help to compensate forthe lack of feedback from others. Participants can generate personal agendas for

The Pfeiffer Library Volume 22, 2nd Edition. Copyright © 1998 Jossey-Bass/Pfeiffer12 ❘❚
behavior modification based on characteristics revealed by the instrument, with theremainder of the workshop to work on them. Individuals can “contract” with the groupmembers to experiment with new behaviors. The personal input into the instrument alsoincreases the chances that participants will form personal commitments to change andgrow; this is not as likely to occur as a result of feedback from others, which is easier todiscount or forget.
Personal Input To Foster Acceptance of Feedback
The feedback from instruments is relatively “low threat.” Because the individual hasfilled out the instrument form himself or herself, he or she is more likely to trust thedata. At least the individual does not have the dilemma of trying to determine whetherthe information is primarily a function of his or her behavior or of the mind-set of theperson who is providing the feedback or of some chemistry between the two of them.An instrument form obviously can hold no personal malevolence toward an individual,and participants can readily see that the information they obtain actually came from theirown responses to the form.
Comparison of and Involvement with Data
Another advantage is that instruments not only provide feedback about the individual,they also allow the person to compare himself or herself with others. We all are awarethat we may be more or less dominating than others, that we may enjoy being withpeople more or less than others, that we may have a greater or lesser need for others tolike us, and so on. However, it often is an eye-opening experience to find out that one isstronger in a particular characteristic than 99 percent of the people in a certain normgroup. This information can cause a person to examine carefully whether thischaracteristic is becoming dysfunctional, i.e., getting in the way of his or herperformance at home or on the job.
Instrumentation can promote involvement with data of all kinds. Participants oftencome to a training session never having heard the word “feedback” or thinking that itwas purely computer terminology. Participants can be taken from the concept offeedback as it applies to data processing to its relationship to instruments and then to itsapplication in interpersonal relationships. After initial experience with feedback from aninstrument, participants can practice giving and receiving feedback in a relativelynonthreatening experience such as predicting one another’s scores. This process allowsthe participants to learn to give and receive constructive feedback early in the life of thegroup and gives the group experience a greater chance to impact the behavior of theparticipants.
Latent Issues Surfaced
Instruments surface covert issues that can be dealt with in the group setting. This is truewhether the issues are within an individual, between individuals, within the group, or

The Pfeiffer Library Volume 22, 2nd Edition. Copyright © 1998 Jossey-Bass/Pfeiffer ❚❘ 13
within an organization. An instrument that uncovers these issues validates the publicairing of these concerns and makes them legitimate topics to be dealt with, discussed,corrected, and improved.
Control over Focus
Instruments aid the facilitator in that they focus the energies and time of the participantson the most appropriate material and also allow him or her to control, to some extent,what is dealt with in the group session. In this way the facilitator is able to ensure thatcrucial, existing issues are worked on—that the group does not tackle less importantissues in order to avoid grappling with the more uncomfortable ones.
Assessment of Change
A final, but important, advantage is that instruments allow longitudinal assessment ofchange in a group, an organization, or an individual. This assessment can be useful inorganization development work for demonstrating that the group interventions arecompatible with the goals of the client, the consultant, and the organization. It also canbe valuable for group research and personal feedback.
Summary
The following lists summarize the disadvantages and advantages of usinginstrumentation with small groups and ways to deal with each:Disadvantages
Engenders fear of exposure.
Encourages “labeling.”
Promotes flight from confrontation.
Generates time-consuming nitpicking.
Relieves potentially growthful tension.
Fosters dependence on the facilitator.
Makes the facilitator an “expert.”
Can result in feedback overload.
Triggers anger and anxiety about “tests.”
Makes distortion of feedback possible through manipulation of scores.
Advantages
Enables early, easy learning of theory.
Promotes personal involvement and commitment.
Develops early understanding of constructs and terminology.
Supplies personal feedback sooner than other participants are able to.
Facilitates contracting for new behavior.
Fosters open reception of feedback through low threat.
Allows comparisons of individuals with norm groups.
Promotes involvement with data and feedback process.

The Pfeiffer Library Volume 22, 2nd Edition. Copyright © 1998 Jossey-Bass/Pfeiffer14 ❘❚
Surfaces latent issues.
Allows facilitator to focus group and control content.
Facilitates longitudinal assessment of change.
Avoiding the Disadvantages of Instruments
1. Legitimize the use of instrumentation with the participants.■ Establish clear expectations concerning instruments and their value to the group experience
prior to the beginning of the session.■ Be ready to intervene to refocus the group discussion if participants use the instrument as a
flight mechanism.■ Minimize anxieties so that more learning can occur.
2. Make a concerted effort to remove the mysticism surrounding instrumentation.■ Discuss the margin of error and other factors that contribute to less-than-absolute results.■ Allow and encourage participants to explore the instrument thoroughly so that they see how it
was designed and how their scores were derived.■ Clarify the theoretical basis of the instrument.
3. Ensure that sufficient time is made available for participants to process the data derived from theinstrument.■ Provide an opportunity for participants to talk through their scores and to compare their scores
with those of others.■ Emphasize and legitimize different life perspectives and orientations.
4. Assure the participants that they have control over their own data.■ Define carefully the ways in which scores are to be shared or not shared.■ Emphasize that scores will not be reported to the participants’ supervisors.
ETHICAL CONSIDERATIONSThere is no commonly accepted ethical code that binds users of training materials, but anumber of practices in relation to the use of instruments have ethical implications.Materials should not be reproduced from copyrighted publications without permission.Even if the use can be categorized as “classroom use” and the number of copiesreproduced is small enough to qualify as “fair usage” under copyright law, the materialsstill should bear the author’s name and the title, publisher, and copyright notification ofthe original source. In such cases it is a courtesy to authors to advise them of theintended use of the instrument; they may be able to supply current information that willbe of use to the facilitator. It is unfortunate that scales so often are “borrowed” fromcomplex instruments and that elements from one instrument are “adapted” for inclusionin new ones. The problem here is not only a question of honesty; the risk is that theelements that are used will not have the same validity out of the original context.Oversimplification or misinterpretation can invalidate the purpose and results of aninstrument.
The question of validity and reliability is another consideration. Scales sometimesare named to indicate more validity than has been demonstrated; norm groups are

The Pfeiffer Library Volume 22, 2nd Edition. Copyright © 1998 Jossey-Bass/Pfeiffer ❚❘ 15
inadequately described; and validity and reliability evidence often is nonexistent.Although many instruments used in training have not been used previously for researchpurposes and have only face validity, it is important that the instrument not be sotransparent that respondents can anticipate the purpose of the scoring and answeraccordingly.
Much of what participants experience in any training or development groupdepends on the skill and personal style of the facilitator(s). Before attempting to useinstrumentation, facilitators must understand how to administer an instrument, presentits theoretical background, help the participants to predict their scores, score theirinstruments, interpret the data, and process the results. If the facilitator is not skilled inusing instrumentation, participants may be harmed by the process. (The discussion thatfollows presents a detailed, seven-stage process for using instruments and also discussesthe issue of facilitator style.)
In addition, participants should not be co-opted into revealing themselves throughinstrumentation; it is intended as a learning and self-development experience. Therefore,scores on scales that denote pathology should not be published within the group.

The Pfeiffer Library Volume 22, 2nd Edition. Copyright © 1998 Jossey-Bass/Pfeiffer16 ❘❚
❚❘ HOW TO PRESENT INSTRUMENTATION
THE SEVEN PHASES IN PRESENTING AN INSTRUMENTThere is a sharp distinction between just “giving” an instrument to a group andpresenting it properly, i.e., getting the most value out of it in terms of the goals of theexperience and the needs of the participants. There are seven basic phases in thepresentation of an instrument:
1. Administration
2. Theory Input
3. Prediction
4. Scoring
5. Interpretation
6. Posting
7. Processing
To illustrate these seven phases, we will describe the manner in which we present theFIRO-B, an instrument often used in interpersonal training. The FIRO-B originally wasdeveloped by Will Schutz in 1957.
1. Administration
This stage usually will take ten to fifteen minutes. First, a nonthreatening atmosphereshould be established. One way to do this is to use the word “instrument” rather than“test” and to indicate that there are no right and wrong answers. Then the use of theinstrument should be legitimized by discussing the purposes of the instrument (i.e., thereasons for taking it and how it fits into the goals of the session). In administering theFIRO-B, it is important to avoid giving any clues about the nature of the traits that arebeing measured.
After the instrument has been distributed, give clear, objective instructions abouthow to respond to the instrument. Give directions sequentially before participants beginto take the instrument. Encourage the participants to answer honestly in order topromote greater self-learning. In administering the FIRO-B, caution the participants ontwo points: (a) although they will experience a sense of repetitiveness in the items of theinstrument, each item is to be considered and responded to independently, and (b) someof the answers do not quite fit (participants can be encouraged to be creative infollowing the intent of the instrument).
The question of whether or not participants should identify themselves on aninstrument form depends, in part, on the instrument itself, its purpose, and the needs of

The Pfeiffer Library Volume 22, 2nd Edition. Copyright © 1998 Jossey-Bass/Pfeiffer ❚❘ 17
the facilitator and participants. If the participants feel anxiety about self-disclosure (asthey might in a work setting), more truthful responses might be obtained if they areallowed to remain anonymous. Even participants in a training workshop may adjust theiranswers because they fear evaluation by other group members. In such cases,respondents may be asked to code their forms (using part of their social securitynumbers or telephone numbers, for example) so that the forms can be identified later andretrieved by the respondents. Of course, the facilitator should attempt to establish thenorms of openness and honesty in filling out the instrument forms and, if appropriate,should encourage the group members to “own” their responses.
A difficulty, particularly in larger groups, is that individuals in the group will finishthe instrument at different times. In a nonauthoritarian way, the administrator of theinstrument can establish the expectation that as people finish the instrument they willwait quietly for the others to finish. When everyone has completed the instrument, thegroup moves to the second phase.
2. Theory Input
This phase usually takes ten to twelve minutes. It is the time to clarify the theoreticalbasis of the instrument. Sometimes this can be done best through the use of analogy andvisual aids. The theory behind FIRO-B is that all human interaction can be divided intothree categories: issues surrounding inclusion, issues surrounding control, and issuessurrounding affection.1 Schutz’s theory of group development suggests that a groupproceeds through inclusion issues into control issues and finally into affection issues andthen recycles. To illustrate these categories, the facilitator can ask the participants toconsider a group of people riding in a boat. The inclusion issue, with the boat, is whetheror not individuals have come along for the ride. The issue of control with the boat iswho is running the motor or operating the rudder. The affection issue concerns howclosely people are seated together in the boat.
The facilitator can follow this discussion of categories with an explanation of theFIRO-B six-cell diagram.
INCLUSION CONTROL AFFECTIONExpressed BehaviorWanted Behavior
The dimensions illustrated by the diagram are inclusion, control, and affection interms of what the individual expresses to others and those same three issues in terms ofwhat the individual wants from others. It is important to clarify that the expressedbehavior is one’s own behavior and that the wanted behavior is what one wishes fromothers. When the participants understand this concept and the meaning of each of the sixcells, it is time for the prediction phase.
1 Schutz revised his dimensions in 1982 with the publication of The Schutz Measures. In these instruments, the dimensions of behavior
are inclusion, control, and openness.

The Pfeiffer Library Volume 22, 2nd Edition. Copyright © 1998 Jossey-Bass/Pfeiffer18 ❘❚
3. Prediction
This phase takes about two minutes. All participants are asked to predict whether theywill score high, medium, or low in each of the six cells and to write their predictions in acorner of each cell in the diagram on their copy of the instrument. When the predictionshave been made, it is time to begin the fourth phase, scoring.
4. Scoring
This discussion will concern itself with instruments that can be scored in situ, not thosethat must be sent out for computerized analyses. For the FIRO-B, the scoring processgenerally takes six to eight minutes. There are a number of ways in which to scoreinstruments. Some require templates; some are self-scoring; and for some the scores canbe called out or written on newsprint or handed out on duplicated sheets of paper. If thescoring is fairly understandable, simple explanations or handouts may suffice. It isimportant to gauge the level of sophistication of the particular group in selecting themost appropriate way to score an instrument. Many instruments available to HRDpractitioners are self-scoring; these provide the participants with immediate feedbackand a sense of how the scores are derived. Virtually all such instruments come completewith scoring and interpretation or profile sheets.
In some cases it is more efficient for the facilitator or another staff member to dothe scoring. This is appropriate if the scoring is difficult. Another reason for thisapproach is that sometimes people can create such a task out of the scoring process thatthey lose or diminish the actual results of the instrument, i.e., the scoring detracts fromthe data being generated. The obvious negative factor in this approach is that individualsdo not receive immediate feedback. This can be mitigated by administering theinstrument before a meal break and having the results available immediately after themeal. The important thing is that the scoring must not detract from the data beinggenerated by the instrument.
Once the facilitator has worked through scoring the first scale on the FIRO-B withthe participants, they generally can derive their own scores for the other scales at theirown pace. After the scoring has been completed and the participants have posted theirscores in the cells along with their predictions, the interpretation phase begins.
5. Interpretation
The way in which the FIRO-B is interpreted can vary greatly depending on theparticipant group and the style of the facilitator. Typically, it takes from five to sevenminutes per participant. We like to handle interpretation in two stages: the first stage isan interpretation of the facilitator’s own scores or those of another staff member; thesecond stage is a dyadic interpretation between pairs of participants. In a typical design,the scores of another staff member first are interpreted by means of a six-step method,so that participants can begin to see how interpretations are made. Then that staffmember interprets the facilitator’s scores in front of the group to afford participants an

The Pfeiffer Library Volume 22, 2nd Edition. Copyright © 1998 Jossey-Bass/Pfeiffer ❚❘ 19
opportunity to see some variance in the style of interpretation. This modeling ofinterpretation is a very important defusing element. If the staff members are willing toshow their scores to others, the individual participants find it easier and less threateningto share their scores with other members of the group.
The following are the six steps in the first phase of interpretation employed for theFIRO-B.
1. Actual scores are compared cell by cell with the predictions of high, medium, orlow. The conversion for this design is as follows:
Prediction Actual Score
High 7-9 points
Medium 3-6 points
Low 0-2 points
2. Actual scores then are compared to norm averages. Norms are numericalsummaries of the behavioral responses of a group of people to standard stimuli (aninstrument). For training purposes, they should be presented as descriptive statistics:average scores or percentiles of various groups of people. These descriptions give therespondents a framework with which to compare their scores with those of variousgroups of people. A respondent can learn from seeing how his or her own highs andlows compare with those of others and how he or she ranks in comparison with others. Itis important to emphasize to the participants that norms are not standards and should notbe misinterpreted as such. Normative data should be used as nonevaluatively as possibleso as to avoid any implication that there are “right” ways of responding or that there is aprofile that the participants “should” have.
The major concern related to norms is that they be based on a relevant referencegroup. Usually this means that norms of locally based groups are most meaningful toparticipants, but tables included in instrument manuals may be useful if the groupsrepresent the participants in some way. For example, the FIRO-B development group isnot described in the manual, but there are averages available for members of twelveoccupational groups ranging from traveling salesmen to teachers.
Average Scores of the FIRO—B Norm Group
Average Scores of the FIRO-B Norm Group
INCLUSION CONTROL AFFECTION
Expressed Behavior 5.4 3.9 4.1 13.4
Wanted Behavior 6.5 4.6 4.8 15.9
11.9 8.5 8.9 29.3
In this phase, we consider scores that are discrepant from the norm by two or morepoints to be significant for purposes of discussion.

The Pfeiffer Library Volume 22, 2nd Edition. Copyright © 1998 Jossey-Bass/Pfeiffer20 ❘❚
3. Column scores are examined to see the significance of inclusion, control, andaffection scores by their relative importance to one another. For example, if the highestscore is for control, control issues are the most important to that individual; if the secondhighest score is for inclusion, it is the second most significant concern for the individual,and so on. A second part of this step is to look at the column scores in relation to thenorm scores and to compare the individual scores with the totals for each of thecolumns. If there are more than three points of discrepancy, they are worthy ofdiscussion.
4. Next, the scores are examined by row—the expressed and wanted aspects. Thefirst comparison is the relative importance of expressed behavior versus wantedbehavior in terms of which is a more characteristic or logical pattern for the individual.The second comparison is the actual score in relation to the norm score totals for the twodimensions. This process allows individuals to see their scores in relation to the scoresof others. A discrepancy of more than four points is worthy of discussion.
5. This step deals with what we call the Social Interaction Index. It is derived fromadding either the columns or the rows to arrive at the sum of all six cells. This trait thenis viewed in relation to twenty-nine points, which is the norm for the sum of the scoresfor the FIRO-B. If an individual’s score is five points higher or lower, it is significant fordiscussion.
6. An interpretation is made of the “fit” between the profiles of two participants.For example, the expressed control of one person is compared with the wanted controlof the second person, and the compatibility of their behavior is discussed.
In the second phase, dyadic interpretation, the facilitator asks individuals to formpairs. Once the dyads have been established, they are directed to exchange scoringsheets so that they are interpreting each other’s scores. The dyads can be allowed five toseven minutes for A to interpret B’s scores while B remains silent as a stoic,noninformational receiver. When that interpretation is completed, A and B exchangeroles and B interprets A’s scores while A remains silent. When this five-to-seven minuteinterpretation is completed, the dyads can move into a five-to-ten minute discussion ofthe instrument in which the two members share the personal impact of their scores. Anoptional, total-group discussion then can focus on generalizations.
6. Posting
The sixth major phase in presenting an instrument is posting. It usually takes from fiveto eight minutes. Posting scores on newsprint sheets or on chalkboard has the potentialto dissipate some of the concerns that people have about negative values and lack ofsocial desirability for any particular score. At the same time, it can generate additional,useful data for the group to process, including group and subgroup profiles. Generatingscores and then posting them for discussion can be particularly effective in dealing withsubgroups within a large workshop.
In some cases, it may be important to emphasize that participant’s scores will not bereported to their managers. As with any personal information in training, any participant

The Pfeiffer Library Volume 22, 2nd Edition. Copyright © 1998 Jossey-Bass/Pfeiffer ❚❘ 21
has the right to choose not to post his or her scores, although, in practice, this rarelyhappens if the norms of openness, sharing, and experimentation have been established.
7. Processing
The final and perhaps most crucial phase of instrumentation is processing. Groupprocessing of the data generated by an instrument has the potential to simultaneouslydefuse negative affect and promote integration of the concepts. It generally will takefrom fifteen to twenty minutes to process and begin to integrate the data from the FIRO-B with a typical subgroup. Sufficient time must be allowed for this critical step, and theamount of time required will vary, depending on the nature and complexity of the dataand the sophistication or receptivity of the participants.
The processing phase allows participants to compare their scores and to develop anunderstanding of how their scores “fit” with their self-images and others’ images ofthem. During this stage, the facilitator should take care to legitimize differing behaviors,orientations, and perspectives. At the end, he or she also can solicit feedback on the wayin which the instrument was administered.
The optimal size of the group for processing data generated by an instrument variesfrom six to twelve participants. In a group composed of participants who are strangers toone another, the smaller size increases the potential for individual speaking time. In anintact group, the goal is to include as many people as possible in order to maximize thecommon exposure to the information being shared.
Questioning
Some questions that are effective in processing are:
■ Which scale scores seem to fit your self-concept most accurately?
■ Which scale scores seem to fit your self-concept least accurately?
■ Based on the common history of the members of the group, which scale scoresseem to be most/least like those that other group members would have predictedfor the individual whose scores are being discussed?
■ What value does each individual place on a high or low score for a particulartrait? For example, the Survey of Interpersonal Values instrument produces thefollowing six scales: support, conformity, recognition, independence,benevolence, and leadership. For each individual, is a high score on conformitysocially desirable or undesirable? This question promotes a forum of valueclarification that provides an opportunity for disclosure (what I hold valuable)and awareness (what other members of the group see as valuable).
Potent Scores
Occasionally, instruments produce feedback that is simultaneously accurate anddiscrepant with an individual’s self-concept. For example, a score of low benevolence

The Pfeiffer Library Volume 22, 2nd Edition. Copyright © 1998 Jossey-Bass/Pfeiffer22 ❘❚
on the Survey of Interpersonal Values may be disturbing to a minister; a low score intime competence on the Personal Orientation Inventory may be disorienting for anexecutive who sees himself or herself as being extremely competent; and a high score inexpressed control on the FIRO-B may be disconcerting for a teacher who sees himself orherself as egalitarian. In leading the processing phase, the facilitator must be tuned in toscores that are disorienting, i.e., not easily integrated. This situation often can behandled most effectively by a one-to-one discussion with the person after the group-processing session.
It is the facilitator’s responsibility to assist in the integration of all data generated byinstrumented feedback. This responsibility may, in some cases, mean that one promotesdealing with disconcerting feedback (as opposed to permitting participants to discountit). It often takes days for individuals to accept dissonant feedback. Conversely,instruments can produce inaccurate data that should not be accepted indiscriminately.
An important caveat in helping participants to interpret their scores is that thetrainer, consultant, or facilitator must recognize and state that the scores obtained byindividuals on any instrument are the result of their answers to a series of questions atone point in time, and that such scores should not be treated with undue reverence. Suchresponses typically change over time, for a variety of reasons. The individual’sinterpretation of the question the next time may affect his or her answer, a variety ofexperiences may change the person’s self-perception, and so on. HRD professionals areencouraged to use and to present instruments simply as one additional means ofobtaining data about individuals, with all the risks and potential payoffs that any otherdata source would yield.
FACILITATOR STYLEIt is important for the facilitator to develop a psychological atmosphere that is conduciveto participants’ receiving instrumented feedback readily. The climate should benonclinical, open, and experimental. The facilitator’s style should be light rather thanheavy and should not convey the impression that this is a deadly serious business that isgoing to yield some delicate data. In “selling” the instrument to the participants, thefacilitator should attempt to induce a psychological set toward frankness in respondingto the instrument items.
The Gestalt concept of presence can be useful in thinking about one’s style inrelation to instrumentation. The facilitator who has presence exhibits confidence,demonstrates that he or she is “on top of” the situation, and appears to be organized andalert. It is somewhat akin to charisma. People tend to follow such a person’s instructionswithout challenge. If the facilitator lacks presence, the participants may tend to askmany questions, nitpick about items, and cast aspersions on the validity of theprocedure. Being present in this context presupposes that the facilitator is well preparedto use the instrument (knows the procedure that he or she is about to direct, is

The Pfeiffer Library Volume 22, 2nd Edition. Copyright © 1998 Jossey-Bass/Pfeiffer ❚❘ 23
comfortable in explaining the theory related to the scales, and is flexible in managing thelearning situation).
In introducing the instrument, the facilitator should be sensitive to the possibleemotional impact that the idea of “being tested” may have on participants. He or sheshould defuse the experience by relating the instrument to the learning goals of thetraining event and by pointing out that the intent is to be instructive rather thandiagnostic. As has been said before, the facilitator can model openness by interpretinghis or her own scores and by soliciting feedback about them.
The following list can enhance the effectiveness of the facilitator in usinginstrumentation.
Do’s and Don’ts in Using Instrumentation
Do’s Don’ts
Do complete the instrument yourself first. Don’t use the word “test.”
Do tell participants how the instrument aids thegoals of the training.
Don’t give instructions while participants arereading.
Do encourage participants to be open in describingthemselves on the instrument.
Don’t give too many instruments at one time.
Do allow plenty of time for processing. Don’t put undue pressure on participants to publishscores that may make them appear to be “sick.”
Do watch for participants who may beexperiencing difficulty in integrating their scoreswith their concepts of themselves.
Don’t diagnose participants’ weaknesses forthem.
Do solicit feedback on your style: particular thingsyou did that helped and impeded learning.
Don’t label participants.
INSTRUMENTS AS PART OF OVERALL TRAINING DESIGNSInstruments are highly useful components of training designs, especially when used inconjunction with structured experiences, which permit participants to share their data,receive feedback and consensual validation, and deepen their understanding of thetheory behind the instrument.
Implicit in this discussion is the idea that training means developing new behaviors.A complete learning model incorporates doing as well as being or understanding. Usefultraining is designed to be transferable from the training setting to the real world.
Initially, in order to validate an instrument, the facilitator usually will divide theparticipants into subgroups to focus on common behaviors in each subgroup. To carrythe use of the instrument further for skill development, the focus must move to theindividual. For this purpose, heterogeneous subgroups are more desirable, because theunique behaviors of individuals are easier to see when they do not become submerged inthe set of behaviors common to all subgroup members. Furthermore, people typicallyfind it easier to perceive a behavior that is clearly different from their own.

The Pfeiffer Library Volume 22, 2nd Edition. Copyright © 1998 Jossey-Bass/Pfeiffer24 ❘❚
In using an instrument to “tie down” observable behavior, the scales, even thoughbehaviorally validated, may be inadequate because not enough concrete detail isprovided by the scale label. Therefore, it is helpful to focus on individual items, whichare more clearly related to specific behaviors.
Once the instrument has been accepted and concrete behaviors of individualsidentified, it is up to the facilitator to provide participants with the opportunity to definespecific behavioral change goals and then to provide a structure for behavioral skillpractice that can lead to goal attainment. “Practice” can be provided in the form ofdiscussions, rehearsals, role plays, or some combination of these. The length of time anddepth of detail involved may vary considerably.
LABORATORY/WORKSHOP DESIGNSIn designing laboratory experiences in which instruments will be used, it is wise toconsider several things. One major concern in using more than a single instrument inany training design is that the traits measured be supplementary. The two instrumentsshould not measure exactly the same characteristics; this adds little or no newinformation. However, the traits measured should not be so diverse that participantshave a difficult time putting together congruent pictures of themselves. For example,two very similar personality inventories would not be used in the same design becausethe data obtained from the second would be redundant. On the other hand, using twodiverse instruments would provide a disconcertingly diverse focus to the feedback.
A second concern is that the facilitator anticipate the type of interaction affect thatwill be produced by the instrumented feedback. He or she should avoid overloading theparticipants with data that will generate a heavy, emotional atmosphere that could movethe interaction to a nonproductive level. It is equally important to avoid instruments thatcould produce feedback that is too sophisticated for the participants to handle well andto avoid producing feedback that is inappropriate to the goals of the learning experienceor that may cause a shutdown of interaction. For example, it would not be productive toadminister a complex personality inventory to a group of managers during a team-building workshop.
The key to managing the integration of data productively when incorporatinginstrumentation in a training design is the careful selection of instruments and theconsciousness of processing issues as they relate to the interaction in the group. (Thediscussion that follows tells how to evaluate and select instruments.) If the decision ismade to use two complementary instruments, the design must include time to processeach of the instruments and time to process the relationship between the two sets ofscores produced.
Many instruments have complementary pairings with structured experiences.Pfeiffer & Company’s Annual series, for example, contains many structured experiencesthat either are built around instruments or utilize them to introduce or reinforce theconcepts to be learned. The well-integrated use of instruments and structuredexperiences tends to reinforce learnings and crystallize concepts.

The Pfeiffer Library Volume 22, 2nd Edition. Copyright © 1998 Jossey-Bass/Pfeiffer ❚❘ 25
❚❘ EVALUATING AND SELECTING INSTRUMENTS
Knowing how to present an instrument is not enough to ensure that its use will besuccessful. The other half of the coin is knowing how to evaluate and select theinstrument(s) that will be used. The number of published instruments available to HRDprofessionals has become so great that choosing the right one for a particular use isdifficult. This discussion contains a model and guidelines for selecting instruments forvarious purposes.
A MODEL OF INSTRUMENTATIONA model of instrumentation could be created using any number of dimensions; the onethat follows is a simple model covering the significant dimensions of (a) psychometricor technical rigor, (b) primary use (training, research, etc.), and (c) learning focus(individual, group, etc.).
The Basic Dimensions of Instrumentation

The Pfeiffer Library Volume 22, 2nd Edition. Copyright © 1998 Jossey-Bass/Pfeiffer26 ❘❚
TECHNICAL CONSIDERATIONS [PSYCHOMETRIC RIGOR]It is important to have a knowledge of technical topics related to instrumentation beforestudying instruments for possible use in training settings. The list that follows includesmost of the technical concerns that the facilitator needs to take into account whenselecting an instrument.
Technical Considerations in Using Instruments
Validity What does the instrument measure? Will the data be useful?
Reliability How accurate or stable are the scores derived from the measurement?
Objectivity Is the scoring dependent on the judgments of the scorer or is there a standard key? Can the instrument be scored by untrained people such as participants?
Theoretical Base Is the instrument based on a workable model?
Behavioral Orientation Are the scores derived from the respondents’ descriptions of their behavior?
Observability Can the scores be related to the observable behavior of respondents?
Special Training How much professional preparation is required to use the instrument?
Language Is the instrument written at an appropriate reading level? Does it use a special vocabulary or jargon?
Sophistication What background is required to use the instrument?
Complexity What kinds of feedback can be derived from the items? How complicated is the interpretation?
Supplementation Will the instrument yield data that add to what the participants already know?
Adaptability Can the items be adapted/amended to fit a particular situation?
Transparency How obvious is the rationale underlying the items?
Fakeability How easy is it for respondents to manipulate their scores?
Norms Are relevant norms available?
Availability Can the instrument be obtained easily?
Copyright Restrictions Can the materials be photoreproduced or edited without special permission?
Time Required How much time is needed to prepare, administer, score, and interpret theInstrument?
Expense What is the cost of the materials, scoring, analyses, and background documents? Are these reusable materials?
Special Materials Does the instrument require that any special apparatus be obtained and set up in advance?
Noxiousness Would the items—or the scale itself—offend intended respondents?
Scoring Complexity Can the instrument be self-scored? Are electronic/clerical options available?
Data Reduction How many scores are derived? Can these be summarized for ease in interpretation?
Handouts Are easily read, interpretive materials available for the facilitator to distribute to respondents?
Familiarity How likely is it that participants will have responded to this instrument before?

The Pfeiffer Library Volume 22, 2nd Edition. Copyright © 1998 Jossey-Bass/Pfeiffer ❚❘ 27
The most critical technical considerations are validity and reliability; these are discussedin detail below.
Validity
The basic questions of validity center around what traits are being measured, what thescores mean, and how useful the data are. Six types of considerations are suggested, andthese are outlined in the following paragraphs.
Content Validity. Content validity, or face validity, is the minimum validityacceptable. It refers to the first impression the user has of the instrument—whether theinstrument appears to be measuring the things it is supposed to measure. A carefulexamination of the instrument should show a reasonable, logical, clear connectionbetween the instrument and what is measured. For example, a selection test shouldinclude simulated job samples; an appraisal form should include job elements deemedimportant to performance by a formal job analysis. The user is cautioned not to havemuch confidence in or make important decisions based on instruments that do notappear to have content validity. Furthermore, respondents and clients are very likely toquestion the instrument. Although it is possible for an instrument to measure somethingit does not appear to be measuring, such occurrences are rare. Of course, it also ispossible for an instrument to fail to measure something that it appears to be measuring.
Predictive Validity. Normally, one would expect more than just content or facevalidity, and there are other ways to check on whether an instrument measures what itclaims to measure. One of these is predictive validity: some concrete evidence thatinstrument scores are related to certain measurable characteristics or behaviors of thepersons tested, as predicted by the logic behind the instrument. If the instrument is ameasure of the ability to learn to fly, people who score high on it should learn faster andfly with more skill. If they do not live up to this prediction, the validity of the instrumentmay be questioned. There are a number of instruments that are used to select people forpotential occupations. However, there are many instruments that are not appropriate forselection or prediction. Scales that measure introversion-extroversion, dominance needs,styles of relating to others, and personal temperament, for example, are not intended topredict performance. For such instruments, there are other criteria for determiningvalidity (these criteria can be used to assess predictive instruments as well). One suchcriterion is concurrent validity.
Concurrent Validity. Concurrent validity is established by showing that there is arelationship with a present criterion, i.e., the measure is shown to relate statistically to anindependently determined, concrete measure obtained simultaneously. For example,those who presently are engaged in an occupation and are doing well should scorehigher on an aptitude measure than those who are doing poorly. On a scale measuringpolitical conservatism, student members of the Young Republicans should score higherthan student members of the Young Democrats.

The Pfeiffer Library Volume 22, 2nd Edition. Copyright © 1998 Jossey-Bass/Pfeiffer28 ❘❚
Convergent Validity. If an instrument is measuring what it is supposed to measure,it should relate positively to other measures of the same thing (i.e., they all should be“converging” on the same trait). Because they all are sampling from the same behavioraldomain but from slightly different angles, they should have substantial overlap.Similarly, an instrument is said to have convergent validity if, in numerous cases, it isstatistically shown that a ratee is rated similarly by several raters on the same dimension(i.e., the raters agree or “converge” on the rating).
Discriminant Validity. The other side of the coin from convergent validity iswhether an instrument is unrelated to scales that measure traits it is not supposed to bemeasuring. An instrument also is said to have discriminant validity if it is shownstatistically that a ratee’s different dimensions are rated differently by a rater (i.e., thevarious dimensions “discriminate” to yield a proper, separate, and different rating foreach dimension).
Construct Validity. Many instruments that measure personal or group characteristicsare related to, issue from, or are the basis for theories. The scale measures a concept orconstruct, such as achievement motivation, that takes on full meaning through thetheory. The theory attempts to explain what childhood experiences lead to highachievement motivation, what the preferred leisure activities are for the person with ahigh need for achievement, the types of situations in which such a person will do well,the types in which he or she will do poorly, and so on. If the scale actually measures thekind of achievement motivation explained by the theory, high scorers will report thosepredicted childhood experiences more than low scorers will; high scorers will performbetter in the prescribed situations than low scorers will, and so on. If the predictedpattern of relationships is found, both the instrument and the construct will have beenvalidated simultaneously. If the predicted pattern is not found, the user must determinewhether the fault lies with the instrument, the theory, or the testing of the instrument andtheory. Usually some hypotheses are confirmed, so that clues are available concerningwhat may be right and what may be wrong with both the theory and the instrument.
An instrument is said to have construct validity if statistical and logical tests (themultitrait-multirater approach) show it to have convergent and discriminant validity.
Validity is not inherent in instruments. The user must validate each instrument forthe specific uses for which he or she will employ it. This means studying the validityevidence available in the instrument manual or other supporting documents and carryingout one’s own evaluation of the usefulness of the instrument. In one sense, validityresides in the user rather than in the items; using the same instrument in a variety ofways with different people can build experience and supply data that can add validity toan instrument. In another sense, validity is situation specific; it resides not so much inthe instrument as in the particular use of it. For example: In training the validity of thescale is measured by whether it will help participants to learn more effective behavior;in organizational assessment the consideration is whether the instrument taps thoseprocess dimensions that are correlated with production. In personnel selection thequestion is one of predictive—or discriminative—validity, i.e., whether the instrument is

The Pfeiffer Library Volume 22, 2nd Edition. Copyright © 1998 Jossey-Bass/Pfeiffer ❚❘ 29
significantly related to a meaningful success criterion; and in research the major concernis the theoretical constructs being measured, i.e., whether the scale measures theconcepts derived from theory sufficiently well to permit meaningful tests of hypothesesderived from the model used.
Reliability
A basic question that must be asked of any measuring device is “Is it consistent, i.e., willthe instrument yield the same results for the same people on separate occasions, giventhe same conditions?” This is test-retest reliability. As an example, imagine a ruler madeof taffy. Each time a person measures something with the ruler, it has become shorter orlonger through handling. The person cannot decide the effects of different kinds offertilizer on the height of certain plants because she cannot measure the height in areliable or consistent way.
Another way of checking reliability is to split the instrument into two equal parts tosee if the two parts yield highly similar results (as they should). This is called split-halfreliability. If an instrument has several separate scales, each scale must be split in halfby randomly sorting items into two groups.
Low reliability means that scores are due to something other than the trait onewanted to measure—there is a lack of consistency in the measuring. These factors canbe called “error” or “error of measurement.” An unreliable instrument cannot be valid.
Reliability indices give scores that range between 0.00 and 1.00. A reliability of0.00 means that nothing consistent is being measured and that scores are beingdetermined by error, chance, or random fluctuations in conditions. A score of 1.00means that error, chance, or other extraneous conditions have no effect on themeasurement procedure.
A reliability index of .85 or higher generally is considered to be effective for allpurposes. An index of between .60 and .85 indicates reliability that is effective formeasuring and talking about groups of people and in doing research but may be too lowfor placing high confidence in an individual’s score. Reliability scores below .60indicate that the variability from extraneous factors is so great that the instrument (a)probably should not be used to diagnose an individual and (b) should be used withcaution to talk about groups of individuals. Even though such an instrument may beuseful in research, the error in it may hide or mask significant differences or changesthat exist.
Higher reliability is required of an instrument used for personal feedback because asreliability goes down, error of measurement goes up. Error of measurement is an indexof how close a person’s hypothetical “real” score is to the one that he or she receivedfrom the instrument. A large error of measurement means that the person’s scores wouldvary widely if you gave him or her the instrument a number of times; a small error ofmeasurement means that the scores would be very similar over a number ofadministrations for the same person.

The Pfeiffer Library Volume 22, 2nd Edition. Copyright © 1998 Jossey-Bass/Pfeiffer30 ❘❚
Measures that have relatively low precision can be utilized to study groupphenomena. Averages of groups have more stability than do individual scores. Aninstrument used to measure employee morale over time need not be so accurate as aninventory intended for career-development counseling. A comparatively crude index ofthe level of interpersonal trust in a group or team can be employed if the interest is instudying how the average changes as the group develops.
Reliability refers to whatever is left after the error of measurement has affected thescores. The term has been used to describe two rather different elements: homogeneityof the statements and stability of the scores.
Homogeneity of Statements
Many indices of reliability measure the extent to which statements in the scale measurethe same characteristics. If two statements measure the same thing, as scores go up onone, they go up on the other, and vice versa. They vary together, or “covary.”Homogeneity is a characteristic of a good measure; if an instrument purports to measurea certain trait, all the parts should be measuring facets of that trait. Although scores ofthe various statements on the scale should vary together, they should not vary togetherperfectly, because then there would be duplicate measures of exactly the same thing, andthat would add no new information.
At the other extreme, one would not want statements that are unrelated, because it isimpossible to say what a score measures, and responses might be attributable toguessing or chance. The ideal of homogeneity is a scale with statements correlated onthe average between .15 and .50. Such statements can be viewed as measuring variousaspects or facets of the same thing.
Stability of Scores
The aspect of reliability measured by the test-retest method is stability. The idea is thatone should obtain the same score on repeated measures. If scores are attributable toguessing, chance, momentary reaction to ambiguous wording, or other extraneousfactors, they will vary from one administration of the instrument to another. Thecorrelation coefficient is used to calculate test-retest reliability.
Reliability and validity are closely related considerations. An instrument cannot bevalid without some precision, but a highly stable measure may not necessarily be useful.Reliability is necessary but not sufficient. The major concern is the utility of theoutcomes from the use of the instrument.
Transparency and Fakeability
At least two other aspects of psychometric rigor are worth examining. First, one may askto what degree the instrument is transparent. That is, how obvious is it that a leadership-style instrument is intended to measure leadership? If it is very clear, it will be easier forpeople who take the instrument to understand the results and they will be more likely to

The Pfeiffer Library Volume 22, 2nd Edition. Copyright © 1998 Jossey-Bass/Pfeiffer ❚❘ 31
trust those results. This can be a benefit in many situations, but it is counterbalanced bythe problem of fakeability. That is, the more transparent the instrument, the easier itusually is to fake the results.
Fakeability becomes a problem when it is clear that certain results are moredesirable than others. For example, when managers fill out a particular leadershipquestionnaire, they typically report that they believe in behaving considerately towardsubordinates and that they place low to moderate emphasis on giving directives andorders. When their subordinates fill out a modified version of the same instrument, theresults usually are quite different. Because contemporary U.S. managerial culture favorsa person-centered, less directive style in theory, U.S. managers usually describethemselves in this way even though that is not how they actually behave. The moretransparent the instrument, the more prone people who take it are, consciously orunconsciously, to fake certain responses.
The technical considerations presented here about instrumentation are intended toensure that the data to be used in HRD work are not misleading. The overridingconcerns are validity and reliability, and information about these characteristics often ismissing or inadequate. It is incumbent on the facilitator to explore the technicalcharacteristics of any instrument that he or she is considering using. The facilitator mustbe prepared to answer any technical questions straightforwardly and must determine thevalidity of the instrument for his or her particular purposes.
PRIMARY USEMany different uses exist for instruments. Four primary uses—personal growth, training,measurement, and research—are shown on the model, although these categories are notmutually exclusive.
Personal Growth. Instruments intended to be used for personal growth shouldpromote self-analysis by providing the user with valid information about himself orherself. This information may be exclusively internal (attitudes) or external (behavior).Many instruments also provide clear guidance on what the user can do about the results,either through a program for self-development or through manuals and materials for thefacilitator.
Training. Training instruments are similar in purpose to those designed for use inexploring personal growth, but are oriented far more toward behavior than towardattitudes or personality. Training instruments are directed toward supporting specificbehavioral changes.
Measurement. Some instruments are professional tools for use in assessingorganizations, groups, relationships, or individuals. For example, some measurevocational interests and aptitudes; some diagnose interpersonal relationships in variouscontexts (families, groups, etc.) for the benefit of the professional counselor.

The Pfeiffer Library Volume 22, 2nd Edition. Copyright © 1998 Jossey-Bass/Pfeiffer32 ❘❚
Research. Some instruments are intended primarily for research use. Although validmeasurement is quite important, the purpose is not to use the data in a pragmatic sensebut to build, support, or test some theory. Many instruments used for diagnosticmeasurement formerly were research tools. Most research instruments never arepublished or widely disseminated, although there is now an index of unpublishedresearch instruments so that scholars and scientists have access to one another’s tools.However, many research instruments are designed especially for one specific projectand are essentially useless for any other purpose.
These four purposes for using instrumentation are not perfectly exclusive. Manyinstruments can be adapted for more than one use. A training instrument may well beused for personal growth with only minor modifications.
LEARNING FOCUSMost instruments have one of four primary learning foci: organization, group,interpersonal, or self (intrapersonal). Of course, most can be applied at more than onelevel. It often is possible to use aggregate scores by pair, group, or organization. Beforeaggregating individual scores, it must be considered whether the aggregate score hasmeaning. For example, it might be interesting to see how many individuals in a group ororganization fall into each category on a particular survey, but it might make no sense tofind an average group score.
PSYCHOLOGICAL DEPTH AND IMPACTAnother major dimension along which an instrument can be rated is the psychologicaldepth or intensity of psychological impact it may have. For example, there are severalinstruments that measure the extent to which an individual feels controlled by or able tocontrol his or her environment (external versus internal control). Much research hasshown this measure of personality to have important behavioral implications (Rao,1985; Rotter, 1966), including feelings of depression on the part of those individualswith strong external orientations. With such persons, the use of an instrument measuringinternal/external control (with resultant interpretations and implications) could havesevere and undesirable effects unless the facilitator is skilled in paying attention to theneeds of individual participants and in dealing with the ramifications of interpretation.At the other extreme, an instrument that deals with behaviors that are clear and easilychangeable is likely to have little psychological impact.
An instrument that has deeper psychological impact requires skills of a high orderon the part of the facilitator in order to avoid potential psychological harm toparticipants. Harrison (1970) says that the HRD practitioner should intervene at the leastdepth needed for the diagnosed problem. This is consistent with standard medicalpractice: intervention to cause the minimum trauma consistent with the diagnosis andneeded cure. Thus, if two instruments are available to measure the same traits, the best

The Pfeiffer Library Volume 22, 2nd Edition. Copyright © 1998 Jossey-Bass/Pfeiffer ❚❘ 33
choice usually would be the one that provides guidance for behavioral change withoutprobing too deeply into the participant’s psychological make-up.
OTHER CONSIDERATIONSThe purpose for using an instrument should be examined carefully and stated clearly,and the learning focus should be clear. Next, an instrument must be assessed in terms offour secondary criteria: administrator concerns, respondent concerns, pragmaticconcerns, and client concerns.
Administrator Concerns
The trainer, assessor, or consultant who administers an instrument has some specialconcerns. First, the administrator must consider the special training he or she needs touse the instrument effectively. Some instruments require extensive training in properscoring and interpretation of results. Others require considerable conceptual backgroundto be able to present the theoretical basis. For example, the use of the Survey ofOrganizations (SOO) requires that the consultant have a good grasp of Likert’s (1971)theory of organizations. Many psychological assessment instruments are sold only toindividuals who are “certified” psychologists.
A second concern for administrators is objectivity of scoring, the degree to whichscoring is based on trained judgments versus a standard “key” or index of rules thatassigns specific scores to specific responses. Objectively scored instruments avoid theneed for special scoring skills and may make it easier for respondents to accept theaccuracy of the score.
A third concern is scoring complexity. Even an objectively scored instrument mayhave many complicated scales. A well-constructed scoring key can reduce this concern,as can a simple, self-scoring format or a procedure by which marking one’s responseautomatically enters it on a hidden scoring form by means of NCR or carbon paper.When scoring complexity is high, another alternative may be an electronic scoringservice with rapid turnaround and feedback, as is now provided for many organizationalsurveys.
A final administrator concern is the need for special materials. For example, someinstruments require audiovisual materials; some require special marking pens, etc. Eveninstruments that must be administered in a large-group setting can present problems ifonly a few people can be spared from their jobs at any one time.
Respondent Concerns
Before using most instruments, the facilitator should evaluate how appropriate they arefor a particular respondent group. At least three specific concerns are relevant. First, theadministrator must consider whether the instrument—or certain items on it—could benoxious to users, that is, whether the instrument could provoke negative reactions. Forexample, Peters, Terborg, and Taynor’s “Women as Managers Scale” (WAMS)

The Pfeiffer Library Volume 22, 2nd Edition. Copyright © 1998 Jossey-Bass/Pfeiffer34 ❘❚
(Terborg, 1979) would be inappropriate for use with managers from a country in whichwomen are informally but absolutely excluded from managerial roles in organizations.
A second concern is respondent familiarity with the instrument because some of thegroup members may have taken it in the past and recall their scores or the items. Manyinstruments that normally are not particularly fakeable can be faked easily byrespondents who are familiar with the items, scoring, and rationale. Even whenrespondents do not intend to fake their scores, their familiarity with the instrument maybias those scores.
The third concern is the language level that respondents must have in order torespond adequately to the instrument. Some instruments use language that assumes ahigher level of education than most respondents may possess. Others may use jargon ortechnical terminology with which some potential user groups may not be familiar. Forexample, to demonstrate the cultural and language bias inherent in many “IQ” tests,Morgan (1981) developed the Central West Virginia Cultural-Awareness Quiz, designedso that those who do not share the jargon of Appalachia do poorly. This clearlyillustrates the issue of language level.
Pragmatic Concerns
Also of concern in using instruments are several practical issues. Obviously, theperceived attractiveness of instrument, the clarity of its format, and the ease inresponding to or scoring it contribute to the cooperation of group members in utilizingthe instrument. An important consideration is expense. The administrator should notoverlook possible scoring-service or scoring-supplies expenses, the cost of backgroundmaterials needed to understand the interpretation, special licensing fees, and whether thematerials are reusable. Related to this is the issue of copyright restrictions, not onlywhether the instrument can be reproduced but also whether it can be modified for aspecial purpose or a different user population. Adaptation may not be practical, even if itis permitted. It might be easier to choose a different, more appropriate instrument oreven to create a new one. Accessibility is another issue. Some publishers may have areputation for slow delivery, or some instruments may be circulated on a small scale andmay be difficult to locate. Finally, the time required to prepare to use the instrument, toadminister it, to score it, and to interpret it must be considered. When a great deal oftime is required, an instrument may become impractical for certain uses or simply maybe too costly in terms of total time and costs incurred.
Client Concerns
The concerns of the person who actually will use the results of an instrument must beconsidered. Individuals, groups, or organizations involved in training; individuals incounseling; and individuals, groups, or organizations undergoing formal assessmentneed to know the meaning of their results. If scores can be related to observablebehavior, it will greatly facilitate the use of the instrument for personal growth and

The Pfeiffer Library Volume 22, 2nd Edition. Copyright © 1998 Jossey-Bass/Pfeiffer ❚❘ 35
training purposes. If the instrument is behaviorally oriented to begin with, users will bebetter able to see a relationship between the instrument and their own behavior.
If the instrument generates many, separate, complex scores, interpretation canbecome quite difficult, even for a professional. If the instrument is complex, a greaterburden is placed on the administrator (trainer or consultant). Simple, straightforward,interpretive materials can relieve some of that burden. Data sometimes must be reduced,and it can help to draw a chart or graph of the results. The use of normative data also isextremely helpful. Finally, the existence of a clear and compelling theoretical base canbe critical if the results are to make an impression on the users and affect their behavior.
In examining the applications and uses of instruments, we have identified a broadrange of dimensions that need to be considered. The following chart reflects the relativeamount of concern each dimension warrants for the purposes of personal growth,training, organizational assessment, personnel selection, measurement, and researchapplications.

The Pfeiffer Library Volume 22, 2nd Edition. Copyright © 1998 Jossey-Bass/Pfeiffer36 ❘❚
WHAT TO LOOK FOR IN AN INSTRUMENT
Instrumentation Application
Area of Concern PersonalGrowth
Training OrganizationalAssessment
PersonnelSelection
Measurement Research
Administrator Concerns
Special TrainingHow much professionalpreparation is requiredto use the instrument? High High High High High High
Objectivity of ScoringIs the scoringdependent on thejudgments of thescorer, or is there astandard key?
Medium High High High High Medium
Scoring ComplexityCan the instrument beself-scored? Areelectronic/clericaloptions available? High High Low Medium Low Low
Special MaterialsDoes the instrumentrequire that any specialapparatus be set up inadvance? High High Medium Medium Medium Medium
Respondent Concerns
NoxiousnessWould the items—orthe instrument itself—offend intendedrespondents?
High High High Medium High High
FamiliarityHow likely is it thatrespondents will haveresponded to theinstrument before? Medium Low to
MediumLow Medium Low High
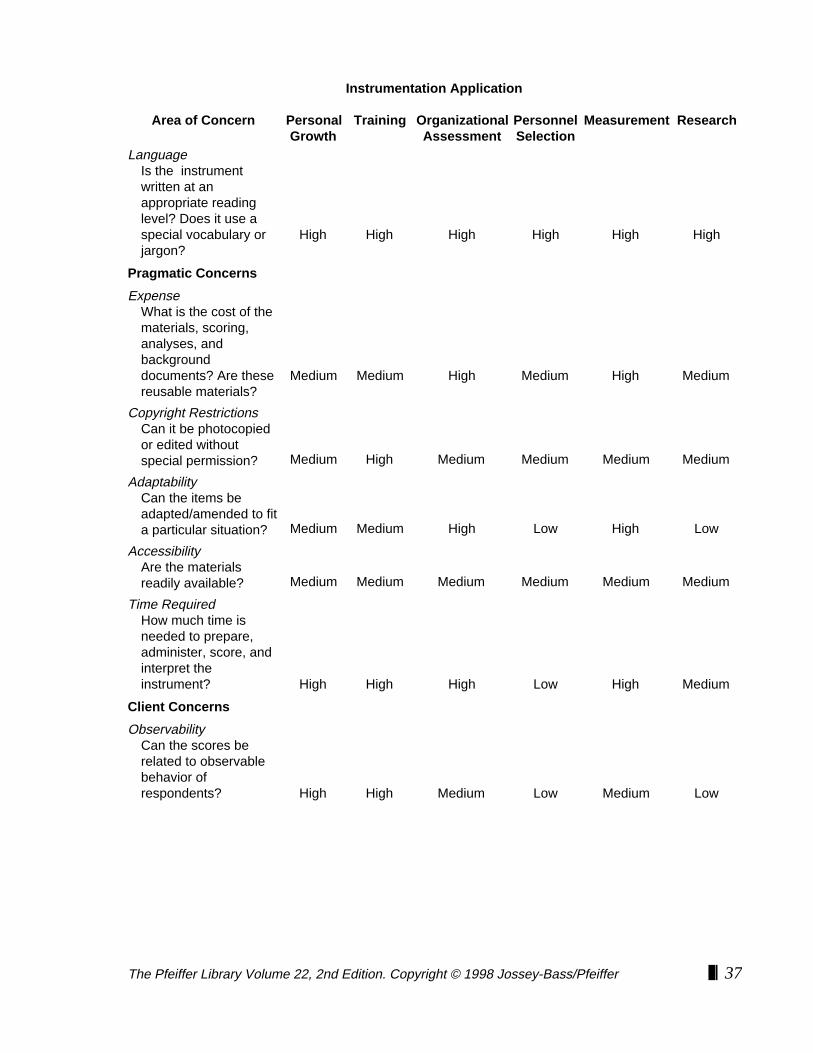
The Pfeiffer Library Volume 22, 2nd Edition. Copyright © 1998 Jossey-Bass/Pfeiffer ❚❘ 37
Instrumentation Application
Area of Concern PersonalGrowth
Training OrganizationalAssessment
PersonnelSelection
Measurement Research
LanguageIs the instrumentwritten at anappropriate readinglevel? Does it use aspecial vocabulary orjargon?
High High High High High High
Pragmatic Concerns
ExpenseWhat is the cost of thematerials, scoring,analyses, andbackgrounddocuments? Are thesereusable materials?
Medium Medium High Medium High Medium
Copyright RestrictionsCan it be photocopiedor edited withoutspecial permission? Medium High Medium Medium Medium Medium
AdaptabilityCan the items beadapted/amended to fita particular situation? Medium Medium High Low High Low
AccessibilityAre the materialsreadily available? Medium Medium Medium Medium Medium Medium
Time RequiredHow much time isneeded to prepare,administer, score, andinterpret theinstrument? High High High Low High Medium
Client Concerns
ObservabilityCan the scores berelated to observablebehavior ofrespondents? High High Medium Low Medium Low

The Pfeiffer Library Volume 22, 2nd Edition. Copyright © 1998 Jossey-Bass/Pfeiffer38 ❘❚
Instrumentation Application
Area of Concern PersonalGrowth
Training OrganizationalAssessment
PersonnelSelection
Measurement Research
Behavioral OrientationAre the scores derivedfrom the respondents’descriptions of theirbehavior? Medium High High Low High Low
Interpretive MaterialsAre easily readinterpretive materialsavailable to bedistributed torespondents? High
High tomedium Medium Low Medium Low
Data ReductionHow many scores arederived? Can these besummarized for ease ininterpretation? High High High Medium High Low
Normative DataAre relevent normsavailable? Low
Mediumto Low Low High Medium
High toMedium
Theoretical BaseIs the instrument basedon a workable model? High High High Low High High

The Pfeiffer Library Volume 22, 2nd Edition. Copyright © 1998 Jossey-Bass/Pfeiffer ❚❘ 39
It may not be possible to rate any one instrument on every factor discussed here, butit should be possible to obtain an average rating using two or three factors in eachcategory and, in this way, to make a reasonable, overall judgment regarding anyinstrument. The check sheet that follows can be filled out and filed with the instrumentfor quick reference.
Instrument Evaluation Check Sheet
Title:
Author:
Source:
Primary Use: ¨ Personal Growth ¨ Training ¨ Organizational Assessment
¨ Personal Selection ¨ Measurement ¨ Research
Learning Focus: ¨ Self ¨ Interpersonal ¨ Group ¨ Organization
Psychometric Rigor
Reliability
low moderate high
Validity
low moderate high
Transparency
very transparent somewhat transparent not at alltransparent
Fakeability
easily faked somewhat easy to fake very difficult to fake
Administrator Concerns
Special Training
requires much requires some requires nospecial training special training special training
Objective of Scoring
completely subjective partly subjective completely objectivejudgment judgment
Scoring Complexity
extremely complex moderately complex not at all complex
Special Materials
requires extensive some special no specialspecial materials materials required materials needed

The Pfeiffer Library Volume 22, 2nd Edition. Copyright © 1998 Jossey-Bass/Pfeiffer40 ❘❚
Respondent Concerns
Noxiousness
clearly offensive somewhat offensive not at all offensiveto users to users to users
Familiarity
considerable some familiarity no familiarityfamiliarity
Language
not appropriate partly appropriate fully appropriatefor users for users for users
Pragmatic Concerns
Expenses
very costly moderately costly not at all costly
Copyright Restrictions
cannot be can be reproduced can be freely copiedreproduced with restrictions
Adaptability
not practical difficult but possible easy to adapt
Accessibility
not at all accessible accessible with readily accessiblesome difficulty
Time Required
long moderate short
Client Concerns
Observability
scores not related indirectly related scores clearlyto observable to observable related tobehavior behavior observable behavior
Behavioral Orientation
scores not derived some scores derived scores derived directlyfrom behavior from behavior from behavior
Interpretive Materials
none available available, not available, excellentvery useful
Data Reduction
multiple scales hard to some data scales easyrelate to one another reduction possible to summarize

The Pfeiffer Library Volume 22, 2nd Edition. Copyright © 1998 Jossey-Bass/Pfeiffer ❚❘ 41
Normative Data
no norms limited normative extensivedata available norms provided
Theoretical Base
no theory base some theory comprehensive,references researchable clear theory
base provided
Once the facilitator has applied the criteria described in this discussion toinstruments that he or she is considering, the final question is: Is this instrumentappropriate for the purpose for which it is intended and the needs of the respondents? Asis discussed elsewhere in this volume, no instrument should be used to measure anythingother than what it purports to measure. An instrument cannot be substituted because it is“close enough” to what is needed without altering the response data and theinterpretation of that data, perhaps with serious consequences. Therefore, if theinstrument under consideration does not satisfy the selection criteria, an alternative is todevelop a new instrument that will meet the needs of the respondents and satisfy thepurpose for which it is intended. Considerations and steps in the development ofinstruments are presented next.

The Pfeiffer Library Volume 22, 2nd Edition. Copyright © 1998 Jossey-Bass/Pfeiffer42 ❘❚
❚❘ DEVELOPING INSTRUMENTS
When an instrument cannot be located that meets the special needs of the group withwhich the facilitator will be working, an instrument can be developed. The time requiredfor such development will be hours or perhaps a day. We will not describe the formalprocedures for developing instruments of established reliability and validity forwidespread psychometric application.
A DEVELOPMENTAL SEQUENCEA number of steps are taken in generating numerical data that can be useful in HRDinterventions. The following is a functional sequence in the development andadministration of a new instrument.
Definition The trait to be measured is defined. Presumably the characteristic is related directly to the goals of the training.
Specification Behavioral instances of the trait are specified and are written as items for a questionnaire, or they are incorporated into the instrument in some manner, depending on the style of instrument the developer has chosen.
Scaling A response format is devised that will yield numbers for interpretation. (Various scaling options will be discussed later.)
Keying A scoring procedure is selected, e.g., weighting response numbers. Thedeveloper examines the key as it applies to the instrument to ensure that itwill be functional.
Duplication The scale is published in a pencil-and-paper response format or through some other device to make it available to the participants.
Administration The administrator facilitates the understanding of the instructions for completing the instrument.
Scoring The key is applied.
Interpretation Participants are instructed on what high and low scores presumably mean. Limitations on validity and reliability are specified.
Norming Frequency distributions and averages are developed for the participants and are posted. The administrator may ask participants to post their own scores to indicate the group “photograph” and to facilitate discussion.
Critiquing The instrument can be refined by studying its utility in the training setting. Participants can be encouraged to share what they have learned.
DEFINITIONBefore developing an instrument to measure something, it may be a good idea todetermine whether the dimension or trait in question could be measured better by some

The Pfeiffer Library Volume 22, 2nd Edition. Copyright © 1998 Jossey-Bass/Pfeiffer ❚❘ 43
other means or whether it is worth the trouble. For example, assume that one wereinterested in measuring the participation of members of a group. If participation isdefined as the number of words spoken by a group member during a session, one couldmeasure that dimension perfectly by attaching a microphone to every member andcalculating the number of words spoken by each member. Granted that there are someresearch designs in which such information might be desired, the limitations of such ameasure for use in small-group discussions is obvious. The number of words spokenprovides almost no information for group members to use; they are more apt to beinterested in the quality, nature, or impact of the words spoken. Most important issues insocial interaction are heavily laden with such value judgments. When group membersrate one another on “participation,” it may be difficult to ascertain how much they arerating quantity of talking and how much they are rating other factors such as influenceand leadership. It is not sufficient to assume that because a dimension such asparticipation is being rated reliably (i.e., group members produce the same score), themembers are in agreement on exactly what they are rating. When all members of agroup find agreement easy in rating some dimension, it may be a clue that theinformation to be obtained and the potential for important learnings may be limited(Hanson, 1981).
Although an instrument may have face validity, the question of whether or not theinstrument is measuring what it is supposed to measure should be subjected toexperimental studies specifically designed to provide construct validity. A minimumeffort to establish such validity is to review the dimensions with the group ofrespondents prior to their completion of the instrument to make certain that everyone isin agreement about the definitions of the items or dimensions. The question is notwhether the instrument developers agree on the items, but whether or not therespondents understand them (Hanson, 1981).
SCALINGAfter the content of the instrument has been specified, the facilitator devises a scalingprocedure. Several uncomplicated and useful strategies are discussed here.
Summative Scale
The summative scale, or Likert scale, was developed by Rensis Likert (Likert, 1932). Itis constructed by first devising statements that a person might use to describe himself orherself, e.g., “I am nervous right now,” or “I usually let other people decide what wewill do together.” Some reasonable categories then are developed for the respondent touse to indicate his or her feelings. The most usual response categories are (1) yes,unsure, and no; (2) true, unsure, and false; and (3) strongly agree, disagree, and stronglydisagree. The following example illustrates an instrument item in the third category.

The Pfeiffer Library Volume 22, 2nd Edition. Copyright © 1998 Jossey-Bass/Pfeiffer44 ❘❚
Circle the response that most clearly reflects your feelings.SA = Strongly agreeA = AgreeSLA = Slightly agreeU = Uncertain (undecided/unsure)SLD = Slightly disagreeD = DisagreeSD = Strongly disagree1. I am a very persistent and steady worker. SA A SLA U SLD D SD
Researchers have moved away from the seven-point Likert scale because of thepossibility of ambiguity (e.g, the meaning of “agree” seems very similar to the meaningof “slightly disagree”; if you have only some slight disagreement with a position, itmeans that you basically agree with it). Others have moved away from the use of the“uncertain” or “unsure” response because it allows the respondent to avoid commitment.We propose a set of four responses: “Disagree; Unsure, probably disagree; Unsure,probably agree; Agree.” This acknowledges that a respondent may be unsure about hisor her reactions and, at the same time, it measures the intensity of his or her feelings.Even though the uncertainty is acknowledged, the respondent is asked to indicate whichway he or she tends to lean. On the other hand, it is possible to so indicate if one’sconvictions are sure. For example:
Circle the response that most clearly reflects your feelings.A = AgreeUA = Unsure, probably agreeUD = Unsure, probably disagreeD = Disagree1. I find it easy to influence people. A UA UD D
A score for a respondent is obtained by assigning a number to each of the responsecategories and then adding up the numbers for each response indicated. The number canbe assigned before the instrument is administered to the person so that the respondentplaces a number in the response space rather than a letter; e.g, 1 for Disagree; 2 forUnsure, probably disagree; 3 for Unsure, probably agree; and 4 for Agree. The person’sscore would be the sum of the scores he or she wrote down in responding to thestatements. If a statement is worded in opposition to the characteristic being measured,the scoring key is reversed so that a response of 1 is counted as 4, 2 is counted as 3, andso on. As an example, in devising an instrument to measure need for interaction withothers, let us assume that we have four statements, with a person’s response recorded infront of each of them.
3 1. I enjoy being with a lot of people. 3 2. I often organize parties or get-togethers. 1 3. I prefer reading to talking with people. 4 4. The good life is the life of friendship, wine, and song.

The Pfeiffer Library Volume 22, 2nd Edition. Copyright © 1998 Jossey-Bass/Pfeiffer ❚❘ 45
Statement number 3 is reverse-worded, so the response of 1 will be counted as 4. Thus,the person’s score on the four-item scale is 3 + 3 + 4 + 4 = 14 out of a possible range offrom 4 to 16. This respondent appears to be socially extroverted. This person might haveresponded with an “Agree” (4) to statement 1 if it had not had the words “a lot” in it. Itis desirable to have some statements that are more extreme than others to help toseparate those individuals who are high on a characteristic from those who are very highon it.
Rating Scales (Semantic Differential)
The semantic-differential approach is the most well-known use of the rating scale. In theuse made by Osgood, Suci, and Tannenbaum (1957), objects (groups, organizations,practices, people, countries) are rated on a series of bipolar scales such as the following:
Sometimes the spaces are numbered from 1 to 7 and sometimes they are numbered from-3 to +3. The first system gets rid of minus signs; the second system indicates clearlywhether an attitude is positive or negative. Osgood and his colleagues analyzed theirdata to try to reduce the number of measures to a few broad ones that seemed to indicatehow people react to social objects. They found three basic dimensions that accounted formany of the ways in which people understood or reacted to things. These are: evaluation(whether the person likes it); potency (whether the person thinks it is powerful); andactivity (whether the person thinks it is moving). Scales that measure the evaluationdimension are:
1. Sweet-sour
2. Beautiful-ugly
3. Tasteful-distasteful
4. Kind-cruel
5. Pleasant-unpleasant
6. Bitter-sweet
7. Happy-sad
8. Sacred-profane

The Pfeiffer Library Volume 22, 2nd Edition. Copyright © 1998 Jossey-Bass/Pfeiffer46 ❘❚
9. Nice-awful
10. Good-bad
11. Clean-dirty
12. Valuable-worthless
13. Fragrant-foul
14. Honest-dishonest
15. Fair-unfair
Scales that measure the potency dimension are:
1. Large-small
2. Strong-weak
3. Heavy-light
Scales that measure the activity dimension are:
1. Active-passive
2. Fast-slow
3. Hot-cold
More evaluative adjectives are given in the first category because it is the strongestfactor in people’s reactions and is used most often (it seems to be an effective measureof pure attitude or pure affect).
The basic technique can be expanded in two ways. First of all, the number of ratingscales can be varied. The instrument developer can add bipolar labels that fit his or herarea of interest, e.g., open-closed, risky-cautious, demanding-yielding, colorful-drab,deep-shallow. Second, the social objects that can be rated are limited only by the time,energy, and creativity of the developer. Examples of objects to be rated include: thisorganization, this organization ten years from now, me, my ideal self, me as others seeme, our team, our relationship, this apple, the person in this group whom I admire themost, Fred, Ed, etc. An example follows.
Place a check in the space that indicates your reaction to the object.
Object: The organization

The Pfeiffer Library Volume 22, 2nd Edition. Copyright © 1998 Jossey-Bass/Pfeiffer ❚❘ 47
Object: My boss
As with the summative scales, numbers are assigned to ratings, e.g., the spaces fromleft to right are 7, 6, 5, 4, 3, 2, and 1, with the exception of the Bitter-Sweet scale, whichhas reversed response numbers of 1, 2, 3, 4, 5, 6, and 7. The user adds the responses toall the bipolar scales that measure the same characteristic. The total is that person’sscore or rating of that specific object on that specific characteristic.
Some people prefer to use an even number of points on a scale, based on theassumption that the respondents will be forced to select a rating either above or belowthe nonexistent middle point (the choice point for people who want to play it safe orwho do not want to make the effort to discriminate). On the other hand, not having amidpoint may force a respondent to ignore a reality that he or she actually perceives.Having too few points on a scale does not allow much discrimination. Having too manypoints may give the false impression that the item is so refined that the number ofchoices is justified. In making such decisions, the designer must use his or her ownjudgment in terms of the purpose of the scale, the clarity and specificity of the behaviorsor things to be rated, and the face validity of the items (Hanson, 1981).
The number of points on a scale to be labeled will depend on the facilitator’s and/orrespondents’ needs for greater or lesser reliability. The more points that are labeled, theeasier it is for respondents to rate them with reliability. This greater reliability would beimportant primarily if the scales were to be used for research purposes. In labeling ascale, it also is important not to use words that change the concept of the original item.For quick assessments (e.g., to help groups to process their meetings), the designer maychoose to label only the two extremes of the scale.
Forced-Choice Scales
One of the problems with most scaling techniques is that the respondent can work atmaking himself or herself look good rather than at describing what he or she really islike. The forced-choice technique presents two alternatives and asks the respondent tochoose which one he or she prefers. The respondent may hate them both or may thinkthat both are excellent; regardless, he or she must choose one and reject one. Thefollowing is an example.

The Pfeiffer Library Volume 22, 2nd Edition. Copyright © 1998 Jossey-Bass/Pfeiffer48 ❘❚
Choose the activity you prefer by placing a check in front of it. You may check only one in each pair. Besure to respond to each pair.
1. Walking through the woods on a cool, sunny day.
Attending a football game on a cool, sunny day.
2. Lying on the beach talking to a member of the opposite sex.
Reading a good novel at home.
The advantages of the forced-choice approach are: (a) the respondent is forced tochoose between alternatives—a behavior that is part of life, and (b) the choices usuallyare equated in their social desirability so that neither choice makes the respondent whochooses it appear healthier, more motivated, more moral, or more intelligent than theother choice.
One of the advantages of the forced-choice method, the difficulty for the respondentin skewing answers in a socially desirable way, also leads to a disadvantage. Withforced-choice techniques, all respondents obtain the same scores, i.e., if you sum theirscores on scales A, B, and C, they always will equal the same number. Thus, a personwhose total involvement in the three areas measured is extremely high will obtain thesame total score as a person whose total involvement in the three areas is near zero. Asecond disadvantage of this method is that it may irritate respondents by requiring themto choose between two equally attractive alternatives or, worse, between two equallyunattractive alternatives, neither of which they would consider normally.
Three modifications can be made in the simple forced-choice approach. One is topresent three or four alternatives and have the respondent select the one he or she likesleast. This approach provides more flexibility than just two alternatives. A secondmethod is to provide two alternatives, but instead of asking the respondent to chooseone, allow him or her to allocate five points between the two choices. Thus, choice Amay receive a rating of 5 and choice B a rating of 0, or choice A may receive a rating of3 and choice B a rating of 2, and so on. This approach avoids forcing an artificial choice.All responses are not counted because some alternatives are used to indicate neither (ornone) of the scales being studied. If a person responds to an alternative that is irrelevantto the characteristics being measured, it reduces his or her scores on the scale beingassessed and lowers the total score.
Sociometric Ratings
One application of the rating-scale technique is the rating of members in a group(department, family, task group, etc.). Assuming that people are using a seven-pointrating scale on the same dimension, ratings can be summed in two ways, as shown in thematrix that follows. One can see at a glance whether person A rated person B in a waythat is discrepant from the way in which B was rated by the others in the group; whetherperson A rated person B in a way that is discrepant from A’s usual rating scale; whoreceived the highest total rating (Roger); who received the lowest (Elizabeth); whotended to rate everybody high (Marsha); and who rated everybody low (Roger). It also is

The Pfeiffer Library Volume 22, 2nd Edition. Copyright © 1998 Jossey-Bass/Pfeiffer ❚❘ 49
possible to look at people’s self-ratings (diagonal cells) to see if some are unusually hardor easy on themselves.
Matrix of Ratings Given and Received
Ratee Ratings Givento Others
Bill Roger Marsha Nancy Elizabeth Total Mean
Bill 4 6 2 5 1 18 3.6
Roger 2 4 1 3 1 11 2.2
Marsha 6 7 5 5 4 27 5.4
Nancy 5 7 2 4 1 19 3.8
Elizabeth 3 5 1 2 1 12 2.4
Ratings Received from Others
Total 20 29 11 19 8 87 17.4
Mean 4.0 5.8 2.2 3.8 1.6 17.4 3.5
In general, the sociometric technique is one that can be done on the spur of the moment,does not need any forms, allows open discussion in the group (this should be agreed onbeforehand by group members), and provides a number of informative and discussableindices.
Meanings of Numbers
Scores derived from instruments do not have meaning except as they are related to boththe content of the items and the method of deriving numbers. Interpreting an index ofanxiety based on counting how many items a respondent marked as true is differentfrom determining the meaning of a score in a forced-choice inventory. The basic numbersystems relevant to instrumentation are as follows:
Nominal Numbers are used to “name” things and are assigned arbitrarily. No “greater than” is implied. An example is the numbering of football jerseys.
Ordinal Numbers represent ranks. There is a notion of “greater than” but not “how much greater.” An example is the ranking of graduates in a class.
Interval Numbers denote by how many units one score is greater than another. However, there is no true zero point. An example is a Fahrenheit thermometer.
Ratio Numbers indicate positions on a scale with a true zero point, such as weight. Comparisons such as “twice as much” are possible. An example is a bathroom scale.
Most instruments used in HRD work are assumed to generate ordinal and interval data.When a group facilitator collects ordinal data, however, he or she is restricted in thetypes of statements that can be made about the data. For example, if participants are

The Pfeiffer Library Volume 22, 2nd Edition. Copyright © 1998 Jossey-Bass/Pfeiffer50 ❘❚
asked to rank-order the other members of the group on some characteristic, they must bereminded not to interpret such rankings (ordinal) as though they were ratings (interval).
DEVELOPING GROUP NORMS
In developing one’s own instrument or in working with an instrument for which thenorm groups are significantly different from the members of one’s participant group, itis necessary to know some simple statistical procedures for developing norms. Thesimplest norm is a hand count of scores, with a posted tally. If participants seemreluctant to reveal their scores, they may be asked to write them anonymously on smallpieces of paper. A chart such as the following then can be constructed.
Name of Characteristic
(Rounded) Score Frequency
7 _______
6 _______
5 _______
4 _______
3 _______
2 _______
1 _______
Almost equally simple are averages (means, medians, and modes) and ranges that can beobtained from such a tally. For example:
Dimensions 1 2 3 4
Mean _______ _______ _______ _______
How I see myself inthis group Range _______ _______ _______ _______
Mean _______ _______ _______ _______
How I see this group
Range _______ _______ _______ _______
The tally can be reduced graphically, making a group “photograph.” Two scores can bedepicted simultaneously on the same numerical scale. The following pattern, forexample, often emerges on the instrument “Supervisory Attitudes: The X-Y Scale”(Pfeiffer & Company Library 19, 187-192):

The Pfeiffer Library Volume 22, 2nd Edition. Copyright © 1998 Jossey-Bass/Pfeiffer ❚❘ 51
X-Y Scale Norms
The tally can be converted into percentile ranks by a simple procedure.
1. Add two new columns to the tally: one for cumulative frequency (from thebottom up) and one for approximate percentile;
2. Divide the number of participants by one hundred; and
3. Multiply each entry in the frequency column by this factor.
The result is a set of percentiles that are interpreted this way: “___________ percent ofthe people scored this given score or less.” The procedure is illustrated here withhypothetical data.
Group Leader Self-Disclosure Scale NormPersonal History
Score FrequencyCumulativeFrequency
ApproximatePercentile
7.0 0 61 99
6.5-6.9 1 61 99
6.0-6.4 1 60 98
5.5-5.9 2 59 97
5.0-5.4 6 57 93
4.5-4.9 8 51 84
4.0-4.4 10 43 71
3.5-3.9 9 33 54
3.0-3.4 9 24 39
2.5-2.9 7 15 25
2.0-2.4 5 8 13
1.5-1.9 2 3 5
1.0-1.4 1 1 2
0.5-0.9 0 0
0.0-0.4 0 0

The Pfeiffer Library Volume 22, 2nd Edition. Copyright © 1998 Jossey-Bass/Pfeiffer52 ❘❚
If the group is small, a simple tally may be preferable. Norms for comparablegroups can be accumulated over time to provide more stable statistics and to facilitatecomparisons that are, on the average, more meaningful.
VALIDATING INSTRUMENTS THROUGH USEOne way to obtain clear behavioral evidence of instrument validity is for the facilitatorto form relatively homogeneous groups whose members’ behaviors (individually or as awhole) are likely to be consistent with the instrument scores. The procedure for this typeof validation is relatively simple. First the instrument is administered, and thenhomogeneous groups are formed. For example, with an instrument that categorizesscores on separate scales (e.g., “self,” “interaction,” and “task” orientations), afteradministration and scoring but prior to any explanation, group members are divided intoscore categories, and subgroups are formed of members who scored high on the samescale.
The second aspect of the validation procedure requires a task provided by thefacilitator. Ideally, the task should be highly suited to the precise types of behaviorpredicted by or inferred from the instrument; however, it is adequate if the task isdesigned to permit a range of various behaviors. In other words, if the facilitator were togive all subgroups the same task and allow only a very short period of time in which toaccomplish it, all subgroups would exhibit task-oriented behavior. With a task thatallowed time for a wider range of behavior, subgroups typically would exhibit thebehaviors expected. Thus, subgroups composed of highly task-oriented individualswould focus on the task given them; subgroups composed of highly self-orientedindividuals would accomplish little (often with discord, perhaps over leadership roles);and subgroups composed of highly interpersonal-oriented individuals would have anenjoyable time socializing and might or might not accomplish the task.
Although these dynamics usually are quite easy to identify, the use of observers or,even better, videotape to record brief vignettes of interaction in each subgroup can helpto capture clearly and strongly the behaviors of interest. Subgroup members often aresurprised to see what they remember as happening “to some degree” recorded soemphatically on videotape. Thus, these procedures can be quite powerful fordemonstrating the reality of the behaviors that the instrument measures through whatotherwise may seem to be rather abstract scales. Participants’ belief in the validity of ameasure is a necessary precondition for the use of the instrument in training.
It is important to remember that once the behaviors that the instrument measures aredemonstrated, the focus must shift to the individual and his or her plans for altering ormodifying some behavior. This is the “training” phase of instrument use. It goes beyondmerely understanding what an instrument measures; it involves the application oflearning to real life. As is discussed previously, the goal of using instruments in trainingdesigns is to develop self-awareness. The individual participant must be able tounderstand which of his or her specific behaviors might be changed. Although new

The Pfeiffer Library Volume 22, 2nd Edition. Copyright © 1998 Jossey-Bass/Pfeiffer ❚❘ 53
behaviors may be obvious to some participants, for others it may be difficult to developplans for behavioral change. The facilitator must provide a training structure that allowsparticipants to develop and then in some way to practice alternative behaviors. A widerange of actions and options for doing this exists. Please refer to the discussion entitled“Instruments As Part of Overall Training Designs” for more on this topic.
GENERATING CONTENT WITHIN THE GROUP ITSELFOne of the most effective and unique aspects of instrument use is generating instrumentson the spot with the participants when the facilitator identifies a need that cannot be metby any of the instruments he or she may have available. This strategy also is useful withparticipants who are apt to engage in the defensive tactic of “nitpicking,” challengingthe validity of items and/or scales.
Items that can be used to form an instrument can be developed quickly with theassistance of participants. This approach has the advantage of developing a sense ofownership, commitment, and relevance. If the recipients of instrumented feedback areinvolved in specifying what is to be measured, they are more likely to learn from theprocess and less likely to reject the data.
Spontaneously derived instruments are helpful in exploring concepts, generatinghere-and-now data for discussion and/or processing, developing new models forexploring human interaction, and facilitating a sense of ownership about learning. It ispossible for a facilitator to develop instruments that measure exactly the characteristicsin which he or she is interested, and facilitators should feel free to use their creativity toget at those characteristics in whatever way seems most appropriate.
Of course, few scales evolved in this way would stand up to statistical scrutiny.Homemade instruments tend to be unreliable, yielding unstable scores. The caveat isthat one must beware of over-interpreting the results. The results should be viewed bythe participants as suggestive, not conclusive.
One can create an instrument that can generate intensive discussion by having theparticipants brainstorm a list of the qualities or characteristics relevant to what is beingstudied (e.g, in a leadership workshop, they would list the qualities of a good leader).Then each participant would rank the items on the list from first to last in order ofimportance. A large group may be broken into small groups for discussion. Participantswould compare their rankings, obtain a group average, discuss the differences andsimilarities in their biases, and attempt to reach consensus. A crude measure of influencecan be obtained by summing the differences between the group-consensus ranking andthe original points of view of individuals. Presumably, those with low scores would bethe most influential.
Adjective Checklists
Adjective checklists can be developed by some procedure such as brainstorming, freeassociation, or critical incidents. For example, the facilitator can ask that each

The Pfeiffer Library Volume 22, 2nd Edition. Copyright © 1998 Jossey-Bass/Pfeiffer54 ❘❚
participant write down two or three adjectives that describe his or her best friend andtwo or three that describe the one person with whom he or she has had the leastsatisfactory relationship. The adjectives generated then are alphabetized and used forvarious purposes such as feedback, intergroup perception checking, and evaluating.
An example can be drawn from a team-building session. The facilitator wants a wayto focus an exchange of interpersonal perceptions about influence within the workgroup. Each member is instructed (a) to recall an individual in his or her past (notpresent) who has influenced the member both significantly and positively and (b) towrite down two or three adjectives that describe how he or she experienced that person.Then the process is repeated with each participant listing a person who influenced himor her both significantly and negatively. These two lists of adjectives are called out bythe participants, alphabetized, and posted. This “instrument” then is used to guide thediscussion of individuals in the team. There are no questions about reliability, validity,objectivity, or relevance.
For an instrument such as an adjective checklist, it is not necessary to go through amechanized duplicating process. Such a list can be written on a chalkboard or onnewsprint for the participants to see, or they can make their own copies on blank sheetsof paper. Instructions can be given orally.
Attitude Scales
Attitude scales can be derived from declarative sentences about issues facing membersof the group or the organization. The facilitator can select an appropriate topic (attitudeobject) such as job enrichment, MBO, participative management, or consensus as adecision-making strategy. Each participant writes a statement about the topic. Thesestatements are posted and numbered, without discussion. (The facilitator must be carefulnot to edit the statements except to make them unidimensional. For example, thestatement “Job enrichment is best done by imposing changes designed by managementbecause workers do not have the proper perspective” is really two statements and shouldbe posted as such.) The response scale is then introduced. Usually this is some variationof the familiar Likert scale, such as:
SA = Strongly AgreeA = AgreeU = Uncertain or UndecidedD = DisagreeSD = Strongly Disagree
Participants write down the number of each statement and their response to it. Theseresponses are tallied by a show of hands, and the facilitator guides a discussion of theresults.
In one supervisory skills session, the facilitator noticed a controversy amongparticipants regarding the subject of women as managers. Because the group had

The Pfeiffer Library Volume 22, 2nd Edition. Copyright © 1998 Jossey-Bass/Pfeiffer ❚❘ 55
resisted an earlier paper-and-pencil inventory that the facilitator had introduced, aspontaneously developed instrument seemed to be the right way to focus attention onboth the subject and self-assessment. Participants were instructed to write down acompletion of the following sentence: “As managers, women . . . .” Members of thetraining group were reluctant to read their sentences aloud in order for the facilitator topost them, so small discussion groups were formed to explore the reasons why peoplewere hesitant to reveal their attitudes. Reports indicated that this was a controversialtopic in the company and that it never was addressed publicly. The facilitator then hadparticipants write their sentences on cards and pass them in anonymously. Thestatements were randomized and posted. Members then used the five-point Likert scaleto record their agreement or disagreement with each item. Individuals asked for a grouptally on any item of interest, and a lively discussion followed.
Semantic Differential Scales
Participants can develop a list of bipolar adjectives, such as hot-cold, light-heavy, high-low, etc. These are posted as the ends of continua, with six or seven points in between,e.g.:
empty/ _________ / _________ / _________ / _________ / _________ / _________ / _________ full
fast/ _________ / _________ / _________ / _________ / _________ / _________ / _________ slow
Then a topic to be rated is announced. Each participants rates the topic according to hisor her associations with it. These ratings are tallied and written on the posted instrumentas the agenda for discussion. The group sees its profile of association for the topic rated.According to the research of Osgood, Suci, and Tannenbaum (1957), who developedthis type of instrument, three types of bipolar adjectives should be included: those thatare evaluative (sweet-sour, happy-sad, etc.), those that measure potency (large-small,strong-weak, etc.), and those that refer to activity (active-passive, fast-slow, etc.).
Several years ago, public-school principals were discussing racial integration intheir schools in a management-development seminar on conflict. The interchange wasenergetic, but the facilitator sensed that the participants were using familiar terms inways that implied a variance of meaning. What “the neighborhood concept” meant toone person was not what it meant to another. The discussion was not creatingunderstanding, and emotions were running high. A set of semantic differential scaleswas constructed to clear up the connotative meanings of various, emotionally loadedsubtopics, such as forced busing, magnet schools, and ethnic studies. This interventionhelped to foster more effective self-expression and listening.
Behaviorally Anchored Rating Scales (BARS)
Participants individually write down important dimensions to be studied. These liststhen are melded on newsprint, and the group members select the most salient ones bysome appropriate method (e.g., voting for three, ranking, or rating). Subgroups are

The Pfeiffer Library Volume 22, 2nd Edition. Copyright © 1998 Jossey-Bass/Pfeiffer56 ❘❚
formed to correspond to the selected dimensions, and these groups constructbehaviorally anchored rating scales (BARS). (For a structured experience and aprofessional development article on using BARS, see Pfeiffer & Company Library 18,113-119 and 20, 167-178). These scales are presented to and edited by the group. Thenthe BARS are used to perform ratings to generate data for discussion.
An example of this technique comes from team building. In sensing interviews,members of the group had voiced dissatisfaction with their weekly staff meetings. In thebeginning of the offsite session, the group constructed BARS on six different aspects ofeffective staff meetings (e.g., cooperation, open communication, attention to process).One of the scales was participation.
Participation 1 l l l 2 l l l 3 l l l4 l l l5 l l l 6 l l l 7 l l l 8 l l l 9
The meeting is People contribute Everyone’sdominated by when they have input is solicitedone or two strong feelings before decisionsmembers are made
These scales were then used by individuals to rate their usual meetings and thatparticular meeting. A progress chart was constructed on which averages were posted.The BARS were used at the end of each three-hour segment of the team-building sessionand became the bases for team self-assessment at ensuing regular staff meetings.
Model-Based Questionnaires
The group is given the task of creating a model of the process to be studied. Subgroupsare formed around the major aspects of the model and they are instructed to develop oneor two questionnaire items to measure the selected dimensions of the model. Eachmember of a subgroup makes a copy of the subgroup’s item(s). As soon as all subgroupshave completed this task, an “assessment circus” is held, in which everyone fans outfrom subgroups and “administers” items to one another. One participant approachesanother, shows the item(s), records the response(s) on a separate sheet of paper, andthen solicits a critique of the item(s). When all participants have been surveyed, thesubgroups are reassembled to tally the data and to discuss the critiques of their items.Representatives are chosen to make brief reports to the total group. Then the facilitatorleads a discussion of the aggregate data.
In a train-the-trainer workshop, the staff wanted to involve participants in exploringthe norms of the “learning community” in order to increase commitment to sharedresponsibility. The group brainstormed community norms and selected a set of five thatseemed particularly relevant to the workshop at that time. Members volunteered to workon a norm area of interest, and subgroups each wrote one or two items. After all the datawere collected and collated, subgroup representatives had a confrontation meeting withthe workshop staff to present the findings. (The other participants were observers.) Thestaff members had their own meeting at that time to explore methods to deal withdysfunctional norms and to reinforce facilitative ones. Subgroups reassembled to rewrite
The Pfeiffer Library Volume 22, 2nd Edition. Copyright © 1998 Jossey-Bass/Pfeiffer ❚❘ 57
their items, based on the critiques; these items formed the basis for a later diagnosis ofcommunity functioning.
Conclusion
Spontaneously developed instruments can be quite useful in training programs in whichthe validity and reliability of an instrument are not as important as its application to theconcerns of the group. For example, a trait can be defined, and then participants canbrainstorm behavioral instances of high and low values of the characteristic. Traits canbe selected from an adjective checklist to form the basis of a rating scale. Group-processphenomena can be identified and can become the content of reaction instruments; suchdimensions of group development as trust and openness can be further differentiatedinto behavioral referents. Developing instruments spontaneously not only serves as aneffective training and consulting intervention, but it also serves as the basis for scalesthat can be refined later into publishable form.
Although the basic precepts presented here hold true in the process of developingany instrument, our focus primarily has been on instruments for training anddevelopment groups. Instrumentation also is a very useful tool in organizationaldiagnosis. Because it is likely that an instrument may not already exist that would meetthe specific needs of (or accurately describe) a particular organization, the discussionthat follows presents guidelines for designing and conducting organizational surveys.

The Pfeiffer Library Volume 22, 2nd Edition. Copyright © 1998 Jossey-Bass/Pfeiffer58 ❘❚
❚❘ DESIGNING AND CONDUCTINGORGANIZATIONAL SURVEYS
There are many standardized instruments available for use in the applied behavioralsciences, including HRD work. Perhaps the most commonly used instrument is thefamiliar attitude and opinion survey. Such instruments are used in group andorganizational settings to measure behavioral dynamics, morale, organizational climate,leadership, and a host of other variables that describe or relate to human behavior. Someare focused on a single variable while others are comprehensive instruments for use inorganizational assessment and development. The Survey of Organizations (SOO)(1980), for example, often is used in conjunction with survey-guided development(Bowers & Franklin, 1977; Franklin, Wissler, & Spencer, 1977; Hauser, Pecorella, &Wissler, 1977). When the issues of concern to a manager or group facilitator arenarrowly, rather than broadly, defined, a full-scale organizational assessment is notneeded. What is then desirable is a survey instrument designed specifically to meet theuser’s needs.
Everyone is familiar with the results of some survey, but how those results areobtained usually is a mystery known only to the experts—whoever they are. Actually,the development of a survey instrument primarily is a matter of care, common sense,and skill developed through practice (and based on the ability to write coherently). Noset of instructions can provide basic aptitudes or the equivalent of practice, but thefollowing guidelines describe how to take care, what common sense is, and where toinvest efforts that amount to practice.
STEP 1: DEFINE THE OBJECTIVESWhat is the purpose or intent of using the survey? What precisely is the survey trying tofind out? Why are these data needed? Can the data be obtained in some way other than asurvey? If not, the objectives should be defined as precisely as possible—in writing—and should be limited to those that are really important, i.e., the reasons for doing thesurvey. If there are more than four or five basic issues, the survey probably will be toolong and the respondents—the people who are asked to fill out the questionnaire—willnot respond.
STEP 2: IDENTIFY THE POPULATION TO BE STUDIEDThe population is everyone from whom the surveyor would need to have a response inorder to completely and correctly answer the basic questions. It is important to beprecise in defining the population to be used. Although this does not mean that a list

The Pfeiffer Library Volume 22, 2nd Edition. Copyright © 1998 Jossey-Bass/Pfeiffer ❚❘ 59
should be made of everyone in the specific population, this is the time to consider howthe survey instrument physically will be brought to the people in the respondentpopulation. For example, will the members of the group be assembled in one place orwill the questionnaire be mailed to them at their home or business addresses?
STEP 3: SELECT THE SURVEY SAMPLEIdeally, one would like to conduct a census, a survey that includes everyone in thepopulation of interest. Obviously this is not realistic if we are talking about, for example,“all managers.” The researcher must settle for a sample of the population, preferably asample that will provide the same results as if all managers actually had responded. Lessobviously, the consultant helping a particular company may also be faced with anunrealistic task if, for example, there are 783 managers in the entire company. Withlimited resources, an individual consultant may find it impossible to obtain and analyzethis much data. Typically, one conducts a census-type survey only when the populationis relatively small or when the need for total participation is extremely great.
Sampling techniques have been developed and refined extensively in the lastseveral decades, but the two most significant ones are randomness and stratification.Normally, every person in the population should have an equal chance of being pickedto be in the sample. This can be accomplished by random selection. Because anynumber of factors easily can interfere with random selection, this step requires extremecare. Suppose, for example, that the consultant to a small company decided to sample 20percent of the 783 managers by listing all of them by their social security numbers andselecting 156 of them. If the consultant were to pick the first 156 and the list were innumerical order (low to high), the sample would not be random but biased. BecauseSocial Security numbers are not assigned randomly, managers from certain parts of thecountry or of certain ages would be excluded from the sample. If the consultant were totake every fifth number, the sample would be random; but the best method would be tolist the numbers randomly and then select every fifth one. This procedure still might notyield a representative sample because there are different numbers of managers at eachlevel of management and fewer high up in the hierarchy. Thus, high-level managerswould be less likely to be represented in the sample than low-level managers.
To correct this problem, one must stratify the sample—in this case by manageriallevel. This can be done by grouping the social security numbers by management leveland picking 20 percent of the people in each level. The final sample then would berandom and also would represent the population accurately. One can, of course, stratifythe population on any basis that logically will reduce bias or make the sample morerepresentative.

The Pfeiffer Library Volume 22, 2nd Edition. Copyright © 1998 Jossey-Bass/Pfeiffer60 ❘❚
STEP 4: CONSTRUCT THE INSTRUMENTIn order to develop a concise instrument, one must have some skill in writing and alsomust be able to endure the tedium of rewriting over and over again until the questions(or items) are as nearly perfect as possible. A typical organizational survey has at leastfour basic parts: the cover letter, the items, the scales, and the codes. Each of these mustbe prepared extremely carefully in order to achieve optimum results. Obviously, muchpractice is a primary way to attain skill in this area.
The Cover Letter
The cover letter should be written clearly and simply, without the use of jargon andtechnical words. It should speak to the respondent on at least three issues: (a) why thesurvey is being conducted; (b) what the benefit of the survey might be, especially withrespect to the respondent; and (c) the guaranteed anonymity and security of responses.Respondents also should be thanked for their participation. The cover letter should notbe long; two to three paragraphs usually is adequate. The more the letter looks like a“real” letter, the better. The use of letterhead stationery is highly desirable, and,whenever possible, each letter should be signed individually. (This usually is possibleonly when fewer than one hundred questionnaires are being used.) The morepersonalized attention the respondent perceives, the higher the response rate will be.
The Items
The items are, of course, the heart of the survey instrument, but writing thequestionnaire items surely is the most tedious aspect of survey design. It also is the mostimportant. One begins with the objectives defined in step 1 and attempts to translatethem into specific questions. Often, one can receive much guidance from the efforts ofothers, because the topic to be examined probably has been studied before. One oftencan borrow items appropriate to fairly specific needs from well-developed researchquestionnaires and use them with appropriate modifications. In many cases, one mustobtain written permission from the author of the source instrument. Obviously, one mustbe careful to maintain professional ethics in the use of questionnaires and questionnaireitems authored by others.
There are a few rules about writing questionnaire items. First, each item must askonly one question and must be unambiguous and specific. It is easy to write double- andtriple-barreled items such as “To what extent does your supervisor give subordinatesresponsible or interesting work?” There are two separate items to be considered here:“responsible” work and “interesting” work. Another example is “To what extent aregroup members participating and involved?” In this example, “participating” wouldrefer to the amount of talking, and “involved” would be an interpretation ofparticipation. It is extremely important to mention only one dimension per item (or dealwith only one topic per question).

The Pfeiffer Library Volume 22, 2nd Edition. Copyright © 1998 Jossey-Bass/Pfeiffer ❚❘ 61
Another of the most frequent errors in constructing items is to mix the scale (therating or frequency) with the item, e.g., “Are participants highly involved?” rather than“How involved are participants?” (Hanson, 1981). Specificity leads to clarity, andclarity of the item is extremely important in order that all respondents can make choicesfrom the same frame of reference.
Thirdly, questions should be worded so as to avoid social-desirability bias. That is,most people would agree or strongly agree with the statement “I support the values onwhich our society is based” and would disagree with the statement “Everyone should tryto get as much as he or she can when selling a commodity.” The socially desirableresponses to these and questions such as “To what degree do you do a good job atwork?” are fairly obvious; there is little point in asking them. If the topic is important,items must be developed so that the “right” response is not obvious. For example, the“get as much as you can” item could be stated in this way: “To what extent do you agreethat profits should be maximized?” Another question might be: “Compared to othersdoing similar work, rate the quality of your own output.” A scale of “better than anyoneelse,” “better than most,” “as good as most,” “not as good as most,” and “not as good asanyone else” might be used. The bias of social desirability also can be avoided byavoiding “loaded” words. When objective terminology is used, people usually willrespond quite honestly, even when the response is not so favorable to them personally.
The fourth rule is: avoid threatening the respondent. If one were trying to measurethe feelings of auto workers about job security, an agree-disagree item such as “lessproductive workers should be laid off first” probably would threaten many people. Aperson who is threatened frequently will refuse to complete the survey. The threat in anitem may not always be obvious; threat often is a matter of circumstance, such as thefinancial stability of an organization or the economy in general. When an implicit threatis inevitable, reassurance of anonymity often helps.
Good item construction depends on common-sense writing skills, i.e., avoid leadingquestions; try to phrase items objectively; use common rather than obscure terms; andstrive for brevity and clarity. Again, only practice can provide the skills needed to writeeffective questionnaire items.
The Scales
Scaling need not be overly technical. As has been discussed before, the most commonlyused scale is the Likert scale, with five or seven multiple-choice alternatives such as “toa very great extent . . . to a moderate extent.” Other dimensions that commonly are usedinclude “agree-disagree,” “how much,” “how often” (frequently-infrequently, never-always, once a day-once a year), “to what degree,” and “how important.” These simplescales generally make certain assumptions that render them equivalent to much moretechnically sophisticated scales.
There is no one best set of scale labels. “To what extent” and “agree-disagree”probably are the most used. When a questionnaire has more than twenty items, itgenerally is less boring for the respondent if more than one scale is used. When actual

The Pfeiffer Library Volume 22, 2nd Edition. Copyright © 1998 Jossey-Bass/Pfeiffer62 ❘❚
frequency of behavior is being measured, the “how often” or “never-always” sets aremost relevant. When personal values or the rewards one wants from work are beingexamined, the “how important” scale might make the most sense. Frequently, it ispossible to phrase one’s questions so as to use whichever scale labels one prefers.
It frequently is helpful to word items so that the answers can be graded on acontinuum rather than discretely. For example, a scale that measures degrees ofmanagerial control (high control, some control, little control, no control) results in acontinuum; whereas on an instrument that identifies sources of managerial control (fear,threats, punishment, etc.), the items must be graded discretely, i.e., individually. Acontinuum generally is indicated by the use of adjectives or adverbs (high-low, often-notoften, moderate-very much), and discrete items generally are nouns or verbs (reward,punishment, does, does not). It is important not to use discrete items as if they were acontinuum (Hanson, 1981).
Research shows that the “right” number of points on a scale usually is between fiveand nine. This is the comfortable range of discrimination for most people. Therefore, itusually is safest to use a seven-point scale, although a five-point scale does make thehandling of data easier. It is important to avoid restricting the range of responses byusing only two or three categories. The rest of this would be meaningless data obtainedat considerable cost.
The Codes
Finally, we come to the matter of coding responses. To prepare to analyze the data, onemust construct a code book. This usually is a copy of the questionnaire, marked up toindicate how each item is to be scored and how to deal with problem responses. Forexample, a response marked between 3 and 4 would be treated according to a generalrule, explicitly stated in the code book. Other typical concerns are failure to respond toan item and reversed items (those for which low scores are “very good” and high scoresare “bad”). The latter may be coded in reverse so as to be consistent when the data aretabulated. One must think carefully about how to score the returned questionnaires.
STEP 5: PRETEST THE INSTRUMENTNo matter how well developed the survey instrument is, there still will be at least minorproblems that must be identified and corrected. This is the function of the pretest. Asmall number of instruments are prepared as mockups; these may be typed instead ofprinted. Volunteers are recruited to respond to the items on the questionnaire as thoughthey were members of the sample population. In fact, some of these pretesters should bemembers of the population from which respondents are to be drawn. Immediately aftercompleting the instrument, each of these volunteers is interviewed, in order to identifyflaws or errors on the form. Even if the sample of volunteers is quite small, a pretest iscrucial. It is almost certain that some (although, unfortunately, not always all) errors willbe identified.

The Pfeiffer Library Volume 22, 2nd Edition. Copyright © 1998 Jossey-Bass/Pfeiffer ❚❘ 63
STEP 6: PREPARE THE FINAL DRAFTAfter the errors identified through pretesting are corrected; the problems are resolved;the typographical errors are corrected; and an attractive, clean, final copy is prepared forreproduction; then the instrument form must be checked carefully. From here on, errorsprobably will be too costly to remedy except by discarding some data, which also is acostly cure.
STEP 7: ADMINISTER THE INSTRUMENTIdeally, one would administer the instrument to everyone in the sample at the same time,perhaps in one large group meeting. Usually this is impossible. Even the next-bestsituation, having several group-administration sessions, is not always feasible. It may benecessary to distribute questionnaires to individual respondents who complete and returnthem either by hand, intra-company mail, or national mail. Although this can increaseprivacy and anonymity for respondents, it also usually leads to decreased return rates.Therefore, when such a voluntary return procedure is unavoidable, the surveyor must doeverything possible to boost the return rate. There are at least four ways in which thiscan be done.
First, the importance of the study must be emphasized (its intrinsic relevance, itspotential usefulness—to management, for example—and the possible benefits to therespondent). These factors should be emphasized in three ways: (a) in the cover letter;(b) in informal conversation when the questionnaire is being handed to the potentialrespondent; and (c) by explaining that some authority (e.g., management) supports thesurvey (as shown by management’s willingness to have it administered during worktime). Telling people that they should not fill out a questionnaire during work time is, bythe way, the same as saying that management thinks it is worthless and will ignore it.Most potential respondents then will ignore it too.
The second aspect to be emphasized is the confidentiality and privacy of individualresponses. Again, this should be stated in the cover letter and verbally. It often is wise toexplain that the person affected (e.g., management) will see only aggregate data such asaverages and percentages, not any person’s or work group’s data. If possible,questionnaires to be returned by mail should be sent to an address other than theorganization’s or interested party’s. If people return questionnaires at the work place, asealed box should be provided so that respondents can drop their completedquestionnaires into it. It should be specified verbally and on the questionnaire form thatno names or identifying marks are to be put on the questionnaires or response forms.
The third aspect of administering the instrument is to invest as much time and effortas possible in personal contact with the potential respondents, explaining the objectivesof the survey verbally and asking for and answering questions. Respondents should bepromised a summary of the results. Survey forms should be given directly to potentialrespondents, and they should be thanked for their participation. In short, everythingpossible should be done to maximize personal contact. Respondents should be asked

The Pfeiffer Library Volume 22, 2nd Edition. Copyright © 1998 Jossey-Bass/Pfeiffer64 ❘❚
when their responses can be expected, and an attempt should be made to obtain verbalcommitments to a specific time frame. These investments of time and energy will berepaid amply in terms of return rate.
Finally, the questionnaire instructions must be as clear as they possibly can be. Therespondents should be told whether they are to make choices, indicate rankings, circleanswers, etc., and how this is to be done. They should be told if they are to turn thepage. They should be reminded not to skip or omit any items. They should be told howto respond each time a new type of item, scale, or topic is used.
A deadline should be set for receipt of the responses, and this date should beincluded on the questionnaire and mentioned verbally to the respondents. The date givenshould be at least one week earlier than the actual deadline. Shortly before the stateddeadline, all respondents should be reminded of the date by means of a letter ormemorandum. An offer can be made to provide another copy of the questionnaire if thefirst was misplaced. Normally, one would not attempt more than two such reminders.
The actions and techniques described above are time consuming, but the morecarefully they are attended to, the better the response rate will be.
STEP 8: CODE THE RESPONSESThis is tedious work. Accounting ledgers make good tally sheets for raw data, and therealso are more costly forms designed for this purpose. Special forms are particularlyuseful when the data are to be transferred to computer disk or tape for computer analysis(which certainly is the easiest way to analyze data). As dull as it is, this step is veryimportant because minor errors can have serious impact. A few of the surveyquestionnaires always should be checked at random to see if there are errors in coding.
STEP 9: TABULATE THE RESULTSThe aim here is to present the data so that people can understand and makeinterpretations from the information generated. Sample tabulations of responses for eachitem, using percentages (not just raw numbers), generally will suffice. This can beindicated on a “doctored” copy of the questionnaire, with percentages filled in where thecheck marks would go. Many results may be ignored later, but it is important to beginby tabulating everything. An example of a tabulation of respondents’ job satisfactionfollows.
Sample Tabulation of Job Satisfaction
Job Satisfaction % (N)
Completely Very Mostly Slightly Not at all Total
61(82) 18(25) 10(13) 7(10) 4(5) 100(135)

The Pfeiffer Library Volume 22, 2nd Edition. Copyright © 1998 Jossey-Bass/Pfeiffer ❚❘ 65
The next step is cross-tabulation for items that have some important relation to oneanother. For example, to determine whether older workers are less satisfied thanyounger workers, one would cross-tabulate age by satisfaction, as is shown in the secondexample.
Sample Cross-Tabulation of Worker Satisfaction
Age Worker Satisfaction % (N)
Completely Very Mostly Slightly Not at all Total
Under 25 75(15) 20(4) 5(1) 0(0) 0(0) 100 (20)25-30 70(24) 15(5) 10(4) 5(2) 0(0) 100 (35)31-40 60(24) 15(6) 10(4) 10(4) 5(2) 100 (40)41-50 50(15) 25(8) 10(3) 10(3) 5(1) 100 (30)
Over 50 40(4) 20(2) 10(1) 10(1) 20(2) 100 (10)
Overall 61(82) 18(25) 10(13) 7(10) 4(5) 100 (135)
The items in parentheses are the numbers of respondents of given ages who gavespecific satisfaction-level responses. For example, of the forty people between thirty-oneand forty years of age, 60 percent (or twenty-four) were completely satisfied. Of the tenpeople over fifty in this sample, 40 percent (or four people) were completely satisfied.One may not know if a trend such as this is statistically significant, but might decidelater that it is worth testing.
Obviously, there must be a reason for setting up cross-tabulations. If the data are tobe analyzed by computer, it is quick and inexpensive to cross-tabulate everything byeverything, but then one must wade through mounds of printout. So even when thecalculations are easy, it is worth spending some time to decide what, if any, variablesshould be cross-tabulated.
Tabulating results is another important step (and can be tedious unless one uses acomputer). It leads directly to data interpretation, the final output of all survey work.
STEP 10: PREPARE THE REPORTBefore preparing a final report, one must pull together all thoughts about the survey in abrief overview or summary paper. The aim is to organize these ideas and the data, not tocommunicate results. Based on this summary paper, the needs of the organization, andthe circumstances of the survey consultation, one then can proceed with a formal, finalreport.
The summary paper should begin with about a page of description, highlightingwhat the data show and referring to the tables. It is a good idea to review the data andthe tables several times and then to review them once more, this time looking forimportant omissions. Then a second, more detailed, summary is written. This secondsummary might be just a minor revision of the first, but by approaching the task this way

The Pfeiffer Library Volume 22, 2nd Edition. Copyright © 1998 Jossey-Bass/Pfeiffer66 ❘❚
one allows as much of a chance as possible to pull it all together without missingimportant findings or interpretations.
The final report will be based on the second summary, but should be tailored to thecircumstances. Some consultants believe that this means that if management is quiteuninterested in doing anything with the results of the survey and would be threatened bytheir negative tone, it is wise to prepare a brief, bland report that plays down thenegative aspects. Our opinion is that there should be a clear contract at the beginning,with both consultant and client agreeing on the purpose and use of the survey. Thus,management agrees at the beginning that it wants the data. If this does not seem to bethe case, it would be a sham (and probably a mistake) to conduct the survey in the firstplace.
The exact form of the final report will depend on how it will be used and on othercircumstances. If the data will be used to work on problems, with small groups involvedat all levels, the report should avoid inferences and conclusions; should contain datagrouped by unit, department, or division; and should be clear to a nonexpert. If topmanagers will work on the data to derive action plans, then more summary, charts, andrecommendations usually are desirable. The guidelines for preparing the final report areto consider who will use it and to consider the purpose for which it will be used. Thesurveyor should prepare a report that (a) will not, in itself, do harm to the people ororganization studied, (b) is targeted to the users, and (c) is an appropriately usable form.
CONCLUSIONThis has, of necessity, been an abbreviated discussion of the ten steps in planning andconducting paper-and-pencil surveys of groups and organizations. To cover all thepractical details involved in this endeavor would take a longer book. Moreover, theskills needed to effectively design and conduct organizational surveys cannot be learnedby reading but can be developed only by practice, correction, and more practice.
The ten-step model is as follows:
Step 1: Define the objectives.Step 2: Identify the population to be studied.Step 3: Select the survey sample.Step 4: Construct the instrument.Step 5: Pretest the instrument.Step 6: Prepare the final draft.Step 7: Administer the instrument.Step 8: Code the responses.Step 9: Tabulate the results.Step 10: Prepare the report.

The Pfeiffer Library Volume 22, 2nd Edition. Copyright © 1998 Jossey-Bass/Pfeiffer ❚❘ 67
❚❘ RESEARCH USES OF INSTRUMENTATION INHUMAN RESOURCE DEVELOPMENT
The parts of this volume have progressed from the general to the specific, fromconsiderations germane to the use of all instruments to specific applications of thetechnology. Even more specific than the use of instrumentation in organizations is theuse of instrumentation for research purposes.
The use of instruments in research appears to be deceptively easy, i.e., all one has todo is have people fill out an instrument and see if their scores relate to some group orindividual criterion. The deceptiveness lies in the number of problems that can arise inusing instruments in research. However, one can anticipate many of the factors that cancause failure in finding significant differences or that make results open to severaldifferent explanations. The major problem areas are reliability, validity, pretesting andposttesting, transparency and social desirability, management, and human concerns.
THE RELIABILITY PROBLEMThe term “reliability” can strike terror in the hearts of users of instruments. Many peopleare not sure what the word means and, therefore, are not sure whether or not theirinstrument has a sufficient amount of it.
Test reliability means that the instrument is measuring something other than chanceresponses, guesses, or some characteristic that comes and goes. One way in which this isdemonstrated is by showing that people respond in the same way to an instrument thesecond time as they did the first time (usually after an interval of about two weeks). Thisis called test-retest reliability. A second way of demonstrating reliability is to examinethe extent to which responses to two halves of an instrument or two different forms of aninstrument are correlated, i.e., measuring the same thing. High correlations indicate thatall the individual questions relate to the same general attitude and that some actualcharacteristics are being measured.
The importance of reliability is that it determines the error of measurement. Thehigher the error of measurement, the less sure one can be that a respondent’s score isclose to the score that the person would obtain if he or she took a parallel form of theinstrument or took the same instrument again after a period of time.
How much reliability is enough? This question is more important for a trainer thanit is for a researcher, because a trainer may be trying to draw conclusions and posealternatives based on scores. If an instrument is unreliable and the trainer does not knowit, it is possible that he or she may offer an erroneous alternative. A researcher, on theother hand, has a built-in check against conclusions based on unreliable instruments:

The Pfeiffer Library Volume 22, 2nd Edition. Copyright © 1998 Jossey-Bass/Pfeiffer68 ❘❚
statistics. Statistics allow comparison of the amount of change in a person’s responseswith the amount of random change in scores or comparison of the difference betweentwo or more groups of people with the variation in scores within the group. Unreliableinstruments show an excess of random variation in scores. The greater the error in theinstrument, the less likely it is that the differences between average group scores willappear statistically significant (so large a difference between groups that it is unlikely tohave occurred by chance). If one is using an unreliable instrument, one is not likely tofind a difference between groups or conditions that is greater than the large error ofmeasurement, and one is not likely to uncover significant findings from using theinstrument. The figure that follows illustrates this point.
Nonsignificant results do not permit one to say that “there is a difference betweenthe groups” or “there was no change.” One can only say that one is not able to

The Pfeiffer Library Volume 22, 2nd Edition. Copyright © 1998 Jossey-Bass/Pfeiffer ❚❘ 69
demonstrate that there was a difference. An unreliable instrument is not likely to lead totrouble, per se, but the user will be frustrated by his or her inability to draw anyconclusions about what has been studied.
Unreliable instruments lead to conservative, nonrisk errors. This is not to say thatsuch conservative errors are not something to be concerned about. Science proceeds bythe gradual accumulation of confidence in or disenchantment with a theory, procedure,or test. If people test a valid theory or procedure with an unreliable instrument and findno support for it, they have done a disservice to the theory, the theorist, and the quest for“truth.” They also have wasted their own time and effort.
THE VALIDITY PROBLEMThe validity of an instrument is the degree to which it measures what the publisher andauthor say it measures. An instrument can be reliable yet invalid; that is, it may bemeasuring an undetermined entity consistently. On the other hand, a very unreliableinstrument cannot be valid because it is not measuring much of anything but randomresponses and guesses.
One way in which validity usually is demonstrated is by showing that an instrumentcorrelates positively with another instrument that is measuring the same generalcharacteristic (convergent validity). A high positive correlation (+.50 or better) meansthat high scores on instrument A were obtained by people who received high scores oninstrument B, and low scores on instrument A were obtained by people who receivedlow scores on instrument B.
Another method used to determine the validity of an instrument is to show whetherpeople who should score in a predicted way on a certain characteristic do. For example,William F. Buckley, Jr., should score nearer the conservative end of a liberal-conservative scale than should Senator Edward Kennedy.
There are other ways to validate instruments (see the discussions of validity andreliability under “Technical Considerations” earlier in this volume), but the twoapproaches above should provide an indication of how it is done.
Even if an instrument has substantial reliability and validity coefficients as reportedin its manual or in published research, one cannot proceed with the assurance that it is a“good” instrument without first examining it very carefully (cutting through the labels,psychological jargon, and general descriptions) to discover exactly what the instrumentmeasures. This can be done as follows:
1. Examine the questions in the instrument and ask, “Do these questions reallyreflect what the author says the instrument is measuring?” If not, what do theymeasure? If so, do they measure other characteristics as well?
2. Examine the correlations with other instruments and ask, “What are all thefactors that could cause a person who scores high on this instrument to scorehigh on the other instrument?”

The Pfeiffer Library Volume 22, 2nd Edition. Copyright © 1998 Jossey-Bass/Pfeiffer70 ❘❚
3. Look at the differences between norm groups (e.g. men versus women, collegestudents versus construction workers) and ask, “In how many other ways dothese groups differ?” Could this instrument be measuring one (or more) of thesefactors instead of, or in addition to, what it purports to measure?
4. Complete the instrument and think about your own experience with it beforedeciding whether it is a valid measure of what it claims to be.
The most serious problem with validity is the use of good instruments to measurewhat they have not claimed to measure. For example: A researcher wants to investigatethe effect of loving attention from members of the opposite sex on individuals’perceptions of their own sexual attractiveness. He cannot locate a measure of perceivedsexual attractiveness, so he uses a previously validated measure of self-esteem.Although the instrument has some questions relevant to sexual attractiveness, most ofthem measure other aspects of self-esteem. He finds that his experimental situation hadno significant effect on the scores he obtained. He did not get results because theinstrument was not valid as a measure of perceived sexual attractiveness. In this case, itprobably would have been preferable for the researcher to develop his own instrumentwith questions that related exactly to what he was expecting to measure. If he had foundsignificant results, he might have had some confidence that he had tested thecharacteristic in which he was interested. Even if he had obtained significant results withthe self-esteem scale, he would have been faced with the fact that he had not tested hispredictions in a valid way.
Even if an instrument is reliable and valid, if it does not measure the trait that isbeing researched, it is almost useless. A compromise would be to use two instrumentsthat come as close as possible to measuring what is desired and then adding one’s owninstrument to the research. It is a good idea to remember that the majority of theory-testing articles published in social psychology use only one—or, at the most, three—questions to measure the effect obtained in the experiment. The results are obtainedfrom strong, experimental manipulations, and the few questions are aimed exactly at theeffect that is expected.
PRETEST AND POSTTEST PROBLEMSOne of the most useful ways to do research from both a common sense and a statisticalviewpoint is to use a pretest and posttest design. The logical way to measure change is toevaluate a group of people on a characteristic prior to an experience and then to evaluatethem again on that characteristic after the experience that was supposed to change them.If the scores are the same or close enough that error of measurement could account forthe difference, then the people did not change. If the group average shifted significantlyin the expected direction between the first evaluation and the second, then they didchange. Using a pretest-posttest design makes more intuitive sense than using a“posttest-only” approach in which one does not measure the experimental group initiallybut compares their scores at the end of an experience with the scores of a group that did

The Pfeiffer Library Volume 22, 2nd Edition. Copyright © 1998 Jossey-Bass/Pfeiffer ❚❘ 71
not go through the experience. No matter what the outcomes are, it is often hard toconvince others, or even oneself, that the two groups were the same except for theexperience.
The statistical advantage of the pretest-posttest approach is that it allows theresearcher to use a form of analysis that ignores differences between people andmeasures only how much change occurs within people. Thus, a smaller change in thegroup can be a statistically significant difference. With the posttest-only approach,however, differences between members of the two separate groups would be a primeconcern, so a larger change might have to occur in order to be statistically significant.
One argument against a pre-post approach is that participants may remember howthey responded the first time. This may make their responses the second time open toconscious comparison by them. A second problem is that completing the instrumentbefore the experience may sensitize them to how they are expected to change, and theymay simulate change rather than actually change as a result of the experience. Onesolution is to “bury” the research question(s) in a larger questionnaire given before theexperience. In this way, participants respond to so much material, they are less likely toremember when they complete the questionnaire the second time how they filled out anyspecific question the first time. They are also unaware of the “important” parts of thequestionnaire until the end of the experience. A second solution is to use a line scale tomeasure each participant’s attitude or characterization of himself or herself. Therespondent draws a slash along a line that has few “anchoring” terms or descriptions(three at most, both ends and the middle). For example:
Right now I am feeling:
High Anxiety, Usual Anxiety Good,Heavy Concern or Concern Very Relaxed
A variation on this approach would be to use a line-response format (e.g.: HighAnxiety ______________ Very Relaxed) in place of the usual five-category responseformat after a number of statements. However, this format poses problems in calibrationbecause the respondent may not mark slashes on the scale consistently (equally far fromthe anchor for each increment) from item to item. Continued recalibration against thelast mark, rather than against the original anchor, is necessary to assure accuratemeasurement.
Another technique is to divide an instrument into two parts, administering the firstpart to half the group and the second part to the other half of the group. After theexperience, each half of the group takes the part of the instrument that it did not take thefirst time. Group scores for the pretest and, later, the posttest equal the sum of the scoresacross the two halves.
Another problem with the pretest-posttest format that may be endemic to trainingsettings is the commitment to providing “learning experiences” and to giving people

The Pfeiffer Library Volume 22, 2nd Edition. Copyright © 1998 Jossey-Bass/Pfeiffer72 ❘❚
feedback about themselves. There is social pressure to have people score themselves andinterpret their score patterns. If that is done, they are sensitized to the dimensions beingassessed and may modify their behaviors in ways they would not have had they nottaken the instrument. Even if a person does not change as a result of taking theinstrument and obtaining feedback from it, the others in the group may change becauseof the instrument, thus presenting the individual with a group experience that is differentfrom what it would have been if the instrument had not been administered.
In doing research connected with a training event, there is a conflict between givingparticipants useful feedback to help them to set personal agendas for the workshop andwithholding all instrument data from them so that they will not be affected byknowledge of their scores. One control group is needed to discover if pretestinggenerates behavior or reactions that differ from the behavior and reactions of peoplewho did not take a pretest. Another possible control would be to administer the pretest toa group and not give the feedback to the participants. The differences on the posttestbetween the experimental group (scored and discussed pretest scores), the first controlgroup (no feedback from pretest), and the second control group (no pretest) will tellwhether taking a pretest causes changes in posttest responses and whether taking apretest and discussing one’s own scores causes even greater changes.
TRANSPARENCY/SOCIAL DESIRABILITY PROBLEMSInstruments vary in terms of how obvious their intent is. Some of them measure onevariable, and the respondents are virtually certain that they know what the variable is bythe time they read the fifth statement. Other instruments measure twelve or moredifferent characteristics; these sometimes contain distractors—or checks—such as “Ibreathe air.” The respondent has so many plausible guesses about what the questionnaireis measuring that (theoretically) he or she stops trying to figure it out and startsresponding to each item at face value.
It is important to remember that transparency is not necessarily problematic. Itcauses trouble primarily when the instrument is being used to evaluate people(particularly when they are experiencing “evaluation apprehension”) or when the way inwhich it is being used lets the respondent decide whether or not he or she wants to“help” the researcher. However, when respondents are filling out an instrument for theirown use, transparency becomes more of an annoyance than a real difficulty. It is anannoyance because the respondents are trying to remember how they have reacted toeach situation described or how they feel about some statement. Their awareness thatthey can move their scores up or down some obvious dimension may be a temptation.This becomes a distraction because they may then try too hard to avoid “cheating,”thereby depressing their scores artificially.
It has been found that when people are put in a situation that arouses evaluationapprehension, they attempt to present themselves in ways that will make them appearmore “socially desirable.” If the researcher suspects that the situation in which the

The Pfeiffer Library Volume 22, 2nd Edition. Copyright © 1998 Jossey-Bass/Pfeiffer ❚❘ 73
instrument is being used may so strongly motivate some respondents to appear healthy,competent, tolerant, etc., that they distort their answers in a socially desirable direction,the researcher should take steps to make it difficult for them to distort or should“correct” for the distortion in computing results.
There are a number of ways in which this can be done. First, one can bury the realintent of the instrument among a number of distractor questions. However, if thequestions in which the researcher is interested have a “look good” answer, therespondents will still distort. In this case, the questions may have to be rewritten. Thesecond approach is to structure the questions so that there is no obvious “healthy”response. For example, a question might have a less guarded response if it is couched ingeneral, rather than personal, terms. A third way of minimizing distortion is to askrespondents to check the statements that would make them “look good” if they agreedwith them. Then have them check the statements that would make them “look good” ifthey disagreed with them. After examining the statements that received a lot of checks,the researcher could either rewrite the instrument (perhaps reversing the wording ofsome statements) so that a high (or low) score could not be obtained by giving “lookgood” responses or the researcher could develop a social desirability key. This keywould include all the “look good” responses. A person would receive a score on the keywhenever he or she gave a “look good” response. If a respondent were to obtain a highscore (in the upper 10 to 15 percent of respondents) on social desirability, the researchermight wish to exclude that person from the analysis because there would be a goodchance that the person was more concerned with looking good than with being honest.
MANAGEMENT PROBLEMSA major concern in doing research in training settings is the effect of administrativetiming on participant responses. Timing of measurement phases becomes importantbecause participants often are at high emotional levels at the beginning and end of aworkshop.
Using Pretests
The first day or first few hours of a workshop usually are marked by feelings of anxietyand general excitement. In many ways, the opening hour of the workshop is a poor timeto administer a questionnaire. Often it is the facilitator’s only opportunity to dopretesting, however, so he or she must live with the problematic elements of this timing.To help alleviate some concern, the facilitator can reassure the participants that they willreceive as much feedback about their scores as possible and that their scores, althoughnot anonymous, will be kept confidential.
One way to eliminate the difficulties involved in first-day administration ofinstruments is to mail the pretests to the participants a week or two before the trainingexperience begins. The difficulty with this approach is that there are likely to be a fewpeople who sign up for the workshop after the questionnaires have been mailed, a few

The Pfeiffer Library Volume 22, 2nd Edition. Copyright © 1998 Jossey-Bass/Pfeiffer74 ❘❚
who do not receive the questionnaires, and a few more who leave their questionnaires athome.
A second way to avoid measuring at the height of “opening” tension is to wait toadminister the pretest until after a session or two has been conducted. The participantswill have had an opportunity to become familiar with the training conditions and to puttheir irrational fears to rest; however, they also are somewhat different from the waythey were before the first one or two sessions. As with many of the issues discussed inthis volume, the user is faced with compensating, counter-balancing factors and mustchoose those alternatives that he or she considers most relevant to the particular situationand those most important to the intent of the research design.
Using Posttests
Just as the beginning of a training experience has its unique set of problems, so does theclosing carry its special concerns. At the end of a personal-interaction event, people tendto be feeling happy, sentimental, euphoric, or perhaps even mystical. They usually arenot in a mood to fill out a questionnaire. There is a legitimate question about the valueof their responses if they are forced to fill out a questionnaire at that time. One solutionis to give them the questionnaires and ask them to mail them back within three days. Thequestionnaires also can be mailed to them with the same instructions. The problem withthese solutions is that some people will neglect to return them. Gathering research datathrough a mailing process has its own inherent problems, most of them centering arounda human reluctance to interrupt personal priorities to respond to another person’spriorities when the other person is not present. Success in mailing questionnairesdepends on the amount of patience and energy one is willing to expend in order toobtain the research data.
HUMAN PROBLEMSAn underlying premise of HRD work is the assumption that people should be open andhonest with one another and that such behavior leads to the most productive outcomes oftraining. The tendency of researchers to avoid telling participants what they areattempting to accomplish by failing to give them feedback about their scores on pretestsand by not processing data during the experience violates this pervasive assumptionabout openness. Participant hostility and resentment is a common result of researcherstandoffishness. Hostile participants can produce invalid results. The researcher mustchoose between withholding feedback versus running the risk of participants knowing“too much,” between a clean research design versus a contaminated design, and betweenrisking nonvalidity through insignificant results versus invalidity through biased results.

The Pfeiffer Library Volume 22, 2nd Edition. Copyright © 1998 Jossey-Bass/Pfeiffer ❚❘ 75
A SAMPLE RESEARCH DESIGNWhen a researcher is concerned with studying the comparative outcomes of varioustraining designs, he or she also must be interested in training versus no training. Controlgroups (those whose members receive no training) are used to compare the effects ofexperimental conditions with the absence of treatment. An effort must be made to keepall groups equal except for the specific training interventions to be tested.
For example, let us assume that one wants to explore the differential effects of aworkshop that has a theory-centered design (a heavy focus on lecture material) and aworkshop that is based on the use of structured experiences. It is conceivable that neitherworkshop will be found to produce lasting, observable changes in the behavior of theparticipants, and this possibility must be taken into account in the research design.
One might take applications for a training experience and randomly assign eachparticipant to one of three groups:
1. Experimental Group 1: These people will participate in the workshop thatfocuses on theory.
2. Experimental Group 2: These applicants will attend the workshop built aroundstructured experiences.
3. Control Group 1: These applicants will be excluded from the workshopexperience. (As alternatives, they may be asked to wait until later to attend theworkshop or they may be brought together for informal discussions.)
Ideally, one would have thirty to forty people in each of the two experimental groupsand more in the control group. In addition, one may wish to establish other controlgroups, such as the following:
4. Control Group 2: Nonvolunteers, drawn from the same population from whichthe workshop applicants are drawn.
5. Control Group 3: A representative sample of people in general. (Sometimesrelevant data on these people can be found in manuals of instruments.)
One might use a variety of instruments to assess outcomes. These should beselected to measure variables directly related to the goals of the workshop. The scalescan be given on a pretest, posttest, and follow-up basis to determine which changes aretemporary and which are lasting. One also may discover “delayed reactions.” Data canbe collected from the participants themselves, from their associates, and from fellowparticipants and facilitators during the training.

The Pfeiffer Library Volume 22, 2nd Edition. Copyright © 1998 Jossey-Bass/Pfeiffer76 ❘❚
❚❘ EXPERIMENTAL STUDIES IN TRAINING
When an organization invests in equipment or materials, it generally takes steps toensure that the investment is prudent—that the product is worth the price. To this end,when the purchase of untried items is contemplated, many companies either conducttheir own analyses or contract for appropriate testing services. Curiously enough,however, many organizations buy or inaugurate expensive training programs or deviceswithout proof of their usefulness. Experimental studies can provide that proof.
It is not necessary for all training programs to be subjected to experimental analysis.Prior use by other organizations, together with sound evidence of effectiveness, may besufficient. However, all innovations, including new types of training equipment, need tohave been tested under such conditions that results can be considered applicable to thenew training situation. The greater the investment an organization plans to make inteaching its employees new skills, the more prudent it becomes to make an effort toascertain the usefulness of the training involved.
WHAT CONSTITUTES AN EXPERIMENTAL STUDYAn experiment can be contrasted to the mere collection of opinions from traineesregarding the usefulness of a training experience and their suggestions for improvement.Such subjective reports can be helpful both to the designers of training and to those whoimplement it, but an experiment requires far more effort than an opinion survey.
Much of what is known about training innovations of the recent past—programmedinstruction, the classroom communicator, and the computer, for example—comes fromcarefully executed experiments. Knowledge of the principles and techniques ofexperimentation helps in evaluating innovations that are being considered. The trainingadministrator who understands the strengths and limitations of investigative proceduresis in a better position to judge the claims of program vendors.
The crucial element in an experiment is control, that is, the elimination of allvariables or conditions that might affect the conclusion except those of primary interest.Every training experiment incorporates the following elements:
1. An “experimental” or “independent” variable;
2. A “dependent” variable that presumably reflects changes resulting from theindependent variable; and
3. One or more “control” variables that are ordinarily related to the dependentvariable.
From The Complete Book of Training: Theory, Principles, and Techniques (Chapter 7), by G. Douglas Mayo and Philip H. DuBois
(1987), San Diego, CA: Pfeiffer & Company. Used with the permission of the authors.

The Pfeiffer Library Volume 22, 2nd Edition. Copyright © 1998 Jossey-Bass/Pfeiffer ❚❘ 77
The main purpose of the experimental design is to eliminate or at least reduce the effectsof the control variables on the dependent variable. In other studies with differentdesigns, however, effects of control variables could be of great interest.
Because there may be more than one change brought about by training, anexperiment may explore several different effects. For example, an innovation resultingin an improvement in reading skill also may be responsible for improvement in otherareas of endeavor and in attitude toward work. In designing a study, one ordinarilyidentifies a single dependent variable as the target, but changes in other measurablevariables may be of interest.
Hypotheses
The first step in designing a study is to develop an hypothesis, which is a statement thatthere is a relationship between the independent variable, which is more or less managedby the experimenter, and a dependent variable, which is not manipulated by theexperimenter and which represents a goal of the training. Examples of independentvariables are as follows:
1. The presence or absence of a specified type of training;
2. One type of training versus another type;
3. Different degrees of the same type of training;
4. Intervals of time between training sessions or programs;
5. The use or lack of use of a particular training device;
6. A comparison of the usefulness of two or more such devices; and
7. The usefulness of feedback or other procedures that might be motivating.
For technical reasons, the hypothesis studied directly in an experiment is generallystated negatively as the “null” hypothesis, that is, “the experimental variable has noeffect on the dependent variable.” A null hypothesis is exact, and it can be refuted at astated level of probability. Statisticians appreciate both of these features. However,because the refutation of a null hypothesis gives evidence that the positively statedexperimental hypothesis is correct, we prefer to formulate positive hypotheses andcollect data that may support them.
The Identification of Dependent Variables
In identifying dependent variables, one might start by determining how the trainedemployees will enhance the organization and what new and useful skills will have beengained if the training is to be considered successful. These determinations would lead tothe identification of one or more dependent variables. In some cases identification ofdependent variables is simple: Workers are taught new skills in machine operation,equipment maintenance and repair, order processing, or record keeping. In any of thesesituations, the resulting increase in proficiency would be apparent. In other cases, as on a

The Pfeiffer Library Volume 22, 2nd Edition. Copyright © 1998 Jossey-Bass/Pfeiffer78 ❘❚
production line, little variation in skill can be tolerated; consequently, no proficiencyvariable exists other than a “go”/“no-go” dichotomy. Another dependent variable mightbe the time or the amount of training required to reach the standard.
One approach to the identification of dependent variables is to list the directobjectives of the training program, together with possible side benefits. Dependentvariables often are the same as the criteria of training effectiveness. Obviously, criteriaare specific to training content; what is central to one program may be tangential or notapplicable to another.
In the case of an organization that has introduced a new type of managerial trainingand is interested in determining the degree to which this training attains its objectives,the first task is to list measurable results, which might be the following:
1. Better internal communication;
2. Reduction of absenteeism, accidents, complaints, and disputes;
3. Increase in productivity and longevity of employees on the job; and
4. Improvement in employee morale and departmental esprit de corps.
These criteria are chiefly measures of the behavior of subordinates and reflect actions ofthe managers only indirectly. Furthermore, by the nature of their jobs, differentmanagers have charge of functions that differ widely in composition and mission. Oneshould not expect that the construction of an observational scale reflecting managerialperformance will be easy; it is likely to require skill and hard work. The effort, however,could be rewarded in better understanding of both a managerial-training program andthe role of supervisors in the success of a company.
Much easier to construct as a criterion is a test of managerial knowledge. Althoughsome instruments of this sort are available from commercial publishers, it is probablybetter to use a device that parallels the training program and represents achievement init. It can cover principles, practices, and the solution of managerial problems. Such adevice cannot stand on its own because verbal knowledge of management and the abilityto apply that knowledge are by no means identical. An investigation is necessary todetermine whether increase in managerial knowledge is actually related to increase inmanagerial skill, as judged by changes in the behavior of subordinates.
Experimental Group and Control Group
In many psychological experiments, two groups are used: the “experimental” group andthe “control” group. For both groups, all the “control” variables must be equivalent. Aswe discuss later, there are several procedures designed to make the two groupsequivalent at the beginning of the study.
It is important to remember that group membership in and of itself may constitutethe “experimental” variable. In a training study, the experimental group participates inor uses the innovation, while the control group is treated in the conventional fashion orreceives no training at all, depending on the hypothesis being investigated. Either way,

The Pfeiffer Library Volume 22, 2nd Edition. Copyright © 1998 Jossey-Bass/Pfeiffer ❚❘ 79
the independent variable may be thought of as dichotomous, with two arbitrary values: 1for the presence of the innovation and 0 for its absence.
Actually, there may be two or more experimental groups in the same study,representing different degrees or different kinds of experimental innovation as well astwo or more control groups, each representing absence of the experimental innovation.
The Four Requirements of a Research Design
Any research design must provide for the following elements:
1. Variation in the independent variable, normally through the existence andtreatment of at least one experimental group, together with nontreatment of atleast one equivalent control group;
2. Differential treatment of the experimental and control groups;
3. Elimination or at least reduction of the effects of all control variables by methodsto be discussed later, such as random assignment, use of the same group at twopoints in time, or matching; and
4. Measurement of the dependent variable in the two groups at the conclusion ofthe study.
The purpose of the entire procedure is to investigate whether or not there is adependable relationship between the independent and dependent variables. Sometimes,when an effect has been demonstrated, it is possible also to assess its strength andpractical importance.
KINDS OF EXPERIMENTS TO EVALUATE TRAININGThe design of an experiment is simply a detailed plan. Normally, it describes the reasonsthat the study is needed and the setting in which it will be conducted. This informationmay be followed by a description of possible approaches and why the selected approachwas chosen. Often, several sources of data will be included in the plan. It is importantthat the designer not attempt to substitute a large volume of low-quality data for data ofgood quality. No amount of poor-quality data will result in an adequate evaluation; itmay even prove to be misleading.
The design should include copies of the measuring instruments and informationconcerning their characteristics, such as validity and reliability. Any sampling procedureshould be described; if random sampling is not employed, the alternative should bejustified.
A plan for analysis should be included, and examples of the type of information thatwill be developed should be set forth. For example, the plan may state that if a certainresult is shown by the data, a particular conclusion can be drawn and a specified actionis indicated. It is advisable to prepare a number of such statements during the designphase. Not only do they apprise all concerned of what may be expected, but they

The Pfeiffer Library Volume 22, 2nd Edition. Copyright © 1998 Jossey-Bass/Pfeiffer80 ❘❚
sometimes point to correctable deficiencies in the study. This is a much better time toidentify design defects than after data have been collected and analyzed.
Random Assignment As a Control-Group Design
Random assignment of trainees to one or more experimental groups and to a controlgroup normally requires a pool of prospective trainees and control of their assignmentby the person or team responsible for evaluation. Obviously, there are a great manyinstances in which this requirement cannot be met; but when it can be met, thisprocedure has excellent potential for providing valid information. The term “random”has a special meaning in research and evaluation. Random assignment does not simplyconsist of designating the first, third, and fifth trainees (and so forth) who enroll in atraining program as members of an experimental group and the second, fourth, and sixth(and so forth) to a control group. Although assembling groups in this way mayapproximate the results of random assignment, it is better to assign each trainee anumber and then use a table of random numbers to designate half of the trainees asmembers of the experimental group and the remaining trainees as members of thecontrol group. When several experimental conditions are included in the design, thisprocedure requires only minor modification in order to assign trainees to more than oneexperimental group. Three examples of random assignment are described in thefollowing paragraphs.
Use of Posttest Only
After random assignment has been made to one or more experimental groups and to acontrol group, the training innovation is implemented without the administration of apretest. A pretest is not necessary because proper random assignment assumes that thegroups are equivalent. This assumption is accurate if the number of trainees is fairlylarge—fifty or more in each group. The appropriate test of statistical significance isbased on probability theory and takes into account chance differences.
Use of Pretest and Posttest
When this design is used, a pretest is given after random assignment of the trainees tothe experimental and control groups. The experimental group then participates in thetraining innovation. As in other designs, the control group may receive the regulartraining or may receive no training at all, depending on what question the evaluation isexpected to answer.
After the training, a posttest is given to both groups. The primary comparison isbetween the gain made by the experimental group and the gain (if any) made by thecontrol group. If the gain by the experimental group exceeds that of the control group bya statistically significant amount, the difference may be considered to be evidence of theeffectiveness of the training innovation. A simple extension of this design occurs when

The Pfeiffer Library Volume 22, 2nd Edition. Copyright © 1998 Jossey-Bass/Pfeiffer ❚❘ 81
more than one experimental program or condition is included in the design. Basiccomparisons and interpretations remain the same.
Use of a Matched Sample
In this design, trainees who have the same score or characteristic on one or more controlmeasures are paired. The closer the relationship of the score or characteristic to theposttest or other criterion measure, the more effective the matched-sample designbecomes. After the pairs have been formed, one member of each pair is assigned to theexperimental group and the other is assigned to the control group by a procedure thattends to avoid systematic bias, such as the use of a table of random numbers. From thispoint, either of the first two procedures described above may be used. Statisticalprocedures appropriate to the matched-sample design take into account thestrengthening of the design due to matching; the result is that smaller differencesbetween groups indicate greater statistical significance than otherwise would be thecase. Other, less-adequate designs that employ matching but do not employ randomassignment can be used when random assignment is impractical.
Limitations of Random Assignment
Despite its advantages, random assignment has certain limitations. As noted by Cookand Campbell (1979), random assignment does not completely ensure that theexperimental group and the control group will be equivalent prior to the training. Theeffectiveness of random assignment requires fairly large numbers. When the number oftrainees is small, there is less assurance that the experimental group and the controlgroup will be equal before the training begins and, hence, less assurance that a correctconclusion will be drawn from post-training differences. Tests of statistical significancereduce the probability of such an error by requiring a larger difference between theexperimental group and the control group when the number of trainees is small, but it isstill possible for the data to suggest an erroneous conclusion.
Although the minimum number of trainees required to conduct an adequateevaluation varies with circumstances, a good rule of thumb is to conduct an evaluationwith no fewer than thirty-five trainees in the experimental group and a similar number inthe control group. However, one should keep in mind that in cases in which a significantdifference is not found, numbers larger than this normally are necessary if one wants tobe able to infer that any difference of importance would have been shown by the data.
From another point of view, random assignment or any other control-group designmay create inequities in the way individual trainees are treated. Not only is thisundesirable from the standpoint of fairness, but individuals assigned to either the controlgroup or the experimental group may behave in an atypical way because of being soassigned, thus obscuring differences that otherwise would result. Examples of this occurwhen some members of the control group think that they are not receiving the besttraining available or when some members of the experimental group believe that theyare being manipulated or “treated like guinea pigs.” Sometimes it is possible to assign

The Pfeiffer Library Volume 22, 2nd Edition. Copyright © 1998 Jossey-Bass/Pfeiffer82 ❘❚
trainees to groups without their knowing that they are participating in an experiment.Obviously, this solves the problem of the effect; but it may raise ethical issues, asdiscussed in the code of ethics of the American Psychological Association (1982).
It is fair to conclude that random assignment involving a large number of traineestends to make pertinent characteristics of an experimental group and of thecorresponding control group initially equal; but it would be inaccurate to conclude thatrandom assignment completely equates all pertinent characteristics, especially thosehaving to do with human reaction. Even so, when practical considerations permit its use,an evaluation design involving random assignment to a control group and one or moreexperimental groups will usually prove superior to other designs in program evaluation.
Quasi-Experimental Designs for Program Evaluation
When it is not possible to assign trainees randomly to experimental and control groups,it still may be possible to collect worthwhile information through the use of quasi-experimental designs. Such designs are somewhat similar to the experimental designspreviously described, but conclusions from them tend to be more equivocal. Normally,the results obtained from quasi-experimental designs permit a greater number ofdifferent interpretations than are possible with carefully designed and executedexperiments.
A quasi-experimental design should not be thought of as an acceptable alternativeto an experimental design when control of conditions, including random assignment, ispossible. Campbell and Stanley (1963) describe a number of quasi-experimental designsand precautions that should be observed in interpreting the resulting data. Cook andCampbell (1979) further develop this topic with special emphasis on field settings.Three examples of quasi-experimental designs are as follows:
1. A design that uses a nonequivalent control group with pretest and posttest;
2. A time-series design; and
3. A regression-discontinuity design.
Nonequivalent Control Group with Pretest and Posttest
In this design, intact classes are assigned randomly to a control group and to one or moreexperimental conditions. The trainees as individuals are not randomly assigned to either(or any) of these classifications. Only after individuals have become members of groupsby usual assignment procedures are intact groups assigned randomly to differentconditions. For random assignment to have much effect, there should be, if possible, anumber of groups involved; but the basic procedure can be used with only one controlgroup and one experimental group.
The control group and the experimental group are given the same pretest andposttest. The only planned difference is that the experimental group participates in theinnovative form of training, while the control group participates in the old form of

The Pfeiffer Library Volume 22, 2nd Edition. Copyright © 1998 Jossey-Bass/Pfeiffer ❚❘ 83
training or no training at all, depending on the question that the study is expected toanswer.
As a rule, the statistical procedure known as the analysis of covariance is used inthe analysis of the data. This procedure seeks to compensate for differences between thepretest scores of the experimental group and those of the control group. In effect, theprocedure predicts posttest scores from pretest scores and indicates the probability thatthe difference between the predicted scores and the observed scores for the experimentalgroup and the control group could have occurred by chance. If the probability is low, itmay be possible to infer that the difference was the result of the experimental training.However, this statistical equating of groups does not necessarily compensate for initiallack of equivalence in the groups. Lord (1969) has pointed out some of the problemsinvolved.
Time-Series Design
As the name implies, the time-series design involves measuring the performance ofseveral groups both before and after the innovation is introduced. Thus, a series ofmeasures is established in which the change to be evaluated occurs near the middle ofthe series. One can readily see that this is a stronger design than simply comparing theperformance of the last group before the innovation was introduced with theperformance of the first group to participate in or use the innovation. The measurementof several groups before and several groups after the introduction of the innovationmakes it easier to detect an atypical group than would be the case if only two groupswere used.
This design lends itself to both graphical presentation and statistical analysis. Ifmost of the groups measured prior to introduction of the innovation have about the samelevel of performance, and most of the groups measured after the introduction have ahigher level of performance, this result suggests that the improvement may be due to theinnovation. On the other hand, if performance is about the same both before and afterthe introduction of the change, it suggests that the innovation is not superior to the oldform of training.
Regression-Discontinuity Design
The regression-discontinuity design is similar to the time-series design in that it involvesmeasurement of a number of groups and is amenable to both graphical presentation andstatistical analysis. However, it is used under different circumstances. The regression-discontinuity design is especially useful when virtually all applicants must be given thetraining for a certain job.
Let us consider an example in which an industrial organization is being encouragedto employ and train personnel whose aptitude level normally would be predictive offailure to complete the required training. A preliminary training program is devised toprepare the low-aptitude applicants for the regular training, and it is decided that theeffectiveness of this program should be evaluated. In addition, an aptitude test used by

The Pfeiffer Library Volume 22, 2nd Edition. Copyright © 1998 Jossey-Bass/Pfeiffer84 ❘❚
the organization is highly predictive of performance in the regular training; the score onthis test that is traditionally used as a cutoff to determine entrance into the trainingprogram is 66. Let us assume that there are at least ten applicants in each five-pointinterval of scores on this test from the 36-40 interval to the 96-100 interval. Thus, thereare prospective trainees in six 5-point intervals on the test below the conventional cutoffscore and in seven 5-point intervals above the cutoff score.
The preliminary program is conducted for the prospective trainees with aptitudescores below the cutoff score of 66, and on completion of the program these traineesparticipate in the regular training. The prospective trainees having aptitude scores of 66or above on the test also complete the regular training. It is then possible to plot themean score for each 5-point aptitude interval from 36-40 to 96-100 (on the horizontalaxis) against mean program grades earned by trainees in each aptitude interval (on thevertical axis).
If the preliminary program has been effective, there should be a “discontinuity”between the line connecting the 5-point intervals including the trainees who participatedin the preliminary program (the low-aptitude trainees) and the trainees who did notparticipate in the preliminary program (the high-aptitude trainees). In other words, anupward extension of the trend line for the trainees who participated in the preliminaryprogram should be higher than the trend line for the trainees who did not participate inthe preliminary program. If there is no discontinuity between the trend line of those whoparticipated and the trend line of those who did not, the data fail to support thecontention that the preliminary program was effective.
An illustration of this discontinuity is shown in the figure that follows. Line Aindicates the aptitude level dividing the trainees who participated in the preliminaryprogram from all other trainees. Line B shows grades made in the regular trainingprogram plotted against aptitude-test scores for the trainees who participated in thepreliminary program (low-aptitude trainees). Line C shows grades in the regular trainingprogram plotted against the aptitude-test scores for the trainees who did not participatein the preliminary program (high-aptitude trainees). The discontinuity between Line Band Line C suggests that the preliminary program was effective. Lines B and C may beplotted from mean grades made by the trainees in each interval on the aptitude test, orthey may be regression lines resulting from correlational analysis.

The Pfeiffer Library Volume 22, 2nd Edition. Copyright © 1998 Jossey-Bass/Pfeiffer ❚❘ 85
Hypothetical Situation Illustrating the Regression-Continuity Design
THE RELIABILITY AND VALIDITY OF DEPENDENT VARIABLES
Reliability
A dependent variable must have reliability. As indicated earlier, the reliability of ameasure is concerned with its stability and consistency. Thus, if a device does notprovide a similar assessment of individuals at different points in time (when nothing hasintervened to alter their performance), one cannot have much confidence in it. Similarly,consider a printed test that is made up of item pairs, one for each instructional objective;and let each pair consist of an a item and a b item, both measuring the same objective.If, when the test is given at the end of the training, the scores on the a items aresubstantially different from those on the b items, the test as a whole is not reliable.
In a training study, reliability is best defined as the consistency between two formsof a device designed to measure the dependent variable. Such consistency could beindicated by a substantial correlation (.55 or more) between the scores on the a itemsand the scores on the b items, provided that the two scores are added to constitute thetotal dependent variable.
If an objective instrument is being used as a criterion and it is possible to divide itinto two equivalent halves, it is possible to obtain an estimate of its reliability from dataobtained during the course of the study. If rab is the correlation between the a and b half

The Pfeiffer Library Volume 22, 2nd Edition. Copyright © 1998 Jossey-Bass/Pfeiffer86 ❘❚
scores, then the reliability of the whole can be estimated as 2rab/(1 + rab). For example, ifthe correlation between the two half tests is .55, then the reliability of the sum can beestimated as .70.
Low reliability is a signal that further development is indicated, perhaps with theassistance of a specialist in psychological measuring devices (a “psychometrician”).With multiple-choice items, distractor counts can lead to the replacement of decoys thatfail to attract responses; and decisions can be made about items that are too easy or toodifficult as measured by the proportion of correct answers. Modifications of theinstrument based on such item-analysis information can lead to improved reliability,which, in turn, can lead to higher validity.
All of this, however, applies only to achievement measures in programs that aretargeted to increase skills and that do not insist that all graduates successfully completeall aspects of the training, as is likely to be the case when safety is of paramountimportance. When safety is the primary concern, there is a special consideration withregard to reliability: If it can be determined that an instrument actually matches jobrequirements, reliability can be assumed.
Validity
A dependent variable also must have validity. Validity has to do with the degree towhich correct inferences can be drawn from the information provided by a measure. Forexample, if there is a high correlation between scores on an end-of-training instrumentand subsequent performance on the tasks that the training was designed to teach, onemay infer that the end-of-training instrument is valid. One also may infer that thetraining is effective in fostering the desired knowledge and skills. Of course, in order tomake these inferences, one must ensure that the trainees had not attained proficiencyprior to entering the training. There are two closely related (but not identical) varieties ofvalidity of interest to trainers: (a) content validity and (b) criterion-related validity.
Content Validity
Content validity has to do with the degree to which a measure represents the knowledgeand skills that a program undertakes to teach. When a program is constructed to achievespecified objectives, those objectives are normally derived from operationalrequirements identified by means of job-task analysis.
Content validity is the primary type of validity that is “built into” the training-development model. In devising an instrument that will possess content validity, oneoften bases the items directly on training objectives. It is not unusual for an item to beessentially the same as the corresponding objective, except that the format is that of atest item.
The implications of content validity for evaluation of training are clear-cut. If anend-of-training instrument has been demonstrated to have a high degree of contentvalidity and a particular group of trainees performs poorly on the instrument, thisoutcome indicates that something is wrong. It may be that the training for that particular

The Pfeiffer Library Volume 22, 2nd Edition. Copyright © 1998 Jossey-Bass/Pfeiffer ❚❘ 87
group was not up to par; it may be that the trainees who made up the group did not havethe requisite qualifications for, or interest in, the training; or there may be some otherexplanation. It becomes the task of the training manager to identify the source of theproblem and to correct it.
To a large extent, content validity is internal. In other words, the items that make upthe instrument are constructed to measure the training objectives. In this situation, thereis always the possibility that the person who wrote the items was not completelysuccessful in constructing items that adequately measured the objectives. This is one ofthe reasons that it is desirable to demonstrate that an instrument also possesses criterion-related validity.
Criterion-Related Validity
Criterion-related validity is external and exists whenever there is a definite relationshipbetween any type of instrument and performance on the job. In training research, it isimportant to study relationships between training success, however measured, andsubsequent work effectiveness. Lack of such a relationship throws doubt on theusefulness of the training. The criterion may be performance on a job sample, supervisorratings of the quality of work, the number of acceptable units produced, or othermeasures of how well an individual performs assigned tasks. Measurement of jobperformance should be a byproduct of the job-task analysis used in determiningoperational requirements and specific training objectives. Development of evaluationprocedures should be an integral part of planning a training-research project. Indiscussing training outcomes, it is convenient to assume that the dependent variable ismeasured in units and that it can be described with conventional statistics: the mean as ameasure of central tendency and the standard deviation as a measure of dispersion orvariability.
THE RECORD SYSTEMEssential in any scientific investigation is a good record system. All data need to beidentified as to the source, the nature and date of the observations, and the individualsinvolved. Identification should be sufficiently complete that a person who encountersthe records later without prior knowledge of the project can understand all entries. Ifinstruments have been used, they should be precisely identified. With subjectiveevaluations or ratings, methods and observers should be carefully stated.
It is important that all manual records be legible and more or less permanent. Whendata are entered into a computer bank, complete details should be available as to formatand how the data may be called up, not only for analyses that have already beendesigned but also for use in studies that may be conceived later. Modern computers areversatile and can summarize large masses of information very efficiently, but using themfor record keeping requires good planning. Published programs are extremely useful, butoccasionally new programming is necessary. Sometimes reports compiled by computer

The Pfeiffer Library Volume 22, 2nd Edition. Copyright © 1998 Jossey-Bass/Pfeiffer88 ❘❚
are more or less in final form, but data summarized by machine are often processedfurther by manual methods.
STATISTICAL SIGNIFICANCEIn our previous descriptions of experimental designs, we used the phrase “statisticalsignificance” several times. The term merits explanation.
Consider two groups that were equivalent at the beginning of a study but whenmeasured at the end of training have different means on the dependent variable, perhapsa performance measure of the skill acquired. Except in the rarest of instances, there willbe a difference in the means of two groups on any variable. In the case of a trainingstudy, the question is whether or not the difference is meaningful, that is, whether or notit is an actual reflection of the way in which the two groups performed.
On the basis of probability theory, mathematical statisticians have worked out thedistribution of the differences that would be found between pairs of means drawn atrandom from an unlimited population in which the differences between pairs of meansaverage zero. The distribution takes into account the number of cases and thedistribution of scores within each group.
When an observed difference between two means is statistically significant, itcannot be considered a chance occurrence. In general, the greater the number of casesinvolved in the comparison of the two means, the smaller the difference need be to beconsidered an event not governed by chance. Accordingly, with large numbers of cases,a very small difference can meet the test of significance. On the other hand, the size ofthe difference needed for significance increases as variability internal to the groupsincreases.
The appropriate method of determining significance is a technical matter thatdepends, in part, on whether or not the means are inherently related. If the two samplesare unmatched and come from independent sources, the means have no inherentrelationship and are treated by the procedures for uncorrelated means. If, on the otherhand, one is dealing with two matched samples or with the same group on two differentoccasions, the means have a built-in relationship that must be taken into considerationby using procedures for correlated means.
Because larger random samples are more stable than smaller samples, the differencebetween two means required for significance decreases as the samples become larger.
One-Sided and Two-Sided Tests
Another consideration is the contrast between “one-sided” and “two-sided” instrumentsof significance. If one is interested in any difference at all between the means of twogroups, a two-way or two-sided statistic is appropriate. Such would be the case veryrarely in training studies. Generally, training research is designed to evaluate aninnovation believed likely to be more effective than the approach that is currently in use.

The Pfeiffer Library Volume 22, 2nd Edition. Copyright © 1998 Jossey-Bass/Pfeiffer ❚❘ 89
When there is an experimental group using an innovation and a control group usinga conventional approach, the “null” hypothesis is that the two means on the dependentvariable (in the parent population represented by the sample) are identical. Theexperimental hypothesis is that the mean of the group participating in or using theinnovation is higher than the mean of the control group. To test whether the innovationis effective, one first inspects the means to determine whether the difference is in theexpected direction; if it is, one then applies a “one-sided t-test” of significance. If thedifference is not in the expected direction, the innovation is considered to be ineffective.
The difference is divided by the “standard error of the difference,” which is theestimated standard deviation of an unlimited number of pairs of means of same-sizedgroups drawn at random from an unlimited population in which the variability isapproximately the same as in the samples. The formula for the standard error of thedifference, its logical basis, and the details of its application in research situations aregiven in many texts on statistics, together with special procedures to be used whengroups are small (fewer than thirty members). A variation of the formula must be usedwhen the means are inherently related, as when the same group is measured before andafter training.
When a difference divided by its standard error is 1.645 or more, it is significant atthe .05 level. In other words, there is one chance in twenty (or less) that the difference isthe result of sampling; and there are at least nineteen chances in twenty that somethingother than chance has produced the difference. If the ratio of the difference to itsstandard error is 2.326 or more, significance is at the .01 level, meaning that there isonly one chance in one hundred (or less) that only sampling is operative.
It must be pointed out that a difference can be reliable and still not amount to muchin the real world. A small difference based on a large number of cases might bestatistically significant—perhaps at the .01 level—while a large difference betweensmall groups might not meet any statistical test of significance. Statistical significance isa necessary but not sufficient condition for a research finding to be consideredimportant. Instead, importance is dependent on two requirements:
1. The dependent variable must be important in the world of work; and
2. The gain ascribed to training must be large enough to have real value at work.
Relation of Statistical Instruments to Decision Making
A training innovation may yield a significantly higher mean in an experiment and yetnot be appropriate to introduce in preparing people for the actual work situation. If thestudy is based on large numbers of cases, a difference that may not mean very much inthe practical situation may be in the expected direction and statistically significant.Considerations beyond statistical significance include the cost effectiveness of theinnovation, public relations, acceptance by trainees, and availability of the resourcesneeded for the proposed change in the training program.

The Pfeiffer Library Volume 22, 2nd Edition. Copyright © 1998 Jossey-Bass/Pfeiffer90 ❘❚
The study itself usually provides only an incomplete basis for a decision. A crucialquestion is the effect of the obtained difference between the means in actual operations.One must consider whether or not the superiority of the experimentally trainedindividuals can be translated into reduction of training costs or greater effectiveness onthe job as indicated by increased quality or quantity of output. The decision regardingwhat to do about the innovation may be hard or easy to make, but it is important toremember that it rests in the hands of administrators who are paid to make decisions.The role of the investigators is to provide the facts.

The Pfeiffer Library Volume 22, 2nd Edition. Copyright © 1998 Jossey-Bass/Pfeiffer ❚❘ 91
❚❘ END PRODUCTS OF EVALUATIVE STUDIES
This chapter deals with the following issues regarding the reporting of results fromevaluative studies:
1. Answers to questions posed by the investigation;
2. The audience for the answers;
3. The way in which findings are to be presented; and
4. The actions that logically follow.
The alternative actions are as follows:
1. Confirmation of the present program as satisfactory;
2. Rejection of the present program in favor of an alternative; or
3. Changes in the present program as indicated by specific results.
Although the ultimate purpose of a organization-sponsored training program is theimprovement of the organization, intermediate considerations include the following:
1. Acceptability to trainees, an issue that is related to motivation;
2. Coverage of needed skills;
3. Identification of program elements that are redundant or superfluous;
4. Transferability of the skills developed during the training to work situations; and
5. The degree to which the results of the training endure over time.
With any evaluative study, the more specifically the questions posed have beenanswered, the more useful the results. In addition, the findings of such a studyoccasionally provide answers to questions that were not originally envisioned. Theprimary means of conducting an evaluation are through the use of experiments and theadministration of questionnaires or similar instruments.
EXPERIMENTSExperimental investigations, as discussed previously, have both advantages anddisadvantages over studies based on instruments such as questionnaires. The advantagesinclude the following:
From The Complete Book of Training: Theory, Principles, and Techniques (Chapter 8), by G. Douglas Mayo and Philip H. DuBois
(1987), San Diego, CA: Pfeiffer & Company. Used with the permission of the authors.

The Pfeiffer Library Volume 22, 2nd Edition. Copyright © 1998 Jossey-Bass/Pfeiffer92 ❘❚
1. Conclusions are based on objective results. In general, one can depend on thefindings.
2. Success on the job can be used as a criterion (dependent variable). Thissometimes makes it possible to estimate the dollar value of the training.
3. An experimental study often can be conducted without the subjects’ awareness.This eliminates a possible source of bias.
4. The independent, dependent, and control variables are all carefully defined.Subjects and experimental conditions are described. Accordingly, the area ofapplicability of the findings can be ascertained and the study can be replicated.
The experimental approach also presents several disadvantages:
1. The experimental variable typically has limited variability. Often there are onlytwo variations. Consequently, it may be difficult to pinpoint aspects that needemphasis or reduction.
2. It is difficult to estimate changes over time because each time interval requires anew set of measurements.
3. Attitudes and motivation can be assessed only indirectly or by means of aseparate set of measurements.
4. Experiments are costly in terms of the time required for planning andadministration. Some experiments also are expensive in terms of trainee timerequired.
INTERPRETING RESULTS OF EXPERIMENTSWhen a training experiment yields positive results, the benefits to the sponsoringorganization should be made clear through written reports and oral presentations tomanagement. Verbal descriptions, numerical findings, and charts reinforce one another.Emphasis should be on the usefulness of the results and the clarity of presentation. Thefact that audiences vary greatly in their ability to understand technical findings and toperceive applications should not obscure the requirement that the first objective inreporting a study is to present the big picture as clearly as possible and then fill in thedetails as the need for more information becomes apparent.
Consider the case in which a difference in a dependent variable clearly is not theresult of chance and is of considerable practical importance. For example, suppose thatan organization has been able to identify two groups of salespeople (thirty in eachgroup) who were judged to be approximately equivalent in sales experience, aptitude forselling, product knowledge, and assigned territory. Also assume that the organization’spractice has been to assign each newly appointed salesperson to a two-week programcovering detailed information about the product line, markets in which the organizationhas been successful, and suggestions from top producers. All of this is “conventionaltraining.” Without the knowledge of those not selected for “special training,” one of the

The Pfeiffer Library Volume 22, 2nd Edition. Copyright © 1998 Jossey-Bass/Pfeiffer ❚❘ 93
groups is given an additional one-week program in sales strategies and techniques,emphasizing analysis of clients’ psychological needs and ways of inducing action basedon knowledge of those needs. Then assume that in the six months after training, grosssales for the two groups were as shown in the table.Comparison of Gross Sales for Two Sales Groups
Comparison of Gross Sales for Two Sales Groups
Thousands of Dollars
Group Number Mean Standard Deviation
Experimental Group*
Control Group**
30
30
275
243
65
50
*Received both conventional and special training
**Received conventional training only
Further assume that when the study was designed, it was decided that a differencefavoring the experimental group would be considered conclusive if it were significant atthe .05 level. In terms of the usual one-sided t-test, this difference is significant at the.05 level (although not at the more rigorous .01 level).
In this example a simple bar chart is useful, showing the difference between themeans graphically (see figure).
Average Sales During the Six Months After Training
The line under the graph provides the scale for interpretation. Management will beinterested in the fact that the members of the experimental group averaged $32,000 more(approximately 13 percent more) in sales than the control group. Whether this meansthat the experimental training actually represents a gain in dollars is a matter to bestudied. The net profit on the $32,000-average increment must be compared with thetotal cost of the training, which may include tuition, living expenses, and travel for thetrainees as well as overhead costs. Another pertinent concern may be loss to theorganization resulting from the absence of the trainees from active selling.

The Pfeiffer Library Volume 22, 2nd Edition. Copyright © 1998 Jossey-Bass/Pfeiffer94 ❘❚
Still another matter to consider is the length of time needed by the organization torecover training costs. Some organizations may be willing to recover training costs overa period of years. However, assume that in this case the organization decided that asatisfactory program should pay off in six months. If gross organizational profit on itssales were 8 percent (that is, $2,560 on sales of $32,000) and the cost of training wereestimated at $2,200 per individual, this training would have shown a modest profit forthe organization.
In real-life situations, payoff needs careful study. Appropriate criteria that can betranslated into monetary terms must be sought. Sometimes a program can be shown tobe highly beneficial in monetary terms. But there are programs that may lead to nomonetary gain or even a loss.
PREPARING REPORTS ON RESULTS OF EXPERIMENTSAfter an experiment has been conducted and interpreted, two reports should be prepared:(a) a complete report for those who are fully aware of research procedures andterminology and (b) a summary for the managers who may not be interested in checkingthe details but who are in a position to use the information in making decisions. Byproviding all the specifics of the study, the complete report substantiates the summaryand can be consulted whenever clarification is needed.
The following outline is suggested for the complete report:
1. The general purpose of the investigation;
2. The specific hypotheses;
3. The subjects: who they were, how they were recruited for or assigned to thestudy, and their backgrounds (pertinent personal information, including priortraining and related experience);
4. Identification of experimental, dependent, and control variables and how theywere defined and measured;
5. The procedures: the instructions given to the administrators of the research, theinstructions to subjects, the instruments used, implementation, details about time,and the conditions under which the dependent variable(s) were measured;
6. Statistical analyses of the data: detailed findings and graphic presentations ifappropriate;
7. Interpretation of the statistical analyses; and
8. Conclusions and suggested applications.
The complete report should have the following characteristics:
1. The information presented should be such that at a later time an investigatorcould reproduce the study with essentially identical variables and method andwith a comparable group of subjects.

The Pfeiffer Library Volume 22, 2nd Edition. Copyright © 1998 Jossey-Bass/Pfeiffer ❚❘ 95
2. The information should be sufficiently detailed that it provides answers to almostall, if not all, questions that might be raised about what was done, the reasoningbehind what was done, and possible applications of the conclusions.
3. The format of the report should be such that all parts can be readilycomprehended by the intended audience. The presentation always includesverbal descriptions and often includes photographs, charts, graphs, and tables.
4. If there is a possibility that a different type of analysis would result in differentconclusions, the original data should be made available either in an appendix orby stated arrangement.
Preparing Bar Charts
The previous figure is a simple example of the result of a study reported in graphic form.The essential element of a bar chart is that the dependent variable is depicted in a linearfashion, with variation in length representing variation in amount. The effectiveness ofthe display depends largely on whether the dependent variable is important to those whoare reviewing the results. In sales training, the dependent variable might be number ofunits sold, gross value of the units, or net profits to the organization. In managerialtraining, the criteria might be increase in production, reduction of manufacturing time orcost, smoother internal operations, or increases in employee morale. All such dependentvariables lend themselves to presentation through the use of bar charts.
Criteria such as those listed in the preceding paragraph present practical andtheoretical difficulties. In evaluating sales training, for example, it may be impossible toassume that each salesperson has an equal opportunity to achieve sales measured on acommon scale. Products or services assigned for sale may vary widely; territories differ;and the supervision received may vary from one individual to another and may have adefinite effect on production. Probably the best ways to neutralize to some degree theeffect of extraneous variables on a criterion are to define and measure the criterioncarefully, to adjust it by statistical methods when feasible, and to use a substantialnumber of subjects.
In evaluating managerial training, the difficulties that one normally encounters withcriteria are compounded because, almost by definition, each managerial job is unique.The manager directs an essential, distinct portion of the total enterprise and, at least in aprogressive organization, is expected to improve ways of accomplishing objectives. Oneway of evaluating success in managerial training is to rely on the judgment of thetrainees’ superiors with regard to the degree that the training has improved jobperformance.
In some business and industrial operations, it is occasionally possible to identifysizable groups of individuals who have more or less identical assignments and for whoma defined criterion is appropriate. This simplifies the task of evaluating training. In othercases, reliance on the judgment of superiors is essential.

The Pfeiffer Library Volume 22, 2nd Edition. Copyright © 1998 Jossey-Bass/Pfeiffer96 ❘❚
FURTHER CONSIDERATION OF THE QUESTIONNAIRE METHODA second—and very powerful—way to evaluate training is to administer an instrumentto trainees either at the conclusion of the program or after an interval of time, whichpermits evaluation in relation to actual application at work. The use of questionnairesand other instruments as a basic method was discussed previously in this volume. Herethe emphasis is on using the results.
Questionnaires have a number of attractive features:
1. A wide range of topics can be covered.
2. Correctable training deficiencies often can be identified.
3. There is no limitation on the degree of specificity of the evaluation; either anassessment of the overall program or reactions to specific details can be elicited.
4. Trainees generally find questionnaires acceptable and readily cooperate incompleting them.
Questionnaire Requirements
In developing a questionnaire, one should address the following issues:
1. Is the language very clear?
2. Is all the information requested germane to the inquiry? (Only when the responsehas the possibility of being the basis for some sort of action should a question beincluded.)
3. When a multiple-choice format is used, do the suggested replies cover the rangeof appropriate answers? Are the different replies assigned to appropriate steps?
4. Is the length reasonable? Can the questionnaire be completed in a few minutes?
5. Will the questionnaire fulfill its purpose without making undue demands on therespondent? (Generally speaking, no information should be requested unless therespondent is likely to have it readily available.)
6. How will the questionnaire be accepted? (Even in a questionnaire that protectsthe respondent’s anonymity, some questions could be objectionable. Good tasteis important!)
The End-of-Training Questionnaire
An excellent time to administer an evaluative instrument is during the final session of aprogram. The group is likely to be intact, and sampling may be 100 percent. Details ofboth the program content and the training situation are clearly in mind. Simple steps canensure the respondents’ anonymity so that opinions are expressed freely. Because this isa good time for trainees to “have their say,” cooperation is likely to be excellent.

The Pfeiffer Library Volume 22, 2nd Edition. Copyright © 1998 Jossey-Bass/Pfeiffer ❚❘ 97
Good information can be obtained about:
1. The trainer and the impression that he or she makes (the degree to which thetrainer is perceived as hard working, informative, helpful, and successful increating a good learning environment);
2. Trainee acceptance of any special techniques or training aids introduced into theprogram;
3. Perception of the adequacy of the physical arrangements (space, freedom frominterruptions, heating, lighting, ventilation, furniture, audibility, and visibility);
4. The best feature of the program as evaluated by the trainees;
5. The least satisfactory aspect(s) of the program; and
6. Whether the program seems likely to result in a permanent gain in a desired skill.
When the trainees are employed by a particular organization and have participatedin an organization-sponsored program, two questions provide good overall evaluations:
1. Does the trainee consider the program a good investment of the organization’smoney?
2. Would the trainees recommend the program to other employees as a worthwhileinvestment of their time and effort?
In addition to the structured items, space should be provided in which the traineescan print comments or suggestions. Providing such an opportunity sometimes evokesreactions to topics that were not considered when the questionnaire was designed.
Information from the structured items of an end-of-training questionnaire is easy totabulate. (Comments are sometimes reported verbatim, but are more intelligible to thereader if grouped or summarized.) Most multiple-choice items present degrees ofresponse that lend themselves to display in a bar chart such as the one shown in thefigure that follows. When presenting such a chart, one can point out the impact of theresults by making a comment such as “Of the seventy-four respondents, sixty-nine or 93percent reported that they believed that their newly acquired skills would be at least‘somewhat useful’ when they returned to their jobs.”

The Pfeiffer Library Volume 22, 2nd Edition. Copyright © 1998 Jossey-Bass/Pfeiffer98 ❘❚
Question: How useful will the skills that you developed in this course be to you in your job?
Bar Chart for Responses to Multiple-Choice Item
A suggested format for a partial end-of-training questionnaire is shown in the nextfigure. In addition to the items provided in the figure, items should be constructed tocover other aspects of the program for which reactions would be useful. Some of theseitems might include ones about the trainer (whose name should be listed on thequestionnaire), the specific training aids or procedures that were used, the physicalfacilities (training rooms, living quarters, and so forth), meals, coffee breaks, and theschedule of the program.

The Pfeiffer Library Volume 22, 2nd Edition. Copyright © 1998 Jossey-Bass/Pfeiffer ❚❘ 99
End of Training Questionnaire 1
Instructions: The organizers of this program want your frank evaluation of its value and how it wasconducted. You need not write your name on this questionnaire; no attempt will be made to identify theresponses of any individual. It is hoped that your replies will be useful in improving future programs. Foreach multiple-choice item, write a check mark in the box next to the response that is most appropriatefor you. When comments are called for, please print.
1. I regard this program as:
o Very valuable for my work.
o Definitely useful for my work.
o Somewhat useful for my work.
o Of little or no use for my work.
Comments:
2. The instruction in this program was:
o Very interesting and highly effective.
o Fairly interesting and reasonably effective.
o Marginally satisfactory.
o Boring—should be improved.
Comments:
3. The best feature of this program was
4. The feature of this program that I found least satisfactory was
5. The investment made by my organization in my training in this program:
o In the long run will pay big dividends.
o Should be considered worthwhile.
o Is neither good nor bad.
o Should be considered a waste of money.
6. To someone in my situation, I would recommend this program:
o Enthusiastically.
o As very good.
o With reservations.
o As something to avoid.
1 The authors thank Drs. Robert E. Lefton and V. Ralph Buzzotta of Psychological Associates, Inc., in St. Louis, Missouri, for
permission to use this adaptation of their questionnaire.

The Pfeiffer Library Volume 22, 2nd Edition. Copyright © 1998 Jossey-Bass/Pfeiffer100 ❘❚
The Delayed Evaluation
An administrator of a training program may find it useful to administer an instrumentsome months after the program has been completed. Trainees with prior workexperience will have had time to determine whether their experiences in the programhave resulted in gains in work proficiency. How long an interval is a matter ofjudgment; it must be long enough so that a good estimate of the value of the skillsresulting from the training can be made and not so long that the details of the trainingexperience have been forgotten. Some investigators like an interval of six to twelvemonths.
An instrument used at this time can produce important information on coverage,both for trainees without prior experience on the job as well as for trainees withconsiderable job experience. The instrument can elicit comments on omissions in theprogram or areas that should have been covered or that should have had greateremphasis in order to be most useful.
With this type of instrument, the respondents can be asked specifically what theyare able to do better as a result of the training. Specific examples are exceedingly useful,and sometimes estimates of the monetary value to the organization can be obtained.
An advantage of the delayed instrument over the one administered during the finalsession of the program is that a lapse of time may moderate negative reactions. Anindividual who at the end of the program may have expressed annoyance with a trainerbecause of what seemed to be excessive demands may have come to realize that highstandards of trainee performance actually produce lasting gains.
The following figure presents a suggested format for the questionnaire to beadministered after experience on the job, including two questions that are applicable ifgoal setting is part of the program.
ORAL PRESENTATION OF RESULTS
Meeting with Managers
The results of training research—whether the findings are positive or negative—arereported to those who need to know how the study has turned out in order to use it as abasis for making decisions. In the business world, training research is supported bymanagement, which needs to know whether the particular program involved is meetingthe needs of the organization and can be considered a good investment.

The Pfeiffer Library Volume 22, 2nd Edition. Copyright © 1998 Jossey-Bass/Pfeiffer ❚❘ 101
Suggested Format for Questionnaire
To Be Administered Some Months After Training 2
Instructions: Sometime ago you participated in (give title and place of program). The organizers of thisprogram are interested in your present evaluation of the program and the degree to which it has beenhelpful to you in your work. Please print all comments.
1. Read the four responses listed below and check the box next to the response that best indicates howuseful the program turned out to be in terms of helping you in your work:
o Indispensable.
o Valuable but not indispensable.
o Somewhat useful.
o Of no value.
2. The most useful aspect was
3. The part that was least useful or least satisfactory was
4. During the training did you establish a goal to achieve at work? Check the appropriate box.
o Yes
o No
5. If you answered yes, what was the goal, how did you attempt to achieve it, and what were theresults?
6. If you achieved your goal satisfactorily, try to estimate the dollar value of your success to theorganization over a period of one year. __________
7. What suggestions do you have for improving this training?
8. List topics or areas that should have been included or emphasized more strongly so that the programwould have had greater value for you.
9. What topics might be dropped or given less emphasis?
2 The authors thank Drs. Robert E. Lefton and V. Ralph Buzzotta of Psychological Associates, Inc., St. Louis, Missouri, for permission
to use this adaptation of their questionnaire.

The Pfeiffer Library Volume 22, 2nd Edition. Copyright © 1998 Jossey-Bass/Pfeiffer102 ❘❚
Although a formal written report is often of considerable interest and constitutes apermanent record of the study, managers frequently request an oral presentation. Visualaids, such as charts that can be displayed on an easel or shown on a screen, are useful;but the great advantage of an oral presentation is the give-and-take involved. Theresearchers can take measures to ensure that the importance of the project and themeaning of the results are understood. The managers can take steps to verify theapplicability of the findings to the work situation. The managers probably know in ageneral way what has been happening, but the research staff should prepare thepresentation in sufficient detail that answers will be available for all questions that maycome up and that important findings will be clearly presented. Evidence includes resultsfrom any experimental study as well as summaries from instruments. The degree towhich trainees have found the program valuable is generally of interest to managers, asare reports of incidents that demonstrate the economic usefulness of the training.
During such a presentation, a discussion in which everyone participates is useful.Often the future of a program will be decided on the basis of the interaction of themanagers and the researchers. Answers to a number of questions need to be established:
1. Is the program effective in its assigned function?
2. Are there better options?
3. Are improvements needed? Are there portions of the program that should bemodified, dropped, or replaced? Is the coverage adequate?
4. As far as costs are concerned, is the training as efficient as can reasonably beexpected?
5. In terms of money invested, what is the dollar yield of the program?
These questions cannot be answered in a hurried atmosphere. Prudence requires thatall pertinent facts be taken into consideration and that a generally satisfactory approachbe adopted. Possible actions include the following:
1. Continuation of the present program with more evidence to be collected later;
2. Modification of the current program on the basis of available evidence;
3. Consideration of a radical change in the training program; and
4. Acceptance of the current program with no further study at the present time.
Meetings with Trainers and Training Designers
It is also useful to deliver an oral presentation to the training staff as well as to thedesigners of the program (if the trainers were not the designers). Although the outcomeof an experimental study would be of interest to both trainers and designers, findingsfrom instrumentation merit particular scrutiny because they cover topics such as thefollowing:
1. How the trainer or trainers were perceived during the program. Appraisal is onan individual basis, and sometimes corrective action is indicated.

The Pfeiffer Library Volume 22, 2nd Edition. Copyright © 1998 Jossey-Bass/Pfeiffer ❚❘ 103
2. Annoyances resulting from correctable conditions, such as poor lighting, pooraudibility, bad ventilation, improper heating or cooling, and interruptions.Although trainers should detect undesirable situations without the use of aninstrument, it often happens that such conditions are missed until reportedformally.
3. Acceptability of identified training aids and special training techniques.
4. Perceived redundancies and omissions in the program.
5. The degree of enthusiasm of the trainees, as evidenced by their expressedwillingness to recommend the training to others and their perception of theprogram as a good investment on the part of the sponsors.
The decisions that can be made in such meetings depend on how the program isorganized. Modifications by training designers are subject to review by the managers towhom they report, regardless of whether the designers are employees of the organizationor external contractors. Because trainers are directly involved in training operations,their recommendations are especially important; nevertheless, these recommendationsare subject to the approval of the trainers’ supervisors.
WRITTEN PRESENTATION OF RESULTS
A formal written report of a project has several uses:
1. It is a permanent record of what has been done and what has been discovered.
2. It generally includes recommendations for action.
3. It can be circulated to all individuals with an interest in the training of theparticular target group or the overall training program of the organization.
4. It serves to familiarize a wide audience with the usefulness of systematicresearch in training. This can lead to an expanded role of the research staff and toimprovement in operations.
Sometimes written reports are merely filed; but when constructiverecommendations seem likely to enhance operations, the research staff can often takesteps to encourage the implementation of these recommendations. It is important toperceive training research as merely one phase of improving ongoing operations.
PUBLICATION IN PROFESSIONAL JOURNALSOccasionally an evaluative study is reported in the professional literature. Other studies,some of which are just as well executed, are recorded only in organizational files. Thereare three categories of professional publications in which a report on the results of atraining investigation might be published:
1. A journal addressed to the managers in the industry;
2. A journal read by the growing group of full-time, professional trainers; and

The Pfeiffer Library Volume 22, 2nd Edition. Copyright © 1998 Jossey-Bass/Pfeiffer104 ❘❚
3. A journal in educational or industrial and organizational psychology.
There are reasons to publish as well as reasons not to publish. Certainly theprofessional worker in training evaluation obtains much of his or her knowledge frompublications. Thus, the worker has an obligation to share results with other professionalsso that the field can continue to grow. It is only through sharing that this can happen.
A first question to ask is whether the study can be written in such a fashion that itmakes a genuine contribution to knowledge. If the answer is yes, publication certainlyshould be considered.
Some organizations may believe that any discoveries resulting from sponsoredresearch should be considered confidential so as not to give an advantage to thecompetition. In most cases, this is not a valid argument because it would be almostimpossible to hide a real secret in the field of training. Any innovation is likely to beknown by a wide circle of people. What a research study uncovers is usually a new fieldof application, a somewhat different approach, or—occasionally—a new method.
Publication can result in recognition by colleagues in other organizations and mayencourage communication with them. It is an important means of furthering professionaldevelopment and, ultimately, of improving one’s own training program.
GRAPHICSBoth in written reports and in oral presentations, graphs and diagrams are often helpful.Recommendations regarding the preparation of graphic aids are as follows:
1. Because their purpose is to clarify, graphs should be simple and easy to read.
2. Graphs should focus on important information, but not too much informationshould be included in any single display.
3. In a training study, a graph is often designed to show the relationship between anindependent variable, such as the use or lack of use of a particular training aid,and a dependent variable, such as an achievement score or success on the job.Both variables should be clearly indicated. When the dependent variable is inunits, the scale should be shown.
4. The caption should be short and informative and should present the relationshipor distribution displayed as well as the source of the data. Somewhere in thediagram—in the caption or elsewhere—the number of trainees participating inthe study should be shown. When a measure of relationship, such as a correlationcoefficient, has been computed for a relationship that has been graphed, it isappropriate to show it.
5. Different colors or cross-hatching may be used to indicate the different groupsinvolved or the different training approaches that have been dealt with. In suchcases, a key must be provided.
As one is preparing the findings of a study for presentation, one should considerways in which graphs might be useful. Facts that can be expressed in percentages can be

The Pfeiffer Library Volume 22, 2nd Edition. Copyright © 1998 Jossey-Bass/Pfeiffer ❚❘ 105
graphed, either in bar-chart form or, when the percentages add up to 100 percent, as apie chart. Experimental studies of learning often yield a learning curve, in which theamount learned is in units on the vertical axis and trials or time on the horizontal axis. Itmay require creative thinking to develop a graph that successfully summarizes animportant finding.
Both graphs and descriptive statistics represent summaries of data. In all cases, anumerical organization of the information (often in terms of frequencies and percentagesor means and perhaps standard deviations) precedes the development of the visualpresentation. Although graphic methods can be used to show fairly complicatedfindings, their chief use in training research is to display distributions and relationshipsbetween variables: an experimental or independent variable on the one hand and thedependent variable on the other.
STATISTICSIn a program of training research, statistics are important in describing the reliability andvalidity of measuring instruments, in determining the degree to which confidence can beplaced in an obtained difference between means, and in controlling the effects ofvariables not of direct interest. In addition to control methods that include matching andrandom assignment to groups, there are statistical techniques designed to accomplishmuch the same result through the subtraction of unwanted variance from statisticsindicating relationship. Although techniques of multivariate analysis of variance and thenumerous varieties of multivariate correlation are beyond the scope of this discussion, astatistical consultant may occasionally suggest a multivariate method useful toincorporate in the design of a specific training study, especially when control ofunwanted variance by a nonstatistical method is impractical. In a complete report of aproject, statistical results have their place as intermediate findings that bolsterconclusions—the real end products of a study.

The Pfeiffer Library Volume 22, 2nd Edition. Copyright © 1998 Jossey-Bass/Pfeiffer106 ❘❚
REFERENCES AND BIBLIOGRAPHYAlreck, P.L., & Settle, R.B. (1986, January). The survey research handbook. Journal of the Market Research
Society, 94.
American Psychological Association. (1982). Ethical principles in the conduct of research with humanparticipants. Washington, DC: Author.
The Annual series for HRD practitioners. (1972-1994). J.W. Pfeiffer, J.E. Jones, & L.D. Goodstein (Eds.). SanDiego, CA: Pfeiffer & Company.
Bowers, D.G., & Franklin, J.L. (1974). Basic concepts of survey feedback. In J.W. Pfeiffer & J.E. Jones (Eds.),The 1974 annual handbook for group facilitators. San Diego, CA: Pfeiffer & Company.
Bowers, D.C., & Franklin, J.L. (1977). Survey-guided development I: Data-based organizational change. SanDiego, CA: Pfeiffer & Company.
Campbell, D.T., & Stanley, J.C. (1963). Experimental and quasi-experimental designs for research on teaching. InN.L. Gage (Ed.), Handbook of research on teaching (pp. 171-246). Chicago: Rand McNally.
Cook, J.D., Hepworth, S.J., Wall, T.D., & Warr, P.B. (1981). The experience of work: A compendium and reviewof 249 measures and their use. Orlando, FL: Academic Press.
Cook, T.D., & Campbell, D.T. (1979). Quasi-experimentation: Design and analysis issues for field settings.Chicago: Rand McNally.
Downie, N.M., & Heath, R.W. (1970). Basic statistical methods (3rd ed.). New York: Harper & Row.
Dunham, R.B., & Smith, F.J. (1979). Organizational surveys: An internal assessment of organizational health.Glenview, IL: Scott, Foresman.
Farrow, D.L., & Sample, J.A. (1994). BARS: Developing behaviorally anchored rating scales. In J.W. Pfeiffer(Ed.), Pfeiffer & Company Library, 18 (pp. 113-119). San Diego, CA: Pfeiffer & Company.
Farrow, D.L., & Sample, J.A. (1986). BARS: Developing behaviorally anchored rating scales. In J.W. Pfeiffer &L.D. Goodstein (Eds.), The 1986 annual: Developing human resources. San Diego, CA: Pfeiffer &Company.
Fowler, F.J., Jr. (1984). Survey research methods. Beverly Hills, CA: Sage.
Frame, R.M., Hess, R.K., & Nielsen, W.R. (1982). Survey-guided development. In The OD source book: Apractitioner’s guide. San Diego, CA: Pfeiffer & Company.
Franklin, J.L., Wissler, A.L., & Spencer, G.J. (1977). Survey-guided development III: A manual for conceptstraining. San Diego, CA: Pfeiffer & Company.
Gavin, J.F. (1984). Survey feedback: The perspectives of science and practice. Group & Organization Studies,9(1), 29-70.
Hanson, P.G. (1981). Learning through groups: A trainer’s basic guide. San Diego, CA: Pfeiffer & Company.
Harrison, R. (1970). Choosing the depth of organizational intervention. Journal of Applied Behavioral Science, 6,181-202.
Hausser, D.L., Pecorella, P.A., & Wissler, A.L. (1977). Survey-guided development II: A manual for consultants.San Diego, CA: Pfeiffer & Company.
Hersey, P., & Blanchard, K.H. (1973). LEAD self (other): Leader effectiveness & adaptability description.Escondido, CA: Leadership Studies, Inc.

The Pfeiffer Library Volume 22, 2nd Edition. Copyright © 1998 Jossey-Bass/Pfeiffer ❚❘ 107
Hillway, T. (1956). Introduction to research. Boston, MA: Riverside Press Cambridge.
Hogarth, R.M. (Ed). (1982). Question framing and response consistency. San Francisco, CA: Jossey Bass.
Kesselman-Turkel, J., & Peterson, F. (1982). Research shortcuts. Chicago: Contemporary Books.
Labaw, P. (1980). Advanced questionnaire design. Cambridge, MA: Abt Books.
Likert, R. (1932). A technique for the measurement of attitudes. Archives of Psychology, 140, 1-55.
Likert, R. (1971). The human organization. New York: McGraw-Hill.
Lord, F.M. (1969). Statistical adjustments when comparing preexisting groups. Psychological Bulletin, 72, 336-337.
Mahler, W.R. (1974). Diagnostic studies. Reading, MA: Addison-Wesley.
Maiorca, J.J. (1991). Basic statistics for the HRD practitioner. In J.W. Pfeiffer (Ed.), The 1991 annual: Developinghuman resources. San Diego, CA: Pfeiffer & Company.
Mayo, G.D., & DuBois, P.H. (1987). The complete book of training: Theory, principles, and techniques. SanDiego, CA: Pfeiffer & Company.
Morgan, J.P., Jr. (1981). Central West Virginia cultural-awareness quiz. In L. Thayer (Ed.), 50 strategies forexperiential learning: Book two. San Diego, CA: Pfeiffer & Company.
Mouton, J.S., & Blake, R.R. (1975). Instrumented team learning: A behavioral approach to student-centeredlearning. Austin, TX: Scientific Methods.
Nadler, D.A. (1977). Feedback and organization development: Using data-based methods. Reading, MA:Addison-Wesley.
Oppenheim, A.N. (1966). Questionnaire design and attitude measurement. New York: Basic Books.
Osgood, C., Suci, G., & Tannenbaum, P. (1957). The measurement of meaning. Urbana, IL: University of IllinoisPress.
Patton, M.Q. (1980). Qualitative evaluation methods. Beverly Hills, CA: Sage.
Peters, D. (1985). Directory of human resource development instrumentation. San Diego, CA: Pfeiffer &Company.
Pfeiffer, J.W., Heslin, R., & Jones, J.E. (1976). Instrumentation in human relations training: A guide to 92instruments with wide application to the behavioral sciences (2nd ed.). San Diego, CA: Pfeiffer & Company.
Rao, T.V. (1985). The entrepreneurial orientation inventory: Measuring the locus of control. In L.D. Goodstein &J.W. Pfeiffer (Eds.), The 1985 annual: Developing human resources. San Diego, CA: Pfeiffer & Company.
Rotter, J.B. (1966). Generalized expectancies for internal versus external control of reinforcement. PsychologicalMonographs, 80 (1, Whole No. 609).
Sample, J.A. (1986). The use of behaviorally based scales in performance appraisal. In J.W. Pfeiffer & L.D.Goodstein (Eds.), The 1986 annual: Developing human resources. San Diego, CA: Pfeiffer & Company.
Sample, J.A. (1994). The use of behaviorally based scales in performance appraisal. In J.W. Pfeiffer (Ed.), Pfeiffer& Company Library, 20 (pp. 167-178). San Diego, DA: Pfeiffer & Company.
Schostrom, E.L. (1974). Personal orientation inventory. San Diego, CA: Educational and Industrial TestingService (EDITS).
Schuman, H., & Presser, S. (1981). Questions and answers in attitude surveys: Experiments in question form,wording and context. New York: Academic Press.
Schutz, W. (1977). FIRO awareness scales manual. Palo Alto, CA: Consulting Psychologists Press.

The Pfeiffer Library Volume 22, 2nd Edition. Copyright © 1998 Jossey-Bass/Pfeiffer108 ❘❚
Schutz, W. (1982). The Schutz measures: An integrated system for assessing elements of awareness. San Diego,CA: Pfeiffer & Company.
Sudman, S., & Bradburn, N.M. (1982). Asking questions. A practical guide to questionnaire design. San Francisco,CA: Jossey-Bass.
Supervisory Attitudes: The X-Y Scale. (1972). In J.W. Pfeiffer & J.E. Jones (Eds.), The 1972 annual handbook forgroup facilitators. San Diego, CA: Pfeiffer & Company.
Supervisory Attitudes: The X-Y Scale. (1994). In J.W. Pfeiffer (Ed.), Pfeiffer & Company Library 19, (pp. 187-192). San Diego, CA: Pfeiffer & Company.
The Survey of Organizations (SOO). (1980). Ann Arbor, MI: Institute for Social Research, The University ofMichigan, and Rensis Likert Associates, Inc.
Taylor, J.C., & Bowers, D.G. (1972). The Survey of Organizations: A machine-scored standardized questionnaireinstrument. Ann Arbor; MI: Institute for Social Research.
Terborg, J.R. (1979). Women as managers scale (WAMS). In J.E. Jones & J.W. Pfeiffer (Eds.), The 1979 annualhandbook for group facilitators. San Diego, CA: Pfeiffer & Company.
Van de Ven, A.H., & Ferry, D.L. (1980). Measuring and assessing organizations. New York: John Wiley.