Embed Size (px)
Citation preview
A Benchtop Sample
Preparation Instrument:
New Solutions for GC
and GC/MS Applications
Rebecca Veeneman
Riva ISCC
Agilent User Meeting
June 1, 2010

Outline
• A new sample preparation instrument for GC, GC/MS, LC, and LC/MS
applications
• Features
• Performance
• Conclusions
• Sample dilution
• ISTD additon
• Derivatization
• Calibration curve
standard preparation
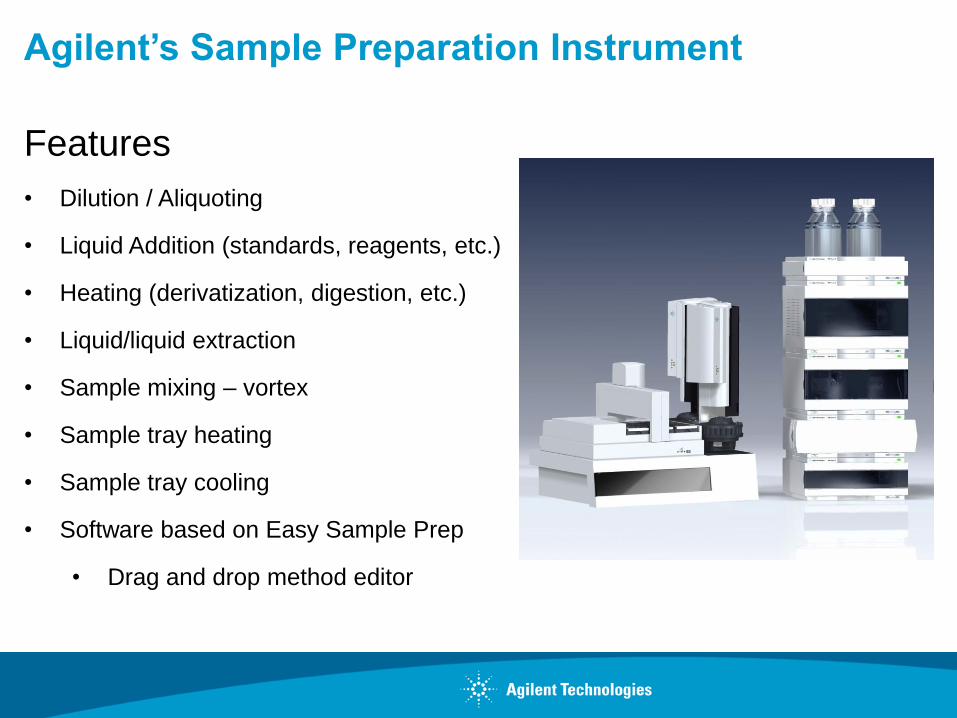
Agilent’s Sample Preparation Instrument
Features
• Dilution / Aliquoting
• Liquid Addition (standards, reagents, etc.)
• Heating (derivatization, digestion, etc.)
• Liquid/liquid extraction
• Sample mixing – vortex
• Sample tray heating
• Sample tray cooling
• Software based on Easy Sample Prep
• Drag and drop method editor
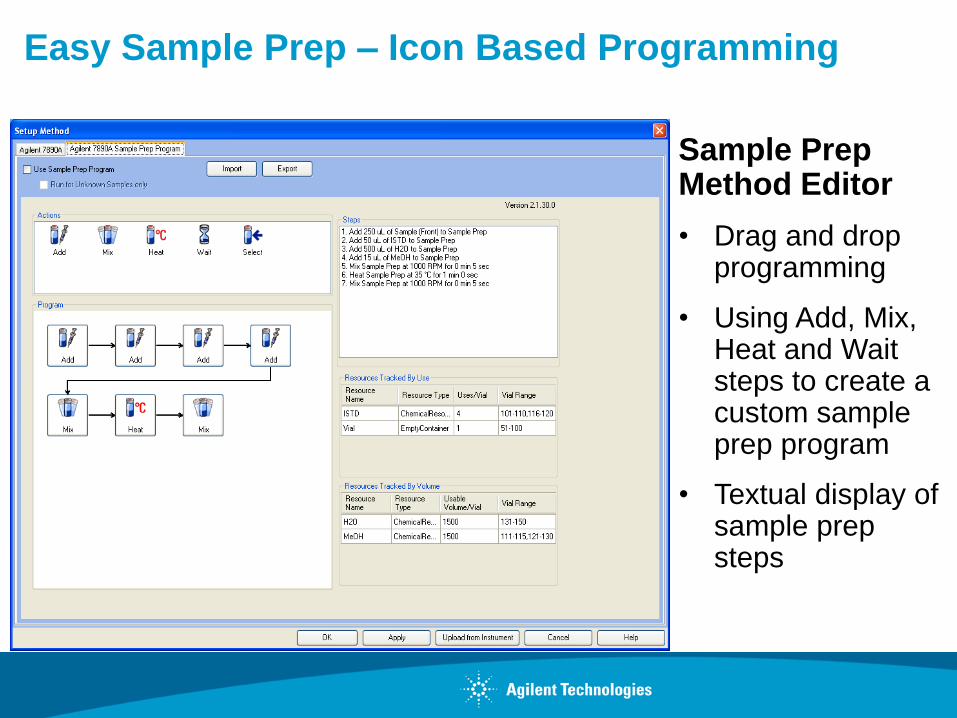
Easy Sample Prep – Icon Based Programming
Sample Prep Method Editor
• Drag and drop programming
• Using Add, Mix, Heat and Wait steps to create a custom sample prep program
• Textual display of sample prep steps
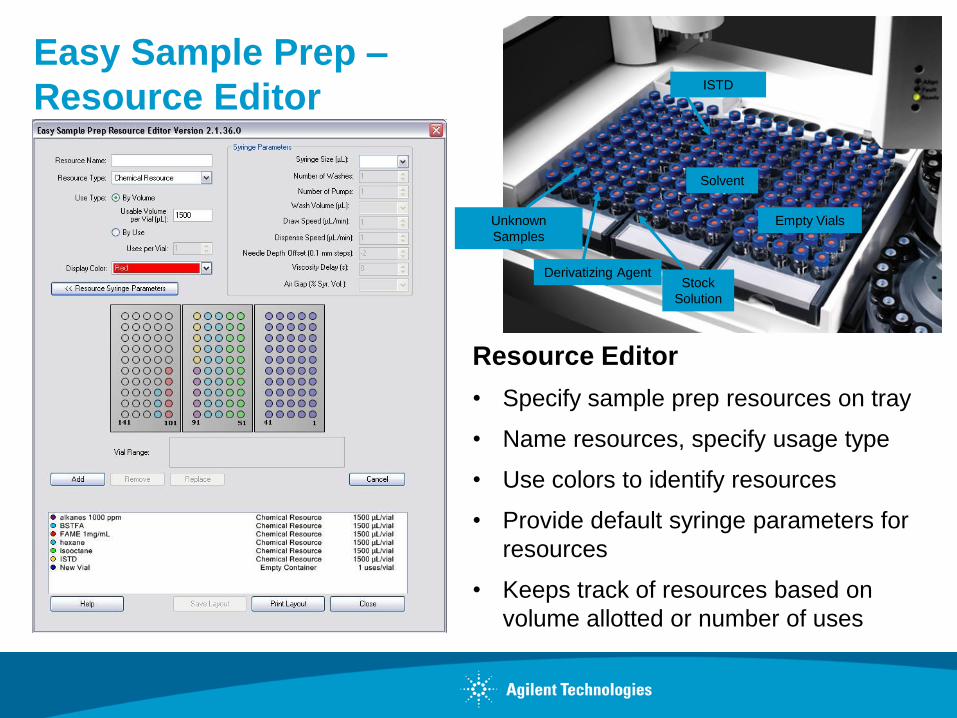
Easy Sample Prep –
Resource Editor
Stock
Solution
Solvent
Empty Vials
ISTD
Unknown
Samples
Derivatizing Agent
Resource Editor
• Specify sample prep resources on tray
• Name resources, specify usage type
• Use colors to identify resources
• Provide default syringe parameters for
resources
• Keeps track of resources based on
volume allotted or number of uses
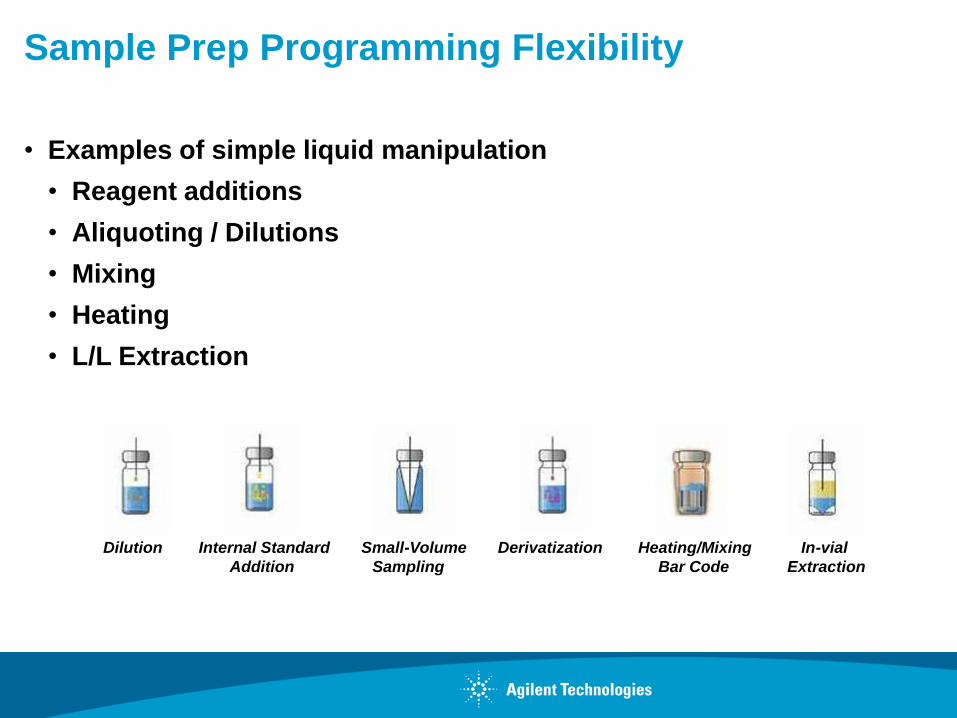
Sample Prep Programming Flexibility
• Examples of simple liquid manipulation
• Reagent additions
• Aliquoting / Dilutions
• Mixing
• Heating
• L/L Extraction
Dilution Internal Standard Small-Volume Derivatization Heating/Mixing In-vial
Addition Sampling Bar Code Extraction
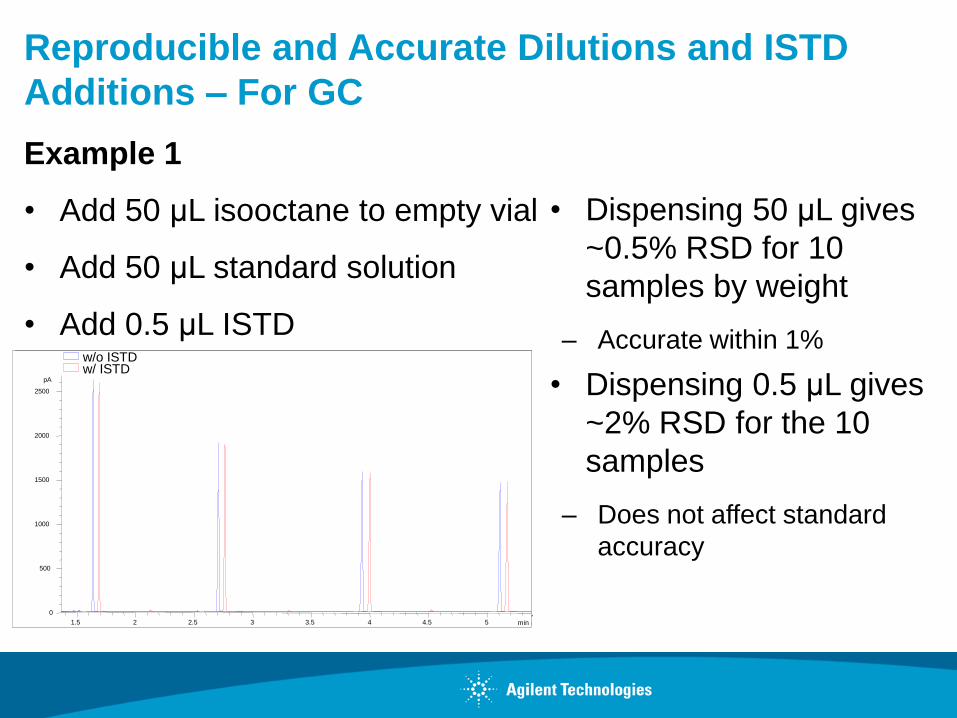
Reproducible and Accurate Dilutions and ISTD
Additions – For GC
Example 1
• Add 50 μL isooctane to empty vial
• Add 50 μL standard solution
• Add 0.5 μL ISTD
min2.5 3 3.5 4 4.5 5 5.5
pA
0
1000
2000
3000
4000
5000
6000
7000
8000
9000
FID1 A, Front Signal (ISTD\SIG2000014.D) FID1 A, Front Signal (ISTD\SIG2000019.D) FID1 A, Front Signal (ISTD\SIG2000024.D) FID1 A, Front Signal (ISTD\SIG2000029.D) FID1 A, Front Signal (ISTD\SIG2000034.D) FID1 A, Front Signal (ISTD\SIG2000039.D) FID1 A, Front Signal (ISTD\SIG2000044.D) FID1 A, Front Signal (ISTD\SIG2000049.D) FID1 A, Front Signal (ISTD\SIG2000054.D) FID1 A, Front Signal (ISTD\SIG2000059.D)
C10
C11 C13
C16
C15
C14C12
min1.5 2 2.5 3 3.5 4 4.5 5
pA
0
500
1000
1500
2000
2500
w/ ISTDw/o ISTD
• Dispensing 50 μL gives
~0.5% RSD for 10
samples by weight
– Accurate within 1%
• Dispensing 0.5 μL gives
~2% RSD for the 10
samples
– Does not affect standard
accuracy
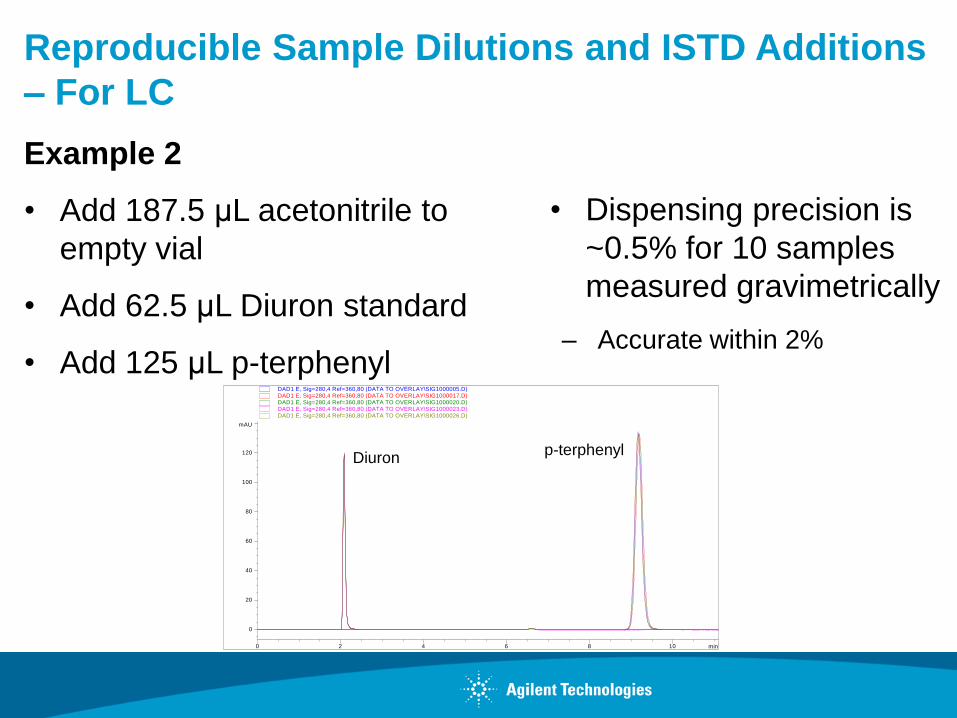
Example 2
• Add 187.5 μL acetonitrile to
empty vial
• Add 62.5 μL Diuron standard
• Add 125 μL p-terphenyl
Reproducible Sample Dilutions and ISTD Additions
– For LC
min0 2 4 6 8 10
mAU
0
20
40
60
80
100
120
DAD1 E, Sig=280,4 Ref=360,80 (DATA TO OVERLAY\SIG1000005.D) DAD1 E, Sig=280,4 Ref=360,80 (DATA TO OVERLAY\SIG1000017.D) DAD1 E, Sig=280,4 Ref=360,80 (DATA TO OVERLAY\SIG1000020.D) DAD1 E, Sig=280,4 Ref=360,80 (DATA TO OVERLAY\SIG1000023.D) DAD1 E, Sig=280,4 Ref=360,80 (DATA TO OVERLAY\SIG1000026.D)
Diuronp-terphenyl
• Dispensing precision is
~0.5% for 10 samples
measured gravimetrically
– Accurate within 2%
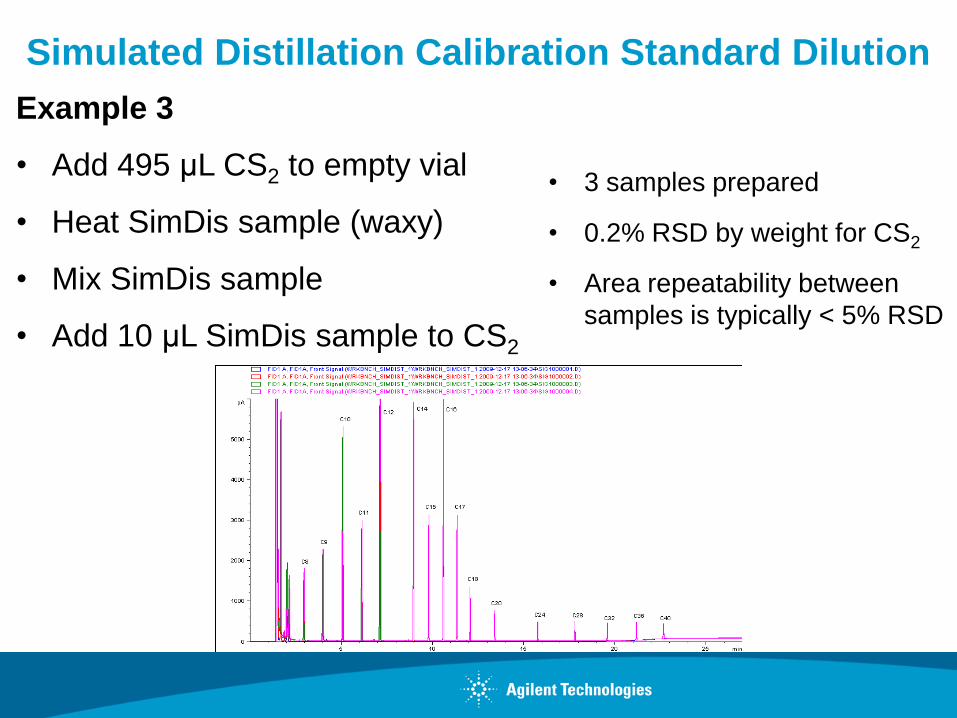
Simulated Distillation Calibration Standard Dilution
Example 3
• Add 495 μL CS2 to empty vial
• Heat SimDis sample (waxy)
• Mix SimDis sample
• Add 10 μL SimDis sample to CS2
• 3 samples prepared
• 0.2% RSD by weight for CS2
• Area repeatability between
samples is typically < 5% RSD
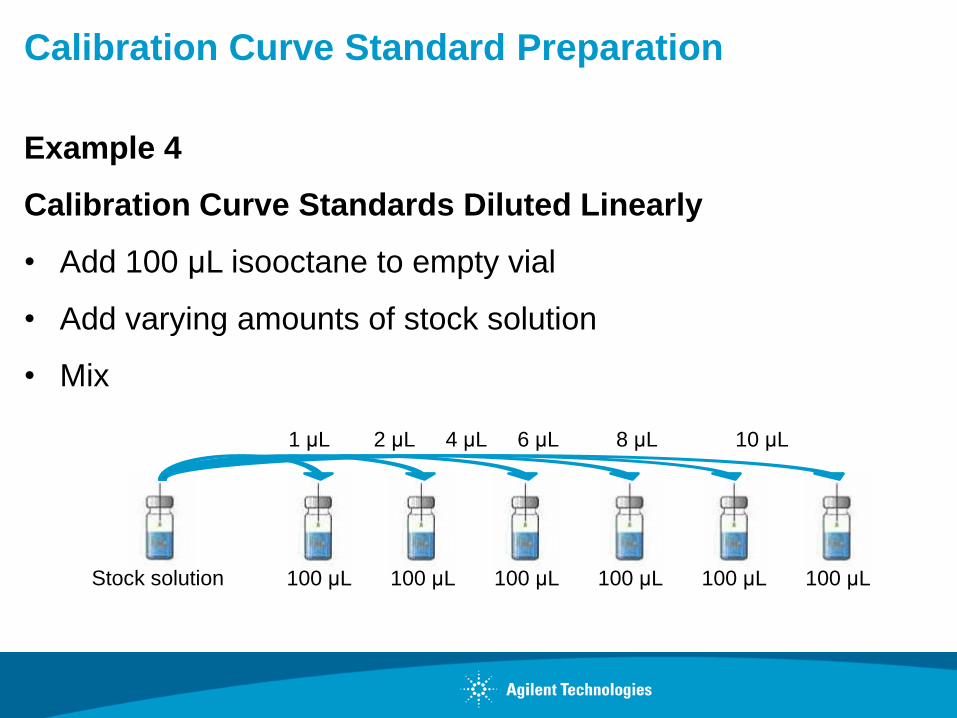
Example 4
Calibration Curve Standards Diluted Linearly
• Add 100 μL isooctane to empty vial
• Add varying amounts of stock solution
• Mix
100 μL 100 μL 100 μL 100 μL 100 μL 100 μL
Calibration Curve Standard Preparation
10 μL8 μL6 μL4 μL2 μL1 μL
Stock solution
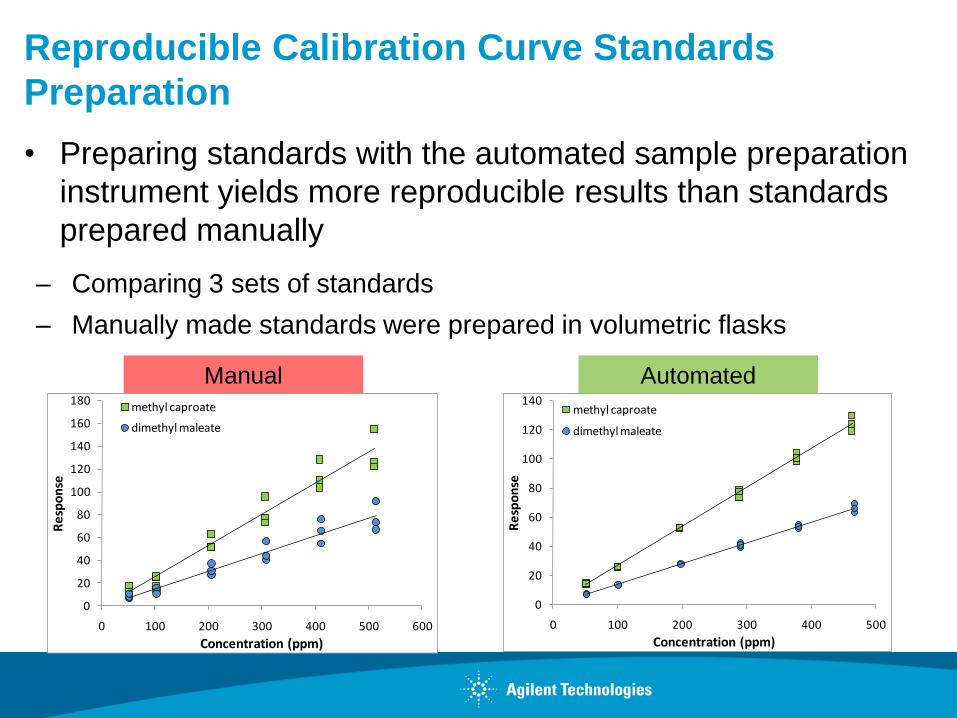
Reproducible Calibration Curve Standards
Preparation
• Preparing standards with the automated sample preparation
instrument yields more reproducible results than standards
prepared manually
– Comparing 3 sets of standards
– Manually made standards were prepared in volumetric flasks
Manual Automated
0
20
40
60
80
100
120
140
0 100 200 300 400 500
Re
spo
nse
Concentration (ppm)
methyl caproate
dimethyl maleate
0
20
40
60
80
100
120
140
160
180
0 100 200 300 400 500 600
Re
spo
nse
Concentration (ppm)
methyl caproate
dimethyl maleate
EPA 8270 Standards Preparation
Example 5
• Add varying amounts (270-300 μL) of methylene chloride to
empty vials
• Add varying amounts of stock solution (0.3-30 μL)
• Add 3 μL ISTD
• Mix
EPA 8270 Calibration Curve Standards
0.0
0.2
0.4
0.6
0.8
1.0
1.2
1.4IS
Ac
en
ap
hth
en
e-d
10
Iso
ph
oro
ne
He
xa
ch
loro
cyc
lop
en
tad
ien
e
Me
vin
ph
os
2,4
-Din
itro
tolu
en
e
Flu
ore
ne
Tri
flu
ralin
IS P
he
na
nth
ren
e-d
10
Sim
azin
e
Atr
azin
e
Pe
nta
ch
loro
ph
en
ol
Te
rbu
fos
Ch
loro
tha
lon
il
Bro
ma
cil
Ald
rin
He
pta
ch
lor
ep
ox
ide
En
dri
n
p,p
'-D
DT
IS C
hry
se
ne
-d1
2
Di(
2-E
thylh
ex
yl)
ad
ipa
te
SS
Tri
ph
en
ylp
ho
sp
ha
te
bis
(2-E
thylh
ex
yl)
ph
tha
late
IS P
ery
len
e-d
12
No
rma
lize
d R
RF
RS
Ds
Manual
ALS
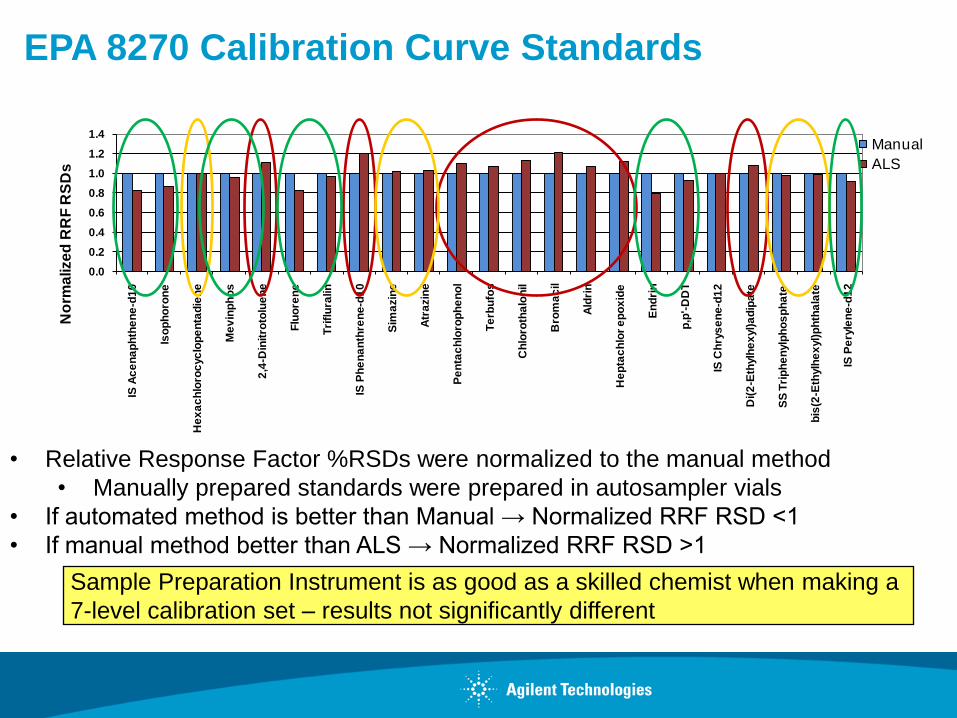
Sample Preparation Instrument is as good as a skilled chemist when making a
7-level calibration set – results not significantly different
• Relative Response Factor %RSDs were normalized to the manual method
• Manually prepared standards were prepared in autosampler vials
• If automated method is better than Manual → Normalized RRF RSD <1
• If manual method better than ALS → Normalized RRF RSD >1
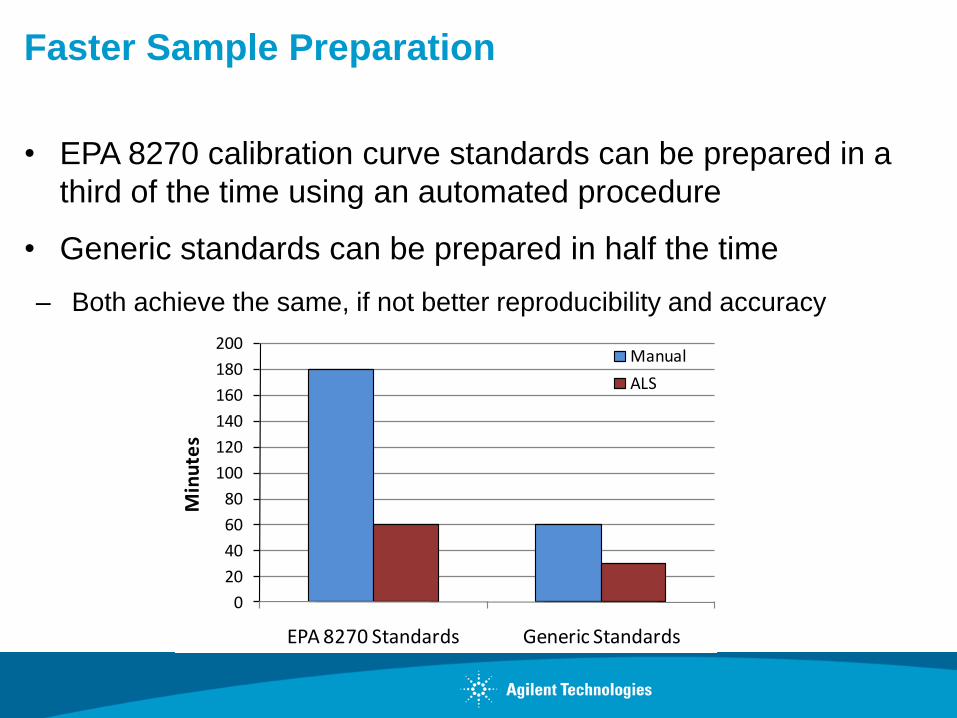
Faster Sample Preparation
• EPA 8270 calibration curve standards can be prepared in a
third of the time using an automated procedure
• Generic standards can be prepared in half the time
– Both achieve the same, if not better reproducibility and accuracy
0
20
40
60
80
100
120
140
160
180
200
EPA 8270 Standards Generic Standards
Min
ute
s
Manual
ALS
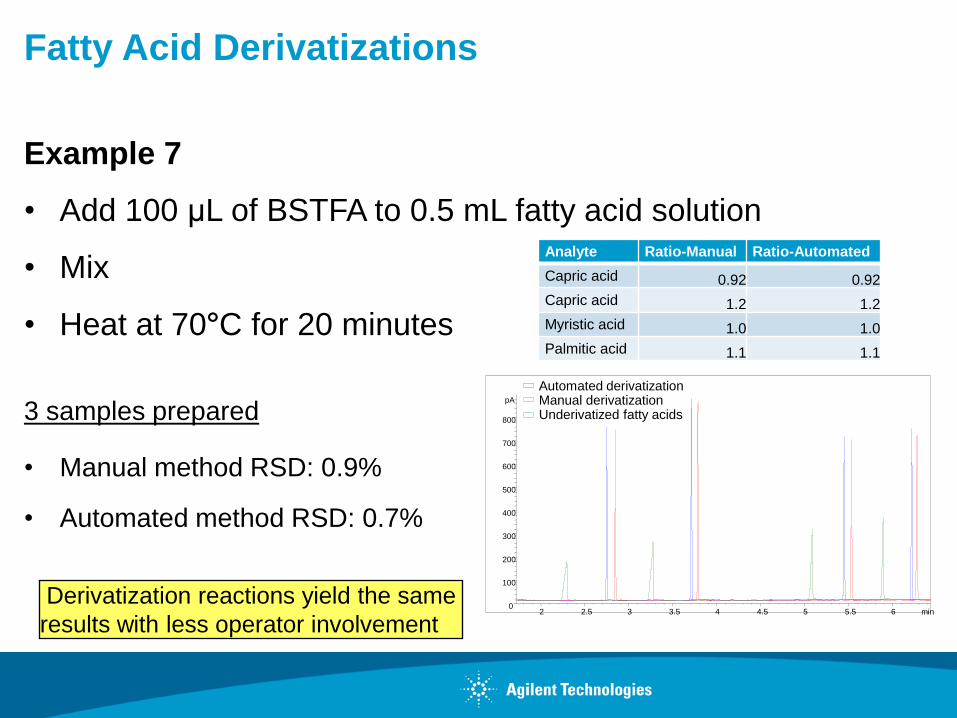
Example 7
• Add 100 μL of BSTFA to 0.5 mL fatty acid solution
• Mix
• Heat at 70°C for 20 minutes
Fatty Acid Derivatizations
3 samples prepared
• Manual method RSD: 0.9%
• Automated method RSD: 0.7%
min2 2.5 3 3.5 4 4.5 5 5.5 6
pA
0
100
200
300
400
500
600
700
800
Automated derivatizationManual derivatizationUnderivatized fatty acids
Analyte Ratio-Manual Ratio-Automated
Capric acid 0.92 0.92
Capric acid 1.2 1.2
Myristic acid 1.0 1.0
Palmitic acid 1.1 1.1
Derivatization reactions yield the same
results with less operator involvement
Conclusions
• Samples prepared with an automated sample preparation
instrument yield reproducible results
– Results are as good, if not better than those obtained with manual
methods
• Samples prepared with automated methods yield accurate
data
– Results achieve the same level of accuracy expected from manual
methods
Increased Lab Productivity
• Automation of sample preparation frees lab personnel for
other tasks
– design experiments, work up data
• Improve quality of chromatographic results by providing better
precision between samples
– Less rework since autosamplers minimize human variability
• Samples take less time to make
Cost Effective Sample Preparation
• Liters of solvent can be saved per year by converting sample
preparation steps to an automated method
– Use 2 mL autosampler vials instead of larger volumetric flasks
– Automating EPA 8270 saves 4 L of methylene chloride per analyst per
year
– Reduced exposure to hazardous chemicals
• Fewer mistakes mean more samples per day

Thank you for your attention!
Additional questions can be directed to:
Peter Mrozinski