Embed Size (px)
Citation preview

Atmos. Chem. Phys., 21, 15555–15567, 2021https://doi.org/10.5194/acp-21-15555-2021© Author(s) 2021. This work is distributed underthe Creative Commons Attribution 4.0 License.
A black carbon peak and its sources in the free troposphere ofBeijing induced by cyclone lifting and transport from central ChinaZhenbin Wang1,2,3,4, Bin Zhu1,2,3,4, Hanqing Kang1,2,3,4, Wen Lu1,2,3,4, Shuqi Yan1,2,3,4, Delong Zhao5,Weihang Zhang6, and Jinhui Gao7
1Collaborative Innovation Center on Forecast and Evaluation of Meteorological Disaster,Nanjing University of Information Science and Technology, Nanjing, 210044, China2Key Laboratory for Aerosol-Cloud-Precipitation of China Meteorological Administration,Nanjing University of Information Science and Technology, Nanjing, 210044, China3Key Laboratory of Meteorological Disaster (KLME), Ministry of Education,Nanjing University of Information Science and Technology, Nanjing, 210044, China4Joint International Research Laboratory of Climate and Environment Change (ILCEC),Nanjing University of Information Science and Technology, Nanjing, 210044, China5Beijing Weather Modification Office, Beijing, 100089, China6College of Oceanic and Atmospheric Sciences, Ocean University of China, Qingdao, 266100, China7Plateau Atmosphere and Environment Key Laboratory of Sichuan Province, School of Atmospheric Sciences,Chengdu University of Information Technology, Chengdu, 610225, China
Correspondence: Bin Zhu ([email protected])
Received: 21 April 2021 – Discussion started: 23 June 2021Revised: 22 September 2021 – Accepted: 28 September 2021 – Published: 18 October 2021
Abstract. Observations suggest that the vertical distribu-tions of air pollutants, such as black carbon (BC), presentas various types depending on the emission sources and me-teorological diffusion conditions. However, the formationprocess and source appointment of some special BC pro-files are not fully understood. In this paper, by using theWeather Research and Forecasting model coupled withChemistry (WRF-Chem) with a BC-tagging technique, weinvestigate the formation mechanism and regional sources ofa BC peak in the free troposphere observed by an aircraftflight in Beijing (BJ) on 5 May 2018. The results show thatthe contribution rate of the Beijing–Tianjin–Hebei (BTH) re-gion to the surface BC of BJ exceeded 80 % in this case.Local sources dominated BC in BJ from the surface to ap-proximately 700 m (78.5 %), while the BC peak in the freetroposphere (∼ 4000 m) was almost entirely imported fromexternal sources (99.8 %). Combining BC tracking and pro-cess analysis, we find that horizontal advection (HADV)and vertical advection (VADV) processes played an impor-tant role in the convergent and upward movement and thetransport of BC. The BC originating from the surface in
central provinces, including Shanxi (SX), Henan (HN), andHebei (HB), had been uplifted through a cyclone system16 h previously, was transported to a height of approximately3000 m above BJ, and was then lifted by the VADV processto approximately 4000 m. At the surface, BJ and its surround-ings were under the control of a weak pressure gradient, lead-ing to the accumulation of BC within the boundary layer. Ourresults indicate that cyclone systems can quickly lift air pol-lutants, such as BC, up to the free troposphere, as well asextend their lifetimes and further affect the regional atmo-spheric environment and climate.
1 Introduction
Black carbon (BC) has been a research hotspot in recentyears owing to its significant environmental and climate ef-fects (IPCC, 2013). Unlike scattering aerosols (e.g. sulfate),BC has a strong ability to absorb solar radiation, which accel-erates global warming (Jacobson, 2001; Weingartner et al.,2003; Bond et al., 2013). Additionally, BC can heat the upper
Published by Copernicus Publications on behalf of the European Geosciences Union.

15556 Z. Wang et al.: A black carbon peak and its sources in the free troposphere of Beijing
air of the planetary boundary layer (PBL), inhibit its develop-ment, and promote regional air pollution (Ding et al., 2016).Air quality is affected not only by local emissions but also bylong-distance transport (Q. Zhang et al., 2017). For example,BC in south China is mainly transported from southeast Asiaand north China (Fang et al., 2020), and most of the BC inthe Arctic is transported from low-latitude regions (Keeganet al., 2014). Therefore, it is necessary to study the tempo-ral and spatial distributions of BC and quantitatively analyseits regional sources to provide a reference for BC emissionreduction.
The annual carbon emissions in China account for approx-imately one-quarter of the global carbon emissions (Bond etal., 2004). As the capital of China, Beijing (BJ) has experi-enced frequent air pollution in recent years (Van Pinxterenet al., 2009). In BJ and its surrounding areas, straw is oftenburned in early summer; hence, BC pollution has becomean environmental problem that cannot be ignored (Berginet al., 2001; He et al., 2001). However, most of the previ-ous measurements of BC were performed at ground level,and the quantitative source tracking of BC was not thoroughenough. For example, based on radiocarbon (14C) measure-ments, Zhang et al. (2015) found that fossil emissions domi-nated BC with a mean contribution of 75±8 % in BJ, but re-gional source research was lacking. To identify the regionalsources, Liu et al. (2018) used a potential source contributionfunction (PSCF) model to determine that Shanxi (SX) andHebei (HB) were the main sources of BC in BJ but failedto quantify their separate contributions. Wen et al. (2020)used the Weather Research and Forecasting model coupledto chemistry (WRF-Chem) to simulate the regional contribu-tion and found that regional transport contributes more than40 % to BC in BJ, but there was no detailed delineation ofexternal source regions.
In addition to research on horizontal BC, many verticalobservations have also been conducted in recent years, show-ing that vertical distributions of BC are strongly affected bymeteorological conditions and regional transport. The air-craft observation experiment carried out in BJ showed thatregional transport of BC can enhance air pollution and trans-port occurs not only near the surface but also in the middlelevels of the PBL (0.5–1 km) (Zhao et al., 2015). Moreover,when the BC profile has a homogeneous or negative gradientdistribution, the diurnal evolution of the PBL is the leadingfactor. When there is a positive BC gradient from the surfaceto the top of the PBL, it is mainly caused by surroundingemissions from high stacks and regional transport (Lu et al.,2019; Shi et al., 2021). However, these studies were mostlyqualitative inferences, and it is difficult to quantify the forma-tion process of vertical distributions and BC sources in detail.In addition, the effect of BC on the PBL varies greatly owingto its altitude. BC will inhibit the development of the PBLabove the morning residual layer and conversely promote itsdevelopment (Ma et al., 2020). Therefore, it is worth empha-sizing that using only BC surface concentrations to calculate
radiative forcing and heating rates and ignoring the verticaldistribution of BC will induce great uncertainties (Shi et al.,2021).
In summary, there are few studies on the quantitative in-terpretation of the regional contribution of BC or the sourceregions are not sufficiently separated; additionally, researchon the reasons for and source tracking of the vertical distribu-tion of BC is even scarcer. Based on the BC profile observedin BJ, this study uses the air quality model WRF-Chem witha BC-tagging technique to track the sources of BC, with thehope to explain the observed BC peak in the free troposphereand evaluate BC sources and direct BC regional emission re-duction measures.
2 Data and methodology
2.1 Description of data used
2.1.1 Data used for modelling
A variety of data were used for modelling in this study.The initial and boundary meteorological and chemical condi-tions were provided by the National Centers for Environmen-tal Prediction (NECP) final (FNL) operational global analy-sis data and outputs of the Community Atmosphere Modelwith Chemistry (CAM-chem; Lamarque et al., 2012). An-thropogenic emissions were provided by the Multi-resolutionEmission Inventory for China (MEIC, 2016 version, http://www.meicmodel.org/, last access: 15 October 2021). Bio-genic emissions were generated by using the Model of Emis-sions of Gases and Aerosols from Nature (MEGAN; Guen-ther et al., 2006).
2.1.2 Ground-based observation
In terms of the observation data used for model verifica-tion, the meteorological factors were derived from groundstation observations using the Meteorological InformationComprehensive Analysis and Processing System (MICAPS)with a time accuracy of 3 h. PM2.5 data were obtainedfrom the China air quality online monitoring and analy-sis platform (https://www.aqistudy.cn/, last access: 15 Oc-tober 2021) provided by the Ministry of Ecology and En-vironment of China (http://106.37.208.233:20035/, last ac-cess: 15 October 2021), which includes 1500 monitoringstations. Each site was equipped with tapered element os-cillating microbalance instruments (TEOM, RP1400 model,Thermo Scientific, USA) using the micro-oscillating balancemethod and the β-absorption method to measure PM2.5 con-centration at a resolution of 0.1 µg m−3 (Zhang and Cao,2015). More details about the measurement methods, accu-racy, and uncertainties are described in China’s Environmen-tal Protection Standard HJ 653-2013 (http://www.cnemc.cn/jcgf/dqhj/201711/W020181008687887167307.pdf, last ac-cess: 15 October 2021). Many studies on air pollution, par-
Atmos. Chem. Phys., 21, 15555–15567, 2021 https://doi.org/10.5194/acp-21-15555-2021

Z. Wang et al.: A black carbon peak and its sources in the free troposphere of Beijing 15557
Figure 1. Model domain (the white line is the path of the vertical cross section in Sect. 3.3.2).
ticularly PM2.5 pollution, have obtained their PM2.5 datafrom this platform, such as Kang et al. (2021) and Houet al. (2019, 2020). BC data were collected by the single-particle soot photometer (SP2, Droplet Measurement Tech-nologies, Inc., USA) that was equipped with an external in-let, the Model 1200 passive isokinetic inlet (Brechtel Manu-facturing Inc., USA), which could deliver a sample flow of150 L min−1 with an air speed of 100 m s−1 and a sample ef-ficiency of 95 % for particle sizes between 0.01 and 6 µm.More details about SP2 can be found in Sharma et al. (2017)and Stephens et al. (2003).
2.1.3 Aircraft observation platform
In May 2018, we carried out a total of seven aircraft obser-vations in BJ and surrounding areas (Fig. S1 in the Sup-plement), with each observation time between 10:00 and12:00 BJT (Beijing time, also known as China standardtime). The airborne measurements in this study were per-formed on a King Air 350 aircraft observation platform witha true speed of approximately 250–300 km h−1. An Aircraft-Integrated Meteorological Measurement System (AIMMS-20, Aventech, Canada) was used to measure meteorologicalparameters in situ, including temperature (T ), relative hu-midity (RH), wind speed (WS), and wind direction (WD),with a time resolution of 1 s. An SP2 was also installed onthe aircraft observation platform to measure the vertical dis-tribution of BC. The operation of most flights was carriedout to avoid clouds where possible, which could effectivelyavoid the wet deposition of BC. More detailed informationabout the aircraft platform can be found in Tian et al. (2019),Hu et al. (2020), and Zhao et al. (2019, 2020).
2.2 Model description
The model used in this study, WRF-Chem 3.9.1.1, is coupledwith a BC-tagging technique (Wang et al., 2014; Yang et al.,2017, 2018; Fang et al., 2020; Zhu et al., 2020), which is sim-
ilar to the particle source analysis technology in the Compre-hensive Air Quality Model with Extensions (CAMx) model.The model can track the BC emitted from the predividedsource region and quantitatively calculate the BC concentra-tion in each source region one time. We divide the modeldomain into 20 geographic source regions before running themodel, so the BC concentration of the target region is equalto the sum of the concentrations of BC from all source re-gions:
C =
20∑i=1
Ci . (1)
The model domain and the administrative regions of eachsource region are shown in Fig. 1 and Table 1, respectively(the source regions with less contribution will be merged inthe subsequent analysis, defined as others). The BC concen-tration in each source region can be expressed as follows:
1Ci =1Chemi +1Phyi +1Emisi , (2)
where 1Chemi , 1Phyi , and 1Chemi represent the BC con-centration produced by chemical, physical and emission pro-cesses, respectively. However, BC is not included in the cal-culation of chemical reactions, so the value of 1Chemi is 0.1Phyi represents the concentration of BC changed by modelphysical processes, including horizontal advection, verticaladvection, vertical mixing, dry deposition, wet deposition,and convection. The BC of each source region is regarded asan independent variable, and it is marked from the beginningof the BC emission, 1Emisi . The concentration of the totalemissions in region i is defined as follows:
1Emisi(x,y,z)={1Emisi(x,y,z)0
inside region ioutside region i
. (3)
If BC is in region i, then 1Emisi(x,y,z)=1Emis(x,y,z);otherwise,1Emisi(x,y,z)= 0. Subsequently, the newly de-fined variables will participate in the physical and chemical
https://doi.org/10.5194/acp-21-15555-2021 Atmos. Chem. Phys., 21, 15555–15567, 2021

15558 Z. Wang et al.: A black carbon peak and its sources in the free troposphere of Beijing
calculation process in the model accompanied by the originvariables in the model. Thus, we can obtain the BC concen-trations of each source region for any grid of the model andat any time.
Compared with sensitive experiments, this method canmore accurately quantify the sources of BC with fewer er-rors. Previous studies have used a similar technique to studythe source of air pollutants, such as PM2.5 and O3, and theresults all show that regional transport is an important fac-tor of PM2.5 and O3 pollution in BJ (Gao et al., 2016, 2020;Y. Zhang et al., 2017). In addition, the air pollutants in BJare mainly from BJ, TJ, and HB, and the high-concentrationarea presents a banded distribution feature from southwest tonortheast, which is consistent with the analysis of BC in thisstudy.
2.3 Parameterized scheme settings
Experiments started at 08:00 BJT on 1 May 2018 and endedat 08:00 BJT on 10 May 2018. The first 3 d was designatedthe spin-up time. Regarding the simulation settings, twonested domains (Fig. 1) were set up with grid sizes of 99×99at horizontal resolutions of 36 and 12 km for D01 and D02,respectively. D01 covered most parts of China and the sur-rounding areas and ocean, and D02 covered most parts ofnorth China. The modelling results of D01 provided meteo-rological and chemical boundary conditions for the simula-tions of D02. For the vertical direction, 38 layers were setup from the surface up to a pressure limit at 50 hPa, where10 layers were located below 1 km. Notably, the carbon bondmechanismZ (CBM-Z; Zaveri and Peters, 1999) was appliedas the gas-phase chemical mechanism in this study. Corre-spondingly, the Model for Simulating Aerosol Interactionsand Chemistry with eight bins (MOSAIC-8bins; Zaveri etal., 2008) was chosen as the aerosol chemistry mechanism.Other parameterization settings are listed in Table 2.
3 Results and discussion
3.1 Model validation
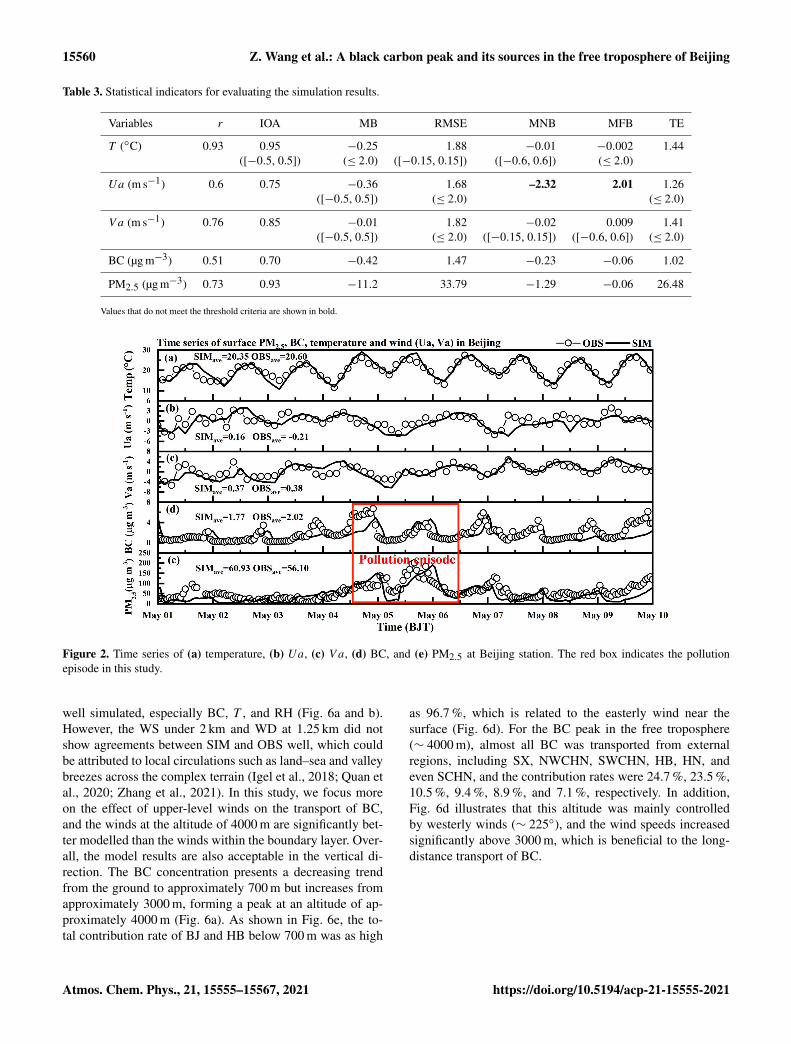
Although the WRF-Chem model is widely used in air qual-ity research, there are significant differences in the simula-tion results with different parameterization schemes. In thisstudy, time series of both simulated and observed PM2.5, BCconcentration, temperature (T ), and wind (Ua and V a) areshown in Fig. 2 to evaluate the performance of the model.Figure 2 illustrates that the model reproduces the numericalmagnitude and variation characteristics of PM2.5, BC, andmeteorological factors well. Additionally, we calculate sev-eral common metrics – the correlation coefficient (r), indexof agreement (IOA), mean bias (MB), root mean square er-ror (RMSE), mean normalized bias (MNB), mean fractionalbias (MFB), and total error (TE) – to validate the model per-formance for meteorological factors and air pollutants. The
benchmarks shown in brackets in Table 3 follow the rec-ommended values suggested by Emery and Tai (2001) andUS EPA (2007). Generally, the model reproduces the pollu-tants and main meteorological elements well, which providesa good basis for subsequent analysis. The model validation innorth China, particularly in HN and SX (source regions), ispresented in Figs. S2 and S3 and Tables S1 and S2 in theSupplement, and the modelling profiles of BC and meteoro-logical factors are also presented in Fig. 6 in Sect. 3.2.2.
As shown in Table 3, meteorological factors (T , Ua,and V a) showed high values of the mean IOAs (≥ 0.75),indicating that the simulation agreed well with the obser-vations. The MB of T was −0.25, which suggested thatthe mean bias of T was within 1◦, and the MBs of Uaand V a were −0.36 and −0.01, respectively, suggesting thatthe model results deviated from the observations to a smallextent. The RMSE and TE of meteorological elements wereless than 1.88 and 1.44, respectively, which are comparablewith the values reported in another modelling study (Gao etal., 2020) and were both within the threshold range. How-ever, the MNB and MFB of Ua were beyond the scope of itsbenchmark, suggesting an overestimation of Ua. The MNBand MFB of the other meteorological factors were within thescope of their benchmark.
For air pollutants, good agreement was found betweenthe simulations and observations since the IOAs of PM2.5and BC were 0.93 and 0.70, respectively. The MB values ofBC and PM2.5 were −0.42 and −11.2, respectively, whichdemonstrated that the deviation in the MB between BC mod-els and observations was less than 1 µg m−3, and the devia-tion in PM2.5 was approximately 11 µg m−3. Notably, all themetrics of air pollutants also indicated that the model perfor-mance for air pollutants was acceptable.
3.2 Tracking BC from the surface to the freetroposphere
During the aircraft observation on 5 May 2018, we foundhigh BC values both near the ground and in the free tropo-sphere (Fig. 3). To reveal the cause of the distinct BC pro-file, the WRF-Chem model with a BC-tagging technique wasused for quantitative explanation.
3.2.1 Tracking BC sources at the surface
The near-surface pollution in BJ lasted from 5 to 6 May(Fig. 2), and both the spatial and temporal distributions (near-surface and in the free troposphere) of BC and PM2.5 exhib-ited highly similar characteristics (Fig. S4). In the synopticchart of Fig. 4a, there was a weak cyclone system in SX andNWCHN at 17:00 BJT on 4 May, leading to convergence andupward movement there. At 08:00 BJT on 5 May (Fig. 4b),the regions controlled by the weak cyclone system had ex-panded, including in SX, NWCHN, HB, and HN, while BJwas in front of the weak low pressure. At the same time,
Atmos. Chem. Phys., 21, 15555–15567, 2021 https://doi.org/10.5194/acp-21-15555-2021

Z. Wang et al.: A black carbon peak and its sources in the free troposphere of Beijing 15559
Table 1. Source region division.
Source name The administrative areas in each region
BJ BeijingTJ TianjinHB HebeiSX ShanxiSD ShandongHN HenanAH AnhuiJS JiangsuNWCHN Including Shaanxi, Gansu, Ningxia, Qinghai, Inner Mongolia, and XiangjiangMONGOLIA MongoliaNECHN Including Heilongjiang, Liaoning, and JilinSWCHN Including Yunnan, Guizhou, Sichuan, Chongqing, and XizangSECHN Including Jiangxi, Fujian, and TaiwanSCHN Including Hunan, Hubei, Guangdong, and GuangxiKOREA Including North Korea and South KoreaJAPAN JapanRUSSIA RussiaVIETNAM VietnamZJ ZhejiangSH ShanghaiOCEAN Including Bohai Sea, Yellow Sea, East China Sea, South China Sea, and western Pacific
Table 2. Major configuration options of WRF-Chem used for this study.
Item Selection Reference
PBL scheme MYJ scheme Janjic (2001)Microphysics scheme Lin scheme Lin et al. (1983)Long-wave radiation scheme RRTM Iacono et al. (2008)Short-wave radiation scheme RRTM Iacono et al. (2008)Land surface scheme Noah land surface model Chen and Dudhia (2001)Dry-deposition scheme Wesely scheme Wesely (1989)
it can be seen that the near-surface convergence areas weremainly in SX from 4 to 5 May (Fig. 4d and e), correspond-ing to the position where the cyclone appeared, indicatingthat convergence uplift of surface BC existed in SX, whichwas consistent with the cross-section analysis in Sect. 3.3.2.There was convergence near the surface, and air pollutants inthe surrounding areas were likely to accumulate, leading toan increase in BC concentration in BJ (Fig. 4d and e). More-over, there was almost no convergence but an obvious “trans-port channel” from SX to BJ in the free troposphere (Fig. 4h),so BC was transported from SX to BJ by westerly winds.Subsequently, the low-pressure system moved south, and BJwas controlled by the uniform pressure field at 08:00 BJT on6 May (Fig. 4c), which was not beneficial for the diffusion ofBC in the horizontal and vertical directions (Fig. 4f). At analtitude of approximately 4000 m, BC was transported south-ward due to clean north winds (Fig. 4i).
Moreover, the sources of BC were quantitatively traced(Fig. 5) to explain the cause of pollution in BJ. The mean
BC concentration was 2.29 µg m−3 in this case (Fig. 5a), andthe diurnal evolution of BC showed a characteristic of “lowerin the daytime and higher in the nighttime”, which is relatedto the daily change in the PBL (Huang et al., 2018). Further-more, BC near the surface mainly originated from BJ, HB,HN, TJ, and SD, whose mean contribution rates were 52.0 %,23.9 %, 6.1 %, 5.7 %, and 4.4 %, respectively (Fig. 5b). TheBC contribution rate of the BTH region to BJ exceeded 80 %,further confirming that when controlled by weak low pres-sure, air pollutants in surrounding areas are likely to accu-mulate in BJ and local pollutants have difficulty diffusingoutward (Chen et al., 2008).
3.2.2 Tracking BC sources vertically
Near-surface BC mainly originated from BJ and its sur-rounding areas, while the source of BC in the free tropo-sphere (∼ 4000 m) showed different characteristics. The ver-tical distributions of BC and meteorological factors were
https://doi.org/10.5194/acp-21-15555-2021 Atmos. Chem. Phys., 21, 15555–15567, 2021
15560 Z. Wang et al.: A black carbon peak and its sources in the free troposphere of Beijing
Table 3. Statistical indicators for evaluating the simulation results.
Variables r IOA MB RMSE MNB MFB TE
T (◦C) 0.93 0.95 −0.25 1.88 −0.01 −0.002 1.44([−0.5, 0.5]) (≤ 2.0) ([−0.15, 0.15]) ([−0.6, 0.6]) (≤ 2.0)
Ua (m s−1) 0.6 0.75 −0.36 1.68 –2.32 2.01 1.26([−0.5, 0.5]) (≤ 2.0) (≤ 2.0)
V a (m s−1) 0.76 0.85 −0.01 1.82 −0.02 0.009 1.41([−0.5, 0.5]) (≤ 2.0) ([−0.15, 0.15]) ([−0.6, 0.6]) (≤ 2.0)
BC (µg m−3) 0.51 0.70 −0.42 1.47 −0.23 −0.06 1.02
PM2.5 (µg m−3) 0.73 0.93 −11.2 33.79 −1.29 −0.06 26.48
Values that do not meet the threshold criteria are shown in bold.
Figure 2. Time series of (a) temperature, (b) Ua, (c) V a, (d) BC, and (e) PM2.5 at Beijing station. The red box indicates the pollutionepisode in this study.
well simulated, especially BC, T , and RH (Fig. 6a and b).However, the WS under 2 km and WD at 1.25 km did notshow agreements between SIM and OBS well, which couldbe attributed to local circulations such as land–sea and valleybreezes across the complex terrain (Igel et al., 2018; Quan etal., 2020; Zhang et al., 2021). In this study, we focus moreon the effect of upper-level winds on the transport of BC,and the winds at the altitude of 4000 m are significantly bet-ter modelled than the winds within the boundary layer. Over-all, the model results are also acceptable in the vertical di-rection. The BC concentration presents a decreasing trendfrom the ground to approximately 700 m but increases fromapproximately 3000 m, forming a peak at an altitude of ap-proximately 4000 m (Fig. 6a). As shown in Fig. 6e, the to-tal contribution rate of BJ and HB below 700 m was as high
as 96.7 %, which is related to the easterly wind near thesurface (Fig. 6d). For the BC peak in the free troposphere(∼ 4000 m), almost all BC was transported from externalregions, including SX, NWCHN, SWCHN, HB, HN, andeven SCHN, and the contribution rates were 24.7 %, 23.5 %,10.5 %, 9.4 %, 8.9 %, and 7.1 %, respectively. In addition,Fig. 6d illustrates that this altitude was mainly controlledby westerly winds (∼ 225◦), and the wind speeds increasedsignificantly above 3000 m, which is beneficial to the long-distance transport of BC.
Atmos. Chem. Phys., 21, 15555–15567, 2021 https://doi.org/10.5194/acp-21-15555-2021

Z. Wang et al.: A black carbon peak and its sources in the free troposphere of Beijing 15561
Figure 3. (a) Aircraft routes and (b) the BC profile observed at 10:00–11:00 BJT.
Figure 4. (a–c) Surface synoptic patterns, (d–f) BC concentration and wind vector at the surface, and (g–i) BC concentration and wind vectorin the troposphere (∼ 4000 m) at 17:00 BJT on 4 May, 08:00 BJT on 5 May, and 08:00 BJT on 6 May. The red line represents the convergenceregion (divergence< 0; unit ×10−6 s−1).
https://doi.org/10.5194/acp-21-15555-2021 Atmos. Chem. Phys., 21, 15555–15567, 2021

15562 Z. Wang et al.: A black carbon peak and its sources in the free troposphere of Beijing
Figure 5. (a) BC concentration and (b) contribution rate of each source region to BC in BJ during the pollution episode. The legend refers tothe regions shown in Fig. 1.
Figure 6. Model validation of (a) vertical BC, (b) T and RH, (c) WS, (d) WD, (e) BC concentration of each source region, and (f) contributionrate of each source region at 10:00–12:00 BJT on 5 May. The shading indicates the modelling standard deviation. The legend refers to theregions shown in Fig. 1.
3.3 Air mass trajectory and physical process analysis
3.3.1 Air mass trajectory analysis
To determine the source of BC in depth and to validatethe source-tracing results above, we utilized the HYSPLITmodel, developed by the National Oceanic and AtmosphericAdministration (NOAA), to analyse the backward trajectory(24 h) of air masses reaching the altitudes of 600, 2200, and3800 m above BJ, with intervals of 1600 m, at 08:00 BJT on5 May (Fig. 7). As presented in Fig. 7, the air mass nearthe surface (red line) originated from BJ and its surround-
ing areas, which is consistent with the source-tracking re-sults (Fig. 6e). The upper air mass (green line) originatedin SX and reached BJ via HB, corresponding to the resultsof the cross section (Figs. 6e and 8). In addition, the airmass reaching the altitude of approximately 2000 m aboveBJ (blue line) was from Mongolia, a source region outsideof D02, so the BC source-tracing results in a predominantlyother source region (Fig. 6e, the other source region includesMongolia and Inner Mongolia). Furthermore, the green lineindicates that from 08:00 BJT on 4 May to 08:00 BJT on5 May, there was an air mass rising from the surface in SXalong a southwestern path and reaching the upper levels of BJ
Atmos. Chem. Phys., 21, 15555–15567, 2021 https://doi.org/10.5194/acp-21-15555-2021

Z. Wang et al.: A black carbon peak and its sources in the free troposphere of Beijing 15563
Figure 7. Backward trajectory (24 h) of the air mass at 08:00 BJTon 5 May.
(∼ 4000 m). During this time, the conditions in central China(including SX, HB, and HN) were controlled by a cyclonesystem (Fig. 4a and b), leading to convergent and elevatingmotion there, which is conducive to the uplift of near-surfaceair masses and consistent with the backward trajectory modelresults.
3.3.2 Tracking BC sources in the cross section
In addition to the backward trajectory, the BC sources inthe vertical cross section along the path from SX to BJ (inFigs. 1 and 7) can more convincingly explain the BC upliftand transport phenomenon. Referring to the backward tra-jectory, the white line shown in Fig. 1b can be regarded asthe transport path of the air mass. To illustrate the uplift andtransport mechanism of BC, cross sections of the BC con-centration, wind vector, and BC contour lines (including BJ,SX, and NWCHN) along the aforementioned line are shownin Fig. 8. From 08:00 to 18:00 BJT on 4 May, the south-west wind prevailed along the SX–BJ line (Fig. 8a and b),which contributed to the transport of BC. BC originated inNWCHN, was transported to SX, and mixed with BC emit-ted in the SX region. By 16:00 BJT on 4 May, the ascend-ing movement in SX was vigorous, resulting in the elevationof near-surface BC (Fig. 8b), which is consistent with theinitial uplifting position presented in Fig. 7. BC originating
from NWCHN and SX was uplifted up to 3000 m and trans-ported to HB and BJ to form high values (Fig. 8c). However,the wind direction near the surface changed from westerlyto easterly, while westerly winds still prevailed in the upperair (Fig. 8d). As a result, near-surface BC in BJ diffused intothe surrounding areas, such as HB, but in the upper air, BCoriginating in NWCHN and SX was still transported to BJand lifted further to approximately 4000 m (Fig. 8d). At thatpoint, there were high BC values both near the surface and inthe free troposphere above BJ (∼ 4000 m), which is consis-tent with the observation and source-tracing results in Fig. 6.
3.3.3 Physical process analysis
The backward trajectory shows that the air mass in thefree troposphere originated from SX, while that within theboundary layer was from BJ; therefore, we further quanti-fied the dominant transport processes of BC in the sourceregion (SX) and receptor region (BJ), including horizontaladvection (HADV), vertical advection (VADV), and verti-cal mixing (VMIX). In Fig. 9, the results show that HADVand VADV played an important role in the convergent andupward movement induced by cyclones and the transport ofBC. From 14:00 BJT to approximately 18:00 BJT on 4 May,in the boundary layer (< 2 km), HADV made positive contri-butions to the BC concentration in SX, while the VADV hadthe opposite effect, suggesting that convergent and upwardmotion existed therein (Fig. 9a and b), which also corrobo-rates the cyclone system in the surface synoptic patterns andnear-surface convergence areas (Fig. 4a and d). At the sametime, in the free troposphere (∼ 4 km), the contribution ofVADV and HADV to BC concentration was converse to thatin the boundary layer, indicating that BC originating in SXwas lifted from the surface to the free troposphere by VADV(Fig. 9a and b), which is consistent with the backward tra-jectory and cross-sectional analysis (Fig. 8b and c). In theupper layer of BJ (∼ 3 km), HADV made a positive contri-bution to the BC concentration from 14:00 BJT to approx-imately 22:00 BJT on 4 May, showing that BC was trans-ported from SX by westerly winds, which is also consistentwith the analysis of BC transport in Fig. 4h. Then, VADVlifted the BC transported by the HADV to approximately4 km from 02:00 BJT to approximately 08:00 BJT on 5 May(Fig. 9d and e), consistent with the analysis in Fig. 8c and d.VMIX in both SX and BJ occurred mainly in the afternoonof 4 May owing to intense turbulence (Fig. 9c and f).
4 Conclusions
This paper utilizes the air quality model WRF-Chem with aBC-tagging technique to study the formation mechanism ofa special BC profile observed by an aircraft flight in BJ. Themajor findings are summarized as follows.
https://doi.org/10.5194/acp-21-15555-2021 Atmos. Chem. Phys., 21, 15555–15567, 2021

15564 Z. Wang et al.: A black carbon peak and its sources in the free troposphere of Beijing
Figure 8. Vertical cross sections of BC concentration from SX to BJ and wind vectors (arrows) where the vertical speed is multiplied by 100at (a) 08:00 BJT on 4 May, (b) 16:00 BJT on 4 May, (c) 00:00 BJT on 5 May, and (d) 08:00 BJT on 5 May. The black line is the BC contourlines of SX plus NWCHN, and the red line is the BC contour line of BJ.
Figure 9. Contributions of horizontal advection (HADV), verticaladvection (VADV), and vertical mixing (VMIX) processes to verti-cal BC concentrations in SX and BJ from 08:00 BJT on 4 May to08:00 BJT on 5 May.
In this case, the mean BC concentration was 2.29 µg m−3.BC at the surface mainly originated from BJ, HB, HN, TJ,and SD, with contribution rates of 52.0 %, 23.9 %, 6.1 %,5.7 % and 4.4 %, respectively. The BC contribution rate ofthe BTH region to BJ exceeded 80 %, further confirming thatwhen controlled by weak low pressure, air pollutants in sur-
Figure 10. Formation mechanism of BC peak in the free tropo-sphere.
rounding areas are likely to accumulate in BJ and local airpollutants have difficulty diffusing outward.
Local sources dominated BC in BJ from the surface to ap-proximately 700 m (78.5 %), while BC was almost entirelyimported from external sources (99.8 %) in the free tropo-sphere (∼ 4000 m). BC in the free troposphere mainly origi-nated from SX, HB, HN, and NWCHN, and the contributionrates were 24.7 %, 9.4 %, 8.9 %, and 23.5 %, respectively.
Figure 10 illustrates the formation mechanism of the spe-cial BC profile. HADV and VADV processes played an im-portant role in the convergent and upward movement andthe transport of BC. Near-surface BC that originated fromSX, HB, HN, and NWCHN had been uplifted by a cyclonesystem approximately 16 h previously, was transported to
Atmos. Chem. Phys., 21, 15555–15567, 2021 https://doi.org/10.5194/acp-21-15555-2021

Z. Wang et al.: A black carbon peak and its sources in the free troposphere of Beijing 15565
a height of approximately 3000 m above BJ, and was thenlifted by the VADV process to approximately 4000 m. At thesurface, BJ and its surroundings were in the field of a weakpressure gradient, leading to the accumulation of BC.
The results indicate that cyclone systems can quickly liftair pollutants, such as BC, up to the free troposphere, extendtheir lifetimes, and further affect the regional atmospheric en-vironment and climate.
Code and data availability. All the observations and model out-puts mentioned in this study are publicly available. Observations ofPM2.5 concentrations can be downloaded directly via the real-timerelease platform of the Ministry of Ecology and Environment ofChina (https://quotsoft.net/air/, last access: 15 October 2021) (Min-istry of Ecology and Environment of China, 2021). Other observa-tions and the simulated results can be accessed by contacting Zhen-bin Wang at [email protected].
Supplement. The supplement related to this article is available on-line at: https://doi.org/10.5194/acp-21-15555-2021-supplement.
Author contributions. ZW performed the model simulation, dataanalysis, and manuscript writing. BZ proposed the idea, supervisedthis work, and revised the manuscript. DZ provided the observationdata at BJ station. WL provided help with the model simulation.HK, SY, and WZ also contributed to the manuscript revision.
Competing interests. The contact author has declared that neitherthey nor their co-authors have any competing interests.
Disclaimer. Publisher’s note: Copernicus Publications remainsneutral with regard to jurisdictional claims in published maps andinstitutional affiliations.
Special issue statement. This article is part of the special issue“Satellite and ground-based remote sensing of aerosol optical, phys-ical, and chemical properties over China”. It is not associated witha conference.
Acknowledgements. We acknowledge the free use of MEICemissions from Tsinghua University (http://www.meicmodel.org/dataset-mix.html, last access: 15 October 2021). We are grateful tothe High Performance Computing Center of the Nanjing Universityof Information Science and Technology for performing the numeri-cal calculations in this work on its blade cluster system.
Financial support. This work was supported by the National KeyResearch and Development Program (grant no. 2016YFA0602003)
and National Natural Science Foundation of China (grantnos. 42021004 and 92044302).
Review statement. This paper was edited by Stelios Kazadzis andreviewed by two anonymous referees.
References
Bergin, M. H., Cass, G. R., Xu, J., Fang, C., Zeng, L.M., Yu, T., Salmon, L. G., Kiang, C. S., Tang, X.Y., Zhang, Y. H., and Chameides, W. L.: Aerosol radia-tive, physical, and chemical properties in Beijing duringJune 1999, J. Geophys. Res.-Atmos., 106, 17969–17980,https://doi.org/10.1029/2001JD900073, 2001.
Bond, T. C., Streets, D. G., Yarber, K. F., Nelson, S.M., Woo, J. H., and Klimont, Z.: A technology-basedglobal inventory of black and organic carbon emissionsfrom combustion, J. Geophys. Res.-Atmos., 109, D14203,https://doi.org/10.1029/2003JD003697, 2004.
Bond, T. C., Doherty, S. J., Fahey, D. W., Forster, P. M., Berntsen,T., DeAngelo, B. J., Flanner, M. G., Ghan, S., Kärcher, B., Koch,D., Kinne, S., Kondo, Y., Quinn, P. K., Sarofim, M. C., Schultz,M. G., Schulz, M., Venkataraman, C., Zhang, H., Zhang, S.,Bellouin, N., Guttikunda, S. K., Hopke, P. K., Jacobson, M.Z., Kaiser, J. W., Klimont, Z., Lohmann, U., Schwarz, J. P.,Shindell, D., Storelvmo, T., Warren, S. G., and Zender, C. S.:Bounding the role of black carbon in the climate system: a sci-entific assessment, J. Geophys. Res.-Atmos., 118, 5380–5552,https://doi.org/10.1002/jgrd.50171, 2013.
Chen, F. and Dudhia, J.: Coupling an advanced land surface–hydrology model with the Penn state–NCAR MM5 mod-eling system. part I: model implementation and sensitivity,Mon. Weather Rev., 129, 569–585, https://doi.org/10.1175/1520-0493(2001)129<0569:CAALSH>2.0.CO;2, 2001.
Chen, Z. H., Cheng, S. Y., Li, J. B., Guo, X. R., Wang,W. H., and Chen, D. S.: Relationship between atmo-spheric pollution processes and synoptic pressure pat-terns in northern China, Atmos. Environ., 42, 6078–6087,https://doi.org/10.1016/j.atmosenv.2008.03.043, 2008.
Ding, A. J., Huang, X., Nie, W., Sun, J. N., Kerminen, V. M., Petäjä,T., Su, H., Cheng, Y. F., Yang, X. Q., Wang, M. H., Chi, X. G.,Wang, J. P., Virkkula, A., Guo, W. D., Yuan, J., Wang, S. Y.,Zhang, R. J., Wu, Y. F., Song, Y., Zhu, T., Zilitinkevich, S., Kul-mala, M., and Fu, C. B.: Enhanced haze pollution by black car-bon in megacities in China, Geophys. Res. Lett., 43, 2873–2879,https://doi.org/10.1002/2016GL067745, 2016.
Emery, C. and Tai, E.: Enhanced Meteorological Modeling and Per-formance Evaluation for Two Texas Ozone Episodes, Final Re-port Submitted to Texas Natural Resources Conservation Com-mission, ENVIRON, International Corporation, Novato, USA,2001.
Fang, C., Zhu, B., Pan, C., Yun, X., Ding, D., and Tao, S.: Re-gional and sectoral sources for black carbon over South Chinain spring and their sensitivity to east Asian summer mon-soon onset, J. Geophys. Res.-Atmos., 125, e2020JD033219,https://doi.org/10.1029/2020JD033219, 2020.
https://doi.org/10.5194/acp-21-15555-2021 Atmos. Chem. Phys., 21, 15555–15567, 2021

15566 Z. Wang et al.: A black carbon peak and its sources in the free troposphere of Beijing
Gao, J., Zhu, B., Xiao, H., Kang, H., Hou, X., and Shao, P.: A casestudy of surface ozone source apportionment during a high con-centration episode, under frequent shifting wind conditions overthe Yangtze River Delta, China, Sci. Total Environ., 544, 853–863, https://doi.org/10.1016/j.scitotenv.2015.12.039, 2016.
Gao, J., Li, Y., Zhu, B., Hu, B., Wang, L., and Bao, F.: What have wemissed when studying the impact of aerosols on surface ozonevia changing photolysis rates?, Atmos. Chem. Phys., 20, 10831–10844, https://doi.org/10.5194/acp-20-10831-2020, 2020.
Guenther, A., Karl, T., Harley, P., Wiedinmyer, C., Palmer, P.I., and Geron, C.: Estimates of global terrestrial isopreneemissions using MEGAN (Model of Emissions of Gases andAerosols from Nature), Atmos. Chem. Phys., 6, 3181–3210,https://doi.org/10.5194/acp-6-3181-2006, 2006.
He, K., Yang, F., Ma, Y., Zhang, Q., Yao, X., Chan, C. K.,Cadle, S., Chan, T., and Mulawa, P.: The characteristics ofPM2.5 in Beijing, China, Atmos. Environ., 35, 4959–4970,https://doi.org/10.1016/S1352-2310(01)00301-6, 2001.
Hou, X., Zhu, B., Kumar, K. R., and Lu, W.: Inter-annual variabil-ity in fine particulate matter pollution over China during 2013–2018: Role of meteorology, Atmos. Environ., 214, 116842,https://doi.org/10.1016/j.atmosenv.2019.116842, 2019.
Hou, X., Zhu, B., Kumar, K. R., de Leeuw, G., Lu, W., Huang,Q., and Zhu, X.: Establishment of conceptual schemas of surfacesynoptic meteorological situations affecting fine particulate pol-lution across eastern China in the winter, J. Geophys. Res., 125,e2020JD033153, https://doi.org/10.1029/2020JD033153, 2020.
Hu, K., Zhao, D., Liu, D., Ding, S., Tian, P., Yu, C., Zhou, W.,Huang, M., and Ding, D.: Estimating radiative impacts of blackcarbon associated with mixing state in the lower atmosphereover the northern North China Plain, Chemosphere, 252, 126455,https://doi.org/10.1016/j.chemosphere.2020.126455, 2020.
Huang, X., Wang, Z., and Ding, A.: Impact of aerosol-PBLinteraction on haze pollution: multiyear observational evi-dences in North China, Geophys. Res. Lett., 45, 8596–8603,https://doi.org/10.1029/2018GL079239, 2018.
Iacono, M. J., Delamere, J. S., Mlawer, E. J., Shephard, M.W., Clough, S. A., and Collins, W. D.: Radiative forcing bylong-lived greenhouse gases: calculations with the AER radia-tive transfer models, J. Geophys. Res.-Atmos., 113, D13103,https://doi.org/10.1029/2008JD009944, 2008.
Igel, A. L., van den Heever, S. C., and Johnson, J. S.: Meteoro-logical and land surface properties impacting sea breeze extentand aerosol distribution in a dry environment, J. Geophys. Res.-Atmos., 123, 22–37, https://doi.org/10.1002/2017JD027339,2018.
IPCC: Contribution of Working Group I to the Fifth AssessmentReport of the Intergovernmental Panel on Climate Change, Cam-bridge University Press, Cambridge, UK and New York, USA,2013.
Jacobson, M. Z.: Strong radiative heating due to the mixing stateof black carbon in atmospheric aerosols, Nature, 409, 695–697,https://doi.org/10.1038/35055518, 2001.
Janjic, Z. I.: Nonsingular Implementation of the Mellor-YamadaLevel 2.5 Scheme in the NCEP Meso Model, NCEP TechnicalNote 437, p. 61, available at: https://repository.library.noaa.gov/view/noaa/11409 (last access: 15 October 2021), 2001.
Kang, H., Zhu, B., Liu, X., Shi, S., Hou, X., Lu, W.,Yan, S., Pan, C., and Chen, Y.: Three-dimensional distribu-
tion of PM2.5 over the yangtze river delta as cold frontsmoving through, J. Geophys. Res., 126, e2020JD034035,https://doi.org/10.1029/2020JD034035, 2021.
Keegan, K. M., Albert, M. R., McConnell, J. R., and Baker, I.:Climate change and forest fires synergistically drive widespreadmelt events of the Greenland Ice Sheet, P. Natl. Acad. Sci. USA,111, 7964–7967, https://doi.org/10.1073/pnas.1405397111,2014.
Lamarque, J. F., Emmons, L., Hess, P., Kinnison, D. E., Tilmes,S., Vitt, F., Heald, C., Holland, E. A., Lauritzen, P., and Neu,J.: CAM-chem: description and evaluation of interactive at-mospheric chemistry in the community earth system model,Geosci. Model Dev., 5, 369–411, https://doi.org/10.5194/gmd-5-369-2012, 2012.
Lin, Y. L., Farley, R. D., and Orville, H. D.: Bulk param-eterization of the snow field in a cloud model, J. Appl.Meteorol. Clim., 22, 1065–1092, https://doi.org/10.1175/1520-0450(1983)022<1065:BPOTSF>2.0.CO;2, 1983.
Liu, Y., Yan, C., and Zheng, M.: Source apportionment of blackcarbon during winter in Beijing, Sci. Total Environ., 618, 531–541, https://doi.org/10.1016/j.scitotenv.2017.11.053, 2018.
Lu, Y., Zhu, B., Huang, Y., Shi, S., Wang, H., An, J., and Yu, X.:Vertical distributions of black carbon aerosols over rural areas ofthe Yangtze River Delta in winter, Sci. Total Environ., 661, 1–9,https://doi.org/10.1016/j.scitotenv.2019.01.170, 2019.
Ma, Y., Ye, J., Xin, J., Zhang, W., Vilà-Guerau de Arel-lano, J., Wang, S., Zhao, D., Dai, L., Ma, Y., and Wu,X.: The stove, dome, and umbrella effects of atmosphericaerosol on the development of the planetary boundary layerin hazy regions, Geophys. Res. Lett., 47, e2020GL087373,https://doi.org/10.1029/2020GL087373, 2020.
Ministry of Ecology and Environment of China: https://quotsoft.net/air/, last access: 15 October 2021.
Quan, J., Dou, Y., Zhao, X., Liu, Q., Sun, Z., Pan, Y.,Jia, X., Cheng, Z., Ma, P., Su, J., and Xin, J.: Re-gional atmospheric pollutant transport mechanisms over theNorth China Plain driven by topography and planetaryboundary layer processes, Atmos. Environ., 221, 117098,https://doi.org/10.1016/j.atmosenv.2019.117098, 2020.
Sharma, S., Leaitch, W. R., Huang, L., Veber, D., Kolonjari,F., Zhang, W., Hanna, S. J., Bertram, A. K., and Ogren, J.A.: An evaluation of three methods for measuring black car-bon in Alert, Canada, Atmos. Chem. Phys., 17, 15225–15243,https://doi.org/10.5194/acp-17-15225-2017, 2017.
Shi, S., Zhu, B., Lu, W., Yan, S., Fang, C., Liu, X.,Liu, D., and Liu, C.: Estimation of radiative forcing andheating rate based on vertical observation of black car-bon in Nanjing, China, Sci. Total Environ., 756, 135–144,https://doi.org/10.1016/j.scitotenv.2020.144135, 2021.
Stephens, M., Turner, N., and Sandberg, J.: Particle identification bylaser-induced incandescence in a solid-state laser cavity, Appl.Optics, 42, 3726–3736, https://doi.org/10.1364/AO.42.003726,2003.
Tian, P., Liu, D., Huang, M., Liu, Q., Zhao, D., Ran,L., Deng, Z., Wu, Y., Fu, S., Bi, K., Gao, Q., He,H., Xue, H., and Ding, D.: The evolution of an aerosolevent observed from aircraft in Beijing: an insight intoregional pollution transport, Atmos. Environ., 206, 11–20,https://doi.org/10.1016/j.atmosenv.2019.02.005, 2019.
Atmos. Chem. Phys., 21, 15555–15567, 2021 https://doi.org/10.5194/acp-21-15555-2021

Z. Wang et al.: A black carbon peak and its sources in the free troposphere of Beijing 15567
US EPA: Guidance on the Use of Models and Other Analy-ses for Demonstrating Attainment of Air Quality Goals forOzone, PM2.5, and Regional Haze, EPA-454/B-07-002, availableat: https://nepis.epa.gov/Exe/ZyPURL.cgi?Dockey=P1006FPU.TXT (last access: 15 October 2021), 2007.
Van Pinxteren, D., Brüggemann, E., Gnauk, T., Iinuma, Y.,Müller, K., Nowak, A., Achtert, P., Wiedensohler, A., and Her-rmann, H.: Size-and time-resolved chemical particle character-ization during CAREBeijing-2006: different pollution regimesand diurnal profiles, J. Geophys. Res.-Atmos., 114, D00G09,https://doi.org/10.1029/2008JD010890, 2009.
Wang, H., Rasch, P. J., Easter, R. C., Singh, B., Zhang, R., Ma,P. L., Qian, Y., Ghan, S. J., and Beagley, N.: Using an explicitemission tagging method in global modeling of source-receptorrelationships for black carbon in the Arctic: Variations, sources,and transport pathways, J. Geophys. Res.-Atmos., 119, 12888–12909, https://doi.org/10.1002/2014JD022297, 2014.
Weingartner, E., Saathoff, H., Schnaiter, M., Streit, N., Bit-nar, B., and Baltensperger, U.: Absorption of light bysoot particles: determination of the absorption coefficient bymeans of aethalometers, J. Aerosol Sci., 34, 1445–1463,https://doi.org/10.1016/S0021-8502(03)00359-8, 2003.
Wen, W., Ma, X., Guo, C., Wei, P., Zhao, X., and Xu, J.: Source ap-portionment of black carbon and the feedback effect on the me-teorological factors in Beijing, China, Environ. Sci. Pollut. Res.,27, 41764–41775, https://doi.org/10.1007/s11356-020-09881-z,2020.
Wesely, M. L.: Parameterization of surface resis-tances to gaseous dry deposition in regional-scalenumerical-models, Atmos. Environ., 23, 1293–1304,https://doi.org/10.1016/j.atmosenv.2007.10.058, 1989.
Yang, Y., Wang, H., Smith, S. J., Ma, P. L., and Rasch, P.J.: Source attribution of black carbon and its direct radia-tive forcing in China, Atmos. Chem. Phys., 17, 4319–4336,https://doi.org/10.5194/acp-17-4319-2017, 2017.
Yang, Y., Wang, H., Smith, S. J., Zhang, R., Lou, S., Yu,H., Li, C., and Rasch, P. J.: Source apportionments ofaerosols and their direct radiative forcing and long-term trendsover continental United States, Earth’s Future, 6, 793–808,https://doi.org/10.1029/2018EF000859, 2018.
Zaveri, R. A. and Peters, L. K.: A new lumped struc-ture photochemical mechanism for large-scale appli-cations, J. Geophys. Res.-Atmos., 104, 30387–30415,https://doi.org/10.1029/1999JD900876, 1999.
Zaveri, R. A., Easter, R. C., Fast, J. D., and Peters, L.K.: Model for simulating aerosol interactions and chem-istry (MOSAIC), J. Geophys. Res.-Atmos., 113, D13204,https://doi.org/10.1029/2007JD008782, 2008.
Zhang, Q., Jiang, X., Tong, D., Davis, S. J., Zhao, H.,Geng, G., Feng, T., Zheng, B., Lu, Z., and Streets, D.G.: Transboundary health impacts of transported global airpollution and international trade, Nature, 543, 705–709,https://doi.org/10.1029/2007JD008782, 2017.
Zhang, W. H., Hai, S., Zhao, Y., Sheng, L. Zhou, Y., Wang,W., and Li, W.: Numerical modeling of regional transport ofPM2.5 during a severe pollution event in the Beijing–Tianjin–Hebei region in November 2015, Atmos. Environ., 254, 118393,https://doi.org/10.1016/j.atmosenv.2021.118393, 2021.
Zhang, Y., Zhu, B., Gao, J., Kang, H., Yang, P., Wang, L., andZhang, J.: The source apportionment of primary PM2.5 in anaerosol pollution event over Beijing-Tianjin-Hebei region us-ing WRF-Chem, China, Aerosol Air Qual. Res., 17, 2966–2980,https://doi.org/10.4209/aaqr.2016.10.0442, 2017.
Zhang, Y. L. and Cao, F.: Fine particulate mat-ter (PM2.5) in China at a city level, Sci. Rep. 5, 14884,https://doi.org/10.1038/srep14884, 2015.
Zhang, Y. L., Huang, R. J., El Haddad, I., Ho, K. F., Cao, J.J., Han, Y., Zotter, P., Bozzetti, C., Daellenbach, K. R., andCanonaco, F.: Fossil vs. non-fossil sources of fine carbona-ceous aerosols in four Chinese cities during the extreme win-ter haze episode of 2013, Atmos. Chem. Phys., 15, 1299–1312,https://doi.org/10.5194/acp-15-1299-2015, 2015.
Zhao, D., Tie, X., Gao, Y., Zhang, Q., Tian, H., Bi, K., Jin, Y.,and Chen, P.: In-situ aircraft measurements of the vertical dis-tribution of black carbon in the lower troposphere of Beijing,China, in the spring and summer time, Atmosphere, 6, 713–731,https://doi.org/10.3390/atmos6050713, 2015.
Zhao, D., Huang, M., Tian, P., He, H., Lowe, D., Zhou,W., Sheng, J., Wang, F., Bi, K., Kong, S., Yang, Y.,Liu, Q., Liu, D., and Ding, D.: Vertical characteristicsof black carbon physical properties over Beijing region inwarm and cold seasons, Atmos. Environ., 213, 296–310,https://doi.org/10.1016/j.atmosenv.2019.06.007, 2019.
Zhao, D., Liu, D., Yu, C., Tian, P., Hu, D., Zhou, W., Ding, S., Hu,K., Sun, Z., Huang, M., Huang, Y., Yang, Y., Wang, F., Shen, J.,Liu, Q., Kong, S., Li, X., He, H., and Ding, D.: Vertical evolutionof black carbon characteristics and heating rate during a hazeevent in Beijing winter, Sci. Total Environ., 709, 136–251, 2020.
Zhu, B., Wang, Y. M., Gao, J. H., Zhao, T. L., and Wang, L. R.:Distribution and source characteristics of Black carbon in au-tumn over Hunan-Hubei basin, China, Trans. Atmos. Sci., 43,592–602, https://doi.org/10.13878/j.cnki.dqkxxb.20200422001,2020.
https://doi.org/10.5194/acp-21-15555-2021 Atmos. Chem. Phys., 21, 15555–15567, 2021