Embed Size (px)
Citation preview
Carbon emission factor decomposition and carbon peak prediction based on multi‑objective decision and information fusion processingChunxue Shi and Xiwen Feng*
1 IntroductionIn recent decades, with the accelerated melting of the two-level glaciers and the increasing sea level, the environmental damage caused by global warming has become a global issue of general concern to the international community today, and curbing the further warming of the global climate has become a problem for mankind. The common challenges faced by society in this century. The factors that cause climate change are both natural and man-made. However, the large amount of greenhouse
Abstract
Global warming caused by excessive carbon dioxide emissions has seriously threat-ened the sustainable development of human society. How to reduce carbon dioxide emissions has become a common problem faced by the international community. This article aims to study the decomposition of carbon emission factors and the prediction of carbon peaks from the perspective of multi-objective decision-making and informa-tion fusion processing. The sample collection method and statistical analysis method are used to collect samples and simplify the algorithm. A collection experiment of carbon emission factors based on the industry of City A is designed. The experimental data collection takes into account the conversion of coal and oil products into stand-ard coal and carbon dioxide the resulting emissions impact. The experimental results in this paper show that the simulated and real values of my country’s petroleum carbon emissions have both increased from 2000 to 2015, and the decline will be controlled in 2017. Both the simulated value and the real value of my country’s coal carbon emis-sions have been on the rise from 2000 to 2015, and the decline will be controlled in 2017. The carbon emissions of coal are far greater than those of petroleum. The research on carbon emission factor decomposition and carbon peak prediction based on multi-objective decision-making and information fusion processing has been completed well. The research results can be used for industrial carbon emission factor decomposition and carbon peak prediction in other cities across the country.
Keywords: Multi-objective decision-making, Information fusion processing, Carbon emission factor decomposition, Carbon peak prediction research
Open Access
© The Author(s) 2021. Open Access This article is licensed under a Creative Commons Attribution 4.0 International License, which permits use, sharing, adaptation, distribution and reproduction in any medium or format, as long as you give appropriate credit to the original author(s) and the source, provide a link to the Creative Commons licence, and indicate if changes were made. The images or other third party material in this article are included in the article’s Creative Commons licence, unless indicated otherwise in a credit line to the mate-rial. If material is not included in the article’s Creative Commons licence and your intended use is not permitted by statutory regulation or exceeds the permitted use, you will need to obtain permission directly from the copyright holder. To view a copy of this licence, visit http://creativecommons.org/licenses/by/4.0/.
RESEARCH
Shi and Feng EURASIP J. Adv. Signal Process. (2021) 2021:102 https://doi.org/10.1186/s13634‑021‑00811‑w
EURASIP Journal on Advancesin Signal Processing
*Correspondence: [email protected] College of Energy and Mining Engineering, Shandong University of Science and Technology, Qingdao 266590, Shandong, China
Page 2 of 18Shi and Feng EURASIP J. Adv. Signal Process. (2021) 2021:102
gases such as CO2 emitted into the atmosphere by human beings in the process of social and economic development is the main cause of global warming. The Inter-governmental Panel on Climate Change (IPCC) in its global climate change assess-ment report released in 2013 believes that global warming is unquestionable, and that climate warming is even more severe than previously expected, with more than 95%. The certainty that climate change is caused by human activities. Global warming has produced a series of abnormal climate problems, which have put tremendous pres-sure on ecological security, food security, water resources security, etc., which has made the ecological environment on which we depend for survival increasingly dete-riorating, and has seriously threatened the sustainable development of human society ability. According to the IPCC’s Special Report on Emission Scenarios (SRES), global sea levels will rise by an average of 22–34 cm from 1990 to the 1980s. Some island countries in the Pacific will be submerged by then, and coastal metropolises such as New York and Shanghai are also facing the threat of being swallowed up by the sea.
My country is the largest developing country in the world. With the rapid devel-opment of industry and the large-scale use of coal-based fossil energy, my country has also become a major carbon emitter. According to statistics, in the early 1990s, my country’s total fossil energy consumption became the second largest consumer after the USA. By 2010, my country surpassed the USA to become the world’s largest energy consumer. According to data from the Oslo International Center for Climate and Environmental Research (CICERO), China’s cumulative carbon dioxide emissions will reach 146.4 billion tons in 2016, surpassing the 146.2 billion tons in the USA, making it the first place. Therefore, my country plays a pivotal role in solving global climate problems and implementing emission reduction measures. The continuous development of social economy has driven the rapid development of the transpor-tation industry, and at the same time, it has also increased the environmental pol-lution caused by energy consumption in transportation and industrial production. Therefore, it is difficult to reconcile the industrial development based on traditional technology and energy conservation and emission reduction contradiction. Only by comprehensively analyzing the characteristics of changes in carbon emissions in vari-ous industries in our country can we reduce my country’s carbon emissions from the source and thereby alleviate the pressure on my country’s carbon emissions.
In recent years, the problem of multiple objective optimization has gradually attracted the attention of researchers and has become a hot and difficult problem. Among them, how to make full use of effective information in existing knowledge to predict the dominance of individuals Relationship is the key issue. To address this difficulty, researchers have merged the ideas of data mining into evolutionary algo-rithms and merged them into the ideas of data mining. The process of finding the best solution in the field of decision making is in fact the process of data mining. Data mining refers to the use of computer methods, including technical and statisti-cal knowledge, to obtain knowledge and information with potential use value from a large amount of noisy and ambiguous data information. Today, data mining technol-ogy has been widely used in the fields of artificial intelligence and experience, and is receiving more and more attention from researchers. However, the application of data
Page 3 of 18Shi and Feng EURASIP J. Adv. Signal Process. (2021) 2021:102
mining to evolutionary arithmetic to solve the flaws of evolutionary algorithms is still in its infancy [1]. In the early stages, it has great potential.
Zhou et al. used numerical analysis to analyze the driving factors of carbon emissions from energy consumption in industry and transportation, and discussed the measures taken by my country to reduce carbon emissions from energy consumption, but his research did not extend to other industries [2]. Dieye uses the LEAP model to predict the steel, building materials, chemical, non-ferrous, power, coal, and high-growth industries in Henan Province under five scenarios: the benchmark scenario, the industrial structure optimization scenario, the energy efficiency improvement scenario, the energy structure adjustment scenario, and the comprehensive scenario. Carbon emissions, the results show that the comprehensive scenario is the optimal development model for industrial carbon emissions peaking in Henan Province, and industrial carbon emissions will peak in 2025, with a peak of 517 million tons. However, he did not do further research on how to apply the province’s industrial carbon emission model to the whole country [3]. Reynard D et al. studied the carbon dioxide emissions of China, the USA, Germany, and Switzerland through the time series GM model and on the basis of environmental eco-logical economics. Combined with the historical data of global carbon dioxide emissions in 2000, they obtained economic growth, population size; the process of urbanization promotes the increase of carbon dioxide emissions, so he added the influencing factor of urbanization rate in the STIRPAT prediction model to predict future carbon dioxide emissions. However, his research is quite limited. It does not distinguish the difference between developing countries and developed countries, and there is no set of general rules and experience summaries [4].
The innovations of this paper are: (1) the interval multi-objective optimization method is used to simplify the method of screening data samples, making the algorithm work easier. (2) Data collection is from 2000 to 2015, which is also the fifteen years of rapid development of my country’s industrialization and modernization, which is symbolic. Based on this, it is more convincing to make carbon peak prediction research. (3) The introduction of the decoupling index model of industrial carbon emissions makes the content of the article more substantial and specific.
2 Method of carbon emission factor decomposition and carbon peak prediction based on multi‑objective decision and information fusion processing
2.1 Total industrial carbon emissions and carbon emissions intensity
Industrial carbon emissions mainly come from the consumption of fossil energy [5]. Commonly used carbon emission accounting methods include actual measurement method [6], material balance algorithm and coefficient method [7]. The actual measure-ment method is to calculate the total carbon emissions by measuring the flow rate [8], velocity and concentration of the exhaust gas through the instruments and facilities rec-ognized by the relevant departments. The material balance algorithm is based on the law of conservation of material [9], which quantitatively analyzes the amount of material used in the energy consumption process or the production process to calculate carbon emissions [10]. It is divided into a material balance algorithm based on the production department and a material balance algorithm based on carbon source energy [11]. The
Page 4 of 18Shi and Feng EURASIP J. Adv. Signal Process. (2021) 2021:102
coefficient method is divided into the coefficient method based on the production field and the coefficient method based on fossil energy [12]. The coefficient method based on the production field refers to the calculation of the total carbon emissions by calculating the average value of the carbon emissions produced by the production unit product or the unit energy consumption under the general technical and economic management conditions [13]. The coefficient method based on fossil energy obtains the carbon emis-sion coefficient of various energy sources according to different countries or regions [14], different energy structures and technological levels, and the sum of the products of standard coal consumption and oxidation rate converted to various energy sources is the carbon emission Total amount [15]. Due to specific issues, it is difficult to obtain the energy consumption data of the counties and districts at the municipal level, and it is impossible to directly calculate the industrial carbon emissions of the counties and districts based on the coefficient method based on fossil energy [16]. Studies have shown that industrial added value is positively correlated with industrial carbon emissions [17]. Therefore, in this paper, according to the proportion of the industrial added value of each county in the city’s industrial added value, the total industrial carbon emissions are proportionally allocated to obtain the industrial carbon emissions of each county [18].
2.2 Low‑carbon economic theory
Since the 1990s, scholars have gradually paid attention to the issue of carbon dioxide emissions [19], trying to explore the relationship between economic development and carbon dioxide emissions by consulting relevant literature and empirical research [20]. With the deepening of research, scholars at home and abroad generally believe that eco-nomic growth plays a positive role in driving carbon dioxide emissions [21], and rapid economic growth has brought about continuous increases in carbon dioxide emissions [22]. Therefore, researchers must pay attention to the issue of carbon emission reduction while developing the economy and the theory of low-carbon economy came into being [23].
The concept of "low-carbon economy" first appeared in the energy white paper "The Future of Our Energy: Creating a Low-Carbon Economy" published in the United King-dom [24]. The book states that economic development should focus on ecological and environmental protection, instead of using a large amount of energy consumption and carbon dioxide emissions. In exchange for economic growth [25], it is necessary to change the economic growth mode based on fossil fuels such as coal and use more clean energy such as solar energy, wind energy, and tidal energy. This economic growth model of "low energy consumption, low pollution, low emissions" and "high efficiency, high effi-ciency, and high efficiency" three lows and three highs has attracted global attention and attention.
Low-carbon economy is based on a variety of means such as technological progress, industrial transformation, institutional innovation, and new energy development to form a series of economic forms such as low-carbon industry, low-carbon life, low-carbon energy, low-carbon technology, and low-carbon development. Change the mode of economic development to obtain more economic output with less energy use and lower carbon dioxide emissions. The development of a low-carbon economy does not mean not developing or developing at the expense of the economy, but to achieve
Page 5 of 18Shi and Feng EURASIP J. Adv. Signal Process. (2021) 2021:102
a harmonious unity of economy, society, and ecology through a change in the concept of development [26].
From a policy perspective, although my country’s current carbon intensity policy helps curb the growth of carbon emissions; it is far from enough to achieve the peak of carbon dioxide emissions. He Jiankun, deputy director of the National Commit-tee of Experts on Climate Change, believes that in 2030, the target carbon intensity of a relative decline in GDP can be measured by the decline in China’s carbon diox-ide emissions. This is also determined by the characteristics of my country’s current industrialization and urbanization, and now we are in during the period of sustained rapid economic growth, energy demand and carbon dioxide emissions will continue to grow for a long period of time. A relative decline in GDP is a necessary condition to ensure sustained and stable economic development, but carbon emission reduction policies need to be further strengthened. So as to vigorously promote the extensive promotion of energy conservation and emission reduction [27].
2.3 Overview of interval multi‑objective optimization problems
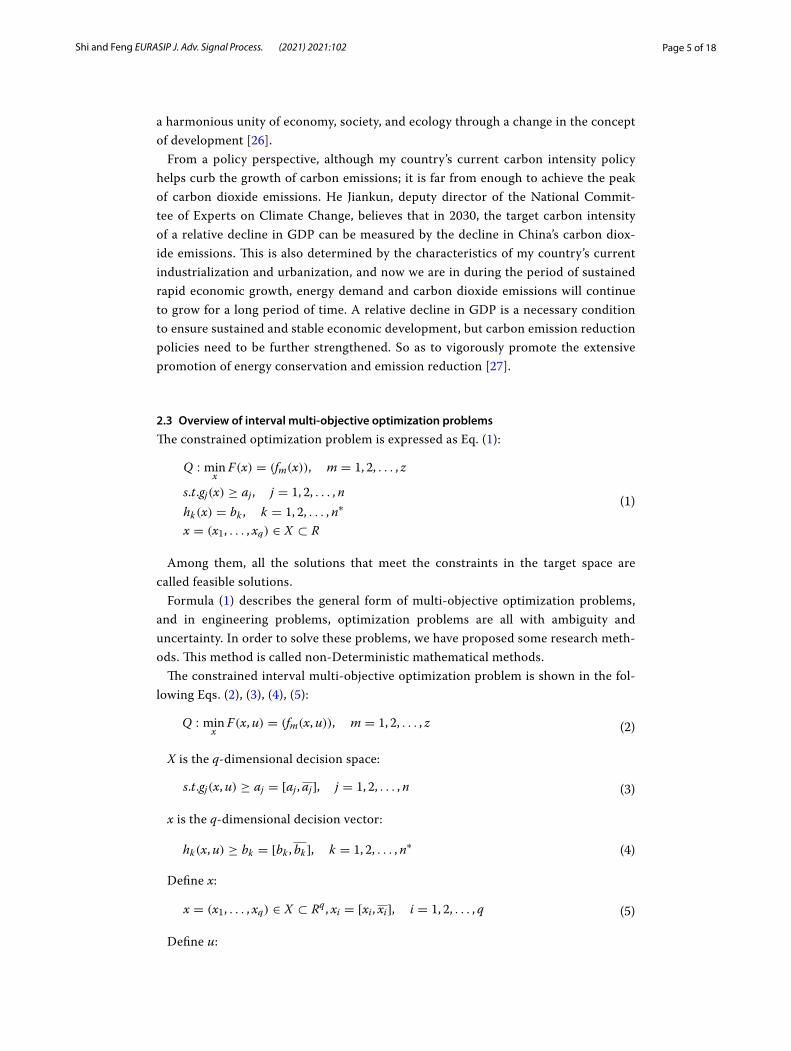
The constrained optimization problem is expressed as Eq. (1):
Among them, all the solutions that meet the constraints in the target space are called feasible solutions.
Formula (1) describes the general form of multi-objective optimization problems, and in engineering problems, optimization problems are all with ambiguity and uncertainty. In order to solve these problems, we have proposed some research meth-ods. This method is called non-Deterministic mathematical methods.
The constrained interval multi-objective optimization problem is shown in the fol-lowing Eqs. (2), (3), (4), (5):
X is the q-dimensional decision space:
x is the q-dimensional decision vector:
Define x:
Define u:
(1)
Q : minx
F(x) = (fm(x)), m = 1, 2, . . . , z
s.t.gj(x) ≥ aj , j = 1, 2, . . . , n
hk(x) = bk , k = 1, 2, . . . , n∗
x = (x1, . . . , xq) ∈ X ⊂ R
(2)Q : minx
F(x,u) = (fm(x,u)), m = 1, 2, . . . , z
(3)s.t.gj(x,u) ≥ aj = [aj , aj], j = 1, 2, . . . , n
(4)hk(x,u) ≥ bk = [bk , bk ], k = 1, 2, . . . , n∗
(5)x = (x1, . . . , xq) ∈ X ⊂ Rq, xi = [xi, xi], i = 1, 2, . . . , q
Page 6 of 18Shi and Feng EURASIP J. Adv. Signal Process. (2021) 2021:102
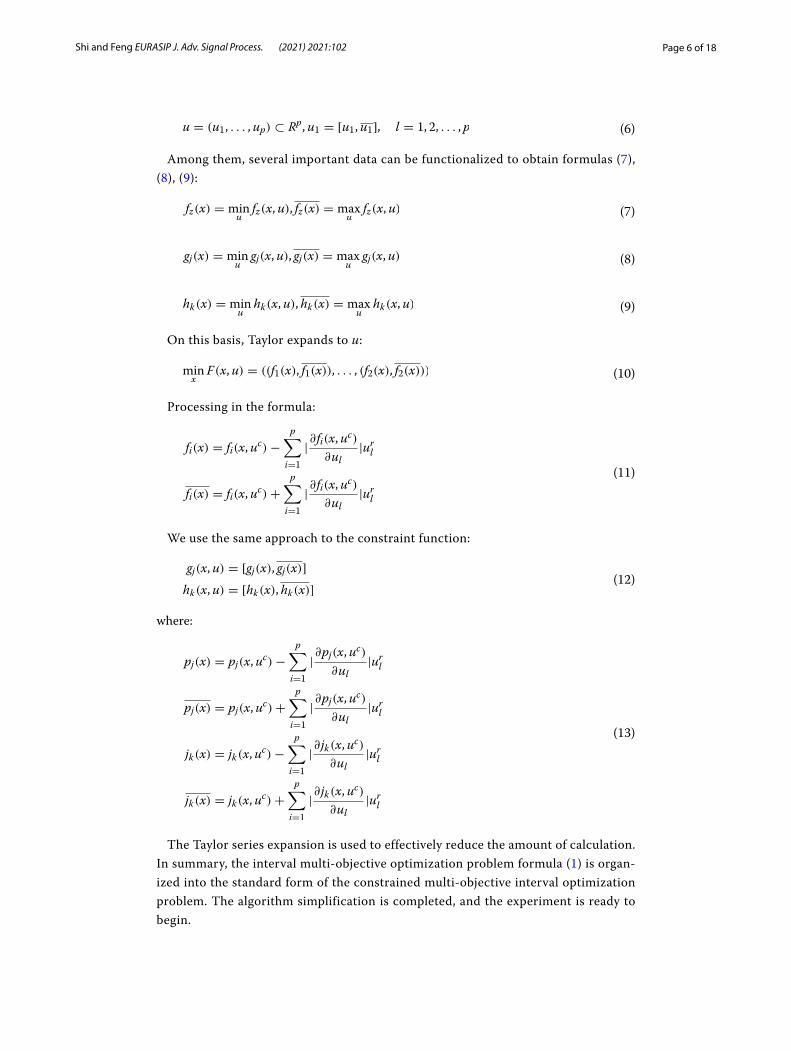
Among them, several important data can be functionalized to obtain formulas (7), (8), (9):
On this basis, Taylor expands to u:
Processing in the formula:
We use the same approach to the constraint function:
where:
The Taylor series expansion is used to effectively reduce the amount of calculation. In summary, the interval multi-objective optimization problem formula (1) is organ-ized into the standard form of the constrained multi-objective interval optimization problem. The algorithm simplification is completed, and the experiment is ready to begin.
(6)u = (u1, . . . ,up) ⊂ Rp,u1 = [u1,u1], l = 1, 2, . . . , p
(7)fz(x) = minu
fz(x,u), fz(x) = maxu
fz(x,u)
(8)gj(x) = minu
gj(x,u), gj(x) = maxu
gj(x,u)
(9)hk(x) = minu
hk(x,u), hk(x) = maxu
hk(x,u)
(10)minx
F(x,u) = ((f1(x), f1(x)), . . . , (f2(x), f2(x)))
(11)
fi(x) = fi(x,uc)−
p∑
i=1
|∂fi(x,u
c)
∂ul|url
fi(x) = fi(x,uc)+
p∑
i=1
|∂fi(x,u
c)
∂ul|url
(12)gj(x,u) = [gj(x), gj(x)]
hk(x,u) = [hk(x), hk(x)]
(13)
pj(x) = pj(x,uc)−
p∑
i=1
|∂pj(x,u
c)
∂ul|url
pj(x) = pj(x,uc)+
p∑
i=1
|∂pj(x,u
c)
∂ul|url
jk(x) = jk(x,uc)−
p∑
i=1
|∂ jk(x,u
c)
∂ul|url
jk(x) = jk(x,uc)+
p∑
i=1
|∂ jk(x,u
c)
∂ul|url
Page 7 of 18Shi and Feng EURASIP J. Adv. Signal Process. (2021) 2021:102
3 Methods/experimental section3.1 Data sources and model construction
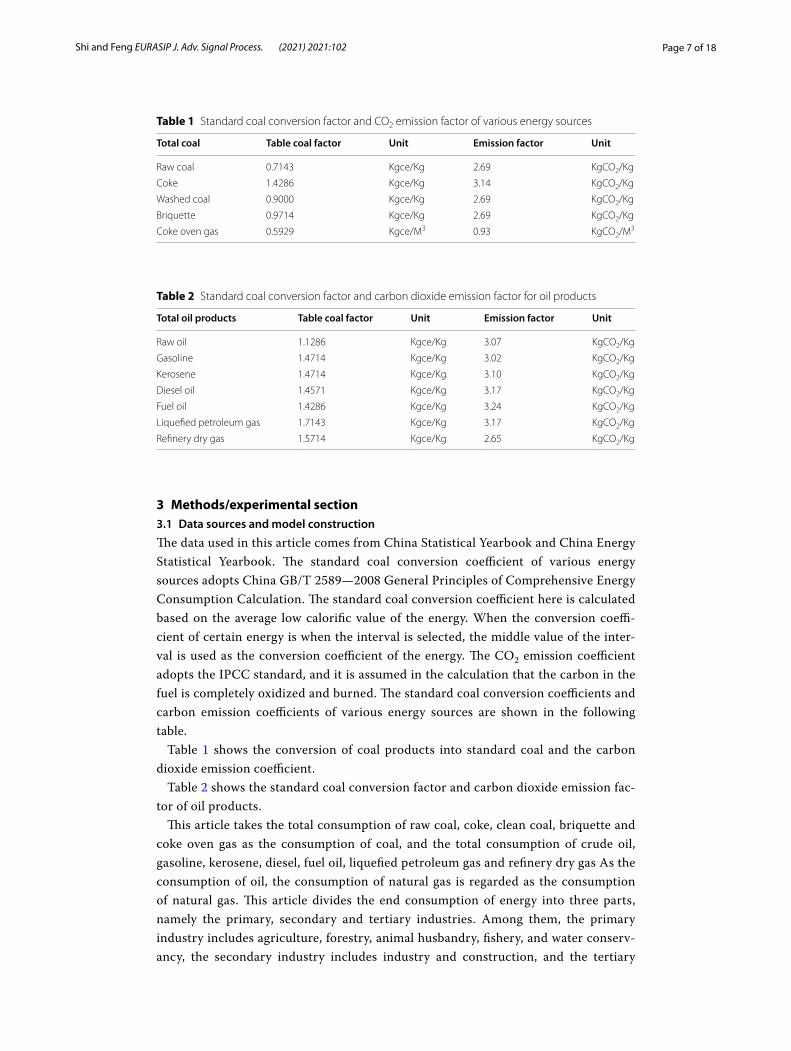
The data used in this article comes from China Statistical Yearbook and China Energy Statistical Yearbook. The standard coal conversion coefficient of various energy sources adopts China GB/T 2589—2008 General Principles of Comprehensive Energy Consumption Calculation. The standard coal conversion coefficient here is calculated based on the average low calorific value of the energy. When the conversion coeffi-cient of certain energy is when the interval is selected, the middle value of the inter-val is used as the conversion coefficient of the energy. The CO2 emission coefficient adopts the IPCC standard, and it is assumed in the calculation that the carbon in the fuel is completely oxidized and burned. The standard coal conversion coefficients and carbon emission coefficients of various energy sources are shown in the following table.
Table 1 shows the conversion of coal products into standard coal and the carbon dioxide emission coefficient.
Table 2 shows the standard coal conversion factor and carbon dioxide emission fac-tor of oil products.
This article takes the total consumption of raw coal, coke, clean coal, briquette and coke oven gas as the consumption of coal, and the total consumption of crude oil, gasoline, kerosene, diesel, fuel oil, liquefied petroleum gas and refinery dry gas As the consumption of oil, the consumption of natural gas is regarded as the consumption of natural gas. This article divides the end consumption of energy into three parts, namely the primary, secondary and tertiary industries. Among them, the primary industry includes agriculture, forestry, animal husbandry, fishery, and water conserv-ancy, the secondary industry includes industry and construction, and the tertiary
Table 1 Standard coal conversion factor and CO2 emission factor of various energy sources
Total coal Table coal factor Unit Emission factor Unit
Raw coal 0.7143 Kgce/Kg 2.69 KgCO2/Kg
Coke 1.4286 Kgce/Kg 3.14 KgCO2/Kg
Washed coal 0.9000 Kgce/Kg 2.69 KgCO2/Kg
Briquette 0.9714 Kgce/Kg 2.69 KgCO2/Kg
Coke oven gas 0.5929 Kgce/M3 0.93 KgCO2/M3
Table 2 Standard coal conversion factor and carbon dioxide emission factor for oil products
Total oil products Table coal factor Unit Emission factor Unit
Raw oil 1.1286 Kgce/Kg 3.07 KgCO2/Kg
Gasoline 1.4714 Kgce/Kg 3.02 KgCO2/Kg
Kerosene 1.4714 Kgce/Kg 3.10 KgCO2/Kg
Diesel oil 1.4571 Kgce/Kg 3.17 KgCO2/Kg
Fuel oil 1.4286 Kgce/Kg 3.24 KgCO2/Kg
Liquefied petroleum gas 1.7143 Kgce/Kg 3.17 KgCO2/Kg
Refinery dry gas 1.5714 Kgce/Kg 2.65 KgCO2/Kg
Page 8 of 18Shi and Feng EURASIP J. Adv. Signal Process. (2021) 2021:102
industry includes transportation, storage and postal services, wholesale, retail and accommodation, and catering.
3.2 Change trend of carbon emissions
From 2000 to 2013, China’s energy carbon emissions maintained rapid growth at an average annual rate of 8.6%. As of 2013, China’s energy carbon emissions reached 103, 5176 million tons. However, energy carbon emissions have declined in 2014 and 2015. This decline can be attributed to the decline in coal consumption caused by the gov-ernment’s reduction of coal production capacity. The increase in oil and natural gas consumption cannot compensate for the reduction in coal consumption. Vacancy. How-ever, China’s energy consumption is still rising. After reaching the lowest growth rate in 2015, the energy consumption growth rate in 2016 began to rise again. It is expected that the energy consumption growth rate in 2017 will be higher than that in 2016. The reduction of energy carbon emissions can be regarded as a short-term situation caused by the impact of the government’s coal de-capacity policy. China’s energy carbon emis-sion peak has not arrived. As the effect of the de-capacity policy gradually weakens and the consumption of oil and natural gas continues to grow, China’s energy carbon emis-sions will regain the momentum of growth. In terms of the contribution of the three energy sources to energy carbon emissions, the contribution of coal consumption to car-bon emissions is the highest, with an average contribution of 80% over the past 16 years, followed by the contribution of oil consumption to carbon emissions, and the average contribution over the past 16 years. At 17%, the contribution of natural gas consump-tion to carbon emissions is the lowest, with an average contribution of 3% in 16 years; in terms of the changing trend of the contribution of the three energy sources to energy carbon emissions, the contribution of coal consumption to carbon emissions shows an increase first and then a decrease The contribution of petroleum consumption carbon emissions shows a trend of first decreasing and then increasing, while the contribution of natural gas consumption carbon emissions presents a consistent growth trend. On the whole, the current coal carbon emissions basically determine energy carbon emissions, but this the degree of determination is gradually decreasing, and the influence of future oil and natural gas consumption on the development trend of energy carbon emissions will gradually increase. China’s energy carbon emissions from 2000 to 2015 are shown in Fig. 1 below.
3.3 Determination of influencing factors
The STIRPAT model is further expanded according to the industrial status quo of the selected sample city A. The three indicators of population size, wealth, and technical level in the model are expanded into population indicators, wealth indicators, techni-cal indicators, and structural indicators. Based on these four indicators, the influenc-ing factors of city A’s industrial carbon emissions are determined. Among them, (1) the population index is the total population. Due to the growth of urban population, the demand for energy is increasing, and energy consumption leads to the continu-ous increase of carbon emissions. Therefore, it is of practical significance to select the total population as the influencing factor of industrial carbon emissions in City A. (2) Wealth indicators choose labor productivity and industrialization rate. Rapid

Page 9 of 18Shi and Feng EURASIP J. Adv. Signal Process. (2021) 2021:102
economic development has led to an increase in energy demand. As a heavy indus-try base, industrial processes consume a lot of energy, which makes industrial car-bon emissions increase sharply. Therefore, labor productivity and industrialization rate are selected. The factors are typical and representative; (3) technical indicators select industrial energy intensity and technical level. Industrial energy intensity refers to the energy consumed per unit of industrial added value. Industrial energy intensity is mainly affected by technology, especially equipment, equipment, and technological level. Therefore, the improvement and improvement of technical level have an impact on energy consumption per unit of industrial added value. Reduction plays a certain role, and then has an impact on industrial carbon emissions; the number of industrial and mining enterprise patent authorizations is a sign of the level of industrial technol-ogy, and also has a relationship with industrial carbon emissions, so the model uses the number of industrial and mining enterprise patent authorizations to represent the technical level; (4) structural indicators include industrial structure factors and energy structure factors. Three factors including industrial light and heavy structure, enterprise scale, and industrial energy structure are selected, respectively. Industrial light and heavy structure and enterprise scale can reflect the industrial characteristics of City A, and changes in the proportion of different types of energy consumption also have an important impact on industrial carbon emissions. The state and local governments encourage the use of clean energy, such as hydropower, solar energy, photovoltaics, etc., and use as little fossil energy as possible, such as coal, oil and other non-clean energy sources with large carbon emissions. At present, the indus-trial energy consumption structure of City A is still dominated by oil and coal. Com-pared with coal, the carbon emission coefficient of the two is much greater than that of oil. Therefore, this paper selects the proportion of coal consumption in primary energy consumption to reflect the impact of energy structure on industrial carbon
Fig. 1 China’s energy carbon emissions from 2000 to 2015

Page 10 of 18Shi and Feng EURASIP J. Adv. Signal Process. (2021) 2021:102
the impact of emissions. In order to more accurately reflect the relationship between various factors and industrial carbon emissions, the industrial added value was used to replace the total industrial output value of Lanzhou in the calculation process.
For uncertain optimization problems, one way of thinking is to first transform uncertain optimization problems into deterministic optimization problems through mathematical methods. Then solve it, but this method will lose some information in the process of solving; another way of thinking is to directly solve the uncertain opti-mization problem. This paper adopts the second method to directly solve the large number of uncertain factors in the analysis of industrial carbon emission factors using cloud computing to obtain the accuracy of the problem analysis.
In summary, this article decomposes the industrial carbon emission factors of City A into 8 items: total population, labor productivity, industrialization rate, industrial energy intensity, industrial energy structure, industrial light and heavy structure, enterprise scale, and technical level. The specific settings are shown in Table 3 shown.
3.4 Abbreviations
In order to be more detailed and complete in the selection of factors the technologi-cal level in the STIRPAT model is innovatively decomposed into two parts: Technical indicators and structural indicators taking into account the impact of technologi-cal progress industrial structure and energy structure factors on industrial carbon emissions
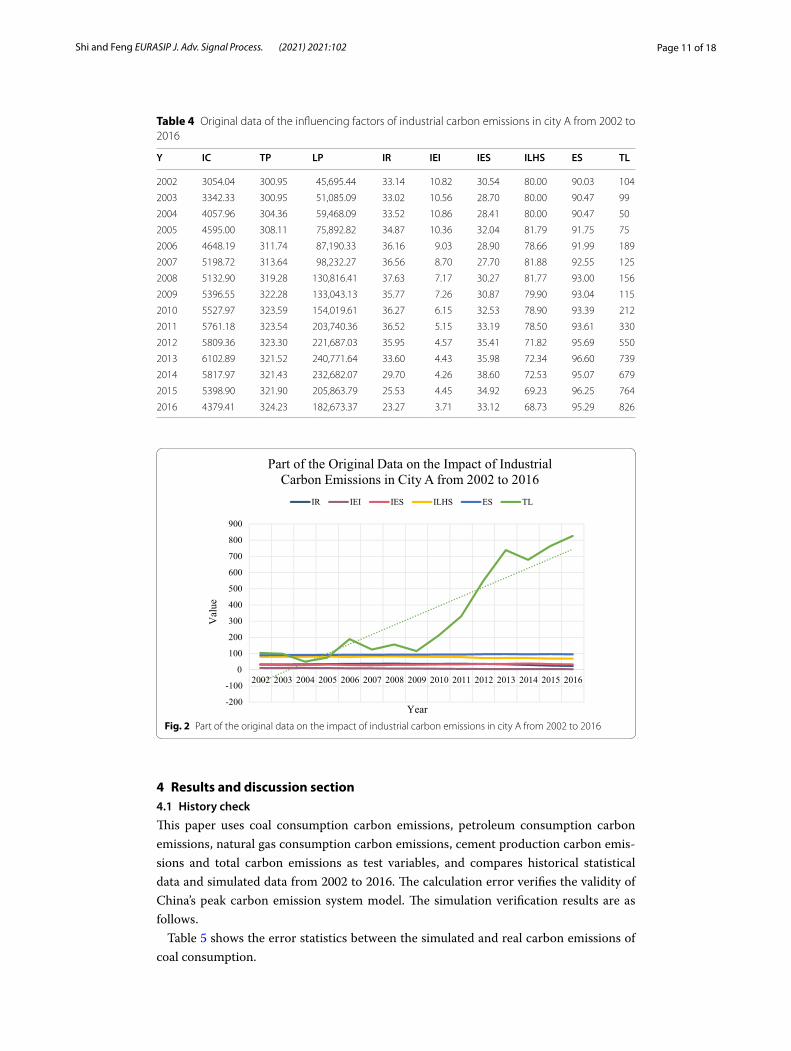
Where Y is the year, IC is the industrial carbon emissions, TP is the total popula-tion, LP is the labor productivity, IR is the industrialization rate, IEI is the industrial energy intensity, IES is the industrial energy structure, ILHS is the industrial light and heavy structure, and ES is the scale of the enterprise. TL stands for technical level. The values of various factors from 2002 to 2016 are shown in Table 4.
Figure 2 is made after statistics of some data as shown in the figure.
Table 3 Setting of factors affecting industrial carbon emissions in city A
Variable Definition Unit
Industrial carbon emissions CO2 emissions from industrial energy consumption Ten thousand tons
Population Total people Ten thousand people
Labor productivity Industrial added value/number of employees Yuan/per people
Industrialization rate Industrial value Added/gross product %
Industrial energy intensity Industrial energy consumption/industrial added value
Tons of standard coal/ten thousand yuan
Industrial energy structure Industrial coal consumption/industrial primary energy consumption
%
Industrial light and heavy structure Heavy industry added value/industrial added value %
Enterprise size Value added of industrial enterprises above desig-nated size/industrial added value
%
Technique level Number of patents granted by industrial and mining enterprises
Item
Page 11 of 18Shi and Feng EURASIP J. Adv. Signal Process. (2021) 2021:102
4 Results and discussion section4.1 History check
This paper uses coal consumption carbon emissions, petroleum consumption carbon emissions, natural gas consumption carbon emissions, cement production carbon emis-sions and total carbon emissions as test variables, and compares historical statistical data and simulated data from 2002 to 2016. The calculation error verifies the validity of China’s peak carbon emission system model. The simulation verification results are as follows.
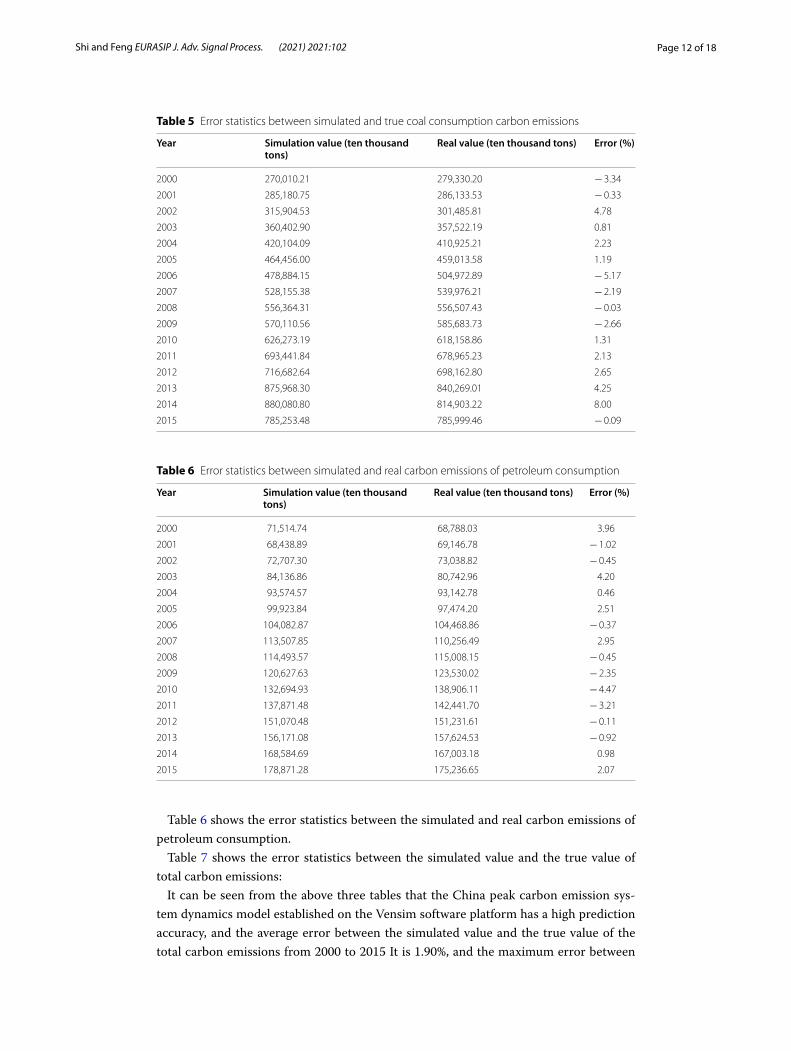
Table 5 shows the error statistics between the simulated and real carbon emissions of coal consumption.
Table 4 Original data of the influencing factors of industrial carbon emissions in city A from 2002 to 2016
Y IC TP LP IR IEI IES ILHS ES TL
2002 3054.04 300.95 45,695.44 33.14 10.82 30.54 80.00 90.03 104
2003 3342.33 300.95 51,085.09 33.02 10.56 28.70 80.00 90.47 99
2004 4057.96 304.36 59,468.09 33.52 10.86 28.41 80.00 90.47 50
2005 4595.00 308.11 75,892.82 34.87 10.36 32.04 81.79 91.75 75
2006 4648.19 311.74 87,190.33 36.16 9.03 28.90 78.66 91.99 189
2007 5198.72 313.64 98,232.27 36.56 8.70 27.70 81.88 92.55 125
2008 5132.90 319.28 130,816.41 37.63 7.17 30.27 81.77 93.00 156
2009 5396.55 322.28 133,043.13 35.77 7.26 30.87 79.90 93.04 115
2010 5527.97 323.59 154,019.61 36.27 6.15 32.53 78.90 93.39 212
2011 5761.18 323.54 203,740.36 36.52 5.15 33.19 78.50 93.61 330
2012 5809.36 323.30 221,687.03 35.95 4.57 35.41 71.82 95.69 550
2013 6102.89 321.52 240,771.64 33.60 4.43 35.98 72.34 96.60 739
2014 5817.97 321.43 232,682.07 29.70 4.26 38.60 72.53 95.07 679
2015 5398.90 321.90 205,863.79 25.53 4.45 34.92 69.23 96.25 764
2016 4379.41 324.23 182,673.37 23.27 3.71 33.12 68.73 95.29 826
-200
-100
0
100
200
300
400
500
600
700
800
900
2002 2003 2004 2005 2006 2007 2008 2009 2010 2011 2012 2013 2014 2015 2016
Val
ue
Year
Part of the Original Data on the Impact of Industrial Carbon Emissions in City A from 2002 to 2016
IR IEI IES ILHS ES TL
Fig. 2 Part of the original data on the impact of industrial carbon emissions in city A from 2002 to 2016
Page 12 of 18Shi and Feng EURASIP J. Adv. Signal Process. (2021) 2021:102
Table 6 shows the error statistics between the simulated and real carbon emissions of petroleum consumption.
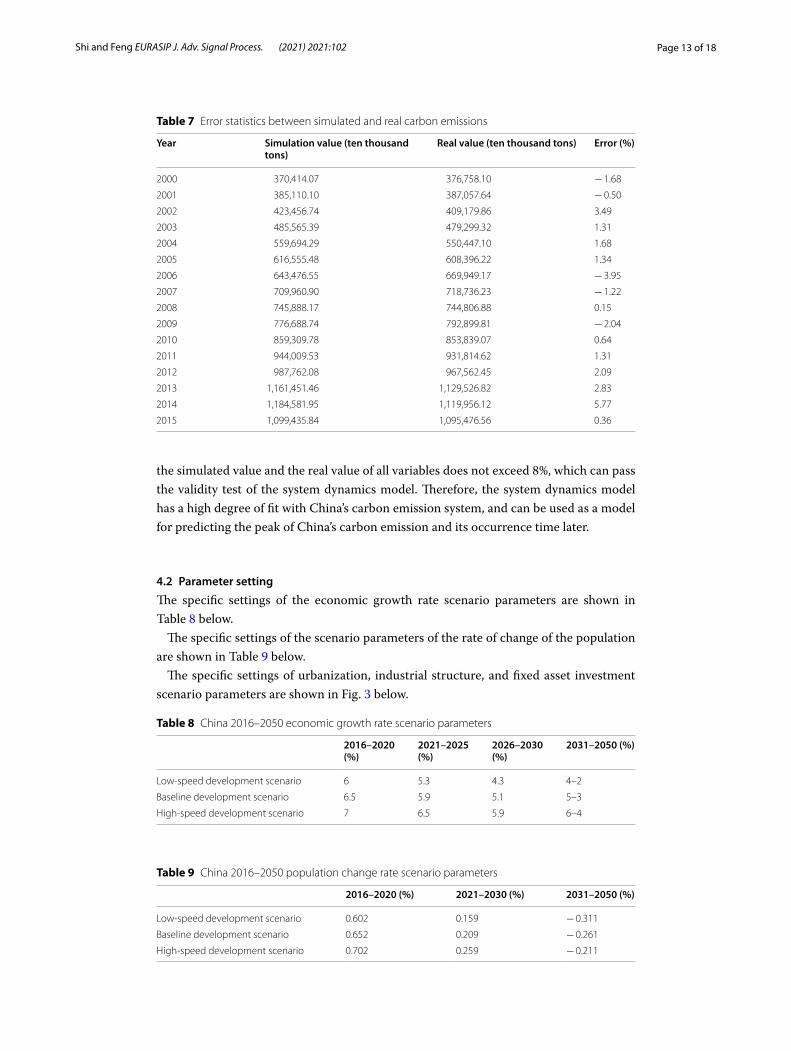
Table 7 shows the error statistics between the simulated value and the true value of total carbon emissions:
It can be seen from the above three tables that the China peak carbon emission sys-tem dynamics model established on the Vensim software platform has a high prediction accuracy, and the average error between the simulated value and the true value of the total carbon emissions from 2000 to 2015 It is 1.90%, and the maximum error between
Table 5 Error statistics between simulated and true coal consumption carbon emissions
Year Simulation value (ten thousand tons)
Real value (ten thousand tons) Error (%)
2000 270,010.21 279,330.20 − 3.34
2001 285,180.75 286,133.53 − 0.33
2002 315,904.53 301,485.81 4.78
2003 360,402.90 357,522.19 0.81
2004 420,104.09 410,925.21 2.23
2005 464,456.00 459,013.58 1.19
2006 478,884.15 504,972.89 − 5.17
2007 528,155.38 539,976.21 − 2.19
2008 556,364.31 556,507.43 − 0.03
2009 570,110.56 585,683.73 − 2.66
2010 626,273.19 618,158.86 1.31
2011 693,441.84 678,965.23 2.13
2012 716,682.64 698,162.80 2.65
2013 875,968.30 840,269.01 4.25
2014 880,080.80 814,903.22 8.00
2015 785,253.48 785,999.46 − 0.09
Table 6 Error statistics between simulated and real carbon emissions of petroleum consumption
Year Simulation value (ten thousand tons)
Real value (ten thousand tons) Error (%)
2000 71,514.74 68,788.03 3.96
2001 68,438.89 69,146.78 − 1.02
2002 72,707.30 73,038.82 − 0.45
2003 84,136.86 80,742.96 4.20
2004 93,574.57 93,142.78 0.46
2005 99,923.84 97,474.20 2.51
2006 104,082.87 104,468.86 − 0.37
2007 113,507.85 110,256.49 2.95
2008 114,493.57 115,008.15 − 0.45
2009 120,627.63 123,530.02 − 2.35
2010 132,694.93 138,906.11 − 4.47
2011 137,871.48 142,441.70 − 3.21
2012 151,070.48 151,231.61 − 0.11
2013 156,171.08 157,624.53 − 0.92
2014 168,584.69 167,003.18 0.98
2015 178,871.28 175,236.65 2.07
Page 13 of 18Shi and Feng EURASIP J. Adv. Signal Process. (2021) 2021:102
the simulated value and the real value of all variables does not exceed 8%, which can pass the validity test of the system dynamics model. Therefore, the system dynamics model has a high degree of fit with China’s carbon emission system, and can be used as a model for predicting the peak of China’s carbon emission and its occurrence time later.
4.2 Parameter setting
The specific settings of the economic growth rate scenario parameters are shown in Table 8 below.
The specific settings of the scenario parameters of the rate of change of the population are shown in Table 9 below.
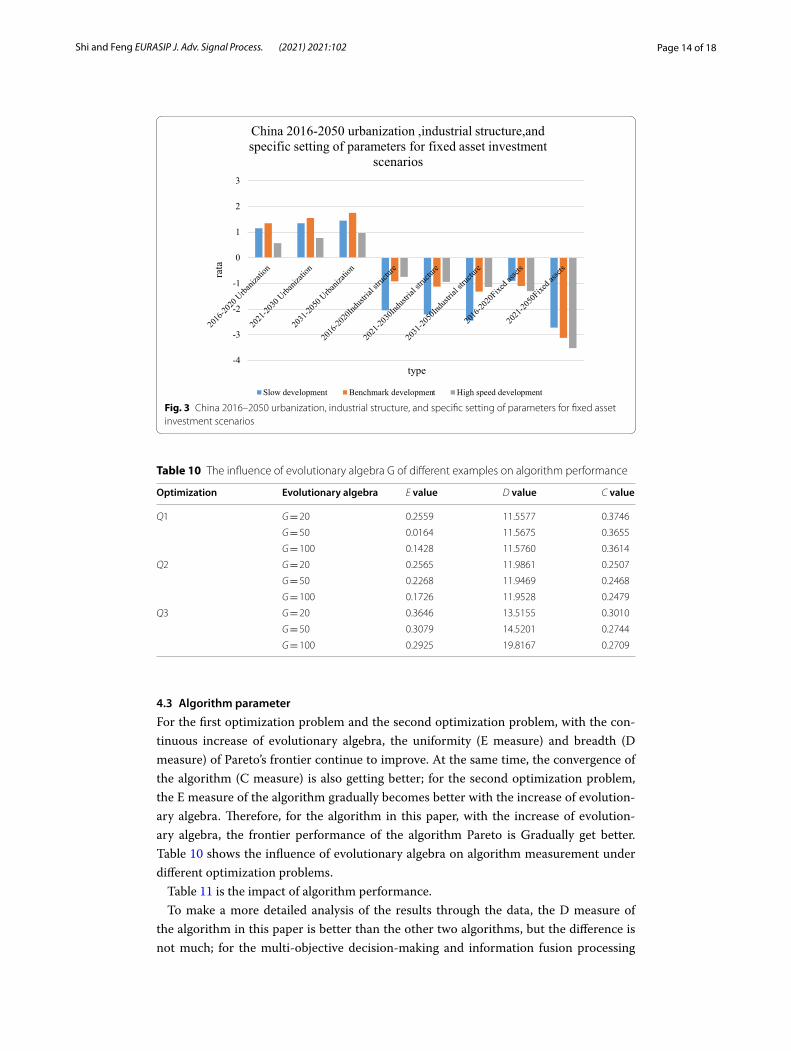
The specific settings of urbanization, industrial structure, and fixed asset investment scenario parameters are shown in Fig. 3 below.
Table 7 Error statistics between simulated and real carbon emissions
Year Simulation value (ten thousand tons)
Real value (ten thousand tons) Error (%)
2000 370,414.07 376,758.10 − 1.68
2001 385,110.10 387,057.64 − 0.50
2002 423,456.74 409,179.86 3.49
2003 485,565.39 479,299.32 1.31
2004 559,694.29 550,447.10 1.68
2005 616,555.48 608,396.22 1.34
2006 643,476.55 669,949.17 − 3.95
2007 709,960.90 718,736.23 − 1.22
2008 745,888.17 744,806.88 0.15
2009 776,688.74 792,899.81 − 2.04
2010 859,309.78 853,839.07 0.64
2011 944,009.53 931,814.62 1.31
2012 987,762.08 967,562.45 2.09
2013 1,161,451.46 1,129,526.82 2.83
2014 1,184,581.95 1,119,956.12 5.77
2015 1,099,435.84 1,095,476.56 0.36
Table 8 China 2016–2050 economic growth rate scenario parameters
2016–2020 (%)
2021–2025 (%)
2026–2030 (%)
2031–2050 (%)
Low-speed development scenario 6 5.3 4.3 4–2
Baseline development scenario 6.5 5.9 5.1 5–3
High-speed development scenario 7 6.5 5.9 6–4
Table 9 China 2016–2050 population change rate scenario parameters
2016–2020 (%) 2021–2030 (%) 2031–2050 (%)
Low-speed development scenario 0.602 0.159 − 0.311
Baseline development scenario 0.652 0.209 − 0.261
High-speed development scenario 0.702 0.259 − 0.211
Page 14 of 18Shi and Feng EURASIP J. Adv. Signal Process. (2021) 2021:102
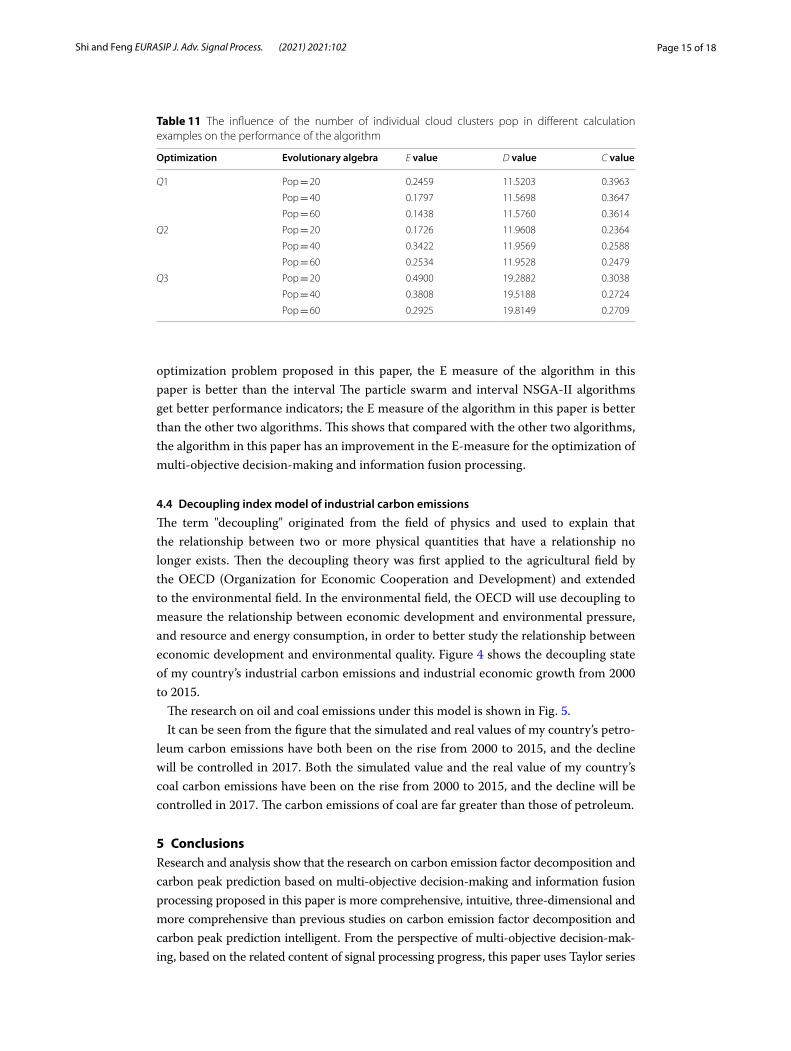
4.3 Algorithm parameter
For the first optimization problem and the second optimization problem, with the con-tinuous increase of evolutionary algebra, the uniformity (E measure) and breadth (D measure) of Pareto’s frontier continue to improve. At the same time, the convergence of the algorithm (C measure) is also getting better; for the second optimization problem, the E measure of the algorithm gradually becomes better with the increase of evolution-ary algebra. Therefore, for the algorithm in this paper, with the increase of evolution-ary algebra, the frontier performance of the algorithm Pareto is Gradually get better. Table 10 shows the influence of evolutionary algebra on algorithm measurement under different optimization problems.
Table 11 is the impact of algorithm performance.To make a more detailed analysis of the results through the data, the D measure of
the algorithm in this paper is better than the other two algorithms, but the difference is not much; for the multi-objective decision-making and information fusion processing
-4
-3
-2
-1
0
1
2
3
rata
type
China 2016-2050 urbanization ,industrial structure,and specific setting of parameters for fixed asset investment
scenarios
Slow development Benchmark development High speed development
Fig. 3 China 2016–2050 urbanization, industrial structure, and specific setting of parameters for fixed asset investment scenarios
Table 10 The influence of evolutionary algebra G of different examples on algorithm performance
Optimization Evolutionary algebra E value D value C value
Q1 G = 20 0.2559 11.5577 0.3746
G = 50 0.0164 11.5675 0.3655
G = 100 0.1428 11.5760 0.3614
Q2 G = 20 0.2565 11.9861 0.2507
G = 50 0.2268 11.9469 0.2468
G = 100 0.1726 11.9528 0.2479
Q3 G = 20 0.3646 13.5155 0.3010
G = 50 0.3079 14.5201 0.2744
G = 100 0.2925 19.8167 0.2709
Page 15 of 18Shi and Feng EURASIP J. Adv. Signal Process. (2021) 2021:102
optimization problem proposed in this paper, the E measure of the algorithm in this paper is better than the interval The particle swarm and interval NSGA-II algorithms get better performance indicators; the E measure of the algorithm in this paper is better than the other two algorithms. This shows that compared with the other two algorithms, the algorithm in this paper has an improvement in the E-measure for the optimization of multi-objective decision-making and information fusion processing.
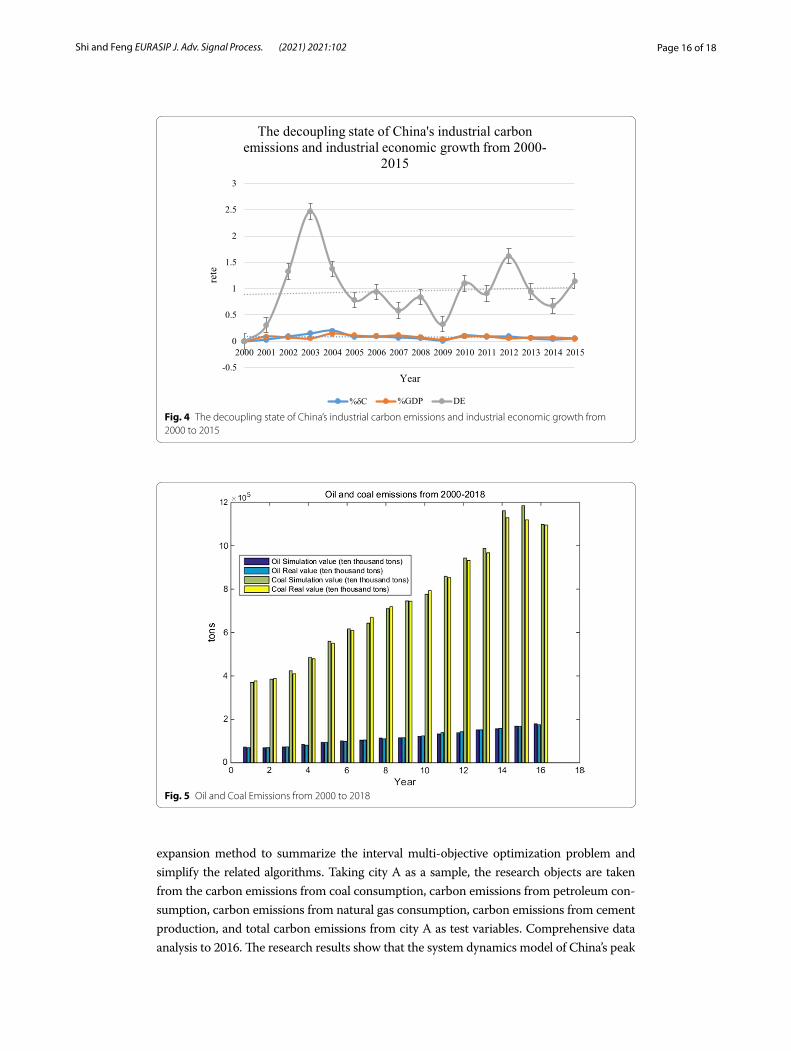
4.4 Decoupling index model of industrial carbon emissions
The term "decoupling" originated from the field of physics and used to explain that the relationship between two or more physical quantities that have a relationship no longer exists. Then the decoupling theory was first applied to the agricultural field by the OECD (Organization for Economic Cooperation and Development) and extended to the environmental field. In the environmental field, the OECD will use decoupling to measure the relationship between economic development and environmental pressure, and resource and energy consumption, in order to better study the relationship between economic development and environmental quality. Figure 4 shows the decoupling state of my country’s industrial carbon emissions and industrial economic growth from 2000 to 2015.
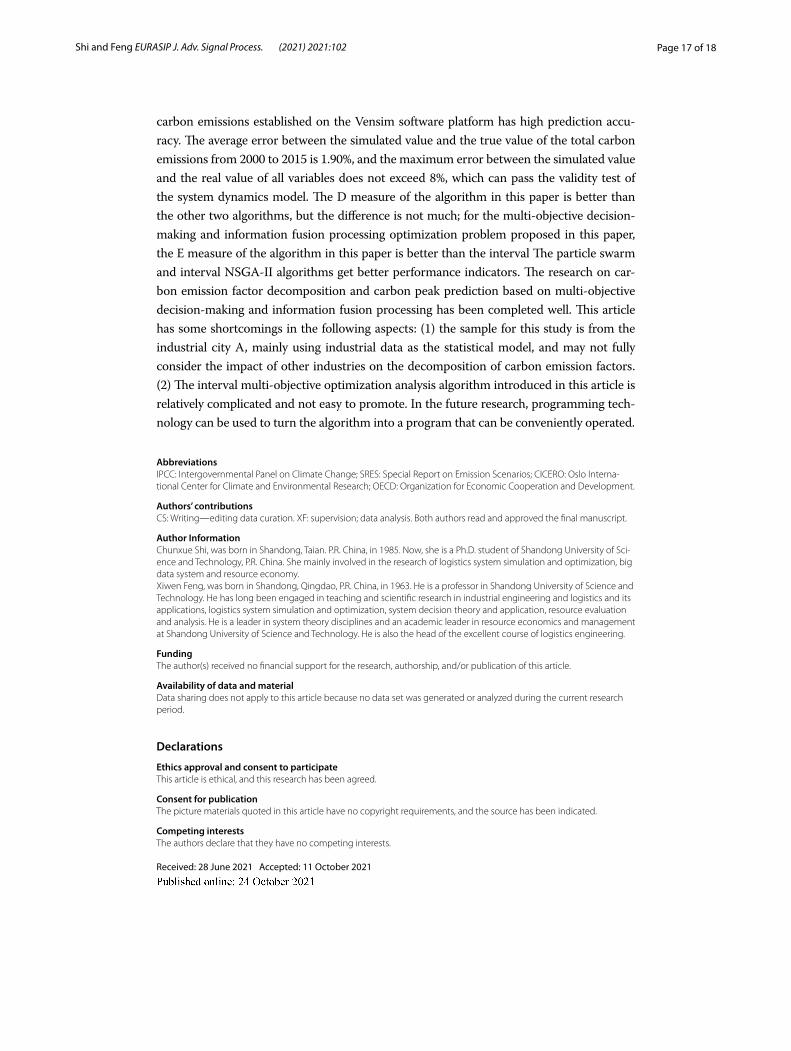
The research on oil and coal emissions under this model is shown in Fig. 5.It can be seen from the figure that the simulated and real values of my country’s petro-
leum carbon emissions have both been on the rise from 2000 to 2015, and the decline will be controlled in 2017. Both the simulated value and the real value of my country’s coal carbon emissions have been on the rise from 2000 to 2015, and the decline will be controlled in 2017. The carbon emissions of coal are far greater than those of petroleum.
5 ConclusionsResearch and analysis show that the research on carbon emission factor decomposition and carbon peak prediction based on multi-objective decision-making and information fusion processing proposed in this paper is more comprehensive, intuitive, three-dimensional and more comprehensive than previous studies on carbon emission factor decomposition and carbon peak prediction intelligent. From the perspective of multi-objective decision-mak-ing, based on the related content of signal processing progress, this paper uses Taylor series
Table 11 The influence of the number of individual cloud clusters pop in different calculation examples on the performance of the algorithm
Optimization Evolutionary algebra E value D value C value
Q1 Pop = 20 0.2459 11.5203 0.3963
Pop = 40 0.1797 11.5698 0.3647
Pop = 60 0.1438 11.5760 0.3614
Q2 Pop = 20 0.1726 11.9608 0.2364
Pop = 40 0.3422 11.9569 0.2588
Pop = 60 0.2534 11.9528 0.2479
Q3 Pop = 20 0.4900 19.2882 0.3038
Pop = 40 0.3808 19.5188 0.2724
Pop = 60 0.2925 19.8149 0.2709
Page 16 of 18Shi and Feng EURASIP J. Adv. Signal Process. (2021) 2021:102
expansion method to summarize the interval multi-objective optimization problem and simplify the related algorithms. Taking city A as a sample, the research objects are taken from the carbon emissions from coal consumption, carbon emissions from petroleum con-sumption, carbon emissions from natural gas consumption, carbon emissions from cement production, and total carbon emissions from city A as test variables. Comprehensive data analysis to 2016. The research results show that the system dynamics model of China’s peak
-0.5
0
0.5
1
1.5
2
2.5
3
2000 2001 2002 2003 2004 2005 2006 2007 2008 2009 2010 2011 2012 2013 2014 2015
rete
Year
The decoupling state of China's industrial carbon emissions and industrial economic growth from 2000-
2015
%δC %GDP DE
Fig. 4 The decoupling state of China’s industrial carbon emissions and industrial economic growth from 2000 to 2015
Fig. 5 Oil and Coal Emissions from 2000 to 2018
Page 17 of 18Shi and Feng EURASIP J. Adv. Signal Process. (2021) 2021:102
carbon emissions established on the Vensim software platform has high prediction accu-racy. The average error between the simulated value and the true value of the total carbon emissions from 2000 to 2015 is 1.90%, and the maximum error between the simulated value and the real value of all variables does not exceed 8%, which can pass the validity test of the system dynamics model. The D measure of the algorithm in this paper is better than the other two algorithms, but the difference is not much; for the multi-objective decision-making and information fusion processing optimization problem proposed in this paper, the E measure of the algorithm in this paper is better than the interval The particle swarm and interval NSGA-II algorithms get better performance indicators. The research on car-bon emission factor decomposition and carbon peak prediction based on multi-objective decision-making and information fusion processing has been completed well. This article has some shortcomings in the following aspects: (1) the sample for this study is from the industrial city A, mainly using industrial data as the statistical model, and may not fully consider the impact of other industries on the decomposition of carbon emission factors. (2) The interval multi-objective optimization analysis algorithm introduced in this article is relatively complicated and not easy to promote. In the future research, programming tech-nology can be used to turn the algorithm into a program that can be conveniently operated.
AbbreviationsIPCC: Intergovernmental Panel on Climate Change; SRES: Special Report on Emission Scenarios; CICERO: Oslo Interna-tional Center for Climate and Environmental Research; OECD: Organization for Economic Cooperation and Development.
Authors’ contributionsCS: Writing—editing data curation. XF: supervision; data analysis. Both authors read and approved the final manuscript.
Author InformationChunxue Shi, was born in Shandong, Taian. P.R. China, in 1985. Now, she is a Ph.D. student of Shandong University of Sci-ence and Technology, P.R. China. She mainly involved in the research of logistics system simulation and optimization, big data system and resource economy.Xiwen Feng, was born in Shandong, Qingdao, P.R. China, in 1963. He is a professor in Shandong University of Science and Technology. He has long been engaged in teaching and scientific research in industrial engineering and logistics and its applications, logistics system simulation and optimization, system decision theory and application, resource evaluation and analysis. He is a leader in system theory disciplines and an academic leader in resource economics and management at Shandong University of Science and Technology. He is also the head of the excellent course of logistics engineering.
FundingThe author(s) received no financial support for the research, authorship, and/or publication of this article.
Availability of data and materialData sharing does not apply to this article because no data set was generated or analyzed during the current research period.
Declarations
Ethics approval and consent to participateThis article is ethical, and this research has been agreed.
Consent for publicationThe picture materials quoted in this article have no copyright requirements, and the source has been indicated.
Competing interestsThe authors declare that they have no competing interests.
Received: 28 June 2021 Accepted: 11 October 2021
Page 18 of 18Shi and Feng EURASIP J. Adv. Signal Process. (2021) 2021:102
References 1. M. Zhou, Y. Long, W. Zhang et al., Adaptive genetic algorithm-aided neural network with channel state information
tensor decomposition for indoor localization. IEEE Trans. Evol. Comput. (2021). https:// doi. org/ 10. 1109/ TEVC. 2021. 30859 06
2. H. Zhou, Y. Zou, Y. Kuang et al., Analysis of the decomposition of factors affecting energy-related carbon emissions in Guangxi province, China. Indian J. Mar. Sci. 46(2), 229–244 (2017)
3. T. Dieye, K. Assigbetse, I. Diedhiou et al., The effect of Jatropha curcas L. leaf litter decomposition on soil carbon and nitrogen status and bacterial community structure (Senegal). J. Soil Sci. Environ. Manag. 7(3), 32–44 (2016)
4. D. Reynard, B. Nagar, H. Girault, Photonic flash synthesis of Mo2C/graphene electrocatalyst for the hydrogen evolu-tion reaction. ACS Catal. 11(9), 5865–5872 (2021)
5. L. Yu, Z. Yang, L. Tang, Prediction-based multi-objective optimization for oil purchasing and distribution with the NSGA-II Algorithm. Int. J. Inform. Technol. Decis. Mak. 15(2), 423–451 (2016)
6. J. Ou, L. Xing et al., A novel prediction strategy based on change degree of decision variables for dynamic multi-objective optimization. IEEE Access 8(9), 13362–13374 (2019)
7. Z. Lan, Z. Sun et al., Multi-period decision-making and governing of carbon emissions. IOP Conf. Ser: Earth Environ. Sci. 237(2), 22047–22047 (2019)
8. M. Zhang, X. Qu, B. Li, Coordination optimization in multi-product and multi-objective supply chains considering carbon emission. Jisuanji Jicheng Zhizao Xitong/Comput. Integr. Manuf. Syst. CIMS 24(4), 1024–1033 (2018)
9. Z.J. Liu, D.P. Sun, C.X. Lin et al., Multi-objective optimization of the operating conditions in a cutting process based on low carbon emission costs. J. Clean. Prod. 124(15), 266–275 (2016)
10. L. Li, X. Deng, J. Zhao et al., Multi-objective optimization of tool path considering efficiency, energy-saving and carbon-emission for free-form surface milling. J. Clean. Prod. 172(3), 3311–3322 (2018)
11. X. Chen, M. Liu, Z. Xu et al., Influences of temperature and moisture on abiotic and biotic soil CO2 emission from a subtropical forest. Carbon Balance Manag 16(1), 77–99 (2021)
12. M. Stanca, C. Gaidau, C.A. Alexe et al., Multifunctional leather surface design by using carbon nanotube-based composites. Materials 14(11), 3003–3011 (2021)
13. Z. Luo, E. Wang, C.J. Smith, Fresh carbon input differentially impacts soil carbon decomposition across natural and managed systems. Ecology 96(10), 2806–2813 (2016)
14. Q. Xia, Y. Hai, W. Min et al., High energy and high power lithium-ion capacitors based on boron and nitrogen dual-doped 3D carbon nanofibers as both cathode and anode. Adv. Energy Mater. 7(22), 170–216 (2017)
15. Y. Chen, X. Li, Z. Wei et al., Efficient synthesis of ultrafine Pd nanoparticles on an activated N-doping carbon for the decomposition of formic acid. Catal. Commun. 108(9), 55–58 (2018)
16. N. Adam, S.A.I.S.M. Ghazali, N.N. Dzulkifli et al., Characterization, physiochemical, controlled release studies of zinc–aluminium layered double hydroxide and zinc layered hydroxide intercalated with salicylic acid. Bull. Mater. Sci. 44(2), 1–11 (2021)
17. F. Han, Y. Chen, J. Zhang et al., Realizing ultralong-term cyclicability of 5 volt-cathode-material graphite flakes by uni-formly comodified TiO2/carbon layer inducing stable cathode–electrolyte interphase. ACS Appl. Mater. Interfaces. 13(8), 10101–10109 (2021)
18. X. Yang, K. Szlavecz, S.L. Pitz et al., The partitioning of litter carbon fates during decomposition under different rainfall patterns: a laboratory study. Biogeochemistry 148(2), 784–792 (2020)
19. M. Neumann, D.L. Godbold, Y. Hirano et al., Improving models of fine root carbon stocks and fluxes in European forests. J. Ecol. 108(2), 496–514 (2020)
20. S. Yang, P. Dou, H. Wang et al., Patterns of carbon, nitrogen and phosphorus dynamics during decomposition of fern leaf and fine root in a subtropical forest. Chin. Sci. Bull. 64(23), 2430–2440 (2019)
21. N.T. Girkin, C.H. Vane, H.V. Cooper et al., Spatial variability of organic matter properties determines methane fluxes in a tropical forested peatland. Biogeochemistry 142(2), 231–245 (2019)
22. J. Yan, B. Su, Y. Liu, Multiplicative structural decomposition and attribution analysis of carbon emission intensity in China, 2002–2012. J. Clean. Prod. 198(16), 195–207 (2018)
23. B. Xue, M. Niu, Y. Yang et al., Influence of graphitization degree of carbon microspheres on properties of PET flame retardant. Polym. Eng. Sci. 58(8), 1399–1408 (2018)
24. P.M. Kopittke, M.C. Hernandez-Soriano, R.C. Dalal et al., Nitrogen-rich microbial products provide new organo-min-eral associations for the stabilization of soil organic matter. Glob. Change Biol. 24(4), 1762–1770 (2018)
25. I. Pradiptya, H.M. Ouakad, Thermal effect on the dynamic behavior of nanobeam resonator assuming size-depend-ent higher-order strain gradient theory. Microsyst. Technol. 24(6), 2585–2598 (2018)
26. M. Zhou, Y. Li, M.J. Tahir et al., Integrated statistical test of signal distributions and access point contributions for Wi-Fi indoor localization. IEEE Trans. Veh. Technol. 70(5), 5057–5070 (2021)
27. J. Chang, D.E. Clay, S.A. Clay et al., A rapid method for measuring feces ammonia-nitrogen and carbon dioxide-carbon emissions and decomposition rate constants. Agron. J. 109(4), 456–512 (2017)
Publisher’s NoteSpringer Nature remains neutral with regard to jurisdictional claims in published maps and institutional affiliations.