1
RESULTS AND DISCUSSION Breath Biopsy Conference, Cambridge Science Park, Cambridge UK, November 08, 2018 INTRODUCTION Giorgia Purcaro 1,2 , Karen A Kormuth 3 , Mavra Nasir 4 , Flavio A. Franchina 1,5 , Valerie Le Sage 3 , Eric Nturibi 3 , Seema S. Lakdawala 3 , and Jane E. Hill 1,4 1 Thayer School of Engineering, Dartmouth College, Hanover, NH, 03755, United States; 2 Gembloux Agro-Bio Tech, University of Liège, Gembloux, 5030, Belgium ; 3 University of Pittsburgh, Pittsburgh, PA, 15219, United States; 4 Geisel School of Medicine, Dartmouth College, Hanover, NH, 03755, United States ; 5 Department of Chemistry, University of Liège, Liège (Sart-Tilman), 4000, Belgium [email protected] A BREATHPRINT OF INFLUENZA A VIRUS INFECTION IN THE FERRET MODEL EXPERIMENTAL CONCLUSIONS Influenza viruses (IV) pose a major public health concern, since they are highly contagious and still have a high global annual mortality. Current diagnostic methods are slow or have high error rates; therefore, a rapid detection tool is highly desirable to inform clinical management. Exhaled breath is a useful diagnostic in a number of diseases. In this work, we examined the exhaled breath of six ferrets collected pre- and post-IV infection. Exhaled breath analysis was carried out using a comprehensive two-dimensional gas chromatography (GC×GC) hyphenated with a time-of-flight mass spectrometer (ToF MS). Random Forest, a non-parametric machine learning algorithm, was used to select the most relevant diagnostic volatile organic compound (VOC) features and build the model using a cross-validation approach. Using this approach, we defined 31 VOC features, which together produce a profile capable of discriminating between uninfected and IV-infected ferrets. Further characterization revealed an abundance of hydrocarbons, which is consistent with increased oxidative stress known to occur during viral infection. Our study is the first of its kind to define a unique exhaled breath signature for influenza infection in ferrets and will be useful for development of a rapid precision diagnostic technique. Figure 1. Overall analytical procedure. Carbopack Y/X/Carboxen1000 GC×GC-ToF MS Breath collection Storage&shipment Analytical determination Data Elaboration Figure 3. Data cleaning and processing scheme. Pre-RA: Room air sampled before infection; post-RA: Room air sampled after infection; F: breath samples from ferret pre- infection; F-IV: breath samples collected from ferret infected with influenza A virus (IV). RF: Random Forest; AUROC: area under the receiver operating characteristic curve. Class t0 t1 t2 t3 t4 t5 Total F 6 6 6 18 F-IV 6 6 6 18 RA 3 3 3 3 3 3 18 Figure 2. Experimental design. Influenza Virus: H3N2 A/Perth/16/2009 (predominant strain in 2016-2017 and 2017- 2018 seasons). F: Pre infection ferret; F-IV: Post-infection. 1D: SLB-5MS (30 m × 250 μm × 0.5 μm) 2D: SLB-50MS (1.3 m × 250 μm × 0.25 μm) stored at 4 °C until analysis #ID Compound Chemical class* CAS MS% LRI Exp LRI Lit 1D rT (min:sec) 2D rT (sec) 1 3-methylene-heptane Hyd 1632-16-2 789 793 9:00 1.1 2 alkylate hydrocarbon Hyd 844 11:25 1.1 3 alkylate hydrocarbon Hyd 855 11:55 1.1 4 alkylate hydrocarbon Hyd 877 12:56 1.1 5 alkylate hydrocarbon Hyd 881 13:09 1.2 6 Cyclohexanone Ket 108-94-1 855 896 901 13:50 1.8 7 Ketone Ket 907 14:21 1.3 8 Alkylate hydrocarbon Hyd 910 14:30 1.1 9 Aldehyde Ald 922 15:08 1.3 10 Alkylate hydrocarbon Hyd 949 16:33 1.1 11 2-ethyl-hexanal Ald 123-05-7 919 954 952 16:47 1.4 12 1-Heptanol Alc 111-70-6 800 969 970 17:34 1.4 13 Alkylate hydrocarbon Hyd 975 17:53 1.1 14 Octanal Ald 124-13-0 892 1003 1006 19:20 1.5 15 Alkylate hydrocarbon Hyd 1023 20:20 1.3 16 Unknown Unk 1047 21:34 1.5 17 Unknown Unk 1059 22:14 1.6 18 Phenyl acetate Ace 122-79-2 824 1058 1068 22:10 1.9 19 2(E)-octenal Ald 2548-87-0 822 1060 1059 22:15 1.6 20 Acetophenone Ket 98-86-2 930 1069 1068 22:42 2.1 21 Alcohol Alc 1078 23:12 1.4 22 Alkylate hydrocarbon Hyd 1152 26:55:00 1.2 23 isododecane isomer (2- methyl-undecane) Hyd 7045-71-8 878 1164 1164 27:30:00 1.2 24 Alkylate hydrocarbon Hyd 1180 28:18:00 1.2 25 Decanal Ald 112-31-2 866 1207 1208 29:35:00 1.5 26 Benzothiazole Aro 95-16-9 809 1233 1234 30:50:00 2.4 27 Unknown Unk 1273 32:43:00 2 28 Unknown Unk 1302 34:03:00 1.8 29 Alkylate hydrocarbon Hyd 1446 40:28:00 1.2 30 Ketone Ket 1446 40:28:00 1.6 31 Alkylate hydrocarbon Hyd 1485 41:59:00 1.2 * Hyd: hydrocarbon; Ald: aldehyde; Ket: ketone; Alc: alcohol; Ace: acetate; Aro: aromatic. Table 1. List of the volatile metabolites selected as the most discriminatory for determining animal infected with IV. 10 VOCs were identified at level 1 according to the criteria established by the Metabolomics Standards Initiative (MSI) [1]. Figure 4. Heatmap depicting the relative abundance of the 31 selected VOCs as a function of sample. The virus burden determined as tissue culture infectious dose 50 (TCID50) per mL from nasal wash titers. The color key is based on the peak intensity after auto-scaling per variable. To discriminate between infected and uninfected animals, volatile features were selected using the Random forest (RF) classification algorithm using a leaving-one-animal out approach. At each iteration the features were ranked according to their mean decrease in accuracy and the features present in the top 15 at least 50% of the time were retained as the most discriminatory of IV infection. A total of 31 features (Table 1) were selected and used to build the final model using the samples in the validation set. The result was visualized using heatmap and hierarchical clustering analysis (Figure 4). The performance of the model was visualized by generating a receiver operating characteristic (ROC) curve using the aggregate validation set class probabilities (ranging from 0 to 1) for each animal (Figure 5). Figure 5. Aggregate ROC curve for the discrimination between F versus F-IV, generated using Random Forest on the 31 selected features (red line). Moreover, ROC curve obtained from a label permutation test is reported (blue line). [1] Sumner et al., Proposed minimum reporting standards for chemical analysis Chemical Analysis Working Group (CAWG) Metabolomics Standards Initiative (MSI), Metabolomics 3, 211–221 (2007). Our study represents the first comprehensive evaluation of the VOCs present in breath of virally infected animals. Although more work needs to be done to understand the metabolic origins for the identified VOCs, our study provides the first important step in defining an exhaled breath biomarker suite for influenza infection.

A BREATHPRINT OF INFLUENZA A VIRUS INFECTION IN THE …

  • Upload
    others

  • View
    1

  • Download
    0

Embed Size (px)

Citation preview

RESULTS AND DISCUSSION

Breath Biopsy Conference, Cambridge Science Park, Cambridge UK, November 08, 2018

INTRODUCTION

Giorgia Purcaro1,2, Karen A Kormuth3, Mavra Nasir4, Flavio A. Franchina1,5, Valerie Le Sage3, Eric Nturibi3, Seema S. Lakdawala3, and Jane E. Hill1,4

1 Thayer School of Engineering, Dartmouth College, Hanover, NH, 03755, United States; 2 Gembloux Agro-Bio Tech, University of Liège, Gembloux, 5030, Belgium

; 3 University of Pittsburgh, Pittsburgh, PA, 15219, United States; 4 Geisel School of Medicine, Dartmouth College, Hanover, NH, 03755, United States ; 5 Department of Chemistry, University of Liège, Liège (Sart-Tilman), 4000, Belgium

[email protected]

A BREATHPRINT OF INFLUENZA A VIRUS INFECTION IN THE FERRET MODEL

EXPERIMENTAL

CONCLUSIONS

Influenza viruses (IV) pose a major public health concern, since they are highly contagious and still have a high global annual mortality. Currentdiagnostic methods are slow or have high error rates; therefore, a rapid detection tool is highly desirable to inform clinical management. Exhaled breathis a useful diagnostic in a number of diseases. In this work, we examined the exhaled breath of six ferrets collected pre- and post-IV infection. Exhaledbreath analysis was carried out using a comprehensive two-dimensional gas chromatography (GC×GC) hyphenated with a time-of-flight massspectrometer (ToF MS). Random Forest, a non-parametric machine learning algorithm, was used to select the most relevant diagnostic volatile organiccompound (VOC) features and build the model using a cross-validation approach. Using this approach, we defined 31 VOC features, which togetherproduce a profile capable of discriminating between uninfected and IV-infected ferrets. Further characterization revealed an abundance ofhydrocarbons, which is consistent with increased oxidative stress known to occur during viral infection. Our study is the first of its kind to define aunique exhaled breath signature for influenza infection in ferrets and will be useful for development of a rapid precision diagnostic technique.

Figure 1. Overall analytical procedure.

Carbopack Y/X/Carboxen1000GC×GC-ToF MS

Breath collection Storage&shipment Analytical determination Data Elaboration

Figure 3. Data cleaning and

processing scheme. Pre-RA:

Room air sampled before

infection; post-RA: Room air

sampled after infection; F:

breath samples from ferret pre-

infection; F-IV: breath samples

collected from ferret infected

with influenza A virus (IV). RF:

Random Forest; AUROC: area

under the receiver operating

characteristic curve.Class t0 t1 t2 t3 t4 t5 TotalF 6 6 6 18

F-IV 6 6 6 18

RA 3 3 3 3 3 3 18

Figure 2. Experimental design.Influenza Virus: H3N2A/Perth/16/2009 (predominantstrain in 2016-2017 and 2017-2018 seasons). F: Pre infectionferret; F-IV: Post-infection.

1D: SLB-5MS (30 m × 250 µm × 0.5 μm) 2D: SLB-50MS (1.3 m × 250 µm × 0.25 μm)

stored at 4 °C until analysis

#ID CompoundChemical

class*CAS MS% LRI Exp LRI Lit

1D rT (min:sec)

2D rT(sec)

1 3-methylene-heptane Hyd 1632-16-2 789 793 9:00 1.1

2 alkylate hydrocarbon Hyd 844 11:25 1.1

3 alkylate hydrocarbon Hyd 855 11:55 1.1

4 alkylate hydrocarbon Hyd 877 12:56 1.1

5 alkylate hydrocarbon Hyd 881 13:09 1.2

6 Cyclohexanone Ket 108-94-1 855 896 901 13:50 1.8

7 Ketone Ket 907 14:21 1.3

8 Alkylate hydrocarbon Hyd 910 14:30 1.1

9 Aldehyde Ald 922 15:08 1.3

10 Alkylate hydrocarbon Hyd 949 16:33 1.1

11 2-ethyl-hexanal Ald 123-05-7 919 954 952 16:47 1.4

12 1-Heptanol Alc 111-70-6 800 969 970 17:34 1.4

13 Alkylate hydrocarbon Hyd 975 17:53 1.1

14 Octanal Ald 124-13-0 892 1003 1006 19:20 1.5

15 Alkylate hydrocarbon Hyd 1023 20:20 1.3

16 Unknown Unk 1047 21:34 1.5

17 Unknown Unk 1059 22:14 1.6

18 Phenyl acetate Ace 122-79-2 824 1058 1068 22:10 1.9

19 2(E)-octenal Ald 2548-87-0 822 1060 1059 22:15 1.6

20 Acetophenone Ket 98-86-2 930 1069 1068 22:42 2.1

21 Alcohol Alc 1078 23:12 1.4

22 Alkylate hydrocarbon Hyd 1152 26:55:00 1.2

23isododecane isomer (2-methyl-undecane)

Hyd 7045-71-8 878 1164 1164 27:30:00 1.2

24 Alkylate hydrocarbon Hyd 1180 28:18:00 1.2

25 Decanal Ald 112-31-2 866 1207 1208 29:35:00 1.5

26 Benzothiazole Aro 95-16-9 809 1233 1234 30:50:00 2.4

27 Unknown Unk 1273 32:43:00 2

28 Unknown Unk 1302 34:03:00 1.8

29 Alkylate hydrocarbon Hyd 1446 40:28:00 1.2

30 Ketone Ket 1446 40:28:00 1.6

31 Alkylate hydrocarbon Hyd 1485 41:59:00 1.2

* Hyd: hydrocarbon; Ald: aldehyde; Ket: ketone; Alc: alcohol; Ace: acetate; Aro: aromatic.

Table 1. List of the volatile metabolites selected as the mostdiscriminatory for determining animal infected with IV. 10 VOCs wereidentified at level 1 according to the criteria established by theMetabolomics Standards Initiative (MSI) [1].

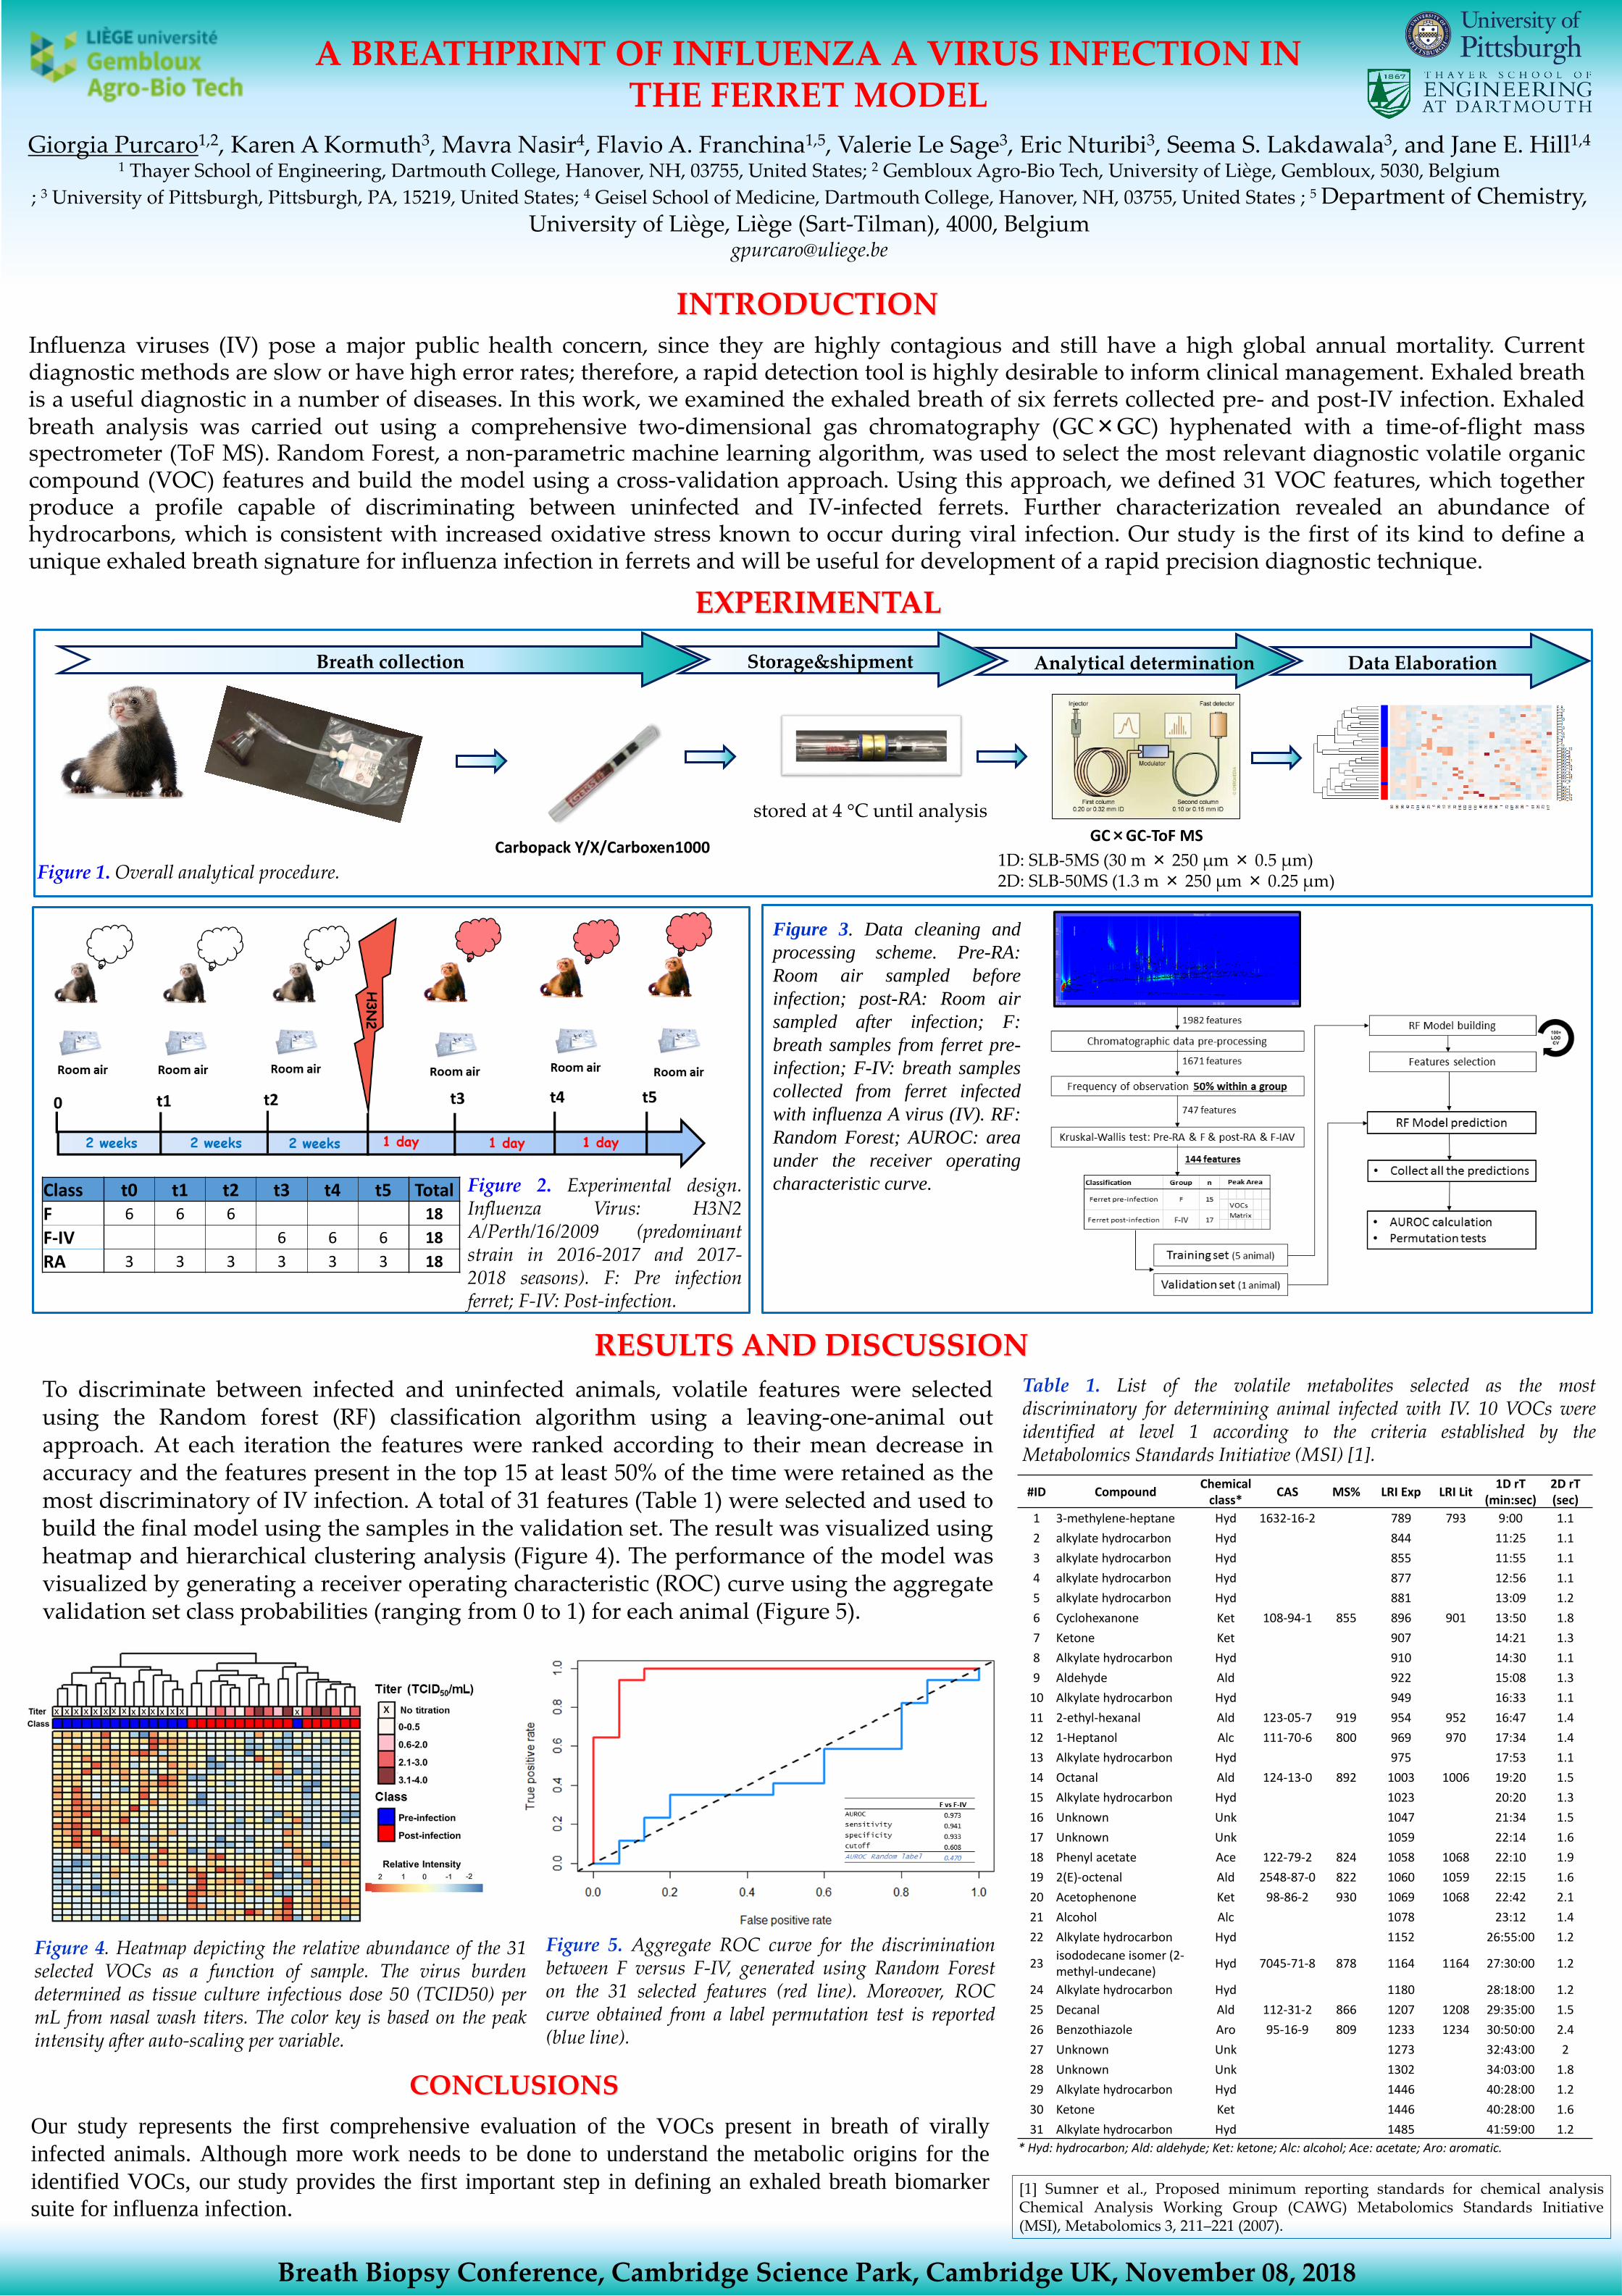
Figure 4. Heatmap depicting the relative abundance of the 31selected VOCs as a function of sample. The virus burdendetermined as tissue culture infectious dose 50 (TCID50) permL from nasal wash titers. The color key is based on the peakintensity after auto-scaling per variable.

To discriminate between infected and uninfected animals, volatile features were selectedusing the Random forest (RF) classification algorithm using a leaving-one-animal outapproach. At each iteration the features were ranked according to their mean decrease inaccuracy and the features present in the top 15 at least 50% of the time were retained as themost discriminatory of IV infection. A total of 31 features (Table 1) were selected and used tobuild the final model using the samples in the validation set. The result was visualized usingheatmap and hierarchical clustering analysis (Figure 4). The performance of the model wasvisualized by generating a receiver operating characteristic (ROC) curve using the aggregatevalidation set class probabilities (ranging from 0 to 1) for each animal (Figure 5).

Figure 5. Aggregate ROC curve for the discriminationbetween F versus F-IV, generated using Random Foreston the 31 selected features (red line). Moreover, ROCcurve obtained from a label permutation test is reported(blue line).

[1] Sumner et al., Proposed minimum reporting standards for chemical analysisChemical Analysis Working Group (CAWG) Metabolomics Standards Initiative(MSI), Metabolomics 3, 211–221 (2007).

Our study represents the first comprehensive evaluation of the VOCs present in breath of virally

infected animals. Although more work needs to be done to understand the metabolic origins for the

identified VOCs, our study provides the first important step in defining an exhaled breath biomarker

suite for influenza infection.