Embed Size (px)
Citation preview

[Type text] Page 1
Directorate of Pulses Development
Government of India
Ministry of Agriculture & Farmers Welfare
Department of Agriculture Cooperation & Farmers Welfare
Bhopal -462004, Madhya Pradesh
A Brief Handbook
(2020-21)

Brief Handbook, DPD, GoI, Bhopal Page 2
INDEX S.No. Particular Page No.
Chapter-1 : Allocation & Progress CSS Programme
1.1 1.1 Scheme-wise Allocation - MP, CG & All India (2019-20 and 2020-21) 4-7
1.2 Assigned States : National Food Security Mission- Financial Progress 8 to 12
1.2.1 Madhya Pradesh (2018-19) 8
1.2.2 (2019-20) 9
1.2.3 (2020-21) 10
1.2.4 Chhattisgarh (2018-19) 11
1.2.5 (2019-20)
1.2.6 (2020-21) 12
1.3 1.2 Flagship Programmes: CS/CSS Schemes Financial Progress 13 to 14
1.3.1 Madhya Pradesh (2018-19) 13
1.3.2 (2019-20)
1.3.3 Chhattisgarh (2018-19) 14
1.3.4 (2019-20)
Chapter-2 : Summary & Comparison of NFSM Action Plan (2019-20 Vs 2020-21)
2.1 Crop/Intervention-wise norms changes :NFSM-Rice, Wheat, Pulses, Coarse &
Nutri-Cereals 15-16
2.1.1 The percent allocation of funds for different interventions for the year 2020-21 16
2.2 Crop/Intervention-wise norms changes : NFSM-Oilseed, Oilpalm & TBOs 17-18
2.2.1 The percent allocation of funds for different interventions for the year 2020-21 18
2.3 NFSM-Commercial Crops (Sugarcane/Cotton/Jute & Mesta) 19
Chapter-3 : Crop-wise Production Scenario 2013-14 to 2019-20
3.1 Production of Foodgrains 20
3.2 Production of Oilseeds and Commercial Crops 21
Chapter-4 : State-wise Crop Production Target (2020-21)
4.1 National Crop Production Target for 2020-21 22
4.2 State/Crop and Season-wise Production Targets of Foodgrains (2020-21) 23
4.3 State/Crop and Season-wise Production Targets of Coarse & Nutri cereals
(2020-21) 24
4.4 State/Crop and Season -wise Revised production Targets of Pulses for the year
2020-21 25
4.5 State/Crop and Season-wise Production Targets of Oilseed Crops (2020-21) 26
4.6 State, Crop and Season -wise Prod. target of Commercial Crops for the year
2020-21 27
Chapter- 5 : Crop Diversion
A Madhya Pradesh 28 to 29
5.1 Kharif- 2019: Target/Achievement 28
5.2 Rabi-2019-20: Target/Achievement 29
5.3 Kharif Target : 2020 29
B Chhattisgarh 30 to 31
5.4 Kharif- 2019: Target/Achievement 30
5.5 Rabi 2019-20: Target/Achievement 30
5.6 Kharif Target : 2020 31
Chapter- 6 : Global Pulses Scenario (2018-19)
6.1 Global Scenario: Crop-Wise 32
6.2 Total Pulses

Brief Handbook, DPD, GoI, Bhopal Page 3
S.No. Particular Page No.
6.3 Chickpea
6.4 Pigeonpea
33 6.5 Lentil
6.6 Fieldpea
6.7 Pulse importing and exporting countries of major pulses (2018-19)
34 6.8 Import/Export: Chickpea (2018-19)
6.9 Import/Export: Pigeonpea (2018-19)
6.10 Import & Export: Lentil (2018-19) 35
6.11 Import/Export: Fieldpea (2018-19)
Chapter- 7 : National Scenario: Major Producing States (Normal)
A. Major Producing States (>90%) : Cereal Crops (Kharif & Rabi)
7.1
to
7.14
Rice (Kharif + Rabi), Wheat (Rabi), Sorghum /Jowar (Kharif + Rabi), Pearl
Millet/Bajra (Kharif), Maize (Kharif+Rabi), Ragi (Kharif), Small Millets
(Kharif), Barley (Rabi), Coarse Cereals (Kharif), Coarse Cereals (Rabi), Total
Coarse Cereals (Kharif + Rabi), Cereals (Kharif) , Cereals (Rabi) , Total Cereals
(Kharif + Rabi).
36 to 40
B. Major Producing States (> 90%) : Pulses Crops (Kharif & Rabi)
7.15
to
7.30
Pigeonpea /Tur (Kharif), Chickpea /Gram (Rabi), Urdbean (Kharif), Urdbean
(Rabi), Total Urdbean (Kharif +Rabi), Mungbean (Kharif), Mungbean (Rabi),
Total Mungbean (Kharif + Rabi), Lentil (Rabi), Fieldpea (Rabi), Lathyrus
(Rabi), Mothbean (Kharif), Kulthi (Kharif + Rabi), Pulses (Kharif), Pulses
(Rabi), Pulses (Kh.+ Rabi),
41 to 45
Chapter- 8 : Seed Minikit
8.1 Pulses and Oilseeds Minikit allocation Madhya Pradesh & Chhattisgarh Kharif -
2020. 46 to 47
8.1.1 Pulses Seed Minikits Allocation: Kharif 2020 46
8.1.2 Oilseeds Minikits Allocation: Kharif 2020 47
8.1.3 Summary: Pulses And Oilseeds Minikit Details Kharif -2020 (All India) 8.2 Pulses and Oilseeds Minikit allocation Madhya Pradesh & Chhattisgarh Rabi -
2020-21. 48 to 50
8.2.1 Madhya Pradesh & Chhattisgarh State Pulses Seed Minikit Rabi -2020-21. 48
8.2.2 M.P. & Chhattisgarh State Allocation Additional Pulses Seed Minikit Rabi -
2020-21. 49
8.2.3 Oilseeds Minikits Allocation: Rabi – 2020-21 49-50
8.2.4 Summary : Pulses and Oilseeds Minikit details Rabi -2020-21 (All India) 50
8.3 Pulses Seed Minikit allocation Madhya Pradesh & Chhattisgarh Summer
2020-21. 51
8.3.1 Pulses Seed Minikits Allocation: Summer – 2020-21
8.3.2 Pulses Minikit details Summer-2020-21 (All India)

Brief Handbook, DPD, GoI, Bhopal Page 4
2.1 Scheme-wise Allocation - MP, CG & All India (2019-20 and 2020-21)
Year States District Coverage Allocation (GoI+SS)
(Rs. in Cr.)
NFSM- PULSES
2019-20
MP (52) All the districts 485.17 (291.10 +194.07)
CG (27) All the districts 64.17 (38.50 + 25.67)
AI 29 States (638 Districts) 1743.10 (1080.87 + 662.23)
2020-21
MP (51) All the districts 260.64 (156.39 +104.26)
CG (27) All the districts 38.17 (22.90+ 15.27)
AI 28 States + 2 UTs (640 district) (J&K under UT)
(Included 1 UT– Ladakh) 1300.75 (772.58 + 528.16)
NFSM- RICE
2019-20
MP (08) Anuppur, Damoh, Dindori, Katni, Mandla, Panna,
Rewa, Sidhi 20.40 (12.24 + 8.16)
CG (13) Baloda Bazar, Bijapur, Bilaspur, Dantewada,
Jashpur, Sukma, Kabirdham, Korba, Koriya,
Mungeli, Raigarh, Raipur, Rajnandgaon
43.32 (25.99 + 17.33)
AI 25 States (194 Districts) 412.53 (283.54 +128.99)
2020-21
MP (08) Anuppur, Damoh, Dindori, Katni, Mandla, Panna,
Rewa, Sidhi 20.08 (12.05 + 8.03)
CG (13) Baloda Bazar, Bijapur, Bilaspur, Dantewada,
Jashpur, Sukma, Kabirdham, Korba, Koriya,
Mungeli, Raigarh, Raipur, Rajnandgaon
24.19 (14.51 + 9.68)
AI 24 States + 1 UT (194 Districts) (J&K under UT) 314.94 (217.80 + 97.14)
NFSM-WHEAT
2019-20 MP (16)
Ashoknagar,Chhattarpur,Guna,Katni, Khandwa,
Panna, Raisen, Raigarh, Rewa, Sagar, Satna, Seoni,
Shivpuri, Sidhi, Tikamgarh, Vidisha
40.08 (24.05+ 16.03)
AI 11 States (126 Districts) 210.66 (131.73 + 78.93)
2020-21
MP - Nil
(Till 13th July,2020)
AI 08 States + 2 UTs (100 Districts) (J&K under UT)
(Excluded- MP, Punjab); (Included – Ladakh) 86.53 (47.50 + 39.03)

Brief Handbook, DPD, GoI, Bhopal Page 5
Year States District Coverage Allocation (GoI+SS)
(Rs. in Cr.)
NFSM- COARSE CEREALS
2019-20
MP (22)
Maize (15)- Alirajpur, Barwani, Betul, Burhanpur,
Chhindwara,Dhar,Dindori,Jhabua,Khargaon, Seoni
Mandsaur,Neemuch,Rajgarh,Ratlam, Singrauli 10.78 (6.47 + 4.31)
Barley (08)- Bhind, Chhattarpur, Panna, Rewa,
Satna, Sidhi, Tikamgarh & Singrauli (common)
CG (08) Maize (08)- Balrampur, Bastar, Gariyaband, Kanker,
Kondagaon, Koriya, Sarguja and Surajpur 3.62 (2.17 + 1.45)
AI 27 States (269 Districts)
Maize- 27 States (237 Districts)
Barley- 04 States (39 Districts)
120.06 (81.65 + 38.41)
2020-21
MP (22)
Maize (15)- Alirajpur, Barwani, Betul, Burhanpur,
Chhindwara, Dhar, Dindori, Jhabua, Khargaon,
Mandsaur, Neemach, Rajgarh, Ratlam, Seoni and
Singrauli 8.53 (5.12 + 3.41)
Barley (08)- Bhind, Chhattarpur, Panna, Rewa,
Satna, Sidhi, Tikamgarh and Singrauli (common)
CG (08) Maize (08)- Balrampur, Bastar, Gariyaband, Kanker,
Kondagaon, Koriya, Sarguja and Surajpur 2.28 (1.37 + 0.91)
AI
26 States + 1 UT (269 Districts) (J&K under UT)
Maize : 26 States +1 UT (237 Districts)
Barley : 04 States (39 Districts)
93.55 (65.37 + 28.18)
NFSM- NUTRI -CEREALS
2019-20
MP (21)
(Common
2 district)
Jowar (09)-Alirajpur, Barwani, Betul, Burahanpur,
Chhindawara, Dhar, Khargaon, Rewa and Sidhi
20.86 (12.51 + 8.34) Bajra (04)-Bhind,Morena,Sheopurkalan, Shivpuri
Other millets (10)-Anuppur,Chhindwara,Dindori,
Jabalpur,Mandla,Shadol,Seoni,Sidhi,Singrauli,Umaria
CG (10) Other millets -Balrampur, Bastar, Dantewada,
Kabirdham, Kanker, Kondagaon, Koriya,
Rajnandgaon, Sarguja and Sukma
14.88 (8.93+ 5.95)
AI 23 States 251.98 (156.07 + 95.91)
2020-21
MP (24)
Jowar (09)- Alirajpur, Barwani, Betul, Dhar,
Burahanpur, Chhindawara, Khargaon,Rewa,Sidhi
15.11 (9.06 + 6.04) Bajra (04)-Bhind,Morena,Sheopurkalan,Shivpuri
Other millets (15)-Anuppur, Balaghat, Betul,
Chhindwara, Damoh, Dindori, Jabalpur, Katni,
Mandla, Rewa, Shadol, Seoni, Sidhi, Singrauli,
Umaria
CG (10)
Other millets -Balrampur, Bastar, Dantewada,
Kabirdham, Kanker, Kondagaon, Koriya,
Rajnandgaon, Sarguja and Sukma
2.30 (1.38 + 0.92)
AI 23 States + 2 UTs (J&K under UT)
(Addl. Meghalaya State & 1 UT- Ladakh) 266.05 (182.19 + 83.87)

Brief Handbook, DPD, GoI, Bhopal Page 6
Year States District Coverage Allocation (GoI+SS)
(Rs. in Cr.)
NFSM- SUGARCANE
2019-20 MP (09)
Chhindwara, Narshingpur, Dhar, Kharogone,
Burhanpur, Gwalior, Hosangabad, Betul and Jabalpur 0.59 (0.36 + 0.24)
AI 11 /13 States (Excl.-Telangana & UK) 10.33 (6.20 + 4.13)
2020-21 MP (14)
Jabalpur, Balaghat, Chhindwara, Mandla,
Narshingpur, Dhar, Raisen, Kharogone, Barwarni,
Burhanpur, Gwalior, Datia, Betul and Hosangabad
0.50 (0.30 + 0.20)
AI 12/13 States (Excl. –Andhra Pradesh) 18.88 (11.43 + 7.45)
NFSM- COTTON
2019-20 MP Programme was not implemented.
AI 14 /15 States (Excl.-Madhya Pradesh) 11.91 (7.24 + 4.67)
2020-21 MP (09)
Chhindwara, Dhar, Jhabua, Alirajpur, Khargone,
Barwani, Khandwa, Burhanpur, Ratlam 1.35 (0.81 +0.54)
AI 15 /15 States 18.04 (11.11 +6.93)
NFSM- OILSEEDS
2019-20
MP MM- I -All the 51 districts of the state. 52.08 (31.25 + 20.83)
CG
MM- I- All the 27 districts of the state 6.00 (3.61+ 2.39)
MM-II- Balod, Janjgir, Korba, Mahasamund,
Dantewada, Jagdalpur, Kanker, Raigarh, Bilaspur,
Sukma, Durg
2.37 (1.42 + 0.95)
MM-III- Jagdalpur, Sarguja, Koriya 1.417 (0.85+ 0.567)
AI
States : Oilseed- 25/26 (Excl.-Punjab)
Oilpalm-13/13
TBOs-08/12 (Excl.-Arunachal Pradesh, Meghalaya,
Nagaland, Odisha)
Oilseed
343.47 (210.85 +132.63)
Oilpalm
101.69 (61.51 +40.19)
TBOs
6.41 (4.26 +2.56)
2020-21
MP MM- I -All the 51 districts of the state. 54.21 (32.52 + 21.68)
CG
MM- I- All the 27 districts of the state 7.04 (4.22 +2.82)
MM-II- Balod, Janjgir, Korba, Mahasamund,
Dantewada, Jagdalpur, Kanker, Raigarh, Bilaspur,
Sukma, Durg
2.32 (1.39 +0.93)
MM-III- Jagdalpur, Sarguja, Koriya 1.50 (0.90 +0.60)
AI
States : Oilseed- 27/28 (J&K under UT)
(Excl.-Jharkhand;Incl.-Ladakh& Pondicherry)
Oilpalm-11/13 (Excl.- Goa & Kerela)
TBOs-8/12 (Excl.- Same as 2019-20)
Oilseed
339.41 (207.37 +132.04)
Oilpalm
104.41 (73.23 +31.18)
TBOs
7.04 (4.95 + 2.09)
NFSM- PROMOTION OF INTER-CROPPING OF PULSES WITH SUGARCANE
2019-20 MP (06) Chhindwara, Narshingpur, Betul, Burhanpur
Barwani, Khargone 0.09 (0.05 + 0.04)

Brief Handbook, DPD, GoI, Bhopal Page 7
Year States District Coverage Allocation (GoI+SS)
(Rs. in Cr.)
AI States 12 (119 districts) 3.78 (2.29 + 1.49)
NFSM- TRFA (OILSEED +PULSES)
2019-20
MP (16)
Katni, Balaghat, Chhindwara, Seoni, Damoh,
Dindori, Mandla, Narsinghpur, Rewa, Sidhi,
Singouli, Satna, Umariya, Anuppur, Raisen, Betul
Pulses
94.52 (56.71 + 37.81)
CG (09) Gariyaband, Raigarh, Rajnandgaon, Kanker,
Kondagaon, Sarguja, Bilaspur, Baloda Bazar,
Jagdalpur
Oilseed +Pulses
57.50 (34.50 +23.00)
AI States-11 367.22 (230.98 + 136.24)
BGREI-BRINGING GREEN REVOLUTION IN EASTERN INDIA
2019-20
CG
Rice and wheat (14)- Gariyaband, Mahasamund,
Dhamtari, Durg, Balod, Bemetara, Janjgir, Sarguja,
Surajpur, Balrampur, Kanker, Narayanpur, Jagdalpur,
Kondagaon.
Total
98.68 (59.21 + 39.47)
Rice
78.95 (47.37 +31.58)
Wheat
19.73 (11.84 + 7.89)
AI
Rice- 07 States
Wheat- 05 States
Total
586.06 (371.80 + 214.26)
Rice
517.36 (330.58 + 186.78)
Wheat
68.70 (41.22 + 27.48)
2020-21
CG
Rice and wheat (14)- Gariyaband, Mahasamund,
Dhamtari, Durg, Balod, Bemetara, Janjgir, Sarguja,
Surajpur, Balrampur, Kanker, Narayanpur, Jagdalpur,
Kondagaon.
Total/Rice
68.84 (41.30 + 27.54)
Wheat
Nil
AI
Rice- 06 States
Wheat- 05 States
Total
350.69 (225.44 + 125.25)
Rice
344.77 (221.89 +122.88)
Wheat
5.92 (3.55 +2.37)

Brief Handbook, DPD, GoI, Bhopal Page 8
1.3 ASSIGNED STATES : NATIONAL FOOD SECURITY MISSION- FINANCIAL PROGRESS (2018-19, 2019-20 & 2020-21)
1.3.1 Madhya Pradesh (2018-19)
(Rs. in Lakhs)
Schemes Approved Allocation/AAP Available Fund Expenditure till March 2019 Unspent Balance on
1st April, 2019
%
Utili.
(TAF)
Central State Total
Release Revali. Total Central
State
Total
Central State CS CS+SS Total UB CS
FOODGRAINS
Pulses 16717.40 11144.94 27862.34
11144.93 16717.40 27862.33 9197.03 6131.35 15328.38 12533.95 7520.37 55
Additional Pulses 9900.00 6600.00 16500.00 9900.00 6600.00
16500.00 5535.57 3690.38 9225.95 7274.05 4364.43 56
Paddy 912.04 608.02 1520.06
360.85 541.27 902.12 302.65 201.77 504.42 397.70 238.62 56
Wheat 1969.76 1313.17 3282.93
923.61 1385.41 2309.02 956.21 637.47 1593.68 715.34 429.20 69
Coarse Cereals 611.50 407.66 1019.16
254.34 381.51 635.85 325.45 216.97 542.42 93.43 56.06 85
Nutri-Cereals 675.18 450.12 1125.30 506.38 337.59
843.97 255.01 170.01 425.02 418.95 251.37 50
Tot.Foodgrains 30785.87 20523.91 51309.78 10406.38 19621.32 19025.59 49053.29 16571.92 11047.95 27619.87 21433.42 12860.05 56
COMMERCIAL CROPS
Sugarcane 30.75 20.50 51.25 19.59 13.75 1.04 34.38 11.84 7.90 19.74 14.64 8.78 57
Cotton 73.50 49.00 122.50 0.00 49.00 73.50 122.50 0.33 0.22 0.55 121.95 73.17 0.4
Tot.Commercial
Crops
104.25 69.50 173.75 19.59 62.75 74.54 156.88 12.17 8.12 20.29 136.59 81.95 13
Intercropping of
Pulses with
Sugarcane
13.77 9.18 22.95 13.77 0.00 0.00 13.77 0.00 0.00 0.00 13.77 13.77 0
Oilseeds 3050.01 2033.34 5083.35 500.00 1284.36 1426.54 3210.90 802.60 535.07 1337.67 1873.23 1123.94 42
Total NFSM 33953.90 22635.93 56589.83 10939.74 20968.43 20526.67 52434.84 17386.70 11591.13 28977.83 23457.01 14079.71 55
Source: NFSM- State’s PUC Letter No. NFSM/PUC/34/2018-19/455 dated 21st May, 2019.

Brief Handbook, DPD, GoI, Bhopal Page 9
1.3.2 Madhya Pradesh (2019-20) (Rs. in Lakhs)
Schemes Approved Allocation/AAP Available Fund Expenditure till March 2020 Unspent Balance
on 1st April, 2020
%
Utili.
(TAF)
Central State Total
Release Revali. Total Central
State
Total
Central State CS+SS CS+SS Total UB CS
FOODGRAINS
Pulses* 29109.95 19406.63 48516.58 9933.89 14554.97 11898.57 36387.43 11156.95 7437.96 18594.91 17792.52 10675.51 51
Paddy 1223.84 815.90 2039.74 679.26 452.84 397.70 1529.80 283.46 188.97 472.43 1057.37 634.42 31
Wheat 2404.79 1603.19 4007.98 1374.39 916.26 715.33 3005.98 714.00 476.00 1190.00 1815.98 1089.59 40
Coarse Cereals 646.95 431.30 1078.25 429.15 286.10 93.43 808.68 399.50 266.33 665.83 142.85 85.71 82
Nutri-Cereals 1251.36 834.24 2085.60 687.15 458.10 418.95 1564.20 203.00 135.33 338.34 1225.86 735.52 22
Tot. Foodgrains 34636.89 23091.26 57728.15 13103.84 16668.27 13523.98 43296.09 12756.90 8504.60 21261.51 22034.58 13220.75 49
COMMERCIAL CROPS
Sugarcane 35.66 23.78 59.44 17.96 11.97 0.00 29.93 4.81 3.20 8.01 21.92 13.15 27
Tot.Commercial
Crops 35.66 23.78 59.44 17.96 11.97 0.00 29.93 4.81 3.20 8.01 21.92 13.15 27
Intercropping of
Pulses with
Sugarcane
5.27 3.51 8.78 5.26 3.52 0.00 8.78 1.22 0.81 2.03 6.75 4.05 23
TRFA 5671.20 3780.80 9452.00 5671.20 3780.80 0.00 9452.00 258.74 172.49 431.23 9020.77 5412.46 5
Oilseeds 3125.00 2083.33 5208.33 1219.83 1562.51 1123.93 3906.27 1201.58 801.06 2002.64 1903.63 1142.18 51
Total NFSM 43474.02 28982.68 72456.70 20018.09 22027.07 14647.91 56693.07 14223.25 9482.17 23705.42 32987.65 19792.59 42
Source: Government of MP, Department of Farmer Welfare & Agri. Develop., Mantralaya File No. B-8/9/2017/14-2/3865 dated 27th August, 2019.
Note :Pulses*-Unspent Balance of Total Pulses of Rs. 11898.57 Lakhs = (Addl. Pulses- Rs. 4364.43 lakhs) + (Intercropping of Pulses with sugarcane –Rs. 13.77
lakhs) + (Pulses itself of last year - Rs. 7520.37 lakhs) is adjusted / revalidated under NFSM-Pulses for the year 2019-20.
Difference between Current Year revalidated fund to Previous years Unspent Balance (Central Share only)
(Rs. in Lakhs)
Total Commodity Revalidation
2019-20
Unspent Balance
2018-19
Difference/Gap Remark
Total Foodgrain 12873.82 12860.052 (+) 13.77 Unspent Balance Rs. 13.77 Lakhs of Intercropping of Pulses with sugarcane of 2018-19 is revalidated under Pulses for the year 2019-20.
Total NFSM 13997.75 14079.714 (-) 81.96 Unspent Balance of Commercial Crops Rs. (-) 81.95 Lakhs =
(Sugarcane – Rs.( -) 8.78 Lakhs + Cotton- Rs. (-) 73.17 Lakhs) of 2018-19, which was not reported in PUC of 2019-20 by the state.
Source: NFSM- State’s PUC Letter No. NFSM/UC/34/2020-21/341 dated 8th
May, 2020.

Brief Handbook, DPD, GoI, Bhopal Page 10
1.3.3 Madhya Pradesh (2020-21) As on 1st December, 2020 (Rs. in Lakhs)
Crop/NFSM Approved Allocation/AAP Revalidation Release
(1st Instl.)
Total
Available
Fund Total
Central States CS SS Total
FOODGRAINS
Pulses incl. PMT* 26064.30 15638.58 10425.72 10675.51 7117.01 17792.52 17792.52
Rice 2008.30 1204.98 803.32 634.42 422.95 1057.37 1057.37
Wheat 2052.00 1231.20 820.80 1089.59 726.39 1815.98 615.60 2431.58
Coarse Cereals 853.21 511.93 341.28 85.71 57.14 142.85 255.96 398.81
Nutri-Cereals 1510.50 906.30 604.20 735.52 490.35 1225.86 1225.86
Total Foodgrains 32488.31 19492.99 12995.32 13220.75 8813.83 22034.58 871.56 22906.14
COMMERCIAL CROPS
Sugarcane 49.84 29.90 19.94 13.15 8.77 21.92 0.00 21.92
Cotton 134.75 80.85 53.90 0.00 0.00 0.00
Total Commercial Crops 184.59 110.75 73.84 13.15 8.77 21.92 0.00 21.92
Intercropping of Pulses with Sugarcane 4.05 2.70 6.75 6.75
TRFA 9924.92 5954.95 3969.97 5412.46 3608.31 9020.77 542.49 9563.26
Oilseed 5420.58 3252.35 2168.23 1142.18 761.45 1903.63 1029.37 2933.00
Total NFSM 48018.40 28811.04 19207.36 19792.59 13195.06 32987.65 2443.42 35431.07
Source: Government of MP, Department of Farmer Welfare & Agri. Develop., Mantralaya File No. B-8/14/2020/14-2 dated 3rd July, 2020.
Note : Pulses*- Unspent Balance of Total Pulses of Rs. 11769.15 Lakhs = (Wheat- Rs. 1089.59 lakhs)+ (Intercropping of Pulses with sugarcane - Rs. 4.05 lakhs)
+ (Pulses itself of last year - Rs. 10675.51 lakhs) is adjusted /revalidated under NFSM-Pulses for the year 2020-21.
Actual Difference as per PUC of 2019-20 & 2020-21 Release
Commercial Crops Unspent Balance Total UB Revalided
(2020-21)
Difference
2018-19 2019-20
1 2 3 (1+2) 4 5
Sugarcane 8.78 13.15 21.94 21.92 -0.02
Cotton 73.17 73.17 -73.17
Total Commercial Crops 81.95 13.15 95.11 21.92 -73.19
Remark : Tentative/Provisional Utilization Certificate has been prepared on the basis of District Progress Report and their unspent balance. Final fund can be
figureout based on Audited UC.

Brief Handbook, DPD, GoI, Bhopal Page 11
1.3.4 Chhattisgarh (2018-19) (Rs. in Lakhs)
Schemes Approved Allocation/AAP Available Fund Expenditure till March 2019 Unspent
Balance on 1st
April, 2019
% Utili.
(TAF)
Central State Total
Release Revali. Total Central
State
Total
Central State CS CS+SS
FOODGRAINS
Pulses 3982.00 2654.67 6636.67 1366.73 911.15 1774.67 4052.55 2054.18 1369.45 3423.63 628.92 84
Addl. Pulses 1650.00 1100.00 2750.00 2750.00 0.00 2750.00 1199.31 799.54 1998.85 751.15 73
Paddy 3301.50 2201.00 5502.50 673.48 448.99 2435.50 3557.97 1758.46 1172.31 2930.77 627.20 82
Coarse Cereals 246.53 164.36 410.89 107.45 71.63 140.57 319.65 178.50 119.00 297.50 22.15 93
Nutri-Cereals 96.93 64.62 161.55 72.70 48.47 0.00 121.17 32.25 21.50 53.75 67.42 44
Tot. Foodgrains 9276.97 6184.64 15461.61 4970.36 1480.24 4350.74 10801.34 5222.70 3481.80 8704.50 2096.84 81
Oilseeds 652.04 434.70 1086.74 171.52 114.35 285.87 159.92 106.62 266.54 19.33 93
Total NFSM 9929.01 6619.34 16548.35 5141.88 1594.58 4350.74 11087.21 5382.62 3588.42 8971.04 2116.17 81
Source: NFSM- State’s AUC Letter No. SAMETI/NFSM/UC/2019-20/973 dated 24th January, 2020.
1.3.5 Chhattisgarh (2019-20) (Rs. in Lakhs)
Schemes Approved Allocation/AAP Available Fund Expenditure till March 2020 Unspent
Balance on
1st April,
2020
% Utili.
(TAF)
Central State Total
Release Revali. Total Central
State
Total
Central State CS CS+SS
FOODGRAINS
Pulses 3850.22 2566.81 6417.03 1967.71 1311.81 1380.07 4659.59 1541.64 1027.76 2569.40 2090.19 55
Special Plan for
Increasing Pulses
Product.
2640.00 1760.00 4400.00 2640.00 1760.00 0.00 4400.00 1086.49 724.32 1810.81 2589.19 41
Paddy 2600.31 1733.54 4333.86 1320.34 880.22 627.20 2827.76 991.44 660.96 1652.40 1175.36 58
Coarse Cereals 216.94 144.63 361.57 173.69 115.80 22.15 311.64 123.95 82.64 206.59 105.05 66
Nutri-Cereals 892.80 595.20 1488.00 421.44 280.96 67.42 769.82 83.49 55.66 139.15 630.67 18
Tot. Foodgrains 10200.28 6800.18 17000.46 6523.18 4348.79 2096.84 12968.81 3827.01 2551.34 6378.35 6590.46 49
Oilseeds 359.99 239.99 599.98 208.22 138.82 19.33 366.37 214.67 143.11 357.78 8.59 98
Total NFSM 10560.26 7040.18 17600.44 6731.41 4487.60 2116.17 13335.18 4041.68 2694.45 6736.13 6599.05 51
Source: NFSM- State’s PUC Letter No. SAMETI/NFSM/2020-21/08 dated 5th May, 2020.
Note : Pulses*- Revalidation of Pulses of Rs. 1380.07 Lakhs = UB (Pulses- Rs. 628.92 lakhs)+ (Addl. Pulses– Rs751.15 lakhs) of 2018-19 is adjusted /
revalidated under NFSM- Pulses for the year 2019-20.

Brief Handbook, DPD, GoI, Bhopal Page 12
1.3.6 Chhattisgarh (2020-21)
As on 20th
July, 2020 (Rs. in Lakhs)
Crop/NFSM Approved Allocation/AAP Revalidation Release
(1st Installment)
Total Available
Fund Total Central States
FOODGRAINS
Pulses incl. PMT* 3816.50 2289.90 1526.60 1054.46 1144.95 2199.41
Rice 2418.80 1451.28 967.52 1394.80 0.00 1394.80
Coarse Cereals 227.62 136.57 91.05 29.96 68.28 98.24
Nutri-Cereals 230.40 138.24 92.16 138.24 0.00 138.24
Total Foodgrains 6693.32 4015.99 2677.33 2617.46 1213.23 3830.69
Oilseed 704.05 422.43 281.62 0.00 0.00 0.00
Total NFSM 7397.37 4438.42 2958.95 2617.46 1213.23 3830.69
Source: NFSM portal/web. (Allocation/Release & Revalidation)

Brief Handbook, DPD, GoI, Bhopal Page 13
1.4 Assigned States : CS/CSS Schemes Financial Progress (2018-19 & 2019-20)
1.4.1 Flagship Programmes: Madhya Pradesh (2018-19) Upto –31
st March, 2019 (Rs. in Lakhs)
Schemes
Allocation Available Fund (CS+SS) Expenditure *
% Util.
Unspent
Balance
(CS+SS) Central State Total Revali. Release Total Central State Total
RKVY 17089.00 11392.67 28481.67 8256.70 18783.56 27040.26 12762.11 8508.08 21270.19 79 5770.07
PKVY 6334.39 4222.93 10557.32 3023.23 4119.95 7143.18 1835.78 1223.86 3059.64 43 4083.54
NMSA-SMAF 0.00 0.00 700.00 700.00 38.52 25.68 64.20 9 635.80
NMAET-SMSP 2733.72 1822.48 4556.20 2056.40 8259.80 10316.20 1900.62 1267.08 3167.70 31 7148.50
NMSA-RAD 0.00 0.00 235.72 235.72 74.41 49.60 124.01 53 111.71
SMFWM 6875.00 4583.33 11458.33 4808.07 3791.67 8599.74 1550.90 1033.94 2584.84 30 6014.90
SHM 1368.20 912.13 2280.33 6031.67 112.15 6143.82 840.55 560.37 1400.92 23 4742.90
SHC 2310.71 1540.47 3851.18 934.07 3495.93 4430.00 1856.92 1237.94 3094.86 70 1335.14
SMAE-ATMA 3969.86 2646.57 6616.43 4924.89 4924.89 2660.38 2050.02 4710.40 96 214.49
PMKSY 2500.00 1666.67 4166.67 2186.43 1500.00 3686.43 230.21 153.48 383.69 10 3302.74
SASA 100% of
GoI(Agriculture
& Irrigation)
554.57 225.00 779.57 232.54 0.00 232.54 30 547.03
Total CS/CSS 43180.88 28787.25 71968.13 28786.86 45212.95 73999.81 23982.95 16110.04 40092.99 54 33906.82
1.4.2 Flagship Programmes: Madhya Pradesh (2019-20) Upto –31
st March, 2020 (Rs. in Lakhs)
Schemes
Allocation Available Fund (CS+SS) Expenditure * %
Util.
Unspent
Balance
(CS+SS) Central State Total Revali. Release Total Central State Total
RKVY 17870.00 11913.33 29783.33 5770.07 14309.25 20079.32 6065.08 4043.38 10108.46 50 9970.86
PKVY 6091.28 4060.85 10152.13 4083.53 4302.80 8386.33 2088.94 1392.62 3481.56 42 4904.77
NMSA-SMAF 0.00 0.00 635.80 635.80 0.00 0.00 0 635.80
NMAET-SMSP 1713.58 1142.39 2855.97 7148.50 2606.67 9755.17 1345.79 897.19 2242.98 23 7512.19
NMSA-RAD 450.00 300.00 750.00 111.70 450.00 561.70 33.27 22.18 55.45 10 506.25
SMFWM 4249.80 2833.20 7083.00 3791.67 3400.00 7191.67 1861.09 1240.72 3101.81 43 4089.86
SHM 0.00 0.00 4742.90 4742.90 420.88 280.59 701.47 15 4041.43
SHC 1312.73 875.16 2187.89 1335.13 835.80 2170.93 748.66 499.11 1247.77 57 923.16
SMAE-ATMA 3332.10 2470.75 5802.85 214.47 6340.50 6554.97 3531.15 2597.61 6128.76 93 426.21
PMKSY 4249.80 2833.20 7083.00 850.00 850.00 0.00 0.00 0 850.00
SASA 100% of
GoI (Agriculture
& Irrigation)
837.78 0.00 837.78 50.94 145.00 195.94 227.22 0.00 227.22 116 -31.28
Total CS/CSS 40107.07 26428.88 66535.95 27884.71 33240.02 61124.73 16322.07 10973.41 27295.48 45 33829.25
RKVY- Rashtriya Krishi Vikas Yojna; PKVY-Paramparagat Krishi Vikas Yojna; NMSA-Sub-mission on Agro-Forestry;
SMSP-Sub-mission of Seed and Planting Material, NMSA-RAD (Rainfed Area Develop.); SMFWM - Sub-mission on
Farm Water Management; SHM-Soil Health Manag.;SHC-Soil Health Card; SMAE-ATMA- Sub-mission of
Agriculture Extension, PMKSY-Pradhan Mantri Krishi Sinchai Yojna; SASA – State Agricultural Statistical Authority.

Brief Handbook, DPD, GoI, Bhopal Page 14
1.4.3 Flagship Programmes: – Chhattisgarh (2018-19)
Upto –31
st March, 2019 (Unit: Rs. in Lakh)
Schemes
Allocation Available Fund (CS+SS) Expenditure * %
Util.
Unspent
Balance
(CS+SS) Central State Total Revali. Release Total Central State Total
RKVY
(RAFTAR)
5144.75 3429.83 8574.58 1420.35 5231.87 6652.22 3000.72 2000.48 5001.20 75 1651.02
RKVY - (RPS) 397.80 265.20 663.00 168.47 0.00 168.47 57.04 38.02 95.06 56 73.41
RKVY-BGREI 4912.82 3275.22 8188.04 4657.09 7462.28 12119.37 5267.29 3511.52 8778.81 72 3340.56
RKVY (TRFA) 2716.20 1810.80 4527.00 488.27 986.73 1475.00 822.94 548.62 1371.56 93 103.44
NMSA (RAD) 650.42 433.62 1084.04 600.00 541.67 1141.67 529.90 353.26 883.16 77 258.51
PKVY 2385.80 1590.54 3976.34 567.22 0.00 567.22 217.91 145.28 363.19 64 204.03
SHM 903.83 602.56 1506.39 182.03 1822.32 2004.35 747.02 498.02 1245.04 62 759.31
PMKSY 340.06 226.70 566.76 41.76 2120.24 2162.00 1037.31 691.54 1728.85 80 433.15
NMAET (SMSP) 2880.00 1920.00 4800.00 0.00 2390.37 2390.37 944.71 629.80 1574.51 66 815.86
NMAET
(SMAE)
3660.00 2440.00 6100.00 1978.43 564.46 2542.89 582.09 388.06 970.15 38 1572.74
SMFWM 2000.00 1333.33 3333.33 3383.14 3148.94 6532.08 1485.35 990.23 2475.58 38 4056.50
IWSM 13499.93 8999.95 22499.88 1666.67 10562.65 12229.32 5171.59 3447.73 8619.32 70 3610.00
Total CS/CSS 39491.62 26327.74 65819.36 15153.42 34831.54 49984.96 19863.86 13242.57 33106.43 66 16878.53
1.4.4 Flagship Programmes: – Chhattisgarh (2019-20) Upto –31
st March, 2020 (Rs. in Lakhs)
Schemes
Allocation Available Fund (CS+SS) Expenditure * %
Util.
Unspent
Balance
(CS+SS) Central State Total Revali. Release Total Central State Total
RKVY
(RAFTAR) 3910.36 2606.91 6517.27 1509.14 5485.66 6994.80 3906.90 2604.60 6511.50 93
483.30
RKVY - (RPS) 180.00 120.00 300.00 73.41 250.00 323.41 166.96 111.31 278.27 86 45.14
RKVY-BGREI 5921.46 3947.64 9869.10 3361.18 9505.76 12866.94 5802.81 3868.54 9671.35 75 3195.59
RKVY (TRFA) 3450.00 2300.00 5750.00 2522.20 5750.00 8272.20 3733.06 2488.71 6221.77 75 2050.43
NMSA (RAD) 0.00 0.00 856.32 0.00 856.32 451.06 300.70 751.76 88 104.56
PKVY 2019.60 1346.40 3366.00 203.93 1683.00 1886.93 1063.67 709.12 1772.79 94 114.14
SHM 293.50 195.67 489.17 818.02 675.22 1493.24 649.66 433.11 1082.77 73 410.47
PMKSY 1104.00 736.00 1840.00 534.36 2091.28 2625.64 1311.26 874.18 2185.44 83 440.20
NMAET (SMSP) 3420.00 2280.00 5700.00 765.86 3018.78 3784.64 2270.78 1513.86 3784.64 100 0.00
NMAET
(SMAE) 2738.25 2428.26 5166.50 2362.15 0.00 2362.15 1414.33 942.89 2357.22 100
4.93
SMFWM 7957.80 5305.20 13263.00 4579.32 1955.98 6535.30 3302.67 2201.78 5504.45 84 1030.85
IWSM 8149.20 5432.80 13582.00 7988.30 5377.18 13365.48 8019.29 5346.19 13365.48 100 0.00
NeGPA 0.00 0.00 145.75 0.00 145.75 86.44 57.62 144.06 99 1.69
Total CS/CSS 39144.17 26698.87 65843.04 25719.94 35792.86 61512.80 32178.90 21452.60 53631.50 87 7881.30
RKVY- Rashtriya Krishi Vikas Yojna: TRFA- Targeted Rice Fallow Area; BGREI- Bringing Green Revolution in
Eastern India; RPS- Reclamation of Problamatic Soil; NMSA-RAD (Rainfed Area Develop.); PKVY-Paramparagat
Krishi Vikas Yojna; SHM-Soil Health Manag.; PMKSY-Pradhan Mantri Krishi Sinchai Yojna; NMAET- SMSP-Sub-
mission of Seed and Planting Material; SAME- Sub-mission of Agriculture Extension; SMFWM - Sub-mission on
Farm Water Management; IWSM- Integrated Watershed Management.; NeGPA-National E Governance Plan of Agri.

Brief Handbook, DPD, GoI, Bhopal Page 15
2.1 Crop/Intervention-wise norms changes : NFSM-Rice, Wheat, Pulses, Coarse & Nutri-Cereals
S.No. Particular Comparison Between Additional/Revised
2019-20 2020-21
1 Funding Pattern
(Between GOI &
State)
60:40- General States
90:10- Hilly & NE States
Same for General,
Hilly & NE States
100:00- Newly created UTs
(J&K, Ladakh)
2 Crop/Intervention-
wise % Fund
Allocation
Same for all NFSM Crops except
Coarse Cereals
Inclusion of INM, IPM
intervention and Primary
Processing equipments
only under Flexi funds in
NFSM- Coarse Cereals.
Coarse Cereals
- (Maize & Barley).
% Fund Allocation:
70% for Demonstration
30% for seed distribution.
Coarse Cereals
- (Maize & Barley).
% Fund Allocation:
Intervention-wise
details (Table-2.1.1).
3 INM in NFSM-
Rice & Wheat Wheat:
Micro-nutrient &
Gypsum
Rice:
Micro-nutrient
Liming in Acidic Soils
Wheat & Rice:
Same as last year
incl. Bio-fertilizers
Bio-fertilizers in Rice &
Wheat
4 IPM NFSM-Rice
& Wheat
Wheat & Rice:
PP Chemicals & Bio-
agents.
Weedicides
Wheat & Rice:
Same as last year
incl. Bio-pesticides
Bio-pesticides in Rice &
Wheat
5 Flexi-Components
Farm Machineries
(SMAM),
Water saving devices
(PMKSY norms),
CHCs, Demo. by NGOs,
Capacity
Building/training Local
Initiatives etc.
All components
(Same as last year)
except
Demonstrations by
NGOs and including
other additional
interventions.
PHM
implements/equipments
/tools and category there
of shall be as per
SMAM norms.
Small seed storage bins
/structures as per SVP
under NFSM.
6 Seed Distribution
of quality seed
(Same as last year)
Phy.& Fin. targets for the varieties > 10 Yrs. of
age with special characteristics should not be >
20% of the total HYVs under seed distribution
for all crops under NFSM.
TL seeds are allowed
for assistance for NE
States, Hilly States (HP
& UK) and UTs of J&K
and Ladakh for all crops
under NFSM.
7 Seed Production
of quality seed
In order to promote quality seeds of newer var.
not older than 10 Yrs. of age, states may take up
prod. of certified seeds through SSC and State
No change

Brief Handbook, DPD, GoI, Bhopal Page 16
S.No. Particular Comparison Between Additional/Revised
2019-20 2020-21
(Pulses & Nutri-
Cereals)
farms.
Separate targets for may be given for
demonstration, seed distribution and
production.
More focus towards potential districts for
increasing pulses & nutri-cereals production.
8 Local Initiatives Those activities which can help in boosting the
production and productivity of NFSM-Rice,
Wheat, Pulses and Nutri-Cereals e.g.
augmentation of water resources, convergence
of Pulses & Nutri-Cereals production within
areas brought under irrigation through
PMKSY.
Excluding from Local
Initiative
Development of godowns
for safe storage of critical
inputs, machines for post
harvest processing like
grader' dehusking
machines, mini dal mills, etc.
6 Crop-Wise
a Rice & Wheat*
(In order to utilize Rice Bunds - State may
include planting of Arhar in demo. plot of Rice.) Inclusion of Bio-fortified
/ HYVs.
The sowing of rice crop
should be avoided in the
'Dark-Zone' areas of the
State.
30% Allocation for Stress
tolerant varieties
30% Allocation for
Stress tolerant/ Bio-
fortified / HYVs
Source: NFSM Cell, Min. of Agri. & FW (DAC&FW) dated 29th April, 2020 and Last Year- dated 15th March,2019
Note- SMAM- Sub-mission on Agricultural Mechanization; SVP- Seed Village Programme
Table- 2.1.1: The percent allocation of funds for different interventions for the year 2020-21
S. No. Interventions % Allocation For
Rice and Wheat Pulses Nutri-Cereals Coarse Cereals
1 Demonstration 40 30 30 50
2 Seed Distribution 20 15 15 30
3 Seed Production - 15 15 -
4 INM & IPM 15 15 15 15
5 Flexi-components
including
Farm Machineries,
Irrigation and CHCs,
Primary Processing
equipments/ implements
tools/small seed
godowns, Capacity
Building / Training,
Local Initiatives, etc.
25 25 25 5
Primary
Processing
equipments only
Total 100 100 100 100
Source: NFSM Cell, Min. of Agri. & FW (DAC&FW) dated 29th April, 2020
Brief Handbook, DPD, GoI, Bhopal Page 17
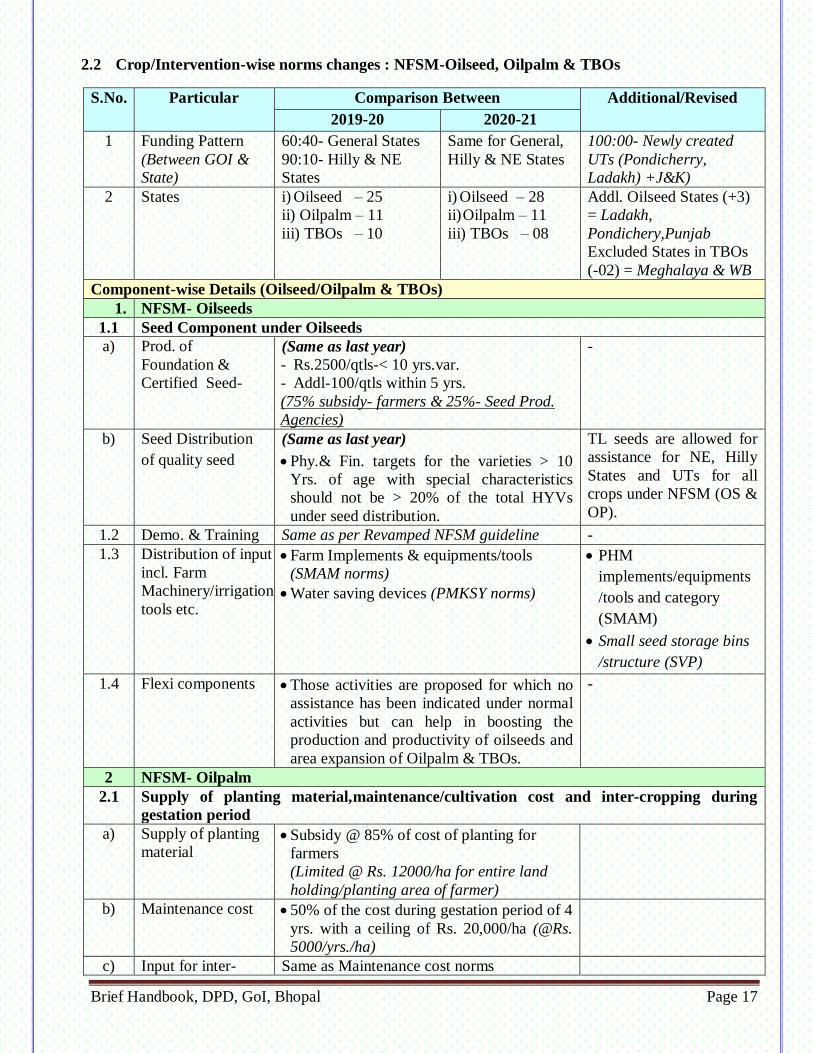
2.2 Crop/Intervention-wise norms changes : NFSM-Oilseed, Oilpalm & TBOs
S.No. Particular Comparison Between Additional/Revised
2019-20 2020-21
1 Funding Pattern
(Between GOI &
State)
60:40- General States
90:10- Hilly & NE
States
Same for General,
Hilly & NE States
100:00- Newly created
UTs (Pondicherry,
Ladakh) +J&K)
2 States i) Oilseed – 25
ii) Oilpalm – 11
iii) TBOs – 10
i) Oilseed – 28
ii) Oilpalm – 11
iii) TBOs – 08
Addl. Oilseed States (+3)
= Ladakh,
Pondichery,Punjab
Excluded States in TBOs
(-02) = Meghalaya & WB
Component-wise Details (Oilseed/Oilpalm & TBOs)
1. NFSM- Oilseeds
1.1 Seed Component under Oilseeds
a) Prod. of
Foundation &
Certified Seed-
(Same as last year)
- Rs.2500/qtls-< 10 yrs.var.
- Addl-100/qtls within 5 yrs.
(75% subsidy- farmers & 25%- Seed Prod.
Agencies)
-
b) Seed Distribution
of quality seed
(Same as last year)
Phy.& Fin. targets for the varieties > 10
Yrs. of age with special characteristics
should not be > 20% of the total HYVs
under seed distribution.
TL seeds are allowed for
assistance for NE, Hilly
States and UTs for all
crops under NFSM (OS &
OP).
1.2 Demo. & Training Same as per Revamped NFSM guideline -
1.3 Distribution of input
incl. Farm
Machinery/irrigation
tools etc.
Farm Implements & equipments/tools
(SMAM norms)
Water saving devices (PMKSY norms)
PHM
implements/equipments
/tools and category
(SMAM)
Small seed storage bins
/structure (SVP)
1.4 Flexi components Those activities are proposed for which no
assistance has been indicated under normal
activities but can help in boosting the
production and productivity of oilseeds and
area expansion of Oilpalm & TBOs.
-
2 NFSM- Oilpalm
2.1 Supply of planting material,maintenance/cultivation cost and inter-cropping during
gestation period
a) Supply of planting
material Subsidy @ 85% of cost of planting for
farmers
(Limited @ Rs. 12000/ha for entire land
holding/planting area of farmer)
b) Maintenance cost 50% of the cost during gestation period of 4
yrs. with a ceiling of Rs. 20,000/ha (@Rs.
5000/yrs./ha)
c) Input for inter- Same as Maintenance cost norms

Brief Handbook, DPD, GoI, Bhopal Page 18
S.No. Particular Comparison Between Additional/Revised
2019-20 2020-21
cropping
d) Other components (Same as revamped NFSM-guideline)
- Such as supply of water saving devices,
establishment of seed garden, vermin-
compost units at oilpalm field, machinery
etc.
3. NFSM - TBOs
3.1 Area Expansion
input Integrated development of Nurseries &
plantation on the new wasteland as well as
existing wasteland/ degraded forest land.
Maintenance of TBO Plantation:
-
3.2 Production Input Incentives for undertaking intercropping with
TBOs with oilseeds, pulses and other crops
(@ Rs. 1000/ha)
-
3.3 ToT Farmers (30 Nos.)-2 days
(@24000/training)
Extension Officers/workers (20 Nos.) –
(@Rs.36000/training)
-
3.4 R&D 100 % Assistance for need based R&D
projects to institute like, ICAR, ICFRE,
CSIR & IIT.
-
3.5 Flexi Components (Same as revamped NFSM-guideline)
Such as exposure visit (inter & Intra state),
distribution of oil extraction units, organizing
seminar/workshop etc., by an independent
agency.
-
Source: NFSM Cell, Min. of Agri. & FW (DAC&FW)Current Year- dated 8th May, 2020 and Last Year- dated 6th
May,2019 & Revamped NFSM guideline (2018-19 to 2019-20)
Table - 2.2.1 The percent allocation of funds for different interventions for the year 2020-21
S.No. NFSM- Oilseeds NFSM-Oilpalm NFSM-TBOs
Intervention %Fund Intervention %Fund Intervention %Fund
1 Seed Component 30 Supply of planting
material,maintenance
/ cultivation cost and
inter-cropping
during gestation
period
50-70 Area Expansion
Input
87
2 Demonstration &
Training
27 Other Component 20-30 Production Input
3 Distribution of inputs
incl. farm machinery
and irrigation system/
tools
30 PMT 0-3 Transfer of
Technology
4 Flexi funds 10 Flexi funds 0-10 Flexi funds 10
5 PMT 3 PMT 3
Total 100 100 100
Source: NFSM Cell, Min. of Agri. & FW (DAC&FW) dated 8th May, 2020

Brief Handbook, DPD, GoI, Bhopal Page 19
2.3 NFSM-Commercial Crops (Sugarcane/Cotton/Jute & Mesta)
- Crop/Intervention-wise norms & Rate of Assistance
S.No. Interventions NFSM- Cotton NFSM- Jute & Mesta NFSM- Sugarcane
15 States 09 States 13 States
1 Demonstration Trial High Density Planting
system@ Rs.
10,000/ha
- Inter-cropping & Single
bud chip tech.-
@ Rs. 9000/ha
2 FLDs Integrated Crop
Manag. / Inter-
cropping/ Natural
Colour Cotton -
@ Rs. 8000/ha
each
Desi & ELS /ELS
Seed Prod.-@
Rs.9000/ha
Alternate retting
technology-
@Rs. 20,000/FLD
Prod. Tech./Inter-
cropping- @ Rs.
9000/ha
3 Production of Seed
B/Foundation/Certified
- Rs. 12000 for Found.
Rs. 5500 for Certified
Rs. 40,000/ha for
Breeder Seed
production
4 Prod. & Supply of
tissue culture plantlets
/seedling
- - Rs. 3.5/seedling
5 Distribution
i) Certified seeds
ii) Nail weeder
iii) Microbial
consortium
(CRIJAF Sona)
- Rate of Assistance
i) Rs.100/kg
ii) Rs.1000/machine
iii) Rs.25/kg
or 50% of cost for each
-
6 Distribution of PP
chemicals and
Bioagents
@Rs.500/ha or 50%
of cost whichever is
less
- @Rs.500/ha or 50% of
cost whichever is less
Trainings
i) National Level
ii) State Level
i) Rs.
80,000/Training
(25 nos X 3 days)
ii) Rs.
40,000/Traini
ng
(20 nos.X 2 days)
Same as NFSM-Cotton
i) Rs.
50,000/Training
(25 nos X 2 days)
ii) Rs.
40,000/Trainin
g
(20 nos.X 2 days)
7 Local Initiatives As per the State
Specific need limited
to 25% of total
allocation
Same as NFSM-Cotton
Source: NFSM Cell, Min. of Agri. & FW (DAC&FW) dated 30th April, 2020 .

Brief Handbook, DPD, GoI, Bhopal Page 20
3.1 Production of Foodgrains Million Tonnes
Crop Season 2013-14 2014-15 2015-16 2016-17 2017-18 2018-19 2019-20
Targets IVth
Adv.Est.
Rice Kharif 91.50 91.39 91.41 96.30 97.14 102.04 102.00 101.98
Rabi 15.15 14.09 13.00 13.40 15.62 14.44 14.00 16.45
Total 106.65 105.48 104.41 109.70 112.76 116.48 116.00 118.43
Wheat Rabi 95.85 86.53 92.29 98.51 99.87 103.60 100.50 107.59
Jowar Kharif 2.39 2.30 1.82 1.96 2.27 1.74 2.10 1.64
Rabi 3.15 3.15 2.42 2.60 2.53 1.74 2.80 3.09
Total 5.54 5.45 4.24 4.57 4.80 3.48 4.90 4.73
Bajra Kharif 9.25 9.18 8.07 9.73 9.21 8.66 9.50 10.28
Ragi Kharif 1.98 2.06 1.82 1.39 1.99 1.24 2.30 1.74
Small Millets Kharif 0.43 0.39 0.39 0.44 0.44 0.33 0.60 0.40
Nutri. Cereals Kharif 14.06 13.93 12.10 13.52 13.91 11.97 14.50 14.06
Rabi 3.15 3.15 2.42 2.60 2.53 1.74 2.80 3.09
Total 17.20 17.08 14.52 16.12 16.44 13.71 17.30 17.15
Maize Kharif 17.15 17.01 16.05 18.92 20.12 19.41 21.30 19.63
Rabi 7.11 7.16 6.51 6.98 8.63 8.30 7.60 9.01
Total 24.26 24.17 22.57 25.90 28.75 27.72 28.90 28.64
Barley Rabi 1.83 1.61 1.44 1.75 1.78 1.63 2.10 1.69
Nutri/Coarse
Cereals
Kharif 31.20 30.94 28.15 32.44 34.03 31.38 35.80 33.69
Rabi 12.09 11.92 10.37 11.33 12.94 11.67 12.50 13.79
Total 43.29 42.86 38.52 43.77 46.97 43.06 48.30 47.48
Cereals Kharif 122.70 122.34 119.56 128.74 131.16 133.42 137.80 135.67
Rabi 123.09 112.53 115.66 123.24 128.44 129.71 127.00 137.83
Total 245.79 234.87 235.22 251.98 259.60 263.13 264.80 273.50
Tur Kharif 3.17 2.81 2.56 4.87 4.29 3.32 4.60 3.83
Gram Rabi 9.53 7.33 7.06 9.38 11.38 9.94 11.60 11.35
Urad Kharif 1.15 1.28 1.25 2.18 2.75 2.36 2.90 1.30
Rabi 0.55 0.68 0.70 0.66 0.74 0.70 0.80 0.74
Total 1.70 1.96 1.95 2.83 3.49 3.06 3.70 2.04
Moong Kharif 0.96 0.87 1.00 1.64 1.43 1.78 1.60 1.79
Rabi 0.65 0.64 0.59 0.52 0.59 0.67 0.70 0.67
Total 1.61 1.50 1.59 2.17 2.02 2.46 2.30 2.46
Lentil Rabi 1.02 1.04 0.98 1.22 1.62 1.23 # 1.18
OKP Kharif 0.71 0.78 0.72 0.89 0.83 0.63 1.00 0.81
ORP Rabi 1.52 1.74 1.47 1.77 1.78 1.45 3.10 1.50
Total Pulses Kharif 6.00 5.73 5.53 9.58 9.31 8.09 10.10 7.72
Rabi 13.26 11.42 10.79 13.55 16.11 13.99 16.20 15.44
Total 19.26 17.15 16.32 23.13 25.42 22.08 26.30 23.15
Tot.Foodgrains Kharif 128.69 128.07 125.09 138.33 140.47 141.52 147.90 143.38
Rabi 136.35 123.96 126.45 136.78 144.55 143.69 143.20 153.27
Total 265.05 252.03 251.54 275.11 285.01 285.21 291.10 296.65
Source: DES, Min.of Agri. & FW (DAC&FW), New Delhi. Lentil- 2019-20 Target # Included in Other Rabi Pulses.

Brief Handbook, DPD, GoI, Bhopal Page 21
3.2 Production of Oilseeds and Commercial Crops Lakh Tonnes
Crop Season 2013-14 2014-15 2015-16 2016-17 2017-18 2018-19 2019-20
Targets IVth
Adv.Est.
Groundnut Kharif 80.58 59.30 53.68 60.48 75.95 53.63 75.68 78.09
Rabi 16.56 14.71 13.66 14.14 16.57 13.31 16.08 15.38
Total 97.14 74.02 67.33 74.62 92.53 66.95 91.76 93.47
Castorseed Kharif 17.27 18.70 17.52 13.76 15.68 12.15 19.32 20.60
Sesamum Kharif 7.15 8.28 8.50 7.47 7.55 7.55 10.17 7.45
Nigerseed Kharif 0.98 0.76 0.74 0.85 0.70 0.65 2.03 0.72
Soyabean Kharif 118.61 103.74 85.70 131.59 109.33 137.86 149.64 122.42
Sunflower Kharif 1.66 1.43 0.85 1.11 0.85 0.93 1.55 0.77
Rabi 3.38 2.91 2.12 1.41 1.37 1.26 1.50 1.25
Total 5.04 4.34 2.96 2.51 2.22 2.19 3.05 2.02
Rapeseed &
Mustard
Rabi 78.77 62.82 67.97 79.17 84.30 93.39 82.37 87.03
Linseed Rabi 1.42 1.55 1.25 1.84 1.74 1.59 2.03 1.02
Safflower Rabi 1.13 0.90 0.53 0.94 0.55 0.24 0.63 0.27
Total Nine
Oilseeds Kharif 226.24 192.21 166.98 215.26 210.06 212.78 258.39 230.06
Rabi 101.26 82.90 85.53 97.50 104.53 109.79 102.61 104.95
Total 327.49 275.11 252.51 312.76 314.59 322.57 361.00 335.01
Sugarcane Total 3521.42 3623.33 3484.48 3060.69 3799.05 4001.57 3855.00 3581.38
Cotton * Total 359.02 348.05 300.05 325.77 328.05 287.08 357.50 360.48
Jute ** Total 110.83 106.18 99.40 104.32 95.91 93.49 105.00 94.32
Mesta ** Total 6.07 5.08 5.83 5.30 4.42 4.19 7.00 4.89
Jute & Mesta Total 116.90 111.26 105.24 109.62 100.33 97.68 112.00 99.21
Source: Agri. Statistics Division, DES, Min. of Agri. & Farmers Welfare (DAC&FW), New Delhi
Cotton * - Production in million bales of 170 kg; Jute* & Mesta**- Production in million bales of 180 kg.

Brief Handbook, DPD, GoI, Bhopal Page 22
4.1 National Crop Production Target for 2020-21 (Production Target : Million tonnes)
Crop Season Target Proposed by Crops Division
Rice
Kharif 102.60
Rabi 14.90
Total 117.50
Wheat Rabi 106.50
Jowar
Kharif 2.15
Rabi 2.85
Total 5.00
Bajra Kharif 9.57
Maize
Kharif 22.00
Rabi 7.00
Total 29.00
Ragi Kharif 2.35
Small Millets Kharif 0.65
Barley Rabi 2.15
Total Coarse Cereals
Kharif 36.72
Rabi 12.00
Total 48.72
Arhar Kharif 4.82
Gram Rabi 11.00
Urad
Kharif 2.90
Rabi 0.70
Total 3.60
Mung
Kharif 1.88
Rabi 0.60
Total 2.48
Other Kharif Pulses Kharif 1.00
Other Rabi Pulses Rabi 2.70
Total Pulses
Kharif 10.60
Rabi 15.00
Total 25.60
Total Foodgrains
Kharif 149.92
Rabi 148.40
Total 298.32
Total Oilseed
Kharif 25.44
Rabi 11.20
Total 36.64
Sugarcane 390.00
Cotton* 36.00
Jute** 10.00
Mesta** 0.50
Jute & Mesta ** 10.50
Cotton * - Production in million bales of 170 kg; Jute* & Mesta**- Production in million bales of 180 kg.

Brief Handbook, DPD, GoI, Bhopal Page 23
4.2 State/Crop and Season-wise Production Targets of Foodgrains (2020-21) Production target: Lakh tonnes
State Rice Wheat Total Coarse & Nutri Cereals Pulses Foodgrains
Kharif Rabi Total Rabi Kharif Rabi Total Kharif Rabi Total Kharif Rabi Total
Andhra Pradesh 48.50 33.00 81.50 7.02 19.02 26.04 2.02 11.03 13.05 57.54 63.05 120.59
Arunachal Pradesh 2.50 2.50 0.91 0.17 1.08 0.10 0.10 0.20 3.51 0.27 3.78
Assam 45.50 11.00 56.50 0.37 0.94 0.94 0.47 0.76 1.23 46.91 12.13 59.04
Bihar 74.00 2.60 76.60 65.45 8.17 15.85 24.02 0.73 4.08 4.81 82.90 87.98 170.88
Chhattisgarh 71.50 1.20 72.70 1.57 3.37 0.05 3.42 1.04 4.72 5.76 75.91 7.54 83.45
Gujarat 20.00 1.50 21.50 32.74 17.50 2.95 20.45 5.25 3.48 8.73 42.75 40.67 83.42
Haryana 39.90 39.90 123.00 10.31 1.55 11.86 0.16 0.95 1.11 50.37 125.50 175.87
Himachal Pradesh 1.20 1.20 6.77 7.12 0.40 7.52 0.15 0.52 0.67 8.47 7.69 16.16
Jammu & Kashmir 6.20 6.20 4.98 5.60 0.06 5.66 0.03 0.02 0.05 11.83 5.06 16.89
Jharkhand 36.50 0.40 36.90 3.67 5.97 0.21 6.18 4.35 3.91 8.26 46.82 8.19 55.01
Karnataka 27.50 5.50 33.00 2.41 55.83 13.60 69.43 12.90 8.78 21.68 96.23 30.29 126.52
Kerala 4.20 1.50 5.70 0.00 0.01 0.03 0.04 4.21 1.53 5.74
Madhya Pradesh 45.50 0.20 45.70 174.29 47.83 5.23 53.06 23.78 50.63 74.41 117.11 230.35 347.46
Maharashtra 30.50 1.00 31.50 16.69 45.88 19.07 64.95 16.81 18.47 35.28 93.19 55.23 148.42
Manipur 1.50 2.50 4.00 0.40 0.20 0.60 0.00 1.90 2.70 4.60
Meghalaya 2.00 0.65 2.65 0.44 0.44 0.00 2.44 0.65 3.09
Mizoram 0.70 0.70 0.08 0.01 0.09 0.00 0.78 0.01 0.79
Nagaland 4.50 0.15 4.65 1.43 0.11 1.54 0.00 5.93 0.26 6.19
Odisha 73.00 9.00 82.00 3.05 0.08 3.13 2.68 1.89 4.57 78.73 10.97 89.70
Punjab 117.11 117.11 176.36 4.76 0.60 5.36 0.08 0.32 0.40 121.95 177.28 299.23
Rajasthan 3.80 3.80 103.89 59.22 10.47 69.69 20.84 17.66 38.50 83.86 132.02 215.88
Sikkim 0.18 0.18 0.75 0.75 2.01 3.41 5.42 2.94 3.41 6.35
Tamil Nadu 53.56 7.10 60.66 18.63 10.30 28.93 3.75 1.79 5.54 75.94 19.19 95.13
Telangana 30.50 20.00 50.50 0.06 19.66 8.35 28.01 0.55 0.18 0.73 50.71 28.59 79.30
Tripura 5.50 2.00 7.50 0.07 0.07 0.00 0.00 0.00 5.57 2.00 7.57
Uttarakhand 6.00 0.20 6.20 10.31 3.33 0.31 3.64 7.01 13.34 20.35 16.34 24.16 40.50
Uttar Pradesh 138.05 0.60 138.65 333.20 35.64 6.20 41.84 0.58 3.00 3.58 174.27 343.00 517.27
West Bengal 118.10 41.90 160.00 8.49 1.58 5.04 6.62 0.00 119.68 55.43 175.11
D&N Haveli 0.00 0.00 0.00 0.00 0.00 0.00
Daman & Diu 0.00 0.01 0.01 0.00 0.01 0.00 0.01
Delhi 0.00 0.09 0.09 0.00 0.09 0.00 0.09
Others 18.00 7.00 25.00 0.74 1.61 0.17 1.78 0.70 0.93 1.63 20.31 8.84 29.15
All India 1026.00 149.00 1175.00 1064.99 367.20 120.00 487.20 106.00 150.00 256.00 1499.20 1483.99 2983.19

Brief Handbook, DPD, GoI, Bhopal Page 24
4.3 : State/Crop and Season-wise Production Targets of Coarse & Nutri cereals (2020-21) Production target : Lakh tonnes
State
Jowar Bajra Maize Ragi Small
Millets
Barley Total Coarse Cereals
Kharif Rabi Total Kharif Kharif Rabi Total Kharif Kharif Rabi Kharif Rabi Total
Andhra Pradesh 0.50 2.90 3.40 0.80 4.95 16.12 21.07 0.45 0.32 7.02 19.02 26.04
Arunachal Pradesh 0.00 0.00 0.61 0.17 0.78 0.00 0.30 0.00 0.91 0.17 1.08
Assam 0.00 0.00 0.90 0.90 0.04 0.94 0.00 0.94
Bihar 0.03 0.03 0.05 7.95 15.65 23.60 0.09 0.05 0.20 8.17 15.85 24.02
Chhattisgarh 0.06 0.06 0.00 3.00 3.00 0.31 0.05 3.37 0.05 3.42
Gujarat 1.15 0.40 1.55 10.66 5.05 2.55 7.60 0.21 0.43 0.00 17.50 2.95 20.45
Haryana 0.39 0.39 8.81 1.11 0.00 1.11 0.00 0.00 1.55 10.31 1.55 11.86
Himachal Pradesh 0.00 7.04 7.04 0.02 0.06 0.40 7.12 0.40 7.52
Jammu & Kashmir 0.00 0.10 5.40 0.00 5.40 0.05 0.05 0.06 5.60 0.06 5.66
Jharkhand 0.00 5.70 0.21 5.91 0.16 0.11 0.00 5.97 0.21 6.18
Karnataka 1.60 9.60 11.20 3.91 36.20 4.00 40.20 13.90 0.22 0.00 55.83 13.60 69.43
Madhya Pradesh 4.00 4.00 5.01 37.22 2.03 39.25 0.00 1.60 3.20 47.83 5.23 53.06
Maharashtra 4.37 13.55 17.92 6.45 32.55 5.50 38.05 2.10 0.41 0.02 45.88 19.07 64.95
Manipur 0.00 0.40 0.20 0.60 0.40 0.20 0.60
Meghalaya 0.00 0.41 0.41 0.03 0.44 0.00 0.44
Mizoram 0.00 0.08 0.01 0.09 0.08 0.01 0.09
Nagaland 0.00 0.01 1.30 0.10 1.40 0.01 0.11 0.01 1.43 0.11 1.54
Odisha 0.00 0.02 2.32 0.08 2.40 0.55 0.16 0.00 3.05 0.08 3.13
Punjab 0.00 0.01 4.75 4.75 0.60 4.76 0.60 5.36
Rajasthan 3.48 3.48 39.05 16.59 0.03 16.62 0.10 10.44 59.22 10.47 69.69
Sikkim 0.00 0.70 0.70 0.05 0.75 0.00 0.75
Tamil Nadu 2.65 1.80 4.45 1.62 10.65 8.50 19.15 3.31 0.40 18.63 10.30 28.93
Telangana 0.45 0.25 0.70 0.16 18.95 8.10 27.05 0.10 19.66 8.35 28.01
Tripura 0.00 0.07 0.07 0.07 0.00 0.07
Uttarakhand 0.00 0.50 0.50 1.88 0.95 0.31 3.33 0.31 3.64
Uttar Pradesh 2.55 2.55 18.86 14.12 1.65 15.77 0.11 4.55 35.64 6.20 41.84
West Bengal 0.00 0.01 1.36 5.00 6.36 0.16 0.05 0.04 1.58 5.04 6.62
Daman & Diu 0.00 0.01 0.00 0.01 0.00 0.01
Delhi 0.03 0.03 0.05 0.01 0.01 0.09 0.00 0.09
Others 0.24 0.24 0.11 0.11 0.10 0.21 0.61 0.54 0.07 1.61 0.17 1.78
All India 21.50 28.50 50.00 95.70 220.00 70.00 290.00 23.50 6.50 21.50 367.20 120.00 487.20

Brief Handbook, DPD, GoI, Bhopal Page 25
4.4 State/Crop and Season -wise Revised production Targets of Pulses for the year 2020-21 Production target : Lakh tonnes
State
Arhar Moong Urd Gram Other
kharif
pulses
Other
Rabi
Pulses
Total Pulses
Kharif Kharif Rabi Total Kharif Rabi Total Rabi Kharif Rabi Total
Andhra Pradesh 1.30 0.20 0.90 1.10 0.38 3.19 3.57 6.34 0.14 0.60 2.02 11.03 13.05
Arunachal Pradesh 0.06 0.01 0.01 0.01 0.01 0.02 0.02 0.09 0.10 0.10 0.20
Assam 0.05 0.00 0.10 0.10 0.42 0.42 0.02 0.64 0.47 0.76 1.23
Bihar 0.40 0.10 1.00 1.10 0.13 0.13 0.58 0.10 2.50 0.73 4.08 4.81
Chhattisgarh 0.53 0.06 0.06 0.12 0.29 0.01 0.30 2.50 0.16 2.15 1.04 4.72 5.76
Gujarat 3.45 0.75 0.21 0.96 0.84 0.02 0.86 3.00 0.21 0.25 5.25 3.48 8.73
Haryana 0.05 0.09 0.20 0.29 0.01 0.01 0.60 0.01 0.15 0.16 0.95 1.11
Himachal Pradesh 0.01 0.01 0.04 0.04 0.01 0.11 0.50 0.15 0.52 0.67
Jammu & Kashmir 0.00 0.02 0.02 0.01 0.02 0.03 0.02 0.05
Jharkhand 2.50 0.30 0.01 0.31 1.28 1.28 2.50 0.27 1.40 4.35 3.91 8.26
Karnataka 9.76 1.30 0.05 1.35 0.44 0.03 0.47 8.00 1.40 0.70 12.90 8.78 21.68
Kerala 0.01 0.00 0.00 0.00 0.01 0.02 0.01 0.03 0.04
Madhya Pradesh 9.27 1.50 0.85 2.35 13.00 0.38 13.38 43.00 0.01 6.40 23.78 50.63 74.41
Maharashtra 12.64 1.80 0.01 1.81 1.77 1.77 17.81 0.60 0.65 16.81 18.47 35.28
Odisha 1.30 0.40 0.60 1.00 0.30 0.03 0.33 0.36 0.68 0.90 2.68 1.89 4.57
Punjab 0.03 0.03 0.28 0.31 0.01 0.01 0.04 0.01 0.00 0.08 0.32 0.40
Rajasthan 0.13 11.20 11.20 5.00 5.00 16.86 4.51 0.80 20.84 17.66 38.50
Tamil Nadu 0.62 0.19 0.80 0.99 0.50 2.58 3.08 0.03 0.70 2.01 3.41 5.42
Telangana 2.65 0.54 0.05 0.59 0.26 0.09 0.35 1.50 0.30 0.15 3.75 1.79 5.54
Uttarakhand 0.04 0.00 0.00 0.11 0.11 0.40 0.18 0.55 0.18 0.73
Uttar Pradesh 3.20 0.30 0.40 0.70 3.46 0.45 3.91 6.39 0.05 6.10 7.01 13.34 20.35
West Bengal 0.08 0.01 0.45 0.46 0.48 0.15 0.63 0.40 0.01 2.00 0.58 3.00 3.58
Others 0.13 0.02 0.02 0.04 0.25 0.06 0.31 0.05 0.30 0.80 0.70 0.93 1.63
All India 48.20 18.80 6.00 24.80 29.00 7.00 36.00 110.00 10.00 27.00 106.00 150.00 256.00
Note: Production target of Rabi Mung & Urd includes Spring/Summer production targets.

Brief Handbook, DPD, GoI, Bhopal Page 26
4.5 State/Crop and Season-wise Production Targets of Oilseed Crops (2020-21) Production target : Lakh tonnes
State
Groundnut Soybean R/Mu
stard
Sunflower Castor Sesa-
mum
Saf-
flower
Linseed Niger Total Oilseeds
Kharif Rabi Total Kharif Rabi Kha. Rabi Total Kharif Kharif Rabi Rabi Kharif Kharif Rabi Total
Andhra Pradesh 5.20 2.15 7.35 0.06 0.02 0.05 0.10 0.15 0.19 0.27 0.04 5.81 2.27 8.08
Arunachal Pradesh 0.01 0.01 0.05 0.20 0.00 0.03 0.03 0.12 0.20 0.32
Assam 0.00 1.20 0.00 0.01 0.11 0.05 0.06 0.18 1.25 1.43
Bihar 0.01 0.01 1.00 0.02 0.27 0.29 0.05 0.19 0.08 1.46 1.54
Chhattisgarh 0.50 0.50 1.25 0.20 0.01 0.01 0.10 0.13 0.16 2.02 0.33 2.35
Gujarat 33.95 2.57 36.52 1.60 3.25 0.00 15.54 1.25 0.05 52.39 5.82 58.21
Haryana 0.03 0.03 10.24 0.06 0.06 0.01 0.02 0.06 10.30 10.36
Jammu & Kashmir 0.00 0.50 0.00 0.05 0.01 0.05 0.51 0.56
Jharkhand 0.40 0.40 0.01 1.50 0.01 0.01 0.01 0.08 0.00 0.29 0.07 0.58 1.79 2.37
Karnataka 4.00 1.60 5.60 3.60 0.04 1.27 0.32 1.59 0.30 0.30 0.20 0.01 0.03 9.50 2.17 11.67
Madhya Pradesh 4.00 4.00 73.45 11.20 0.02 0.02 0.08 2.48 0.00 0.70 1.00 81.03 11.90 92.93
Maharashtra 2.60 1.05 3.65 46.96 0.20 0.10 0.05 0.15 0.04 0.07 0.40 0.08 0.06 49.83 1.78 51.61
Manipur 0.03 0.03 0.06 0.25 0.00 0.09 0.25 0.34
Nagaland 0.01 0.01 0.60 0.30 0.01 0.01 0.03 0.06 0.64 0.37 1.01
Odisha 0.25 0.40 0.65 0.01 0.02 0.02 0.17 0.19 0.11 0.07 0.01 0.17 0.45 0.91 0.77 1.68
Punjab 0.03 0.03 0.55 0.10 0.10 0.02 0.05 0.05 0.70 0.75
Rajasthan 16.32 16.32 14.36 42.00 0.00 2.75 1.15 34.58 42.00 76.58
Sikkim 0.00 0.04 0.03 0.00 0.04 0.03 0.07
Tamil Nadu 5.00 4.66 9.66 0.00 0.03 0.08 0.11 0.05 0.40 5.48 4.74 10.22
Telangana 0.50 2.40 2.90 3.72 0.01 0.03 0.10 0.13 0.45 0.20 0.01 4.90 2.52 7.42
Tripura 0.01 0.01 0.02 0.05 0.00 0.05 0.06 0.06 0.12
Uttar Pradesh 1.15 1.15 0.25 10.21 0.08 0.08 1.10 0.25 2.50 10.54 13.04
Uttarakhand 0.03 0.03 0.20 0.15 0.00 0.01 0.24 0.15 0.39
West Bengal 0.04 1.80 1.84 0.04 7.00 0.18 0.18 2.39 0.01 0.05 0.09 2.56 9.04 11.60
Others 0.13 0.03 0.16 0.50 1.00 0.00 0.05 0.02 0.02 0.70 1.05 1.75
All India 74.20 16.67 90.87 146.76 91.12 1.56 1.52 3.08 19.54 10.28 0.63 2.06 2.06 254.40 112.00 366.40

Brief Handbook, DPD, GoI, Bhopal Page 27
4.6 State, Crop and Season -wise Production target of Commercial Crops for the year 2020-21
Production : Lakh tonnes
State Sugarcane Cotton* Jute** Mesta** Jute & Mesta**
Andhra Pradesh 80.00 22.97 0.50 0.50
Assam 12.00 9.20 0.30 9.50
Bihar 150.00 12.00 1.65 13.65
Chhattisgarh 5.00
Gujarat 120.00 105.00
Haryana 85.00 22.00
Karnataka 370.00 16.32
Madhya Pradesh 55.00 20.50
Maharashtra 850.00 90.00
Meghalaya 0.75 0.28 1.03
Mizoram
Nagaland 2.00 0.55 0.13 0.68
Odisha 4.00 0.28 0.33 0.61
Punjab 80.00 4.05
Rajasthan 16.00
Tripura 18.00 0.10 0.10 0.20
Tamil Nadu 165.00
Telangana 30.00 4.00
Uttar Pradesh 1800.00 41.00
Uttarakhand 65.00
West Bengal 20.00 77.00 1.20 78.20
Others 7.00 0.16 0.12 0.51 0.63
All India 3900.00 360.00 100.00 5.00 105.00
* Production in Lakh bales of 170 kg for Cotton.
** Production in Lakh bales of 180 kg for Jute & Mesta

Brief Handbook, DPD, GoI, Bhopal Page 28
A. MADYA PRADESH
5.1 Kharif- 2019: Target/Achievement
(A-lakh ha, P-lakh tons, Y-kg/ha)
S.No Crops Target Achievement % Increase/Decrease
over Target
Area Prod. Yield Area Prod. Yield Area Prod Yield
1 Rice 24.97 43.00 1722 19.82 48.06 2425 -21 12 41
2 Sorghum 1.39 5.00 3597 0.75 1.64 2189 -46 -67 -39
3 Bajra 2.57 4.50 1751 2.99 5.74 1921 16 28 10
4 Maize 13.68 35.20 2573 12.56 40.90 3256 -8 16 27
5 Kodo kutki, Others
(SM & Ragi)
1.35 1.55 1148 0.89 0.59 663 -34 -62 -42
6 Arhar 4.47 9.27 2074 2.52 3.10 1230 -44 -67 -41
7 Urdbean(Kh.) 16.60 13.38 806 17.52 8.85 505 6 -34 -37
8 Mungbean (Kh+R) 1.92 2.35 1224 2.70 1.44 532 41 -39 -57
9 Other Pulses 0.13 0.01 77 0.21 0.11 542 61 1034 604
10 Soybean 56.32 73.44 1304 61.94 62.56 1010 10 -15 -23
11 Groundnut 2.36 4.00 1695 2.18 2.63 1205 -8 -34 -29
12 Sesame 4.42 2.48 561 3.14 1.50 478 -29 -39 -15
13 Other Oilseeds 0.55 1.10 1890 0.96 0.34 352 75 -69 -81
14 Cotton 6.14 20.50 568 6.10 19.30 538 -1 -6 -5
Total Cereals 43.96 89.25 2030 37.01 96.93 2619 -16 9 29
Total Pulses 23.12 25.01 1082 22.95 13.50 588 -1 -46 -46
Total Food grain 67.08 114.26 1703 59.96 110.43 1842 -11 -3 8
Total Oilseeds 63.65 81.02 1273 68.23 67.03 982 7 -17 -23
Total Commercial 6.14 20.50 568 6.10 19.30 538 -1 -6 -5
Total All Crops 136.87 215.78 1577 134.29 196.76 1465 -2 -9 -7
Source- DES. GoI, Ministry of Agri. &FW, N.Delhi, Achievments- 3rd advance estimate of Kharif 2019.

Brief Handbook, DPD, GoI, Bhopal Page 29
5.2 Rabi-2019-20: Target/Achievement
(A-lakh ha, P-lakh tons, Y-kg/ha)
S.No
Crops Target Achievement % Increase/Decrease
over Target
Area Prod. Yield Area Prod. Yield Area Prod. Yield
1 Wheat 57.27 160.00 2794 60.28 185.83 3083 5 16 10
2 Barley & other 0.90 3.00 3333 0.30 0.52 1735 -67 -83 -48
3 Maize 0.32 2.00 6161 0.11 0.42 3809 -66 -79 -38
4 Gram 31.68 47.00 1483 19.27 26.06 1352 -39 -45 -9
5 Other Pulses 11.70 8.40 718 5.57 6.12 1099 -52 -27 53
6 R&M 7.10 10.00 1409 6.70 7.42 1108 -6 -26 -21
7 Linseed & other 1.40 0.70 500 0.52 0.29 563 -63 -58 13
8 Sugarcane 0.95 48.00 50304 1.25 31.66 25330 31 -34 -50
Total Cereals 58.50 165.00 2821 60.69 186.77 3077 4 13 9
Total Pulses 43.38 55.40 1277 24.84 32.18 1295 -43 -42 1
Total Food grain 101.88 220.40 2163 85.53 218.95 2560 -16 -1 18
Total Oilseeds 8.50 10.70 1259 7.22 7.72 1069 -15 -28 -15
Total Commercial 0.95 48.00 50304 1.25 31.66 25330 31 -34 -50
Total Crops 111.33 279.10 2507 94.00 258.33 2748 -16 -7 10
Source- DES. GoI, Ministry of Agri. &FW, N.Delhi, Achievments- 3rd advance estimate of Rabi 2019-20.
5.3 Kharif Target : 2020
(A-Lakh ha, P-Lakh tonnes, Y-kg/ha)
Crop Name Area Production Productivity
Paddy 25.00 45.50 1820
Maize 16.00 37.22 2326
Sorghum 0.50 4.00 8000
Bajra 3.00 5.01 1670
Kodo-Kutki 1.50 1.60 1067
Total Cereals 46.00 93.33 2029
Pigeonpea 5.26 9.27 1762
Mungbean 2.00 1.50 750
Urdbean 16.50 13 788
Kulthi & Others 0.16 0.01 63
Total Pulses 23.92 23.78 994
Total foodgrain 69.92 117.11 1675
Groundnut 2.22 4.00 1802
Sesame 3.14 2.48 790
Soybean 56.00 73.45 1312
Niger & Others 0.90 1.10 1222
Cotton 6.09 20.5 572
Total Oilseeds 62.26 81.03 1301
Grand Total 138.27 218.64 1581
Source: Area- State Deptt. of Agriculture, Govt. of, MP; Prod.- DES. GoI.

Brief Handbook, DPD, GoI, Bhopal Page 30
B. CHHATTISGARH
5.4 Kharif- 2019: Target/Achievement
(A-Lakh ha, P-Lakh tonnes, Y-kg/ha)
S.No Crops Target Achievement % Increase/Decrease
over Target
Area Prod. Yield Area Prod. Yield Area Prod Yield
1 Rice 36.70 68.00 1853 36.66 65.00 1773 -0.1 -4 -4
2 Sorghum 0.05 0.04 0.03 712 -48
3 Maize 2.29 3.00 1312 1.30 2.94 2271 -43 -2 73
4 Kodo kutki, Others
(SM & Ragi)
0.82 0.30 368 0.79 0.20 252 -4 -34 -31
5 Arhar 1.50 0.53 353 0.50 0.26 518 -67 -51 47
6 Urdbean (Kh+R) 1.77 0.30 169 0.78 0.26 331 -56 -14 95
7 Mungbean (Kh+R) 0.37 0.12 323 0.10 0.04 402 -74 -68 25
8 Other Pulses 0.40 0.16 400 0.39 0.15 391 -2 -4 -2
9 Soybean 1.20 1.25 1042 0.72 0.53 735 -40 -58 -29
10 Groundnut 0.65 0.50 769 0.26 0.38 1448 -60 -24 88
11 Sesame 0.40 0.10 250 0.15 0.06 388 -62 -41 55
12 Other Oilseeds 0.71 0.17 239 0.52 0.10 190 -27 -42 -21
Total Cereals 39.80 71.35 1793 38.78 68.16 1758 -3 -4 -2
Total Pulses 4.04 1.11 275 1.77 0.71 401 -56 -36 46
Total Food grain 43.84 72.46 1653 40.54 68.87 1699 -8 -5 3
Total Oilseeds 2.96 2.02 682 1.65 1.07 646 -44 -47 -5
Total All Crops 46.81 74.48 2335 42.19 69.94 2345 -10 -6 0
Source- DES. GoI, Ministry of Agri. &FW, N.Delhi, Achievments- 3rd advance estimate of Rabi 2019-20.
5.5 Rabi 2019-20: Target/Achievement
(A-Lakh ha, P-Lakh tonnes, Y-kg/ha)
S.No Crops Target Achievement % Increase/Decrease
over Target
Area Prod. Yield Area Prod. Yield Area Prod. Yield
1 Wheat 1.05 1.50 1430 0.93 1.44 1548 -12 -4 8
2 Jowar & Others 0.02 0.04 1717 0.02 0.01 792 -25 -66 -54
3 Gram 2.97 2.50 841 3.12 3.20 1026 5 28 22
4 Other Pulses 3.33 2.15 646 1.81 0.92 508 -46 -57 -21
5 R&M 0.46 0.20 434 0.37 0.18 488 -19 -9 13
6 Linseed & other 0.29 0.13 453 0.15 0.04 274 -48 -69 -39
7 Sugarcane 0.21 5.00 23277 0.35 17.43 50180 62 249 116
Total Cereals 1.07 1.54 1436 0.95 1.45 1534 -12 -6 7
Total Pulses 6.30 4.65 738 4.93 4.12 836 -22 -11 13
Total Food grain 7.37 6.19 840 5.87 5.57 949 -20 -10 13
Total Oilseeds 0.75 0.33 441 0.52 0.22 427 -31 -33 -3
Total Commercial 0.21 5.00 23277 0.35 17.43 50180 62 249 116
Total Crops 8.34 11.52 1382 6.74 23.22 3446 -19 102 149
Source- DES. GoI, Ministry of Agri. &FW, N.Delhi, Achievments- 3rd advance estimate of Rabi 2019-20.

Brief Handbook, DPD, GoI, Bhopal Page 31
5.6 Kharif Target : 2020
(A-Lakh ha, P-Lakh tonnes, Y-kg/ha)
Crop Name Area Production Productivity
Paddy 37.00 71.50 1932
Maize 2.38 3.00 1261
Sorghum, Kodo-Kutki & other SM 0.90 0.37 411
Total Cereals 40.28 74.87 1859
Pigeonpea 1.30 0.53 408
Mungbean 0.31 0.06 194
Urdbean 1.59 0.29 183
Kulthi & Others 0.43 0.16 370
Total Pulses 3.63 1.04 287
Total foodgrain 43.91 75.91 1729
Groundnut 0.56 0.50 888
Sesame 0.38 0.10 262
soybean 1.20 1.25 1042
Niger & Others 0.71 0.17 241
Total Oilseeds 2.85 2.02 709
Fibre & Other Crops 1.44 0
Grand Total 48.20 77.93 1617
Source: Area- State Deptt. of Agriculture, Govt. of, CG; Prod.- DES. GoI.

Brief Handbook, DPD, GoI, Bhopal Page 32
6.1 Global Scenario: Crop-Wise
{Area-lakh ha, Production-lakh tonnes, Yield-kg/ha}
Crop Area % to Total Production % to Total Productivity
Chickpea 178.15 19 171.92 19 965.07
Lentil 61.01 6 63.33 7 1038.10
Pigeon pea 69.93 7 59.61 6 852.42 Pea 78.78 8 135.34 15 1717.96
Beans 344.96 36 304.34 33 882.26
Total Pulses 957.20 922.78 964.04
Source: FAO Statistics 2018.
6.2 Total Pulses
{Area- lakh ha, Production-Lakh Tones, Yield-kg/ha}
Country Area %
Cont. Country Prod. % Cont. Country Yield
India 364.51 38 India 254.06 28 Canada 1950
Niger 60.42 6 Canada 63.25 7 USA 1907 Myanmar 37.82 4 Myanmar 61.84 7 Ethiopia 1869
Canada 32.44 3 China 50.27 5 China 1821
Nigeria 30.03 3 Russ. Fed. 34.36 4 Myanmar 1635 Brazil 28.75 3 USA 34.06 4 Russ. Fed. 1304
China 27.61 3 Ethiopia 30.90 3 Australia 1097
Russ. Fed. 26.36 3 Brazil 29.30 3 Brazil 1019
Australia 25.01 3 Australia 27.45 3 Tanzania 977
Others 324.27 34 Others 337.31 37 India 697
World 957.20
World 922.78
World 964
Source: FAO Statistics 2018.
6.3 Chickpea
{Area- Lakh ha, Production-Lakh Tonnes, Yield-kg/ha}
Country Area % Cont. Country Prod. % Cont. Country Yield
India 118.99 67 India 113.80 66 Ethiopia 2138
Australia 10.75 6 Australia 9.98 6 Mexico 1810 Pakistan 9.77 5 Turkey 6.30 4 Canada 1769
Russ.Fed. 8.19 5 Russ.Fed. 6.20 4 USA 1695
Turkey 5.14 3 USA 5.78 3 Myanmar 1384 Iran 5.01 3 Ethiopia 5.16 3 Spain 1295
Myanmar 3.68 2 Myanmar 5.10 3 Turkey 1225
USA 3.41 2 Mexico 3.52 2 Argentina 1070
Ethiopia 2.41 1 Pakistan 3.23 2 Tanzania 949 Mexico 1.94 1 Canada 3.11 2 Australia 928
Others 8.84 5 Others 9.74 6 India 956
World 178.15 World 171.92 World 965
Source: FAO, Statistics 2018

Brief Handbook, DPD, GoI, Bhopal Page 33
6.4 Pigeonpea
(Area-Lakh ha, Production-Lakh tonnes, Yield- kg/ha)
Country Area %Cont. Country Prod. %Cont. Country Yield
India 55.83 80 India 42.90 72 Philippines 1857
Myanmar 5.33 8 Myanmar 6.76 11 Malawi 1743 Tanzania 3.00 4 Malawi 4.35 7 Myanmar 1270
Malawi 2.50 4 Tanzania 3.16 5 Burundi 1147
Kenya 1.37 2 Haiti 0.88 1 Dom. Republic 1076
Haiti 0.89 1 Kenya 0.86 1 Tanzania 1053 Uganda 0.40 1 Dom. Republic 0.25 0.4 Nepal 987
Others 0.62 1 Others 0.46 0.8 India 768
World 69.93 World 59.61 World 852
Source: FAO, Statistics 2018
6.5 Lentil
{Area- lakh ha, Production-Lakh Tones, Yield-kg/ha}
Country Area %
Cont.
Country Prod. %
Cont.
Country Yield
India 22.15 36 Canada 20.92 33 China 2567
Canada 14.99 25 India 16.20 26 France 1442
Kazakhstan 2.95 5 USA 3.81 6 Ethiopia 1409
USA 2.91 5 Turkey 3.53 6 Canada 1395
Turkey 2.59 4 Australia 2.55 4 Turkey 1361
Russian Federation 2.48 4 Kazakhstan 2.54 4 USA 1313
Australia 2.29 4 Nepal 2.49 4 Nepal 1256
Nepal 1.99 3 Russ. Fed. 1.95 3 Bangladesh 1142
Bangladesh 1.55 3 Bangladesh 1.77 3 Australia 1115
Iran 1.47 2 China 1.72 3 Kazakhstan 861
Others 5.65 9 Others 5.85 9 India 731
World 61.01 World 63.33 World 1038
Source: FAO, Statistics 2018
6.6 Fieldpea
{Area- lakh ha, Production-Lakh Tones, Yield-kg/ha}
Country Area %Cont. Country Prod. %Cont. Country Yield
Canada 14.31 18 Canada 35.81 26 France 3301
Russ. Fed 13.86 18 Russ. Fed. 23.04 17 Germany 2788
China 10.00 13 China 15.25 11 Canada 2502
India 9.98 13 India 9.20 7 USA 2210
Ukraine 4.26 5 Ukraine 7.76 6 Lithuania 2012
USA 3.27 4 USA 7.23 5 Ukraine 1820
Australia 2.91 4 France 6.16 5 Spain 1762
Ethiopia 2.31 3 Ethiopia 3.75 3 Russ. Fed. 1663
Tanzania 1.99 3 Australia 3.17 2 Ethiopia 1625
Others 15.90 20 Others 23.97 18 India 923
World 78.78 World 135.34 World 1718
Source: FAO, Statistics 2018

Brief Handbook, DPD, GoI, Bhopal Page 34
6.7 Pulse importing and exporting countries of major pulses (2018-19)
Pulses Top 5 Export Destinations Top 5 Import Sources
Peas
(PisumSativum)
Shri Lanka DSR (48.5%), Nepal
(12.6%), U S A (11.1%), Australia
(4.1 %), Qatar (3.3%),
Canada (39.1%), Ukraine (20.4%),Russia
(16.3%), Lithuania (5.5%),Netherland (4.2%)
Chickpeas
(Garbanzos)
Algeria (20.8%), U Arab EMTS (9.8%),
Shri Lanka DSR (8.4%), Turkey (6.9%),
Morocco (5.4%
Sudan (31.9%), Myanmar (20.2%), Tanzania
(18.9%), Ethiopia (5.8%), USA (4.5%),
Moong/Urad USA (37.7%), UK (12.4%), Canada (12.3%), Nepal (8.3%), Qatar (5.9%)
Myanmar (80.3%), Kenya (4.9%), Mozambique (2.9%), Australia (2.3%),
Tanzania (2.0%)
Lentils (Masur) Bangladesh (48.5%), Qatar (12.0%), Sri
Lanka DSR (10.2%), USA (7.8%), Nepal (4.5%)
Canada (81.8%), Australia (6.2%), USA
(4.2%), Netherland (4.2%), Singapore (2.6%)
Pigeon Peas(Tur) USA (57.8%), Canada (15.7%), U Arab
EMTS (6.8%), Australia (3.4%),
Singapore (2.6%)
Mozambique (44.2%), Myanmar (30.2%),
Tanzania (14.0%), Malawi (5.5%), Sudan
(5.2%),
(%) figures in parenthesis indicates percentage share of global import/export
6.8 Import/Export: Chickpea (2018-19)
(Quantity-Thousand Tonnes)
S.No. Import Export
Country Area % Share Country Prod. % Share
1 Sudan 67.21 36 Algeria 43.68 19
2 Myanmar 36.15 19 U Arab Emts 25.52 11
3 Tanzania Rep 30.76 17 Sri Lanka Dsr 19.87 9
4 Ethiopia 10.58 6 Turkey 13.77 6 5 Russia 7.01 4 Morocco 11.28 5
6 Australia 7.00 4 Pakistan Ir 9.95 4
7 U S A 5.95 3 Saudi Arab 8.54 4 8 Singapore 5.68 3 Iran 8.44 4
9 Turkey 5.19 3 Egypt A Rp 8.21 4
10 U Arab Emts 4.59 2 U K 7.93 3 11 Others 5.81 3 Others 71.63 31
Total 185.95 228.82
6.9 Import/Export: Pigeonpea (2018-19)
(Quantity-Thousand Tonnes)
S.No IMPORT EXPORT
Country Area % Share Country Prod. % Share
1 Mozambique 209.27 39 U S A 4.57 49
2 Myanmar 173.57 33 Canada 1.81 19
3 Tanzania Rep 77.23 15 U Arab Emts 1.04 11
4 Malawi 34.71 7 Australia 0.31 3
5 Sudan 30.79 6 Singapore 0.23 3
6 Singapore 1.84 0.3 Sri Lanka Dsr 0.18 2
7 Uganda 1.17 0.2 U K 0.17 2
8 Kenya 1.00 0.2 Malaysia 0.14 2
9 Others 1.10 0.2 Others 0.87 9
Total 530.67 9.33
Source: Ministry of Commerce and Industry;

Brief Handbook, DPD, GoI, Bhopal Page 35
6.10 Import & Export: Lentil (2018-19)
(Quantity-Thousand Tonnes)
S.No. IMPORT EXPORT
Country Area % Share Country Prod. % Share
1 Canada 204.23 82 Bangladesh Pr 6.76 45
2 Australia 14.96 6 Qatar 2.31 15
3 Netherland 10.87 4 Sri Lanka Dsr 2.27 15
4 U S A 9.05 4 Nepal 0.85 6
5 Singapore 7.36 3 U S A 0.81 5
6 U Arab Emts 1.77 0.7 Singapore 0.39 3
7 Turkey 0.29 0.1 U K 0.24 2
8 Algeria 0.25 0.1 Netherland 0.23 2
9 Others 0.19 0.1 Others 1.20 8
Total 248.97 15.07
Source: Ministry of Commerce and Industry;
6.11 Import/Export: Fieldpea (2018-19)
(Quantity-Thousand Tonnes)
S. No. IMPORT EXPORT
Country Aveg.* % Share Country Aveg.* % Share
1 Sri Lanka 1.34 62 Canada 313.40 37
2 Nepal 0.29 13 Ukraine 179.27 21
3 U S A 0.11 5 Russia 148.67 17
4 Bangladesh 0.11 5 Lithuania 53.46 6
5 Qatar 0.08 4 Netherland 37.83 4
6 Australia 0.04 2 Turkey 30.89 4
7 Russia 0.04 2 U Arab Emts 25.57 3
8 U Arab Emts 0.02 1 U S A 14.99 2
9 Others 0.14 6 Others 47.33 6
Total 2.18 Total 851.41
Source: Ministry of Commerce and Industry

Brief Handbook, DPD, GoI, Bhopal Page 36
A. MAJOR PRODUCING STATES (>90%) : CEREAL CROPS (KHARIF & RABI)
7.1 RICE (KHARIF + RABI)
(Area-Lakh ha, Production Lakh Tonnes; Yield-kg/ha)
S.No. States Area Contri. (%) Prod. Contri. (%) Yield
1 West Bengal 54.05 12 154.29 14 2855
2 Uttar Pradesh 58.58 13 134.48 12 2296
3 Punjab 29.87 7 121.44 11 4066
4 Andhra Pradesh 22.05 5 77.15 7 3499
5 Odisha 39.18 9 73.57 7 1878
6 Bihar 32.60 7 71.29 6 2187
7 Chhattisgarh 37.64 9 63.24 6 1680
8 Tamil Nadu 17.58 4 56.77 5 3230
9 Telangana 16.07 4 51.19 5 3184
10 Assam 24.61 6 51.16 5 2079
11 Haryana 13.79 3 43.29 4 3139
12 Madhya Pradesh 21.78 5 40.03 4 1838
13 Jharkhand 16.14 4 34.12 3 2114
14 Karnataka 11.20 3 31.23 3 2787
All Above 395.15 (90%) 1003.24 (91%) 2539
All India 439.07 1097.65 2500
7.2 WHEAT (RABI)
(Area-Lakh ha, Production Lakh Tonnes; Yield-kg/ha)
S.No. States Area Contri. (%) Prod. Contri. (%) Yield
1 Uttar Pradesh 96.88 32 285.04 30 2942
2 Madhya Pradesh 57.55 19 170.33 18 2959
3 Punjab 35.08 12 167.32 17 4770
4 Haryana 25.46 8 113.18 12 4446
5 Rajasthan 29.89 10 96.26 10 3220
6 Bihar 21.26 7 52.81 5 2484
7 Gujarat 9.63 3 27.51 3 2857
All Above 275.75 (91%) 912.45 (95%) 3309
All India 303.28 961.58 3171

Brief Handbook, DPD, GoI, Bhopal Page 37
7.3 SORGHUM /JOWAR (KHARIF + RABI)
(Area-Lakh ha, Production Lakh Tonnes; Yield-kg/ha)
S.No. States Area Contri. (%) Prod. Contri. (%) Yield
1 Maharashtra 26.84 50 16.22 36 604
2 Karnataka 10.26 19 10.01 22 976
3 Tamil Nadu 3.45 6 4.06 9 1175
4 Rajasthan 5.90 11 3.94 9 667
5 Madhya Pradesh 1.98 4 3.78 8 1909
6 Andhra Pradesh 1.42 3 2.74 6 1935
7 Uttar Pradesh 1.64 3 1.70 4 1038
8 Gujarat 1.04 2 1.41 3 1355
All Above 52.53 (98%) 43.86 (97%) 835
All India 53.96 45.06 835
7.4 PEARL MILLET/BAJRA (KHARIF)
(Area-Lakh ha, Production Lakh Tonnes; Yield-kg/ha)
S.No. States Area Contri. (%) Prod. Contri. (%) Yield
1 Rajasthan 41.38 57 39.40 44 952
2 Uttar Pradesh 9.27 13 17.79 20 1918
3 Gujarat 4.15 6 8.70 10 2098
4 Haryana 4.21 6 7.77 9 1845
5 Madhya Pradesh 2.82 4 6.25 7 2219
6 Maharashtra 7.80 11 5.34 6 685
7 Karnataka 2.11 3 2.22 2 1051
All Above 71.74 (98%) 87.47 (98%) 1219
All India 72.98 89.71 1229
7.5 MAIZE (KHARIF+RABI)
(Area-Lakh ha, Production Lakh Tonnes; Yield-kg/ha)
S.No. States Area Contri. (%) Prod. Contri. (%) Yield
1 Karnataka 13.15 14 36.90 14 2807
2 Madhya Pradesh 12.27 13 31.44 12 2562
3 Bihar 6.96 8 24.77 10 3560
4 Maharashtra 10.56 11 24.60 10 2328
5 Telangana 6.48 7 22.72 9 3507
6 Tamil Nadu 3.41 4 21.87 8 6406
7 Andhra Pradesh 2.78 3 17.77 7 6403
8 Rajasthan 8.79 10 15.56 6 1770
9 Uttar Pradesh 7.23 8 14.47 6 2000
10 West Bengal 1.94 2 9.90 4 5115
11 Himachal Pradesh 2.90 3 7.08 3 2443
12 Gujarat 4.06 4 6.95 3 1711
All Above 80.53 (87%) 234.03 (92%) 2906
All India 92.06 258.22 2805

Brief Handbook, DPD, GoI, Bhopal Page 38
7.6 RAGI (KHARIF)
(Area-Lakh ha, Production Lakh Tonnes; Yield-kg/ha)
S.No. States Area Contri. (%) Prod. Contri. (%) Yield
1 Karnataka 6.63 61 10.62 63 1601
2 Tamil Nadu 0.84 8 2.63 15 3118
3 Uttarakhand 1.04 10 1.43 8 1373
4 Maharashtra 0.94 9 1.05 6 1113
5 Andhra Pradesh 0.33 3 0.38 2 1164
6 Odisha 0.45 4 0.31 2 705
7 Gujarat 0.16 2 0.16 1 956
8 Jharkhand 0.17 2 0.14 1 842
All Above 10.57 (97%) 16.72 (98%) 1582
All India 10.90 16.98 1559
7.7 SMALL MILLETS (KHARIF)
(Area-Lakh ha, Production Lakh Tonnes; Yield-kg/ha)
S.No. States Area Contri. (%) Prod. Contri. (%) Yield
1 Madhya Pradesh 1.45 25 0.92 23 637
2 Uttarakhand 0.60 10 0.78 19 1292
3 Tamil Nadu 0.26 5 0.32 8 1222
4 Maharashtra 0.66 12 0.31 8 469
5 Arunachal Pradesh 0.22 4 0.27 7 1213
6 Chhattisgarh 0.96 17 0.24 6 246
7 Andhra Pradesh 0.27 5 0.22 5 801
8 Gujarat 0.17 3 0.19 5 1123
9 Karnataka 0.25 4 0.14 4 574
10 Odisha 0.27 5 0.14 3 509
11 Nagaland 0.09 2 0.10 3 1119
All Above 5.21 (92%) 3.63 (91%) 697
All India 5.72 3.98 696
7.8 BARLEY (RABI)
(Area-Lakh ha, Production Lakh Tonnes; Yield-kg/ha)
S.No. States Area Contri. (%) Prod. Contri. (%) Yield
1 Rajasthan 2.75 43 8.52 52 3096
2 Uttar Pradesh 1.52 24 3.81 23 2507
3 Madhya Pradesh 1.02 16 1.99 12 1956
4 Haryana 0.23 4 0.81 5 3453
5 Himachal Pradesh 0.20 3 0.36 2 1763
6 Punjab 0.09 1 0.32 2 3728
7 Uttarakhand 0.21 3 0.26 2 1222
All Above 6.02 (94%) 16.05 (98%) 2667
All India 6.38 16.42 2575

Brief Handbook, DPD, GoI, Bhopal Page 39
7.9 COARSE CEREALS (KHARIF)
(Area-Lakh ha, Production Lakh Tonnes; Yield-kg/ha)
S.No. States Area Contri. (%) Prod. Contri. (%) Yield
1 Rajasthan 56.16 30 58.83 19 1047
2 Karnataka 22.02 12 47.52 15 2158
3 Madhya Pradesh 18.41 10 41.90 13 2276
4 Uttar Pradesh 17.61 10 32.48 10 1844
5 Maharashtra 22.89 12 29.30 9 1280
6 Tamil Nadu 5.25 3 18.59 6 3543
7 Telangana 5.58 3 15.05 5 2699
8 Gujarat 8.29 4 14.94 5 1804
9 Haryana 4.78 3 8.21 3 1718
10 Himachal Pradesh 2.96 2 7.13 2 2406
11 Bihar 2.62 1 6.16 2 2354
12 Andhra Pradesh 2.17 1 5.27 2 2426
All Above 168.73 (91%) 285.39 (91%) 1691
All India 184.85 313.89 1698
7.10 COARSE CEREALS (RABI)
(Area-Lakh ha, Production Lakh Tonnes; Yield-kg/ha)
S.No. States Area Contri. (%) Prod. Contri. (%) Yield
1 Bihar 4.60 8 18.94 16 4115
2 Maharashtra 24.01 42 18.28 16 761
3 Andhra Pradesh 2.97 5 16.42 14 5526
4 Karnataka 10.39 18 12.37 11 1191
5 Tamil Nadu 3.26 6 11.66 10 3574
6 Rajasthan 2.79 5 8.67 7 3107
7 Telangana 1.76 3 8.55 7 4865
8 West Bengal 1.46 3 8.52 7 5827
9 Uttar Pradesh 2.13 4 5.33 5 2505
10 Madhya Pradesh 1.15 2 2.49 2 2160
All Above 54.52 (96%) 111.23 (95%) 2040
All India 57.14 116.48 2038
7.11 TOTAL COARSE CEREALS (KHARIF + RABI)
(Area-Lakh ha, Production Lakh Tonnes; Yield-kg/ha)
S.No. States Area Contri. (%) Prod. Contri. (%) Yield
1 Rajasthan 58.95 24 67.50 16 1145
2 Karnataka 32.40 13 59.90 14 1848
3 Maharashtra 46.90 19 47.58 11 1014
4 Madhya Pradesh 19.56 8 44.39 10 2269
5 Uttar Pradesh 19.74 8 37.81 9 1916
6 Tamil Nadu 8.51 4 30.24 7 3555
7 Bihar 7.22 3 25.10 6 3477
8 Telangana 7.33 3 23.60 5 3218
9 Andhra Pradesh 5.15 2 21.70 5 4216
10 Gujarat 9.61 4 17.43 4 1815
All Above 222.46 (92%) 394.32 (92%) 1773
All India 242.00 430.37 1778

Brief Handbook, DPD, GoI, Bhopal Page 40
7.12 CEREALS (KHARIF)
(Area-Lakh ha, Production Lakh Tonnes; Yield-kg/ha)
S.No. States Area Contri. (%) Prod. Contri. (%) Yield
1 Uttar Pradesh 75.92 13 166.21 13 2189
2 Punjab 31.04 5 125.74 10 4051
3 West Bengal 41.82 7 112.28 9 2685
4 Madhya Pradesh 40.07 7 81.65 6 2037
5 Bihar 34.47 6 75.68 6 2196
6 Karnataka 31.30 5 72.99 6 2332
7 Tamil Nadu 21.30 4 69.23 5 3250
8 Odisha 38.08 7 67.08 5 1762
9 Chhattisgarh 39.93 7 66.25 5 1659
10 Rajasthan 58.04 10 63.01 5 1086
11 Maharashtra 37.47 6 57.52 5 1535
All Above 485.36 (83%) 1061.19 (84%) 2186
All India 582.14 1270.45 2182
7.13 CEREALS (RABI)
(Area-Lakh ha, Production Lakh Tonnes; Yield-kg/ha)
S.No. States Area Contri. (%) Prod. Contri. (%) Yield
1 Uttar Pradesh 99.28 25 291.13 24 2932
2 Madhya Pradesh 58.83 15 173.11 14 2943
3 Punjab 35.17 9 167.64 14 4767
4 Haryana 25.69 6 113.99 9 4437
5 Rajasthan 32.68 8 104.93 9 3210
6 Bihar 26.61 7 73.52 6 2763
7 West Bengal 16.76 4 58.89 5 3514
8 Andhra Pradesh 9.83 2 46.80 4 4761
9 Maharashtra 34.66 9 33.58 3 969
10 Gujarat 11.35 3 31.24 3 2753
All Above 350.86 (87%) 1094.84 (90%) 3120
All India 402.20 1219.15 3031
7.14 TOTAL CEREALS (KHARIF + RABI)
(Area-Lakh ha, Production Lakh Tonnes; Yield-kg/ha)
S.No. States Area Contri. (%) Prod. Contri. (%) Yield
1 Uttar Pradesh 175.19 18 457.33 18 2610
2 Punjab 66.20 7 293.38 12 4432
3 Madhya Pradesh 98.90 10 254.76 10 2576
4 West Bengal 58.58 6 171.17 7 2922
5 Rajasthan 90.72 9 167.95 7 1851
6 Haryana 44.26 4 165.49 7 3739
7 Bihar 61.08 6 149.20 6 2443
8 Andhra Pradesh 27.19 3 98.85 4 3635
9 Karnataka 45.37 5 93.09 4 2052
10 Maharashtra 72.13 7 91.11 4 1263
11 Tamil Nadu 26.08 3 87.01 3 3336
All Above 765.72 (78%) 2029.32 (82%) 2650
All India 984.34 2489.60 2529

Brief Handbook, DPD, GoI, Bhopal Page 41
B. MAJOR PRODUCING STATES (> 90%) : PULSES CROPS (KHARIF & RABI)
7.15 PIGEONPEA /TUR (KHARIF)
(Area-Lakh ha, Production Lakh Tonnes; Yield-kg/ha)
S.No. States Area Contri. (%) Prod. Contri. (%) Yield
1 Maharashtra 12.77 29 9.48 27 743
2 Karnataka 9.93 22 6.67 19 671
3 Madhya Pradesh 5.30 12 5.87 16 1108
4 Gujarat 2.63 6 3.08 9 1169
5 Uttar Pradesh 2.85 6 2.65 7 930
6 Jharkhand 2.11 5 2.14 6 1016
7 Telangana 2.96 7 1.86 5 628
8 Odisha 1.39 3 1.27 4 918
9 Andhra Pradesh 2.50 6 1.01 3 405
10 Tamil Nadu 0.56 1 0.55 2 980
All Above 42.99 (97%) 34.58 (98%) 804
All India 44.29 35.69 806
7.16 CHICKPEA /GRAM (RABI)
(Area-Lakh ha, Production Lakh Tonnes; Yield-kg/ha)
S.No. States Area Contri. (%) Prod. Contri. (%) Yield
1 Madhya Pradesh 31.57 34 36.93 41 1170
2 Maharashtra 16.99 18 13.63 15 802
3 Rajasthan 13.83 15 13.38 15 967
4 Karnataka 11.51 12 6.57 7 571
5 Uttar Pradesh 4.92 5 4.93 5 1001
6 Andhra Pradesh 4.42 5 4.21 5 953
7 Chhattisgarh 3.06 3 3.04 3 993
8 Gujarat 1.81 2 2.29 3 1265
9 Jharkhand 1.92 2 2.21 2 1152
10 Telangana 0.86 1 1.15 1 1327
All Above 90.89 (98%) 88.33 (98%) 972
All India 92.77 90.17 972
7.17 URDBEAN (KHARIF)
(Area-Lakh ha, Production Lakh Tonnes; Yield-kg/ha)
S.No. States Area Contri. (%) Prod. Contri. (%) Yield
1 Madhya Pradesh 14.38 40 8.29 42 577
2 Rajasthan 5.13 14 2.86 15 558
3 Uttar Pradesh 5.54 16 2.78 14 501
4 Maharashtra 3.24 9 1.22 6 378
5 Jharkhand 1.24 3 1.06 5 856
6 Gujarat 1.11 3 0.70 4 627
7 Tamil Nadu 0.59 2 0.48 2 803
8 West Bengal 0.65 2 0.45 2 690
9 Karnataka 0.88 2 0.37 2 425
10 Andhra Pradesh 0.38 1 0.31 2 820
All Above 33.14 (92%) 18.53 (94%) 559
All India 35.53 19.64 553

Brief Handbook, DPD, GoI, Bhopal Page 42
7.18 URDBEAN (RABI)
(Area-Lakh ha, Production Lakh Tonnes; Yield-kg/ha)
S.No. States Area Contri. (%) Prod. Contri. (%) Yield
1 Andhra Pradesh 3.60 40 3.13 45 868
2 Tamil Nadu 3.54 40 2.47 36 698
3 Assam 0.57 6 0.37 5 659
4 Madhya Pradesh 0.27 3 0.33 5 1222
5 Uttar Pradesh 0.47 5 0.30 4 639
6 West Bengal 0.12 1 0.11 2 958
7 Telangana 0.08 1 0.06 1 834
8 Odisha 0.09 1 0.04 1 496
All Above 8.73 (97%) 6.82 (99%) 781
All India 8.93 6.94 777
7.19 TOTAL URDBEAN (KHARIF +RABI)
(Area-Lakh ha, Production Lakh Tonnes; Yield-kg/ha)
S.No. States Area Contri. (%) Prod. Contri. (%) Yield
1 Madhya Pradesh 14.65 33 8.62 32 589
2 Andhra Pradesh 3.98 9 3.44 13 863
3 Uttar Pradesh 6.01 14 3.08 12 512
4 Tamil Nadu 4.13 9 2.95 11 713
5 Rajasthan 5.13 12 2.86 11 558
6 Maharashtra 3.24 7 1.22 5 378
7 Jharkhand 1.24 3 1.06 4 856
8 Gujarat 1.15 3 0.73 3 633
9 West Bengal 0.77 2 0.56 2 731
10 Karnataka 0.94 2 0.40 2 428
All Above 41.24 (94%) 24.93 (95%) 604
All India 44.46 26.58 598
7.20 MUNGBEAN (KHARIF)
(Area-Lakh ha, Production Lakh Tonnes; Yield-kg/ha)
S.No. States Area Contri. (%) Prod. Contri. (%) Yield
1 Rajasthan 16.16 53 7.66 57 474
2 Maharashtra 4.08 13 1.55 12 380
3 Karnataka 3.64 12 0.97 7 265
4 Madhya Pradesh 1.79 6 0.91 7 508
5 Gujarat 1.05 3 0.54 4 512
6 Telangana 0.92 3 0.53 4 570
7 Odisha 1.12 4 0.34 3 301
8 Tamil Nadu 0.30 1 0.20 2 688
9 Jharkhand 0.27 1 0.20 2 760
10 Uttar Pradesh 0.45 1 0.16 1 356
All Above 29.78 (97%) 13.06 (99%) 439
All India 30.49 13.46 441

Brief Handbook, DPD, GoI, Bhopal Page 43
7.21 MUNGBEAN (RABI)
(Area-Lakh ha, Production Lakh Tonnes; Yield-kg/ha)
S.No. States Area Contri. (%) Prod. Contri. (%) Yield
1 Madhya Pradesh 1.74 18 1.28 21 736
2 Bihar 1.61 16 1.04 17 647
3 Andhra Pradesh 1.29 13 0.92 15 713
4 Tamil Nadu 1.67 17 0.83 14 496
5 Odisha 1.61 16 0.64 11 395
6 Uttar Pradesh 0.49 5 0.34 6 693
7 West Bengal 0.44 5 0.29 5 655
8 Punjab 0.23 2 0.21 3 882
9 Gujarat 0.27 3 0.17 3 638
All Above 9.49 (95%) 5.81 (95%) 613
All India 9.86 6.02 611
7.22 TOTAL MUNGBEAN (KHARIF + RABI)
(Area-Lakh ha, Production Lakh Tonnes; Yield-kg/ha)
S.No. States Area Contri. (%) Prod. Contri. (%) Yield
1 Rajasthan 16.16 40 7.66 39 474 2 Madhya Pradesh 3.54 9 2.19 11 621 3 Maharashtra 4.08 10 1.55 8 380
4 Bihar 1.71 4 1.12 6 652 5 Andhra Pradesh 1.55 4 1.04 5 670
6 Tamil Nadu 1.97 5 1.03 5 525 7 Karnataka 3.70 9 0.98 5 265 8 Odisha 2.73 7 0.97 5 356 9 Gujarat 1.33 3 0.71 4 538
10 Telangana 1.03 3 0.61 3 589
All Above 37.80 (94%) 17.88 (91%) 473
All India 40.34 19.48 483
7.23 LENTIL (RABI)
(Area-Lakh ha, Production Lakh Tonnes; Yield-kg/ha)
S.No. States Area Contri. (%) Prod. Contri. (%) Yield
1 Madhya Pradesh 5.41 38 4.53 37 837
2 Uttar Pradesh 4.44 31 3.66 30 824 3 Bihar 1.56 11 1.55 13 997 4 West Bengal 1.15 8 1.07 9 934
5 Rajasthan 0.49 3 0.47 4 966 6 Jharkhand 0.49 3 0.43 4 882
7 Assam 0.27 2 0.20 2 723 8 Uttarakhand 0.11 1 0.08 1 762 All Above 13.92 (97%) 12.00 (99%) 862
All India 14.24 12.17 855

Brief Handbook, DPD, GoI, Bhopal Page 44
7.24 FIELDPEA (RABI)
(Area-Lakh ha, Production Lakh Tonnes; Yield-kg/ha)
S.No. States Area Contri. (%) Prod. Contri. (%) Yield
1 Uttar Pradesh 3.43 39 3.98 45 1161
2 Madhya Pradesh 3.30 38 2.72 31 825
3 Jharkhand 0.47 5 0.54 6 1141
4 Rajasthan 0.13 1 0.26 3 2061
5 Assam 0.27 3 0.25 3 922
6 Himachal Pradesh 0.08 1 0.24 3 2825
7 West Bengal 0.16 2 0.18 2 1174
8 Odisha 0.19 2 0.18 2 948
9 Bihar 0.18 2 0.17 2 983
10 Manipur 0.18 2 0.17 2 942
All Above 8.38 (96%) 8.70 (98%) 1037
All India 8.74 8.89 1018
7.25 LATHYRUS (RABI)
(Area-Lakh ha, Production Lakh Tonnes; Yield-kg/ha)
S.No. States Area Contri. (%) Prod. Contri. (%) Yield
1 Chhattisgarh 2.71 68 2.14 62 791
2 West Bengal 0.67 17 0.75 22 1127
3 Bihar 0.57 14 0.56 16 973
All Above 3.94 (99%) 3.45 (100%) 874
All India 3.98 3.45 868
7.26 MOTHBEAN (KHARIF)
(Area-Lakh ha, Production Lakh Tonnes; Yield-kg/ha)
S.No. States Area Contri. (%) Prod. Contri. (%) Yield
1 Rajasthan 10.73 98 3.24 97 302
2 Gujarat 0.20 2 0.10 3 479
All Above 10.93 (100%) 3.34 (100%) 305
All India 10.95 3.34 305
7.27 KULTHI (KHARIF + RABI)
(Area-Lakh ha, Production Lakh Tonnes; Yield-kg/ha)
S.No. States Area Contri. (%) Prod. Contri. (%) Yield
1 Karnataka 1.59 37 0.65 32 406
2 Tamil Nadu 0.69 16 0.45 22 650 3 Andhra Pradesh 0.53 12 0.21 10 395 4 Chhattisgarh 0.46 11 0.16 8 357 5 Jharkhand 0.23 5 0.16 8 703 6 Uttarakhand 0.13 3 0.11 6 860
7 Odisha 0.31 7 0.11 6 366 8 Bihar 0.09 2 0.08 4 926
9 Madhya Pradesh 0.15 4 0.06 3 416
All Above 4.18 (98%) 2.00 (98%) 478
All India 4.27 2.04

Brief Handbook, DPD, GoI, Bhopal Page 45
7.28 PULSES (KHARIF)
(Area-Lakh ha, Production Lakh Tonnes; Yield-kg/ha)
S.No. States Area Contri. (%) Prod. Contri. (%) Yield
1 Madhya Pradesh 21.65 17 15.18 20 701
2 Rajasthan 32.96 26 14.32 19 434
3 Maharashtra 20.98 16 12.66 17 603
4 Karnataka 16.01 12 8.87 12 554
5 Uttar Pradesh 8.83 7 5.58 7 632
6 Gujarat 5.04 4 4.43 6 879
7 Jharkhand 3.99 3 3.66 5 917
8 Telangana 4.19 3 2.61 3 624
9 Odisha 4.43 3 2.49 3 563
10 Tamil Nadu 2.30 2 2.33 3 1014
All Above 120.39 (93%) 72.13 (95%) 599
All India 128.88 76.49 594
7.29 PULSES (RABI)
(Area-Lakh ha, Production Lakh Tonnes; Yield-kg/ha)
S.No. States Area Contri. (%) Prod. Contri. (%) Yield
1 Madhya Pradesh 42.61 29 45.98 35 1079
2 Rajasthan 14.52 10 14.26 11 982
3 Maharashtra 18.06 12 14.14 11 783
4 Uttar Pradesh 13.76 9 13.21 10 960
5 Andhra Pradesh 9.78 7 8.56 7 875
6 Karnataka 12.95 9 7.12 5 550
7 Chhattisgarh 6.25 4 5.36 4 858
8 Bihar 4.52 3 3.98 3 880
9 Tamil Nadu 6.15 4 3.91 3 636
10 Jharkhand 3.07 2 3.34 3 1090
All Above 131.66 (91%) 119.86 (92%) 910
All India 144.88 131.71 909
7.30 PULSES (KHARIF + RABI)
(Area-Lakh ha, Production Lakh Tonnes; Yield-kg/ha)
S.No. States Area Contri. (%) Prod. Contri. (%) Yield
1 Madhya Pradesh 64.26 23 61.16 29 952
2 Rajasthan 47.48 17 28.58 14 602
3 Maharashtra 39.05 14 26.79 13 686
4 Uttar Pradesh 22.59 8 18.79 9 832
5 Karnataka 28.96 11 15.98 8 552
6 Andhra Pradesh 13.28 5 10.13 5 763
7 Gujarat 7.37 3 7.08 3 960
8 Jharkhand 7.06 3 7.00 3 992
9 Chhattisgarh 8.33 3 6.19 3 744
10 Tamil Nadu 8.45 3 5.69 3 673
All Above 246.82 (90%) 187.40 (90%) 759
All India 273.76 208.20 761

Brief Handbook, DPD, GoI, Bhopal Page 46
8.1 Pulses and Oilseeds Minikit allocation Madhya Pradesh & Chhattisgarh Kharif -2020.
8.1.1 Pulses Seed Minikits Allocation: Kharif 2020
Crops Varieties Total Allocation Agency - NSC
Minikits (Nos.) Qty (Qtl) Minikits (Nos.) Qty (Qtl)
MADHYA PRADESH
Urd Pratap Urd 1 12000 480 12000 480
CHHATTISGARH
Urd Pratap Urd 1 10000 400 10000 400
Arhar Rajiv Lochan 10000 400 10000 400
CG Total 20000 800 20000 800
ALL INDIA
Arhar 67125 2685 10000 400
Urdbean 68500 2740 22000 880
Moongbean 69125 2765 0 0
ALL INDIA TOTAL 204750 8190 32000 1280
Date of Supply of Minikit at District Level: 25.06.2020 (NSC)

Brief Handbook, DPD, GoI, Bhopal Page 47
8.1.2 Oilseeds Minikits Allocation: Kharif 2020
(Minikit : Nos. Quantity : Qtls)
Crops Varieties
Total Allocation Agency wise allocation
Minikits Qty NSC NAFED HIL IFFDC KRIBHCO
Minikits Qty Minikits Qty Minikits Qty Minik Qty Minikits Qty
MADHYA PRADESH
Soybean JS 20-29 30000 2400 10000 800 20000 1600 0 0 0 0 0 0
JS 20-34 27500 2200 5000 400 0 0 12500 1000 10000 800 0 0
RVS 2001-4 49250 3940 18000 1440 31250 2500 0 0 0 0 0 0
JS 20-69 22500 1800 7500 600 15000 1200 0 0 0 0 0 0
MP Total 129250 10340 40500 3240 66250 5300 12500 1000 10000 800 0 0
CHHATTISGARH
Soybean JS 20-69 6575 526 5000 400 0 0 0 0 1575 126 0 0
JS 20-34 2500 200 0 0 0 0 2500 200 0 0 0 0
JS 20-29 5000 400 5000 400 0 0 0 0 0 0 0 0
CG Total 14075 1126 10000 800 0 0 2500 200 1575 126 0 0
ALL INDIA
Soybean 181550 14524 66000 5280 80000 6400 18625 1490 16925 1354 0 0
Sasame 114900 1149 0 0 114900 1149 0 0 0 0 0 0
ALL INDIA TOTAL 296450 15673 66000 5280 194900 7549 18625 1490 16925 1354 0 0
Date of Supply of Minikit at District Level: 25.06.2020 (All Seed Agency)
8.1.3 Summary: Pulses and Oilseeds Minikit details Kharif -2020 (All India)
Crop TOTAL ALLOCATION (Nos.)
Varieties within 10 years MP CG All India
Arhar 0 1000 67125 TS-3R, GJP 1, Rajiv Lochan, IPA 203, PKV Tara, BDN 716, Pant Arhar 291,
Urdbean 12000 1000 68500 LBG 787, Mash 479, Pratap Urd 1, CO6, CO 8
Moongbean 0 0 69125 IPM 2-14, MH 421, BM -2003-2, PM 5
Soybean 129250 14075 181550 JS 20-29, JS 20-34, JS 20-69, KDS-344, RVS 2001-4, MAUS-162,
Sesame 0 0 114900 RT 351, GT-4, HT-4, HT-2
Total 141250 16075 501200

Brief Handbook, DPD, GoI, Bhopal Page 48
8.2 Pulses and Oilseeds Minikit allocation Madhya Pradesh & Chhattisgarh Rabi -2020-21.
8.2.1 Madhya Pradesh & Chhattisgarh State Pulses Seed Minikit Rabi -2020-21.
Crops Varieties
Total Allocation Agency wise allocation
Minikits
(Nos.)
Qty (Qtl) NSC NAFED HIL
Minikits
(Nos.)
Qty (Qtl) Minikits
(Nos.)
Qty
(Qtl)
Minikits
(Nos.)
Qty (Qtl)
MADHYA PRADESH
Lentil Kota Masoor-1 8000 640 0 0 0 0 8000 640
L-4717 5000 400 5000 400 0 0 0 0
MP Total 13000 1040 5000 400 0 0 8000 640
CHHATTISGARH
Lentil IPL-316 6000 480 2000 160 2000 160 2000 160
CG Total 6000 480 2000 160 2000 160 2000 160
ALL INDIA
Lentil 38175 3054 13875 1110 14300 1144 10000 800
Urd 23000 920 23000 920 0 0 0 0
Gram 3040 486 3040 486
ALL INDIA TOTAL 64215 4460 39915 2516 14300 1144 10000 800
Date of Supply of Minikit at District Level: 20.09.2020extended 30.09.2020 (All Seed Agency) & Gram 3040 Nos. Minikit date of supply 30.09.2020 (NSC).

Brief Handbook, DPD, GoI, Bhopal Page 49
8.2.2 Madhya Pradesh & Chhattisgarh State Allocation Additional Pulses Seed Minikit Rabi -2020-21.
Crops Varieties
Total Allocation Agency wise allocation
Minikits
(Nos.)
Qty (Qtl) NSC NAFED HIL
Minikits
(Nos.)
Qty (Qtl) Minikits
(Nos.)
Qty
(Qtl)
Minikits
(Nos.)
Qty (Qtl)
MADHYA PRADESH
Lentil IPL-316 10000 800 10000 800 0 0 0 0
Kota Massor-1 12500 1000 0 0 0 0 12500 1000
L-4717 10000 800 10000 800 0 0 0 0
MP Total 32500 2600 20000 1600 0 0 12500 1000
CHHATTISGARH
Lentil IPL-316 11250 900 0 0 5000 400 6250 500
JL-31 2500 200 0 0 2500 200 0 0
L-4717 10000 800 10000 800 0 0 0 0
CG Total 23750 1900 10000 800 7500 600 6250 500
ALL INDIA
Lentil 94737 7578.96 58112 4648.96 17875 1430 18750 1500
ALL INDIA TOTAL 94737 7578.96 58112 4648.96 17875 1430 18750 1500
Date of Supply of Additional Minikit at District Level: 18.10.2020 (All Seed Agency)
8.2.3 Oilseeds Minikits Allocation: Rabi – 2020-21
Crops Varieties
Total Allocation Agency wise allocation
Minikits
(Nos.)
Qty
(Qtl)
NSC NAFED HIL IFFDC KRIBHCO
Minikits
(Nos.)
Qty
(Qtl)
Minikits
(Nos.)
Qty
(Qtl)
Minikits
(Nos.)
Qty
(Qtl)
Minikits
(Nos.)
Qty
(Qtl)
Minikits
(Nos.)
Qty
(Qtl)
MADHYA PRADESH
Musatrd RH-0749 78900 1578 50000 1000 13900 278 15000 300 0 0 0 0
PM -30 2750 55 2750 55 0 0 0 0 0 0 0 0
RH-725 40000 800 40000 800 0 0 0 0 0 0 0 0
sub-total 121650 2433 92750 1855 13900 278 15000 300 0 0 0 0
Linseed Kota Barani-4 10000 200 10000 200 0 0 0 0 0 0 0 0
Jawahar Alsi-41 5000 100 0 0 5000 100 0 0 0 0 0 0
JLS-73 5000 100 0 0 5000 100 0 0 0 0 0 0

Brief Handbook, DPD, GoI, Bhopal Page 50
Crops Varieties
Total Allocation Agency wise allocation
Minikits
(Nos.)
Qty
(Qtl)
NSC NAFED HIL IFFDC KRIBHCO
Minikits
(Nos.)
Qty
(Qtl)
Minikits
(Nos.)
Qty
(Qtl)
Minikits
(Nos.)
Qty
(Qtl)
Minikits
(Nos.)
Qty
(Qtl)
Minikits
(Nos.)
Qty
(Qtl)
sub-total 20000 400 10000 200 10000 200 0 0 0 0 0 0
MP Total 141650 2833 102750 2055 23900 478 15000 300 0 0 0 0
CHHATTISGARH
Mustard Giriraj 95000 1900 92000 1840 0 0 3000 60 0 0 0 0
PM-30 5000 100 0 0 5000 100 0 0 0 0 0 0
sub-total 100000 2000 92000 1840 5000 100 3000 60 0 0 0 0
Linseed JLS-73 5000 100 0 0 5000 100 0 0 0 0 0 0
Jawahar Alsi-41 2500 50 0 0 2500 50 0 0 0 0 0 0
sub-total 7500 150 0 0 7500 150 0 0 0 0 0 0
CG Total 107500 2150 92000 1840 12500 250 3000 60 0 0 0 0
ALL INDIA
Mustard 1504100 30082 1334500 26690 92100 1842 38000 760 12500 250 27000 540
Linseed 52500 1050 25000 500 27500 550 0 0 0 0 0 0
ALL INDIA TOTAL 1556600 31132 1359500 27190 119600 2392 38000 760 12500 250 27000 540
Date of Supply of Minikit at District Level: 30.09.2020 (All Seed Agency)
8.2.4 Summary : Pulses and Oilseeds Minikit details Rabi -2020-21 (All India)
Crop TOTAL ALLOCATION (Nos.) Varieties
Madhya Pradesh Chhattisgarh All India
Lentil* 45500 29750 132912
IPL-316, Kota Masoor-1, L-4717, IPL-526, KLB-2008-04,
KLS-09-03, JL-31
Urd 0 0 23000 TU-40
Gram 0 0 3040 GNG-1958, GNG-2171
Total 276300 113500 1620815
Note: Included additional allocation.

Brief Handbook, DPD, GoI, Bhopal Page 51
8.3 Pulses Seed Minikit allocation Madhya Pradesh & Chhattisgarh Summer-2020-21.
8.3.1 Pulses Seed Minikits Allocation: Summer – 2020-21
Crops Varieties
Total Allocation Agency wise allocation
Minikits
(Nos.)
Qty
(Qtl) NSC NAFED HIL IFFDC KRIBHCO
Minikits
(Nos.)
Qty
(Qtl)
Minikits
(Nos.)
Qty
(Qtl)
Minikits
(Nos.)
Qty
(Qtl)
Minikits
(Nos.)
Qty
(Qtl)
Minikits
(Nos.)
Qty
(Qtl)
MADHYA PRADESH
Moong IPM-205-07
(Virat) 8000 320 2000 80 2000 80 2000 80 2000 80 0 0
IPM-410-3
(Shikha) 3100 124 0 0 1100 44 2000 80 0 0 0 0
CG Total 11100 444 2000 80 3100 124 4000 160 2000 80 0 0
CHHATTISGARH
Moong Indira Urd -1 1000 40 0 0 1000 40 0 0 0 0 0 0
CG Total 1000 40 0 0 1000 40 0 0 0 0 0 0
ALL INDIA
Moong 52100 2084 19000 760 14100 564 12500 500 6500 260 0 0
Urd 20000 800 19000 760 1000 40 0 0 0 0 0 0
ALL INDIA TOTAL 72100 2884 38000 1520 15100 604 12500 500 6500 260 0 0
Date of Supply of Minikit at District Level: 20.01.2021 (All Seed Agency).
8.3.2 Pulses Minikit details Summer-2020-21 (All India)
Crop TOTAL ALLOCATION (Nos.) Varieties
MP CG All India
Moong 11100 1000 52100 IPM-205-07 (Virat), IPM-410-3 (Shikha), IPM-2-14, MH-318, SML-832,
Urd 0 0 20000 TU-40, Indira Urd -1
Total 11100 1000 72100
*************