Embed Size (px)
Citation preview
A Case for Index Fund Portfolios
Investors holding only index funds have a better chance for success
RICHARD A. FERRI, CFAPortfolio Solutions®, LLC
ALEX C. BENKE, CFP®
Betterment
Authors
June 2013
Page 2 of 25
A Case for Index Fund Portfolios
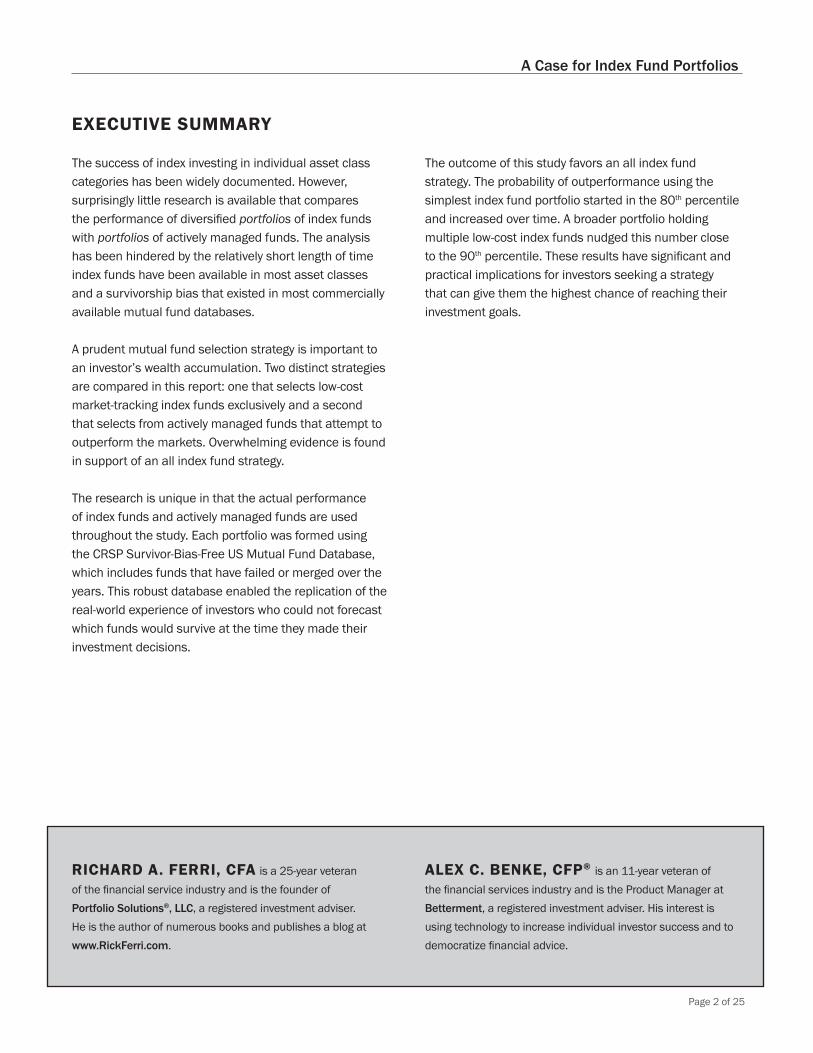
The success of index investing in individual asset class categories has been widely documented. However, surprisingly little research is available that compares the performance of diversified portfolios of index funds with portfolios of actively managed funds. The analysis has been hindered by the relatively short length of time index funds have been available in most asset classes and a survivorship bias that existed in most commercially available mutual fund databases.
A prudent mutual fund selection strategy is important to an investor’s wealth accumulation. Two distinct strategies are compared in this report: one that selects low-cost market-tracking index funds exclusively and a second that selects from actively managed funds that attempt to outperform the markets. Overwhelming evidence is found in support of an all index fund strategy.
The research is unique in that the actual performance of index funds and actively managed funds are used throughout the study. Each portfolio was formed using the CRSP Survivor-Bias-Free US Mutual Fund Database, which includes funds that have failed or merged over the years. This robust database enabled the replication of the real-world experience of investors who could not forecast which funds would survive at the time they made their investment decisions.
The outcome of this study favors an all index fund strategy. The probability of outperformance using the simplest index fund portfolio started in the 80th percentile and increased over time. A broader portfolio holding multiple low-cost index funds nudged this number close to the 90th percentile. These results have significant and practical implications for investors seeking a strategy that can give them the highest chance of reaching their investment goals.
RICHARD A. FERRI, CFA is a 25-year veteran of the financial service industry and is the founder of Portfolio Solutions®, LLC, a registered investment adviser. He is the author of numerous books and publishes a blog at www.RickFerri.com.
ALEX C. BENKE, CFP® is an 11-year veteran of the financial services industry and is the Product Manager at Betterment, a registered investment adviser. His interest is using technology to increase individual investor success and to democratize financial advice.
EXECUTIVE SUMMARY
Page 3 of 25
A Case for Index Fund Portfolios
Mutual funds and exchange-traded funds (collectively, “funds”) can be divided into two broad categories: passively managed index funds1 that attempt to track the performance of a market or market sector less a small expense, and actively managed funds that attempt to outperform a market or market sector net of expenses.
Investors have a wide choice of funds today. Index fund providers and actively managed mutual fund companies have redundant funds that span the global markets. All the major asset classes are well covered.
Studies referenced in this paper show that index funds have outperformed a majority of active funds in their respective investment categories. These studies, conducted over decades, have shown that index funds have outperformed the average actively managed fund in all equity and fixed income markets, both in the US and abroad.
It’s natural to expect that a portfolio holding only index funds would outperform a comparable portfolio that holds only actively managed funds. Surprisingly little research has been done to test this hypothesis. There are only a handful of studies on mutual fund portfolio performance, and only one that has measured actual index fund portfolio performance relative to actual actively managed fund portfolio performance.2
The index fund portfolios used in this study are composed of index funds that existed over the entire period. These funds were available to all individual investors at all times. These index fund portfolios were compared to randomly selected actively managed fund portfolios chosen from a universe of funds that were also available to all investors over the same period.
Several decisions were made about the mutual fund data used in this study. Sales loads and redemption fees were excluded from actively managed fund performance because the fees would have impeded portfolio performance. The index fund share class with the highest expense ratio was selected when two or more share classes of the fund existed. Pre-tax performance was used even though index funds tend to have better tax efficiency.
The probability of an all index fund portfolio outperforming the average actively managed fund portfolio3 was higher than we anticipated prior to conducting this study. We attribute the higher-than-expected outperformance to three factors that emerged during our research. We call these factors Passive Portfolio Multipliers (PPM):
1. Portfolio advantage: Index funds have a higher probability of outperforming actively managed funds when combined together in a portfolio.
2. Time advantage: The probability of index fund portfolio outperformance increased when the time period was extended from 5 years to 15 years.
3. Active manager diversification disadvantage: The probability of index fund portfolio outperformance increased when two or more actively managed funds were held in each asset class.
Each scenario was calculated using nominal performance data and risk-adjusted performance data. We calculated the Sharpe ratio4 for each actively managed fund portfolio and compared it to the Sharpe ratio of an all index fund portfolio. The results using risk-adjusted performance were not meaningfully different than using nominal performance.
In one scenario, the database was filtered for actively managed funds that had low fees relative to the average fund in each category. Creating this low-fee active fund universe allowed us to study the effect that fees had in the outperformance of an all index fund portfolio. Fees did affect performance to small degree, but not as much as we expected, and they were not game changing.
Investors seek a portfolio strategy that has the highest probability of meeting their investment goals. The overwhelming evidence from this study favors an all index fund portfolio. The strategy’s outperformance is consistent and statistically significant. Based on the results, we believe an all index fund portfolio yields the best chance for investor success.
SUMMARY OF FINDINGS
Page 4 of 25
A Case for Index Fund Portfolios
Mutual Funds under the Microscope Index funds attempt to closely track a market or market sector net of fund expenses. This differs from actively managed funds, which attempt to outperform a market after accounting for expenses. The expenses incurred by actively managed funds tend to be considerably more than the expenses incurred by an index fund in the same category. 5
Exhaustive mutual fund performance studies were conducted during the 1960s. Eugene Fama, William Sharpe and Jack Treynor were some of the first researchers to note the apparent lack of skill by mutual fund managers.6 Economist Michael Jensen provided his view in 1967, that “mutual funds were on average not able to predict security prices well enough to outperform a buy-the-market-and-hold policy, but also that there is very little evidence that any individual fund was able to do significantly better than that which we expected from mere random chance.”7 These insights helped transform the face of modern portfolio theory.
Mutual fund analysis continued to improve during the 1980s and 1990s. Mark Carhart exhaustively studied mutual fund performance for his 1997 doctoral thesis at the University of Chicago Booth School of Business. He was first to document the deep survivorship bias in existing mutual fund databases. Carhart observed that although some funds outperformed, on average, mutual fund managers did not exhibit superior investment skill.8
Research comparing the performance of indexes and index funds to actively managed funds is now an on-going project for several companies. S&P Dow Jones Indices, LLC publishes the bi-annual report S&P Indices Versus Active Funds (SPIVA®) Scorecard that compares actively managed equity and bond funds to S&P Dow Jones indexes and other indexes. S&P Dow Jones Indices, LLC also publishes the S&P Persistence Scorecard, which compares mutual fund performance over independent time periods. Vanguard annually updates The Case for Indexing and includes active versus passive fund comparisons in the report.9 All these studies show that
active fund managers have a very difficult time keeping up with their index benchmarks. While some managers do outperform, it typically is not by much and not for long.
We are not of the belief that active funds cannot beat their benchmarks because the evidence shows that they can. We acknowledge there have been and always will be actively managed funds that outperform in each category. However, even the most prescient investor cannot predict which funds will outperform and over what period. We believe successfully predicting winning active managers across all the fund categories is highly unlikely.
Index Funds to the Fore Index tracking products were introduced in the early 1970s. The first portfolios were managed by banks and open only to select customers. High costs and limited access prevented these products from attracting broad investor interest.10
The first publicly available and widely accepted index mutual fund was launched by The Vanguard Group in 1976. It tracked the S&P 500® US stock index. The idea was spearheaded by Vanguard founder and then-chairman John C. Bogle. 11
The success of equity index funds led to the launch of other products covering more asset classes. The first bond index fund was introduced by Vanguard in 1986 and the first international equity index funds followed in 1990. A real estate investment trust (REIT) index fund was launched by Vanguard in 1996.
Today, hundreds of low-cost index funds are offered by many fund companies. In addition, over 1,000 index tracking exchange-traded funds (ETFs) are available to investors. Together, these index products track every major asset class, sub-asset class, style, and industry sector in the US and abroad.
BACKGROUND INFORMATION
Page 5 of 25
A Case for Index Fund Portfolios
Measuring Mutual Fund Portfolio Performance Investors in mutual funds rarely own just one fund covering one asset class. Their portfolios are diversified across several funds that cover multiple asset classes. An investor may own two or three US equity funds, a couple of international equity funds, one or two bond funds and perhaps an alternative asset class such as a REIT fund. This is why a study of portfolio returns is important.
Studies that compare the performance of index funds to active funds are common, yet surprisingly little attention has been paid to how portfolios of index funds have performed relative to portfolios of actively managed funds. There are only three studies that we know of.
The first attempt to quantify the difference in portfolio performance between the two strategies occurred in 1993. Larry Martin, then senior vice president and chief investment officer at State Street Global Advisors (formerly State Street Asset Management), reported in the Journal of Investing that fund fees were inversely correlated with the probability that mutual fund managers could outperform an index. His results were based on one, three and five funds over 1, 5, 10 and 20 year periods.12
Allan Roth, Founder of Wealth Logic, LLC, conducted a similar study to Martin’s in the late 1990s. Using a Monte Carlo simulation, Roth predicted the probability of a portfolio holding multiple active funds outperforming an index over different time periods. His findings were close to Martin’s results.13 Roth published his findings in his perennially popular book, How a Second Grader Beats Wall Street: Golden Rules Any Investor Can Learn.
Richard Ferri, co-author of this article, used actual fund performance to calculate index fund portfolio performance for his 2010 book, The Power of Passive Investing. He used performance data from Morningstar Principia®, which provides comprehensive data on existing mutual fund performance for investors and financial professionals. Ferri found that index fund portfolios
outperformed actively managed fund portfolios by about the same percentages predicted by Martin and Roth.14
A measurable margin of error could exist in all three studies because survivorship bias had to be estimated (see the section on survivorship bias). Many funds closed or merged with other funds during the study period, and this skewed database performance upward. Closed, for our purposes, means a fund no longer exists.
Page 6 of 25
A Case for Index Fund Portfolios
The objective of the study was to compare and document the past performance of investable index fund portfolios relative to investable actively managed fund portfolios using a survivorship-bias free database. We were interested to know the probability of an all index fund portfolio to outperform a randomly selected active fund portfolio culled from a universe of funds that were available to investors. In the study, we define an actively managed fund as any fund available to individual investors that is not a pure index fund and subject to the Portfolio Selection Methodology outlined in the next section.
We compared and documented portfolio performance using actual fund performance in several different scenarios. We varied the holding period of the portfolios, varied the number of asset classes in the portfolios, measured the performance of actively managed portfolios that held more than one fund in each asset class, and tested a subset of active funds with lower fees to see if there was a meaningful change in the active fund portfolio success rate.
Each scenario began with a preselected index fund portfolio that was available to all investors. This portfolio was compared to 5,000 simulated trials of all active fund portfolios that were also available to all investors. Each of the 5,000 simulated trials involved randomly selecting a fund from each asset class in the portfolio that was available at the time. If a mutual fund closed or merged during the period, it was replaced with another fund from the universe of funds available at that time of the closure or merger.
Using this methodology, we found that the results stabilized at 5,000 simulated trials. We are confident that our findings are within ± 1.0 percent of the actual probability of outperformance in each scenario.
Our goal was to measure the probability of portfolio success using index funds so that investors had more information to make wise strategy decisions. It was not our intent to suggest or prove that active management
doesn’t work or to say that no active management strategy can beat a specific index benchmark. We know that’s not true. It is possible to outperform a portfolio of index funds using actively managed funds as our analysis shows; it is just not probable.
OBJECTIVE OF THIS STUDY
Page 7 of 25
A Case for Index Fund Portfolios
Survivorship Bias Investors and advisers typically use mutual fund databases to compare and select available investment products. Most of these databases exclude funds that have closed or merged with another fund, because this information is of little use when attempting to select an investment today.
The number of funds that close and merge each year is meaningful. Recent research by Vanguard found that 46% of mutual funds available in January 1997 were no longer in existence by December 2011.15 The study also noted that these funds tended to have poor performance over an 18-month period prior to closing or merging. The shortfall was -4.63% for large-cap blend equity funds, -10.52% for small-cap blend equity funds, and -1.75% for US corporate bond funds.
Databases that exclude closed and merged funds limit the ability of researchers to measure and compare the past performance of all mutual funds. The average performance of an actively managed fund portfolio is skewed higher when closed and merged funds are not included.
To measure the difference, we created a database that had survivorship bias and ran comparisons to the results from the CRSP database that did not have a bias. The bias database was formed using the CRSP data, excluding closed and merged funds. The average upward skew in performance using the survivorship-bias database was about 0.8% per year over the same portfolios created from the survivorship-bias-free database. 16
Database Selection The CRSP Survivor-Bias-Free US Mutual Fund Database17 served as the foundation for our research. It is maintained by the Center for Research in Security Prices (CRSP®), an integral part of the University of Chicago Booth School of Business. Mark Carhart (cited earlier) pioneered the database as he pursued his Ph.D. at the university.
The database includes monthly performance of surviving funds, as well as closed and merged funds. This complete database allowed us to replicate the mutual funds that were available to all investors during our period of study.
Portfolio Selection Methodology The CRSP Survivor-Bias-Free US Mutual Fund Database includes investment styles and investment objective categories compiled from three different sources over the life of the database. We used this “CRSP Style Code” information as a starting point to filter and sort funds based on asset classes and investment styles.
Some funds did not fit well into a particular category and had to be excluded. For example, balanced funds that held positions in stocks and bonds were excluded from the all-equity fund categories when they held a meaningful position in bonds. We manually culled through each category to isolate the funds that did not belong. Filters were then created to exclude funds with the same characteristics.
We excluded variability annuity funds, duplicate share classes of the same fund (for example, we excluded B and C shares if A shares were already included), 529 college savings plan funds, and institutional shares (a class of mutual fund shares typically acquired with sales load and commission breaks not available to retail investors).
We also excluded pure index funds from the database so that we would not be comparing an index fund portfolio to portfolios holding index funds. Enhanced index funds were retained. These funds use an active management overlay strategy to potentially enhance index performance.
After populating asset class categories with active funds, we created an algorithm18 to query the database and randomly select an actively managed fund from each category. These funds were weighted in the actively managed portfolio using the same asset allocation as the all index fund portfolio.
DATA DESCRIPTION
Page 8 of 25
A Case for Index Fund Portfolios
We tracked the active fund portfolio relative to the index fund portfolio over the period specified by the individual scenario. The monthly performance figures used were total performance, including reinvested dividends, and net of all management expenses and 12b-1 fees. No rebalancing was done in either the index fund portfolio or active fund portfolio.
If an actively managed fund closed or merged during the period, another fund was selected at random from the available funds in the category at the time of the closure or merger. The annualized category performance was linked from the two funds over the periods they were held, which mimics an actual investor’s experience.
This random portfolio selection process was repeated using 5,000 simulated trials for each scenario. Each portfolio performance was compared to the performance of the all index fund portfolio and the results were sorted from worst to best. The probability of the index fund portfolio’s outperformance versus the active fund portfolio was calculated as the number of index portfolio wins divided by 5,000.
We also documented the median excess performance from the outperforming active fund portfolios and the median shortfall from the underperforming portfolios. It was helpful to compare these two numbers because in every case the penalty for underperforming was far greater than the reward for outperforming.
Index Fund Selection Available and investable index funds were used for all scenarios. We chose index funds that had the longest track record in each category. Vanguard funds were often selected because they offered the first-to-market index fund in most asset classes.
Index funds selected at the beginning of the period were the same funds in the portfolio at the end of a period, with two exceptions: In scenario 3, run 3, the actively managed Vanguard Inflation-Protected Securities Fund (VIPSX) was used in the inflation-protected securities
category until the iShares Barclays TIPS Bond Fund (TIP) was launched in 2003; and the Vanguard Intermediate-Term Tax-Exempt Fund (VWITX) was used until the iShares S&P National AMT-Free Municipal Bond Fund (MUB) was launched in 2007.
The highest-cost share class was used when an index fund had more than one share class. For example, Vanguard Investor Shares were used for all Vanguard index funds in lieu of lower-cost Admiral Shares and exchange-traded fund (ETF) shares. The decision to use the highest cost index fund provided an advantage to the actively managed fund portfolios. The probability of the index fund portfolio outperformance would have been higher had a lower cost share class been used.
Six scenarios were created that differed in investment style and back-tested the performance of index fund portfolios and actively managed fund portfolios in each scenario. Each scenario was run multiple times to ensure that the probabilities stated were within a ±1.0% margin of error.
Page 9 of 25
A Case for Index Fund Portfolios
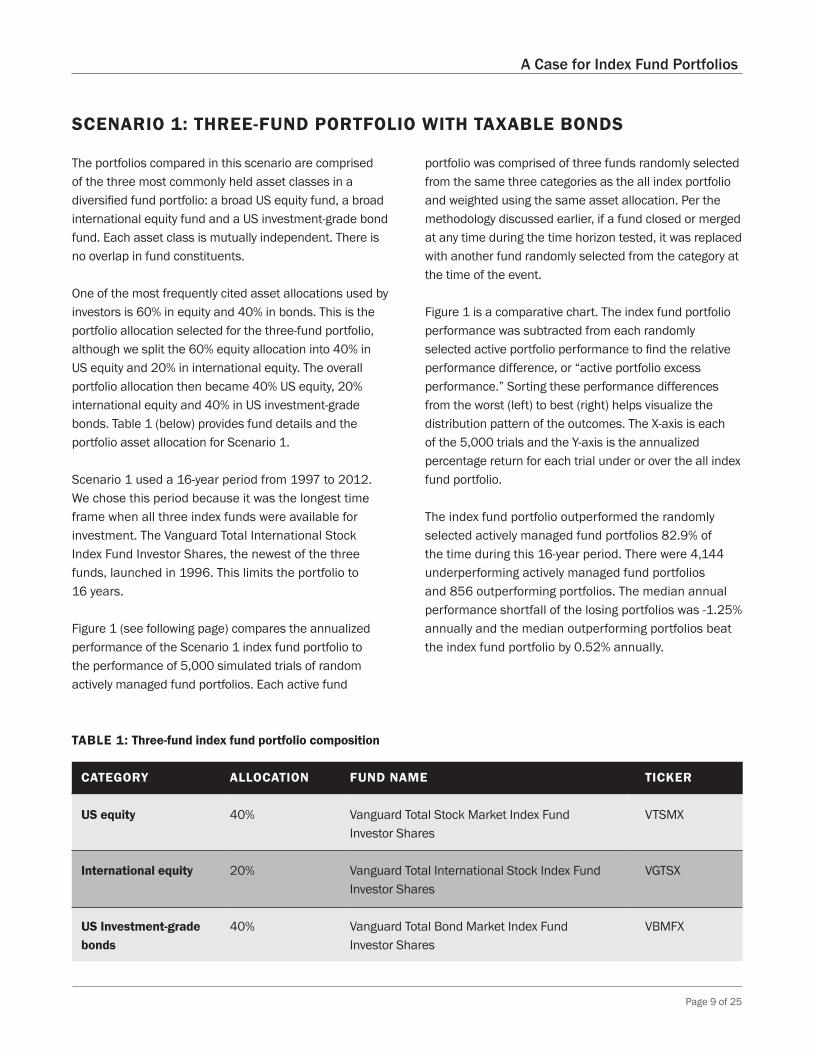
The portfolios compared in this scenario are comprised of the three most commonly held asset classes in a diversified fund portfolio: a broad US equity fund, a broad international equity fund and a US investment-grade bond fund. Each asset class is mutually independent. There is no overlap in fund constituents.
One of the most frequently cited asset allocations used by investors is 60% in equity and 40% in bonds. This is the portfolio allocation selected for the three-fund portfolio, although we split the 60% equity allocation into 40% in US equity and 20% in international equity. The overall portfolio allocation then became 40% US equity, 20% international equity and 40% in US investment-grade bonds. Table 1 (below) provides fund details and the portfolio asset allocation for Scenario 1.
Scenario 1 used a 16-year period from 1997 to 2012. We chose this period because it was the longest time frame when all three index funds were available for investment. The Vanguard Total International Stock Index Fund Investor Shares, the newest of the three funds, launched in 1996. This limits the portfolio to 16 years.
Figure 1 (see following page) compares the annualized performance of the Scenario 1 index fund portfolio to the performance of 5,000 simulated trials of random actively managed fund portfolios. Each active fund
portfolio was comprised of three funds randomly selected from the same three categories as the all index portfolio and weighted using the same asset allocation. Per the methodology discussed earlier, if a fund closed or merged at any time during the time horizon tested, it was replaced with another fund randomly selected from the category at the time of the event.
Figure 1 is a comparative chart. The index fund portfolio performance was subtracted from each randomly selected active portfolio performance to find the relative performance difference, or “active portfolio excess performance.” Sorting these performance differences from the worst (left) to best (right) helps visualize the distribution pattern of the outcomes. The X-axis is each of the 5,000 trials and the Y-axis is the annualized percentage return for each trial under or over the all index fund portfolio.
The index fund portfolio outperformed the randomly selected actively managed fund portfolios 82.9% of the time during this 16-year period. There were 4,144 underperforming actively managed fund portfolios and 856 outperforming portfolios. The median annual performance shortfall of the losing portfolios was -1.25% annually and the median outperforming portfolios beat the index fund portfolio by 0.52% annually.
SCENARIO 1: THREE-FUND PORTFOLIO WITH TAXABLE BONDS
TABLE 1: Three-fund index fund portfolio composition
CATEGORY ALLOCATION FUND NAME TICKER
US equity 40% Vanguard Total Stock Market Index Fund Investor Shares
VTSMX
International equity 20% Vanguard Total International Stock Index Fund Investor Shares
VGTSX
US Investment-grade bonds
40% Vanguard Total Bond Market Index Fund Investor Shares
VBMFX
Page 10 of 25
A Case for Index Fund Portfolios
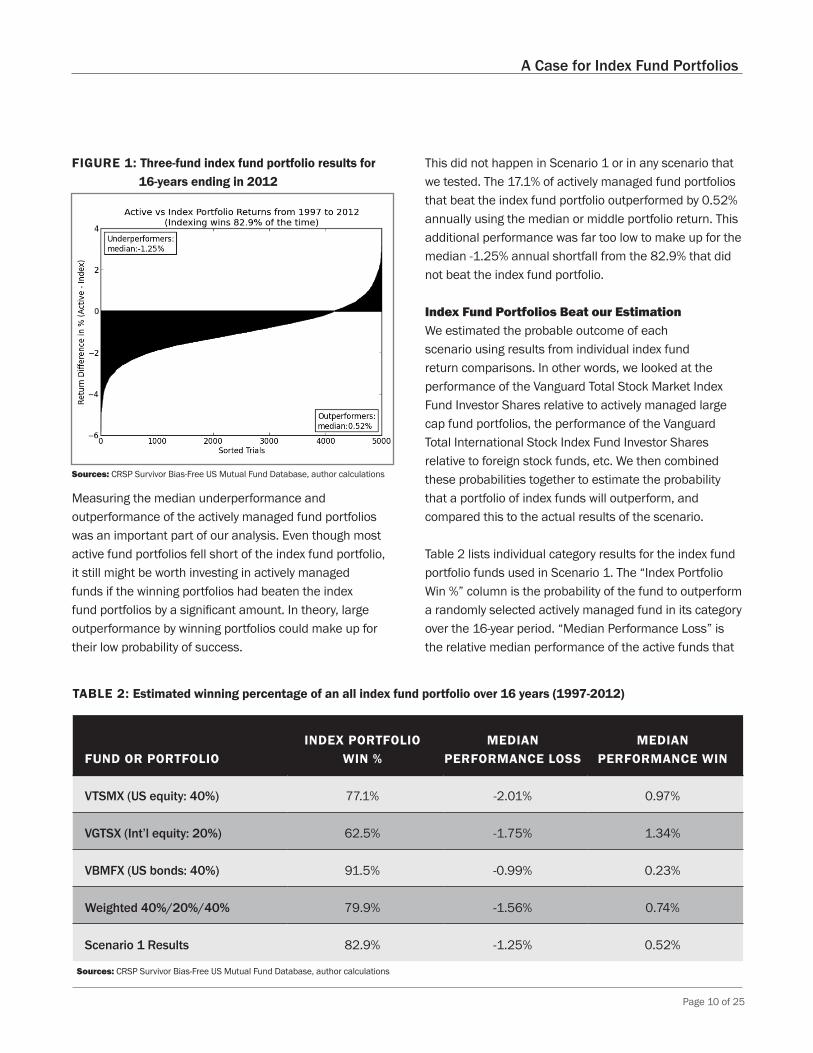
Measuring the median underperformance and outperformance of the actively managed fund portfolios was an important part of our analysis. Even though most active fund portfolios fell short of the index fund portfolio, it still might be worth investing in actively managed funds if the winning portfolios had beaten the index fund portfolios by a significant amount. In theory, large outperformance by winning portfolios could make up for their low probability of success.
This did not happen in Scenario 1 or in any scenario that we tested. The 17.1% of actively managed fund portfolios that beat the index fund portfolio outperformed by 0.52% annually using the median or middle portfolio return. This additional performance was far too low to make up for the median -1.25% annual shortfall from the 82.9% that did not beat the index fund portfolio.
Index Fund Portfolios Beat our Estimation We estimated the probable outcome of each scenario using results from individual index fund return comparisons. In other words, we looked at the performance of the Vanguard Total Stock Market Index Fund Investor Shares relative to actively managed large cap fund portfolios, the performance of the Vanguard Total International Stock Index Fund Investor Shares relative to foreign stock funds, etc. We then combined these probabilities together to estimate the probability that a portfolio of index funds will outperform, and compared this to the actual results of the scenario.
Table 2 lists individual category results for the index fund portfolio funds used in Scenario 1. The “Index Portfolio Win %” column is the probability of the fund to outperform a randomly selected actively managed fund in its category over the 16-year period. “Median Performance Loss” is the relative median performance of the active funds that
FIGURE 1: Three-fund index fund portfolio results for 16-years ending in 2012
TABLE 2: Estimated winning percentage of an all index fund portfolio over 16 years (1997-2012)
FUND OR PORTFOLIOINDEX PORTFOLIO
WIN %MEDIAN
PERFORMANCE LOSS MEDIAN
PERFORMANCE WIN
VTSMX (US equity: 40%) 77.1% -2.01% 0.97%
VGTSX (Int’l equity: 20%) 62.5% -1.75% 1.34%
VBMFX (US bonds: 40%) 91.5% -0.99% 0.23%
Weighted 40%/20%/40% 79.9% -1.56% 0.74%
Scenario 1 Results 82.9% -1.25% 0.52%
Sources: CRSP Survivor Bias-Free US Mutual Fund Database, author calculations
Sources: CRSP Survivor Bias-Free US Mutual Fund Database, author calculations

Page 11 of 25
A Case for Index Fund Portfolios
did not beat the index fund and “Median Performance Win” is the relative annualized median performance of the active funds that outperformed.
Line 4 in Table 2 shows the weighted-average of the three individual index funds based on 40% US equity, 20% international equity and 40% US investment-grade bond fund portfolio. Weighting the three index funds using 40%/20%/40% suggests an expected index portfolio win rate for the portfolio to be 79.9%. In reality, the actual win rate was 82.9% from Scenario 1. Our estimate was 3.0% below. This was an unexpected outcome.
In addition, the “Median Performance Win” of 0.74% based on the 40%/20%/40% asset allocation method was higher than the actual outcome. In the actual 5,000 simulated trials, the median outperforming actively managed portfolio won by only 0.52% annually, one-third less than the expected outperformance.
Passive Portfolio Multiplier #1 – Increased probability through a portfolio Passive Portfolio Multipliers (PPMs) are factors that enhance the returns of index funds. The first PPM we found was that index funds, when combined together in a portfolio, have a higher probability of outperforming actively managed funds than they do individually.
An all index fund portfolio performed better than the sum of its parts. It had a higher probability of outperforming an all actively managed fund portfolio than expected, and the “Median Performance Win” of the active fund portfolios was lower than expected. PPM #1 was persistent in every scenario we tested.
Page 12 of 25
A Case for Index Fund Portfolios
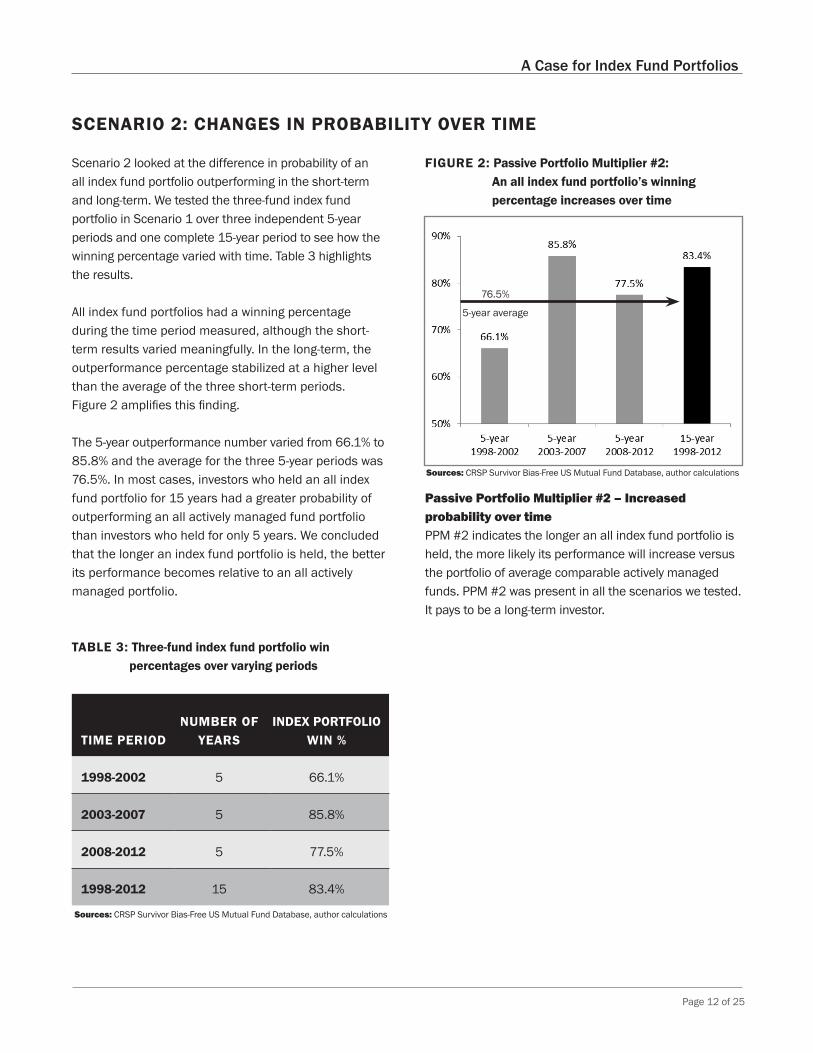
Scenario 2 looked at the difference in probability of an all index fund portfolio outperforming in the short-term and long-term. We tested the three-fund index fund portfolio in Scenario 1 over three independent 5-year periods and one complete 15-year period to see how the winning percentage varied with time. Table 3 highlights the results.
All index fund portfolios had a winning percentage during the time period measured, although the short-term results varied meaningfully. In the long-term, the outperformance percentage stabilized at a higher level than the average of the three short-term periods. Figure 2 amplifies this finding.
The 5-year outperformance number varied from 66.1% to 85.8% and the average for the three 5-year periods was 76.5%. In most cases, investors who held an all index fund portfolio for 15 years had a greater probability of outperforming an all actively managed fund portfolio than investors who held for only 5 years. We concluded that the longer an index fund portfolio is held, the better its performance becomes relative to an all actively managed portfolio.
Passive Portfolio Multiplier #2 – Increased probability over time PPM #2 indicates the longer an all index fund portfolio is held, the more likely its performance will increase versus the portfolio of average comparable actively managed funds. PPM #2 was present in all the scenarios we tested. It pays to be a long-term investor.
SCENARIO 2: CHANGES IN PROBABILITY OVER TIME
TABLE 3: Three-fund index fund portfolio win percentages over varying periods
TIME PERIODNUMBER OF
YEARSINDEX PORTFOLIO
WIN %
1998-2002 5 66.1%
2003-2007 5 85.8%
2008-2012 5 77.5%
1998-2012 15 83.4%
FIGURE 2: Passive Portfolio Multiplier #2: An all index fund portfolio’s winning percentage increases over time
76.5%
5-year average
Sources: CRSP Survivor Bias-Free US Mutual Fund Database, author calculations
Sources: CRSP Survivor Bias-Free US Mutual Fund Database, author calculations

Page 13 of 25
A Case for Index Fund Portfolios
Scenario 3 studies the effect of adding multiple asset classes to a portfolio. The scenario measures the probability of an all index fund portfolio outperforming an all actively managed fund portfolio when the number of investment categories is increased.
A 10-year period was selected for this scenario because many index funds have only been available since the late 1990s and early 2000s. Index funds in some asset classes have been available for less than 10 years. We created workarounds for those two index funds as explained later in this section.
This study was conducted by comparing three different index fund portfolios to their respective actively managed fund portfolios. First, the results of the three-fund index fund portfolio were measured over the time period. Second, a five-fund portfolio was created using two new asset classes. Third, a ten-fund index fund portfolio was created and measured. All funds in the portfolios were equally weighted, including the index fund portfolios.
Run 1: Equally-Weighted Three-Fund Index Fund Portfolio Scenario 3 used a 10-year period from 2003 to 2012. The first step was to run 5,000 simulated trials for the equally-weighted, three-fund portfolio that held Vanguard Total Stock Market Index (VTSMX), Vanguard Total International Stock Index (VGTSX) and Vanguard Total Bond Market Index (VBMFX).
The three-fund index fund portfolio was compared to 5,000 simulated trials of active fund portfolios, each with three randomly selected funds. Figure 3 highlights the results.
The equally weighted three-fund index fund portfolio outperformed 87.7% of actively managed fund portfolios over this 10-year period. The losing active fund portfolios had a median performance shortfall of -1.47% annually, while the winning actively managed fund portfolios had a median outperformance of 0.54% annually.
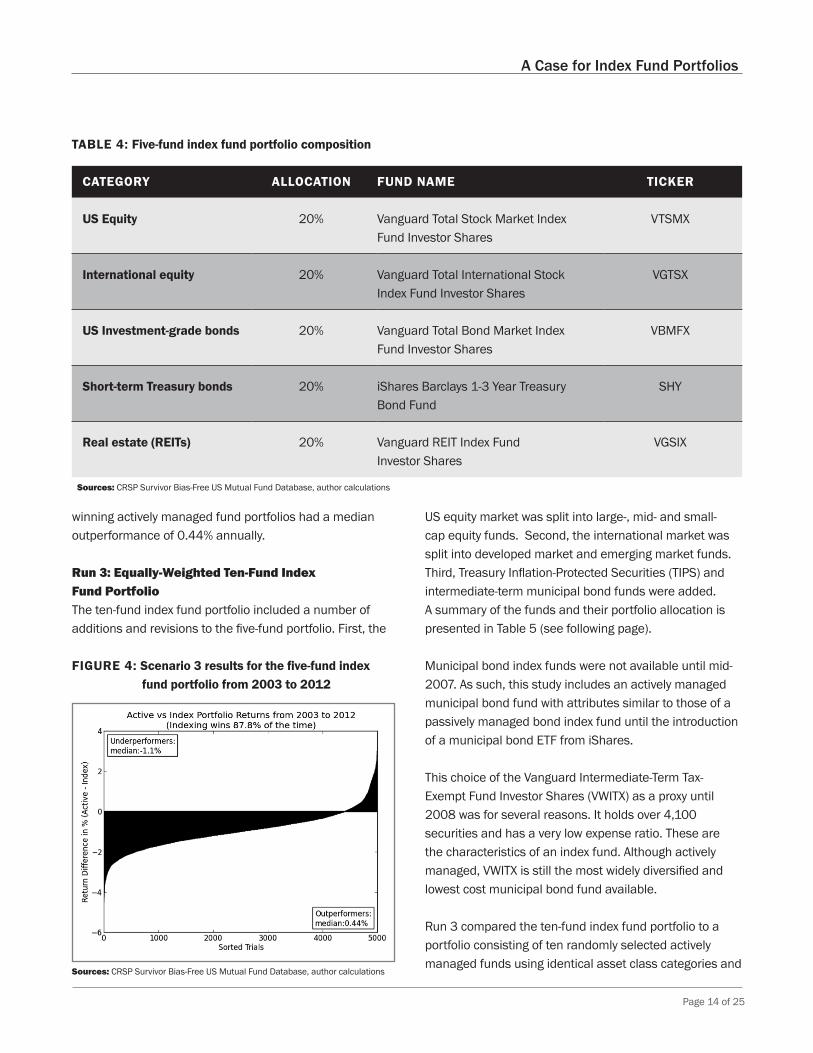
Run 2: Equally-Weighted Five-Fund Index Fund Portfolio The index fund portfolio fund count was expanded to five funds by introducing a short-term Treasury securities index fund and a REIT index fund. This portfolio was equally-weighted to 20% in each fund as shown in Table 4 (see following page). The portfolio was also compared to 5,000 simulated trials of active fund portfolios, each with five randomly selected funds within the same investment categories and with 20% allocated to each asset class.
Run 2 compared the five-fund index fund portfolio to randomly selected actively managed portfolios using identical asset class categories and weightings. The 5,000 simulated trials used a 10-year period from 2003 to 2012. The results of Run 2 are illustrated in Figure 4 (see following page).
The five-fund index fund portfolio beat 87.8% of actively managed fund portfolios using 5,000 simulated trials. The losing active fund portfolios had a median performance shortfall of -1.10% annually, while the
SCENARIO 3: MULTI-ASSET CLASS PORTFOLIOS
FIGURE 3: Scenario 3 results for the three-fund index fund portfolio from 2003 to 2012
Sources: CRSP Survivor Bias-Free US Mutual Fund Database, author calculations
Page 14 of 25
A Case for Index Fund Portfolios
winning actively managed fund portfolios had a median outperformance of 0.44% annually.
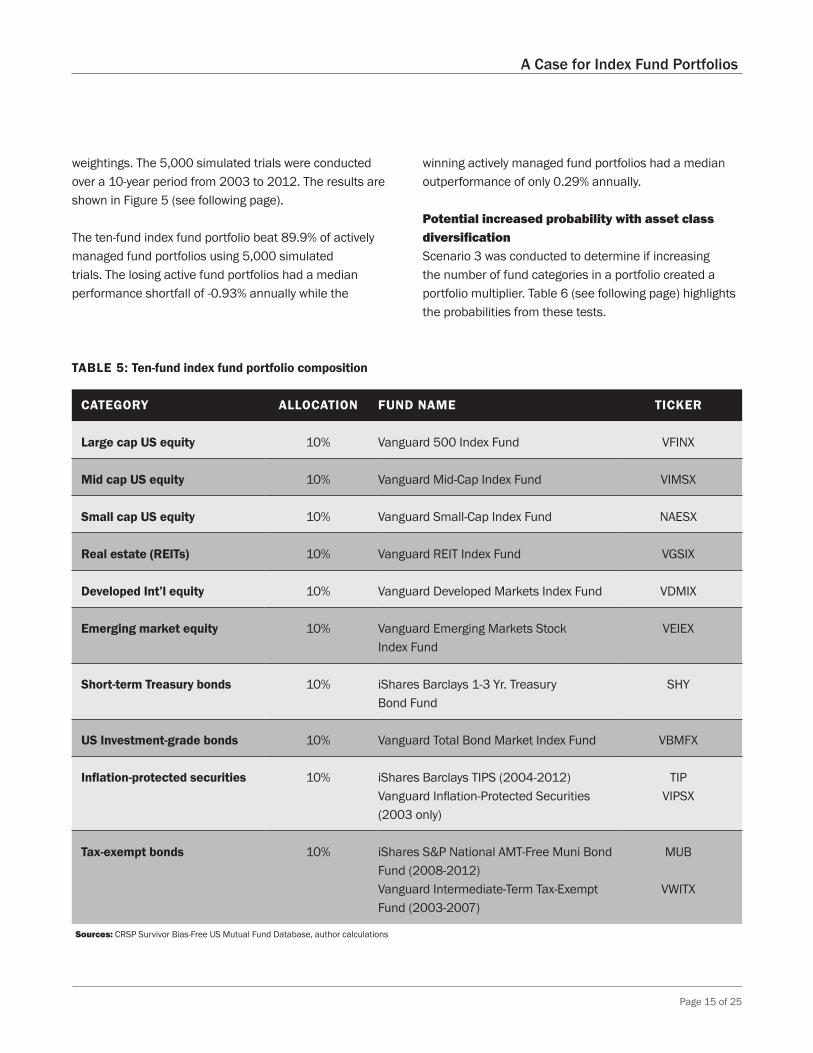
Run 3: Equally-Weighted Ten-Fund Index Fund Portfolio The ten-fund index fund portfolio included a number of additions and revisions to the five-fund portfolio. First, the
US equity market was split into large-, mid- and small-cap equity funds. Second, the international market was split into developed market and emerging market funds. Third, Treasury Inflation-Protected Securities (TIPS) and intermediate-term municipal bond funds were added. A summary of the funds and their portfolio allocation is presented in Table 5 (see following page).
Municipal bond index funds were not available until mid-2007. As such, this study includes an actively managed municipal bond fund with attributes similar to those of a passively managed bond index fund until the introduction of a municipal bond ETF from iShares.
This choice of the Vanguard Intermediate-Term Tax-Exempt Fund Investor Shares (VWITX) as a proxy until 2008 was for several reasons. It holds over 4,100 securities and has a very low expense ratio. These are the characteristics of an index fund. Although actively managed, VWITX is still the most widely diversified and lowest cost municipal bond fund available.
Run 3 compared the ten-fund index fund portfolio to a portfolio consisting of ten randomly selected actively managed funds using identical asset class categories and
TABLE 4: Five-fund index fund portfolio composition
CATEGORY ALLOCATION FUND NAME TICKER
US Equity 20% Vanguard Total Stock Market Index Fund Investor Shares
VTSMX
International equity 20% Vanguard Total International Stock Index Fund Investor Shares
VGTSX
US Investment-grade bonds 20% Vanguard Total Bond Market Index Fund Investor Shares
VBMFX
Short-term Treasury bonds 20% iShares Barclays 1-3 Year Treasury Bond Fund
SHY
Real estate (REITs) 20% Vanguard REIT Index Fund Investor Shares
VGSIX
FIGURE 4: Scenario 3 results for the five-fund index fund portfolio from 2003 to 2012
Sources: CRSP Survivor Bias-Free US Mutual Fund Database, author calculations
Sources: CRSP Survivor Bias-Free US Mutual Fund Database, author calculations
Page 15 of 25
A Case for Index Fund Portfolios
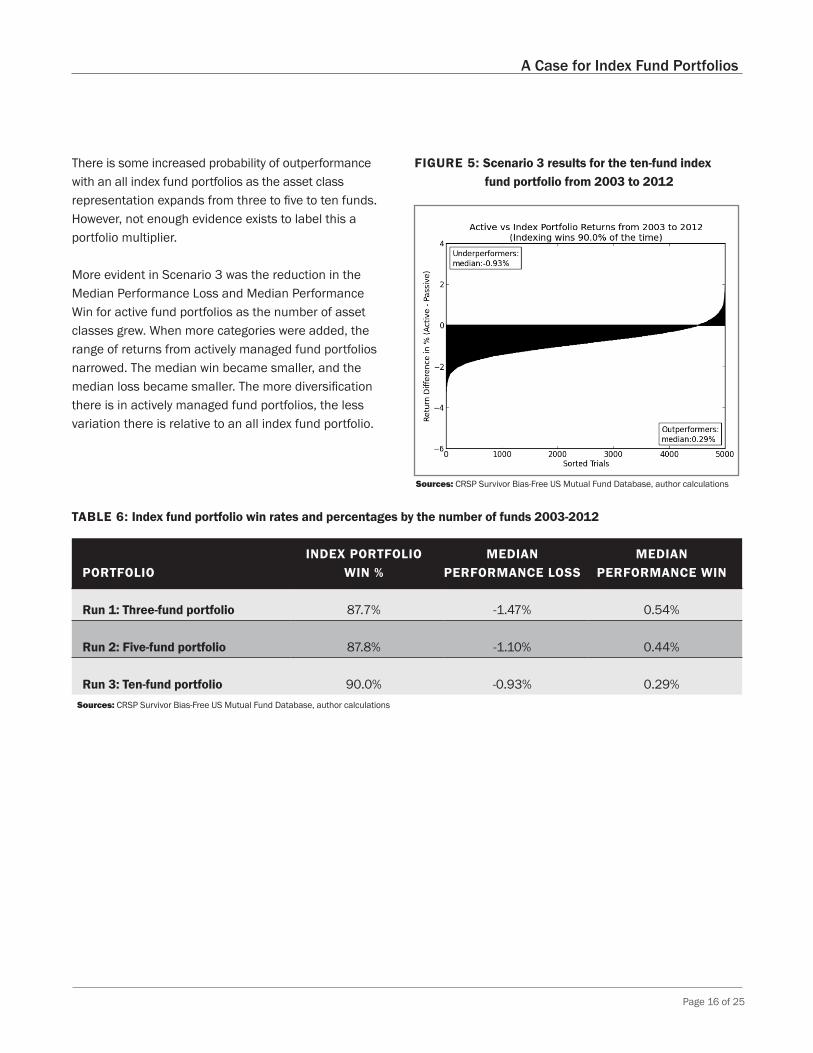
weightings. The 5,000 simulated trials were conducted over a 10-year period from 2003 to 2012. The results are shown in Figure 5 (see following page).
The ten-fund index fund portfolio beat 89.9% of actively managed fund portfolios using 5,000 simulated trials. The losing active fund portfolios had a median performance shortfall of -0.93% annually while the
winning actively managed fund portfolios had a median outperformance of only 0.29% annually.
Potential increased probability with asset class diversification Scenario 3 was conducted to determine if increasing the number of fund categories in a portfolio created a portfolio multiplier. Table 6 (see following page) highlights the probabilities from these tests.
TABLE 5: Ten-fund index fund portfolio composition
CATEGORY ALLOCATION FUND NAME TICKER
Large cap US equity 10% Vanguard 500 Index Fund VFINX
Mid cap US equity 10% Vanguard Mid-Cap Index Fund VIMSX
Small cap US equity 10% Vanguard Small-Cap Index Fund NAESX
Real estate (REITs) 10% Vanguard REIT Index Fund VGSIX
Developed Int’l equity 10% Vanguard Developed Markets Index Fund VDMIX
Emerging market equity 10% Vanguard Emerging Markets Stock Index Fund
VEIEX
Short-term Treasury bonds 10% iShares Barclays 1-3 Yr. Treasury Bond Fund
SHY
US Investment-grade bonds 10% Vanguard Total Bond Market Index Fund VBMFX
Inflation-protected securities 10% iShares Barclays TIPS (2004-2012) Vanguard Inflation-Protected Securities (2003 only)
TIP VIPSX
Tax-exempt bonds 10% iShares S&P National AMT-Free Muni Bond Fund (2008-2012) Vanguard Intermediate-Term Tax-Exempt Fund (2003-2007)
MUB
VWITX
Sources: CRSP Survivor Bias-Free US Mutual Fund Database, author calculations
Page 16 of 25
A Case for Index Fund Portfolios
There is some increased probability of outperformance with an all index fund portfolios as the asset class representation expands from three to five to ten funds. However, not enough evidence exists to label this a portfolio multiplier.
More evident in Scenario 3 was the reduction in the Median Performance Loss and Median Performance Win for active fund portfolios as the number of asset classes grew. When more categories were added, the range of returns from actively managed fund portfolios narrowed. The median win became smaller, and the median loss became smaller. The more diversification there is in actively managed fund portfolios, the less variation there is relative to an all index fund portfolio.
FIGURE 5: Scenario 3 results for the ten-fund index fund portfolio from 2003 to 2012
TABLE 6: Index fund portfolio win rates and percentages by the number of funds 2003-2012
PORTFOLIOINDEX PORTFOLIO
WIN %MEDIAN
PERFORMANCE LOSSMEDIAN
PERFORMANCE WIN
Run 1: Three-fund portfolio 87.7% -1.47% 0.54%
Run 2: Five-fund portfolio 87.8% -1.10% 0.44%
Run 3: Ten-fund portfolio 90.0% -0.93% 0.29%
Sources: CRSP Survivor Bias-Free US Mutual Fund Database, author calculations
Sources: CRSP Survivor Bias-Free US Mutual Fund Database, author calculations

Page 17 of 25
A Case for Index Fund Portfolios
Investors typically hold more than one actively managed fund in each asset class. An investor may hold two or three US equity funds to diversify fund companies. They may hold a couple of bond funds to diversify fund managers. There are many reasons why investors choose to spread their mutual fund holdings among the same fund categories.
The question we asked was, is this is a good idea? We were interested to see if there was a meaningful difference in the probability of outperformance by an all index fund portfolio when investors used two or more actively managed funds in each asset class.
We looked at the performance of all index fund portfolios compared to actively managed fund portfolios that held one, two and three funds per each asset class. The three-fund index fund portfolio from Scenario 1 was used in these tests. The time period was 16-years, from 1997 to 2012.
Figure 6 highlights the results of the three tests in Scenario 4. The percentages represent the probability of an all index fund portfolio outperforming an all active fund portfolio in each of the three tests.
Although it is fairly common for investors to diversify their active fund holdings within an asset class, this practice lowered their performance relative to an all index fund portfolio. The chance of outperformance by the all index fund portfolio increased when two or more actively managed funds are used in each asset class.
Passive Portfolio Multiplier #3 – Increased probability with fund diversity The results of Scenario 4 highlight the significance of PPM #3. The probability that an all index fund portfolio will outperform an all actively managed fund portfolio increases when two or more active funds are used for each asset class category.
We conclude that while in general diversification of holdings is a good investing practice, diversifying fund managers is not. Doing so reduces the chances of an active portfolio outperforming an index portfolio. A portfolio of index funds provides both holdings diversification and a higher chance of outperformance.
SCENARIO 4: MULTIPLE ACTIVELY MANAGED FUNDS IN EACH ASSET CLASS
FIGURE 6: The probability that a three-fund index fund portfolio will outperform actively managed fund portfolios with one, two and three active funds per asset class.
Sources: CRSP Survivor Bias-Free US Mutual Fund Database, author calculations

Page 18 of 25
A Case for Index Fund Portfolios
Risk-adjusted performance considers a portfolio’s return relative to the volatility of the return. All things being equal, a portfolio with low volatility is preferred to a portfolio with high volatility.
We tested all scenarios using only returns, and then a second time using risk-adjusted returns. Our goal was to determine if adjusting for portfolio risk helped or hurt index fund portfolio performance relative to actively managed fund portfolios. The risk metric used was the Sharpe ratio.
Table 7 shows the three-fund index fund portfolio performance from Scenario 1 over multiple periods on both a nominal basis and a risk-adjusted basis. We looked at several periods of time to capture bull markets, bear markets and trendless markets.
The all index fund portfolio allocation was 40% allocated to the Vanguard Total Stock Market Index Fund (VTSMX), 20% allocated to the Vanguard Total International Stock Index Fund (VGTSX) and 40% allocated to the Vanguard Total Bond Market Index Fund (VBMFX). The actively managed fund portfolios had the same allocation. Table 7 highlights the results.
In a majority of tests, including most in Table 7, the all index fund portfolio outperformed more actively managed portfolios when adjusted for risk. However, this outcome was not universal. There were several tests in our study where actively managed portfolios performed slightly better on a risk-adjusted basis.
One of those tests was the ten-fund index fund portfolio from Scenario 3. Using 10-years of returns from 2003 to 2012, the ten-fund index fund portfolio won 90% of the time before adjusting for risk and 89% of the time after adjusting for risk. The actively managed portfolios gained 1% on a risk-adjusted basis, which is not a meaningful amount.
Our conclusion is that adjusting for risk does not help actively managed portfolio performance probabilities and it may not hurt it much either. Using risk-adjusted performance of all index fund portfolios may add slightly to their outperformance, but not meaningfully.
SCENARIO 5: RISK-ADJUSTED PERFORMANCE
TABLE 7: Risk-adjusted performance comparison for the three-index fund portfolio over varying independent time periods
TIME PERIOD NUMBER OF YEARSINDEX PORTFOLIO
WIN %RISK-ADJUSTED
INDEX WIN%
1998-2002 5 66.1% 64.9%
2003-2007 5 85.8% 91.0%
2008-2012 5 77.5% 77.7%
1997-2004 8 75.7% 74.6%
2005-2012 8 84.7% 85.3%
1997-2012 16 82.9% 85.5%
Sources: CRSP Survivor Bias-Free US Mutual Fund Database, author calculations
Page 19 of 25
A Case for Index Fund Portfolios
Most research on actively managed fund performance points to mutual fund fees as the biggest culprit inhibiting performance. According to research from Vanguard, a negative correlation exists between fund expenses and fund performance.19 On balance, their data shows that as fund expenses increase, long-term performance decreases. They also show that this tendency persists in every mutual fund category.
Though the performance data used in our study is net of fund expenses, the study has thus far been agnostic to the relative size of the fund expense ratios. It included funds with high and low expense ratios, and every expense ratio in-between.
The relative size of fund expense ratios was taken into consideration in the final scenario. Scenario 6 filters the database for actively managed funds that have lower-than-average expense ratios in their respective categories. These funds are the lowest 50% in terms of their stated expense ratio (again, ignoring front-end and deferred fund loads).
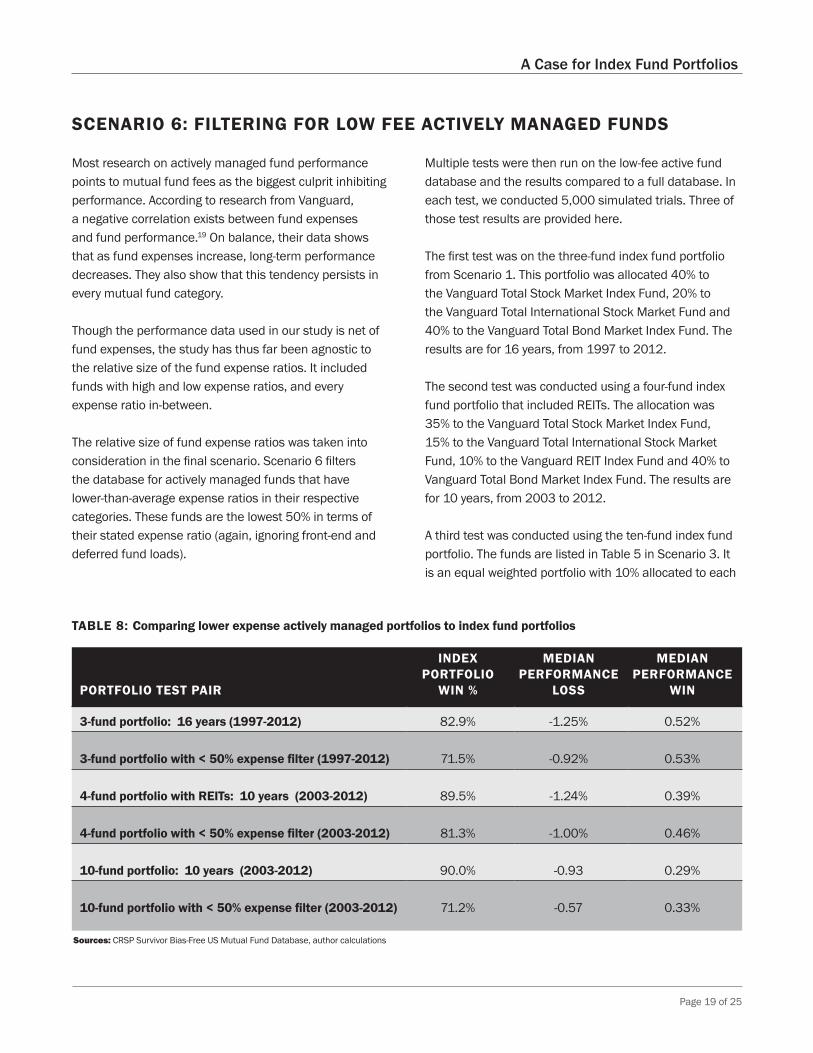
Multiple tests were then run on the low-fee active fund database and the results compared to a full database. In each test, we conducted 5,000 simulated trials. Three of those test results are provided here.
The first test was on the three-fund index fund portfolio from Scenario 1. This portfolio was allocated 40% to the Vanguard Total Stock Market Index Fund, 20% to the Vanguard Total International Stock Market Fund and 40% to the Vanguard Total Bond Market Index Fund. The results are for 16 years, from 1997 to 2012.
The second test was conducted using a four-fund index fund portfolio that included REITs. The allocation was 35% to the Vanguard Total Stock Market Index Fund, 15% to the Vanguard Total International Stock Market Fund, 10% to the Vanguard REIT Index Fund and 40% to Vanguard Total Bond Market Index Fund. The results are for 10 years, from 2003 to 2012.
A third test was conducted using the ten-fund index fund portfolio. The funds are listed in Table 5 in Scenario 3. It is an equal weighted portfolio with 10% allocated to each
SCENARIO 6: FILTERING FOR LOW FEE ACTIVELY MANAGED FUNDS
TABLE 8: Comparing lower expense actively managed portfolios to index fund portfolios
PORTFOLIO TEST PAIR
INDEX PORTFOLIO
WIN %
MEDIAN PERFORMANCE
LOSS
MEDIAN PERFORMANCE
WIN
3-fund portfolio: 16 years (1997-2012) 82.9% -1.25% 0.52%
3-fund portfolio with < 50% expense filter (1997-2012) 71.5% -0.92% 0.53%
4-fund portfolio with REITs: 10 years (2003-2012) 89.5% -1.24% 0.39%
4-fund portfolio with < 50% expense filter (2003-2012) 81.3% -1.00% 0.46%
10-fund portfolio: 10 years (2003-2012) 90.0% -0.93 0.29%
10-fund portfolio with < 50% expense filter (2003-2012) 71.2% -0.57 0.33%
Sources: CRSP Survivor Bias-Free US Mutual Fund Database, author calculations
Page 20 of 25
A Case for Index Fund Portfolios
fund. The results are for 10 years, from 2003 to 2012.
Table 8 (previous page) highlights the results of these three tests. The first column is the name of the portfolio test pair (with and without <50% expense filter). The second column is the index fund portfolio’s winning percentage. The third and fourth columns are the actively managed portfolios’ annualized median performance loss relative to the index fund portfolio and median performance win.
In all portfolio tests, there was some benefit to using low-cost actively managed funds, but not as much as we expected, given the reported impact that fees have on individual fund performance. The probability of outperformance by the all index fund portfolios remained above 70% in all scenarios. The 10-fund portfolio test showed the largest shift, although with little gain in the actual Median Outperformance Win amount.
An unexpected result from the low-fee tests was the low Median Performance Win increase by the outperforming actively managed fund portfolios. The difference in the three-fund portfolio was only 0.01% and the difference in all other tests was less than 0.10%. There was a reduction in the Median Performance Loss amount, meaning the losing low-fee portfolios fell short by less than the portfolios selected from all actively managed funds.
A common belief in the investment community is that low-fee actively managed fund portfolios have a meaningfully higher chance for outperforming an all index fund portfolio. We find no evidence to support this view. The best that can be said is that they edge closer to all index fund portfolio performance and that loss from underperforming is not as deep.
The Future of Filtering It may be possible to identify other fund characteristics that shift the probability in favor of actively managed fund portfolios. Filtering could be done using a variety of
factors: funds that had the best performance record, the highest ratings, the most assets under management, the best-educated managers, the oldest or youngest fund managers, etc. Perhaps a mix of factors can be found that produces positive results.
We speculate that filtering actively managed funds may shift the probability curve closer to an all index fund portfolio as in the low-expense example, but we are not convinced that any filtering methodology will significantly alter the balance in favor of all actively managed funds. This may be an area for future research.
Page 21 of 25
A Case for Index Fund Portfolios
Mutual fund portfolios holding only index funds have performance advantages over comparable portfolios that hold only actively managed funds. These advantages were quantified by running several scenarios that measured and compared strategy performance over time, both nominally and risk-adjusted.
During this analysis, three Passive Portfolio Multipliers (PPMs) were isolated that enhanced the probability of outperformance by all index fund portfolios. These multipliers illustrate how the chance of index fund portfolio outperformance increases as funds are combined in a portfolio, as the holding period increases, and as the number of actively managed funds in each asset class increases.
This study has important strategy implications for investors. Those currently holding actively managed fund portfolios can increase the probability of meeting their investment goals by switching to an all index fund portfolio. Those who own two or more actively managed funds in each asset class category would benefit significantly by switching to index funds in each asset class category.
A diversified portfolio holding only index funds in all asset classes is difficult to beat in the short-term and becomes more difficult to beat over time. An investor increases their probability of meeting their investment goals with a diversified all index fund portfolio held for the long term.
CONCLUSION
Page 22 of 25
A Case for Index Fund Portfolios
Bernstein, Peter L., Capital Ideas: The Improbable Origins of Modern Wall Street, (Free Press, December 16, 1991)
Bogle, John C., “The First Index Mutual Fund: A History of Vanguard Index Trust and the Vanguard Index Strategy,” Bogle Financial Markets Research Center, 1996, www.vanguard.com/bogle_site/lib/sp19970401.html.
Carhart, Mark M., “On Persistence in Mutual Fund Performance,” The Journal of Finance Vol. 52, No. 1 (March 1997): 57-82.
Fama, Eugene F., “The Behavior of Stock-Market Prices,” Journal of Business Vol. 38, Issue 1 (January 1965): 34 – 105.
Fama, Eugene F. and French, Kenneth R. “The Cross-Section of Expected Stock Returns,” The Journal of Finance Vol. 47, No. 2 (June 1992): 427 – 465.
Fama, Eugene F. and French, Kenneth R. “Multifactor Explanations of Asset Pricing Anomalies,” The Journal of Finance Vol. 51 No. 1 (March 1996).
Ferri, Richard A. The Power of Passive Investing, (John Wiley & Sons, December 7, 2011)
Jensen, Michael C. “The Performance of Mutual Funds in the Period 1945–1964,” The Journal of Finance Vol. 23, No. 2 (May 1, 1967): 389 – 416.
Martin, Larry L. “The Evolution of Passive versus Active Equity Management,” The Journal of Investing, Vol. 2, No. 1, 17-20 (Spring 1993).
Philips, Christopher B., Kinniry, Francis M. Jr., and Schlanger, Todd, “The case for index-fund investing”, April 2013, https://personal.vanguard.com/pdf/s296.pdf
Roth, Allan S. How a Second Grader Beats Wall Street: Golden Rules Any Investor Can Learn (John Wiley & Sons, January 25, 2011)
Schlanger, Todd and Philip, Christopher B. “The mutual fund graveyard: An analysis of dead funds”, January 2013, https://personal.vanguard.com/pdf/s362.pdf
Sharpe, William F. “Capital Asset Prices: A Theory of Market Equilibrium under Conditions of Risk,” The Journal of Finance Vol. 19, No. 3 (September 1964): 425 – 442.
Sharpe, William F. “Mutual Fund Performance,” The Journal of Business Vol. 39 (January 1966): 119–138.
Sharpe, William F. “The Arithmetic of Investment Expenses,” Financial Analysts Journal, Vol. 69, No. 2 (March 29, 2013)
Soe, Aye “S&P Indices Versus Active Funds (SPIVA®) Scorecard”, Year-End 2012, http://www.spindices.com/documents/spiva/spiva-us-year-end-2012.pdf
Treynor, Jack L. “How to Rate Management of Investment Funds,” Harvard Business Review 43 (1965): 63–75.
REFERENCES
Page 23 of 25
A Case for Index Fund Portfolios
1 For this study, the term “index fund” is used in its traditional meaning: a low-expense, broadly diversified, market-tracking mutual fund or exchange traded fund that is capitalization weighted. We recognize that in recent years the term has been expanded by the investment industry to include any list of securities and weighted using any methodology.
2 Richard Ferri ran several index fund portfolio probability studies in 2011 using a Morningstar® Principia® database for his book, The Power of Passive Investing (83-92).
3 By “average actively managed fund portfolio” we mean the median of 5,000 simulated trials comprised of randomly selected funds from each investment category and weighted using the same allocation as the index fund portfolio.
4 A ratio developed by Nobel Laureate William F. Sharpe to measure risk-adjusted performance of portfolios. The Sharpe ratio is calculated by subtracting the risk-free rate (a 1-month T-bill performance) from the performance for a portfolio and dividing the result by the standard deviation of the portfolio performance.
5 “The Arithmetic of Investment Expenses”, William F. Sharpe, Stanford University - Graduate School of Business, March 29, 2013, Financial Analysts Journal, Vol. 69, No. 2, 2013.
6 A good starting point for reviewing early mutual fund studies is Mutual Funds: Fifty Years of Research Findings, April 20, 2005, Seth C. Anderson and Parvez Ahmed, New York, Springer Science and Business Media, Inc. A second source is Martin Sewell’s website, http://finance.martinsewell.com/fund-performance/. See also a historical review by Richard A. Ferri, The Power of Passive Investing, in the reference section.
7 The quote is from Michael C. Jensen, “The Performance of Mutual Funds in the Period 1945 –1964”, The Journal of Finance 23, no. 2 (1967): 389 – 416.
8 See Mark M. Carhart, “On Persistence in Mutual Fund Performance,” The Journal of Finance Vol. 52, No. 1 (March 1997). Carhart was the first to apply a momentum factor in mutual fund analysis. He was also the first to document the
survivorship bias in mutual fund databases that existed at the time, which led to the founding of the CRSP Survivor-Bias-Free US Mutual Fund Database used in this study.
9 S&P Dow Jones Indices, LLC publishes a bi-annual report titled S&P Indices Versus Active Funds (SPIVA®) Scorecard. It compares actively managed equity and bond funds to S&P Dow Jones indexes and other indexes. They also publish the S&P Persistence Scorecard, which compares mutual fund performance over independent time periods. Both reports are available at http://us.spindices.com/. Vanguard research updates The Case for Indexing each year. The paper includes detailed comparisons of actively managed funds versus indexes and index funds. It is available at http://www.vanguard.com.
10 For a history of early adoption of risk metrics and indexing, read Capital Ideas: The Improbable Origins of Modern Wall Street, by Peter L. Bernstein, published by Free Press (December 16, 1991).
11 John C. Bogle has written extensively on the formation of the first index fund launched by Vanguard. See “The First Index Mutual Fund: A History of Vanguard Index Trust and the Vanguard Index Strategy,” in the reference section. After a name change, the Vanguard 500 Index fund grew to become the largest and most successful mutual fund in history by the late 1990s.
12 Larry L. Martin was a senior vice president and chief investment officer at State Street Global Advisors (formerly State Street Asset Management) in the early 1990s. The earliest discussion of portfolio performance probability was in “The Evolution of Passive versus Active Equity Management” by Martin in the spring 1993 issue of The Journal of Investing. The calculations were cited and summarized in Fact and Fantasy in Index Investing by Eric Kirzner (January 2000) on pages 27 & 28 under “Probability of Active Management Outperforming an Index.” The probabilities cited for a single manager outperforming an index were 41% in 1 year, 29% in 5 years, 22% in 10 years, and 14% in 20 years. The probabilities for three managers outperforming an index were 33% in 1 year, 17% in 5 years, 9% in 10 years, and 3% in 20 years. The probabilities for five managers outperforming an index were 29% in 1 year, 11% in 5 years, 4% in 10 years, and 1% in 20 years.
NOTES
Page 24 of 25
A Case for Index Fund Portfolios
13 Author and financial advisor Allan Roth also quantified portfolio probabilities and found strikingly similar results to Larry L. Martin several years earlier. His data is published in his book, How a Second Grader Beats Wall Street: Golden Rules Any Investor Can Learn (see reference section for details). Using fund expenses and a Monte Carlo simulation model, Roth calculated that probabilities for a single manager outperforming a comparable index fund were 42% in 1 year, 30% in 5 years, 23% in 10 years, and 12% in 25 years. The probabilities for three managers outperforming an index fund were 32% in 1 year, 18% in 5 years, 11% in 10 years, and 3% in 25 years. The probabilities for five managers outperforming an index fund were 25% in 1 year, 9% in 5 years, 6% in 10 years, and 1% in 25 years.
14 Richard Ferri ran multiple probability studies for The Power of Passive Investing using a Morningstar Principia® database. This database has survivorship bias because it’s intended for use in selecting funds for investment rather than performance research. To correct for the survivorship bias, a dummy variable for closure rates was added based on S&P SPIVA reports and the performance of closed and merged funds reported in Carhart’s paper, “On Persistence in Mutual Fund Performance” (see reference page). After finding similar results to Martin’s and Roth’s, a filtered database was created to 1) eliminate the highest expense actively managed funds, and 2) reduce the performance of index funds. The results of filtering only modestly lowered all index fund portfolio outperformance results.
15 The mutual fund graveyard: An analysis of dead funds, by Vanguard researchers Todd Schlanger and Christopher B. Philips, CFA, provides information on closed and merged funds. They include the difference in category performance using a database with a survivorship bias and one without. See the reference section.
16 The survivorship-bias test used the three-fund index fund portfolio in Scenario 1 for the period 1997 to 2012. The index fund portfolio outperformed 60.2% of actively managed fund portfolios using a database that included only surviving funds over the period. The same index fund portfolio outperformed 82.9% of actively managed fund portfolios selected from a
survivorship-bias fee database. The benefit of selecting funds based on hindsight is significant.
17 All information in this study was calculated or derived based on the data from the CRSP Survivor-Bias-Free US Mutual Fund Database (year-ending 2012), Center for Research in Security Prices (CRSP®), The University of Chicago Booth School of Business.
18 Special thanks to Akshat Mittal for assistance in developing the initial algorithm used in this study.
19 The case for indexing, a research paper by Vanguard, April 2013. See Figure 11: “Figure 11 provides evidence for the inverse relationship between investment performance and cost across multiple categories of funds, including both indexed and active mandates.”
Page 25 of 25
A Case for Index Fund Portfolios
This document and the performance data is provided for information purposes only and should not be used or construed as an indicator of future performance, an offer to sell, a solicitation of an offer to buy, or a recommendation for any security. Investments are subject to market risk, including the possible loss of the money you invest. Neither Portfolio Solutions®, LLC nor Betterment can guarantee the suitability or potential value of any particular investment. The performance data used is actual mutual fund data. The results portrayed reflect the reinvestment of dividends and other earnings, and reflect the deduction of mutual fund expenses. Mutual fund performance can be found at CRSP Survivor-Bias-Free US Mutual Fund Database. Past performance and portfolio allocations of benchmark indexes, mutual funds, hypothetical portfolios, or actual portfolios do not guarantee similar future performance of portfolio allocations. No assurances or guarantees can be given or implied concerning future investment results for Portfolio Solutions®, LLC, Betterment or any investment index. Future returns may differ significantly from the past due to materially different economic and market conditions and other factors. Investments within portfolios, and therefore, portfolios, involve risk and the possibility of loss, including a permanent loss of principal. Therefore, no current or prospective client should assume that future performance of any specific investment or investment strategy (including the investments and/or investment strategies recommended or undertaken by Portfolio Solutions®, LLC or Betterment) made reference to directly or indirectly by Portfolio Solutions®, LLC or Betterment in its web site, or indirectly via a link to an unaffiliated third party web site, will be profitable or equal the corresponding indicated performance level(s). Different types of investments involve varying degrees of risk, and there can be no assurance that any specific investment will either be suitable or profitable for a client or prospective client’s investment portfolio nor that the future performance of any specific investment or investment strategy will be profitable or equal any historical performance level(s).
Exposure to an asset class represented by an index is available through investable instruments based on that index. Neither Portfolio Solutions®, LLC nor Betterment sponsors, endorses, sells, promotes or manages any investment fund or other investment vehicle that is offered by third parties and that seeks to provide an investment return based on the performance of any index. Neither Portfolio Solutions®, LLC nor Betterment makes assurances that investment products based on the index will accurately track index performance or provide positive investment returns. A decision to invest in any investment fund should not be made in reliance on any statements set forth in this document. Prospective investors are advised to make an investment in any such fund only after carefully considering the risks associated with investing in such funds, as detailed in the offering memorandum, prospectus or similar document that is prepared by or on behalf of the issuer of the investment fund. Inclusion of a mutual fund, REIT or bond fund within an index is not a recommendation by Portfolio Solutions®, LLC or Betterment to buy, sell or hold such security, nor is it considered to be investment advice. This document has been prepared solely for information purposes based upon information generally available to the public from sources considered to be reliable. No content contained in this document (including index data) or any part of the content may be modified, reproduced or distributed in any form by any means, without the prior written permission of both Portfolio Solutions®, LLC and Betterment. The content of this document cannot be used for any unlawful or unauthorized purposes. Portfolio Solutions®, LLC and Betterment and its third party data provider do not guarantee
the accuracy, completeness, timeliness or availability of the content. Hypothetical illustrations are not exact representations of any particular investment, as you cannot invest directly in an index or fund-group average. The securities and/or strategies discussed do not relate or partially relate to the services currently offered by Portfolio Solutions®, LLC and Betterment. The results do not represent actual trading using client assets but were achieved by means of the retroactive application of a model design and they may not reflect the impact that material economic and market factors might have had on the decision-making of Portfolio Solutions®, LLC and Betterment if they were actually managing clients’ money. Bond funds are subject to the risk that an issuer will fail to make payments on time, and that bond prices will decline because of rising interest rates or negative perceptions of an issuer’s ability to make payments. Diversification does not ensure a profit or protect against a loss in a declining market.
Performance data shown represents past performance, which is not a guarantee of future results. Inherent in any investment is the potential for loss as well as the potential for gain. Investment returns and principal value will fluctuate, so investors’ shares, when sold, may be worth more or less than their original cost. Current performance may be lower or higher than the performance data cited. Investing involves risk, including possible loss of principal.
DISCLOSURE
0613PSWPCaseV3