Embed Size (px)
Citation preview

University of Kentucky University of Kentucky
UKnowledge UKnowledge
Molecular and Cellular Biochemistry Faculty Publications Molecular and Cellular Biochemistry
8-12-2020
A Chemical Interpretation of Protein Electron Density Maps in the A Chemical Interpretation of Protein Electron Density Maps in the
Worldwide Protein Data Bank Worldwide Protein Data Bank
Sen Yao University of Kentucky, [email protected]
Hunter N. B. Moseley University of Kentucky, [email protected]
Follow this and additional works at: https://uknowledge.uky.edu/biochem_facpub
Part of the Biochemistry, Biophysics, and Structural Biology Commons, and the Bioinformatics
Commons
Right click to open a feedback form in a new tab to let us know how this document benefits you. Right click to open a feedback form in a new tab to let us know how this document benefits you.
Repository Citation Repository Citation Yao, Sen and Moseley, Hunter N. B., "A Chemical Interpretation of Protein Electron Density Maps in the Worldwide Protein Data Bank" (2020). Molecular and Cellular Biochemistry Faculty Publications. 176. https://uknowledge.uky.edu/biochem_facpub/176
This Article is brought to you for free and open access by the Molecular and Cellular Biochemistry at UKnowledge. It has been accepted for inclusion in Molecular and Cellular Biochemistry Faculty Publications by an authorized administrator of UKnowledge. For more information, please contact [email protected].

A Chemical Interpretation of Protein Electron Density Maps in the Worldwide Protein Data Bank Notes/Citation Information Published in PLOS ONE, v. 15, issue 8, 0236894.
© 2020 Yao, Moseley.
This is an open access article distributed under the terms of the Creative Commons Attribution License, which permits unrestricted use, distribution, and reproduction in any medium, provided the original author and source are credited.
Digital Object Identifier (DOI) https://doi.org/10.1371/journal.pone.0236894
This article is available at UKnowledge: https://uknowledge.uky.edu/biochem_facpub/176

RESEARCH ARTICLE
A chemical interpretation of protein electron
density maps in the worldwide protein data
bank
Sen Yao1,2,3, Hunter N. B. MoseleyID1,2,3,4,5*
1 Department of Molecular & Cellular Biochemistry, University of Kentucky, Lexington, Kentucky, United
States of America, 2 Markey Cancer Center, University of Kentucky, Lexington, Kentucky, United States of
America, 3 Resource Center for Stable Isotope Resolved Metabolomics, University of Kentucky, Lexington,
Kentucky, United States of America, 4 Institute for Biomedical Informatics, University of Kentucky, Lexington,
Kentucky, United States of America, 5 Center for Clinical and Translational Science, University of Kentucky,
Lexington, Kentucky, United States of America
Abstract
High-quality three-dimensional structural data is of great value for the functional interpretation
of biomacromolecules, especially proteins; however, structural quality varies greatly across
the entries in the worldwide Protein Data Bank (wwPDB). Since 2008, the wwPDB has
required the inclusion of structure factors with the deposition of x-ray crystallographic struc-
tures to support the independent evaluation of structures with respect to the underlying exper-
imental data used to derive those structures. However, interpreting the discrepancies
between the structural model and its underlying electron density data is difficult, since derived
sigma-scaled electron density maps use arbitrary electron density units which are inconsis-
tent between maps from different wwPDB entries. Therefore, we have developed a method
that converts electron density values from sigma-scaled electron density maps into units of
electrons. With this conversion, we have developed new methods that can evaluate specific
regions of an x-ray crystallographic structure with respect to a physicochemical interpretation
of its corresponding electron density map. We have systematically compared all deposited x-
ray crystallographic protein models in the wwPDB with their underlying electron density
maps, if available, and characterized the electron density in terms of expected numbers of
electrons based on the structural model. The methods generated coherent evaluation metrics
throughout all PDB entries with associated electron density data, which are consistent with
visualization software that would normally be used for manual quality assessment. To our
knowledge, this is the first attempt to derive units of electrons directly from electron density
maps without the aid of the underlying structure factors. These new metrics are biochemi-
cally-informative and can be extremely useful for filtering out low-quality structural regions
from inclusion into systematic analyses that span large numbers of PDB entries. Furthermore,
these new metrics will improve the ability of non-crystallographers to evaluate regions of inter-
est within PDB entries, since only the PDB structure and the associated electron density
maps are needed. These new methods are available as a well-documented Python package
on GitHub and the Python Package Index under a modified Clear BSD open source license.
PLOS ONE
PLOS ONE | https://doi.org/10.1371/journal.pone.0236894 August 12, 2020 1 / 17
a1111111111
a1111111111
a1111111111
a1111111111
a1111111111
OPEN ACCESS
Citation: Yao S, Moseley HNB (2020) A chemical
interpretation of protein electron density maps in
the worldwide protein data bank. PLoS ONE 15(8):
e0236894. https://doi.org/10.1371/journal.
pone.0236894
Editor: Oscar Millet, CIC bioGUNE, SPAIN
Received: April 8, 2020
Accepted: July 15, 2020
Published: August 12, 2020
Peer Review History: PLOS recognizes the
benefits of transparency in the peer review
process; therefore, we enable the publication of
all of the content of peer review and author
responses alongside final, published articles. The
editorial history of this article is available here:
https://doi.org/10.1371/journal.pone.0236894
Copyright: © 2020 Yao, Moseley. This is an open
access article distributed under the terms of the
Creative Commons Attribution License, which
permits unrestricted use, distribution, and
reproduction in any medium, provided the original
author and source are credited.
Data Availability Statement: An older version of
this manuscript is available on the bioRxiv preprint
server: https://doi.org/10.1101/613109. Also the
described software is available on GitHub (https://
github.com/MoseleyBioinformaticsLab/pdb_eda)
and the Python Package Index (https://pypi.org/

Introduction
Proteins are active components in the biochemical implementation of biological processes,
and understanding their structure is important for interpreting their biochemical functions.
The Worldwide Protein Data Bank (wwPDB, www.wwpdb.org) [1] is the international organi-
zation that manages the Protein Data Bank (PDB, www.rcsb.org) [2], the central repository of
biological macromolecules structures. Thousands of structures are deposited into the wwPDB
every year, but their data quality can vary significantly from structure to structure, and even
region to region within a structure. Low-quality data can cause problems for both a single mac-
romolecule structure inspection and aggregated systematic analyses across hundreds or thou-
sands of structural entries [3, 4]. Thus, the analysis and interpretation issues caused by the
presence of low-quality structural data are pushing the structural biology community to pay
more attention to the quality of deposited structural entries [5]. The wwPDB has initiated sev-
eral efforts to improve the quality of entries being deposited, including launching a deposition,
biocuration, and validation tool: OneDep [6]. Many data quality measures are now available
for PDB structures, such as a resolution, B-factors, MolProbity clashscores [7], to name a few.
However, low-quality regions can still exist even in structures with very good metrics of global
structural quality, as shown in the overlay of structures with electron density maps in Fig 1.
These low-quality regions arise from structural model and electron density mismatches that
can be due to a variety of reasons including problems with regional protein mobility that can
often lead to an apparent lack of electron density [8–10], data processing [11, 12], or model fit-
ting [10, 13, 14]. These mismatches often occur around bound ligands where a lot of interest-
ing biological activities happen, making the analysis of protein sequence-structure-function
Fig 1. Model and difference electron density maps. Both panels A and B are from the same structure, PDB ID: 3B1Q, and are centered around the ligands
B.330 (A) and P.33 (B). Blue meshes represent the model electron density. Green and red meshes represent discrepancies between experimental data and
the structure model. The structure has very good overall quality, as demonstrated by a resolution of 1.7 Å, an R-factor value of 0.176, and an R-free value of
0.207. The panel A shows a high-quality region in the structure where the experimental data and model match very well. And the panel B shows that there
are still low-quality regions within the structure, as demonstrated by the green and red blobs around the coordinating ligand residue (“ligand” refers to the
coordination chemistry definition of this word).
https://doi.org/10.1371/journal.pone.0236894.g001
PLOS ONE A chemical interpretation of protein electron density maps in the worldwide protein data bank
PLOS ONE | https://doi.org/10.1371/journal.pone.0236894 August 12, 2020 2 / 17
project/pdb-eda/), the documentation is available
on ReadTheDocs (https://pdb-eda.readthedocs.io/
en/latest/), and all results are available on a
FigShare repository (https://doi.org/10.6084/m9.
figshare.7994294).
Funding: HNBM received National Science
Foundation (https://www.nsf.gov/) award 1419282.
The funders had no role in study design, data
collection and analysis, decision to publish, or
preparation of the manuscript.
Competing interests: The authors have declared
that no competing interests exist.

relationships more difficult. Therefore, the evaluation of structure quality, especially around
regions of interest, is paramount before accurate structural inferences can be made.
Driving improved evaluations of structure quality are newer deposition requirements like
mandatory deposition of structure factors (x-ray structures) and constraints (NMR structures)
starting from 2008 [15], NMR-assigned chemical shifts from 2010, and 3DEM volume maps
from 2016 [7]. The inclusion of underlying experimental data used in structure determination
enables researchers to better validate structural models, improving the inferences they can
make from these structures. For x-ray crystallographic structures, electron density maps enable
a direct comparison between the observed electron density Fo to calculated electron density Fc
based on the structural model. The 2Fo-Fc map represents the electron densities surrounding
well-determined atoms in the model across a three-dimensional (3D) space and the Fo-Fc
map represents the electron density discrepancies between the observed and calculated elec-
tron density across a 3D space. For x-ray crystallographic PDB entries with deposited experi-
mental data, sigma-scaled electron density maps are made available by the PDB in Europe
(PDBe) [16]. Previously from about 1998 to 2018 [17], electron density maps were made avail-
able by the Uppsala Electron Density Server (Uppsala EDS), which was created and main-
tained outside of the PDB [18]. However, the PDBe uses newer methods to provides higher
quality density maps, which prompted the retirement of the Uppsala EDS by 2018. Many elec-
tron density map viewers [19–22] exist for manually examining the quality of a model versus
its electron density; however, this software and evaluation approach is not suitable for batch
analysis of hundreds of structures. Also, these sigma-scaled electron density maps are in arbi-
trary units of electron density, with no direct physicochemical meaning. This normally does
not affect the visualization of electron densities and is a by-product of creating maps with a
summative intensity of zero (zero-sum) across the whole map, which is done primarily for
visual simplification during modeling [23, 24]. But this zero-sum representation can be detri-
mental for understanding a model, especially a local region of a model, where the number of
electrons represented by the density or density discrepancy would be useful for evaluation.
While methods exist that can derive electron density maps on an absolute scale, these methods
require a reanalysis of the underlying structure factors with software packages that are not
designed for automated use across large numbers of structural entries [25, 26]. Due to these
limitations, we have developed a new method that derives a conversion factor from the arbi-
trary electron density units of a given electron density map with corresponding PDB entry
into the absolute value of electrons per angstroms cubed, without the need to reprocess and
reanalyze the underlying structure factors. With this conversion factor, we have developed
new evaluation methods that normalize electron density and electron density discrepancies
into estimated quantities of electrons. These new electron discrepancy values can provide
chemically-informative information for evaluating structural models or for filtering structure
entry regions for inclusion into systematic analyses that span large numbers of PDB entries.
Methods
Calculating the electron density ratio for atoms, residues, and chains
A workflow of the analysis is shown in Fig 2. Structural data (in PDB format) was downloaded
from wwPDB on Jul 3, 2018, and their electron density data (in CCP4 format), if available, was
acquired from the PDBe website [16]. Structural data was processed using a self-developed
parser and Biopython [27]. Electron density data was analyzed according to the CCP4 suite
[28] format guidance. The electron density map is represented as a 3D array in the data, which
corresponds to voxels in the real space. An electron density voxel with a density value greater
than 1.5σ of all voxels is considered significant for 2Fo-Fc maps, and 3σ for Fo-Fc maps. For
PLOS ONE A chemical interpretation of protein electron density maps in the worldwide protein data bank
PLOS ONE | https://doi.org/10.1371/journal.pone.0236894 August 12, 2020 3 / 17

structures with electron density data available, symmetry operations were performed to
include the surrounding environment for the modeled structure.
To calculate the total electron density around each atom, we initially used the radii from lit-
erature [29] and calculated the sum of all densities within the corresponding radius. The voxel
center is used when calculating the distance from a density voxel to an atom. Different atoms
(without hydrogens) from the 20 common amino acids are categorized into 13 atom types as
shown in S1 Table. Electron density ratio (ri) is defined as the total density of all associated
voxels (ρm) divided by the number of electrons (Zi) for a given atom i,
ri ¼Prm
zið1Þ
As the unit for electron density is eÅ-3, the electron density ratio thus has the unit as Å-3.
The total density is adjusted by a factor of the occupancy of the atom. Since hydrogen is nor-
mally not resolvable within electron density maps, their electrons were added to their bonded
atom. A table of electron counts used for each atom is shown in S2 Table.
After all atom electron densities are calculated, they are aggregated into residue and chain
densities where the residue cloud contains at least 4 atoms and the chain cloud contains at
least 50 atoms. The overlapping density voxels between two or more atoms are only counted
once through the aggregation. The total number of electrons is calculated by adding contribut-
ing atom’s electron numbers together. Residue (rr) and chain (rc) density ratios are then calcu-
lated accordingly.
Fig 2. Workflow of the electron density analysis.
https://doi.org/10.1371/journal.pone.0236894.g002
PLOS ONE A chemical interpretation of protein electron density maps in the worldwide protein data bank
PLOS ONE | https://doi.org/10.1371/journal.pone.0236894 August 12, 2020 4 / 17

Normalizing the electron density ratio by the number of voxels
To smooth the representation of continuous electron densities using discrete voxels, the elec-
tron density ratio is then normalized by the median volume (in number of voxels) of a given
atom type. If we denote the original density ratio as ri and the volume of a given atom i with
atom type t as Vi, and the median volume of all atoms with atom type t as median(Vt), the nor-
malized density ratio ri-norm can be defined as follow:
ri� norm ¼ ri �medianðVtÞ=Vi ð2Þ
Correcting the unit electron density by the atom B-factor
As the actual value of the density ratio is highly specific to individual structures, we then define
a more universal measure as the chain deviation fraction (fi) for a given atom i as:
fi ¼ ðri� norm � medianðrcÞÞ=medianðrcÞ ð3Þ
The dispersion of electron density around an atom can be approximated using the B-factor
of the given atom. The chain deviation fraction and logarithmic B-factor have a linear correla-
tion both statistically and visually, and thus a slope (st) of chain deviation fraction over loga-
rithmic B-factor can be calculated for each atom type and for every structure. If there are less
than three points for a given atom type, the median slope over 1000 random structures is used.
Then for each individual atom i with atom type t, its unit electron density can be corrected by
its deviation from the median B-factor:
fi� corrected ¼ fi þ ðlogðbiÞ � medianðlogðbtÞÞÞ � st ð4Þ
ri� corrected ¼ fi� corrected �medianðrcÞ þmedianðrcÞ ð5Þ
Optimization of radii
After the initial calculation, the median density ratios of different atom types were still quite
different from each other. Thus, to achieve a more uniformly interpretable density ratio within
a structure as well as across structures, an optimization of radii was performed. First, we tested
the radius for each atom type on 100 random structures and obtained an initial estimation of
the radii. The metric we used to optimize was the median of corrected chain deviation fraction
(fi-corrected) for a given atom type. Based on the results from the initial step, we then optimized
one atom type at a time on 1000 randomly selected structures. For every iteration, the atom
type that has the largest deviation from last round was optimized. Different radii were tested
for the given atom type and the radius that has a median corrected chain deviation fraction
closest to zero was picked out. At the end of each optimization, the set of B-factor slopes were
updated as well. This process continued until the median chain deviation fraction for all atom
types were smaller than 0.05. The final set of radii were then tested on another 1000 random
structures and the whole PDB database for validation.
Adding an F000 term
The average value of the 2mFo-DFc map (i.e. a Sigma-A weighted map) is practically zero for
most of the structures in the PDB. Theoretically, an F000 term should be added to get the
proper number of electrons on an absolute scale. Unfortunately, not all structure factor
PLOS ONE A chemical interpretation of protein electron density maps in the worldwide protein data bank
PLOS ONE | https://doi.org/10.1371/journal.pone.0236894 August 12, 2020 5 / 17

programs provide the F000 value. So as an estimation, we add up the numbers of electrons for
all the atoms of a model in the unit cell, including symmetry structure units and modeled
water molecules,
F000 ¼X
ntZt ð6Þ
Where nt is number of atoms of element t in the asymmetric unit and Zt is the number of elec-
trons (atomic number) of element t. This estimated F000 term is then divided by the unit cell
volume V in Å3 and added to the density values of all the voxels.
Design, implementation, and distribution of the above methods
These new methods are implemented in a Python package, pdb-eda. It is written in major ver-
sion 3 of the Python program language and is available on GitHub, https://github.com/
MoseleyBioinformaticsLab/pdb_eda, and the Python Package Index (PyPI), https://pypi.org/
project/pdb-eda/. There are three main parts of pdb-eda: the pdb parser, the ccp4 parser, and
the electron density analysis. Starting from a PDB id, pdb-eda can either read a local pdb or
ccp4 file or download it on the fly. Intermediate and final results of all three parts can be
accessed via either importing as a library or using the command line interface. Many options
are available for handling and processing the data with the details documented in the package
guide and tutorial files. As part of the development process, new versions are updated on
GitHub regularly. The version that is described and implemented for this paper has been fro-
zen, tarballed, and published on FigShare (https://doi.org/10.6084/m9.figshare.7994294),
along with all the result files and codes in generating all results, figures, and tables.
Results
We downloaded and used a total of 141,763 wwPDB entries, of which 106,321 structures have
electron density maps available and suitable for the analysis in this study. The assumption of
this study is based on a fundamental rule for electron density construction, that is the electron
density is proportional to the number of electrons. However, after being deposited into the
PDB, this information of absolute value of electrons is hard to derive and is inconsistent across
structures. Different structures can vary a lot in terms of density ratios, due to the quality of
the crystal or the choice of data processing software. Therefore, we need an internal measure
to enable a consistent interpretation within and across structures. If we simply use the radii
from the literature and do not apply any correction, the median of atom density ratio shows
that the density ratios are inconsistent within a single structure for atoms, residues, and chains,
as illustrated in Fig 3 Panels A-C as Sina plots, an enhanced jitter strip chart that visualizes the
distribution of each dataset for better visual comparison [30]. The atom density ratios span
over the largest range, while the chain density ratio has the smallest range. Therefore, we chose
the chain deviation fraction as a reliable measure to optimize all atom types to the same level.
Volume and B-factor adjustment
An example of the volume distribution for a single structure is shown in Fig 4. Ideally, atoms
of the same atom type should occupy the same volume. However in reality, different parts of a
structure may be more or less ordered within the crystal than others. Also, during the recon-
struction of the electron density data from complex structure factors, continuous electron den-
sity through space is represented as a point density value for every voxel. And the use of the
point density to estimate the whole voxel depends on the smoothness of the density function.
Moreover, based on the placement of the atom in relation to the voxel and the selection of grid
PLOS ONE A chemical interpretation of protein electron density maps in the worldwide protein data bank
PLOS ONE | https://doi.org/10.1371/journal.pone.0236894 August 12, 2020 6 / 17

length, the inclusion of a voxel is an all-or-none decision. Thus, we performed the volume nor-
malization to minimize these effects.
B-factor measures the temperature-dependent atomic displacement in a crystal. As a result,
it is inversely correlated with the total electron density within a distance of an atom, and thus
the density ratio. After examining several different relationships between density ratio and B-
factor, both statistically and visually, the chain deviation fraction versus logarithmic B-factor
demonstrated the strongest linear correlation, and thus was used for the correction. This is not
surprising due to the expected non-linear relationship of B-factors [10]. Fig 5 provides an
example of this relationship.
The volume normalization correction helps to reduce the high variability of the density
ratio while the B-factor correction improves the symmetry of each atom density ratio distribu-
tion. Fig 6 illustrates the distributions of atom density ratios before and after each step (Panels
A-C). After both adjustments, the atom density ratio is coherent within each atom type,
though it is still uneven between atom types (Panel C).
The final set of radii after optimization
Fig 6, Panel D illustrates the distributions of atom density ratios after radii optimization,
where different atom types have much more similar median ratios. Moreover, the standard
Fig 3. Sina plots of density ratio for atoms, residues, and chains, before (Panels A-C) and after (Panels D-F) radii optimization. PDB ID: 3UBK. The
atom density ratios have the largest range, and chain density ratios have the smallest range, which can be used as internal standard to optimize the atom
ratios to.
https://doi.org/10.1371/journal.pone.0236894.g003
PLOS ONE A chemical interpretation of protein electron density maps in the worldwide protein data bank
PLOS ONE | https://doi.org/10.1371/journal.pone.0236894 August 12, 2020 7 / 17

deviation of the overall distribution drops to 0.09, representing a 40% decrease in the calcu-
lated density ratio variability. This improvement percolates through to the residue and chain
level, but is not as obvious (see Fig 3, Panels D-F). A comparison of initial and final set of radii
is shown in Table 1. In general, most of the backbone atoms decrease in radius, while most of
the optimized radii on the side chain are larger than those on the backbone. This is due to the
lower order and higher flexibility of the side chain atoms, which practically requires a larger
radius to capture the expected number of electrons.
Fig 4. Sina plot for the volumes of each atom type. PDB ID: 3UBK.
https://doi.org/10.1371/journal.pone.0236894.g004
PLOS ONE A chemical interpretation of protein electron density maps in the worldwide protein data bank
PLOS ONE | https://doi.org/10.1371/journal.pone.0236894 August 12, 2020 8 / 17
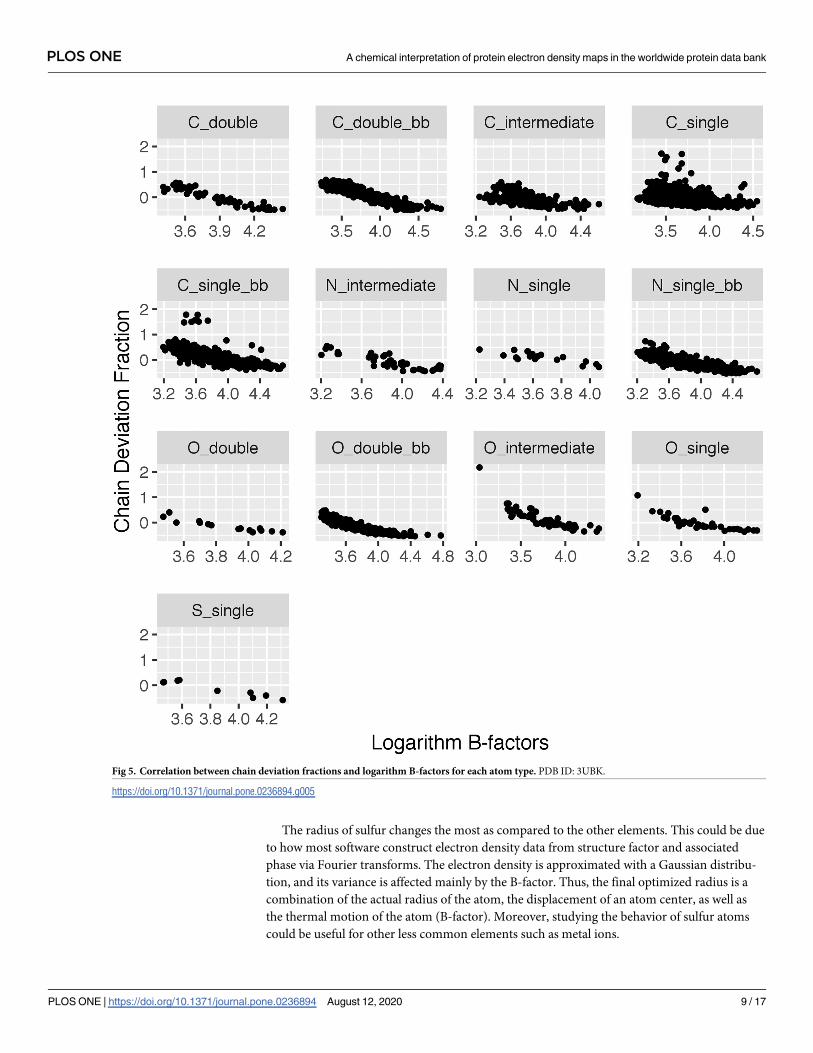
The radius of sulfur changes the most as compared to the other elements. This could be due
to how most software construct electron density data from structure factor and associated
phase via Fourier transforms. The electron density is approximated with a Gaussian distribu-
tion, and its variance is affected mainly by the B-factor. Thus, the final optimized radius is a
combination of the actual radius of the atom, the displacement of an atom center, as well as
the thermal motion of the atom (B-factor). Moreover, studying the behavior of sulfur atoms
could be useful for other less common elements such as metal ions.
Fig 5. Correlation between chain deviation fractions and logarithm B-factors for each atom type. PDB ID: 3UBK.
https://doi.org/10.1371/journal.pone.0236894.g005
PLOS ONE A chemical interpretation of protein electron density maps in the worldwide protein data bank
PLOS ONE | https://doi.org/10.1371/journal.pone.0236894 August 12, 2020 9 / 17

Overview of density ratio for the whole PDB database
The final set of radii was first tested on another 1000 random structures and all atom types
held true to have no more than a 5% chain deviation fraction. It was then applied to all PDB
structures that had usable electron density data, and the results are shown in Fig 7. For all
atom types, the distributions center around 0, which indicates the set of optimized radii yields
Fig 6. Atom density ratios at each major step of improvement. A) Original, B) After volume normalization, C) After B-factor correction, D) After radii
optimization. PDB ID: 3UBK. After each major step, the overall distribution of the atom density ratios generally becomes less spread.
https://doi.org/10.1371/journal.pone.0236894.g006
PLOS ONE A chemical interpretation of protein electron density maps in the worldwide protein data bank
PLOS ONE | https://doi.org/10.1371/journal.pone.0236894 August 12, 2020 10 / 17

consistent measures of density ratios across structures. As shown in S1 Fig, for high-quality
structures with a resolution smaller than 1.5Å, the chain deviation fraction illustrates tighter
distributions with modes above 0, because of the narrower electron dispersion around atoms
in the experimental data. As the resolution gets worse, this distribution tends to broaden for all
atom types with the modes smaller than 0.
F000 term and the absolute scale
Analysis of electron density on an absolute scale (i.e. in units of e/Å3) requires the value of F000
and the unit cell volume. As the shape of the density matters more than the absolute scale in
the structure modeling, most maps lack this F000 term. Therefore, the mean value of the 2mFo-
DFc map is practically zero across the whole PDB, as shown in Fig 8. To get the true electron
density values, we would need to add an F000 term to the set of Fourier coefficients going into
the calculation of the map. However, as Fig 9 shows before and after adding the estimated F000
term, it makes very little contribution to the overall absolute electron density values. This is
probably due to missing the contribution from the bulk solvent, which is not easy to retrieve
without extra data and software packages [25, 26]. Furthermore, the bulk solvent is estimated
in different ways depending on resolution [31, 32]. Thus, an F000 term as theoretically repre-
sented in textbooks and papers [33, 34] is not easy to calculate and likely depends on software
parameters used in the creation of the map. Therefore, the chain median is used as a conver-
sion factor to relate all electron density values back to the absolute scale.
Evaluative use-case for the electron density conversion factor
One of the most important applications of this work is to estimate the difference density map
in terms of electrons. The total difference in expected vs actual electron density can be repre-
sented in electron units by dividing the total electron densities by the conversion factor (the
median of chain density ratios). As shown in Fig 10, the Fo-Fc map overlaying the 2Fo-Fc map
and structure model show several positive (green) and negative (red) density blobs between
the measured density from the experiment and the density explained by the given model. On
panel A, most of the discrepancies are below six electrons, which can be reasonably interpreted
Table 1. The atom radii before and after radii optimization.
Atom Type Original Radius (Å) Optimized Radius (Å)
C_single 0.77 0.84
C_single_bb 0.77 0.72
C_double 0.67 0.67
C_double_bb 0.67 0.61
C_intermediate 0.72 0.72
O_single 0.67 0.80
O_double 0.60 0.71
O_double_bb 0.60 0.77
O_intermediate 0.64 0.71
N_single 0.70 0.95
N_single_bb 0.70 0.70
N_intermediate 0.62 0.77
S_single 1.04 0.75
“_bb” identifies backbone atom types.
https://doi.org/10.1371/journal.pone.0236894.t001
PLOS ONE A chemical interpretation of protein electron density maps in the worldwide protein data bank
PLOS ONE | https://doi.org/10.1371/journal.pone.0236894 August 12, 2020 11 / 17

as random background or water noise. Whereas on panel B, there are some difference density
blobs worth about 16 and 29 electrons, which could imply actual missing atoms from the
model. Moreover, the red missing electron density and the green extra density suggest that the
side chain of A389 glutamine should be modeled at the green mesh position rather than the
current position. In a similar manner, regions of interest that are common to many PDB
entries can be automatically filtered based on electron deviation quality before systematic
analysis.
Fig 7. Histogram of the median chain deviation fraction for all structures in the PDB.
https://doi.org/10.1371/journal.pone.0236894.g007
PLOS ONE A chemical interpretation of protein electron density maps in the worldwide protein data bank
PLOS ONE | https://doi.org/10.1371/journal.pone.0236894 August 12, 2020 12 / 17

Discussion
One of the biggest challenges in using electron density maps is that they are in arbitrary scale
with no direct physicochemical meaning. This is partly because of missing the magnitude of
the structure factor F000, which is generally not needed or reported in structure factor files or
electron density maps, as it does not affect standard modeling and visualization procedures.
Therefore, to put everything back onto an absolute scale so that it is more meaningful for gen-
eral scientists, this issue needs to be addressed. An approximation of the F000 term can be
derived from the structure model; however, it is still incomplete because of unknown solvent
Fig 8. Histogram of the mean value of electron density maps provided by PDBe. The histogram illustrates that most of the electron density maps in the
PDB are effectively zero-meaned. A) 2Fo-Fc density map, B) Fo-Fc density map.
https://doi.org/10.1371/journal.pone.0236894.g008
Fig 9. The absolute scale of the density ratio for all structures in the PDB. Panel A shows the density ratios vs. inverse of voxel volume plot indicates that
there is a consistent 1:3 ratio. Panel B is the histogram of the multiplication of the x and y axes values from Panel A. They both show that the density ratio is
not affected much by adding an estimated F000 term.
https://doi.org/10.1371/journal.pone.0236894.g009
PLOS ONE A chemical interpretation of protein electron density maps in the worldwide protein data bank
PLOS ONE | https://doi.org/10.1371/journal.pone.0236894 August 12, 2020 13 / 17

region compositions and potentially other factors, which are calculated in different ways
depending on resolution. Also, the zero-mean conversion methods for creation of electron
density maps appear to complicate a simple F000 correction. This study thus derived new meth-
ods that use the median of chain density ratio as a conversion factor to allow the calculation of
the missing or excessing electron densities in terms of absolute unit of electrons. These meth-
ods implemented in the pdb-eda package provide consistent measures across structures in the
PDB with publicly available electron density maps. The pdb-eda methods for deriving a con-
version of electron density into a quantity of electrons appear robust with respect to resolution
and other PDB entry-specific issues like B-factors, but these methods are currently limited to
PDB entries containing a significant peptide/protein component. However, the pdb-eda pack-
age contains the basic facilities necessary for deriving atomic radii for other polymeric and
repetitive supermacromolecular structures. Also, S1 Fig illustrates a correlation between chain
density ratios and resolution, which illuminates a clear path for improvement of atom radii
based on resolution. These relationships between atomic radii, B-factors, and resolution with
respect to observed electron density have been described previously [35]; however, Fig 5 and
S1 Fig provide a useful visualization of these relationships. Also, S1 Fig implies that the current
radii are likely optimized for the median resolution of x-ray crystallographic structures present
in the wwPDB.
For the purpose of region-specific model evaluation, our pdb-eda package derives a conver-
sion factor from arbitrary electron density per Å3 to electrons per Å3 based only on the pro-
vided 2Fo-Fc map and uses this conversion factor to convert electron density discrepancy
from the provided Fo-Fc map into absolute units of electrons of discrepancy. At a specified
number of standard deviations (sigma level), voxels with significant electron density discrep-
ancies can be detected, absolutely summed, and converted into units of electrons of discrep-
ancy to evaluate local regions [36]. A possibly sophisticated approach would be to use a
region-specific estimate of noise [25, 37] to detect voxels with significant electron density dis-
crepancies within a local region.
Fig 10. Evaluative use-case for the electron density conversion factor. PDB id: 2P7Z, panel A highlighted residue: A.351, panel B highlighted residue:
A.389. The blue lattice represents the significant density regions in the 2Fo-Fc map, while the green lattice represents the significant positive discrepant
density blobs and the red lattice represents the significant negative discrepant density blobs, both from the Fo-Fc map.
https://doi.org/10.1371/journal.pone.0236894.g010
PLOS ONE A chemical interpretation of protein electron density maps in the worldwide protein data bank
PLOS ONE | https://doi.org/10.1371/journal.pone.0236894 August 12, 2020 14 / 17

A complementary method called electron density support for individual atoms (EDIA) uti-
lizes the 2Fo-Fc map to evaluate the electron density support for the location of individual
atoms as well as groups of atoms within the electron density [38]. However, the values for
EDIA do not have a direct physiochemical interpretation like electrons of discrepancy that our
pdb-eda package derives from the Fo-Fc map. But between these two methods, both the Fo-Fc
and the 2Fo-Fc maps can be directly used to evaluate the structural quality of a region of inter-
est with respect to the experimental data. Moreover, pdb-eda electrons of discrepancy and
EDIA metrics should be highly complementary since the first focuses on the evaluation of sig-
nificant electron density discrepancies in the Fo-Fc map and EDIA focuses on the evaluation
of less significant (below 1.2σ) electron density in the 2Fo-Fc map. Therefore, these new mea-
sures provide useful region-specific model evaluation and are suitable for systematic quality
control analyses across large numbers of PDB structure entries, as demonstrated for bound
metal ion regions [36].
Over time, the user-base of the wwPDB has shifted from mainly protein crystallographers
to a broader community of biologists, computational biochemists, and bioinformaticians,
which poses new challenges for how structural data is effectively utilized. While crystallogra-
phers are familiar with the concept that not all regions in a structure are of the same quality,
this concept is relatively unfamiliar to the other scientists, who tend to focus on global metrics
of structure quality like resolution, R-factor, and R-free. Moreover, the experimental details
are rather overwhelming for non-crystallographers without extensive training. Thus, this
study takes advantages of the recent addition of electron density maps to the PDBe, enabling
general scientists to better utilize electron density information now available from the public
repository. Our Python pdb-eda package provides easy-to-use methods for interpreting and
evaluating structural data with a better physiochemical context. The primary goal of this pack-
age is to facilitate a shift in x-ray crystallographic structure evaluation from an entry-specific
perspective to a region-specific perspective for the broader scientific community that utilizes
the PDB.
Supporting information
S1 Table. Atom type mapping and the electron counts for the 20 common residues.
(DOCX)
S2 Table. Atom-specific electron counts for the 20 common residues.
(DOCX)
S1 Fig. Density plot of the median chain deviation fraction for all structures in the PDB of
different resolutions.
(TIFF)
Acknowledgments
We would like to acknowledge helpful conversations with Dr. David Rodgers.
Author Contributions
Conceptualization: Hunter N. B. Moseley.
Funding acquisition: Hunter N. B. Moseley.
Investigation: Sen Yao.
Methodology: Sen Yao, Hunter N. B. Moseley.
PLOS ONE A chemical interpretation of protein electron density maps in the worldwide protein data bank
PLOS ONE | https://doi.org/10.1371/journal.pone.0236894 August 12, 2020 15 / 17

Software: Sen Yao.
Supervision: Hunter N. B. Moseley.
Validation: Hunter N. B. Moseley.
Visualization: Sen Yao.
Writing – original draft: Sen Yao.
Writing – review & editing: Sen Yao, Hunter N. B. Moseley.
References1. Berman H, Henrick K, Nakamura H. Announcing the worldwide Protein Data Bank. Nat Struct Biol.
2003; 10(12):980. Epub 2003/11/25. https://doi.org/10.1038/nsb1203-980 PMID: 14634627.
2. Berman HM, Westbrook J, Feng Z, Gilliland G, Bhat TN, Weissig H, et al. The Protein Data Bank.
Nucleic Acids Res. 2000; 28(1):235–42. Epub 1999/12/11. https://doi.org/10.1093/nar/28.1.235 PMID:
10592235.
3. Yao S, Flight RM, Rouchka EC, Moseley HN. A less-biased analysis of metalloproteins reveals novel
zinc coordination geometries. Proteins. 2015; 83(8):1470–87. Epub 2015/05/27. https://doi.org/10.
1002/prot.24834 PMID: 26009987.
4. Yao S, Flight RM, Rouchka EC, Moseley HN. Aberrant coordination geometries discovered in the most
abundant metalloproteins. Proteins. 2017; 85(5):885–907. Epub 2017/02/01. https://doi.org/10.1002/
prot.25257 PMID: 28142195.
5. Yao S, Flight RM, Rouchka EC, Moseley HN. Perspectives and expectations in structural bioinformatics
of metalloproteins. Proteins. 2017; 85(5):938–44. Epub 2017/02/09. https://doi.org/10.1002/prot.25263
PMID: 28168746.
6. Young JY, Westbrook JD, Feng Z, Sala R, Peisach E, Oldfield TJ, et al. OneDep: Unified wwPDB Sys-
tem for Deposition, Biocuration, and Validation of Macromolecular Structures in the PDB Archive. Struc-
ture. 2017; 25(3):536–45. Epub 2017/02/14. https://doi.org/10.1016/j.str.2017.01.004 PMID:
28190782.
7. Gore S, Sanz Garcia E, Hendrickx PMS, Gutmanas A, Westbrook JD, Yang H, et al. Validation of Struc-
tures in the Protein Data Bank. Structure. 2017; 25(12):1916–27. Epub 2017/11/28. https://doi.org/10.
1016/j.str.2017.10.009 PMID: 29174494.
8. Mitroshin I, Garber M, Gabdulkhakov A. Crystallographic analysis of archaeal ribosomal protein L11.
Acta Crystallogr F Struct Biol Commun. 2015; 71(Pt 8):1083–7. Epub 2015/08/08. https://doi.org/10.
1107/S2053230X15011395 PMID: 26249704.
9. Fraser JS, Jackson CJ. Mining electron density for functionally relevant protein polysterism in crystal
structures. Cellular and molecular life sciences. 2011; 68(11):1829–41. https://doi.org/10.1007/s00018-
010-0611-4 PMID: 21190057
10. Shapovalov MV, Dunbrack RL Jr. Statistical and conformational analysis of the electron density of pro-
tein side chains. Proteins: Structure, Function, and Bioinformatics. 2007; 66(2):279–303.
11. Akey DL, Brown WC, Konwerski JR, Ogata CM, Smith JL. Use of massively multiple merged data for
low-resolution S-SAD phasing and refinement of flavivirus NS1. Acta Crystallogr D Biol Crystallogr.
2014; 70(Pt 10):2719–29. Epub 2014/10/08. https://doi.org/10.1107/S1399004714017556 PMID:
25286855.
12. Karplus PA, Diederichs K. Assessing and maximizing data quality in macromolecular crystallography.
Current opinion in structural biology. 2015; 34:60–8. https://doi.org/10.1016/j.sbi.2015.07.003 PMID:
26209821
13. van Beusekom B, Lutteke T, Joosten RP. Making glycoproteins a little bit sweeter with PDB-REDO.
Acta Crystallogr F Struct Biol Commun. 2018; 74(Pt 8):463–72. Epub 2018/08/08. https://doi.org/10.
1107/S2053230X18004016 PMID: 30084395.
14. Cowtan K. Fitting molecular fragments into electron density. Acta Crystallographica Section D: Biologi-
cal Crystallography. 2008; 64(1):83–9.
15. Dutta S, Burkhardt K, Young J, Swaminathan GJ, Matsuura T, Henrick K, et al. Data deposition and
annotation at the worldwide protein data bank. Mol Biotechnol. 2009; 42(1):1–13. Epub 2008/12/17.
https://doi.org/10.1007/s12033-008-9127-7 PMID: 19082769.
16. Gutmanas A, Alhroub Y, Battle GM, Berrisford JM, Bochet E, Conroy MJ, et al. PDBe: Protein Data
Bank in Europe. Nucleic Acids Res. 2014; 42(Database issue):D285–91. Epub 2013/11/30. https://doi.
org/10.1093/nar/gkt1180 PMID: 24288376.
PLOS ONE A chemical interpretation of protein electron density maps in the worldwide protein data bank
PLOS ONE | https://doi.org/10.1371/journal.pone.0236894 August 12, 2020 16 / 17

17. EMBL-EBI. http://www.ebi.ac.uk/pdbe/eds.
18. Kleywegt GJ, Harris MR, Zou JY, Taylor TC, Wahlby A, Jones TA. The Uppsala Electron-Density
Server. Acta Crystallogr D Biol Crystallogr. 2004; 60(Pt 12 Pt 1):2240–9. Epub 2004/12/02. https://doi.
org/10.1107/S0907444904013253 PMID: 15572777.
19. Sehnal D, Deshpande M, Varekova RS, Mir S, Berka K, Midlik A, et al. LiteMol suite: interactive web-
based visualization of large-scale macromolecular structure data. Nat Methods. 2017; 14(12):1121–2.
Epub 2017/12/01. https://doi.org/10.1038/nmeth.4499 PMID: 29190272.
20. DeLano WL. Pymol: An open-source molecular graphics tool. CCP4 Newsletter on protein crystallogra-
phy. 2002; 40(1):82–92.
21. Goddard TD, Huang CC, Ferrin TE. Visualizing density maps with UCSF Chimera. Journal of structural
biology. 2007; 157(1):281–7. https://doi.org/10.1016/j.jsb.2006.06.010 PMID: 16963278
22. Emsley P, Cowtan K. Coot: model-building tools for molecular graphics. Acta Crystallographica Section
D: Biological Crystallography. 2004; 60(12):2126–32.
23. Read RJ. Improved Fourier coefficients for maps using phases from partial structures with errors. Acta
Crystallographica Section A: Foundations of Crystallography. 1986; 42(3):140–9.
24. Schwarzenbach D, Abrahams S, Flack H, Gonschorek W, Hahn T, Huml K, et al. Statistical descriptors
in crystallography: Report of the IUCr Subcommittee on Statistical Descriptors. Acta Crystallographica
Section A: Foundations of Crystallography. 1989; 45(1):63–75.
25. Lang PT, Holton JM, Fraser JS, Alber T. Protein structural ensembles are revealed by redefining X-ray
electron density noise. Proceedings of the National Academy of Sciences. 2014;111(1):237–42.
26. Quillin ML, Wingfield PT, Matthews BW. Determination of solvent content in cavities in IL-1β using
experimentally phased electron density. Proceedings of the National Academy of Sciences. 2006;103
(52):19749–53.
27. Cock PJ, Antao T, Chang JT, Chapman BA, Cox CJ, Dalke A, et al. Biopython: freely available Python
tools for computational molecular biology and bioinformatics. Bioinformatics. 2009; 25(11):1422–3.
Epub 2009/03/24. https://doi.org/10.1093/bioinformatics/btp163 PMID: 19304878.
28. Collaborative Computational Project N. The CCP4 suite: programs for protein crystallography. Acta
Crystallogr D Biol Crystallogr. 1994; 50(Pt 5):760–3. Epub 1994/09/01. https://doi.org/10.1107/
S0907444994003112 PMID: 15299374.
29. Heyrovska R. Atomic Structures of all the Twenty Essential Amino Acids and a Tripeptide, with Bond
Lengths as Sums of Atomic Covalent Radii. arXiv preprint arXiv. 2008; 0804(2488).
30. Sidiropoulos N, Sohi SH, Pedersen TL, Porse BT, Winther O, Rapin N, et al. SinaPlot: an enhanced
chart for simple and truthful representation of single observations over multiple classes. Journal of
Computational and Graphical Statistics. 2018; 27(3):673–6.
31. Weichenberger CX, Afonine PV, Kantardjieff K, Rupp B. The solvent component of macromolecular
crystals. Acta Crystallographica Section D: Biological Crystallography. 2015; 71(5):1023–38.
32. Guo D, Blessing RH, Langs DA. Bulk-solvent correction in direct-methods phasing. Acta Crystallogra-
phica Section D: Biological Crystallography. 2000; 56(4):451–7.
33. Dorset DL. Filling the missing cone in protein electron crystallography. Microscopy research and tech-
nique. 1999; 46(2):98–103. https://doi.org/10.1002/(SICI)1097-0029(19990715)46:2<98::AID-
JEMT3>3.0.CO;2-G PMID: 10423555
34. Wang B-C. Resolution of phase ambiguity in macromolecular crystallography. Methods in enzymology.
115: Elsevier; 1985. p. 90–112.
35. Tickle IJ. Statistical quality indicators for electron-density maps. Acta Crystallographica Section D: Bio-
logical Crystallography. 2012; 68(4):454–67.
36. Yao S, Moseley HNB. Finding High-Quality Metal Ion-Centric Regions Across the Worldwide Protein
Data Bank. Molecules. 2019; 24:3179. https://doi.org/10.3390/molecules24173179.
37. Beckers M, Jakobi AJ, Sachse C. Thresholding of cryo-EM density maps by false discovery rate control.
IUCrJ. 2019; 6(1).
38. Meyder A, Nittinger E, Lange G, Klein R, Rarey M. Estimating electron density support for individual
atoms and molecular fragments in X-ray structures. Journal of chemical information and modeling.
2017; 57(10):2437–47. https://doi.org/10.1021/acs.jcim.7b00391 PMID: 28981269
PLOS ONE A chemical interpretation of protein electron density maps in the worldwide protein data bank
PLOS ONE | https://doi.org/10.1371/journal.pone.0236894 August 12, 2020 17 / 17


![The Relativistic Electron Density [1ex] and Electron ... · PDF fileThe Relativistic Electron Density and Electron Correlation Markus Reiher ... Electron density distributions for](https://img.pdfslide.net/doc/110x75/5ab2020e7f8b9aea528d15ec/the-relativistic-electron-density-1ex-and-electron-relativistic-electron-density.jpg)