Embed Size (px)
Citation preview

U.S. Department of the InteriorU.S. Geological Survey
Fact Sheet 2012–3053April 2012
Famine Early Warning Systems Network—Informing Climate Change Adaptation Series
A Climate Trend Analysis of Ethiopia
Printed on recycled paper
Conclusions
Food Security Context: Complex Patterns of Climate, Climate Change, and Livelihoods
Most rural people live in the highlands and middle-highlands, which comprise only one-third of the country, and this population tends to be concentrated primarily in Oromia or northern SNNPR.
The seasonality of rainfall varies in different areas of Ethiopia. In the eastern Somali region, rains come twice a year–during the March–June Belg season, and during the October–December Deyr season. In the south-central part of the country, most areas receive both Belg and summer (June–September) Kiremt rains. Many farmers plant slowly maturing but high yielding ‘long cycle’ crops that grow during both the Belg and Kiremt seasons.
In 2011, Ethiopia, with a population of 90.9 million (CIA, 2011) and a population growth rate of 3.2 percent (a doubling time of 22 years), faces increased levels of food insecurity. Pre-planned assis-tance provided by the Productive Safety Net Program supported some 7.4 million people, whereas an additional 4.5 million people required emergency humanitarian assistance because of decreased pre-cipitation and extremely high food prices (FEWS NET, 2011). These 4.5 million people tended to be located in the south-central, southeast-ern, or eastern part of the country. Approximately 65 percent of these at-risk households relied primarily on agricultural livelihoods; the remainder were pastoralists or agro-pastoralists.
Ethiopia is a large complex country, with complex patterns of rainfall and livelihoods (Livelihoods Integration Unit, 2010). In Ethiopia, higher elevations receive more rainfall than low arid areas and support agricultural livelihoods and higher population densities (fig. 1). Lowlands receive minimal rainfall, and people generally sup-port themselves by raising livestock. In between, agro-pastoralists rely on a mixture of the two livelihood strategies. The population density of Ethiopia varies dramatically (Livelihoods Integration Unit, 2010), from more than 300 people per square kilometer (km2) in some parts of the Southern Nations, Nationalities, and Peoples Region (SNNPR, see Objectives and Methods section for a map with region names), to less than 10 people per km2 in areas dominated by pastoral livelihoods.
• Spring and summer rains in parts of Ethiopia have declined by 15–20 percent since the mid-1970s.
• Substantial warming across the entire country has exac-erbated the dryness.
• An important pattern of observed existing rainfall declines coincides with heavily populated areas of the Rift Valley in south-central Ethiopia, and is likely already adversely affecting crop yields and pasture conditions.
• Rapid population growth and the expansion of farming and pastoralism under a drier, warmer climate regime could dramatically increase the number of at-risk people in Ethiopia during the next 20 years.
• Many areas of Ethiopia will maintain moist climate conditions, and agricultural development in these areas could help offset rainfall declines and reduced produc-tion in other areas.
This brief report, drawing from a multi-year effort by the U.S. Agency for International Development (USAID) Famine Early Warning Systems Network (FEWS NET), examines recent trends in March–June, June–September, and March–September rainfall and temperature, identifying significant reductions in rainfall and increases in temperature over time in many areas of Ethiopia.
Between the mid-1970s and late 2000s, Belg and Kiremt rainfall, based on quality controlled station observations, decreased by 15–20 percent across parts of southern, southwestern, and southeastern Ethiopia. We have described these declines in three ways : as a contrac-tion of the areas receiving adequate rainfall for viable agricultural livelihoods (assumed to be greater than 500 millimeter (mm) of rainfall per rainy season), as a map of anticipated changes in rainfall and tem-peratures (assuming a persistence of patterns observed), and as plots of changes in standardized precipitation indices and dryness frequencies for selected crop growing areas (Funk and others, in press).
Ethiopia receives most of its rain between March and Septem-ber. Rains begin in the south and central parts of the country during the Belg season, then progress northward, with central and northern Ethiopia receiving most of their precipitation during the Kiremt season. Rainfall totals of more than 500 mm during these rainy seasons typi-cally provide enough water for viable farming and pastoral pursuits.
Between 1960 and 1989 the area receiving (on average) this much rain or more during the Belg season was large, more than 215,000 km2. For the Belg season this area is shown in light brown in the upper left panel of figure 2 and should be understood to lie beneath the dark brown and orange areas. During the past 20 years, the areas receiving sufficient Belg rains have contracted by 16 percent (dark brown polygon), exposing densely populated areas in the Rift Valley,
Patterns of Climate Change: Growing Season Rainfall has Declined by 15–20 Percent
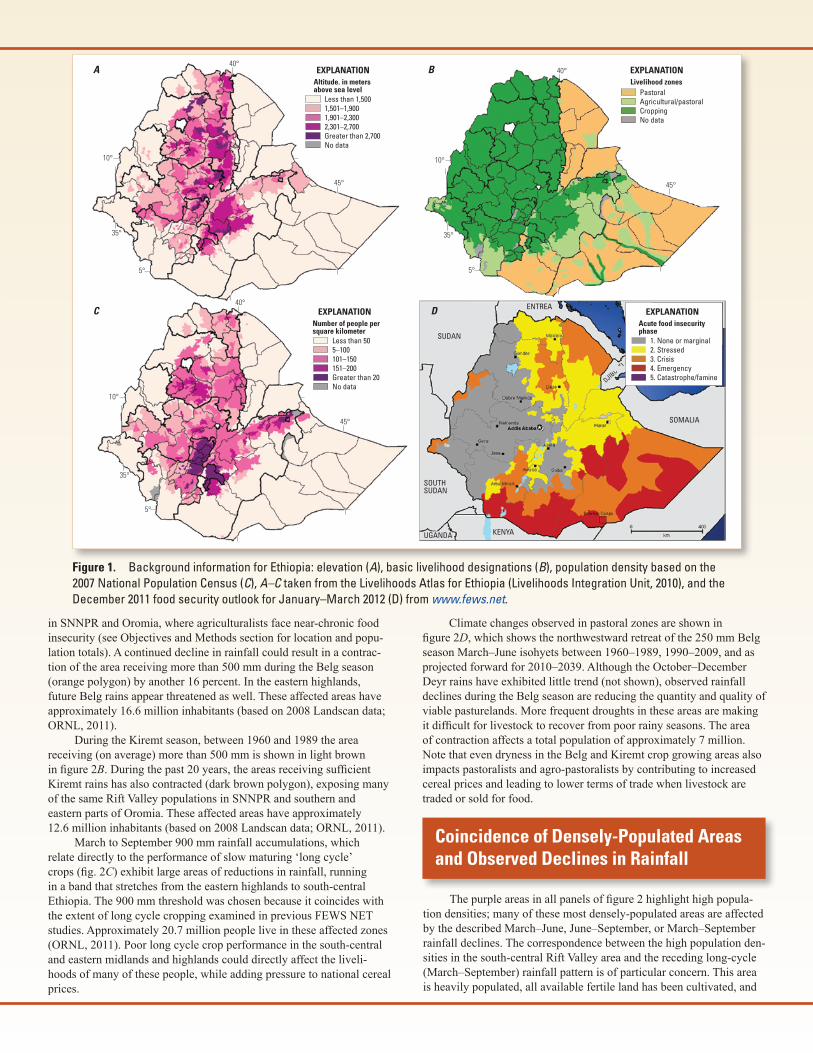
Figure 1. Background information for Ethiopia: elevation (A), basic livelihood designations (B), population density based on the 2007 National Population Census (C), A–C taken from the Livelihoods Atlas for Ethiopia (Livelihoods Integration Unit, 2010), and the December 2011 food security outlook for January–March 2012 (D) from www.fews.net.
45°
40°
35°
10°
5°
45°
40°
35°
10°
5°
45°
40°
35°
10°
5°
A
C D
B
Less than 1,5001,501–1,9001,901–2,3002,301–2,700Greater than 2,700No data
EXPLANATIONAltitude. in metersabove sea level Pastoral
Agricultural/pastoralCroppingNo data
EXPLANATIONLivelihood zones
Less than 505–100101–150151–200Greater than 20No data
EXPLANATIONNumber of people persquare kilometer
1. None or marginal2. Stressed3. Crisis4. Emergency5. Catastrophe/famine
EXPLANATIONAcute food insecurityphase
SUDAN
SOUTHSUDAN
KENYA
SOMALIA
DJIBOUTI
ENTREA
UGANDA
in SNNPR and Oromia, where agriculturalists face near-chronic food insecurity (see Objectives and Methods section for location and popu-lation totals). A continued decline in rainfall could result in a contrac-tion of the area receiving more than 500 mm during the Belg season (orange polygon) by another 16 percent. In the eastern highlands, future Belg rains appear threatened as well. These affected areas have approximately 16.6 million inhabitants (based on 2008 Landscan data; ORNL, 2011).
During the Kiremt season, between 1960 and 1989 the area receiving (on average) more than 500 mm is shown in light brown in figure 2B. During the past 20 years, the areas receiving sufficient Kiremt rains has also contracted (dark brown polygon), exposing many of the same Rift Valley populations in SNNPR and southern and eastern parts of Oromia. These affected areas have approximately 12.6 million inhabitants (based on 2008 Landscan data; ORNL, 2011).
March to September 900 mm rainfall accumulations, which relate directly to the performance of slow maturing ‘long cycle’ crops (fig. 2C) exhibit large areas of reductions in rainfall, running in a band that stretches from the eastern highlands to south-central Ethiopia. The 900 mm threshold was chosen because it coincides with the extent of long cycle cropping examined in previous FEWS NET studies. Approximately 20.7 million people live in these affected zones (ORNL, 2011). Poor long cycle crop performance in the south-central and eastern midlands and highlands could directly affect the liveli-hoods of many of these people, while adding pressure to national cereal prices.
Climate changes observed in pastoral zones are shown in figure 2D, which shows the northwestward retreat of the 250 mm Belg season March–June isohyets between 1960–1989, 1990–2009, and as projected forward for 2010–2039. Although the October–December Deyr rains have exhibited little trend (not shown), observed rainfall declines during the Belg season are reducing the quantity and quality of viable pasturelands. More frequent droughts in these areas are making it difficult for livestock to recover from poor rainy seasons. The area of contraction affects a total population of approximately 7 million. Note that even dryness in the Belg and Kiremt crop growing areas also impacts pastoralists and agro-pastoralists by contributing to increased cereal prices and leading to lower terms of trade when livestock are traded or sold for food.
Coincidence of Densely-Populated Areas and Observed Declines in Rainfall
The purple areas in all panels of figure 2 highlight high popula-tion densities; many of these most densely-populated areas are affected by the described March–June, June–September, or March–September rainfall declines. The correspondence between the high population den-sities in the south-central Rift Valley area and the receding long-cycle (March–September) rainfall pattern is of particular concern. This area is heavily populated, all available fertile land has been cultivated, and

Figure 2. Climate change in Ethiopia (Funk and others, in press): A shows the average location of the March–June 500 mm rainfall isohyets for 1960–1989 (light brown), 1990–2009 (dark brown), and 2010–2039 (predicted, orange). B shows the average location of the June–September 500 mm rainfall isohyets. C shows the average location of the March–September 900 mm rainfall isohyets. D shows the average location of the March–June 250 mm rainfall isohyets. The semi-transparent purple overlay shows the areas with 2007 population densities of greater than 100 people per km2. The yellow shading in the background delineates agricultural areas; the gray background delineates agro-pastoral and pastoral livelihood areas (cf. fig. 1B).
2010–20391990–20091960–1989
EXPLANATION
C. Long cycle rains March–September, 900 millimeter contours
D. Pastoral rains March–June, 250 millimeter contours
A. Belg season March–June, 500 millimeter contours
B. Kiremt season June–September, 500 millimeter contours
Population density greater than 100 people per square kilometer
Pastoral/agro-pastoralAgricultural
45°
40°
35°
10°
5°
45°
40°
35°
10°
5°
45°
40°
35°
10°
5°
45°
40°
35°
10°
5°
the size of land holdings is diminishing as population grows. It appears likely that the combination of population growth, land degradation, and more frequent droughts will result in more frequent food-related crises.
Observed Changes in Rainfall and Temperature Projected Forward
Spatial patterns and quantities of projected future rainfall reduc-tions and temperature increases are projected in figure 3, by extend-ing the rate of observed 1960–2009 changes for each season, through 2010–2039 , based on an assumed persistence of the observed trends. For the Belg rains, rainfall declines range from -150 to -50 mm across the south-central and eastern parts of the country, and will be associ-ated with lower Belg harvests and poorer pastoral rangelands during
the summer and early fall. This may be particularly disruptive for pastoralists and agro-pastoralists living in southern Oromia and west-ern Somali regions who currently (2012) rely upon meager Belg rains for their livelihoods. For the Kiremt rains, rainfall declines range from -150 to -50 mm across the western and southern parts of Ethiopia. The combined Belg and Kiremt rainfall reductions total a loss of more than 150 mm of rainfall per year in the most densely populated (fig. 1) long cycle crop growing area of the country.
If recent warming trends continue, most of Ethiopia will experi-ence more than a 1.0° Celsius (°C) increase in air temperature (fig. 3B bottom), with the warming tendency projected to be greatest in the south-central part of the country. This warming will intensify the impacts of droughts, and could particularly reduce the amount of productive crop land for coffee, since coffee plants typically prefer temperatures cooler than 22°C.

Figure 3. Observed and projected change (Funk and others, in press) in March–June, June–September, and March–September rainfall (top) and temperature (bottom).
Greater than 10Plus or minus 10Less than 10Less than 50Less than 150
EXPLANATIONRainfall change, in millimeters
Less than 0.8Greater than 0.8Greater than 1.0Greater than 1.2
EXPLANATIONTemperature change, in degrees Celsius
March–June June–September March–September
March–SeptemberJune–SeptemberMarch–June
Recent rainfall performance for crop growing areas for the Belg and Kiremt seasons are shown in figures 4A and 4B. The x-axes iden-tify the percent change in the number of below normal rainfall seasons between 1960–1989 and 1990–2011 for the Belg and Kiremt seasons. For the Belg season, SNNPR, Oromia, and Amhara experienced a 35–80 percent increase in the frequency of below-normal rains. Dur-ing the Kiremt season, Oromia South, Beneshangul Gumuz, SNNPR, and Gambella have experienced a similar increase in below-normal rains.
The decreased rainfall averages for these same periods, expressed in units of standard deviations in the Standard Precipitation Index, are shown along the y-axes in figures 4A and 4B. During the past 11 or 12 years, average rainfall conditions have been poor in most areas, more than 0.4 standard deviations below average (Funk and others, in press). This means that more frequent droughts, and drier climate in general, may be producing repeated shocks that increase vulnerability and aid a cycle of poverty.
The great Rift Valley in Ethiopia is a densely populated area stretching southward from the capital city, Addis Ababa. During the Belg season, south of Shashemene, (fig. 2), the observed 500 mm rainfall isohyets for 1960–1989 and 1999–2009 indicate a substantial retreat, indicating increased climatic pressure on the valley’s agricul-tural livelihoods. A second area of declining rainfall and Belg crop production appears along the eastern highlands, stretching between the cities of Asebe Teferi and Harer. The most recent observations
(1990–2009) indicate that this area no longer receives an average of 500 mm of rainfall during the March-June season. If the rate of recent rainfall declines persists, the 500 mm rainfall contour appears likely to retreat to the west of Lake Abaya (southwest from Shashemene).
During the main Kiremt season, the pattern of westward retreat (fig. 2B) is similar, but more northward of Lake Abaya and Shashem-ene in the Rift Valley. These densely populated long cycle crop grow-ing areas of the Valley have experienced significant declines in rainfall. In areas with sufficient Belg and Kiremt rains, it is often the practice to grow slowly maturing varieties of maize, sorghum, and millet that can have high yields and account for up to one-half of the national crop production. The observed drying trends, centered on this critical long cycle growing area, have likely already had negative impacts on national agricultural production and food availability.
An Acceleration of the Trends? Very Dry Recent Weather
Hot-Spots of Climate Change: The Rift Valley and Eastern Highlands Areas
The Interaction of Altitude and Climate Change
Observed June-September rainfall means at 8°N for 1960–1989 and 1990–2009, and projected 2010–2039 are shown in figure 5. This graphic indicates how the ‘local velocity’ of climate change can interact with terrain. In Ethiopia, rainfall tends to increase to the west and at higher elevations, and the interaction of these two features is seen in an increase, a decrease, and then another increase in rainfall when moving from east-to-west at 8°N. Population density in central Oromia and eastern SNNPR tends to peak in the mountains and val-leys of the central Rift area. This area has already experienced sub-stantial declines in Kiremt rains between 1960–89 and 1990–2009, and further declines are projected. Population densities in this area (fig. 1C) are high, and this area of Ethiopia seems to be an emergent area of increasing risk. In the areas surrounding cities like Nazret, Meki, and Arsi Negele, declining rainfall should be of great concern regarding the impacts it is having on the food security of these large populations (fig. 2B).

Figure 4. Recent changes in dryness frequencies and standardized precipitation index (SPI) values for March–June (top) and June–September (bottom).
Figure 5. Transects of mean 1960–1989 and 1990–2009 June–September rainfall, along with 2010–2039 projected rainfall (transects taken along 8°N).
10 20 30 40 50 60 70 80-0.8
-0.7
-0.6
-0.5
-0.4
-0.3
-0.2
-0.1
0
Oromia South
Beneshangul Gumuz
Amhara
Oromia West
Oromia East
SNNPR
Gambella
Chan
ge in
sta
ndar
dize
d pr
ecip
itatio
n in
dex
(200
0–20
11 v
erse
s 19
60–1
989)
A. March–June rainfall
-10 0 10 20 30 40 50 60 70 80-1.2
-1.0
-0.8
-0.6
-0.4
-0.2
0
0.2
0.4
Oromia South
Beneshangul Gumuz
GambellaOromia West
Oromia East
SNNPR
Change in dryness frequency (1990–2011 verses 1960–1989)
B. June–September rainfall
Amhara
37º200
350
500
650
800
39.5ºLongitude
42º
Mea
n Ju
ne–S
epte
mbe
r rai
nfal
l, in
mill
imet
ers
Extent of productive growing areas over 1960–1989 era
1960–1989 observed
Extent of productive growing areas over 1990–2009 era
1990–2009 observed
Extent of productive growing areas over 2010–2039 era
2010–2039 projected
City: Jima At risk population centers
Cities:NazretMekiArsi Negele }
Population Pressure and Stagnating Agricultural Growth
Climatically Secure Areas
It is important to note that many areas of Ethiopia appear climati-cally secure. At 8°N, areas west of 38°E receive, and appear likely to continue to receive, more than 800 millimeters of precipitation during the Kiremt season. This is true for large areas of Ethiopia, during both the Belg and Kiremt seasons. Ethiopia does not, therefore, face a cata-strophic national failure of rainfall, but rather regional hot spots with a tendency towards more frequent droughts. Although these droughts will tend to affect most pastoralists and agro-pastoralists living in cli-matically marginal areas, improved yields in climatically secure areas could help mitigate the impact of those effects.
Some Implications for Climate Adaptation Programming
Ethiopia’s population of 90.9 million people expanded by 68 percent between 1990 and 2010, or by 33 million people. According to Gridded Population of the World statistics (CIESIN, 2011), most of these population increases occurred in Oromia (+11 million people) and SNNPR (+6 mil-lion), which are densely populated areas where rainfall has been declining rapidly (figs. 2 and 3), whereas the populations of chronically food insecure Somali, Tigray, and Afar regions have increased by approximately 1.5, 1.9, and 1.1 million people, respectively. Given that Ethiopia is a land-locked country dependent on agricultural, agro-pastoral, and pastoral livelihoods, this population expansion will place increasing stress on limited natural resources. Crop statistics from the Food and Agriculture Organization of the United Nations indicate that per capita cereal production in Ethiopia is relatively low (150 kilograms per person per year). Although yields have been improving, the amount of farmland per person has been declining at a rate twice as fast (Funk and Brown, 2009). If these trends persist, per capita cereal production could decline by 28 percent by 2025. This level of food production could leave millions more Ethiopians exposed to hunger and undernourishment
The patterns and rates of climate change discussed here repre-sent worrisome trends in one of the world’s most food insecure areas, and are consistent with previous FEWS NET studies of Ethiopia, and of its neighbors in the region (see Objectives and Methods section). A decline in rainfall of approximately 0.5 standard deviation, and an increase in the frequency of droughts of approximately 40 percent, is sufficient to markedly increase the number of poor harvests that can be expected. The impacts of increasingly frequent droughts could be offset by improved water and agricultural management practices. Raising yields in the more agriculturally viable areas may be a better option than extending agriculture into ever more marginal areas; however, rapid population growth may make it difficult to slow the process of agricultural extensification into those more marginal areas.
Whereas the agricultural viability of the areas highlighted above appears threatened, it is also important to note that large parts of the country are likely to continue receiving adequate amounts of rainfall. Agricultural development in the western highland areas is much less threatened and, with better agricultural practices and water manage-ment, could dramatically enhance food security at the national level. The spatial pattern of the drying and warming trends, however, tends to indicate disproportionate stresses on south-central Ethiopia, where trends have likely already been affecting yields during the Belg,

Figure 6. Landscan 2008 population for Ethiopia (ORNL, 2011), along with Gridded Population of the World (CIESIN, 2011) estimates of 1990 to 2010 population increases.
45°
40°
35°
10°
5°
Tigray +2 M
Amhara +8 M
Afar +1 M
Somali +1.5 M
Harari +0.3 M
Dire Dawa +0.1 M
SNNPR +6 M
Gambela +0.1 M
Beneshangul Gumuz +0.3 M
Oromia +11 M
Addis Ababa +1 M
Less than 2Less than 5162129
EXPLANATIONPopulation, in millions (M)
Publishing support provided by the Rolla Publishing Service Center
This report was written by Chris Funk and Jim Rowland (both of USGS), Gary Eilerts (USAID), Emebet Kebebe and Nigist Biru (both of FEWS NET), and Libby White and Gideon Galu (both of University of California, Santa Barbara). It builds upon a multi-year research project (see references) carried out under a USAID-funded FEWS NET agreement with USGS.
The FEWS NET Informing Climate Change Adaptation series seeks to guide adaptation efforts by providing sub-national detail on the patterns of climate trends already observed in an appropriately documented record. Whether or not these observed trends are related to natural climate variations, global warming, or some combination of the two is less important than knowing now where to focus adaptation efforts.
These FEWS NET reports rely on rigorous analysis of station data, combined with attribution studies using observed climate data. This brief report examined Ethiopian rainfall and temperature trends during the last 110 years (1900–2009) using observations from 215 rainfall gauges and 9 air temperature stations for the 2 primary rainy periods, corresponding to March–June and June–September. The data were quality controlled, and mean values were calculated for 1960–1989 and 1990–2009. The difference between these means was converted into 1960–2009 trend observations, and interpolated using a rigorous geo-statistical technique (kriging). Kriging produces standard error estimates, and these can be used to assess the relative spatial accuracy of the identified trends. Dividing the trends by the associated errors allows identification of the relative certainty of the estimates (Funk and others, 2005; Verdin and others, 2005; Brown and Funk, 2008; Funk and Verdin, 2009).
The observed warming trends are more likely to continue than the rainfall trends. But recent rainfall decreases appear linked to a warming of the Indian Ocean, and therefore likely to persist for at least the next decade. Readers interested in more information can see the reference links below. These publications are available at http://earlywarning.usgs.gov/fews/reports.php.
Objectives and Methods
Kiremt, and long cycle growing seasons. These increasingly frequent droughts will impact the large number of farmers and agro-pastoralists living in this area, while also decreasing food availability on a national scale. During the Belg season, more frequent droughts across the southeast have impacted marginal pastoral and agro-pastoral areas, fur-ther eroding resilience and increasing poverty at the sub-national scale.
References
Brown, M.E., and Funk, C.C., 2008, Food security under climate change: Sci-ence, v. 319, p. 580–581. (Also available online at ftp://chg.geog.ucsb.edu/pub/pubs/Science_2008.pdf.)
CIA (Central Intelligence Agency), 2011, The World Factbook, accessed December 15, 2011, at https://www.cia.gov/library/publications/the-world-factbook/geos/et.html.
CIESIN (Center for International Earth Science Information Network), 2011, Gridded population of the world, version 3, accessed May 5, 2010, at http://sedac.ciesin.columbia.edu/gpw/.
FEWS NET, 2010, Food Security Framework, accessed December 15, 2011, at http://www.fews.net/ml/en/info/Pages/fmwkfactors.aspx?gb=et&l=en&fmwk=factor.
FEWS NET, 2011, Ethiopia Food Security Outlook Update, August 25, 2011, accessed December 15, 2011, at http://www.fews.net/docs/Publications/Ethiopia_Dekadal_08_20_final_ext.pdf.
Funk, C., Senay, G., Asfaw, A., Verdin, J., Rowland, J., Korecha, D., Eilerts, G., Michaelsen, J., Amer, S., and Choularton, R., 2005, Recent drought tenden-cies in Ethiopia and equatorial-subtropical eastern Africa: Washington, D.C., U.S. Agency for International Development. (Also available online at ftp://chg.geog.ucsb.edu/pub/pubs/FEWSNET_2005.pdf.)
Funk, C., Dettinger, M.D., Michaelsen, J.C., Verdin, J.P., Brown, M.E., Barlow, M., and Hoell, A., 2008, Warming of the Indian Ocean threatens eastern and southern African food security but could be mitigated by agricultural devel-opment: Proceedings of the National Academy of Sciences of the United States of America, v. 105, no. 32, p. 11,081–11,086. (Also available online at ftp://chg.geog.ucsb.edu/pub/pubs/PNAS_2008.pdf.)
Funk, C.C., and Brown, M.E., 2009, Declining global per capita agricultural production and warming oceans threaten food security: Food Security, v. 1, no. 3, p. 271–289. (Also available online at ftp://chg.geog.ucsb.edu/pub/pubs/FoodSecurity_2009.pdf.)
Funk, C., and Verdin, J.P., 2009, Real-time decision support systems—The famine early warning system network, in Gebremichael, M., and Hossain, F., eds., Satellite rainfall applications for surface hydrology: Netherlands, Springer, p. 295–320. (Also available online at ftp://chg.geog.ucsb.edu/pub/pubs/SatelliteRainfallApplications_2010.pdf.)
Funk, C., Michaelsen, J., and Marshall, M., in press, Mapping recent decadal climate variations in precipitation and temperature across Eastern Africa and the Sahel, chap. 14 of Remote sensing of drought—Innovative monitoring approaches: Wardlow, B., Anderson, M., and Verdin, J., eds., New York, CRC Press, 484 p.
Livelihoods Integration Unit, 2010, The livelihoods atlas for Ethiopia: accessed December 15, 2011, at http://www.feg-consulting.com/spotlight/complete-atlas/Atlas%20Final%20Print%20Version%20June%2029%202011.pdf.
ORNL (Oak Ridge National Laboratory), 2011, Landscan 2008 population: accessed May 5, 2010, at http://www.ornl.gov/sci/landscan/.
Verdin, J.P., Funk, C.C., Senay, G.B., and Choularton, R., 2005, Climate science and famine early warning: Philosophical Transactions of the Royal Society B—Biological Sciences, v. 360, no. 1,463, p. 2,155–2,168. (Also available online at ftp://chg.geog.ucsb.edu/pub/pubs/RoyalSociety_2005.pdf.)
Williams, A.P., and Funk, C.C., 2011, A westward extension of the warm pool leads to a westward extension of the Walker circulation, drying eastern Africa: Climate Dynamics, v. 37.11-12, p. 2,417–2,435. (Also available at http://www.springerlink.com/content/u0352236x6n868n2/.)
Williams A.P., Funk, C., Michaelsen, J., Rauscher, S.A., Robertson, I., Wils, T.H.G., Koprowski, M., Eshetu, Z. and Loader, N.J., 2011, Recent summer precipitation trends in the Greater Horn of Africa and the emerging role of Indian Ocean sea surface temperature: Climate Dynamics. (Also available at http://www.springerlink.com/content/d3h8738018410q74/fulltext.pdf.)