Embed Size (px)
Citation preview
PerceptuaIand Motor Skills, 1993, 77, 163-174 O Perceptual and Motor Skills 1993
A CLOCK PARADIGM TO STUDY THE RELATIONSHIP BETWEEN EXPECTANCY AND RESPONSE FORCE '"
PIOTR JASKOWSKI AND ROLF VERLEGER
Department of Biopbsics, Medical Academy Department of Neurology Poznan, Poland Medizinische Uniuersitat zu Liibeck
Summary.-It has recently been demonstrated that the force used by subjects to press a response key depends on stimulation conditions such as stimulus intensity, fore- period, etc. We performed an experiment in which response force and reaction time were measured as a function of expectancy. In contrast to the paradigms used so far, we manipulated expectancy without using warning stimuli by applying a so-called "clock- paradigm." I t enabled us to avoid the possible arousing effect of the warning stimulus. Both reaction time and response force depended on expectancy. The results suggest that response force was not affected by arousal or activation but was affected by prepa- ratory state at the moment of making a response.
In reaction time experiments, very sensitive response keys are mostly used which need only little force to close an electrical circuit. However, cog- nitive psychologists have not generally been interested in measuring the force used by subjects when pressing the response key. Angel's paper (1973) on the relationshp between stimulus intensity and response force went, for in- stance, unnoticed, although he obtained astonishing results. In his experi- ments, subjects made speeded responses to stimuh of different intensities. O n every trial, a full force-time function was recorded, i.e., response force was continuously measured from stimulus onset. Besides the well-known reaction time changes there were some systematic variations of maximal force used by the subjects in making their response: the force was greater for higher stimulus intensities no matter what stimulus modality was employed. This result is a clear indication that stimulus intensity can affect very distal stages of stimulus processing.
Just recently the investigations of response force were restarted in sev- eral laboratories (Giray, 1990; Gitay & Ulrich, 1991; Jaskowski, Rybarczyk, Jaroszyk, & Lemanski, 1993; Jaskowski, Wroblewski, & Hojan-Jezierska, 1993). Giray (1990), in a series of experiments, found that response force depends on the duration of foreperiod. Reaction time and maximal force decreased as a function of duration of foreperiod. I t was also shown (Giray, 1990; Giray & Ulrich, 1991) that accessory auditory stimuli on tasks of di- vided and focused attention make subjects' responses both faster and stron- ger.
'This work was supported by a grant from the Commission of the European Communities to P. askowski.
'Address for correspondence: Piotr Jaskowski, Department of Biophysics, Medical Academy, Fredry 10, 61-701 Poznan, Poland.
164 P. JASKOWSKI & R. VERLEGER
All these findings were explained in terms of immediate arousal caused by the warning or accessory stimulus. According to t h s idea introduced by Sanders and Wertheim (1973; see also Sanders, 1983; Bertelson & Tisseyere, 1969; Posner, Nissen, & Klein, 1976), the incoming stimulus can evoke a transient state of higher arousal, a state in which the subject's reaction is fa- cilitated by general activation of the motor system. Adopting this idea, Giray (1990) suggested that the higher the level of arousal or activation, the larger the maxlmal force used by the subject.
Generally in line with this explanation are two studies by Jaskowski and coworkers (Jaskowski, Rybarczyk, Jaroszyk, & Lemanski, 1993; Jaskowski, Wroblewski, & Hojan-Jezierska, 1993). In the first study (Jaskowsh, Rybar- czyk, Jaroszyk, & Lemanski, 1993) they attempted to replicate Angel's result; however, they succeeded only partially. While the effect of intensity on re- sponse force was found for auditory stimuli, they did not obtain analogous effects for visual stimuli. The different behaviour of auditory and visual sys- tems is in good accordance with the common view that only loud auditory stimuli have an arousal property which is absent for visual stimulation, at least for intensities and sizes typically used in psychophysical experiments (Sanders & Wertheim, 1973; Sanders, 1983; Niemi, 1979; Posner, et a/ . , 1976; see also Nissen, 1977; Niemi & Naatanen, 1981, for reviews).
The second study by Jaskowski and coworkers (Jaskowski, Wroblewski, & Hojan-Jezierska, 1993) concerned the arousal/activation effect of uninfor- mative electrical shocks delivered occasionally to the subjects during a simple response task. Since electrical shock is known to evoke a more persistent, tonic activation (e.g., Shapiro, Egerman, & Klein, 1984; Shapiro &Johnson, 1987), they hypothesized that the shocks, although being irrelevant to the task, should cause increases in response force when subject made speeded responses to the visual stimuli. Indeed, the force was greater in blocks in which the electrical shocks were delivered.
All these effects on response force strongly suggest that stimulus-in- duced arousal or activation indeed influences the motor system. According to the assumptions of Sanders' (1983) or Giray's (1990) models, all incoming stimuli, i.e., warning signals, accessory or imperative stimuli, more or less activate an energetical mechanism. The output from this mechanism is direct- ly connected to the motor adjustment stage of the computational channel and can affect the dynamics of the motor response (Sanders, 1983; Giray, 1990).
An open question is whether expectancy and preparation for a stimulus can affect response force independently of stimulus-induced arousal. There- fore, in this paper an experiment is described in which the response force is measured as a function of the expectancy for the stimulus. In previous studies (see Niemi & Naatanen, 1981, for a review) the expectancy, defined as subjective probability of the immediate delivery of the imperative stimu-
RESPONSE FORCE AND EXPECTANCY 165
lus, was manipulated in a two-stimulus paradigm: the warning stimulus is followed by the imperative stimulus and the time between them, i.e., the foreperiod, is changed. The warning stimulus is assumed to trigger the sub- ject's response preparation and to evoke the immediate arousal which acti- vates the motor system. Subjects try to adjust their preparation to be maxi- mal at the moment of the expected occurrence of the stimulus (Nickerson, 1973). When the moment of stimulus presentation is expected, the prepara- tion is high and reaction time is short. When the expectancy is low, e.g., just after presentation of the warning stimulus, the subject's response is de- layed (see Niemi & Naatanen, 1981, for a review) and, as Giray (1990) has recently shown, stronger. Accordingly, although reaction time and response force co-vary in experiments of this kind, they d o so for different reasons: reaction-time changes are elicited by changes in response preparation while variations of response force are produced by immediate arousal decaying after presentation of a warning stimulus. So, if we were able to manipulate expec- tancy for the stimulus without presentation of any warning stimulus, we would expect changes of reaction time but response force should remain con- stant. O n the other hand, if the changes in response force occur, they should be assigned to the state of preparation at the presentation of the imperative stimulus.
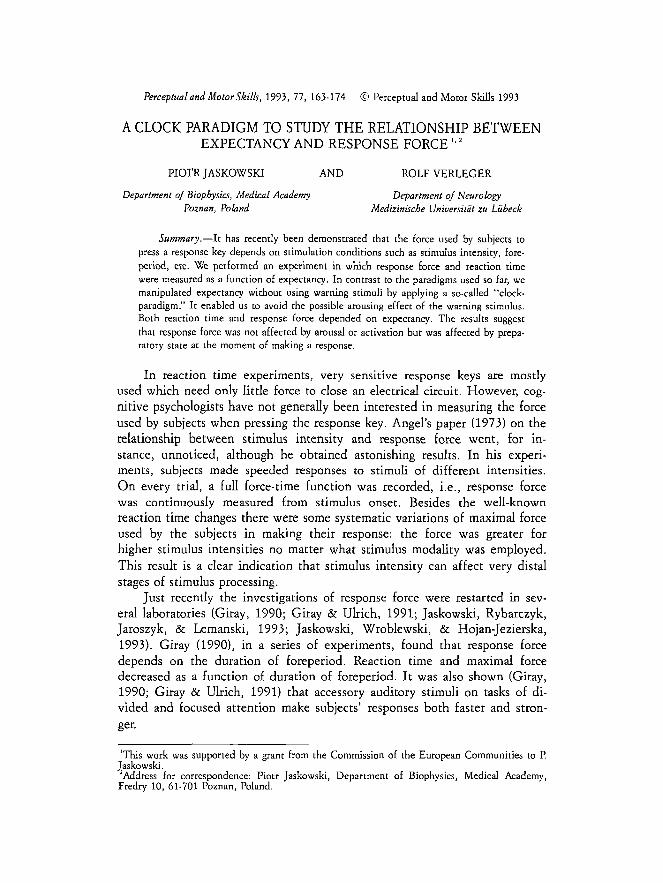
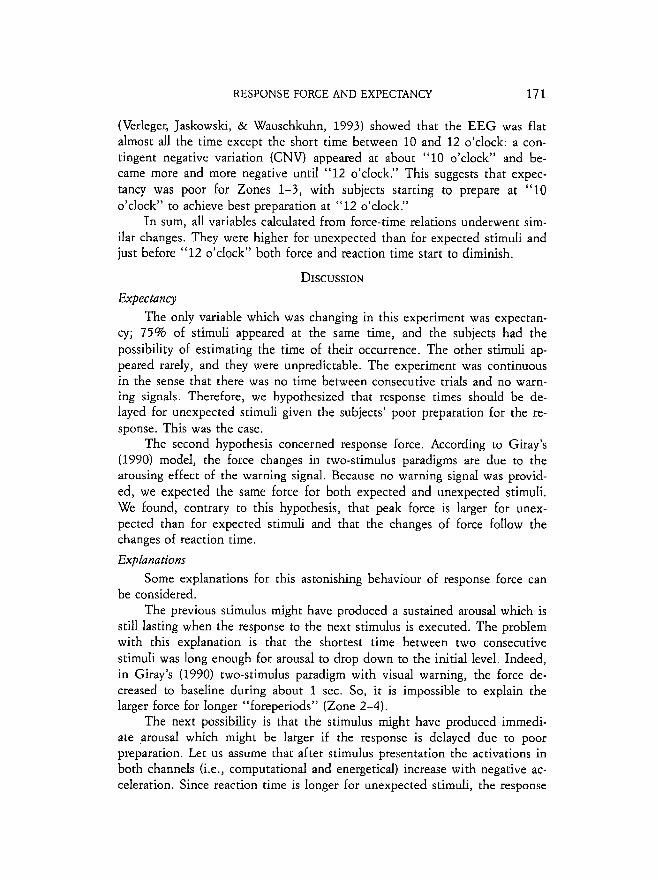
To arrange the conditions for allowing free manipulation of expectancy without any warning stimulus we introduced a special paradigm which we will call the clock paradigm.' The stimulus design is presented in Fig. 1. The subject observed a circle with a wide border, representing a clock face. All the time, the pointer moved around the clock face, one turn per 5.7 sec. The stimulus, in the form of a s m d circle, appeared concentrically with the clock face, around the fixation cross. The subjects' task was to press a re- sponse key as fast as possible in response to stimulus presentation while keep- ing their gaze on the fixation cross. They were told that the stimulus would always appear at "12 o'clock;" occasionally, however, the stimuli could be presented at other times. The subjects were encouraged to use the pointer to improve their performance. Some feedback information was provided on the screen.
We hypothesized that only "12 o'clock" stimuli would be highly ex- pected and the subjects' response preparation for these stimuli would be greatest, while other stimuli would be rather unexpected (perhaps intruding in the regular rhythm of the task) whlch should be reflected in prolongation of reaction times. Because, at the same time, no warning stimulus was pro- vided, we expected no effects on force.
-
'One referee called our attention to the fact that something like the clock paradigm was intro- duced by Gottsdanker (1975); however, the aims and designs of his experiments were com- pletely different.
166 P. JASKOWSKI & R. VERLEGER
METHOD
Subjects
Seven volunteers (four male and three female) whose ages were between 21 and 26 years participated in the experiment. ALI were naive to the pur- poses of the experiment and took part in a psychophysical experiment for the first time. We paid particular attention to subjects' unawareness of force being measured. They were only informed that we are interested in reaction time and the special response key we used only because it is very sensitive. The subjects were paid 12 DM per hour for their participation.
Stimuli
The "clock" and stimuli were generated on the color monitor of a Com- modore Amiga 2000 (Fig. 1). The "clock" face was a white circle with wide border (inner diameter of 3.2 cm, outer diameter of 4.3 cm). A red pointer of length equal to the width of the "clock" border was moving around the "clock" face with velocity 63.1°/sec. So one cycle lasted 5.7 sec. In the cen- ter of the "clock" face, the (white) fixation cross was located. The response stimulus was a yellow circle, 7 mm in diameter, concentric with the "clock" face.
fixation cross
FIG. 1. Clock paradigm: the stimulus panel
"At 12 o'clock" 225 stimuli appeared. The other 75 stimuli were dis- persed in time with equal probability over a whole cycle of the pointer, with the constraint that no stimulus appeared sooner than 1.0 sec. after the pre- vious one. Subjects were not informed about this constraint.
Procedure
Subjects were seated in a comfortable armchair in a sound-proof, electri- cally shielded chamber in front of the Arniga monitor. The observation dis- tance was 130 cm. Under the subject's right index finger, the response key was firmly mounted on the arm of the chair. The subjects' task was to press the key as fast as possible when the stimulus appeared while fixating their
RESPONSE FORCE AND EXPECTANCY 167
eyes on the fixation cross. Subjects were encouraged to use the pointer to improve the speed of their responses, they were, however, asked to avoid pre- mature responses.
After each response the score (feedback information) appeared on the screen close to the "clock face." The score was calculated from reaction time according to the formula: 5-RT/100, where RT is reaction time in msec. This means that fast responses were rewarded by positive points (maximally 5) while slower responses (i.e., >500 msec.) were punished by negative points. Special punishments, - 50 points, were provided for premature responses. Also, a low-voice tone (200 Hz) was generated after premature responses. Subjects were informed before the session about the rules of the reward-pun- ishment system. They were also told that their score was an important part of the task.
A subject participated in only one session lasting about 30 min. Before the task, subjects were given a short practice block of 20 stimuli.
Measurements
Force was measured by a special key with two built-in extensometers embodied in a bridge. The output from the bridge was amplified by a differ- ential amplifier and sent via a 12 bits AID converter to a 386/DX-corn- patible microcomputer. The data were digitized at a rate of 200 sarnples/sec. The key did not bend under the subject's thrust. When the force was higher than 2.0 Newton a trigger signal was generated by a special comparator con- nected to the analog output from the differential amplifier. This signal was fed via a relay to the Amiga. Subjects could hear the click generated by the relay. The trigger-signal was used by the Amiga to stop the computer clock that started just before stimulus presentation. Since for further analysis we employed the force-time relations to calculate all time parameters of re- sponses, the Amiga calculations of subjects' reaction times were used only to prepare the on-line feedback information.
Throughout the experiment the EEG was recorded. Method and results are reported by Verleger, Jaskowski, and Wauschkuhn (1993).
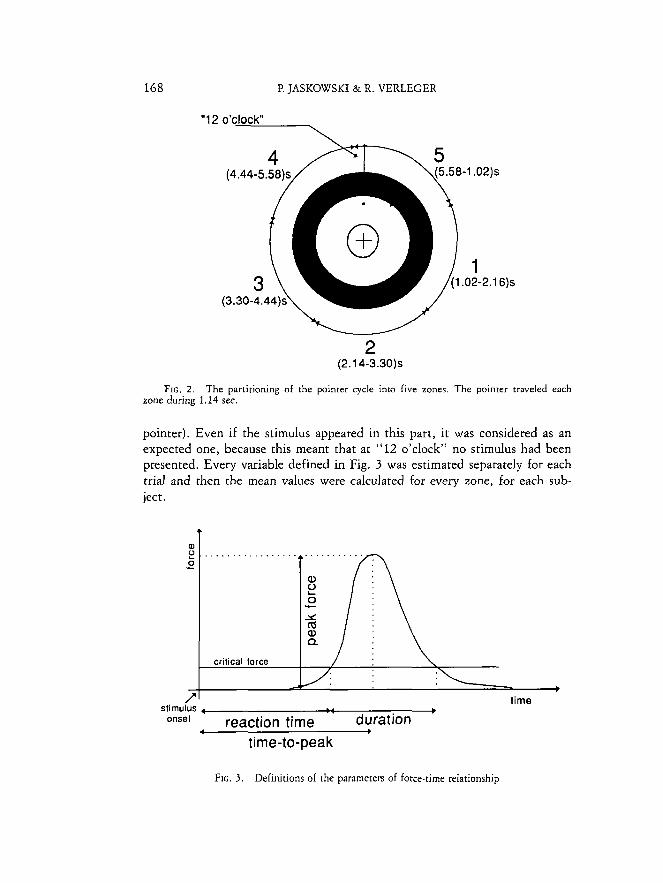
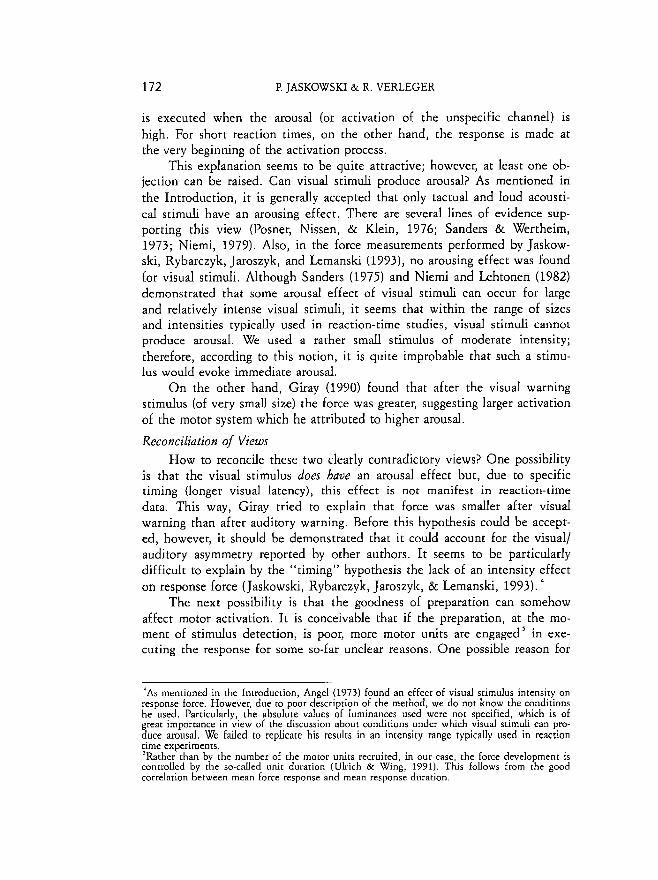
Data Analysis Atl parameters analyzed further were calculated from the force-time
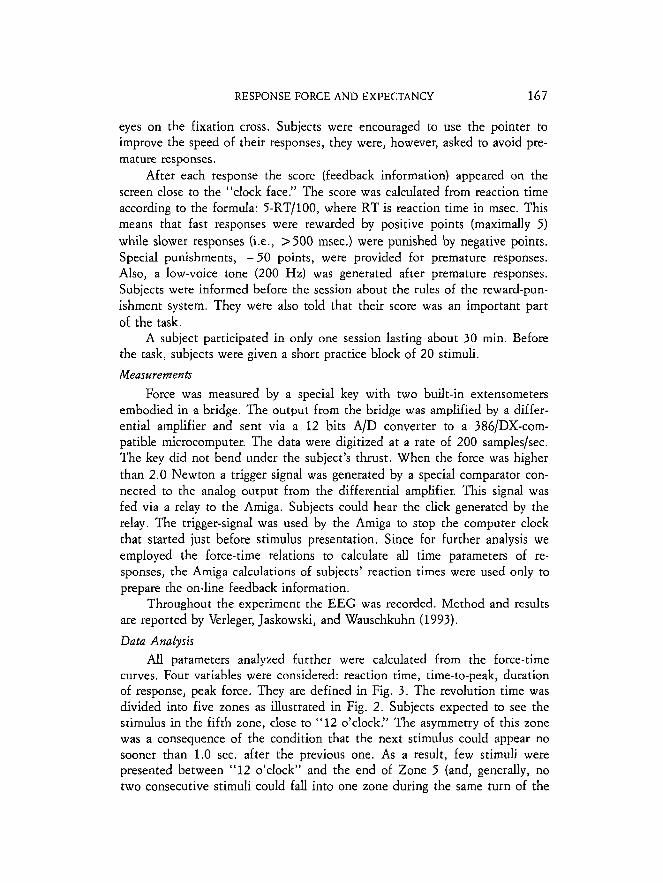
curves. Four variables were considered: reaction time, time-to-peak, duration of response, peak force. They are defined in Fig. 3. The revolution time was divided into five zones as illustrated in Fig. 2. Subjects expected to see the stimulus in the fifth zone, close to "12 o'clock." The asymmetry of this zone was a consequence of the condition that the next stimulus could appear no sooner than 1.0 sec. after the previous one. As a result, few stimuli were presented between "12 o'clock" and the end of Zone 5 (and, generally, no two consecutive stimuli could fall into one zone during the same turn of the
168 P. JASKOWSKI & R. VERLEGER
"1 2 o'clock" Y
FIG. 2 . The partitioning of the pointer cycle into five zones. The pointer traveled each zone during 1.14 sec.
pointer). Even if the stimulus appeared in this part, it was considered as an expected one, because this meant that at "12 o'clock" no stimulus had been presented. Every variable defined in Fig. 3 was estimated separately for each trial and then the mean values were calculated for every zone, for each sub- ject.
time-to-peak
a 2 0 -
/"
FIG. 3 . Definitions of the parameters of force-time relationship
+
. . . . . . . . . . . . . . . .
critical lorce
b
time stimulus , b
Onset reaction time duration b
RESPONSE FORCE AND EXPECTANCY 169
The statistical analyses were carried out by using repeated-measures analyses of variance. Degrees of freedom were corrected by Greenhouse- Geisser coefficients.
RESULTS
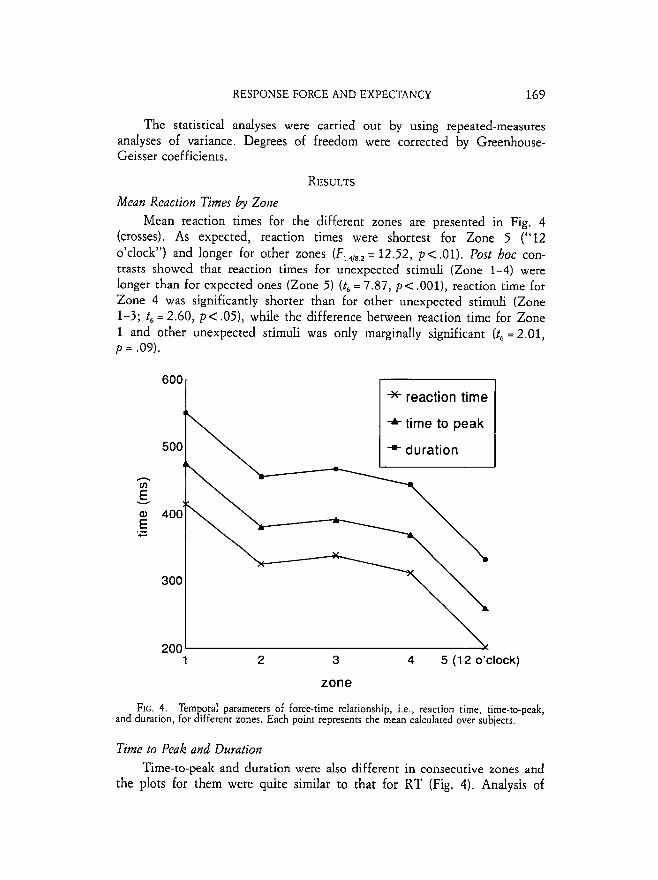
Mean Reaction Times by Zone Mean reaction times for the different zones are presented in Fig. 4
(crosses). As expected, reaction times were shortest for Zone 5 ("12 o'clock") and longer for other zones (F,,,,,,, = 12.52, p < .01). Post hoc con- trasts showed that reaction times for unexpected stimuli (Zone 1-4) were longer than for expected ones (Zone 5 ) (t, = 7.87, p < .001), reaction time for Zone 4 was significantly shorter than for other unexpected stimuli (Zone 1-3; t, = 2.60, p < .05), while the difference between reaction time for Zone 1 and other unexpected stimuli was only marginally significant (t, = 2.01, p = .09).
* reaction time
f time to peak
-) duration
1 2 3 4 5 (1 2 o'clock)
zone
FIG. 4. Tern oral parameters of force-time relationship, i.e., reaction time, time-to-peak, and duration, for h e r e n t zones. Each point represents the mean calculated over subjects.
Time to Peak and Duration T i m e - t ~ - ~ e a k and duration were also different in consecutive zones and
the plots for them were quite similar to that for RT (Fig. 4). Analysis of
170 I? JASKOWSKI & R. VERLEGER
variance performed for these variables showed that the effect of presentation time was significant (for time-to-peak F,,,,,, = 12.23, p<.01, and for duration F,,,,,,, = 11.7, p < .01). Contrast analysis gave similar results as for reaction time. For expected vs unexpected stimuli t6 = 8.2, p< .001 for time-to-peak, and t6 = 8.1, p< .001 for duration. For Zone 1-3 vs Zone 4: t, = 2.49, p = .05 for time-to-peak, and t, = 2.40, p = .05 for duration. Finally, for Zone 2-4 vs Zone 1, t, = 2.04, p = .09 for time-to-peak, and t, =2.02, p = .09 for dura- tion.
Peak Force and Presentation Time
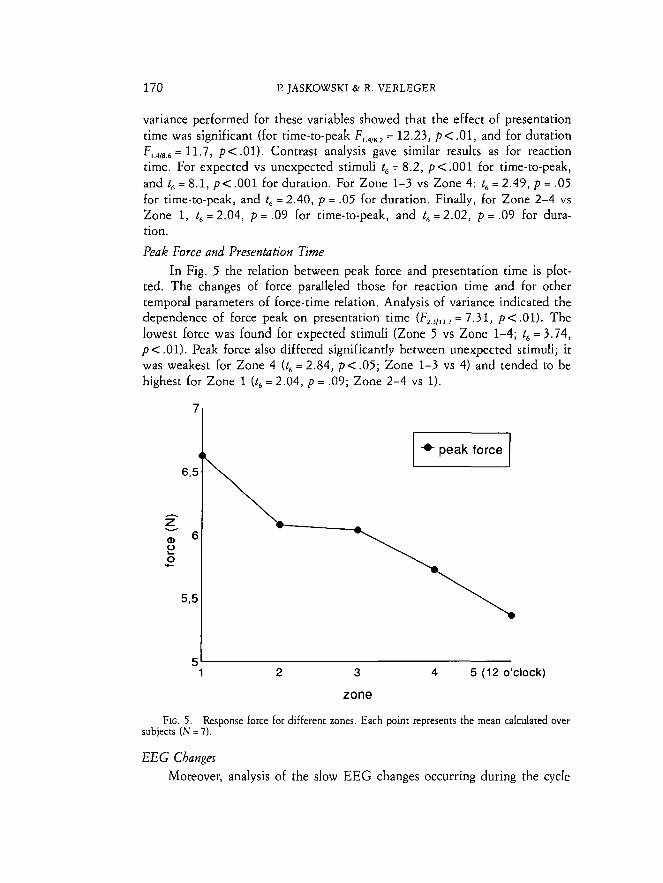
In Fig. 5 the relation between peak force and presentation time is plot- ted. The changes of force paralleled those for reaction time and for other temporal parameters of force-time relation. Analysis of variance indicated the dependence of force peak on presentation time (F2.,,,, , = 7.3 1, p < .01). The lowest force was found for expected stimuli (Zone 5 vs Zone 1-4; t, = 3.74, p < .01). Peak force also differed significantly between unexpected stimuli; it was weakest for Zone 4 (t, = 2.84, p < .05; Zone 1-3 vs 4) and tended to be highest for Zone 1 (t, = 2.04, p = .07; Zone 2-4 vs 1).
* peak force D
1 2 3 4 5 (12 o'clock)
zone
FIG. 5 . Response force for different zones. Each point represents the mean calculated over subjects (N = 7).
EEG Changes
Moreover, analysis of the slow EEG changes occurring during the cycle
RESPONSE FORCE AND EXPECTANCY 171
(Verleger, Jaskowski, & Wauschkuhn, 1993) showed that the E E G was flat almost all the time except the short time between 10 and 12 o'clock: a con- tingent negative variation (CNV) appeared at about "10 o'clock" and be- came more and more negative until "12 o'clock." This suggests that expec- tancy was poor for Zones 1-3, with subjects starting to prepare at "10 o'clock" to achieve best preparation at "12 o'clock."
I n sum, all variables calculated from force-time relations underwent sim- ilar changes. They were higher for unexpected than for expected stimuli and just before "12 o'clock" both force and reaction time start to diminish.
Expectancy
The only variable which was changing in t h s experiment was expectan- cy; 75% of stimuli appeared at the same time, and the subjects had the possibility of estimating the time of their occurrence. The other stimuli ap- peared rarely, and they were unpredictable. The experiment was continuous in the sense that there was no time between consecutive trials and no warn- ing signals. Therefore, we hypothesized that response times should be de- layed for unexpected stimuli given the subjects' poor preparation for the re- sponse. This was the case.
The second hypothesis concerned response force. According to Giray's (1990) model, the force changes in two-stimulus paradigms are due to the arousing effect of the warning signal. Because no warning signal was provid- ed, we expected the same force for both expected and unexpected stimuli. We found, contrary to this hypothesis, that peak force is larger for unex- pected than for expected stimuli and that the changes of force follow the changes of reaction time.
Explanations
Some explanations for this astonishing behaviour of response force can be considered.
The previous stimulus might have produced a sustained arousal which is still lasting when the response to the next stimulus is executed. The problem with this explanation is that the shortest time between two consecutive stimuli was long enough for arousal to drop down to the initial level. Indeed, in Giray's (1990) two-stimulus paradigm with visual warning, the force de- creased to baseline during about 1 sec. So, it is impossible to explain the larger force for longer "foreperiods" (Zone 2-4).
The next possibility is that the stimulus might have produced immedi- ate arousal which might be larger if the response is delayed due to poor preparation. Let us assume that after stimulus presentation the activations in both channels (i.e., computational and energetical) increase with negative ac- celeration. Since reaction time is longer for unexpected s t i m d , the response
172 P. JASKOWSKI & R. VERLEGER
is executed when the arousal (or activation of the unspecific channel) is high. For short reaction times, on the other hand, the response is made at the very beginning of the activation process.
This explanation seems to be quite attractive; however, at least one ob- jection can be raised. Can visual stimuli produce arousal? As mentioned in the Introduction, it is generally accepted that only tactual and loud acousti- cal stimuli have an arousing effect. There are several lines of evidence sup- porting this view (Posner, Nissen, & Klein, 1976; Sanders & Wertheim, 1973; Niemi, 1979). Also, in the force measurements performed by Jaskow- s h , Rybarczyk, Jaroszyk, and Lemanslu (1993), no arousing effect was found for visual stimuli. Although Sanders (1975) and Nierni and Lehtonen (1982) demonstrated that some arousal effect of visual stimuli can occur for large and relatively intense visual stimuli, it seems that within the range of sizes and intensities typically used in reaction-time studies, visual stimuli cannot produce arousal. We used a rather s m d stimulus of moderate intensity; therefore, according to this notion, it is quite improbable that such a stimu- lus would evoke immediate arousal.
O n the other hand, Giray (1990) found that after the visual warning stimulus (of very small size) the force was greater, suggesting larger activation of the motor system which he attributed to higher arousal.
Reconciliation of Views How to reconcile these two clearly contradictory views? One possibility
is that the visual stimulus does have an arousal effect but, due to specific timing (longer visual latency), this effect is not manifest in reaction-time data. This way, Giray tried to explain that force was smaller after visual warning than after auditory warning. Before this hypothesis could be accept- ed, however, it should be demonstrated that it could account for the visual/ auditory asymmetry reported by other authors. I t seems to be particularly difficult to explain by the "timing" hypothesis the lack of an intensity effect on response force (Jaskowski, Rybarczyk, Jaroszyk, & Lernanski, 1993).
The next possibiLty is that the goodness of preparation can somehow affect motor activation. I t is conceivable that if the preparation, at the mo- ment of stimulus detection, is poor, more motor units are engaged5 in exe- cuting the response for some so-far unclear reasons. One possible reason for
'As mentioned in the Introduction, Angel (1973) found an effect of visual stimulus intensity on response force. However, due to poor description of the method, we do not know the conditions he used. Particularly, the absolute values o l luminances used were not specified, which is of great importance in view of the discussion about conditions under w h c h visual stimuli can pro- duce arousal. We failed to replicate his results in an intensity range typically used in reaction time experiments. 'Rather than by the number of the motor units recruited, in our case, the force development is controlled by the so-called unit duration (ULrich & Wing, 1991). This follows from the good correlation between mean force response and mean response duration.
RESPONSE FORCE A N D EXPECTANCY 173
such a behaviour is that under the task stress that requires fast responding, subjects want to compensate their slowness (caused by the lack of readiness) by more impetuous and forceful responses. The possibility that the unexpect- ed stimulus is itself more alerting than the expected one can also be consid- ered.
With the assumption of a direct effect of expectancy on response force, it is possible to explain both the present results and Giray's results of the two-stimulus experiments. I n all these experiments, expectancy was manipu- lated, and longer reaction times were accompanied b y greater response force, which may be attributed to poor preparation.
ResumP Summarizing, this experiment suggests that response force can be
changed if only expectancy is manipulated. Although an explanation based on immediate arousal of the imperative stimulus can be possible, it is diffi- cult to reconcile this explanation with previous findings concerning the vi- sual/auditory asymmetry in the arousing effect. The striking correlation be- tween mean reaction time and mean response force strongly suggests that expectancy/preparation by itself can somehow influence the force used by subjects for executing the response.
REFERENCES ANGEL, A. (1973) Input-output relations in simple reaction time experiments. Quarterly Journal
of Experimental Psychology, 25, 193-200. BERTELSON, P., & TISSEYERE, F. (1969) The time-course of preparation with regular and irregu-
lar foreperiods. Quarterly Journal of Experimental Psychology, 20, 297-300. GIRAY, M. (1990) ijber die Aktivierung der menschlichen Motorik: Theoretische und ex-
erimentelle Analvsen bei Reaktion~auf~nben. Unpublished doctoral dissertation, Eber- Eard-~ar l s -~n ivers lm Tiibingen.
GLRAY, M., & ULRICH, R (1991) Motor coactlvatlon revealed by response force in divided and focused attention. (submitted)
GOTTSDANKER, R. (1975) The attaining and maintaining of preparation. I n l? A. M. Rabbitt & S. Dornic (Eds.), Attenlion and per/ormunce, V. London: Academic Press. Pp. 33-49.
JASKOWSKI, P, RYBARCZYK, K., JAROSZYK, F., & LEMANSKI, D. (1993) The effect of stimulus intensity on Force output in simple reaction time task. (submitted)
JASKOWSKI, I)., WROBLEWSKI, M., & HOJAN-JE~RSKA, D. (1993) Attendant electrical shock can affect response force in simple reaction time task. (submitted)
NICKERSON, R. S. (1973) Intersensory facilttation of reaction time: energy summation or preparation enhancement? Psychological Reuiew, 80, 489-509.
N m , P. (1979) Stimulus intensity effects on auditory and visual reaction processes. Acfa Psy- chologica, 43, 299-312.
NIEMI, I?, & LEHTONEN, E. (1982) Foreperiod and visual stimulus intensity: a reappraisal. Acta Psychologica, 50, 73-82.
N m , l?, & NAATANEN, R. (1981) Foreperiod and simple reaction time. Psychological Bulletin, 89, 133-162.
NISSEN, M. J. (1977) Stimulus intensity and information processing. Perception G Psycho- physics, 22, 338-352.
POSNER, M., NISSEN, M-J., & KLEIN, R. (1976) Visual dominance: an information-processing account of its origins and significance. Psychological Reuiew, 83, 157-171.
SANDERS, A. F. (1975) The foreperiod effect revisited. Quarterly Journal o/ Experimental Psy- chology, 27, 591-598.
174 P. JASKOWSKI & R. VERLEGER
SANDERS, A. F. (1983) Towards a model of stress and human performance. A*I Psychologica, 53, 61-97.
SANDERS, A. F., & WERTHEIM, M. (1973) The relation between physical stimulus properries and the effect of foreperiod on reaction time. Quarterly Journal of Experimental Pry- chology, 25, 201-206.
SHAPIRO, K. L., EGERMAN, B., & KLEIN, R. M. (1984) Effect of arousal on human visual domi- nance. Perception G. Psychophysics, 35, 547-552.
SHAPIRO, K. L., & JOHNSON, T. L. (1987) Effects of arousal on attention ro central and pe- ripheral visual stimuli. Ac& Psychologica, 66, 157-172.
ULRICH, R., & WING, A. M. (1971) A recruitment theory OF Force-time relations in the produc- tion of brief force pulse: the parallel force unit model. PsychoIogical Review, 98, 268- 294.
VERLEGEX, R . , JASKOWSKI, I?, & WAUSCHKU~IN, B. (1993) Suspence and surprise: on the rela- tionship between expectancies and P3. (submitted)
Accepted May 12, 1993.

![Proposals to Extend Healthy Life Expectancy in Shizuoka ...€¦ · [Gap between life expectancy and healthy life expectancy in Shizuoka Prefecture] Healthy life expectancy *Source:](https://img.pdfslide.net/doc/110x75/5f427921a09c2479a15262fb/proposals-to-extend-healthy-life-expectancy-in-shizuoka-gap-between-life-expectancy.jpg)