Embed Size (px)
Citation preview

Chapter 9
A CO-EVOLUTIONARY FUZZY SYSTEMFOR RESERVOIR WELL LOGSINTERPRETATION
Tina Yu1 and Dave Wilkinson2
1Memorial University of Newfoundland, St. John’s, NL A1B 3X5, Canada, 2Chevron EnergyTechnology Company, San Ramon, CA 94583, USA
Abstract Well log data are routinely used for stratigraphic interpretation of the earth’s sub-surface. This paper investigates using a co-evolutionary fuzzy system to generatea well log interpreter that can automatically process well log data and interpretreservoir permeability. The methodology consists of 3 steps: 1) transform well logdata into fuzzy symbols which maintain the character of the original log curves;2) apply a co-evolutionary fuzzy system to generate a fuzzy rule set that classifiespermeability ranges; 3) use the fuzzy rule set to interpret well logs and infer thepermeability ranges. We present the developed techniques and test them on welllog data collected from oil fields in offshore West Africa. The generated fuzzyrules give sensible interpretation. This result is encouraging in two respects. Itindicates that the developed well log transformation method preserves the in-formation required for reservoir properties interpretation. It also suggests thatthe developed co-evolutionary fuzzy system can be applied to generate well loginterpreters for other reservoir properties, such as lithology.
Keywords: reservoir modeling and characterization, fuzzy logic, co-operative co-evolution,time series, well logs interpretation, genetic programming.
1. INTRODUCTIONIn reservoir characterization, well log data are frequently used to interpret
physical rock properties such as lithology, porosity, pore geometry, depositionalfacies and permeability. These properties are keys to the understanding of anoil reservoir and can help determining hydrocarbon reserves and reservoir pro-ducibility. Based on the information, decisions of where to complete a well,how to stimulate a field, and where to drill next, can be made to maximize profitand minimize risk.
T. Yu and D. Wilkinson: A Co-Evolutionary Fuzzy System for Reservoir Well Logs Interpretation, Studies in ComputationalIntelligence (SCI) 88, 199–218 (2008)www.springerlink.com c© Springer-Verlag Berlin Heidelberg 2008

200 EVOLUTIONARY COMPUTATION IN PRACTICE
Well log data, ranging from conventional logs, such as spontaneous poten-tial, gamma ray, and resistivity, to more advanced logging technology, such asNuclear Magnetic Resonance (NMR) logs, are sequence of curves indicatingthe properties of layers within the earth’s subsurface. Figure 9-1 gives an exam-ple of gamma ray, neutron and spontaneous potential (SP) logs. The interpretedlithology is listed on the left-hand side.
Well log interpretation is a time-consuming process, since many differenttypes of logs from many different wells need to be processed simultaneously.This paper investigates using a co-evolutionary fuzzy system to generate a well-log interpreter that can process well log data and interpret reservoir permeabilityautomatically. The developed methodology has 3 steps:
Transform well log data into fuzzy symbols which maintain the characterof the original log curves.
Apply a co-evolutionary fuzzy system to generate a fuzzy rule set thatclassifies permeability ranges.
Use the fuzzy rule set to interpret well logs and infer the permeabilityranges.
Similar to time series, well logs are sequential data, which are indexed bythe depth under earth’s surface where the data were collected. To interpret earthproperties, similar consecutive log data can be grouped into blocks, since rockproperties formation is frequently developed in layers. By examining blockedwells logs across the same depth, geologists are able to detect earth propertiesat that particular layer.
In this research, we developed a computer system to carry out the well logblocking process. Additionally, the numerical data are transformed into fuzzysymbols (Yu and Wilkinson, 2007). Fuzzy symbol representation has advan-tages over its numerical counter-part in that it is easier for computers to ma-nipulate and to carry out the interpretation task. Meanwhile, because fuzzysymbols have no precise boundaries, they allows efficient interpretation underthe uncertainty embedded in the data sets.
The second step of the process uses a co-evolutionary fuzzy system to extractfuzzy rule patterns in the transformed well logs fuzzy symbols to distinguishdifferent permeability ranges. Since permeability can be divided into more thanone ranges (3 in this study), the evolutionary system maintains multiple popu-lations, each of which evolves rules that classify one permeability range fromothers. These populations co-evolve to produce a combined fuzzy rule set thatcan classify all possible permeability ranges. Once completed, this fuzzy ruleset can be used to interpret permeability of other wells with similar geologicalcharacteristics.

A Co-Evolutionary Fuzzy System for Reservoir Well Logs Interpretation 201
Figure 9-1. An example of gamma ray, neutron and spontaneous potential logs. The interpretedlithology is listed on the left-hand side.

202 EVOLUTIONARY COMPUTATION IN PRACTICE
We have tested the developed method on well log data collected from oil fieldsin offshore West Africa and the results are very encouraging. Based on this ini-tial study, we are currently applying the system to develop a reservoir lithologyinterpreter, which requires a more sophisticated co-evolutionary model to in-terpret 5 different types of lithology. In this case, 4 populations are co-evolvedtogether to accomplish this task.
We organize the paper as follows. Section 2 presents the methodology totransform well log data into fuzzy symbols. Information about the testing welllog data and the transformed results are given in Section 3. Section 4 introducesthe co-evolutionary fuzzy system developed to generate fuzzy rules. After that,the experimental setup for fuzzy rule generation is given in Section 5. In Section6, we report the experimental results. Analysis and discussion are then providedin Section 7. Finally, Section 8 concludes the paper.
2. WELL LOG TRANSFORMATIONThe fuzzy symbolic representation is an approximation of well logs data
that maintains the trend in the original data. The transformation process hasfour steps: 1) segmentation of the numerical well log data; 2) determining thenumber of segments; 3) symbol assignment; and 4) symbol fuzzification. Thesesteps are explained in the following sub-sections.
2.1 SegmentationWell log segmentation involves partitioning log data into segments and using
the mean value of the data points falling within the segment to represent theoriginal data. In order to accurately represent the original data, each segment isallowed to have arbitrary length. In this way, areas where data points have lowvariation will be represented by a single segment while areas where data pointshave high variation will have many segments.
The segmentation process starts by having one data point in each segment.That is the number of segments is the same as the number of original data points.Step-by-step, neighboring segments (data points) are gradually combined toreduce the number of segments. This process stops when the number of segmentsreaches the predetermined number.
At each step, the segments whose merging will lead to the least increase inerror are combined. The error of each segment is defined as:
errora =∑n
i=1 (di − µa)2
where n is the number of data points in segment a, µa is the mean of segmenta, di is the ith data point in segment a.
This approach is similar to the Adaptive Piecewise Constant Approximationproposed by (Keogh et al., 2001) and SAX (Lin et al., 2003). However, our

A Co-Evolutionary Fuzzy System for Reservoir Well Logs Interpretation 203
0 20 40 60 80 100 120 140 160 180 200−3
−2
−1
0
1
2
3
4
data sequence number
norm
alized w
ell log d
ata
0.23915
−1.1974
0.99576
−0.80347
0.02389
−0.80396
1.5738
−0.24538
2.0014
0.18876
Figure 9-2. 10 segments.
0 20 40 60 80 100 120 140 160 180 200−3
−2
−1
0
1
2
3
4
data sequence number
norm
alized w
ell log d
ata
0.40804
−0.11976
−1.1974
0.99576
−0.35708
−1.1021
−0.65261
0.86853
−0.5656
0.043683
−1.2366
−0.054499
−1.1594
1.5738
−0.29359
−0.19717
1.496
3.0121
−0.26563
0.60819
Figure 9-3. 20 segments.
method has an extra component that dynamically determines the number ofsegments (see Section 2.2). Another similar work using a different approach todetermine the number of segments is reported in (Abonyi et al., 2005).
Figure 9-2 is an example of a well log with 189 data points, which arepartitioned into 10 segments. The same data are partitioned into 20 segmentsin Figure 9-3. The average value of the data points within each segment is usedto represent the original data.
2.2 Number of SegmentsAlthough a larger number of segments capture the data trend better, it is
also more difficult to interpret. Ideally, we want to use the smallest possiblenumber of segments to capture the trend of the log data. Unfortunately, thesetwo objectives are in conflict: the total error of all segments monotonicallyincreases as the number of segments decreases (see Figure 9-4). We thereforedevised a compromised solution where a penalty is paid for increasing thenumber of segments. The new error criterion is now defined as the previoustotal error plus the number of segments:
f = N +N∑
i=1
errori where N is the number of segment.
During the segmentation process, the above f function is evaluated at eachstep when 2 segments were combined. As long as this value f is decreasing, thesystem continues to merge segments. Once f starts increasing, it indicates thatfarther reducing the number of segments will sacrifice log character, hence thesegmentation process terminates. For the 189 data points in Figure 9-2, the finalnumber of segments is 50 (see Figure 9-5).

204 EVOLUTIONARY COMPUTATION IN PRACTICE
204060801001201401601800
50
100
150
200
number of segments
tota
l e
rro
r
total errornumber of segments
Figure 9-4. number of segments vs. total er-ror.
2040608010012014016018050
100
150
200
number of segments
tota
l err
or
+ n
um
ber
of segm
ents
total error + number of segments
Figure 9-5. a compromised solution.
−3 −2 −1 0 1 2 30
0.2
0.4
0.6
0.8
1
a b c d e
Figure 9-6. Using 4 breakpoints to produce 5 symbols with equal probability.
2.3 Symbol AssignmentSegmented well logs are represented as a set of numerical values, WL =
s1, s2, s3 . . ., where si is the mean value of the data within the ith segment. Thisnumerical representation is farther simplified using symbols. Unlike numericalvalues, which are continuous, symbols are discrete and bounded. This makes iteasy for any subsequent computer interpretation scheme.
While converting the numerical values into symbols, it is desirable to pro-duce symbols with equal-probability (Apostolico et al., 2002). This is easilyachieved since normalized sequence data have a Gaussian distribution (Larsenand Marx, 1986). We therefore applied z-transform to normalize the data andthen determined the breakpoints that would produce n equal-sized areas underthe Gaussian curve, where n is the number of symbols. Figure 9-6 gives thefour breakpoints -0.84, -0.25, 0.25 and 0.84 that produce 5 symbols, a, b, c, d, e,with equal probability. If only 3 symbols (a, b and c) are used, the breakpointsare -0.43 and 0.43.
Once the number of symbols, hence the breakpoints have been decided, weassign symbols to each segment of the well logs in the following manner: Allsegments have mean values that are below the smallest breakpoint are mappedto the symbol a; all segments have mean values that are greater than or equal tothe smallest breakpoint and less than the second smallest breakpoint are mapped

A Co-Evolutionary Fuzzy System for Reservoir Well Logs Interpretation 205
0 50 100 150 200−3
−2
−1
0
1
2
3
4
data sequence number
norm
aliz
e w
ell l
og d
ata
d
a
c
a
d
e
a
c
a
b
a
b
d
b
c
b
d
a
c
aa
e e
a
e
e
c
a
c
d
Figure 9-7. A well log transformed using 5 symbols.
−3 −2 −1 0 1 2 30
0.2
0.4
0.6
0.8
1
data value
degre
e o
f m
em
bers
hip
a b c d e
Figure 9-8. A segment with mean -0.9 istransformed as a crisp symbol a.
−3 −2 −1 0 1 2 30
0.2
0.4
0.6
0.8
1
De
gre
e o
f M
em
be
rsh
ip
a b c d e
Figure 9-9. A segment with mean -0.9 istransformed as fuzzy symbol a (80%) andb (20%).
to the symbol b and so on. Figure 9-7 gives a well log that is transformed using5 symbols.
2.4 Symbol FuzzificationWhile some segments are clearly within the boundary of a particular symbol
region, others may not have such clear cut. For example, in Figure 9-7, thereare 3 segments that lie on the borderline of regions a and b. A crisp symbol,either a or b, does not represent its true value. In contrast, fuzzy symbols usemembership function to express the segment can be interpreted as symbol aand b with some possibility. As an example, with the crisp symbol approach, asegment with mean -0.9 is assigned with symbol a with 100% possibility (seeFigure 9-8). Using fuzzy symbols designed by trapezoidal-shaped membershipfunctions, the segment is assigned with symbol a with 80% possibility andsymbol b with 20% possibility (see Figure 9-9). Fuzzy symbol representationis more expressive in this case.

206 EVOLUTIONARY COMPUTATION IN PRACTICE
−1 −0.5 0 0.5 10
0.2
0.4
0.6
0.8
1
f1 f2
S1 S2
Figure 9-10. The 4 parameters, f1, f2, s1, s2, that define a trapezoidal-shaped membershipfunction.
In fuzzy logic, a membership function (MF) defines how each point in theinput space is mapped into a membership value (or degree of membership)between 0 and 1. The input space consists of all possible input values. In ourcase, z-normalized well log data have open-ended boundaries with mean 0.When 5 symbols are used to represent a well-log, 5 membership functions aredefined, one for each of the 5 symbols.
To design a trapezoidal-shaped membership function, 4 parameters are re-quired: f1 and f2 are used to locate the ‘feet’ of the trapezoid and s1 and s2
are used to locate the ‘shoulders’ (see Figure 9-10). These four parameters aredesigned in the following way.
Let c1 and c2 be the breakpoints that define a symbol x and c2 > c1:
d =c2 − c1
4f1 = c1 − d; s1 = c1 + d; s2 = c2 − d; f2 = c2 + d
There are two exceptions: symbol a has f1 = c1 and symbol e has f2 = c2.Table 9-1 gives the four parameters used to design the membership functionsfor each symbol.
Once the 4 parameters are decided, the membership function f is defined asfollows:
f(x, f1, f2, s1, s2) =
⎧⎪⎪⎪⎪⎪⎪⎨
⎪⎪⎪⎪⎪⎪⎩
0 if x ≤ f1,x−f1
s1−f1if f1 ≤ x ≤ s1.
1 if s1 ≤ x ≤ s2,f2−xf2−s2
if s2 ≤ x ≤ f2.0 if f2 ≤ x,
Using the described fuzzy symbol scheme, the 10 segments lying between thetwo symbol regions in Figure 9-7 were mapped into fuzzy symbols shown inFigure 9-11.

A Co-Evolutionary Fuzzy System for Reservoir Well Logs Interpretation 207
Table 9-1. Parameters used to design the trapezoidal-shaped membership function for eachsymbol.
data symbol f1 s1 s2 f2
well-log a -3 -3 -0.9875 -0.6925b -0.9875 -0.6925 -0.3975 -0.1025c -0.375 -0.125 0.125 0.375d 0.1025 0.3975 0.6925 0.9875e 0.6925 0.9875 3 3
perm a -3 -3 -0.645 -0.215b -0.645 -0.215 0.215 0.645c 0.215 0.645 3 3
0 50 100 150 200−3
−2
−1
0
1
2
3
4
data sequence number
norm
aliz
ed w
ell l
og d
ata
a(0.6),b(0.4)a(0.87),b(0.13)
b(0.19),c(0.86)
d(0.36),e(0.64)
c(0.58),d(0.43)c(0.5),d(0.5)
c(0.5),d(0.5)
a(0.3),b(0.7)
c(0.74),d(0.3)
d(0.6),e(0.4)
Figure 9-11. A well log represented with fuzzy symbols.
In most cases, a reservoir well has multiple logs. To carry out the describedtransformation process, a reference log is first selected for segmentation. Theresult is then used to segment the other logs in the same well. After that, fuzzysymbols are assigned to each segmented data.
3. WELL LOG DATAWe tested the developed transformation method on 2 sets of well log data
collected from an offshore West Africa field. The first set is from Well A andcontains 227 data points while the second set is from Well B and contains 113data points. Each well has 3 different logs: PHI (porosity), RhoB (density)and DT (sonic log). Additionally, V-shale (Volume of shale) information hasbeen calculated previously (Yu et al., 2003). The core permeability data areavailable and will be used to test the evolved fuzzy rules.
Since permeability is the interpreted target, it is chosen as the referencelog to perform segmentation described in Sections 2.1 and 2.2. For symbol

208 EVOLUTIONARY COMPUTATION IN PRACTICE
assignment, permeability has 3 possible symbols, a, b and c, representing low,medium and high permeability. The 3 well logs and V-shale, however, have5 possible symbols, a, b, c, d, e. This allows the evolved fuzzy rules to havea finer granularity in interpreting well log data. Figures 9-12, 9-13, 9-14, 9-15and 9-16 give the transformed logs in Well A. The resulting transformationsgive sensible blocking and resemble the original log curves reasonably well.Due to space constraint, the results of Well B, which have a similar pattern, arenot shown here.
0 50 100 150 200 250−2
−1.5
−1
−0.5
0
0.5
1
1.5
data sequence number
core
per
mea
bilit
y
Well A
Figure 9-12. The transformed core permeability (k).
0 50 100 150 200 250−3
−2
−1
0
1
2
3
4
data sequence number
PH
I (po
rosi
ty)
Well A
Figure 9-13. The transformed PHI log.
0 50 100 150 200 250−6
−4
−2
0
2
4
data sequence number
RH
OB
(de
nsity
)
Well A
Figure 9-14. The transformed RHOB log.

A Co-Evolutionary Fuzzy System for Reservoir Well Logs Interpretation 209
0 50 100 150 200 250−2
−1
0
1
2
3
data sequence number
DT
(so
nic
log
)
Well A
Figure 9-15. The transformed DT log.
0 50 100 150 200 250−1.5
−1
−0.5
0
0.5
1
1.5
data sequence number
v−sh
ale
Well A
Figure 9-16. The transformed V-shale data.
After the transformation process, all logs in Well A have 43 segments andall logs in Well B have 15 segments. Among the 43 permeability segmentationsin Well A, 22 are low-permeability (symbol a), 9 are medium-permeability(symbol b) and 12 are high-permeability (symbol c). The number of low, mediumand high permeability segments in Well B is 6, 2 and 7 respectively.
4. CO-EVOLUTIONARY FUZZY SYSTEMUsing the transformed well log data, we applied a co-evolutionary fuzzy
system to identify rule patterns that can interpret well logs having high, mediumor low permeability. The interpretation task is decomposed into two sub-tasks:the first one separates one permeability range data from the rest of the data andthe second one distinguishes another permeability range data from the others.By combining the two sub-solutions using an if-then-else construct, the finalsolution is able to determine whether a well log segment has either high, mediumor low permeability.
We adopted a co-operative co-evolution approach to address these two sub-problems (Potter and Jong, 1994; Potter and Jong, 2000). In this approach,two populations are maintained, each of which is evolved toward one of the two
210 EVOLUTIONARY COMPUTATION IN PRACTICE
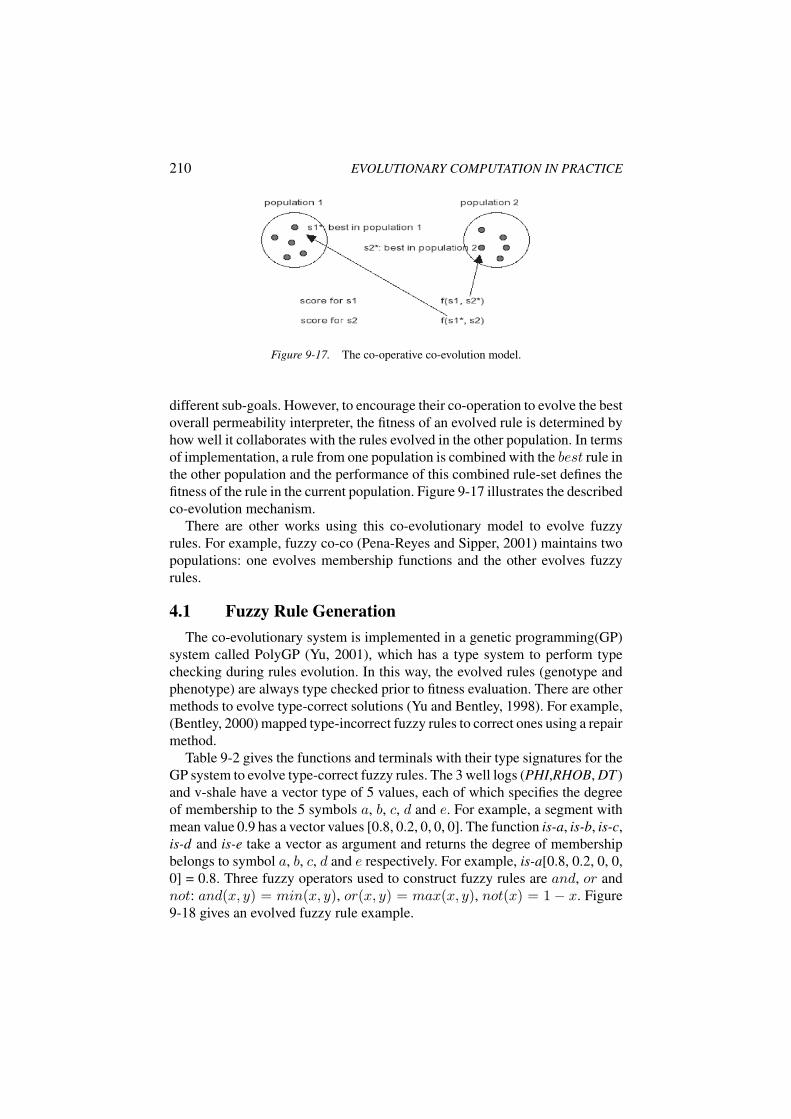
Figure 9-17. The co-operative co-evolution model.
different sub-goals. However, to encourage their co-operation to evolve the bestoverall permeability interpreter, the fitness of an evolved rule is determined byhow well it collaborates with the rules evolved in the other population. In termsof implementation, a rule from one population is combined with the best rule inthe other population and the performance of this combined rule-set defines thefitness of the rule in the current population. Figure 9-17 illustrates the describedco-evolution mechanism.
There are other works using this co-evolutionary model to evolve fuzzyrules. For example, fuzzy co-co (Pena-Reyes and Sipper, 2001) maintains twopopulations: one evolves membership functions and the other evolves fuzzyrules.
4.1 Fuzzy Rule GenerationThe co-evolutionary system is implemented in a genetic programming(GP)
system called PolyGP (Yu, 2001), which has a type system to perform typechecking during rules evolution. In this way, the evolved rules (genotype andphenotype) are always type checked prior to fitness evaluation. There are othermethods to evolve type-correct solutions (Yu and Bentley, 1998). For example,(Bentley, 2000) mapped type-incorrect fuzzy rules to correct ones using a repairmethod.
Table 9-2 gives the functions and terminals with their type signatures for theGP system to evolve type-correct fuzzy rules. The 3 well logs (PHI,RHOB, DT )and v-shale have a vector type of 5 values, each of which specifies the degreeof membership to the 5 symbols a, b, c, d and e. For example, a segment withmean value 0.9 has a vector values [0.8, 0.2, 0, 0, 0]. The function is-a, is-b, is-c,is-d and is-e take a vector as argument and returns the degree of membershipbelongs to symbol a, b, c, d and e respectively. For example, is-a[0.8, 0.2, 0, 0,0] = 0.8. Three fuzzy operators used to construct fuzzy rules are and, or andnot: and(x, y) = min(x, y), or(x, y) = max(x, y), not(x) = 1 − x. Figure9-18 gives an evolved fuzzy rule example.

A Co-Evolutionary Fuzzy System for Reservoir Well Logs Interpretation 211
Table 9-2. Function and Terminal SetsFunctionTerminal Type
is-a [float,float,float,float,float]→floatis-b [float,float,float,float,float]→floatis-c [float,float,float,float,float]→floatis-d [float,float,float,float,float]→floatis-e [float,float,float,float,float]→floatand float→float→floatnot float→floator float→float→float
PHI [float,float,float,float,float]RHOB [float,float,float,float,float]
DT [float,float,float,float,float]v-shale [float,float,float,float,float]
and
is-a or
porosity is-b not
v-shale is-c
density
Figure 9-18. An evolved fuzzy rule example.
To work with this fuzzy rule tree representation, we employed four geneticoperators in this study: homologous crossover, and-crossover, or-crossover andmutation. Homologous crossover selects common location in both parent treesto carry out the crossover operation. The and-crossover combines two parentrules into one rule using the and operator. The or-crossover combines twoparent rules into one rule using the or operator. The mutation operation canperform sub-tree, function and terminal mutations, depending on the selectedmutation location.
4.2 Fuzzy Rules EvaluationAfter evaluation, a fuzzy rule produces a numerical value between 0 and 1.
This value indicates the degree of membership the data belongs to the classifiedpermeability. We uses a simple defuzzification mechanism to interpret the result:
212 EVOLUTIONARY COMPUTATION IN PRACTICE
if the degree of membership is greater than or equal to 0.5, the data belongs tothe classified range.
To assign a fitness to the evaluated fuzzy rule, the rule is first combined withthe best rule in the other population using the following template:
if rule-1 ≥ 0.5then high-permeability
else if rule-2 ≥ 0.5then low-permeability
else medium-permeability.
where rule-1 is a rule from the first population and rule-2 is a rule from thesecond population. If the evaluated rule is from the first population, the bestrule from the second population is used to complete the template. If the evaluatedrule is from the second population, the best rule from the first population is usedto complete the template. This combined if-then-else rule is then tested on thetraining data and the interpretation results are compared with the transformedpermeability. If the if-then-else rule gives the correct interpretation, it is a hit.The percentage of the hit among the training data is the fitness of the evaluatedrule. To promote shorter and more readable rules to be evolved, rules with lengthmore than 100 nodes are penalized. Also, the best rule in each populationis updated at the beginning of every generation, so that a good rule can beimmediately used to combine with rules in the other population and impactevolution.
5. EXPERIMENTAL SETUPBoth Well A and B have a greater number of high and low permeability
data segments than medium-permeability data segments. We therefore usedone population to evolve rules that separate high-permeability data segmentsand the other population to evolve rules that distinguish low-permeability datasegments. In this way, both populations have a balanced number of positive andnegative samples, which is important to train robust classifiers.
We used Well A data to train the fuzzy rules. The final best rule was then testedon Well B data. The crossover rates used are as follows: 20% for homologouscrossover, 10% for and-crossover and 10% for or-crossover. Mutation rate is50%. When no genetic operation is executed, an identical copy of one parent iscopied over to the next generation.
The selection scheme is a tournament with size 2. We set the population sizeas 100 to run for 1,000 generations, where at each generation, the population is100% replaced by the offspring except one copy of the elite (the best) which iskept and carried over to the new generation.
By combining two rules from two populations, it is sufficient to classifythree permeability ranges. However, the order of their combination can effect

A Co-Evolutionary Fuzzy System for Reservoir Well Logs Interpretation 213
the classification accuracy. This is because rule-1 is evaluated first, accordingto the rule template. Once rule-1 makes a wrong interpretation, rule-2 cannot correct it. Consequently, rule-1 has a stronger impact than rule-2 on theperformance of the combined rule.
To achieve a better interpretation accuracy, it is desirable to have the rulewhich has better accuracy be rule-1. Unfortunately, we do not know in advancewhich of the two rules will give better accuracy. We therefore made two setsof experimental runs. In the first set, rule-1 is the rule that identifies high-permeability data segments. In the second set, rule-1 is the rule that classifieslow-permeability data segments. Fifty runs were made for each of the two setupsand their final best rules were collected for evaluation.
6. RESULTSFigure 9-19 gives the results of the two sets of runs. As shown, the fuzzy rules
which classify high-permeability first produce better results: the average fitnessof the best rule from the 50 runs is 0.83 on training data and 0.61 on testingdata. The rules that first identify low-permeability data have average fitness of0.77 on training data and 0.6 on testing data. In both cases, there is a big gapbetween the fitness on training data and the fitness on testing data. There canbe a couple of explanations. First, the two wells have very different geology.
0 5 10 15 20 25 30 35 40 45 50
0.35
0.4
0.45
0.5
0.55
0.6
0.65
0.7
0.75
0.8
0.85
run number
fitness
setup−2: best rule on testing datasetup−1: best rule on testing datasetup−2: best rule training datasetup−1: best rule on training data
Figure 9-19. Results of the two sets of runs.

214 EVOLUTIONARY COMPUTATION IN PRACTICE
The fuzzy rules trained based on log data from Well A therefore do not work aswell on Well B. Another explanation is that Well B has a smaller number (15)of data points. Consequently, even a small number of mis-classification (1 or 2)will have strong impact on the classification accuracy. The accuracy measureof Well B, therefore, is not sufficient to reflect the fuzzy rules’ performance.
To give a more detailed analysis of the performance of the fuzzy rules, weselected the rule that had the best fitness (0.76) on testing data and plotted itspermeability interpretation on training data (Well A) and on testing data (WellB). The results are given in Figure 9-20 and Figure 9-21.
As shown, the fuzzy rule gives permeability interpretations which are veryclose to the transformed target permeability in both wells. In Well A, 8 out of the43 segments were mis-classified; all of them have medium-permeability and thefuzzy rule mis-classified them as either low-permeability or high-permeability.The degree of ‘mistake’ is not too serious.
For Well B, the fuzzy rule mis-classified 4 out of the 15 segments. Amongthem, 1 segment can be fuzzily interpreted as either medium or high permeabil-ity according to the core permeability. The segmentation method transformedit as c (high permeability) while the fuzzy rule interpreted it as medium perme-ability. Once this segment is excluded, the number of mis-classification on WellB becomes 3 and the classification accuracy improves to 0.8, which is close tothe accuracy on Well A (0.81). Based on this detailed analysis, the fuzzy rulegives a reasonably accurate permeability interpretation for both Well A andWell C. This is a very encouraging result.
0 50 100 150 200−2
−1
0
1
2
3
4
5
data sequence number
core
per
mea
bilit
y
core permeability
perm
eabi
lity
by fu
zzy
rule
0
1
2
3
4transformed permeabilitypermeability by fuzzy rule
Figure 9-20. Well A permeability.

A Co-Evolutionary Fuzzy System for Reservoir Well Logs Interpretation 215
0 50 100 150−2
−1
0
1
2
3
4
5
data sequence number
core
per
mea
bilit
y
core permeability
perm
eabi
lity
by fu
zzy
rule
0
0.5
1
1.5
2
2.5
3
3.5
4transformed permeabilitypermeability by fuzzy rule
Figure 9-21. Well B permeability.
7. ANALYSIS AND DISCUSSIONTo understand why rules that classify high-permeability segments first have
produced better results, we calculated the average population fitness and thefitness of the best solution for all runs. The averages of the 50 runs for each setof experiments are plotted in Figure 9-22 and Figure 9-23.
When the first population is used to evolve rules that classify low-permeabilitysegments and the second population is used to evolve rules that classify high-permeability data segments, Figure 9-22 shows that the co-evolution pressureis biased toward the second population. Average fitness of the first populationis consistently lower than that of the second population. Using the worse of thetwo rules (the one from the first population) as rule-1 to interpret permeabilityhas impaired the overall interpretation accuracy.
This bias, however, does not appear in the other experiment where the rulesthat classify high-permeability were used as rule-1 to interpret permeability.As shown in Figure 9-23, both populations co-evolve together with comparableaverage fitness. This is a healthy co-evolutionary dynamics which has producedcombined if-then-else rule that give more accurate permeability interpretationsthan that by the other experiment.
In both sets of experimental runs, the two populations improved very quicklyat the first 200 generations. After that, the improvement is not very visible. Thispattern also appears in the fitness improvement of the best combined overallpermeability interpreter, although to a lesser extend. One possible reason is

216 EVOLUTIONARY COMPUTATION IN PRACTICE
0.2
0.3
0.4
0.5
0.6
0.7
0.8
0.9
0 200 400 600 800 1000
fitne
ss
generation
pop-1 average
pop-2 average
best combined rule
Figure 9-22. Experimental results for runs where population 1 evolves rules to identify low-permeability data.
0.2
0.3
0.4
0.5
0.6
0.7
0.8
0.9
0 200 400 600 800 1000
fitne
ss
generation
pop-1 average
pop-2 average
best combined rule
Figure 9-23. Experimental results for runs where population 1 evolves rules to identify high-permeability data.

A Co-Evolutionary Fuzzy System for Reservoir Well Logs Interpretation 217
that the best solution used to combine with individuals in the other populationfor fitness evaluation is updated every generation. Such a greedy approach mayhave reduced the population diversity necessary for continuous evolution. In ourfuture work, we plan to investigate using a less frequent updating scheme sothat the two populations only occasionally communicate with each other. Thisasynchronous version of co-evolution model not only allows each populationto have a slower and more stable evolution pace but also is suited for a parallelimplementation in which each population is evolved on a separate processor.Such parallel implementation is important for the efficient processing of a largenumber of well logs simultaneously.
8. CONCLUSIONSWell log interpretation is a routine, but time-consuming task in oil companies.
With the increasing global energy demand, it is a natural trend to seek com-puterized well log interpretation techniques to provide results more efficiently.In this work, we have devised a co-evolutionary fuzzy system to generate awell log interpreter to automatically process well log data and interpret reser-voir permeability. The initial testing results show that the generated fuzzy rulesgive a sensible permeability interpretation. Although the result is preliminary,it provides initial evidence of the potential of the developed method. We planto continue the work by extending the system in two areas:
the capability to evolve fuzzy rule interpreters for other reservoir prop-erties, such as lithology.
a less frequent rule updating scheme between the two populations, hencethe possibility of parallel implementation of the co-evolutionary fuzzysystem.
AcknowledgmentsI would like to thank Julian Squires for porting the PolyGP system from
Haskell to Java. The data set is provided by Chevron Energy TechnologyCompany.
ReferencesAbonyi, J., Feil, B., Nemeth, S., and Arva, P. (2005). Modified gath-geva clus-
tering for fuzzy segmentation of multivariate time-series. Fuzzy Sets andSystems, 149:39–56.
Apostolico, A., Bock, M. E., and Lonardi, S. (2002). Monotony of surprise andlarge-scale quest for unusual words. In Proceedings of the 6th InternationalConference on Research in Computational Molecular Biology, pages 22–31.
218 EVOLUTIONARY COMPUTATION IN PRACTICE
Bentley, Peter J. (2000). “Evolutionary, my dear watson” investigatingcommittee-based evolution of fuzzy rules for the detection of suspiciousinsurance claims. In Proceedings of the Genetic and Evolutionary Compu-tation Conference (GECCO-2000), pages 702–709. Morgan Kaufmann.
Keogh, Eamonn, Chakrabarti, Kaushik, Mehrotra, Sharad, and Pazzani, Michael(2001). Locally adaptive dimensionality reduction for indexing large time se-ries databases. In Proceedings of ACM SIGMOD Conference on Managementof Data, pages 151–162.
Larsen, R. J. and Marx, M. L. (1986). An Introduction to Mathematical Statisticsand Its Applications,2nd Edition. Prentice Hall, Englewood.
Lin, J., Keogh, E., Lonardi, S., and Chiu, B. (2003). A symbolic representationof time series, with implications for streaming algorithms. In Proceedingsof the 8th ACM SIGMOD Workshop on Research Issues in Data Mining andKnowledge Discovery.
Pena-Reyes, Carlos Andres and Sipper, Moshe (2001). Fuzzy coco: A coop-erative coevolutionary approach to fuzzy modeling. IEEE Transactions onFuzzy Systems, 9(5):727–737.
Potter, Mitchell A. and Jong, Kenneth A. De (1994). A cooperative coevolu-tionary approach to function optimization. In Parallel Problem Solving fromNature – PPSN III, pages 249–257, Berlin. Springer.
Potter, Mitchell A. and Jong, Kenneth A. De (2000). Cooperative coevolution:An architecture for evolving coadapted subcomponents. Evolutionary Com-putation, 8(1):1–29.
Yu, Tina (2001). Hierachical processing for evolving recursive and modularprograms using higher order functions and lambda abstractions. GeneticProgramming and Evolvable Machines, 2(4):345–380.
Yu, Tina and Bentley, Peter (1998). Methods to evolve legal phenotypes. InParallel Problem Solving from Nature – PPSN V, pages 280–291, Berlin.Springer.
Yu, Tina and Wilkinson, Dave (2007). A fuzzy symbolic representation forintelligent reservoir well log interpretation. In “Hybrid Intelligent Systemsusing Soft Computing” of the Series on Computational Intelligence, SpringerVerlag Edited by, O. Castillo, P. Melin, W. Pedrycz, and J. Kacprzyk.
Yu, Tina, Wilkinson, Dave, and Xie, Deyi (2003). A hybrid GP-fuzzy approachfor reservoir characterization. In Riolo, Rick L. and Worzel, Bill, editors, Ge-netic Programming Theory and Practise, chapter 17, pages 271–290. Kluwer.