Embed Size (px)
Citation preview
AKES Conference on Korea and the World Economy, XI
“New Challenge for the Korea and the World Economy in the Era of
Globalization and Polarization”
A Comparative Analysis of Korea’s Free Trade Agreements by
CGE Models: New Challenges under Globalization
Linyue Li
The Central University of Finance and Economics
June, 2012
Abstract
In this paper, the economic impacts of Korea’s possible Free Trade Agreements
(FTAs) with China, Japan, ASEAN (10)1, the United States and EU (27) are
investigated qualitatively and quantitatively. There are seven possible FTAs for Korea:
Korea – China, Korea – Japan, Korea – China & Japan, Korea – China & Japan &
ASEAN, Korea – ASEAN, Korea – United States, and Korea – EU. To conduct the
assessment, both static and dynamic CGE models with 7 regions, 12 sectors and 5
endowments are employed, assuming that skilled labor, unskilled labor, and capital
are able to be mobile among the regions, and at the same time, land and natural
resource are not mobile among the regions. The major finding is that Korea would
benefit most from a Korea – China & Japan & ASEAN FTA, which is the largest
possible FTA in East Asia. The results of this paper will be meaningful to explore
Korea’s potential FTAs with major economies and contribute to the discussion on
economic integration.
Keywords: Computable General Equilibrium (CGE) model, Free Trade Agreement
(FTA), ASEAN, China P.R., Japan
JEL Classification: F10, F14, F15
Corresponding author, assistant professor, at the department of International Trade and Economics,
the Central University of Finance and Economics, [email protected]
1 ASEAN=Association of Southeast Asian Nations, ASEAN (10) include Brunei Darussalam, Cambodia, Indonesia, Lao PDR, Malaysia, Myanmar, Philippines, Singapore, Thailand, and Viet Nam.
1
I. Introduction
After the global financial crisis, as the interdependence of countries is
growing, the impact of globalization through the increasing integration of trade,
finance, people, and ideas in one global market has been widely discussed, with world
GDP and global trade both in the process of recovering to pre-crisis levels. South
Korea, as one of the few developed countries that were able to avoid a recession
during the global financial crisis, has reached economic growth rate at 6.16% (World
Development Indicator, April 2012) in 2010, which was a sharp recovery from
economic growth rates of 2.3% in 2008 and 0.32% in 20092 when the global financial
crisis hit. Heavily dependent on international trade, South Korea is still one of the
fastest – growing countries in 2000s, with sixth largest exporter and tenth largest
importer in the world in 2010.
Since 1997 - 98 Asian Financial Crisis, Asian economies, especially Korea,
China and Japan has begun to show their continuous interest in regional economic
cooperation, while the fever for regionalism is growing in other parts of the world.
Mutual benefit with strategic cooperation in a far-reaching view is the meaning for
regional cooperation. However, Korea still implemented the trade policy consistent
with the agreements within the multilateral framework of GATT and WTO, until the
late 1990s. In the wake of the Asian Financial Crisis, both external and internal
factors led Korea to realize the importance of adopting an FTA approach with major
economies, such as Japan, ASEAN, the United States, and the European Union (Yoon
et al., 2009).
Starting with the FTA negotiations with Chile in November 1998, Korea
has successfully established FTAs with Chile in 2002, with Singapore in 2005, with
ASEAN in 2005 for goods and services and in 2009 for investment, with the United
States in 2007, with India in 2009, and with EU in 2010, and involved in FTAs with
Canada, Mexico and other countries in the world. Meanwhile, China – Japan – Korea
trilateral summit is making significant progress to promote stronger economic
cooperation and political dialogue annually for the consideration of China – Japan –
Korea FTA, since the first meeting in Manila in November 1999.
2 South Korea’s GDP growth rate in 2008 and 2009 are from World Development Indicator, World Bank,
April 2012.
2
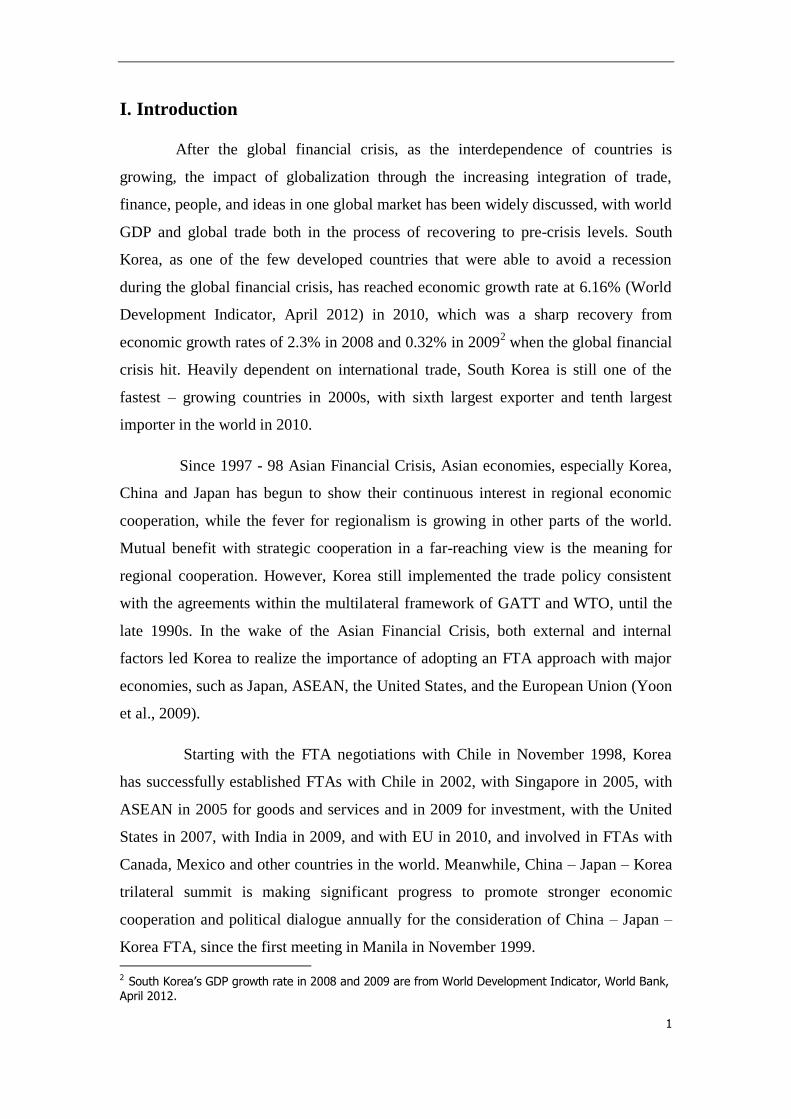
Figure 1: Exports to Korea as the Share of Total Exports among
Ranking Top 7 Economies, 1990 – 2011
Source: IMF, Direction of Trade Statistics (DOTS)
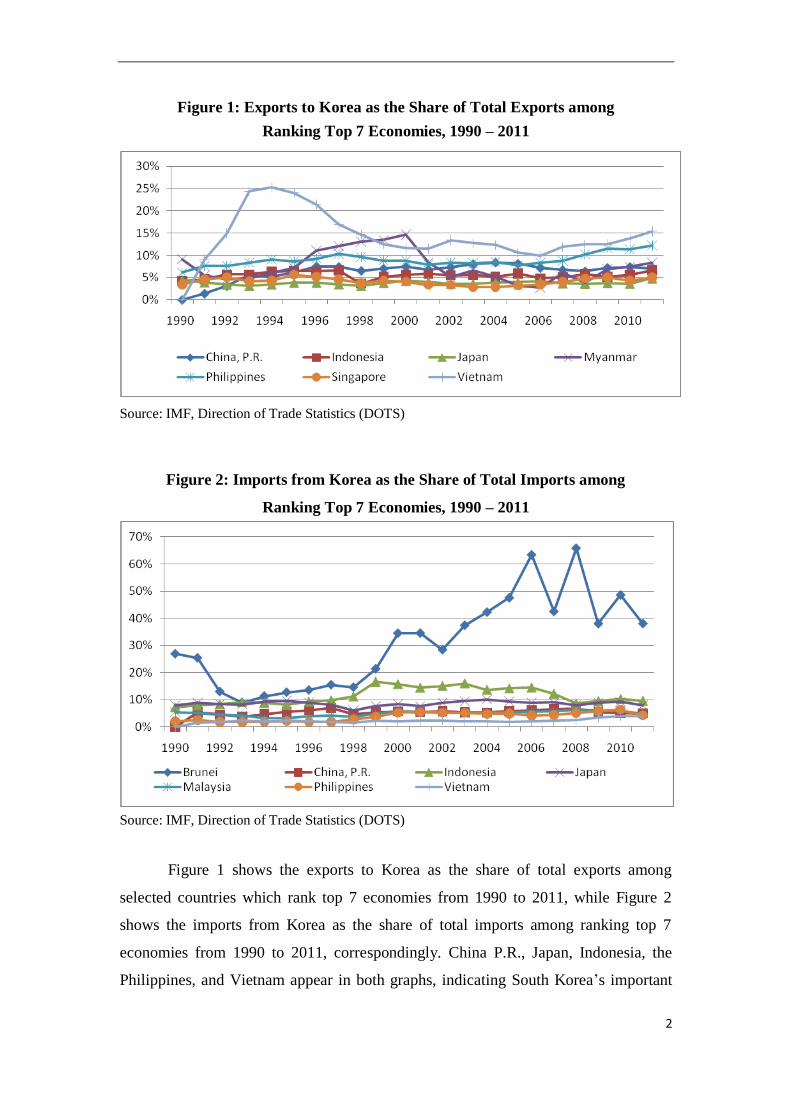
Figure 2: Imports from Korea as the Share of Total Imports among
Ranking Top 7 Economies, 1990 – 2011
Source: IMF, Direction of Trade Statistics (DOTS)
Figure 1 shows the exports to Korea as the share of total exports among
selected countries which rank top 7 economies from 1990 to 2011, while Figure 2
shows the imports from Korea as the share of total imports among ranking top 7
economies from 1990 to 2011, correspondingly. China P.R., Japan, Indonesia, the
Philippines, and Vietnam appear in both graphs, indicating South Korea’s important
3
trade position as an importer and an exporter to these countries, compared with other
7 ASEAN countries, 3 NAFTA countries and the EU as a whole.
In the first graph, the dramatic increase of Vietnam’s exports to Korea as the
share of Vietnam’s total exports during the first half of 1990s and the peak reached in
1994 illustrates the great effects from the establishment of diplomatic relations
between Vietnam and Korea in 1992. Vietnam’s major exports to Korea include
agriculture, forestry and marine products, while Vietnam’s principal imports from
Korea include petroleum oils and oils, apparel, and automobiles. Abundant human
and natural resources in Vietnam and advanced technologies in Korea make their
economic growth through win-win cooperation.
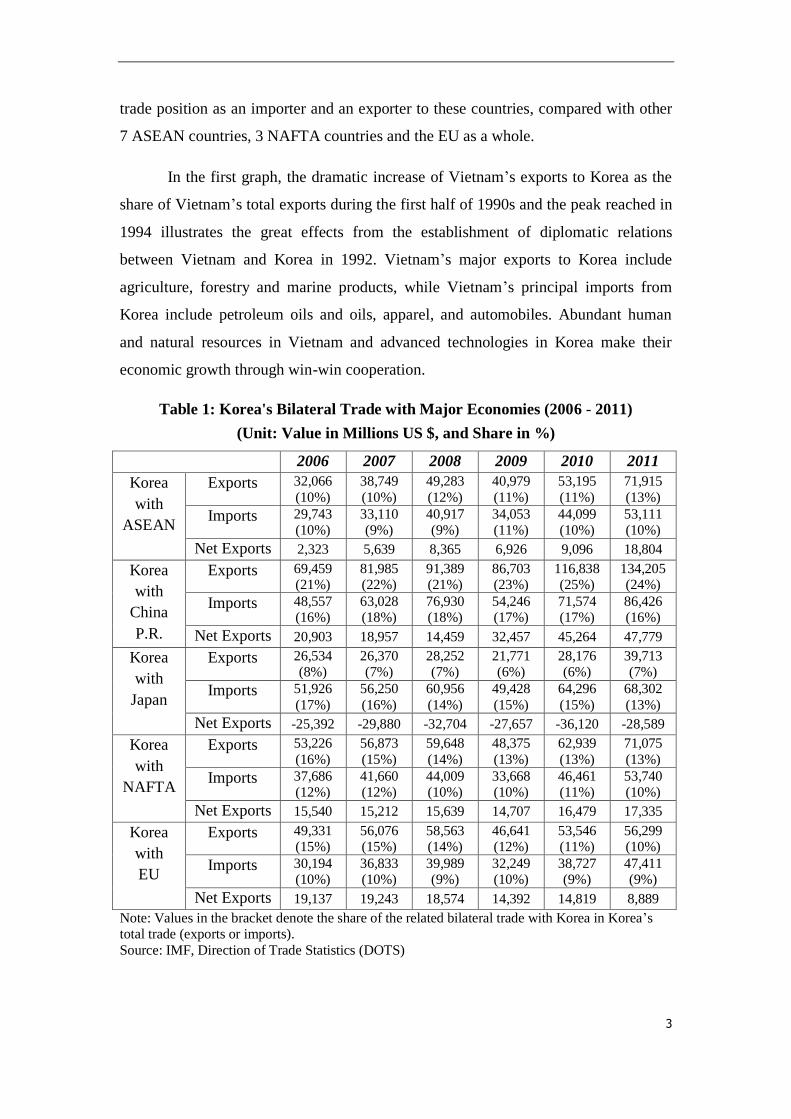
Table 1: Korea's Bilateral Trade with Major Economies (2006 - 2011)
(Unit: Value in Millions US $, and Share in %)
2006 2007 2008 2009 2010 2011
Korea
with
ASEAN
Exports 32,066
(10%)
38,749
(10%)
49,283
(12%)
40,979
(11%)
53,195
(11%)
71,915
(13%)
Imports 29,743 (10%)
33,110 (9%)
40,917 (9%)
34,053 (11%)
44,099 (10%)
53,111 (10%)
Net Exports 2,323 5,639 8,365 6,926 9,096 18,804
Korea
with
China
P.R.
Exports 69,459 (21%)
81,985 (22%)
91,389 (21%)
86,703 (23%)
116,838 (25%)
134,205 (24%)
Imports 48,557 (16%)
63,028 (18%)
76,930 (18%)
54,246 (17%)
71,574 (17%)
86,426 (16%)
Net Exports 20,903 18,957 14,459 32,457 45,264 47,779
Korea
with
Japan
Exports 26,534 (8%)
26,370 (7%)
28,252 (7%)
21,771 (6%)
28,176 (6%)
39,713 (7%)
Imports 51,926
(17%)
56,250
(16%)
60,956
(14%)
49,428
(15%)
64,296
(15%)
68,302
(13%)
Net Exports -25,392 -29,880 -32,704 -27,657 -36,120 -28,589
Korea
with
NAFTA
Exports 53,226
(16%)
56,873
(15%)
59,648
(14%)
48,375
(13%)
62,939
(13%)
71,075
(13%)
Imports 37,686 (12%)
41,660 (12%)
44,009 (10%)
33,668 (10%)
46,461 (11%)
53,740 (10%)
Net Exports 15,540 15,212 15,639 14,707 16,479 17,335
Korea
with
EU
Exports 49,331 (15%)
56,076 (15%)
58,563 (14%)
46,641 (12%)
53,546 (11%)
56,299 (10%)
Imports 30,194 (10%)
36,833 (10%)
39,989 (9%)
32,249 (10%)
38,727 (9%)
47,411 (9%)
Net Exports 19,137 19,243 18,574 14,392 14,819 8,889
Note: Values in the bracket denote the share of the related bilateral trade with Korea in Korea’s total trade (exports or imports).
Source: IMF, Direction of Trade Statistics (DOTS)
4
In the second graph, Brunei’s imports from Korea as the share of Brunei’s
total imports experienced significant increase since 1994, indicating that the trade
position of Korea in Brunei become increasingly important. Brunei’s major imports
from Korea include motor cars, heating and cooking machinery, steel products and
telephone sets, while Brunei’s major exports to Korea include mineral products,
agriculture and fishery products, and steel and metal products. Since 2006, Brunei –
Korea bilateral trade has been in favor of Brunei, with Korea’s trade deficit with
Brunei reaching 1654.3 million US $ in 2008.
From the perspective of Korea, Table 1 represents Korea’s bilateral trade
with ASEAN, China P.R., Japan, NAFTA, and EU, as the share of Korea’s total trade.
For the annual share in percentage, China P.R. takes up around a quarter of Korea’s
total exports, along with NAFTA at 14% on average, EU at about 13%, ASEAN at
about 11.2% and Japan at about 7%. The rank of Korea’s bilateral imports with
trading partners is China at 17% on average, Japan at 15% on average, NAFTA at
about 10.83%, ASEAN at about 9.83% and EU at 9.5% on average. The proportions
for these five trading partners are relatively stable during the period from 2006 to
2011, which include 2007 – 2009 the global financial crisis. Therefore, it is natural
and meaningful to discuss the possibility of adopting an FTA with each of them or the
combination of these major trading partners.
Under this background, the paper will focus on Korea’s Free Trade
Agreements (FTAs) to do a comparative analysis through computable general
equilibrium (CGE) models. The purpose of this study is to explore optimal FTAs for
the Korea and the world economy, considering new challenges under globalization
and polarization. At the same time, the research on Korea’s FTAs will contribute to
the discussion on economic integration.
The structure of this paper is organized as the follows. Section II briefly
reviews the major findings and contributions in the existing literature. Section III
describes the empirical framework in qualitative analysis and quantitative analysis. In
section IV, the results from quantitative approach through CGE model are presented
for comparative analysis in different dimensions. Section V concludes the paper and
indicates future research direction, followed by the reference.
5
II. Literature Review
A number of studies usually used a computable general equilibrium (CGE)
model with the database of the Global Trade Analysis Project (GTAP) to quantify the
economic impact of FTAs. Generally speaking, there are two types of CGE models:
static CGE model and dynamic or capital accumulation CGE model. The static model
evaluates the immediate impact of the removal of trade barriers, in the short run,
while the dynamic model incorporates medium – and long – term efficiency gains
from capital accumulation and resource re-allocation. In general, empirical studies
using dynamic CGE model often find a bigger aggregate GDP and bigger welfare
gains among member countries from an FTA, because a dynamic model incorporates
the impact of trade on growth through accumulated investment and shows higher
gains compared to the static model3. The advantage of standardized CGE model is to
derive a lot of valuable results at a relatively small expense with little effort (Yoon et
al., 2009).
CGE model is widely used to quantitatively assess changes in national
output, industry production and welfare resulting from a policy change or some
economic shock, especially for the trade policy studies. To analyze the effects of
changes in trade policy, such as regional trade agreements and multilateral trade
liberalization negotiations, CGE model has been extensively used to do analysis. For
example, Hertel et al. (2001) used the CGE model to analyze the economic impacts of
an FTA between Singapore and Japan. Tongzon (2001) investigated the influence of
China’s entry into WTO on the other East Asian countries.
To examine and quantify the effects of a trilateral FTA for Northeast Asia,
Ko (2000), Lee, J.W. (2002), Abe (2003), Park (2004), Lee et al. (2005), and Yoon et
al. (2009) all applied a CGE model to assess the economic impacts of the FTA.
However, due to different underlying assumptions and specifications, such as the
version of the Global Trade Analysis Project (GTAP) database, the type of CGE
model and the scenarios used to assess the effects of trade liberalization, the literature
on FTAs has produced varying results on the value of estimated economic impacts.
3 Please see ADB working paper “The PRC’s Free Trade Agreements with ASEAN, Japan, and the Republic of Korea: A Comparative Analysis” by Gemma Estrada, Donghyun Park, Innwon Park, and
Soonchan Park, January, 2012.
6
In the literature to study Korea’s FTA with China and Japan, Yoon et al.
(2009) made contribution to compare the macroeconomic and sector effects of
bilateral agreements or a trilateral FTA among China, Korea and Japan. Based on
their results, from the perspective of Korea, Korea’s FTA with China is most
beneficial for Korea, while China’s FTA with Korea and Japan will generate most
beneficial results for China, considering four possible FTA scenarios among China,
Japan, and Korea (Yoon et al., 2007 and 2009).
As China’s role in East Asia’s recovery from the recent global financial
crisis highlighted China’s growing role as an engine of growth not only for Asia, but
also for the world, there are many potential gains from entering into FTAs with China,
for the countries who collectively from a large and fast-growing market. Therefore,
Korea’s three possible FTAs with China: Korea – China FTA, Korea – China & Japan
FTA and Korea – China & Japan & ASEAN FTA will be focused on. The discussion
on the results of Korea – China & Japan FTA is meaningful for China – Korea –
Japan trilateral cooperation and the East Asian community, after the trilateral summit
held in Seoul, 2012. However, previous literatures on this study rarely do
comparisons of Korea’s existing and potential FTAs with China, Japan, ASEAN,
NAFTA and EU through both static CGE model and dynamic CGE model. The
inspiration of writing this paper is to fill this gap with updated database (GTAP
database 7), CGE model and latest information about status of Korea’s FTA (See
Table 2). The contribution of this paper is to highlight the existing and potential
impacts of Korea’s FTAs with China, Japan, ASEAN, NAFTA, and EU.
In addition, different from most of the previous studies, this paper will do a
comparative analysis mainly in two different dimensions. For the first dimension, the
welfare and output effects from trade for Korea’s 7 possible FTAs will be compared
through either static CGE model or dynamic CGE model. For the second dimension,
the results from static CGE model and dynamic CGE model will be compared for
each possible FTA. In the process of comparative analysis, quantitative and
qualitative analysis will be combined to do explanation. New challenges in the era of
globalization and polarization, such as changing global economy, the dynamic cost of
polarization against the potential dynamic benefits, fragile recovery from recession,
business cycle transmission through trade channel and the transmission of negative
7
effects from EU crisis will be considered in the discussion on the possibility to realize
the optimal FTAs which are likely to be mutually beneficial for both Korea and
Korea’s trading partner, further promoting the cooperation for Korea and the world
economy.
Table 2: Status of Korea’s FTA (updated to April, 2012)
FTAs in effect
Korea – Chile FTA
(2002)
Korea – Singapore FTA
(2005)
Korea – EFTA4 FTA
(2005)
Korea – ASEAN
(2005 for goods and
services only & 2009 for
investment)
Korea – India CEPA
(2009)
Concluded FTAs
Korea - U.S. FTA
(2007)
Korea – EU FTA
(2010)
Korea – Peru FTA
(2011)
FTAs under negotiation
Korea – Canada FTA Korea – Mexico FTA Korea – GCC FTA
Korea – Australia FTA Korea – New Zealand
FTA
Korea – Colombia FTA
Korea – Turkey FTA
FTAs under consideration
Korea – Japan FTA Korea – China FTA Korea – China – Japan
FTA
Korea – MERCOSUR TA Korea – Russia FTA Korea – Israel FTA
Korea – SACU FTA Source: KOIMA (Korea Importers Association)
4 EFTA: European Free Trade Association
8
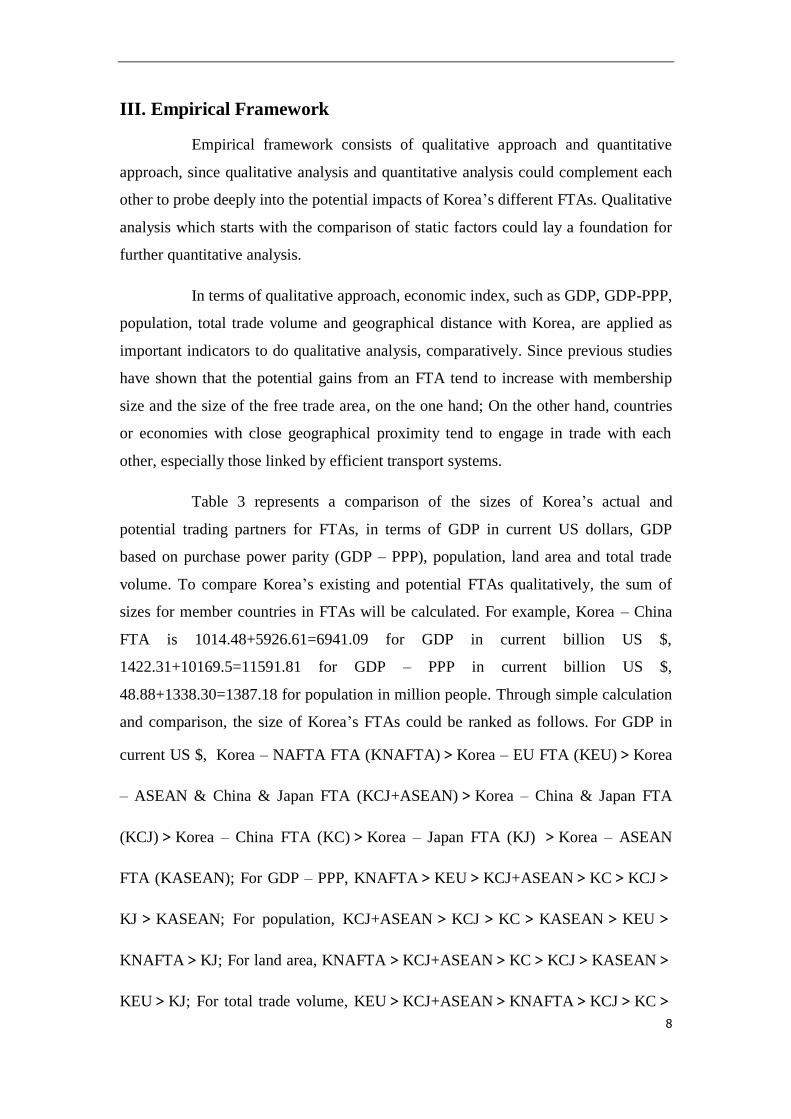
III. Empirical Framework
Empirical framework consists of qualitative approach and quantitative
approach, since qualitative analysis and quantitative analysis could complement each
other to probe deeply into the potential impacts of Korea’s different FTAs. Qualitative
analysis which starts with the comparison of static factors could lay a foundation for
further quantitative analysis.
In terms of qualitative approach, economic index, such as GDP, GDP-PPP,
population, total trade volume and geographical distance with Korea, are applied as
important indicators to do qualitative analysis, comparatively. Since previous studies
have shown that the potential gains from an FTA tend to increase with membership
size and the size of the free trade area, on the one hand; On the other hand, countries
or economies with close geographical proximity tend to engage in trade with each
other, especially those linked by efficient transport systems.
Table 3 represents a comparison of the sizes of Korea’s actual and
potential trading partners for FTAs, in terms of GDP in current US dollars, GDP
based on purchase power parity (GDP – PPP), population, land area and total trade
volume. To compare Korea’s existing and potential FTAs qualitatively, the sum of
sizes for member countries in FTAs will be calculated. For example, Korea – China
FTA is 1014.48+5926.61=6941.09 for GDP in current billion US $,
1422.31+10169.5=11591.81 for GDP – PPP in current billion US $,
48.88+1338.30=1387.18 for population in million people. Through simple calculation
and comparison, the size of Korea’s FTAs could be ranked as follows. For GDP in
current US $, Korea – NAFTA FTA (KNAFTA)>Korea – EU FTA (KEU)>Korea
– ASEAN & China & Japan FTA (KCJ+ASEAN)>Korea – China & Japan FTA
(KCJ)>Korea – China FTA (KC)>Korea – Japan FTA (KJ) >Korea – ASEAN
FTA (KASEAN); For GDP – PPP, KNAFTA>KEU>KCJ+ASEAN>KC>KCJ>
KJ>KASEAN; For population, KCJ+ASEAN>KCJ>KC>KASEAN>KEU>
KNAFTA>KJ; For land area, KNAFTA>KCJ+ASEAN>KC>KCJ>KASEAN>
KEU>KJ; For total trade volume, KEU>KCJ+ASEAN>KNAFTA>KCJ>KC>
9
KASEAN>KJ. Therefore, Korea – ASEAN & China & Japan FTA and Korea –
NAFTA FTA have relative comparative advantage in sizes, and Korea – Japan FTA
has relative comparative disadvantage in term of sizes. In terms of geographical
proximity with Korea, negative effects are involved as the geographical distance with
Korea increases. The rank in terms of geographical proximity is KCJ>KC>KJ>
KASEAN>KCJ+ASEAN>KEU>KNAFTA, indicating that Korea – NAFTA FTA
has relative comparative disadvantage and Korea – China & Japan has relative
comparative advantage in terms of geographical proximity. In addition, development
levels among member countries of an actual or potential FTA matter for successful
integration. To some extent, the development levels could be measured by annual
GDP growth rate. In terms of annual GDP growth rate, Korea is close to ASEAN
(average) and Japan. Based on the above three aspects of the indicators,
comprehensive results for qualitative analysis implies that Korea – ASEAN & China
& Japan FTA, Korea – China FTA and Korea – China & Japan FTA could generate
larger output effects and welfare effects, compared with other combination of Korea’s
FTAs. The results from the qualitative approach are expected to be consistent with the
results from the quantitative approach.
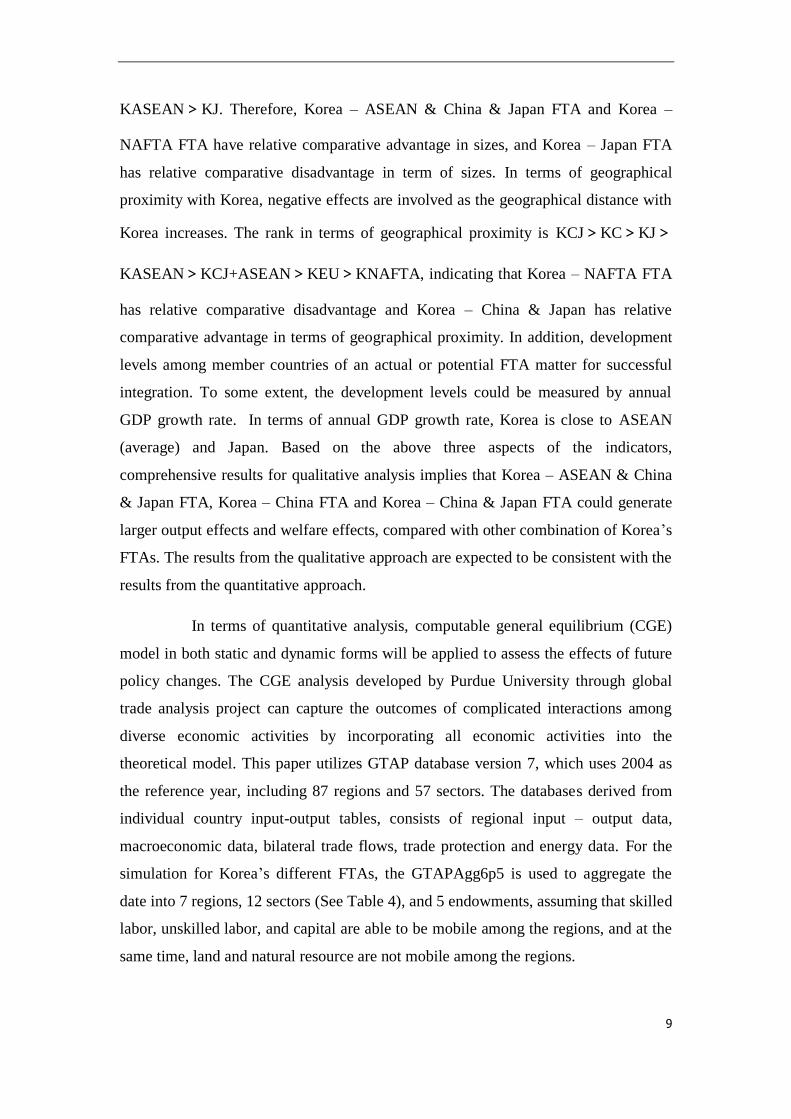
In terms of quantitative analysis, computable general equilibrium (CGE)
model in both static and dynamic forms will be applied to assess the effects of future
policy changes. The CGE analysis developed by Purdue University through global
trade analysis project can capture the outcomes of complicated interactions among
diverse economic activities by incorporating all economic activities into the
theoretical model. This paper utilizes GTAP database version 7, which uses 2004 as
the reference year, including 87 regions and 57 sectors. The databases derived from
individual country input-output tables, consists of regional input – output data,
macroeconomic data, bilateral trade flows, trade protection and energy data. For the
simulation for Korea’s different FTAs, the GTAPAgg6p5 is used to aggregate the
date into 7 regions, 12 sectors (See Table 4), and 5 endowments, assuming that skilled
labor, unskilled labor, and capital are able to be mobile among the regions, and at the
same time, land and natural resource are not mobile among the regions.

10
Table 3: Comparison of Economic Index in 2010
GDP
annual
growth
(%)
GDP
(current
billion
US $)
GDP-
PPP
(billion
$)
Populatio
n, total
(million)
Land
area (sq.
thousand
km)
Trade
volume
(billion
US $)
Geographic
al distance
with
Korea
(km) (%) (%) (%) (%) (%)
Brunei
Darussalam -1.77
14.50 20.20 0.40 5.27 11.39 3819
(0.02) (0.03) (0.01) (0.004) (0.03)
Cambodia 5.96 11.24 31.02 14.14 176.52 14.77
3629 (0.02) (0.04) (0.21) (0.14) (0.04)
Indonesia 6.10 706.56 1037.50 239.87 1811.57 328.38
5278 (1.12) (1.35) (3.48) (1.40) (0.89)
Lao PDR 8.45 7.30 15.82 6.20 230.80 4.58
3208 (0.01) (0.02) (0.09) (0.18) (0.01)
Malaysia 7.19 237.80 418.37 28.40 328.55 421.21
4609 (0.38) (0.55) (0.41) (0.25) (1.14)
Myanmar 10.42 84.03 93.54 47.96 653.52 13.37
3688 (0.13) (0.12) (0.70) (0.50) (0.04)
Philippines 7.63 199.59 370.18 93.26 298.17 138.24
2614 (0.32) (0.48) (1.35) (0.23) (0.37)
Singapore 14.47 208.77 294.12 5.08 0.70 878.98
4667 (0.33) (0.38) (0.07) (0.001) (2.38)
Thailand 7.81 318.52 591.26 69.12 510.89 434.69
3719 (0.50) (0.77) (1.00) (0.39) (1.18)
Vietnam 6.78 106.43 278.62 86.93 310.07 166.91
2744 (0.17) (0.36) (1.26) (0.24) (0.45)
ASEAN 7.31
(aver.)
1894.7 3150.6 591.4 4326.1 2412.5 3810
(aver.) (3.00) (4.11) (8.58) (3.34) (6.53)
China 10.40 5926.61 10169.5 1338.30 9327.48 3273.18
962 (9.37) (13.26) (19.41) (7.19) (8.86)
Japan 4.00 5458.84 4299.29 127.45 364.50 1668.21
1153 (8.63) (5.61) (1.85) (0.28) (4.52)
Korea, Rep. 6.16 1014.48 1422.31 48.88 97.10 1063.34
0 (1.60) (1.85) (0.71) (0.07) (2.88)
CJK 6.85
(aver.)
12399.9 15891.1 1514.6 9789.1 6004.7 705
(aver.) (19.60) (20.72) (21.97) (7.55) (16.25)
Canada 3.21 1577.04 1332.63 34.13 9093.51 955.47
13653.29 (2.49) (1.74) (0.49) (7.01) (2.59)
Mexico 5.52 1035.87 1651.88 113.42 1943.95 640.87
12071 (1.64) (2.15) (1.65) (1.50) (1.73)
United
States 3.00
14586.7 14586.7 309.35 9147.42 4175.18 7866.71
(23.06) (19.02) (4.49) (7.05) (11.30)
NAFTA 3.91
(aver.)
17199.6 17571.2 456.9 20184.9 5771.5 11197
(aver.) (27.19) (22.91) (6.63) (15.56) (15.62)
European
Union
2.11
(aver.)
16241.1 15939.8 502.13 4181.73 13033.7 8273
(aver.) (25.67) (20.78) (7.28) (3.22) (35.28)
Note: Numbers in the brackets denote the share of related variables in the world total. For the rows of ASEAN, CJK, NAFTA and European Union, GDP, GDP-PPP, Population, Land, and Trade
Volume calculate the aggregate of the member countries, and GDP growth and geographical distance with Korea calculate the average of the member countries. Source: World Development Indicator Online (accessed April 2012)
11
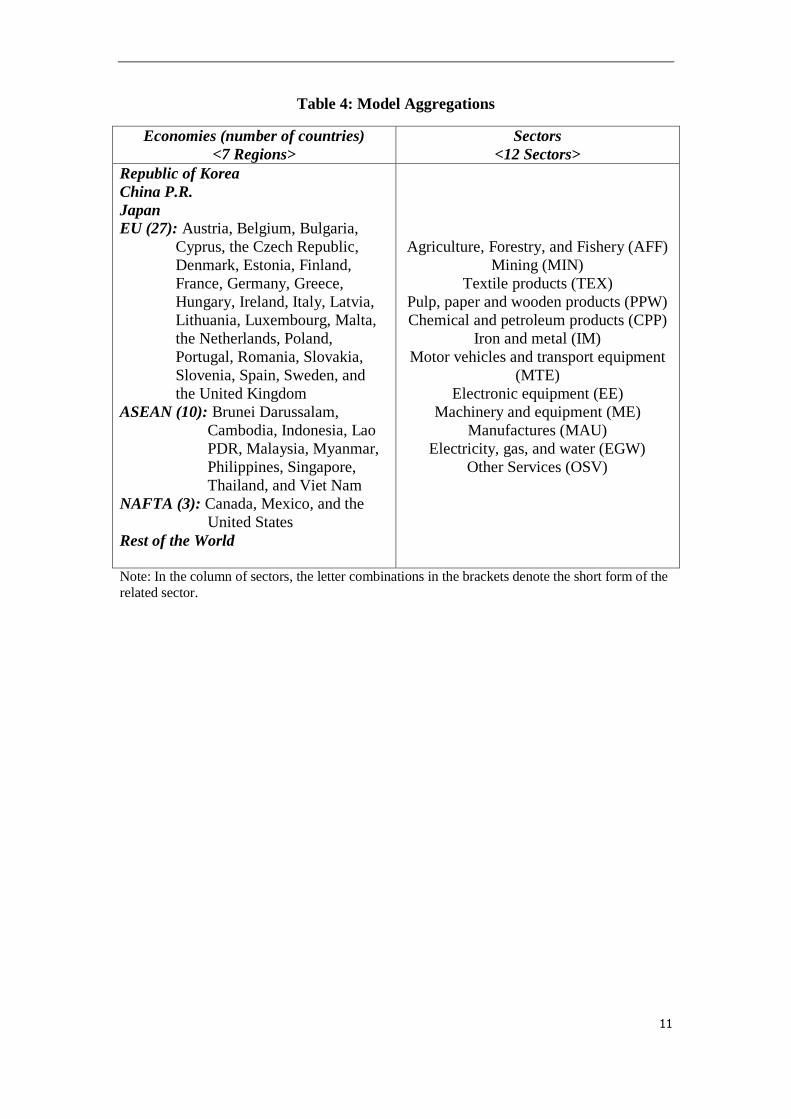
Table 4: Model Aggregations
Economies (number of countries)
<7 Regions>
Sectors
<12 Sectors>
Republic of Korea
China P.R.
Japan
EU (27): Austria, Belgium, Bulgaria,
Cyprus, the Czech Republic,
Denmark, Estonia, Finland,
France, Germany, Greece,
Hungary, Ireland, Italy, Latvia,
Lithuania, Luxembourg, Malta,
the Netherlands, Poland,
Portugal, Romania, Slovakia,
Slovenia, Spain, Sweden, and
the United Kingdom
ASEAN (10): Brunei Darussalam,
Cambodia, Indonesia, Lao
PDR, Malaysia, Myanmar,
Philippines, Singapore,
Thailand, and Viet Nam
NAFTA (3): Canada, Mexico, and the
United States
Rest of the World
Agriculture, Forestry, and Fishery (AFF)
Mining (MIN)
Textile products (TEX)
Pulp, paper and wooden products (PPW)
Chemical and petroleum products (CPP)
Iron and metal (IM)
Motor vehicles and transport equipment
(MTE)
Electronic equipment (EE)
Machinery and equipment (ME)
Manufactures (MAU)
Electricity, gas, and water (EGW)
Other Services (OSV)
Note: In the column of sectors, the letter combinations in the brackets denote the short form of the
related sector.
12
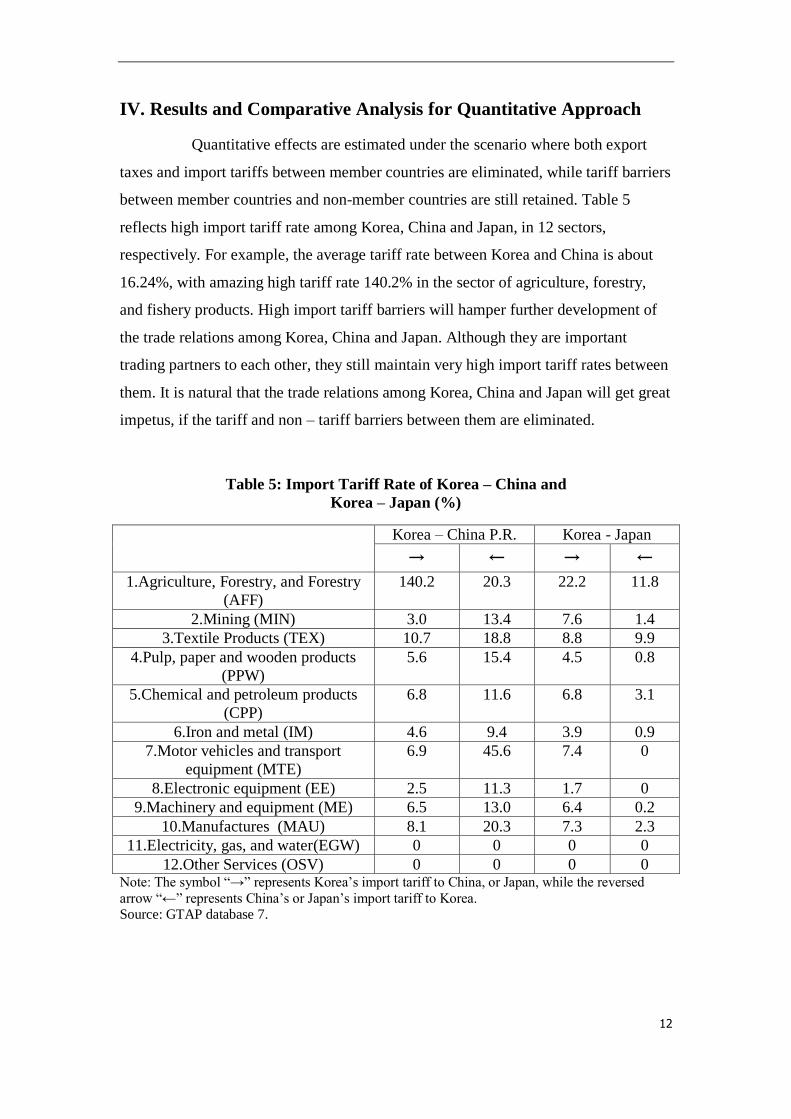
IV. Results and Comparative Analysis for Quantitative Approach
Quantitative effects are estimated under the scenario where both export
taxes and import tariffs between member countries are eliminated, while tariff barriers
between member countries and non-member countries are still retained. Table 5
reflects high import tariff rate among Korea, China and Japan, in 12 sectors,
respectively. For example, the average tariff rate between Korea and China is about
16.24%, with amazing high tariff rate 140.2% in the sector of agriculture, forestry,
and fishery products. High import tariff barriers will hamper further development of
the trade relations among Korea, China and Japan. Although they are important
trading partners to each other, they still maintain very high import tariff rates between
them. It is natural that the trade relations among Korea, China and Japan will get great
impetus, if the tariff and non – tariff barriers between them are eliminated.
Table 5: Import Tariff Rate of Korea – China and
Korea – Japan (%)
Korea – China P.R. Korea - Japan
→ ← → ←
1.Agriculture, Forestry, and Forestry
(AFF)
140.2 20.3 22.2 11.8
2.Mining (MIN) 3.0 13.4 7.6 1.4
3.Textile Products (TEX) 10.7 18.8 8.8 9.9
4.Pulp, paper and wooden products
(PPW)
5.6 15.4 4.5 0.8
5.Chemical and petroleum products
(CPP)
6.8 11.6 6.8 3.1
6.Iron and metal (IM) 4.6 9.4 3.9 0.9
7.Motor vehicles and transport
equipment (MTE)
6.9 45.6 7.4 0
8.Electronic equipment (EE) 2.5 11.3 1.7 0
9.Machinery and equipment (ME) 6.5 13.0 6.4 0.2
10.Manufactures (MAU) 8.1 20.3 7.3 2.3
11.Electricity, gas, and water(EGW) 0 0 0 0
12.Other Services (OSV) 0 0 0 0 Note: The symbol “→” represents Korea’s import tariff to China, or Japan, while the reversed
arrow “←” represents China’s or Japan’s import tariff to Korea. Source: GTAP database 7.
13
Table 6: GDP and Welfare Effects for Korea’s Different FTAs
Static CGE Model Dynamic CGE Model
GDP Welfare GDP Welfare
% Millions
of US $
% Millions
of US $
% Millions
of US $
% Millions
of US $
1. Korea R. – China P. R. (KC – FTA)
ASEAN - 0.22 - 1423 - 0.12 - 735 - 0.25 - 1512 - 0.15 - 973
Korea 2.65 13674 0.95 5641 3.75 16482 2.16 12684
China 0.32 2415 - 0.03 - 18 0.48 3964 0.15 2157
Japan - 0.11 - 716 - 0.01 - 406 - 0.12 - 710 - 0.03 - 738
NAFTA - 0.31 - 1326 - 0.11 - 812 - 0.36 - 1431 - 0.20 - 911
EU - 0.16 - 879 - 0.07 - 321 - 0.19 - 899 - 0.11 - 441
2. Korea R. – Japan (KJ – FTA)
ASEAN - 0.37 -2185 - 0.17 - 1170 - 0.51 - 3274 - 0.33 - 2174
Korea - 0.17 - 1171 - 0.16 - 937 - 0.36 - 2241 - 0.31 - 1865
China - 0.03 - 361 - 0.04 - 379 - 0.35 - 2240 - 0.32 - 4894
Japan 0.98 6258 0.16 6408 0.95 6128 0.24 9711
NAFTA 0.71 5217 0.09 398 0.82 5404 0.15 442
EU 0.52 4126 0.42 2141 0.64 4740 0.55 3086
3. Korea R. – China P.R. & Japan (KCJ – FTA)
ASEAN - 0.31 - 1649 - 0.22 - 849 - 0.39 - 1721 - 0.28 - 9192
Korea 1.05 9041 1.05 4145 2.16 11328 2.17 10071
China 0.27 2105 0.01 10 0.29 2207 0.08 16
Japan - 0.09 - 821 - 0.16 421 - 0.15 - 1047 - 0.21 - 646
NAFTA - 0.31 - 1439 - 0.21 1461 - 0.32 - 1518 - 0.29 - 2112
EU - 0.27 - 2706 - 0.34 3701 - 0.31 - 2916 - 0.41 - 4016
4. Korea R. – ASEAN (KASEAN – FTA)
ASEAN 0.64 4212 0.31 2104 1.34 7523 1.07 7443
Korea - 0.24 - 1367 - 0.12 - 688 - 0.36 1652 - 0.21 - 1141
China 0.56 5741 0.13 1940 0.92 8084 0.47 6787
Japan - 0.14 - 710 - 0.05 - 1092 - 0.17 - 802 - 0.08 - 1807
NAFTA - 0.09 - 512 - 0.10 - 2706 - 0.11 - 531 - 0.16 - 3140
EU - 0.16 - 889 - 0.22 - 374 - 0.16 - 892 - 0.31 - 624
5. Korea R. – China P.R. & Japan & ASEAN (KCJ+ASEAN – FTA)
ASEAN 0.15 1415 0.41 3010 1.83 6741 2.39 16175
Korea 2.78 16174 0.89 5442 4.31 3965 2.55 15159
China 0.54 15451 0.04 674 1.32 4295 0.81 12256
Japan 1.58 276 0.25 9850 1.54 3176 0.40 15843
NAFTA 2.21 431 0.29 8741 2.36 828 0.35 61271
EU 1.62 288 0.16 7205 1.81 293 0.24 59213
6. Korea R. – NAFTA (KNAFTA – FTA)
ASEAN - 0.42 - 3676 - 0.31 - 2147 - 0.50 - 3742 - 0.41 - 2987
Korea 0.74 4621 0.61 3901 0.82 4689 0.73 4041
China - 0.21 - 2016 - 0.16 - 3047 - 0.30 - 2604 - 0.23 - 3152
Japan - 0.09 - 907 - 0.11 - 1641 - 0.12 - 1121 - 0.24 - 2057
NAFTA 0.41 4521 0.52 2176 0.56 4629 0.59 2296
EU 0.21 3609 0.36 4365 0.27 3721 0.37 4474
14
Table 6: GDP and Welfare Effects for Korea’s Different FTAs
(Continued)
Static CGE Model Dynamic CGE Model
GDP Welfare GDP Welfare
% Millions
of US $
% Millions
of US $
% Millions
of US $
% Millions
of US $
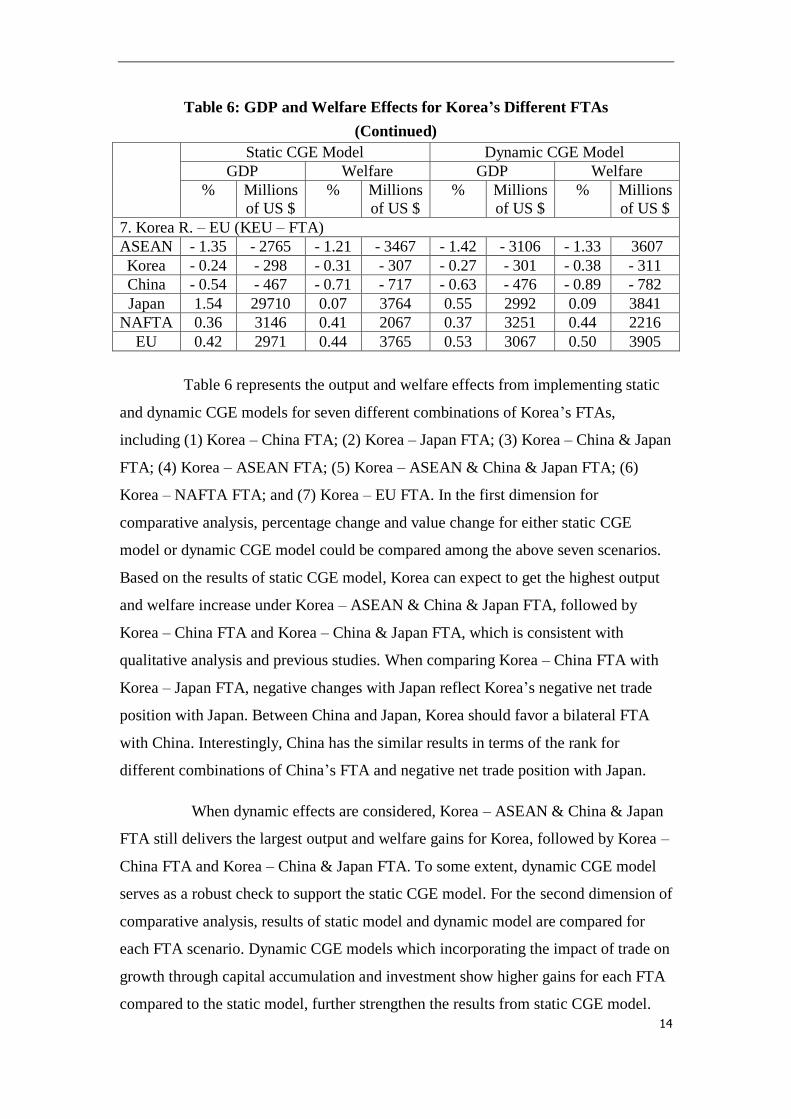
7. Korea R. – EU (KEU – FTA)
ASEAN - 1.35 - 2765 - 1.21 - 3467 - 1.42 - 3106 - 1.33 3607
Korea - 0.24 - 298 - 0.31 - 307 - 0.27 - 301 - 0.38 - 311
China - 0.54 - 467 - 0.71 - 717 - 0.63 - 476 - 0.89 - 782
Japan 1.54 29710 0.07 3764 0.55 2992 0.09 3841
NAFTA 0.36 3146 0.41 2067 0.37 3251 0.44 2216
EU 0.42 2971 0.44 3765 0.53 3067 0.50 3905
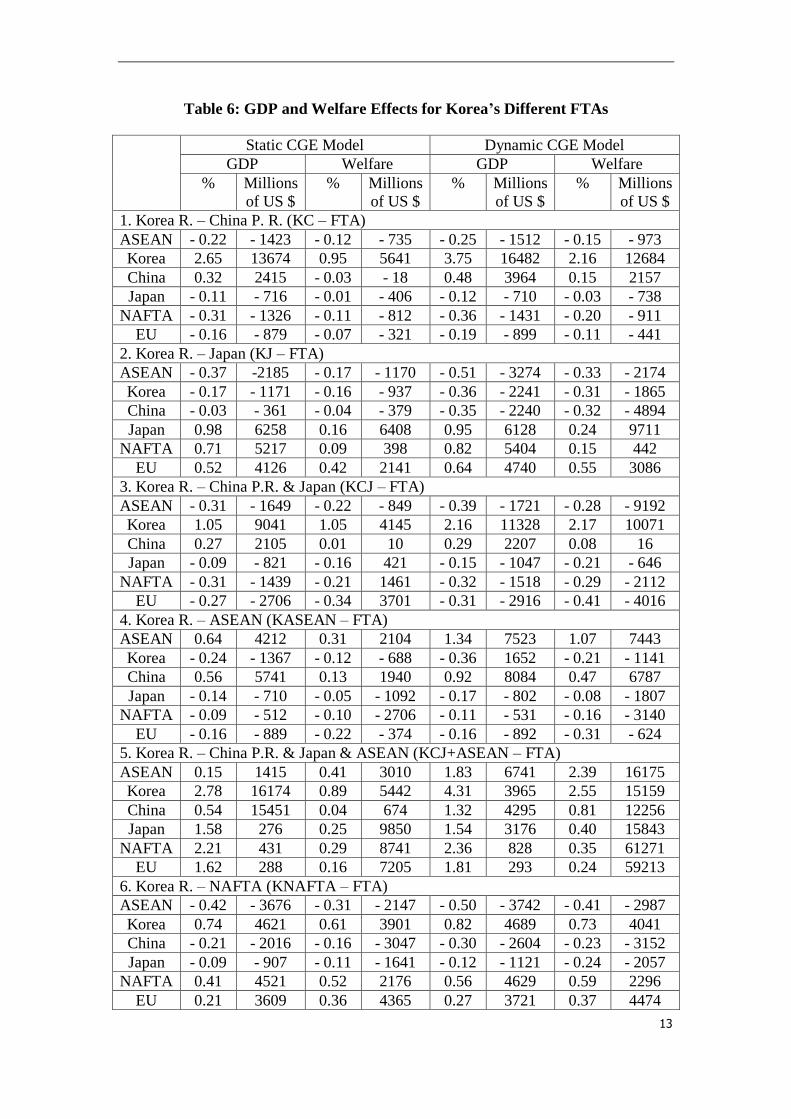
Table 6 represents the output and welfare effects from implementing static
and dynamic CGE models for seven different combinations of Korea’s FTAs,
including (1) Korea – China FTA; (2) Korea – Japan FTA; (3) Korea – China & Japan
FTA; (4) Korea – ASEAN FTA; (5) Korea – ASEAN & China & Japan FTA; (6)
Korea – NAFTA FTA; and (7) Korea – EU FTA. In the first dimension for
comparative analysis, percentage change and value change for either static CGE
model or dynamic CGE model could be compared among the above seven scenarios.
Based on the results of static CGE model, Korea can expect to get the highest output
and welfare increase under Korea – ASEAN & China & Japan FTA, followed by
Korea – China FTA and Korea – China & Japan FTA, which is consistent with
qualitative analysis and previous studies. When comparing Korea – China FTA with
Korea – Japan FTA, negative changes with Japan reflect Korea’s negative net trade
position with Japan. Between China and Japan, Korea should favor a bilateral FTA
with China. Interestingly, China has the similar results in terms of the rank for
different combinations of China’s FTA and negative net trade position with Japan.
When dynamic effects are considered, Korea – ASEAN & China & Japan
FTA still delivers the largest output and welfare gains for Korea, followed by Korea –
China FTA and Korea – China & Japan FTA. To some extent, dynamic CGE model
serves as a robust check to support the static CGE model. For the second dimension of
comparative analysis, results of static model and dynamic model are compared for
each FTA scenario. Dynamic CGE models which incorporating the impact of trade on
growth through capital accumulation and investment show higher gains for each FTA
compared to the static model, further strengthen the results from static CGE model.
15
V. Conclusion and Policy Implication
Under the background of globalization and polarization, challenges and
opportunities coexist for the growing trend of regionalism in recent international
economic environment. Most of the FTAs in the world tend to start with neighboring
countries which are close to each other in terms of income and development level,
history and geography, for example, ASEAN, NAFTA and EU, and then spread to
adjacent regions and areas through contagion effects.
The objective of this paper is to compare and assess Korea’s 7 possible
FTAs involving major economies in the world: China P. R., Korea, Japan, ASEAN,
NAFTA and EU, qualitatively and quantitatively. According to the results of
comparative analysis in two different dimensions, Korea would benefit most from a
Korea – China & Japan & ASEAN FTA, which is the largest possible FTA in East
Asia. This major finding is consistent with previous CGE model studies that have
found that broader FTAs generate higher output and welfare gains for member
countries. From the perspective of Korea, strengthening trade links with the East
Asian neighbors, especially with China, through FTAs offers the opportunities to
enhance Korea’s economic and political position in the Asian region. Korea, China
P.R., Japan, and ASEAN can leverage their common market to reduce their heavy
dependence on exports to the United States and European Union, which would also
contribute to the discussion of decoupling hypothesis and the solution for the problem
of current global account imbalances.
In the path to reach region – wide Korea – China & Japan & ASEAN FTA,
since the process is usually gradual and complex, Korea can keep bilateral FTA as
medium – term trade strategy and pursue region – wide FTA as a long – term trade
strategy. To realize an ideal FTA, political dialogue is also necessary to promote
optimal economic results for each member in an FTA.
Future research direction for this research could disaggregate
macroeconomic effects into different sectors or industry levels to do comparison and
do assessment from the perspective of different trading partners to figure out an
optimal FTA solution for Korea and the global economy.
16
Reference
Abe, K. (2003), “Economic Effects of a Possible FTA among China, Japan and
Korea”, in Y. S. Kim and C. K. Lee (Eds.), Northeast Asian Economic
Integration: Prospects for a Northeast Asian FTA, Korea Institute for
International Economic Policy, Conference Proceedings 03-05.
Estrada, G., D. Y. Park, I. W. Park, and S. C. Park (2012), “The PRC’s Free Trade
Agreements with ASEAN, Japan, and the Republic of Korea: A Comparative
Analysis”, Asian Development Bank Working Paper Series on Regional
Economic Integration, No. 92
Hertel, T.W., T. L. Walmsley, and K. Itakura (2001), “Dynamic Effects of the New
Age Free Trade Agreement between Japan and Singapore”, GTAP working
paper
Ko, J.W. (2000), “Analysis of Economic Effects of a Free Trade Agreement among
Korea, China, and Japan”, International Area Studies Review, Vol. 4, No. 2,
pp. 177-209.
Lee, C. J. et al. (2005), “Rationale for a China-Japan-Korea FTA and Its Impact on
the Korean Economy”, Korea Institute for International Economic Policy,
NRCS Joint Research Series on FTA Issues 05-04.
Lee, J. W. (2002), “Economic Impacts in Northeast Asia: The Perspective of a China-
Japan-Korea FTA”, Journal of Korea Trade, Vol. 6, No. 2, pp. 155-188.
Park, I. W. (2004), “A CGE Analysis of a Korea-China-Japan Free Trade Area”,
Economic Papers, Vol. 6, No. 2, pp. 151-186.
Tongzon, J. L. (2001), “China’s Membership in the World Trade Organization (WTO)
and the Exports of the Developing Economies of East Asia: A Computable
General Equilibrium Approach”, Applied Economics, Vol. 33, pp. 1943-1959.
Yoon, Y. M., and T. D. Yeo (2007), “Trade Structures and Relations among China,
Japan, and Korea”, Journal of the Korean Economy, Vol. 8, No. 1, pp. 1-24.
Yoon, Y. M,. C. Gong, and T. D. Yeo (2009), “A CGE Analysis of Free Trade
Agreement among China, Japan and Korea”, Journal of Korea Trade, Vol. 12,
No. 1, February 2009, 45-64