Embed Size (px)
Citation preview

International Review of Business Research Papers
Vol. 9. No. 3. March 2013 Issue. Pp. 1 – 21
Changes in Comparative Advantage of South Korea and Her Major Trading Countries*
Seung Jin Kim**
South Korea and her major trading countries (i.e., China, the USA, and Japan) are now suffering from an economic recession, which can be overcome by further expanding trade volumes among these four countries. For this purpose, this paper will analyze how comparative advantage of these four countries in 35 industries of the manufacturing sector changed over time for the period of 1999-2009. It was found that export products of China are the most concentrated for the period of 1999-2009. This concentration of Chinese export products is followed by Japan, South Korea, and the USA in that order. Since this kind of high concentration of export products is not desirable, it should be diversified to avoid any potential economic loss associated with unfavorable trade-environmental changes against these concentrated export products. Export patterns of South Korea changed faster than those of the USA, China, and Japan for the period of 1999-2009. On the other hand, export patterns of Japan remained the most stable in the same period. Therefore both South Korea and CUJ (i.e., China, the USA, and Japan in short hereafter) should fully adjust their economies to ever-changing patterns of their exports. It was found that South Korea’s export patterns do not resemble those of China due to the differences in factor endowment ratios of China and South Korea. Therefore South Korea can increase her exports to China by exploiting non-similarity of South Korean and Chinese export patterns. Both UJ (i.e., the USA and Japan in short hereafter) and South Korea had similar export patterns due to the resemblances in factor endowment ratios of UJ and South Korea. Especially, South Korean export patterns became increasingly similar to Japanese export patterns and South Korean products’ competition with Japanese products in the world export market became increasingly severe. Therefore both UJ and South Korea should cooperate in exporting their products in the world market. It was found that South Korea exported products which are less skilled human capital intensive and more R&D intensive for the entire period of 1999-2009. For the case of China, less skilled human capital intensive and less R&D intensive products were found to be exported for the same period. Therefore both South Korea and China should try to export more of these products to the world market from now on. It was found that both the USA and Japan exported products which are more R&D intensive for the entire period of 1999-2009. Therefore both the USA and Japan should try to export more of these products to the world market from now on.
JEL Codes: F11, F13 and F14
1. Introduction The economy of South Korea has experienced dramatic changes during the last four decades. From a typical, underdeveloped agrarian economy of 1950s, South Korea emerged on the world stage as one of the front runners among the NIEs (Newly Industrializing Economies) in 1980s and now becomes one of the major exporting countries of automobiles, iron and steel, electronic products, shipbuilding, and petrochemical products. This outstanding economic achievement is truly remarkable ---------------------------------------------------- * This work was supported by Hankuk University of Foreign Studies Research Fund of 2013. **Prof. Seung Jin Kim, Dept. of International Economics and Law, Hankuk University of Foreign Studies, 270 Imundong, Dongdaemunku, Seoul 130-791, South Korea. Email: [email protected]

Kim
2
considering the poor endowment of natural resources and the small domestic market. For this reason, the economic development strategy of South Korea has been frequently referred to as a suitable model for other countries on the road to development. According to Economic Statistics System of the Bank of Korea (i.e., ecos.bok.or.kr), China made an economic miracle by achieving 10.5% GDP growth rate on average for the last decade and has now been the second biggest country next to the USA in terms of a size of GDP from 2010 on, even if her growth rate slowed down last year. The USA, however, has been suffering from a so-called global economic crisis by recording -0.3% and -3.1% GDP growth rate in 2008 and 2009 respectively ever since a sudden collapse of Lehman Brothers in September 2008. Japan has also been suffering from a global economic crisis by making -5.5% and -0.9% GDP growth rate in 2009 and 2011 respectively. According to Korean Trade Statistics published by the Korean International Trade Association (KITA) (i.e., kita.net), South Korean exports to China in 2011 amounted to US$ 134.19 billion (i.e., 24.2% of South Korea’s total exports) and South Korean imports from China reached US$ 86.43 billion (i.e., 16.5% of South Korea’s total imports). Accordingly, South Korea enjoyed US$ 47.75 billion trade surplus with China. In 2011 South Korean exports to the USA amounted to US$ 56.21 billion (i.e., 10.1% of South Korea’s total exports) and South Korean imports from the USA reached US$ 44.57 billion (i.e., 8.5% of South Korea’s total imports). Accordingly, South Korea enjoyed US$ 11.64 billion trade surplus with the USA. On the other hand, South Korean exports to Japan in 2011 amounted to US$ 39.68 billion (i.e., 7.1% of South Korea’s total exports) and South Korean imports from Japan reached US$ 68.32 billion (i.e., 13.0% of South Korea’s total imports). Consequently, South Korea suffered from US$ 28.64 billion trade deficit with Japan. Despite of a very close trade between South Korea and her major trading countries (i.e., China, the USA, and Japan, CUJ in short hereafter), they are now suffering from an economic recession engendered by a so-called an EU sovereign debt crisis. Therefore one way of overcoming the on-going economic recession in these 4 countries will be to further expand trade volumes among these countries. In this respect, it is very timely to analyze how comparative advantage of South Korea and her major trading countries in the manufacturing sector changed over time for the period of 1999-2009. For this purpose, Section 2 will briefly survey a revealed comparative advantage (RCA in short hereafter) index developed by Balassa (1965) and methodology and research design of this paper will be suggested in Section 3. Section 4 will measure RCA (Revealed Comparative Advantage) indices of South Korea and her major trading countries in the manufacturing sector for the period of 1999-2009 by using OECD (2011) trade matrix. On top of this, Section 4 will also try to find the determinants of RCA indices of South Korea, China, USA, and Japan in the manufacturing sector for the last decade by utilizing both correlation coefficients and multiple regression analyses, which was never attempted in the previous papers

Kim
3
(Kim (2002, 2010) and others). Accordingly this paper is the first attempt which tries to analyze the RCA determinants of South Korea and her major trading countries for the period of 1999-2009 so far. Section 5 will summarize major empirical results and conclude the paper with a few remarks.
2. Literature Review 2.1 Heckscher-Ohlin Theorem (i.e., Modern Version of Comparative Advantage
Theorem) According to the Heckscher-Ohlin type of two-country-two-product-two-factor model, trade patterns between countries will be determined by the comparative advantage structures between the two countries, determined by factor intensities of two products and factor endowment ratios of two countries. For example, Korea is relatively labor abundant and the USA is relatively capital abundant. Suppose that a product of X1 is relatively labor intensive and a product of X2 is relatively capital intensive. Then Korea has a comparative advantage in the production of X1 and the USA has a comparative advantage in the production of X2 since before trade Korea can produce X1 at a lower cost vis-à-vis the USA and the USA can produce X2 at a lower cost vis-à-vis Korea. Since it is not so easy to measure prices of X1 and X2 empirically in an actual world due to heterogeneity of those products, Balassa (1965) introduced an RCA index as shown in Section 2.2. 2.2 Revealed Comparative Advantage (RCA) Index To measure the international competitiveness of the i-th industry in the j-th country, Balassa (1965) suggested an RCA index as follows:
RCAij = ((EXi
j/ WEXi) / (TEXj/TWEX ))· 100 -------------- (2-1)
where RCAi
j is an RCA index of the i-th industry in the j-th country,
EXij is the i-th industry's export value of the j-th country,
WEXi is the world's export value of the i-th industry, TEXj is the total export value of the j-th country, TWEX is the world's total export value.
As obvious in the above equation, the j-th country will have a comparative advantage in the i-th industry if the value of RCAi
j is greater than 100. On the contrary, the j-th country will have a comparative disadvantage in the i-th industry if the value of RCAi
j
is less than 100. Due to convenience of calculating an RCA index, some trade-related papers utilized the RCA index for measuring comparative advantage structure of trading countries. As stated above, this paper will not only measure RCA indices themselves but also try to find the determinants of RCA indices, which is the first attempt of its kinds.

Kim
4
3. Data and Methodology
3.1 Data To calculate RCA indices of South Korea, China, USA, and Japan in the manufacturing sector for the period of 1999-2009, we used the OECD (2011) trade matrix, which reports all the trade data between each and every OECD member country and non-member countries of OECD from the viewpoint of OECD member countries. (Since South Korea has been a member country of OECD ever since 1990s, it is quite appropriate for us to use an OECD trade matrix.) As shown in Table 1, our basic sample of industries for the manufacturing sector consists of 35 industries at a SITC 2-digit level, which is an optimal sample size for our research. On top of that, the OECD trade matrix is now published for these 35 manufacturing industries. The classification of manufactured products by factor intensity and end uses is also listed in Table 2.
Table 1: List of 35 Industries in Manufacturing Sector
SITC Code
Name of Industry SITC Code
Name of Industry
51 Organic Chemicals 71 Power Generating Machinery
And Equipment
52 Inorganic Chemicals 72 Specialized Machinery
53 Dyeing, Tanning
And Coloring Materials 73 Metal Working Machinery
54 Medicinal and Pharmaceutical Pro
ducts 74
Other Industrial Machinery and Parts
55 Essential Oils and Perfume Materials 75 Office Machines
And ADP Equipment
56 Fertilizers 76 Telecommunications
And Sound Recording Apparatus
57 Plastics in Primary Forms 77 Electrical Machinery, Apparatus
And Appliances, n.e.s.
58 Plastics in Non-primary Forms 78 Road Vehicles
59 Chemical Materials and Products,
n.e.s. 79 Other Transport Equipments
61 Leather, Leather Manufactures
And Dressed Furskins 81
Prefabricated Buildings, Sanitary, Heating and Lighting Fixtures,
n.e.s.
62 Rubber Manufactures, n.e.s. 82 Furniture and Parts Thereof
63 Cork and Wood Manufactures
(excluding Furniture) 83 Travel Goods, Handbags, etc.
64 Paper and Paper Manufactures 84 Articles of Apparel
And Clothing Accessories
65 Textile Yarn, Fabrics and Related
Products 85 Footwear
66 Non-metallic Mineral Manufactures,
n.e.s. 87
Professional and Scientific Instruments, n.e.s.
67 Iron and Steel 88 Photo Apparatus, Optical Goods,
Watches and Clocks
68 Non-ferrous Metals 89
Miscellaneous Manufactured Articles, n.e.s. 69 Manufactures of Metal, n.e.s.

Kim
5
Table 2: Classification of Manufactured Products by Factor Intensity and End Uses
SITC 2 digit Code
1) Labor-Intensive Products 61 63 65 66 69 76 81 82 83 84 85 89
2) Capital/Technology-Intensive Products
51 52 53 54 55 56 57 58 59 62 64 66 67 68 71 72 73 74 75 76 77 78 79 86 87 88 89
3) Nondurable Consumer Products 55 57 65 83 84 85 86 88 89
4) Durable Consumer Products 66 69 76 77 78 81 82 88 89
5) Capital Goods 69 71 72 73 74 75 77 78 79 87 88
6) Labor-Intensive Intermediate Products
61 63 65 66 69
7) Capital-Intensive Intermediate Products
51 52 53 54 55 56 58 59 62 64 66 67 68 88
Source: Ministry of International Trade and Industry, Government of Japan, White Paper on International Trade (1986: 405-406).
3.2 Methodology In order to find major determinants of RCA of South Korea, China, USA, and Japan in the manufacturing sector for the period of 1999-2009, the following correlation coefficients and multiple regression analyses are used. The models for correlation analysis are as follows. RCAj = f(PKL), RCAj = f(SHKL), RCAj = f(RD)---------------------------(3-1) where RCAj is the country j-th RCA index,
PKL is a physical capital intensity defined as (physical capital)/(labor)ratio, SHKL is a skilled human capital intensity defined as (skilled human
capital)/(labor), RD is an R&D intensity defined as (R&D related expenditure)/(total sales value),
j = k(South Korea), c(China), u(USA), and j(Japan).
To be specific, our correlation analysis model and hypotheses are as follows. RCAk = f(PKL), RCAk = f(SHKL), RCAk = f(RD) ? - + RCAc = f(PKL), RCAc = f(SHKL), RCAc = f(RD) - - - RCAu = f(PKL), RCAu = f(SHKL), RCAu = f(RD) ? ? + RCAj = f(PKL), RCAj = f(SHKL), RCAj = f(RD) ? ? + (Notice that the sign below an independent variable is an expected sign by our model, which are our hypotheses.) For the multiple regression, the following log-linear models are estimated by OLS (ordinary least squares) method with assumption of no multicollinearity.
log (RCAj)=A1+A2·log(PKL)+A3·log(SHKL)+A4·log(RD)--------(3-2)

Kim
6
Since independent variables of PKL and SHKL are highly correlated with each other, only SHKL and RDI are used in the process of multiple regression to overcome the multicollinearity problem as follows.
log (RCAj)=A1+A2·log(SHKL)+A3·log(RD)-------------------------(3-3)
To be specific, our multiple regression analysis model and hypotheses are as follows. log (RCAk)=A1+A2·log(SHKL)+A3·log(RD)
- + log (RCAc)=A1+A2·log(SHKL)+A3·log(RD)
- - log (RCAu)=A1+A2·log(SHKL)+A3·log(RD)
? + log (RCAj)=A1+A2·log(SHKL)+A3·log(RD)
? + (Notice that the sign below an independent variable is an expected sign by our model, which are our hypotheses.)
Repeatedly, this study on the determinants of RCA indices of the above-mentioned four countries in the last decade by utilizing both correlation coefficients and multiple regression analyses was not attempted in the previous papers (Kim (2002, 2010) and others) and accordingly this paper is the first attempt which tries to analyze the RCA determinants of South Korea and her major trading countries for the period of 1999-2009 so far.
4. Findings 4.1 Changes in RCA of South Korea and her Major Trading Countries in the
Manufacturing Sector The commodities whose RCA indices are within the 5th rank in both South Korea and her major trading countries for the period of 1999-2009 are listed in Table 3.

Kim
7
Table 3: List of Industries Whose RCA Indices are Within the 5th Rank in South Korea and Her Major Trading Countries: 1999-2009
Country Year SITC 2-digit code in each rank
1st rank 2nd rank 3rd rank 4th rank 5th rank
South Korea 1999 77 75 76 65 67 2000 75 77 76 65 67 2001 76 75 77 65 62 2002 76 75 77 62 65 2003 76 77 75 79 62 2004 76 77 75 79 62 2005 76 77 62 78 79 2006 76 79 87 77 62 2007 76 87 77 62 73 2008 76 79 77 62 73 2009 76 79 77 62 67
China 1999 83 85 81 84 89 2000 83 85 81 84 89 2001 83 85 81 84 89 2002 83 85 81 84 89 2003 83 85 81 89 84 2004 83 85 81 75 84 2005 83 85 84 81 82 2006 83 85 75 84 81 2007 83 85 75 84 82 2008 83 85 84 82 76 2009 83 85 75 84 76
USA 1999 79 71 59 77 58 2000 79 87 71 59 77 2001 87 79 71 59 77 2002 79 87 71 59 77 2003 79 71 87 59 58 2004 79 87 71 59 57 2005 79 87 71 59 57 2006 79 87 71 59 57 2007 79 87 71 59 72 2008 79 87 71 59 57 2009 79 87 71 59 54
Japan 1999 73 88 78 76 72 2000 73 88 78 72 77 2001 73 88 78 72 76 2002 73 88 78 72 76 2003 73 88 78 72 76 2004 73 88 78 72 87 2005 73 88 78 72 87 2006 73 88 78 72 87 2007 73 88 78 72 87 2008 73 78 88 72 62 2009 88 73 78 72 58
Throughout the entire period, South Korea has comparative advantage in the production of commodities which are (a) relatively labor-intensive, such as textile yarn, fabrics and related products (SITC 65) and (b) relatively capital/technology-intensive, such as telecommunications and sound recording apparatus (SITC 76), electrical machinery, apparatus and appliances, n.e.s. (SITC 77), rubber manufactures, n.e.s. (SITC 62), other transport equipments (SITC 79), office machines and ADP equipment (SITC 75), iron and steel (SITC 67), professional and scientific instruments, n.e.s. (SITC 87), metal working machinery (SITC 73), and

Kim
8
road vehicles (SITC 78) (refer to Table 2 for the classification of manufactured products by factor intensity and end uses. Also notice that in order to save the space of this paper only SITC code will be listed from now on. Look at Table 1 for the name of each SITC code listed). On the other hand, China has comparative advantage in the production of commodities which are (a) relatively labor-intensive, such as SITC 83, SITC 85, SITC 81, SITC 84, SITC 82, and SITC 89 and (b) relatively capital/technology-intensive, such as SITC 75 and SITC 76. Throughout the entire period, the USA has comparative advantage in the production of commodities which are relatively capital/technology-intensive, such as SITC 79, SITC 87, SITC 71, SITC 59, SITC 77, SITC 57, SITC 58, SITC 72, and SITC 54. On the other hand, Japan has comparative advantage in the production of commodities which are relatively capital/technology-intensive, such as SITC 73, SITC 88, SITC 78, SITC 72, SITC 76, SITC 87, SITC 58, SITC 62, and SITC 77. The numbers of industries whose RCA indices are greater than 100 and standard deviation of RCA Indices in both South Korea and her major trading countries for the period of 1999-2009 are listed in Table 4. Throughout the entire period, the USA has comparative advantage in 19.1 industries while South Korea has comparative advantage in 11.5 industries on the average during the period of 1999-2009. This means that the USA has comparative advantage in the more diversified industries than South Korea during the period of 1999-2009. As for an average value of standard deviation of each country's RCA during the period of 1999-2009, South Korea has the bigger value (i.e., 83.2) than the USA (i.e., 63.2). This again means that South Korea's export products are highly concentrated, while the US export products are more diversified. (As shown in pp. 65-66 in Yamazawa (1970), it can be easily demonstrated that the lower the standard deviation of RCA indices (i.e., export specialization indices) of a certain country, the more diversified the export specialization pattern of the country.) Furthermore, South Korea's standard deviation of her RCA increased from 67.5 in 1999 to 100.8 in 2009, which means that the South Korean exports became more concentrated over time in the period of 1999-2009.

Kim
9
Table 4: Numbers of Industries Whose RCA Indices are Greater Than 100 and Standard Deviation of RCA Indices in South Korea and Her Major
Trading Countries: 1999-2009 Year # of
Indices Industries are
Whose greater
RCA than 1*
Standard Deviation of RCA
South Korea
China USA Japan South Korea
China USA Japan
1999 11 15 17 11 67.5 199.9 54.4 81.9 2000 10 15 19 11 66.1 194.5 55.9 88.1 2001 11 15 18 13 68.1 180.2 55.8 90.3 2002 10 15 18 13 73.8 169.3 59.8 89.2 2003 9 14 18 13 82.8 157.5 64.1 96.4 2004 10 13 20 13 85.3 149.0 68.3 99.3 2005 12 13 22 14 85.3 141.7 68.3 105.0 2006 12 14 21 14 91.3 141.2 68.6 104.9 2007 13 14 20 13 92.1 135.6 68.1 102.9 2008 14 12 19 12 102.6 136.9 66.8 113.1 2009 14 14 18 16 100.8 126.8 65.5 101.9
Average 11.5 14.0 19.1 13.0 83.2 157.5 63.2 97.5 * 1 means 100% here.
On the other hand, Japan and China have the bigger value in standard deviation of their RCA (i.e., 97.5 and 157.5 respectively) than South Korea. This means that export products of Japan and China are highly concentrated, while South Korean export products are more diversified. (Repeatedly, it should be noted that the lower the standard deviation of RCA index of a certain country, the more diversified the export specialization pattern of the country, which was proved in pp. 65-66 in Yamazawa (1970).) Furthermore, Japan's standard deviation of her RCA increased from 81.9 in 1999 to 101.9 in 2009, which means that the Japanese exports became more concentrated over time in the period of 1999-2009. China's standard deviation of her RCA, however, decreased from 199.9 in 1999 to 126.8 in 2009, which means that the Chinese exports became more diversified over time in the period of 1999-2009. As shown in Table 5, the Spearman (rank-order) correlation coefficient between 2009 RCA index and 1999 RCA index has the highest value in Japan (i.e., 0.93), which is followed by China (i.e., 0.92), the USA (i.e., 0.73), and South Korea (i.e., 0.67). This means that export patterns of South Korea changed faster than those of the USA, China, and Japan for the period of 1999-2009. On the other hand, export patterns of Japan remained the most stable in the same period.

Kim
10
Table 5: Spearman Correlation Coefficients Between 2009 RCA Index and Respective Year’s RCA Indices of South Korea and Her Major Trading
Countries: 1999-20081)
Year South Korea China USA Japan
1999 0.67*** 0.92*** 0.73*** 0.93*** 2000 0.70*** 0.93*** 0.86*** 0.94*** 2001 0.70*** 0.93*** 0.89*** 0.95*** 2002 0.77*** 0.95*** 0.90*** 0.95*** 2003 0.82*** 0.94*** 0.95*** 0.96*** 2004 0.89*** 0.95*** 0.95*** 0.96*** 2005 0.88*** 0.90*** 0.96*** 0.97*** 2006 0.92*** 0.98*** 0.95*** 0.97*** 2007 0.97*** 0.97*** 0.98*** 0.97*** 2008 0.96*** 0.83*** 0.99*** 0.94*** 1) ‘*’ indicates that the coefficients are statistically significant at the 10 percent level, ‘**’ 5 percent level, and ‘***’ 1 percent level, respectively. The same notation will be used hereafter.
Table 6 displays the Spearman correlation coefficients between South Korea's 2009 RCA index and respective year's RCA index of CUJ (i.e., China, the USA, Japan in short hereafter). By looking at this table, we can guess which year of CUJ’s export patterns the South Korean export patterns most likely resemble. South Korea’s 2009 RCA index has insignificant Spearman correlation coefficients with China for the period of 2005-2009. This means that South Korea’s export patterns do not resemble those of China due to the differences in factor endowment ratios of South Korea and China. On the other hand, South Korea's 2009 RCA index has positively significant Spearman correlation coefficients with UJ (i.e., the USA and Japan in short hereafter) throughout the entire period of 1999-2009. This means that both UJ and South Korea had similar export patterns due to the resemblances in factor endowment ratios of UJ and South Korea. Furthermore, South Korea's 2009 RCA index has the highest Spearman correlation coefficient with Japan's 2003 RCA index. This implies that export patterns of South Korea in 2009 were more similar to those of Japan in the early 2000s than in the mid-2000s. Table 6: Spearman Correlation Coefficients Between South Korea’s 2009 RCA
Index and Respective Year’s RCA Indices of the USA, Japan, and China: 1999-2009
Year South Korea’s 2009
and China’s Respective Year
South Korea’s 2009 and USA’s Respective Year
South Korea’s 2009 and Japan’s Respective Year
1999 -0.35** 0.44*** 0.78*** 2000 -0.33* 0.55*** 0.78*** 2001 -0.36** 0.51*** 0.78*** 2002 -0.33* 0.52*** 0.78*** 2003 -0.33* 0.44*** 0.79*** 2004 -0.29* 0.39** 0.77*** 2005 -0.28 0.39** 0.76*** 2006 -0.24 0.41** 0.76*** 2007 -0.23 0.41** 0.78*** 2008 -0.11 0.37** 0.76*** 2009 -0.15 0.34** 0.78***

Kim
11
The Spearman correlation coefficients between South Korea's RCA index and CUJ RCA indices respectively in the period of 1999-2009 are displayed in Table 7. South Korea's RCA index has insignificant correlation coefficients with China's RCA index for the period of 1999-2009, which means that South Korean export pattern is not similar to China's export patterns. This implies that South Korea can increase her exports to China by exploiting non-similarity of South Korean and Chinese export patterns. The correlation coefficients between South Korea’s RCA index and the US RCA index, however, are positively significant for the period of 2006-2009. Furthermore, the correlation coefficients between South Korea’s RCA index and Japan’s RCA index are positively significant for the entire period of 1999-2009. This again means that both UJ and South Korea had similar export patterns due to the resemblances in factor endowment ratios of UJ and South Korea. Especially, South Korean export patterns became increasingly similar to Japanese export patterns over time for the period of 1999-2009 and accordingly South Korean products’ competition with Japanese products in the world export market became increasingly severe. Table 7: Spearman Correlation Coefficients between South Korea’s RCA Index
and Her Major Trading Countries’ RCA Index: 1999-2009
Year Korea and China Korea and the USA Korea and Japan
1999 0.18 0.12 0.47***
2000 0.16 0.15 0.46***
2001 0.11 0.14 0.49***
2002 0.03 0.24 0.55***
2003 -0.07 0.23 0.60***
2004 -0.08 0.20 0.67***
2005 -0.09 0.17 0.63***
2006 -0.12 0.32* 0.70***
2007 -0.15 0.38** 0.82***
2008 -0.11 0.34** 0.71***
2009 -0.15 0.34** 0.78***
4.2 RCA Determinants of South Korea and her Major Trading Countries in the
Manufacturing Sector 4.2.1 RCA Determinants of South Korea For the entire period of 1999-2009, an RCAk variable has (a) negative correlation coefficients with PKL and SHKL and (b) positive correlation coefficients with RD (Table 8).i Furthermore, significantly negative correlation coefficients were found in the cases of both simple and Spearman rank correlation coefficients between RCAk and SHKL for the period of 1999-2002, which means that South Korea exported products which are less skilled human capital intensive for those years. On top of that, significantly positive correlation coefficients were found in the cases of both simple and Spearman rank correlation coefficients between RCAk and RD for the period of 2002-2009, which means that South Korea exported more R&D intensive products for the period.ii

Kim
12
Table 8: Correlation Coefficients Between RCAk and Industrial Characteristics Variables: 1999-2009
Year Industrial Characteristics Variables related to RCA
k
PKL SHKL RD
1999 Simple -0.19 -0.40** 0.06 Spearman -0.24 -0.39** 0.10
2000 Simple -0.18 -0.34** 0.19 Spearman -0.20 -0.32* 0.15
2001 Simple -0.18 -0.36** 0.19 Spearman -0.17 -0.33** 0.19
2002 Simple -0.18 -0.32* 0.30* Spearman -0.13 -0.30* 0.27
2003 Simple -0.17 -0.28 0.39** Spearman -0.06 -0.22 0.33*
2004 Simple -0.15 -0.25 0.40** Spearman -0.06 -0.15 0.38**
2005 Simple -0.14 -0.21 0.39** Spearman -0.11 -0.12 0.33*
2006 Simple -0.13 -0.18 0.52*** Spearman -0.05 -0.11 0.37**
2007 Simple -0.14 -0.20 0.33** Spearman -0.03 -0.05 0.43**
2008 Simple -0.06 -0.14 0.53*** Spearman 0.12 0.03 0.47***
2009 Simple -0.09 -0.13 0.57*** Spearman 0.09 0.05 0.51***
According to multiple regressions results of South Korea, the coefficients of SHKL and RD turn out to be significantly negative and positive respectively for the entire period of 1999-2009 (Table 9). This proves that South Korea exported products which are less skilled human capital and more R&D intensive for the entire period of 1999-2009.

Kim
13
Table 9: Multiple Regression with log (RCAk) as a Dependent Variable: 1999-2009
Year Independent variables Constant Test Stat.
log (SHKL) log (RD) R2 F test Prob>F
1999 2000 2001 2002 2003 2004 2005 2006 2007 2008 2009
-1.02*** (0.265) -0.99*** (0.277) -1.01*** (0.271) -0.98*** (0.273) -1.00*** (0.288) -0.92*** (0.299) -0.73** (0.350) -0.85** (0.336) -0.79** (0.322) -0.65* (0.322) -0.60* (0.305)
0.38** (0.177) 0.47** (0.185) 0.51*** (0.181) 0.60*** (0.182) 0.69*** (0.192) 0.75*** (0.199) 0.71*** (0.234) 0.83*** (0.224) 0.83*** (0.215) 0.85*** (0.215) 0.88*** (0.203)
3.53*** (0.221) 3.41*** (0.230) 3.40*** (0.225) 3.33*** (0.227) 3.19*** (0.239) 3.11*** (0.249) 3.17*** (0.291) 3.06*** (0.279) 3.13*** (0.267) 3.18*** (0.267) 3.21*** (0.254)
0.316 0.300 0.322 0.334 0.346 0.337 0.233 0.311 0.326 0.328 0.371
7.40 6.86 7.61 8.04 8.46 8.12 4.85 7.24 7.73 7.82 9.43
0.00 0.00 0.00 0.00 0.00 0.00 0.01 0.00 0.00 0.00 0.00
Note: Standard errors in parentheses. The same notation will be used hereafter.
4.2.2 RCA Determinants of China For the entire period of 1999-2009, a RCAc variable has significantly negative correlation coefficients with PKL, SHKL, and RD (Table 10), which means that China exported products which are less physical (and skilled human) capital intensive and less R&D intensive products for the period.iii

Kim
14
Table 10: Correlation Coefficients Between RCAc and Industrial Characteristics Variables: 1999-2009
Year Industrial Characteristics Variables related to RCA
c
PKL SHKL RD
1999 Simple -0.28 -0.38** -0.33* Spearman -0.57*** -0.55*** -0.50***
2000 Simple -0.30* -0.38** -0.35** Spearman -0.55*** -0.54*** -0.52***
2001 Simple -0.31* -0.39** -0.35** Spearman -0.54*** -0.52*** -0.52***
2002 Simple -0.33* -0.41** -0.34** Spearman -0.57*** -0.56*** -0.51***
2003 Simple -0.33* -0.41** -0.34** Spearman -0.56*** -0.54*** -0.52***
2004 Simple -0.34** -0.42** -0.34** Spearman -0.55*** -0.51*** -0.53***
2005 Simple -0.35** -0.45*** -0.36** Spearman -0.59*** -0.58*** -0.58***
2006 Simple -0.36** -0.45*** -0.35** Spearman -0.59*** -0.56*** -0.54***
2007 Simple -0.36** -0.44*** -0.35** Spearman -0.56*** -0.51*** -0.55***
2008 Simple -0.33* -0.46*** -0.32* Spearman -0.47*** -0.52*** -0.41**
2009 Simple -0.38** -0.47*** -0.31* Spearman -0.60*** -0.58*** -0.46***
According to multiple regressions results of China, the coefficients of SHKL and RD turn out to be significantly negative for the entire period of 1999-2009 (Table 11).iv This proves that China exported products which are less skilled human capital intensive and less R&D intensive for the entire period of 1999-2009.

Kim
15
Table 11: Multiple Regression with log (RCAc) as a Dependent Variable: 1999-2009
Year Independent variables Constant Test Stat.
log (SHKL) log (RD) R2 F test Prob>F
1999 2000 2001 2002 2003 2004 2005 2006 2007 2008 2009
-0.73** (0.332) -0.67** (0.317) -0.62* (0.310) -0.73** (0.306) -0.62** (0.299) -0.59* (0.295) -0.67** (0.257) -0.69** (0.266) -0.58** (0.262) -0.74** (0.272) -0.72*** (0.251)
-0.56** (0.221) -0.60*** (0.211) -0.57*** (0.206) -0.50** (0.204) -0.53** (0.200) -0.56*** (0.197) -0.53*** (0.171) -0.47** (0.178) -0.48*** (0.175) -0.26 (0.181) -0.33* (0.167)
4.47*** (0.276) 4.57*** (0.263) 4.58*** (0.257) 4.49*** (0.255) 4.56*** (0.249) 4.61*** (0.246) 4.57*** (0.214) 4.64*** (0.221) 4.73*** (0.218) 4.45*** (0.226) 4.57*** (0.208)
0.402 0.428 0.410 0.410 0.403 0.414 0.495 0.453 0.427 0.351 0.418
10.74 11.97 11.14 11.11 10.82 11.29 15.68 13.25 11.91 8.66 11.50
0.00 0.00 0.00 0.00 0.00 0.00 0.00 0.00 0.00 0.00 0.00
Note: Standard errors in parentheses. The same notation will be used hereafter.
4.2.3 RCA Determinants of the USA For the entire period of 1999-2009, a RCAu variable has positive correlation coefficients with PKL, SHKL, and RD (Table 12). Furthermore, significantly positive correlation coefficients were found in the cases of Spearman rank correlation coefficients (a) between RCAu and PKL for the entire period of 1999-2009 and (b) between RCAu and SHKL for the period of 2003-2009, which means that the USA exported products which are more physical (and skilled human) capital intensive. On top of that, significantly positive correlation coefficients were found in the cases of both simple and Spearman rank correlation coefficients between RCAu and RD for the entire period of 1999-2009, which means that the USA exported more R&D intensive products for the period.

Kim
16
Table 12: Correlation Coefficients Between RCAu and Industrial Characteristics Variables: 1999-2009
Year Industrial Characteristics Variables related to RCA
u
PKL SHKL RD
1999 Simple 0.12 0.08 0.73*** Spearman 0.38** 0.18 0.65***
2000 Simple 0.06 0.09 0.58*** Spearman 0.29* 0.21 0.64***
2001 Simple 0.05 0.08 0.56*** Spearman 0.34** 0.24 0.64***
2002 Simple 0.10 0.13 0.62*** Spearman 0.36** 0.28 0.61***
2003 Simple 0.14 0.16 0.62*** Spearman 0.42** 0.32* 0.63***
2004 Simple 0.16 0.19 0.66*** Spearman 0.44*** 0.33* 0.61***
2005 Simple 0.16 0.18 0.63*** Spearman 0.46*** 0.37** 0.60***
2006 Simple 0.15 0.18 0.62*** Spearman 0.45*** 0.37** 0.61***
2007 Simple 0.17 0.18 0.65*** Spearman 0.44*** 0.35** 0.63***
2008 Simple 0.17 0.18 0.63*** Spearman 0.46*** 0.37** 0.59***
2009 Simple 0.20 0.21 0.58*** Spearman 0.49*** 0.42** 0.59***
According to multiple regressions results of the USA, the coefficients of RD turn out to be significantly positive for the entire period of 1999-2009 (Table 13). This proves that the USA exported products which are more R&D intensive for the entire period of 1999-2009.

Kim
17
Table 13: Multiple Regression with log (RCAu) as a Dependent Variable: 1999-2009
Year Independent variables Constant Test Stat.
log (SHKL) log (RD) R2 F test Prob>F
1999 2000 2001 2002 2003 2004 2005 2006 2007 2008 2009
-0.14 (0.181) -0.07 (0.188) -0.05 (0.192) 0.01 (0.201) 0.06 (0.216) 0.09 (0.224) 0.12 (0.233) 0.14 (0.235) 0.11 (0.232) 0.16 (0.231) 0.22 (0.235)
0.54*** (0.120) 0.52*** (0.125) 0.53*** (0.128) 0.54*** (0.134) 0.55*** (0.144) 0.57*** (0.149) 0.55*** (0.155) 0.56*** (0.156) 0.59*** (0.154) 0.55*** (0.154) 0.54*** (0.157)
3.92*** (0.150) 4.06*** (0.156) 4.04*** (0.160) 4.02*** (0.167) 4.01*** (0.179) 4.02*** (0.186) 4.05*** (0.193) 4.05*** (0.195) 3.98*** (0.192) 4.03*** (0.192) 4.01*** (0.195)
0.417 0.394 0.396 0.402 0.394 0.397 0.376 0.382 0.406 0.392 0.391
11.46 10.42 10.48 10.77 10.38 10.52 9.62 9.88 10.93 10.31 10.25
0.00 0.00 0.00 0.00 0.00 0.00 0.00 0.00 0.00 0.00 0.00
Note: Standard errors in parentheses. The same notation will be used hereafter.
4.2.4 RCA Determinants of Japan For the entire period of 1999-2009, the results show positive relationships between a RCAj variable and RD variables (Table 14). Furthermore, significantly positive correlation coefficients were found in the cases of Spearman rank correlation coefficients between RCAj and RD, which means that Japan exported more R&D intensive products for the period.

Kim
18
Table 14: Correlation Coefficients Between RCAj and Industrial Characteristics Variables: 1999-2009
Year Industrial Characteristics Variables related to RCA
j
PKL SHKL RD
1999 Simple -0.04 -0.05 0.21 Spearman 0.16 0.13 0.62***
2000 Simple -0.05 -0.05 0.20 Spearman 0.14 0.13 0.62***
2001 Simple -0.04 -0.05 0.19 Spearman 0.17 0.13 0.63***
2002 Simple -0.03 -0.04 0.18 Spearman 0.18 0.13 0.62***
2003 Simple -0.04 -0.04 0.21 Spearman 0.18 0.14 0.63***
2004 Simple -0.05 -0.05 0.19 Spearman 0.16 0.13 0.62***
2005 Simple -0.04 -0.04 0.18 Spearman 0.18 0.14 0.61***
2006 Simple -0.04 -0.03 0.19 Spearman 0.19 0.15 0.62***
2007 Simple -0.04 -0.03 0.22 Spearman 0.18 0.14 0.62***
2008 Simple -0.10 -0.05 0.18 Spearman 0.13 0.11 0.61***
2009 Simple 0.03 -0.02 0.21 Spearman 0.26 0.20 0.62***
According to multiple regressions results of Japan, the coefficients of RD turn out to be significantly positive for the entire period of 1999-2009 (Table 15). This proves that Japan exported products which are more R&D intensive for the entire period of 1999-2009.
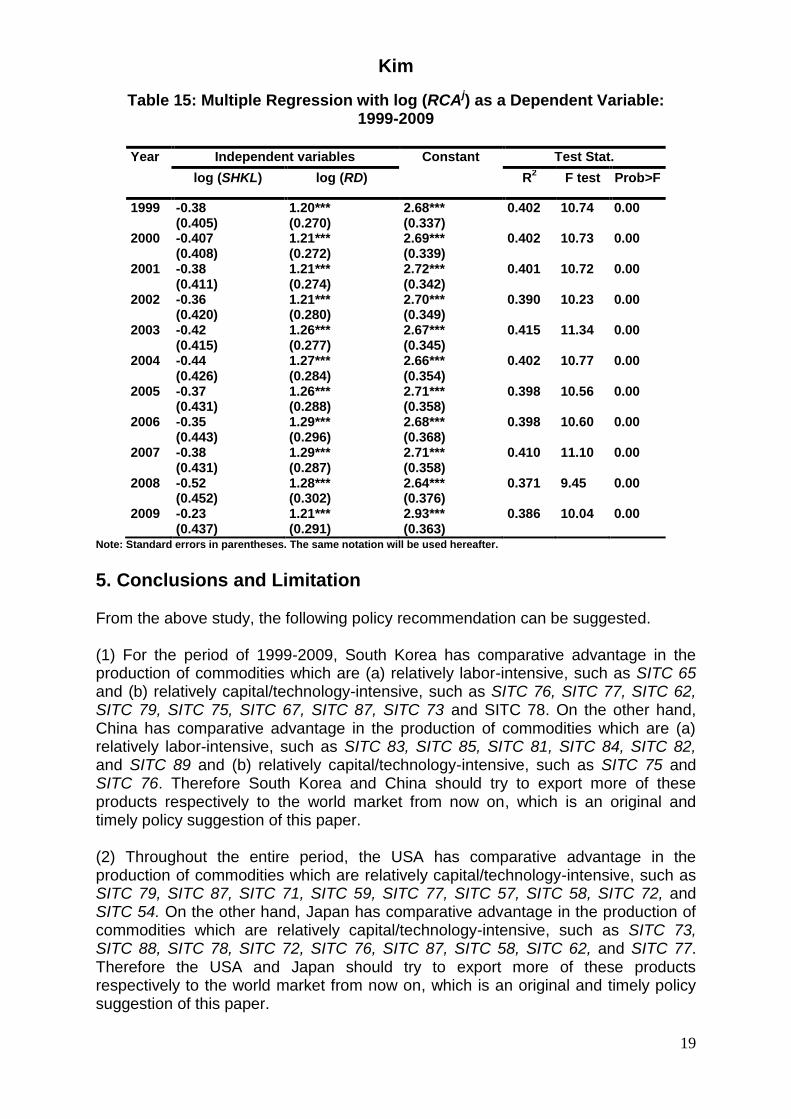
Kim
19
Table 15: Multiple Regression with log (RCAj) as a Dependent Variable: 1999-2009
Year Independent variables Constant Test Stat.
log (SHKL) log (RD) R2 F test Prob>F
1999 2000 2001 2002 2003 2004 2005 2006 2007 2008 2009
-0.38 (0.405) -0.407 (0.408) -0.38 (0.411) -0.36 (0.420) -0.42 (0.415) -0.44 (0.426) -0.37 (0.431) -0.35 (0.443) -0.38 (0.431) -0.52 (0.452) -0.23 (0.437)
1.20*** (0.270) 1.21*** (0.272) 1.21*** (0.274) 1.21*** (0.280) 1.26*** (0.277) 1.27*** (0.284) 1.26*** (0.288) 1.29*** (0.296) 1.29*** (0.287) 1.28*** (0.302) 1.21*** (0.291)
2.68*** (0.337) 2.69*** (0.339) 2.72*** (0.342) 2.70*** (0.349) 2.67*** (0.345) 2.66*** (0.354) 2.71*** (0.358) 2.68*** (0.368) 2.71*** (0.358) 2.64*** (0.376) 2.93*** (0.363)
0.402 0.402 0.401 0.390 0.415 0.402 0.398 0.398 0.410 0.371 0.386
10.74 10.73 10.72 10.23 11.34 10.77 10.56 10.60 11.10 9.45 10.04
0.00 0.00 0.00 0.00 0.00 0.00 0.00 0.00 0.00 0.00 0.00
Note: Standard errors in parentheses. The same notation will be used hereafter.
5. Conclusions and Limitation From the above study, the following policy recommendation can be suggested. (1) For the period of 1999-2009, South Korea has comparative advantage in the production of commodities which are (a) relatively labor-intensive, such as SITC 65 and (b) relatively capital/technology-intensive, such as SITC 76, SITC 77, SITC 62, SITC 79, SITC 75, SITC 67, SITC 87, SITC 73 and SITC 78. On the other hand, China has comparative advantage in the production of commodities which are (a) relatively labor-intensive, such as SITC 83, SITC 85, SITC 81, SITC 84, SITC 82, and SITC 89 and (b) relatively capital/technology-intensive, such as SITC 75 and SITC 76. Therefore South Korea and China should try to export more of these products respectively to the world market from now on, which is an original and timely policy suggestion of this paper. (2) Throughout the entire period, the USA has comparative advantage in the production of commodities which are relatively capital/technology-intensive, such as SITC 79, SITC 87, SITC 71, SITC 59, SITC 77, SITC 57, SITC 58, SITC 72, and SITC 54. On the other hand, Japan has comparative advantage in the production of commodities which are relatively capital/technology-intensive, such as SITC 73, SITC 88, SITC 78, SITC 72, SITC 76, SITC 87, SITC 58, SITC 62, and SITC 77. Therefore the USA and Japan should try to export more of these products respectively to the world market from now on, which is an original and timely policy suggestion of this paper.

Kim
20
(3) For the period of 1999-2009, export products of China are the most concentrated. This concentration of Chinese export products is followed by Japan, South Korea, and the USA in that order. Since this kind of high concentration of export products are not desirable, it should be diversified to avoid any potential economic loss associated with unfavorable trade-environmental changes against these concentrated export products. (4) It was found that export patterns of South Korea changed faster than those of the USA, China, and Japan for the period of 1999-2009. On the other hand, export patterns of Japan remained the most stable in the same period. Therefore both South Korea and CUJ should fully adjust their economies to ever-changing patterns of their exports. (5) It was found that South Korea’s export patterns do not resemble those of China due to the differences in factor endowment ratios of China and South Korea. Therefore South Korea can increase her exports to China by exploiting non-similarity of South Korean and Chinese export patterns. (6) It was found that both UJ and South Korea had similar export patterns due to the resemblances in factor endowment ratios of UJ and South Korea. Especially, South Korean export patterns became increasingly similar to Japanese export patterns and South Korean products’ competition with Japanese products in the world export market became increasingly severe. Therefore both UJ and South Korea should cooperate in exporting their products in the world market. (7) It was found that South Korea exported products which are less skilled human capital intensive and more R&D intensive for the entire period of 1999-2009. For the case of China, less skilled human capital intensive and less R&D intensive products were found to be exported for the same period. Therefore both South Korea and China should try to export more of these products to the world market from now on. (8) It was found that both the USA and Japan exported products which are more R&D intensive for the entire period of 1999-2009. Therefore both the USA and Japan should try to export more of these products to the world market from now on. Even if the above conclusions were drawn from this paper, it has its own limitation. Therefore the more in-depth study on this topic should be pursued in the near future.
Endnotes i The only exceptions are Spearman rank correlation coefficients (a) between RCA
k and PKL and (b)
between RCAk and SHKL for both 2008 and 2009, which are positive.
ii The only exception is a Spearman rank correlation coefficient between RCA
k and RD in 2002, which
is not significant. iii The only exception is a simple correlation coefficient between RCA
c and PKL in 1999, which is not
significant. iv The only exception is a coefficient of RD in 2008, which is not significant.

Kim
21
References
Balassa, B. 1965, ‘Trade liberalization and revealed comparative advantages’, The Manchester School of Economic and Social Studies, vol. 33, no. 2, pp. 91-123, Manchester, England.
Bank of Korea, Economic Statistics System (ecos.bok.or.kr), Seoul, Korea. Kim, S.J. 1988, ‘The composition of trade flows for a less developed economy: the case of Korea’,.Asian Economic Journal: vol. 2, no. 2, pp. 139-164, Osaka,
Japan. Kim, S.J. 2002, Trade patterns between Korea and the United States: overcoming
Korea’s financial crisis through expanding her trade volume with the United States, International Trade and Business Institute, Seoul, Korea.
Kim, S.J. 2004, Pure Trade Theory, Yulgok Books Co., Seoul, Korea. Kim, S.J. 2007, ‘Korea’s trade intensity with her major trading countries in the manufacturing sector: Its changes over the last decade’, International Area Review, vol. 10, no. 1, pp. 151-174, Hankuk University Foreign Studies, Seoul, Korea. Kim, S.J. 2010, ‘Changes in comparative advantage of OECD East European
countries and Korea’, Eastern European Studies, vol. 25, pp. 355-382, Institute of Eastern European and Balkan Studies, Seoul, Korea.
Korean International Trade Association, Korean Trade Statistics (kita.net), Seoul, Korea
Ministry of International Trade and Industry, Government of Japan 1986, White Paper on International Trade, Tokyo, Japan.
OECD 2011, International Trade by Commodity Statistics, vol. 5, Paris, France. Yamazawa, I. 1970, ‘Intensity analysis of world trade flow’, Hitotsubashi Journal of
Economics, vol. 10, pp. 61-90, Tokyo, Japan.


![[Cc Korea]License Usages In Korea](https://img.pdfslide.net/doc/110x75/5554f617b4c90566278b5408/cc-korealicense-usages-in-korea.jpg)