Embed Size (px)
Citation preview

This content has been downloaded from IOPscience. Please scroll down to see the full text.
Download details:
IP Address: 134.197.14.10
This content was downloaded on 11/09/2014 at 08:15
Please note that terms and conditions apply.
A comparative study of magnetic properties of LiFePO4 and LiMnPO4
View the table of contents for this issue, or go to the journal homepage for more
2004 J. Phys.: Condens. Matter 16 5531
(http://iopscience.iop.org/0953-8984/16/30/014)
Home Search Collections Journals About Contact us My IOPscience

INSTITUTE OF PHYSICS PUBLISHING JOURNAL OF PHYSICS: CONDENSED MATTER
J. Phys.: Condens. Matter 16 (2004) 5531–5548 PII: S0953-8984(04)79785-4
A comparative study of magnetic properties ofLiFePO4 and LiMnPO4
Denis Arcon1,2, Andrej Zorko1, Robert Dominko3 and Zvonko Jaglicic4
1 Department of Solid State Physics, Institute Jozef Stefan, Jamova 39, 1000 Ljubljana, Slovenia2 Faculty of Mathematics and Physics, University of Ljubljana, Jadranska 19, 1000 Ljubljana,Slovenia3 National Institute of Chemistry, Hajdrihova 19, 1000 Ljubljana, Slovenia4 Institute of Mathematics, Physics and Mechanics, Jadranska 19, 1000 Ljubljana, Slovenia
Received 23 April 2004Published 16 July 2004Online at stacks.iop.org/JPhysCM/16/5531doi:10.1088/0953-8984/16/30/014
AbstractA detailed comparative study of the magnetic properties of LiFePO4 andLiMnPO4 samples is presented. Magnetic susceptibility, electron paramagneticresonance and 7Li NMR experiments were performed on samples as preparedfor electrochemical studies. The ground state of LiFePO4 seems to be that ofa collinear antiferromagnet and very robust against crystal imperfections. Onthe other hand, our LiMnPO4 samples possess a weak ferromagnetic groundstate with a transition temperature TN = 42 K. We suggest that solitons maybe very important magnetic excitations in these systems and that pinning ofsolitons below TN together with frustration plays a decisive role in the formationof the weak ferromagnetic state in LiMnPO4. The differences between themagnetic properties of these two samples reflect also the differences betweentheir electronic structures and may thus be important for the electrochemistryof LiFePO4 and LiMnPO4.
1. Introduction
Since the pioneering work of Goodenough et al [1], the phospho-olivines LiMPO4 (where Mstands for Fe, Mn, Co, Ni) have been recognized as a potential positive electrode material foruse in lithium rechargeable batteries. This family of materials has numerous advantages overthe layered rock salt oxides (e.g. LiCoO2 and LiNiO2) that are currently used in commercialbatteries. Besides its high capacity (∼170 mA h g−1), LiMPO4 cathode material shows highstability during lithium extraction/insertion and does not deteriorate when used at moderatelyhigh temperatures. Recently, a lot of effort has been devoted to optimization of LiFePO4
material. In particular, particle minimization with intimate carbon contact resulted in almostthe theoretical capacity at moderate current densities with LiFePO4 cathode material [2].
0953-8984/04/305531+18$30.00 © 2004 IOP Publishing Ltd Printed in the UK 5531

5532 D Arcon et al
Surprisingly, only few papers indicate the applicability of LiMnPO4 [3–5] and, besides that,the results remain controversial.
The origin of the different electrochemical activities of isostructural LiFePO4 andLiMnPO4 is not quite clear at the moment. Yamada et al [3] suggested that the lowelectrochemical activity of LiMnPO4 is due to slow kinetics and internal friction during lithiumextraction/insertion. We have recently performed a comparative structural study [6] of thesetwo materials and found minute differences in the oxygen vibrations in the Li layer. Yetanother important factor is the magnetism in these compounds [7–9]. Magnetic properties aredetermined by the electronic states and may thus reflect the potential differences within theLiMPO4 family. Magnetism is therefore indirectly important for the electrochemical propertiesas well.
In the olivine structure the magnetic ions occupy only the so-called M2 site, i.e. the M2+
ion sits in the centre of the MO6 unit. Each MO6 distorted octahedron is connected to fourother MO6 via vertices forming a layered network perpendicular to the crystal [100] axis.Successive M2+ layers are separated by PO4 tetrahedra and LiO6 octahedra.
Magnetic properties of LiMPO4 were studied in the early 1960s. The magnetic structuresof LiCoPO4 and LiNiPO4 are suggested to be those of collinear antiferromagnets [10] but theydiffer in the orientation of the sublattice magnetizations. In LiCoPO4 the magnetic momentsare oriented along the [010] direction while in LiNiPO4 they point along the [001] direction.On the other hand, in LiFePO4 the antiferromagnetic transition [10, 11] occurs at 52 K withmagnetic moments aligned along the crystal [010] axis. And finally, LiMnPO4 was againsuggested to be a collinear antiferromagnet with a Neel temperature ranging between 35 K,for synthetic materials [8], and 42 K, for minerals [12].
However, with the discovery of the electrochemical activity of LiFePO4 there has beena revival of interest in these materials. In this paper we revisit the magnetic properties ofLiFePO4 and LiMnPO4 materials, as prepared for use as an active material for Li ion batteries.We emphasize that the focus of this study is on the magnetic properties of materials preparedfor electrochemical studies with all possible defects, vacancies and particle size effects. Inparticular, we have performed SQUID magnetization, EPR and 7Li NMR measurementsbetween room temperature and 2 K. The measurements revealed differences in the magneticground states that could be important for the electrochemical activity of the LiMPO4 family.
2. Experimental details
2.1. Sample synthesis
The samples were prepared by a standard sol–gel method [13]. As a starting precursor, iron(III) citrate (Aldrich, 22,897-4) or manganese (II) acetate tetrahydrate (C4H6MnO4 × 4H2O,Fluka, 63537) and citric acid (C6H8O7 × H2O, Kemika, 0319506) were dissolved at 60 ◦Cin water. Separately, an equimolar water solution of LiH2PO4 was prepared from lithiumphosphate (Li3PO4, Aldrich 33,889-3) and phosphoric (V) acid (H3PO4, Aldrich 31,027-1).Clear solutions were mixed together and dried at 60 ◦C for 24 h. After thorough grinding witha mortar and pestle, the xerogel obtained was fired in a reductive (5 wt% of hydrogen in argon)atmosphere at 700 ◦C (LiFePO4) or 900 ◦C (LiMnPO4) for 10 h. The powder obtained wasblack due to carbon-coated submicron particles (the content of carbon is about 6 wt%) [14].The average size of coherent domains obtained from the analysis of the half-width of the x-raydiffraction peaks was, for both materials, in the range between 40 and 50 nm. The averageparticle size did not vary substantially from batch to batch. A typical active surface area wasestimated to be around 60 m2 g−1.

A comparative study of magnetic properties of LiFePO4 and LiMnPO4 5533
Figure 1. Lithium extraction/insertion in thesecond cycle at a current density of 8.5 mA g−1
(C/20 rate).
2.2. Electrochemical testing
The preparations of electrodes and systems for electrochemical testing are describedelsewhere [15]. We should stress that the current density used for discharging/chargingwas setto a value of 8.5 mA g−1 (corresponding roughly to a C/20 rate). The cut-off voltages duringthe discharge and charge were 4.1 and 2.7 V for LiFePO4 and 4.5 and 2.5 V versus the lithiummetal reference for LiMnPO4.
Typical charge and discharge curves for LiFePO4 and LiMnPO4 are shown in figure 1.Although the nominal capacities for the two materials are similar, the capacity obtained forLiMnPO4 is three times lower than that for LiFePO4 and, besides that, the large polarizationof the LiMnPO4 sample suggests hindered lithium extraction/insertion.
2.3. Magnetization and magnetic resonance measurements
The susceptibility and magnetization were measured with a Quantum Design SQUIDmagnetometer, equipped with a 5 T superconducting magnet.
Continuous wave (cw) EPR measurements were performed on a Bruker E580 spectrometerusing a Varian dual resonator with a reference sample in the second resonator to account forthe slight changes in the Q-factor during the measurements. In all the cw experiments amodulation field Hmod = 1 G and νmod = 100 kHz were used. The temperature was stabilizedwithin 0.2 K in a continuous flow cryostat, ESR 900. To estimate the EPR spin susceptibility,Cu(SO4)2·5H2O has been used as a standard sample.
7Li NMR measurements were performed at a Larmor frequency νL = 104.9 MHz in asuperconducting magnet, at 6.3 T. The 7Li NMR spectra were, over the entire temperaturerange, broader than the measurement window determined with the 90◦ rf pulse width 6 µs.The spectra were therefore measured via the intensity of the echo signal while sweeping theresonance frequency in steps of 10 kHz. We also used automatic tuning of the resonance circuitin the frequency range between 103.5 and 106 MHz. The spin–lattice relaxation time T1 wasmeasured using a saturation–recovery technique with appropriate phase cycling.
3. Results
3.1. Magnetic susceptibility measurements
In figure 2 we show the temperature dependence of the static spin susceptibility in LiMnPO4
powder. We stress that we found in this particular sample traces of Li3PO4 impurities. In

5534 D Arcon et al
(a)
(b)
Figure 2. The temperature dependence of the (a) spin susceptibility and (b) inverse spinsusceptibility for LiMnPO4 powder. Please note the difference between the field cooled (FC)and zero-field cooled (ZFC) experiments.
an independent check, we tried to examine the magnetic properties of Li3PO4 using EPR butfailed to find any paramagnetic signal. We therefore conclude that the Li3PO4 impurities cannotcontribute to the total spin susceptibility presented in figure 2. At high temperatures, i.e. attemperatures between room temperature and 50 K, we observe a Curie–Weiss behaviour witha Curie constant C = 4.23(1) emu K mol−1 and a Curie–Weiss temperature � = −87(2) K.These constants do not vary significantly from sample to sample. The susceptibility alsoshows the same behaviour between room temperature and ∼40 K, irrespective of the coolingprotocol. However, around 40 K we observe an anomaly which is strongly dependent onwhether the sample has been cooled in zero field or in a magnetic field. While in zero-fieldcooled experiments we observe a cusp in the magnetic susceptibility at TN = 39–42 K, infield cooled experiments the susceptibility suddenly increases below TN and then at lowertemperatures saturates. The same type of behaviour can also be seen from the temperaturedependence of the inverse susceptibility (figure 2(b)) where 1/χ suddenly decreases at TN.We stress that the magnitude of the saturated moment slightly varies from sample to sample.However, it will be shown later with 7Li NMR measurements that this is still an intrinsicphenomenon and not a result from some unknown impurity phase.
Further evidence for the magnetic ordering comes from the ac susceptibility measurements,which clearly show a peak at TN. We would like to stress that the peak position is frequencyindependent, i.e. it is precisely the same at ν = 1 Hz as at ν = 100 Hz, excluding the possibilityof some spin-glass or superparamagnetic-like behaviour.

A comparative study of magnetic properties of LiFePO4 and LiMnPO4 5535
Figure 3. Magnetization curves measured for powdered LiMnPO4 at 50 K (open circles) and at2 K (solid circles). The measurements are displayed only for fields between −6 and 6 kOe, whilecomplete magnetization versus magnetic field cycles are shown in the inset. The arrows indicatethe direction of the change of the magnetic field.
Finally, we show in figure 3 hysteresis curves measured for a LiMnPO4 powder sample.One can clearly see the hysteresis in the 2 K curve. The coercive field is about 1000 Oe, whilethe remanent magnetization is about 70 emu mol−1. This remanent magnetization correspondsto 0.012 µB/Mn. Interestingly, we find a structure in the hysteresis just around zero field. Thehysteresis disappears at T = 50 K, i.e. at temperatures above TN. At this temperature wemeasure only a straight paramagnetic line.
The magnetic susceptibility of LiFePO4 is less complicated (figure 4). Again, at hightemperatures the magnetic susceptibility follows a Curie–Wess behaviour with a Curie constantC = 4.28 emu K mol−1 and a Curie–Weiss temperature � = −115(1) K. The susceptibilityclearly shows a maximum characteristic of antiferromagnetic ordering at 50 K. No noticeabledifference between zero-field cooled and field cooled experiments has been found. On the basisof these experiments, we can conclude that LiFePO4 goes into a collinear antiferromagneticground state below TN = 51(1) K.
3.2. EPR measurements
The EPR line in LiMnPO4 has a Lorentzian lineshape over the entire temperature range. Thisresult is somewhat surprising as typically for a 2D lattice formed by the Mn ions one wouldexpect deviations from the Lorentzian lineshape as a result of the spin diffusion processes.The EPR peak-to-peak linewidth is, at room temperature, 298 G. We note that this linewidth islarger by an order of magnitude than the one measured for perovskite layered Mn square-latticeantiferromagnets [16].
The temperature dependence of the EPR signal intensity, which is, in the paramagneticphase, directly proportional to the static spin susceptibility, is shown in figure 5(a). Atroom temperature the intensity of the line corresponds to the spin susceptibility χEPR =1.05×10⁻² emu mol−1, which is nearly the same as the one measured by the SQUID (figure 2).This proves that we detect all Mn spins in these EPR measurements. At high temperatures theintensity of the signal follows the one measured by the SQUID magnetometer. The temperaturedependence of the EPR spin susceptibility can be fitted with a Curie–Weiss law:
χEPR = C
T − �, (1)

5536 D Arcon et al
(a)
(b)
Figure 4. The temperature dependence of the (a) spin susceptibility and (b) inverse spinsusceptibility for LiFePO4 powder.
where C = 3.92(2) emu K mol−1 is the Curie constant and � = −105(2) K is the Curie–Weisstemperature. We note that the extracted Curie–Weiss temperature is slightly more negativethan the one obtained from SQUID measurements.
On cooling below around 45 K the EPR signal starts to disappear quite rapidly; it nearlyvanishes in an interval of a few kelvins and almost completely vanishes at 42 K. This proves thatthe magnetic transition observed in SQUID measurements is indeed intrinsic and is not relatedto some unidentified impurities. We were not able to detect antiferromagnetic resonance inpowdered LiMnPO4 below TN. We have however been able to measure the residual EPR signaldown to 4 K. The origin of this signal will be discussed later.
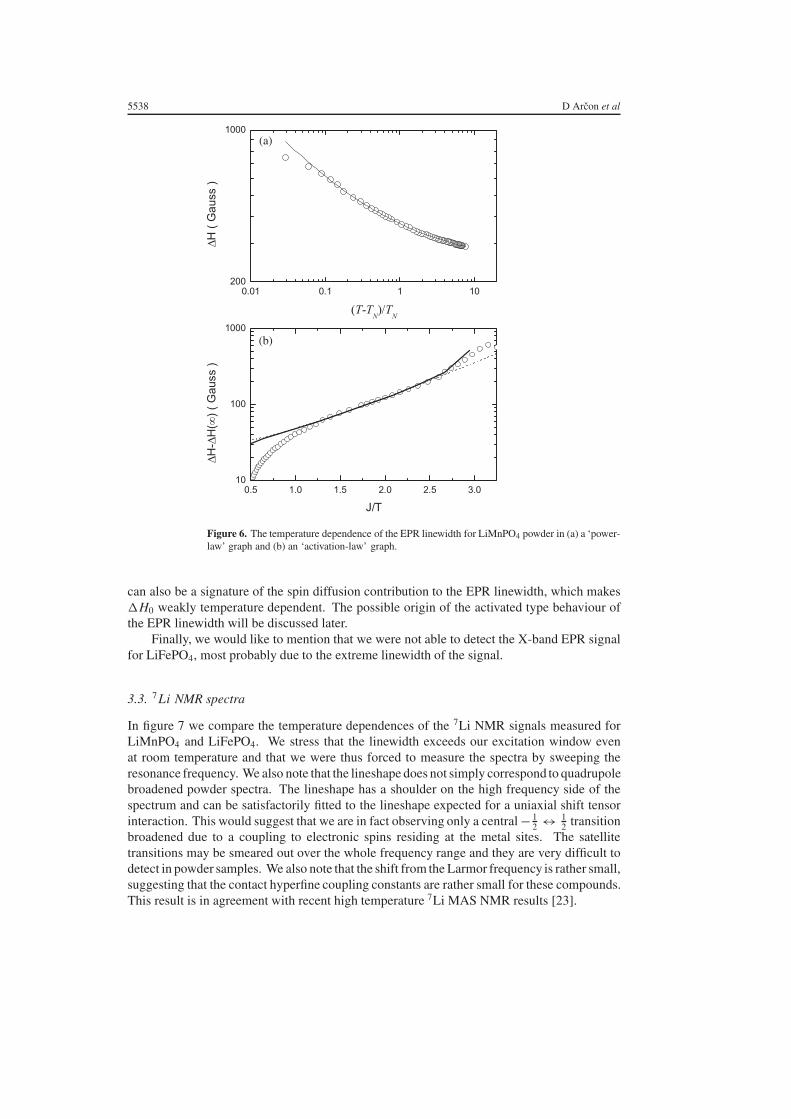
Although the centre of the line (i.e. the g-factor) is nearly temperature independent(figure 5(b)), the linewidth exhibits a pronounced temperature dependence (figure 5(c)). Inthe entire temperature interval between room temperature and TN the linewidth increasesmonotonically with decreasing temperature. At TN the linewidth nearly diverges. In figure 6we show the temperature dependence of the EPR linewidth on two different scales: ln �Hversus (T − TN)/TN and ln(�H − �H (∞)) versus J/T . In the first graph we are testing thepower-law behaviour while in the second one we are looking for an activated type of behaviourof the EPR linewidth. An attempt to fit the temperature dependence of the EPR linewidth tothe power-law behaviour
�H (T ) = �H0 + �H P0
(T − TN
TN
)−β
(2)

A comparative study of magnetic properties of LiFePO4 and LiMnPO4 5537
(a)
(b)
(c)
Figure 5. The temperature dependence of the (a) intensity, (b) centre and (c) linewidth of theLorentzian EPR signal for LiMnPO4 powder.
(This figure is in colour only in the electronic version)
is shown in figure 6(a). The parameters used in the fit are the linewidth at infinite temperature�H0 = 236(2) G, �H P
0 = 134(3) G and the power exponent β = 0.45(1). Surprisingly, thisfit successfully describes the temperature dependence of the linewidth over a wide temperatureinterval, although it is difficult to believe that the critical fluctuations would survive even attemperatures as high as 10 TN!
On the other hand, we notice that one can describe the temperature dependence of the EPRlinewidth in the paramagnetic phase also with an activated type behaviour �H ∝ exp(Ea/T )
where Ea = 120 K (see the dotted curve in figure 6(b)). In that case the deviation of thetemperature dependence of the EPR linewidth from the activated type of behaviour just abovethe TN reflects the critical fluctuations. The data were thus fitted with a sum of two contributions,i.e. the activated type contribution and the power-law contribution
�H (T ) = �H0 + �H a0 exp(Ea/T ) + �H P
0
(T − TN
TN
)−β
. (3)
An unconstrained fit (the solid curve in figure 6(b)) led to the activation energy Ea = 144(3) Kand power exponent β = 0.38(6). A deviation at higher temperatures (i.e. at lower J/T values)
5538 D Arcon et al
(a)
(b)
Figure 6. The temperature dependence of the EPR linewidth for LiMnPO4 powder in (a) a ‘power-law’ graph and (b) an ‘activation-law’ graph.
can also be a signature of the spin diffusion contribution to the EPR linewidth, which makes�H0 weakly temperature dependent. The possible origin of the activated type behaviour ofthe EPR linewidth will be discussed later.
Finally, we would like to mention that we were not able to detect the X-band EPR signalfor LiFePO4, most probably due to the extreme linewidth of the signal.
3.3. 7 Li NMR spectra
In figure 7 we compare the temperature dependences of the 7Li NMR signals measured forLiMnPO4 and LiFePO4. We stress that the linewidth exceeds our excitation window evenat room temperature and that we were thus forced to measure the spectra by sweeping theresonance frequency. We also note that the lineshape does not simply correspond to quadrupolebroadened powder spectra. The lineshape has a shoulder on the high frequency side of thespectrum and can be satisfactorily fitted to the lineshape expected for a uniaxial shift tensorinteraction. This would suggest that we are in fact observing only a central − 1
2 ↔ 12 transition
broadened due to a coupling to electronic spins residing at the metal sites. The satellitetransitions may be smeared out over the whole frequency range and they are very difficult todetect in powder samples. We also note that the shift from the Larmor frequency is rather small,suggesting that the contact hyperfine coupling constants are rather small for these compounds.This result is in agreement with recent high temperature 7Li MAS NMR results [23].

A comparative study of magnetic properties of LiFePO4 and LiMnPO4 5539
(a) (b)
Figure 7. The temperature dependence of the 7Li NMR signal for (a) LiMnPO4 and (b) LiFePO4powder.
On cooling, the 7Li NMR line is shifted to lower resonance frequencies and continuouslybroadens for both samples. This reflects the Curie–Weiss temperature dependence of themagnetic susceptibility. However, below the Neel temperature the two samples behavequalitatively differently. While for the LiMnPO4 sample the linewidth tends to increase evenbelow TN, for LiFePO4 the line narrows. This difference indicates that different local fieldsare experienced by the 7Li nuclei below TN in the particular two samples studied. The resultsclearly suggest that in LiFePO4 the magnetic ordering is indeed antiferromagnetic. This is seenfrom the fact that the local field at the 7Li site decreases below the transition temperature. Onthe other hand, in LiMnPO4 the magnetic ordering is weak ferromagnetic type as evidencedby the broadening of the 7Li NMR spectra. Possible origins of the weak ferromagnetism inour LiMnPO4 sample will be discussed later.
The changes in the lineshape can also be seen in the temperature dependence of themoments of the 7Li NMR spectra (figure 8). The temperature dependence of
√M2, which
is approximately a measure of the linewidth of the spectra, on cooling steadily increases forboth samples (figure 8(a)). For instance,
√M2 increases from 82 kHz at room temperature to
around 200 kHz at 60 K. However, below the Neel temperatures again the two samples behavequalitatively differently.
√M2 for LiMnPO4 suddenly increases below 40 K and then nearly
saturates at the value of 350 kHz. On the other hand, for LiFePO4 the second moment below50 K starts to decrease and, for instance, at 15 K it amounts to only
√M2 ∼ 135 kHz. The
same observations seem to hold for the first moments as well (figure 8(b)). For both samplesthe line first paramagnetically shifts on cooling. However, at TN the line continues to shift forLiMnPO4 while for LiFePO4 the shift of the 7Li NMR line reverses its trend.
So, to summarize this section, the local fields experienced by the 7Li NMR probe on coolingfrom room temperature at first increase as expected for a paramagnetic phase. However, belowTN the two samples are qualitatively different. In LiFePO4 the local field decreases while inLiMnPO4 the local field increases below TN. This suggests that the ground state of the sampleof LiFePO4 studied is indeed antiferromagnetic, but that of LiMnPO4 is weak ferromagnetic.
3.4. 7 Li relaxation
Spin dynamics is reflected in the spin–spin relaxation time T2 and spin–lattice relaxationtime T1. The spin–spin relaxation time has been measured in two different ways: first by

5540 D Arcon et al
(a)
(b)
Figure 8. The temperature dependences of the (a) second-moment and (b) the first-moment 7LiNMR spectra of LiMnPO4 (solid circles) and LiFePO4 (open circles).
monitoring the decay of the Hahn echo as a function of the separation time τ between thetwo pulses and second by means of the Carr–Purcell–Meiboom–Gill (CPMG) sequence [24].Typical relaxation curves measured for LiMnPO4 are shown in figure 9. The magnetizationcurve obtained from the decay of the Hahn echo is clearly non-exponential. A non-exponentialdecay is usually a signature of diffusion processes and has a characteristic time dependence:
EHE(τ ) = E0 exp
(−2τ
T2− 2
3(γ G)2 Dτ 3
). (4)
Here T2 is the decay rate of transverse magnetization in a uniform field, τ is the time intervalbetween the two pulses in the Hahn-echo experiment, γ is the nuclear gyromagnetic ratio,G = ∂ B/∂z is the gradient of the magnetic field, which is assumed to be uniform, and D isthe appropriate self-diffusion coefficient. In many cases one wishes to determine the diffusionconstant by intentionally applying a field gradient. However, even if the external magnetic fieldis homogeneous, local inhomogeneity in the spin susceptibility may take over and effectivelylead to a very similar behaviour. In such a case one would expect to find G = ∂χ
∂z B , whichcould thus be relevant in the paramagnetic systems.
To avoid the extra decay due to diffusion, the Carr–Purcell–Meiboom–Gill (CPMG)sequence is often used. The experiments (a typical example is shown on figure 9(b)) wereperformed using different times τ between 180◦ pulses. The data obtained were then analysedusing a simple exponential form E(τ ) = E0 exp
(− 2τT2
). We note however that the extracted
spin–spin relaxation time T2 depends on the value of τ used in the CPMG sequence. A typical

A comparative study of magnetic properties of LiFePO4 and LiMnPO4 5541
(a) (b)
Figure 9. The decay of the echo intensity in LiMnPO4 as a function of τ in (a) a simple Hahn-echoexperiment and (b) a Carr–Purcell–Meiboom–Gill (CPMG) experiment. In the inset we show thedecay of the echo in the CPMG experiment. The temperature is 296 K here.
(a)
(b)
Figure 10. The dependence of the relaxation parameter T2 obtained from the CPMG measurementsfor (a) LiFePO4 and (b) LiMnPO4 at T = 290 K.
example of such a dependence is shown in figure 10. For very small values of τ , i.e. whenτ = 30 µs, the extracted parameter T2 approaches the values obtained from a two-pulse Hahn-echo experiment. For larger values of τ > 50 µs, the extracted parameter T2 on the other handbecomes smaller by almost a factor of two. The effect is much more pronounced for LiFePO4,indicating that the slow motions responsible for the τ dependence of the parameter T2 are moreactive on the timescale of τ ∼ 30–50 µs.
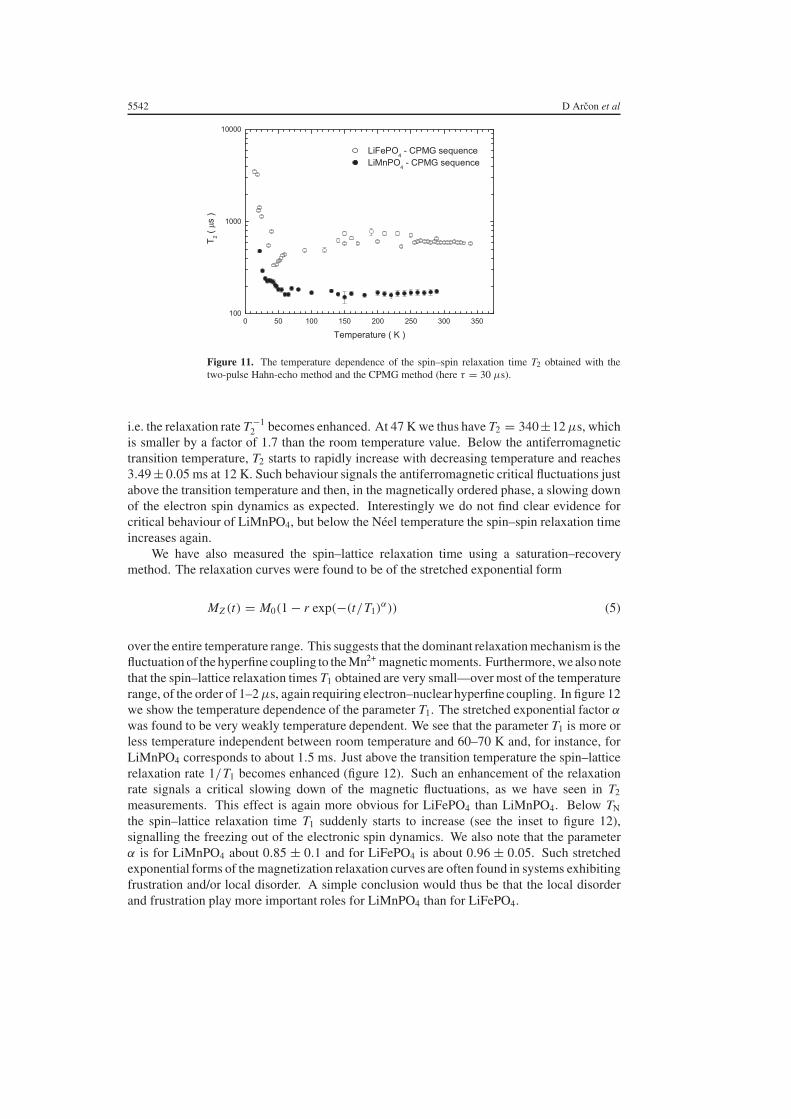
In figure 11 we show the temperature dependence of the spin–spin relaxation time asobtained from the CPMG sequence with τ = 30 µs for both samples. Interestingly, therelaxation time is, around room temperature, more or less temperature independent and, forinstance, for LiFePO4 amounts to 590 ± 25 µs, while for LiMnPO4 it is slightly smaller andcorresponds to 180 ± 35 µs. On cooling however, T2 exhibits anomalous behaviour. Forinstance, for LiFePO4, about 10 K above the transition temperature, T2 starts to get smaller,
5542 D Arcon et al
Figure 11. The temperature dependence of the spin–spin relaxation time T2 obtained with thetwo-pulse Hahn-echo method and the CPMG method (here τ = 30 µs).
i.e. the relaxation rate T −12 becomes enhanced. At 47 K we thus have T2 = 340±12 µs, which
is smaller by a factor of 1.7 than the room temperature value. Below the antiferromagnetictransition temperature, T2 starts to rapidly increase with decreasing temperature and reaches3.49 ± 0.05 ms at 12 K. Such behaviour signals the antiferromagnetic critical fluctuations justabove the transition temperature and then, in the magnetically ordered phase, a slowing downof the electron spin dynamics as expected. Interestingly we do not find clear evidence forcritical behaviour of LiMnPO4, but below the Neel temperature the spin–spin relaxation timeincreases again.
We have also measured the spin–lattice relaxation time using a saturation–recoverymethod. The relaxation curves were found to be of the stretched exponential form
MZ (t) = M0(1 − r exp(−(t/T1)α)) (5)
over the entire temperature range. This suggests that the dominant relaxation mechanism is thefluctuation of the hyperfine coupling to the Mn2+ magnetic moments. Furthermore, we also notethat the spin–lattice relaxation times T1 obtained are very small—over most of the temperaturerange, of the order of 1–2 µs, again requiring electron–nuclear hyperfine coupling. In figure 12we show the temperature dependence of the parameter T1. The stretched exponential factor α
was found to be very weakly temperature dependent. We see that the parameter T1 is more orless temperature independent between room temperature and 60–70 K and, for instance, forLiMnPO4 corresponds to about 1.5 ms. Just above the transition temperature the spin–latticerelaxation rate 1/T1 becomes enhanced (figure 12). Such an enhancement of the relaxationrate signals a critical slowing down of the magnetic fluctuations, as we have seen in T2
measurements. This effect is again more obvious for LiFePO4 than LiMnPO4. Below TN
the spin–lattice relaxation time T1 suddenly starts to increase (see the inset to figure 12),signalling the freezing out of the electronic spin dynamics. We also note that the parameterα is for LiMnPO4 about 0.85 ± 0.1 and for LiFePO4 is about 0.96 ± 0.05. Such stretchedexponential forms of the magnetization relaxation curves are often found in systems exhibitingfrustration and/or local disorder. A simple conclusion would thus be that the local disorderand frustration play more important roles for LiMnPO4 than for LiFePO4.

A comparative study of magnetic properties of LiFePO4 and LiMnPO4 5543
Figure 12. The temperature dependence of the spin–lattice relaxation rate 1/T1 for LiMnPO4(open circles) and LiFePO4 (solid circles). In the inset we show the temperature dependence ofthe spin–lattice relaxation time T1 for LiFePO4.
4. Discussion
The structures of LiMnPO4 and LiFePO4 are isomorphous. They both crystallize in theolivine type crystal structure with orthogonal space group Pnma. The profile refinementby the FULLPROF program gives for LiMnPO4 the room temperature lattice constantsa = 10.4447(6) Å, b = 6.1018(3) Å, c = 4.7431(3) Å [6]. The Mn–Mn distance is shortest inthe b–c plane, at 3.92 Å. The Mn–Mn distance is much longer in the perpendicular direction,along the crystal a-lattice, i.e. 5.62 Å. These parameters suggest a quasi-two-dimensionalcharacter for the magnetic properties of LiMnPO4. However, the Mn–O–Mn bonding is rathercomplicated and the Mn lattice cannot be simply treated as a two-dimensional square lattice.This is clearly reflected in the temperature dependence of the magnetic susceptibility, whichcan be, in the paramagnetic phase, simply fitted with a Curie–Weiss law (equation (1)). Anunconstrained fit of the temperature dependence of the LiMnPO4 susceptibility leads to a Curietemperature � = −87 ± 2 K and a Curie constant C = 4.23(1) emu K mol−1. The Curieconstant obtained corresponds to the effective magnetic moment µeff = 5.82(2) µB, which isclose to but slightly less than the value expected for Mn(II) spins (S = 5/2).
A similar observation holds also for LiFePO4, where the susceptibility again followsa Curie–Weiss law between room temperature and 60 K with a Curie constant C =4.28(2) emu K mol−1 and a Curie–Weiss temperature � = −115(1) K. In this case the Curieconstant corresponds to the effective moment µeff = 5.85(4) µB, which is in agreement withthe Fe2+ high spin S = 5/2 state. We note that the temperature dependence of the susceptibilitydoes not follow the dependence predicted for the 2D square lattice of classical spins [17] as itdoes not show a typical broad maximum. The sign of the Curie temperature for both samplessuggests predominantly antiferromagnetic coupling between the spins.
We stress once again that we obtained, in EPR measurements, a spin-only susceptibilityfor about 15% higher Curie temperatures (see section 3.2). One can use a classical result toestimate the exchange coupling constant:
J = 3kB�
2zS(S + 1)(6)
where z is the number of nearest neighbours. The estimated exchange coupling constant isJex = 2.5 K for LiMnPO4, while for LiFePO4 it is Jex = 3.3 K.
5544 D Arcon et al
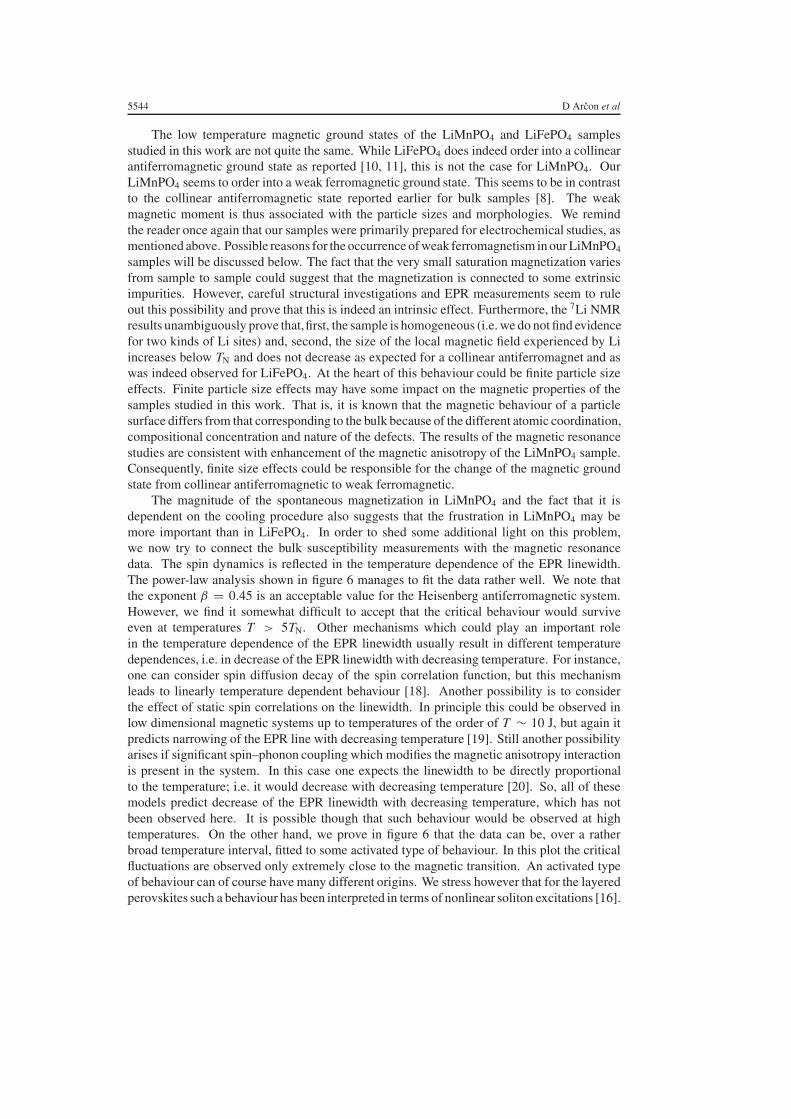
The low temperature magnetic ground states of the LiMnPO4 and LiFePO4 samplesstudied in this work are not quite the same. While LiFePO4 does indeed order into a collinearantiferromagnetic ground state as reported [10, 11], this is not the case for LiMnPO4. OurLiMnPO4 seems to order into a weak ferromagnetic ground state. This seems to be in contrastto the collinear antiferromagnetic state reported earlier for bulk samples [8]. The weakmagnetic moment is thus associated with the particle sizes and morphologies. We remindthe reader once again that our samples were primarily prepared for electrochemical studies, asmentioned above. Possible reasons for the occurrence of weak ferromagnetism in our LiMnPO4
samples will be discussed below. The fact that the very small saturation magnetization variesfrom sample to sample could suggest that the magnetization is connected to some extrinsicimpurities. However, careful structural investigations and EPR measurements seem to ruleout this possibility and prove that this is indeed an intrinsic effect. Furthermore, the 7Li NMRresults unambiguously prove that,first, the sample is homogeneous (i.e. we do not find evidencefor two kinds of Li sites) and, second, the size of the local magnetic field experienced by Liincreases below TN and does not decrease as expected for a collinear antiferromagnet and aswas indeed observed for LiFePO4. At the heart of this behaviour could be finite particle sizeeffects. Finite particle size effects may have some impact on the magnetic properties of thesamples studied in this work. That is, it is known that the magnetic behaviour of a particlesurface differs from that corresponding to the bulk because of the different atomic coordination,compositional concentration and nature of the defects. The results of the magnetic resonancestudies are consistent with enhancement of the magnetic anisotropy of the LiMnPO4 sample.Consequently, finite size effects could be responsible for the change of the magnetic groundstate from collinear antiferromagnetic to weak ferromagnetic.
The magnitude of the spontaneous magnetization in LiMnPO4 and the fact that it isdependent on the cooling procedure also suggests that the frustration in LiMnPO4 may bemore important than in LiFePO4. In order to shed some additional light on this problem,we now try to connect the bulk susceptibility measurements with the magnetic resonancedata. The spin dynamics is reflected in the temperature dependence of the EPR linewidth.The power-law analysis shown in figure 6 manages to fit the data rather well. We note thatthe exponent β = 0.45 is an acceptable value for the Heisenberg antiferromagnetic system.However, we find it somewhat difficult to accept that the critical behaviour would surviveeven at temperatures T > 5TN. Other mechanisms which could play an important rolein the temperature dependence of the EPR linewidth usually result in different temperaturedependences, i.e. in decrease of the EPR linewidth with decreasing temperature. For instance,one can consider spin diffusion decay of the spin correlation function, but this mechanismleads to linearly temperature dependent behaviour [18]. Another possibility is to considerthe effect of static spin correlations on the linewidth. In principle this could be observed inlow dimensional magnetic systems up to temperatures of the order of T ∼ 10 J, but again itpredicts narrowing of the EPR line with decreasing temperature [19]. Still another possibilityarises if significant spin–phonon coupling which modifies the magnetic anisotropy interactionis present in the system. In this case one expects the linewidth to be directly proportionalto the temperature; i.e. it would decrease with decreasing temperature [20]. So, all of thesemodels predict decrease of the EPR linewidth with decreasing temperature, which has notbeen observed here. It is possible though that such behaviour would be observed at hightemperatures. On the other hand, we prove in figure 6 that the data can be, over a ratherbroad temperature interval, fitted to some activated type of behaviour. In this plot the criticalfluctuations are observed only extremely close to the magnetic transition. An activated typeof behaviour can of course have many different origins. We stress however that for the layeredperovskites such a behaviour has been interpreted in terms of nonlinear soliton excitations [16].

A comparative study of magnetic properties of LiFePO4 and LiMnPO4 5545
The soliton energy of the Belavin–Polyakov solution [21] is given by the expression
ES = 4π JexS2. (7)
Taking the previously estimated value for the exchange energy Jex = 2.5 K, one can calculatethe soliton energy to be ES = 195 K. Given the crudeness of the estimation of the exchangeenergy, we find this to be a rather satisfactory agreement with the experimentally determinedactivation energy Ea = 144 K. We note however that the introduction of a very small amountof impurity into the magnetic sites of a classical two-dimensional antiferromagnet leads tothere being a new type of static (impurity-pinned) soliton that drastically affects the parameterEa measured from the linewidth of the EPR signal [22]. It may well be that in our casethe defects act as pinning centres for solitons. Therefore, one may suggest that in the lowtemperature magnetic phase of LiMnPO4 a significant number of solitons are frozen aroundimpurity centres. The residual EPR signal could thus originate from such centres.
A closer look at the 7Li NMR data seems to support the above physical picture of LiMnPO4.In paramagnetic systems of quadrupolar nuclei the electron–nuclear interaction (both contactas well as dipolar) is strong enough to influence not only the relaxation time but also thepowder lineshape. The principal axis of the anisotropic electron–nuclear interaction doesnot necessary coincide with the unique axis of the electric field gradient tensor. This thenintroduces additional orientational dependent broadening of the 7Li NMR lineshape and avery complex asymmetric 7Li lineshape.
According to very recent 7Li MAS NMR study of LiMPO4 (M = Mn, Fe) theseparamagnetic materials contain a single type of Li site in agreement with the olivinestructure [23]. The isotropic shifts fall outside the known chemical shift range for Li indiamagnetic compounds and seem to suggest a significant electron–nuclear coupling. We notehowever that hyperfine coupling of the 7Li nucleus to unpaired metal d electrons can resultonly from transfer of unpaired spin density via the oxygen p orbitals to the Li s orbitals. Insuch a case we expect the first moment of the line to follow the spin susceptibility measuredby the SQUID. It has also been noted that such transfer of spin density can occur along twodifferent ‘paths’, i.e. through the four ‘right-angle’ bonds with a Li–O–Fe angle of 95◦–97◦and four ‘bent’ bonds with a Li–O–Fe angle of 110◦–122◦.
In view of this, the appropriate spin Hamiltonian for the particular 7Li nuclei would be
H = HZ + Hen + HQ. (8)
Here, the first term
HZ = −γ �I · (1 − σ) · �B0 (9)
is the Zeeman term with the chemical shift σ already included. Typical values for the chemicalshift of the Li nuclei in diamagnetic systems are about 20 ppm. Here we expect that, due tothe character of the Li–O bond and increasing covalency of the ligands, the anisotropy of thechemical shift tensor will be even smaller [25]. The chemical shift anisotropy will thus beneglected in the forthcoming analysis. The second term is the term describing the coupling ofthe Li nucleus to the electronic spins Hen. This coupling is then further composed from thedipolar interaction between the Li nuclei and the unpaired metal magnetic moments, as well asfrom the contact interaction due to a partial transfer of unpaired spin density to the Li s orbital:
Hen =∑
i
Aiiso〈�Si 〉 · �I +
∑k
〈�Sk〉 · Tk · �I . (10)
Here the sum over i runs over all Fe (Mn)–O–Li bonds. With the brackets 〈 〉 we also reflectthe fact that the dynamics of the electronic spins is, on the NMR timescale, so fast that one has

5546 D Arcon et al
Figure 13. A comparison between experimental (circles) and theoretical (lines) powder 7Li NMRspectra for LiMnPO4. The calculated spectra were obtained by using equations (8)–(14).
to take the time averaged value of the electronic spin. The time averaged value of the electronspin is proportional to the molar susceptibility χmol:
Naµ0µBg〈�S〉 = χmol �B. (11)
In the second term the sum goes over all neighbouring moments M and tensor Tk is the dipolarcoupling tensor, which is traceless as long as the g-factor is isotropic. The dipolar tensor is,in the electron–nuclear point dipole approximation, given by [26]
T = µ0
4πgµBγn
∑k
3nk ⊗ nk − 1
r3k
. (12)
Here nk is the unit vector denoting the direction cosines of the electron–nuclear �rk in the crystalframe. The sum goes over all k magnetic moments M . We have used the structural data andcalculated the dipolar sum for a given Li site. The components of the tensor T are, for theLiMnPO4 structure, then given by
T = µ0
4πgµBγ
( 0.270 −0.018 0.025−0.018 −0.109 0.0140.025 0.014 −0.161
)[1030 m−3]. (13)
The last term is due to the quadrupole interaction HQ. In the principle axis system thisinteraction can be written as
HQ = e2q Q
4I (2I − 1)
(3I 2
z − I (I + 1) +1
2η(I 2
+ + I 2−)
)(14)
where e2q Q is the quadrupole frequency and η is the asymmetry parameter.In figure 13 we compare the experimental and theoretical powder 7Li NMR spectra for
LiMnPO4 in the paramagnetic phase. Here the only free fitting parameter was e2q Q. Thetemperature evolution of the spectra, including the broadening of the line, is hidden in thetemperature dependence of the spin susceptibility χmol, which was taken from the SQUIDdata. The agreement is rather good over the entire temperature range. We stress that we couldalso fit the powder 7Li NMR spectra for LiFePO4 in the same way, except for the different T2
value (i.e. broadening of the spectra).The experimental spectra could be fitted even below TN. However, here the two samples
differ qualitatively. For LiFePO4 the NMR linewidth becomes smaller suggesting that the

A comparative study of magnetic properties of LiFePO4 and LiMnPO4 5547
averaged value of the electronic spin ‘seen’ by the 7Li nuclei becomes smaller, as expectedfor the antiferromagnetically ordered sample. On the other hand, for LiMnPO4 the spectradramatically broaden below TN, suggesting an increase of the local magnetic field. It seemsthat on this point the magnetization measurements and 7Li NMR measurements completelyagree. Such a broadening could be due to the canting of the magnetic moments leading toa weak ferromagnetism. In such a case the canting angle must be very small, of the orderof 0.1◦. The other possibility is connected to the presence of some oxygen vacancies, whichcould change the Mn valence state and lead to ordered ‘uncompensated’ magnetic moments.We should however then observe a multi-component NMR spectrum, which is obviously notthe case here. The presence of oxygen vacancies alone is thus not enough to account for thebroadening of the entire 7Li NMR line for LiMnPO4. However, such oxygen vacancies couldact as a pinning centre for soliton excitations, as suggested by the EPR measurements discussedearlier. In this case the effect of oxygen vacancies could be much more far reaching and couldbe easily seen also in the 7Li NMR spectra as a dramatic broadening of the line. This couldalso explain the fact that the soliton energy obtained is 144 K and is about 20% smaller thanthe theoretical value calculated from equation (7) [22].
NMR relaxation times are important parameters in the understanding of phase transitionsas they contain direct information about the fluctuations of the electronic spins. We will use theclassical Kubo–Tomita–Moriya approach [27, 28]. Within this model the nuclear spin–latticerelaxation time is given by
T −11 =
∑α0�q�π
|Kα(q)|2Sα(q, ωN)nα(q), (15)
where Kα(q) is the electron–nuclear coupling described earlier, Sα(q, ωN) is the dynamicstructure factor of the magnetic excitations, ωN is the nuclear resonance frequency and nα(q)
is the corresponding occupation function. At high temperatures, where hωN � kBT , thisexpression reduces to
T −11 = γ 2
NkBT∑q,α
|Kα(q)|2 χ ′′α (q, ωN)
ωN. (16)
We mention that the spin–spin lattice relaxation time T2 of the 7Li NMR line is also givenby the same dynamic structure factor, but this time at ω = 0:
δν ∝ 1
T2∝
∑�q
Kα(�q)Sα(�q, 0). (17)
Now, if we assume that the dissipative part of the dynamic spin susceptibility χ ′′α (q, ωN) is
simply proportional to the static magnetic susceptibility measured by the SQUID or from thefirst moment of the line, we can indeed successfully describe the temperature dependence ofT1 in the paramagnetic phase. Using similar arguments one can also explain the temperaturedependence of T2 shown in figure 11.
In the vicinity of a phase transition, however, it is the dynamic structure factor Sα(q, ω)
which determines the temperature dependence of T1. When the critical fluctuations becomeenhanced due to the divergence of the spin correlation length near TN, then one has Sα(q, ω) ∝(T/TN − 1)−β and the relaxation times should show a tendency for divergent behaviour. Thishas indeed been observed. However, below TN one may assume that nα is the limiting factor forthe relaxation. If nα is determined by the soliton density, then one expects to observe a strongincrease of relaxation times (or decrease of the relaxation rates), as has been observed. The re-laxation data thus seem to support the physical picture of pinned solitons obtained from the EPRlinewidth data. The fact that the stretched exponential parameter α is smaller for our LiMnPO4
sample also suggests that the concentration of pinning sites is rather higher in this sample thanin the bulk samples and may thus be responsible for the occurrence of weak ferromagnetism.

5548 D Arcon et al
5. Conclusions
In conclusion, we have compared the magnetic properties of LiMnPO4 and LiFePO4 powdersas prepared for electrochemical applications. Interestingly, we found that the magnetic groundstate of LiMnPO4 is very sensitive to various crystal imperfections and readily changes fromthe collinear antiferromagnetic state to a weak ferromagnetic state. This is not the casefor LiFePO4, whose collinear antiferromagnetic ground state is very robust. We suggestthat solitons may be very important magnetic excitations in this system and that pinning ofsolitons below TN together with frustration may play a decisive role in the formation of aweak ferromagnetic state in LiMnPO4. The difference in stability of the magnetic groundstates clearly reflects the difference in electronic structure of the two compounds and shouldbe taken into account in further electrochemical studies. In the light of these results it wouldbe interesting to investigate the variation of the electrochemical and magnetic properties as afunction of the particle size, morphology and sample preparation conditions.
Acknowledgments
AD acknowledges the financial support of NATO (grant number SfP 976913) and the EUthrough the ALCANDO project, contract No G5MA-CT-2002-04023.
References
[1] Padhi A K, Nanjundaswamy K S and Goodenough J B 1997 J. Electrochem. Soc. 144 1188[2] Huang H, Yin S-C and Nazar L F 2001 Electrochem. Solid-State Lett. 4 A170[3] Yamada A and Chung S-C 2001 J. Electrochem. Soc. 148 A960[4] Li G, Azuma H and Tohda M 2002 Electrochem. Solid-State Lett. 5 A135[5] Delacourt C, Poizot P, Morcrette M, Tarascon J-M and Masquelier C 2004 Chem. Mater. 16 93[6] Arcon D, Zorko A, Cevc P, Dominko R, Bele M, Jamnik J, Jaglicic Z and Golosovsky I 2004 J. Phys. Chem.
Solids at press[7] Santoro R P, Segal D J and Newman R E 1966 J. Phys. Chem. Solids 27 1192[8] Mays J M 1963 Phys. Rev. 131 38[9] Goni A, Lezama L, Barberies G E, Pizzaro J L, Arriortua M I and Rojo T 1996 J. Magn. Magn. Mater. 164 251
[10] Santoro R P and Newman R E 1967 Acta Crystallogr. 22 344[11] Rousse G, Rodriguez-Carvajal J, Patoux S and Masquelier C 2003 Chem. Mater. 15 4082[12] Bozorth R M and Kramer V 1959 J. Phys. Rad. 20 393[13] Gaberscek M, Dominko R, Bele M, Remskar M, Hanzel D and Jamnik J 2004 submitted[14] Dominko R, Gaberscek M, Bele M, Remskar M, Hanzel D and Jamnik J 2003 LiBD Electrode Materials
(Sept. 2003) (Extended Abstracts, Abstract No. 8)[15] Gaberscek M, Bele M, Drofenik J, Dominko R and Pejovnik S 2001 Electrochem. Solid-State Lett. 4 A187[16] Zaspel C E, Grigereit T E and Drumheller J E 1995 Phys. Rev. Lett. 74 4539[17] Curely J and Rouch J 1998 Physica B 254 298[18] Richards P M 1976 Local Properties at Phase Transitions ed K A Muller (Amsterdam: North-Holland) p 539[19] Soos Z G, Cheung T T P and McGregor K T 1977 Chem. Phys. Lett. 46 600[20] Seehra M S and Castner T C 1968 Phys. Kondens. Mater. 7 185[21] Belavin A A and Polyakov A M 1975 JETP Lett. 22 245[22] Subbaraman K, Zaspel C E and Drumheller J E 1998 Phys. Rev. Lett. 80 2201[23] Tucker M C, Doeff M M, Richardson T J, Finones R, Cairns E J and Reimer J A 2002 J. Am. Chem. Soc. 124
3832[24] Slichter C P 1992 Principles of Magnetic Resonance (New York: Springer)[25] Ganguly P, Venkatraman T N, Pradhan S, Rajamohanan P and Ganapathy S 1996 J. Phys. Chem. 100 5017[26] Schweiger A and Jeschke G 2001 Principles of Pulsed Electron Paramagnetic Resonance (Oxford: Oxford
University Press)[27] Kubo R and Tomita K 1954 J. Phys. Soc. Japan 9 888[28] Moriya T 1962 Prog. Theor. Phys. 28 371