Embed Size (px)
Citation preview
Acta Materialia 51 (2003) 6341–6357www.actamat-journals.com
A comparative study of precipitation behavior of Heuslerphase (Ni2TiAl) from B2-TiNi in Ni–Ti–Al and Ni–Ti–Al–X
(X = Hf, Pd, Pt, Zr) alloysJ. Jung, G. Ghosh !, G.B. Olson
Department of Materials Science and Engineering, Robert R. McCormick School of Engineering and Applied Science,Northwestern University, 2220 Campus Dr., Evanston, IL 60208-3108, USA
Received 22 May 2003; received in revised form 30 July 2003; accepted 8 August 2003
Abstract
In support of the design of high strength TiNi-based shape-memory alloys, the precipitation of L21–Ni2TiAl phasefrom a supersaturated B2–TiNi matrix at 600 and 800 °C is studied using transmission and analytical electronmicroscopy (TEM/AEM), and 3D atom-probe microscopy (3DAP) in Ni–Ti–Al and Ni–Ti–Al–X (X = Hf, Pd, Pt,Zr) alloys. A B2/L21 fully coherent two-phase microstructure is confirmed to be analogous to the classical γ /γ! systemin terms of precipitate shape, spatial distribution and a minimum distance of separation between L21 precipitates asdictated by the interplay between strain and interfacial energies. The effects are also confirmed to disappear with lossof coherency. These results lend further support, at least qualitatively, to the theoretical predictions of microstructuraldynamics of coherent aggregates. Selected cohesive properties of stable and virtual B2 compounds are calculated byan ab initio method, showing good agreement with measured site occupancy and lattice parameters. A simple analysisof the L21 precipitate size evolution suggests that in the case of alloys with Al, Zr or Hf substitution for Ti, theprecipitates follow coarsening kinetics at 600 °C and growth kinetics at 800 °C, while for alloys with Pd or Pt substi-tution for Ni, precipitates follow one kinetic behavior at both temperatures. The temperature-dependent partitioningbehaviors of Hf, Pd, Pt and Zr are established by quantitative microanalysis using AEM and nanoscale analysis using3DAP. Both Hf and Zr prefer to partition to the B2 phase at 800 °C while they exhibit reverse behavior at 600°C. Ptalso partitions to B2 at 800 °C, while Pd partitions to the L21 phase at both 600 and 800 °C. To describe the compositiondependence of the lattice parameter of multicomponent B2 and L21 phases, the atomic volumes of Al, Hf, Ni, Ti andZr in B2 and L21 phases are determined, providing a model for the control of interphase misfit in alloy design. 2003 Acta Materialia Inc. Published by Elsevier Ltd. All rights reserved.
Keywords: 3DAP; Ab initio electron theory; Analytical electron microscopy; Heusler phases; Intermetallic phases; Kinetics; Precipi-tation
1. Introduction
The shape-memory effect is caused by a thermo-elastic martensitic transformation—a reversible
! Corresponding author. Tel.: +1-847-467-2595; fax: +1-847-491-7820.
E-mail address: [email protected] (G. Ghosh).
1359-6454/$30.00 2003 Acta Materialia Inc. Published by Elsevier Ltd. All rights reserved.doi:10.1016/j.actamat.2003.08.003
transformation between two different crystallinemicrostructures that occurs when a shape-memoryalloy (SMA) is heated or cooled. An SMA isdeformed in the martensite condition, and theshape recovery occurs during heating when thespecimen undergoes a reverse transformation ofthe martensite to the parent phase. Under con-strained conditions, the output stress during rever-
6342 J. Jung et al. / Acta Materialia 51 (2003) 6341–6357
sion is limited by the flow strength of the parentphase. For engineering applications, it is alsoessential that the shape-memory behavior is repeat-able and predictable after many cycles throughthe transformation.To improve both the output force and the cyclic
lifetime of TiNi-based SMAs, the strength of thealloy must be improved. By raising the criticalshear stress for slip, the irreversible slip defor-mation during the martensite reorientation andstress-induced martensite transformation can besuppressed, which in turn improves the shapememory effect and transformation superelasticitycharacteristics [1]. The introduction of nanoscalesecond phase particles to serve as barriers to dislo-cation motion would also improve the fatigue life.Based on the structural analogy of fcc-based γ /γ!Ni superalloys, the precipitation of equilibriumHeusler phase (Ni2TiAl-type with L21 structure) inB2–TiNi is considered for strengthening in thepresent work. Koizumi et al. [2] previously demon-strated that the precipitation of Heusler phaseincreases the 0.2% compressive yield strength of astable 50.71Ni–40.86Ti–8.43Al (in at.%) alloy byan order of magnitude up to 2300 MPa. Anotherprecipitation strengthening method involves theformation of a metastable bct phase [3,4]. How-ever, so far, this strategy has been realized onlyduring the annealing of sputter deposited TiNithin films.According to the known lattice constants [5],
there is a lattice misfit between TiNi and Ni2TiAl,as determined by the relation
d " !aNi2TiAl#2aTiNi2aTiNi " " #0.0257 (1)
where aNi2TiAl is the lattice parameter of Ni2TiAl(a = 0.5865 nm) and aTiNi is the lattice parameterof TiNi (a = 0.3010 nm). Lattice misfit arisingfrom different lattice parameters between twocoherent phases causes coherency strains with anassociated volume strain energy that can affect theprecipitate shape, the spatial distribution and thecoarsening behavior [6]. To promote fine scalehomogeneous precipitation, to retain coherency atlarger particle size and to reduce the interfacialfrictional work for martensite nucleation and vari-ant growth, it is necessary to minimize the lattice
mismatch. To achieve the lowest possible misfitbetween B2 and L21 phases, the possibility ofincreasing the lattice parameter of the latter phaseby adding Hf, Pd, Pt, or Zr in the alloy is con-sidered.It is well known that dissolved Al in B2–TiNi
decreases the martensite start temperature drasti-cally [7]. To offset this effect, elements which canstabilize the martensite phase will have to beadded. In this regard, Hf, Zr, Pd, and Pt are candi-date components as they are known as martensitestabilizers and also effective in reducing the latticemisfit between the B2 and L21 phase [8–11]. How-ever, to control misfit and martensite stability insuch a two-phase system, it is necessary to knowthe relative partitioning behavior that is establishedduring high temperature heat treatment [12].In the present work, the B2–L21 phase relations
are quantified in Ni–Ti–Al and Ni–Ti–Al–X (X= Hf, Pd, Pt, Zr) model alloys. The primary objec-tives of this study are: (i) to investigate precipi-tation kinetics and microstructure evolution of L21precipitates in a B2 matrix during isothermal agingat 600 and 800 °C, (ii) to quantify partitioningbehavior of Hf, Pd, Pt and Zr between B2 and L21at 600 and 800 °C, and (iii) to develop and test thecomposition dependence of the lattice parametersof multicomponent B2 and L21 phases.
2. Experimental procedures
Ni–Ti–Al and Ni–Ti–Al–X (X = Hf, Pd, Pt,Zr) alloys were prepared by arc-melting in anargon atmosphere using pure elements (99.98–99.994 wt.% Ni, 99.99 wt.% Ti, 99.999 wt.% Al,99.9 wt.% Hf, 99.98 wt.% Pd, 99.95 wt.% Pt, and99.999 wt.% Zr). The nominal chemical compo-sitions of each of these alloys are shown in Table1. Taking equiatomic TiNi as a reference, in alloysA, A + 5Hf and A + 5Zr, the Ni-content was keptat 50 at.%, while Ti was partially replaced by Al,Hf or Zr. On the other hand, in alloys B + 5Pd,B + 20Pd and B + 5Pt, Ni was partially substitutedby Pd and Pt.Each as-cast specimen was sealed in an evacu-
ated quartz capsule and solution treated at 1100 °Cfor 100 h. After quenching by crushing the cap-
6343J. Jung et al. / Acta Materialia 51 (2003) 6341–6357
Table 1Nominal chemical composition of alloys (at.%)
Alloys Ni Ti Al Hf Zr Pd Pt
A 50 45 5 – – – –A + 5Hf 50 40 5 5 – – –A + 5Zr 50 40 5 – 5 – –B + 5Pd 45 44 6 – – 5 –B + 20Pd 30 44 6 – – 20 –B + 5Pt 45 44 6 – – – 5
sules in oil, different sets of A, A + 5Hf, and A+ 5Zr specimens were annealed at 800 °C for 1000h and at 600 °C for 1000 and 2000 h in evacuatedquartz capsules, and then quenched into oil.Samples of B + 5Pd, B + 20Pd, and B + 5Pt speci-mens were annealed at 800 or 600 °C for 100 h inevacuated quartz capsules, and then quenched intooil. Although binary TiNi alloys are typically agedat 550 °C for 1 h to produce metastable Ni4Ti3particles [13], in the present work, the specimensare aged for a prolonged time to grow the Heuslerphase precipitates sufficiently large for the compo-sition analysis. Thin foils for transmission electronmicroscopy (TEM) observation were prepared bystandard twinjet electropolishing using a solutionof 20% perchloric acid in 80% methanol as electro-lyte at #40 to #50 °C.Conventional transmission electron microscopy
(CTEM) was performed in a Hitachi H8100 micro-scope operated at 200 kV. The centered dark-fieldTEM micrographs were scanned and the projectedarea of the L21 precipitates was measured on aMacintosh computer using the public domain NIHImage program [14]. Based on these measure-ments, the average equivalent spherical radius ofthe precipitates was derived.For most specimens aged at 800 °C, the analyti-
cal characterization was performed in a HitachiHF-2000 analytical electron microscope (AEM)equipped with an ultrathin-window Link energydispersive X-ray (EDS) detector. The AEM wasalso operated at 200 kV. The take-off angle for theEDS detector was 68°. The X-ray collection timewas 100 s and the electron probe size was about8 nm. Care was taken to ensure that the particlebeing analyzed was not in a two-beam condition in
order to minimize electron-channeling effects [15].Background correction was done using theDesktop Spectrum Analyzer (DTSA 2.5.1)software [16].The compositions of B2 and L21 phases in equi-
librium at 800 °C were determined by analyzingthe EDS data using a standard calibration method.The background-subtracted integrated intensities ofthe X-ray spectra were converted to compositionsby the procedure described in Ref. [17]. X-rayspectra were collected from foils with a thicknessof 100 nm or less. In this thickness range, Hf, Ni,Pd, Pt, Ti and Zr satisfied the criterion of a thin foiland the Cliff–Lorimer factor for Al was determinedusing the extrapolation method [18] due to thestrong thickness dependence.The compositions of B2 and L21 phases were
determined by analyzing about 30 EDS spectra foreach. The statistical accuracy of the compositiondetermination is primarily limited by the countingstatistics of the X-ray collection process [19]. Theconfidence interval is estimated by the statistics ofthe Student t-distribution. The relationship betweenthe atomic fraction and the weight fraction wasused to calculate the total relative error in the for-mer from that in the latter using a standard math-ematical procedure.The Heusler precipitates formed at 600 °C are
in general much too small compared to the foilthickness, and as a result, the EDS spectra wouldinvariably contain some contribution from thematrix. Hence, the determination of exact compo-sition of precipitates from EDS data would neces-sarily involve correction for the matrix overlap. Toeliminate these uncertainties, a 3-dimensionalatom-probe (3DAP) field-ion microscope was

6344 J. Jung et al. / Acta Materialia 51 (2003) 6341–6357
employed to determine the composition of thephases in specimens aged at 600 °C. The 3DAP isequipped with a reflectron lens for energy compen-sated time-of-flight mass spectrometry. Field-ionmicroscopy tips were prepolished in a solution of5–10 vol.% perchloric acid in butoxyethanol fol-lowed by an electropolishing in 2 vol.% perchloricacid in butoxyethanol. For field-ion imaging, 1 ×10#5 Pa Ne was used, and the tips were cooled to#213 °C. Atom-probe analyses were carried outat #213 °C at a pulse voltage-to-d.c. voltage ratiof = 0.20. The statistical error of 3DAP data iscaused by the uncertainty due to counting statistics.The peaks were deconvoluted in reference to thenatural isotope abundances to obtain correct com-positions.X-ray diffraction was performed using a Scintag
machine with a copper target, excited to 40 kV and20 mA. A step size of 0.01° and a counting timeof 30 s per step were used for X-ray diffractionexperiments. The X-ray diffraction peaks weredeconvoluted by the MacDiff program [20], usinga pseudo-Voigt method [21], to obtain the latticeparameter of B2 and L21 phases. High purity sili-con powder was used as a standard for correctingthe diffractometer misalignment.
3. Computational methodology
The formation energies of 11 B2 compounds rel-evant to the present study were carried out usingthe Vienna ab initio Simulation Package (VASP),the details of which are described elsewhere[22,23]. The VASP code is based on the electronicdensity functional theory. The VASP codeimplements Vanderbilt ultrasoft pseudopotentials[24], and uses iterative strategies based on residualminimization and preconditioned conjugate-gradi-ent techniques for the diagonalization of the Kohn–Sham Hamiltonian. The energy cut-off for theplane-wave basis set was 314 eV.For the Brillouin-Zone integration, Methfessel–
Paxton [25] technique with a modest smearing ofthe one electron levels (0.1 eV) is used. The K-point mesh for Brillouin-Zone integration was con-structed using the Monkhorst–Pack [26] scheme. Amesh of 20 × 20 × 20 was used, and the resulting
formation energies are estimated to be numericallyconverged to a precision of about 1 meV/atom. ForNi and Ni-containing B2 phases, spin-polarizedcalculations are employed. All ab initio total ener-gies are calculated at the generalized gradientapproximation level to account for the non-localityof the exchange-correlation functional. Also, inthis study, Ti-3p and Zr-4p states are treated asvalence electrons.
4. Results
4.1. Phases and microstructure: CTEM
The presence/absence of Heusler phase in thinfoils can be confirmed by examining the trans-mission electron diffraction pattern either along[1 1 0] or along [1 1 2] zone axis. Accordingly, thethin foils of as-quenched and aged specimens werealways examined along or close to either of thesezone axes.Fig. 1 shows bright-field images of solution
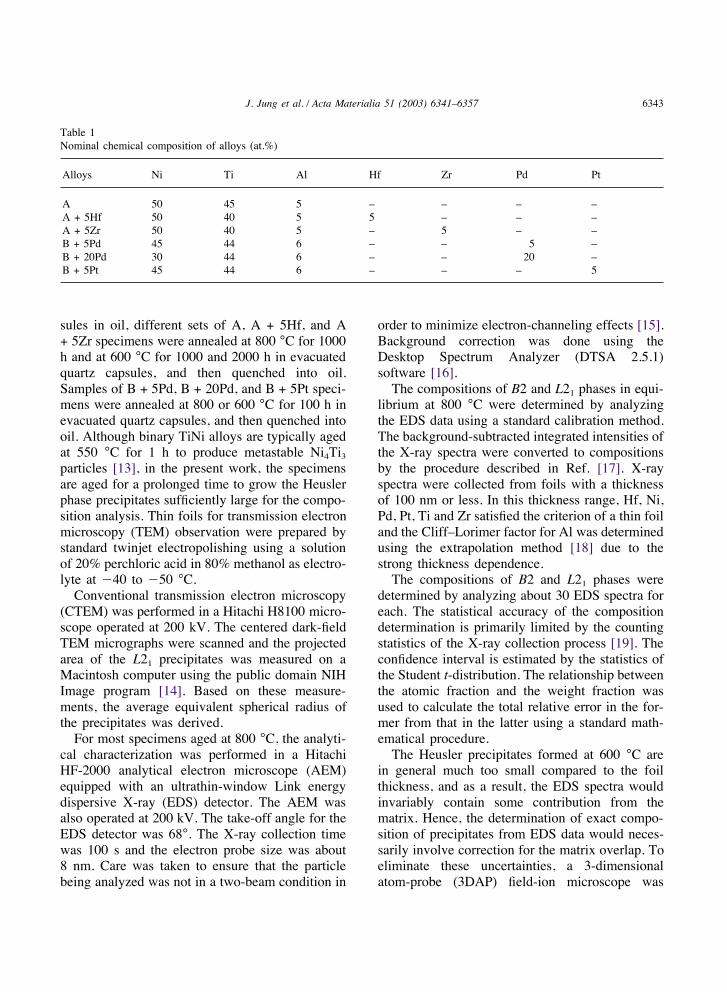
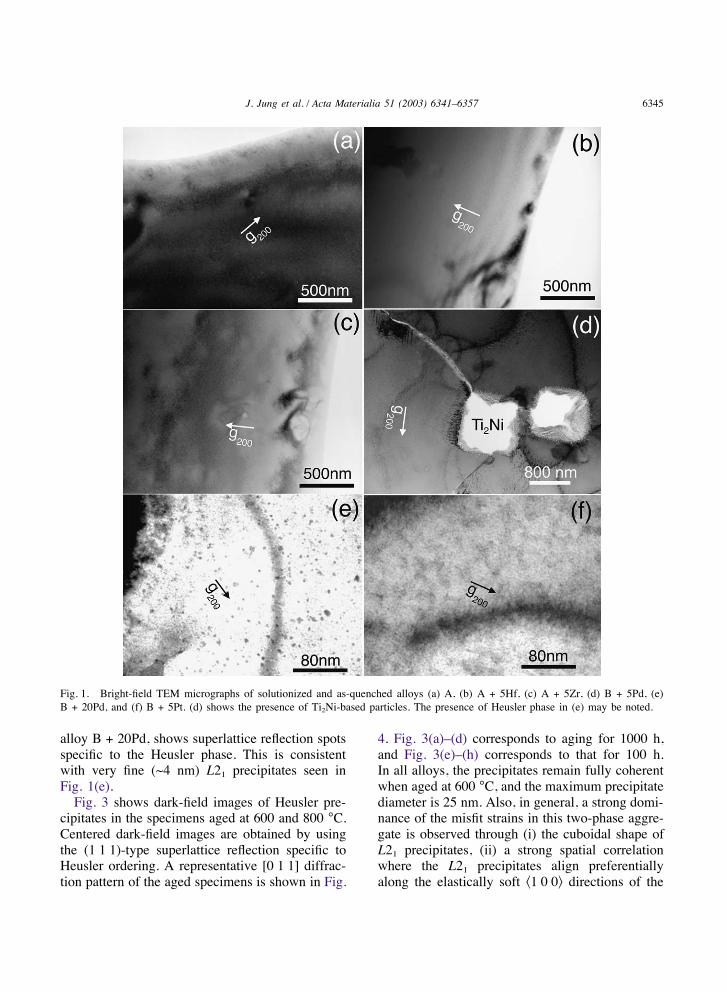
treated and quenched specimens. Fig. 1(d) showslarge Ti2Ni-based particles located on or near grainboundaries. These particles are preferentiallyetched by the electrolyte, which is consistent withthe fact that Ti2Ni is prone to corrosion [27]. Ti2Nimelts at 984 °C [28], significantly lower than thesolution temperature of 1100 °C. The morphologyof these particles suggests that the Ti2Ni-basedphase existed as liquid droplets at the solutiontreatment, solidifying during the subsequent oilquenching. Fig. 1(e) shows a bright-field TEMmicrograph of solutionized B + 20Pd specimenshowing evidence of Heusler precipitates. How-ever, Ti2Ni-based particles were not observed. Avery small size of the Heusler precipitates ($4 nmin diameter) in Fig. 1(e) suggests that precipitationoccurred during quenching, and they were notpresent at the solution treatment temperature. Onthe other hand, the as-quenched B + 5Pt alloy doesnot exhibit Heusler precipitates.Fig. 2(a) shows the [0 1 1] diffraction pattern
that is observed in A, A + 5Hf, A + 5Zr, B +5Pd, and B + 5Pt alloys, and it clearly shows theabsence of any Heusler phase. On the other hand,the [0 1 1] diffraction pattern in Fig. 2(b), from
6345J. Jung et al. / Acta Materialia 51 (2003) 6341–6357
Fig. 1. Bright-field TEM micrographs of solutionized and as-quenched alloys (a) A, (b) A + 5Hf, (c) A + 5Zr, (d) B + 5Pd, (e)B + 20Pd, and (f) B + 5Pt. (d) shows the presence of Ti2Ni-based particles. The presence of Heusler phase in (e) may be noted.
alloy B + 20Pd, shows superlattice reflection spotsspecific to the Heusler phase. This is consistentwith very fine (~4 nm) L21 precipitates seen inFig. 1(e).Fig. 3 shows dark-field images of Heusler pre-
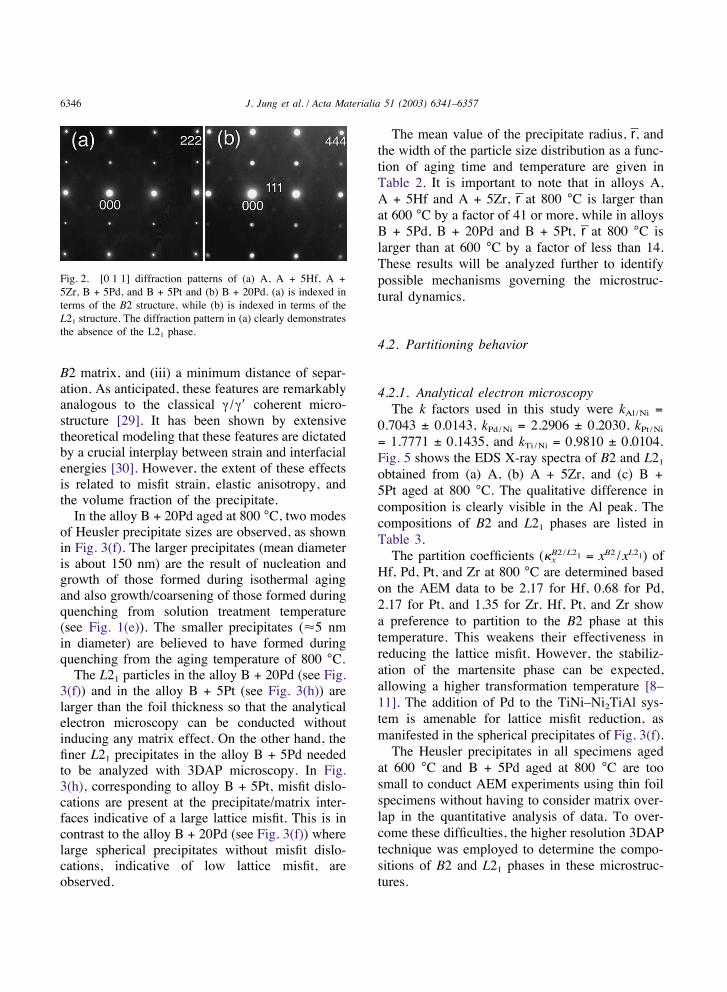
cipitates in the specimens aged at 600 and 800 °C.Centered dark-field images are obtained by usingthe (1 1 1)-type superlattice reflection specific toHeusler ordering. A representative [0 1 1] diffrac-tion pattern of the aged specimens is shown in Fig.
4. Fig. 3(a)–(d) corresponds to aging for 1000 h,and Fig. 3(e)–(h) corresponds to that for 100 h.In all alloys, the precipitates remain fully coherentwhen aged at 600 °C, and the maximum precipitatediameter is 25 nm. Also, in general, a strong domi-nance of the misfit strains in this two-phase aggre-gate is observed through (i) the cuboidal shape ofL21 precipitates, (ii) a strong spatial correlationwhere the L21 precipitates align preferentiallyalong the elastically soft #1 0 0$ directions of the
6346 J. Jung et al. / Acta Materialia 51 (2003) 6341–6357
Fig. 2. [0 1 1] diffraction patterns of (a) A, A + 5Hf, A +5Zr, B + 5Pd, and B + 5Pt and (b) B + 20Pd. (a) is indexed interms of the B2 structure, while (b) is indexed in terms of theL21 structure. The diffraction pattern in (a) clearly demonstratesthe absence of the L21 phase.
B2 matrix, and (iii) a minimum distance of separ-ation. As anticipated, these features are remarkablyanalogous to the classical γ /γ! coherent micro-structure [29]. It has been shown by extensivetheoretical modeling that these features are dictatedby a crucial interplay between strain and interfacialenergies [30]. However, the extent of these effectsis related to misfit strain, elastic anisotropy, andthe volume fraction of the precipitate.In the alloy B + 20Pd aged at 800 °C, two modes
of Heusler precipitate sizes are observed, as shownin Fig. 3(f). The larger precipitates (mean diameteris about 150 nm) are the result of nucleation andgrowth of those formed during isothermal agingand also growth/coarsening of those formed duringquenching from solution treatment temperature(see Fig. 1(e)). The smaller precipitates (%5 nmin diameter) are believed to have formed duringquenching from the aging temperature of 800 °C.The L21 particles in the alloy B + 20Pd (see Fig.
3(f)) and in the alloy B + 5Pt (see Fig. 3(h)) arelarger than the foil thickness so that the analyticalelectron microscopy can be conducted withoutinducing any matrix effect. On the other hand, thefiner L21 precipitates in the alloy B + 5Pd neededto be analyzed with 3DAP microscopy. In Fig.3(h), corresponding to alloy B + 5Pt, misfit dislo-cations are present at the precipitate/matrix inter-faces indicative of a large lattice misfit. This is incontrast to the alloy B + 20Pd (see Fig. 3(f)) wherelarge spherical precipitates without misfit dislo-cations, indicative of low lattice misfit, areobserved.
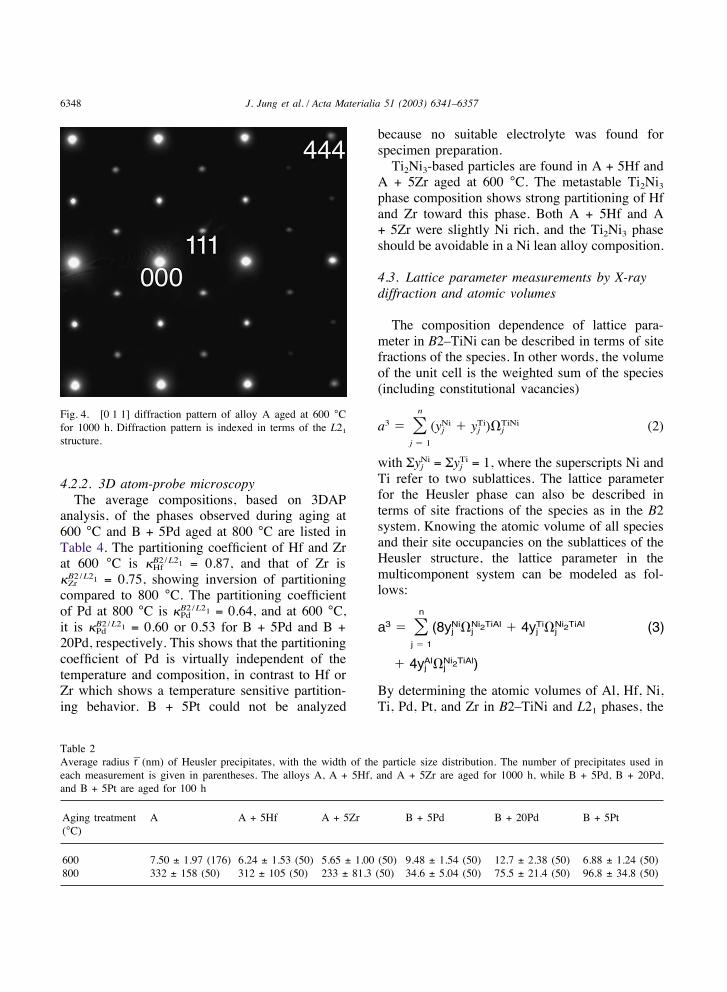
The mean value of the precipitate radius, r, andthe width of the particle size distribution as a func-tion of aging time and temperature are given inTable 2. It is important to note that in alloys A,A + 5Hf and A + 5Zr, r at 800 °C is larger thanat 600 °C by a factor of 41 or more, while in alloysB + 5Pd, B + 20Pd and B + 5Pt, r at 800 °C islarger than at 600 °C by a factor of less than 14.These results will be analyzed further to identifypossible mechanisms governing the microstruc-tural dynamics.
4.2. Partitioning behavior
4.2.1. Analytical electron microscopyThe k factors used in this study were kAl/Ni =
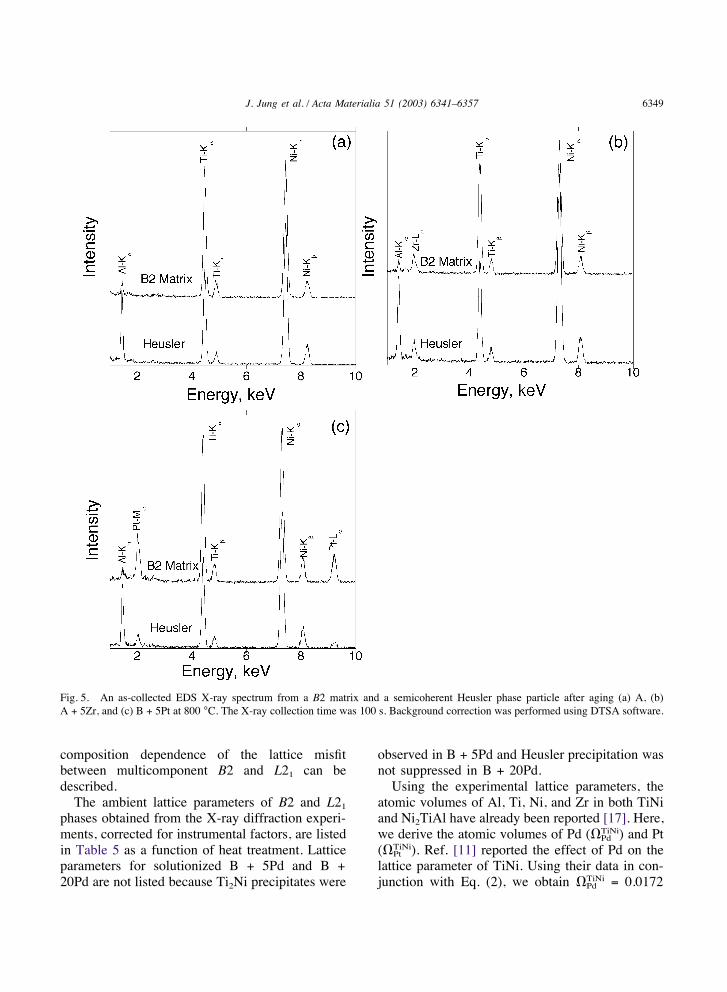
0.7043 ± 0.0143, kPd/Ni = 2.2906 ± 0.2030, kPt/Ni= 1.7771 ± 0.1435, and kTi /Ni = 0.9810 ± 0.0104.Fig. 5 shows the EDS X-ray spectra of B2 and L21obtained from (a) A, (b) A + 5Zr, and (c) B +5Pt aged at 800 °C. The qualitative difference incomposition is clearly visible in the Al peak. Thecompositions of B2 and L21 phases are listed inTable 3.The partition coefficients (%B2/L21x = xB2 /xL21) of
Hf, Pd, Pt, and Zr at 800 °C are determined basedon the AEM data to be 2.17 for Hf, 0.68 for Pd,2.17 for Pt, and 1.35 for Zr. Hf, Pt, and Zr showa preference to partition to the B2 phase at thistemperature. This weakens their effectiveness inreducing the lattice misfit. However, the stabiliz-ation of the martensite phase can be expected,allowing a higher transformation temperature [8–11]. The addition of Pd to the TiNi–Ni2TiAl sys-tem is amenable for lattice misfit reduction, asmanifested in the spherical precipitates of Fig. 3(f).The Heusler precipitates in all specimens aged
at 600 °C and B + 5Pd aged at 800 °C are toosmall to conduct AEM experiments using thin foilspecimens without having to consider matrix over-lap in the quantitative analysis of data. To over-come these difficulties, the higher resolution 3DAPtechnique was employed to determine the compo-sitions of B2 and L21 phases in these microstruc-tures.

6347J. Jung et al. / Acta Materialia 51 (2003) 6341–6357
Fig. 3. Dark-field TEM micrographs of specimens aged at 600 (a, c, e, g) and 800 °C (b, d, f, h) showing fully coherent Heuslerprecipitates: (a–b) alloy A, (c–d) alloy A + 5Zr, (e–f) alloy B + 20Pd, (g–h) alloy B + 5Pt. Aging time for (a–d) is 1000 h, and for(e–h) it is 100 h.
6348 J. Jung et al. / Acta Materialia 51 (2003) 6341–6357
Fig. 4. [0 1 1] diffraction pattern of alloy A aged at 600 °Cfor 1000 h. Diffraction pattern is indexed in terms of the L21structure.
4.2.2. 3D atom-probe microscopyThe average compositions, based on 3DAP
analysis, of the phases observed during aging at600 °C and B + 5Pd aged at 800 °C are listed inTable 4. The partitioning coefficient of Hf and Zrat 600 °C is %B2/L21Hf = 0.87, and that of Zr is%B2/L21Zr = 0.75, showing inversion of partitioningcompared to 800 °C. The partitioning coefficientof Pd at 800 °C is %B2/L21Pd = 0.64, and at 600 °C,it is %B2/L21Pd = 0.60 or 0.53 for B + 5Pd and B +20Pd, respectively. This shows that the partitioningcoefficient of Pd is virtually independent of thetemperature and composition, in contrast to Hf orZr which shows a temperature sensitive partition-ing behavior. B + 5Pt could not be analyzed
Table 2Average radius r (nm) of Heusler precipitates, with the width of the particle size distribution. The number of precipitates used ineach measurement is given in parentheses. The alloys A, A + 5Hf, and A + 5Zr are aged for 1000 h, while B + 5Pd, B + 20Pd,and B + 5Pt are aged for 100 h
Aging treatment A A + 5Hf A + 5Zr B + 5Pd B + 20Pd B + 5Pt(°C)
600 7.50 ± 1.97 (176) 6.24 ± 1.53 (50) 5.65 ± 1.00 (50) 9.48 ± 1.54 (50) 12.7 ± 2.38 (50) 6.88 ± 1.24 (50)800 332 ± 158 (50) 312 ± 105 (50) 233 ± 81.3 (50) 34.6 ± 5.04 (50) 75.5 ± 21.4 (50) 96.8 ± 34.8 (50)
because no suitable electrolyte was found forspecimen preparation.Ti2Ni3-based particles are found in A + 5Hf and
A + 5Zr aged at 600 °C. The metastable Ti2Ni3phase composition shows strong partitioning of Hfand Zr toward this phase. Both A + 5Hf and A+ 5Zr were slightly Ni rich, and the Ti2Ni3 phaseshould be avoidable in a Ni lean alloy composition.
4.3. Lattice parameter measurements by X-raydiffraction and atomic volumes
The composition dependence of lattice para-meter in B2–TiNi can be described in terms of sitefractions of the species. In other words, the volumeof the unit cell is the weighted sum of the species(including constitutional vacancies)
a3 " &nj " 1
(yNij & yTij )'TiNij (2)
with ΣyNij = ΣyTij = 1, where the superscripts Ni andTi refer to two sublattices. The lattice parameterfor the Heusler phase can also be described interms of site fractions of the species as in the B2system. Knowing the atomic volume of all speciesand their site occupancies on the sublattices of theHeusler structure, the lattice parameter in themulticomponent system can be modeled as fol-lows:
a3 " &nj " 1
(8yNij 'Ni2TiAlj & 4yTij 'Ni2TiAlj (3)
& 4yAlj 'Ni2TiAlj )
By determining the atomic volumes of Al, Hf, Ni,Ti, Pd, Pt, and Zr in B2–TiNi and L21 phases, the
6349J. Jung et al. / Acta Materialia 51 (2003) 6341–6357
Fig. 5. An as-collected EDS X-ray spectrum from a B2 matrix and a semicoherent Heusler phase particle after aging (a) A, (b)A + 5Zr, and (c) B + 5Pt at 800 °C. The X-ray collection time was 100 s. Background correction was performed using DTSA software.
composition dependence of the lattice misfitbetween multicomponent B2 and L21 can bedescribed.The ambient lattice parameters of B2 and L21
phases obtained from the X-ray diffraction experi-ments, corrected for instrumental factors, are listedin Table 5 as a function of heat treatment. Latticeparameters for solutionized B + 5Pd and B +20Pd are not listed because Ti2Ni precipitates were
observed in B + 5Pd and Heusler precipitation wasnot suppressed in B + 20Pd.Using the experimental lattice parameters, the
atomic volumes of Al, Ti, Ni, and Zr in both TiNiand Ni2TiAl have already been reported [17]. Here,we derive the atomic volumes of Pd ('TiNi
Pd ) and Pt('TiNi
Pt ). Ref. [11] reported the effect of Pd on thelattice parameter of TiNi. Using their data in con-junction with Eq. (2), we obtain 'TiNi
Pd = 0.0172
6350 J. Jung et al. / Acta Materialia 51 (2003) 6341–6357
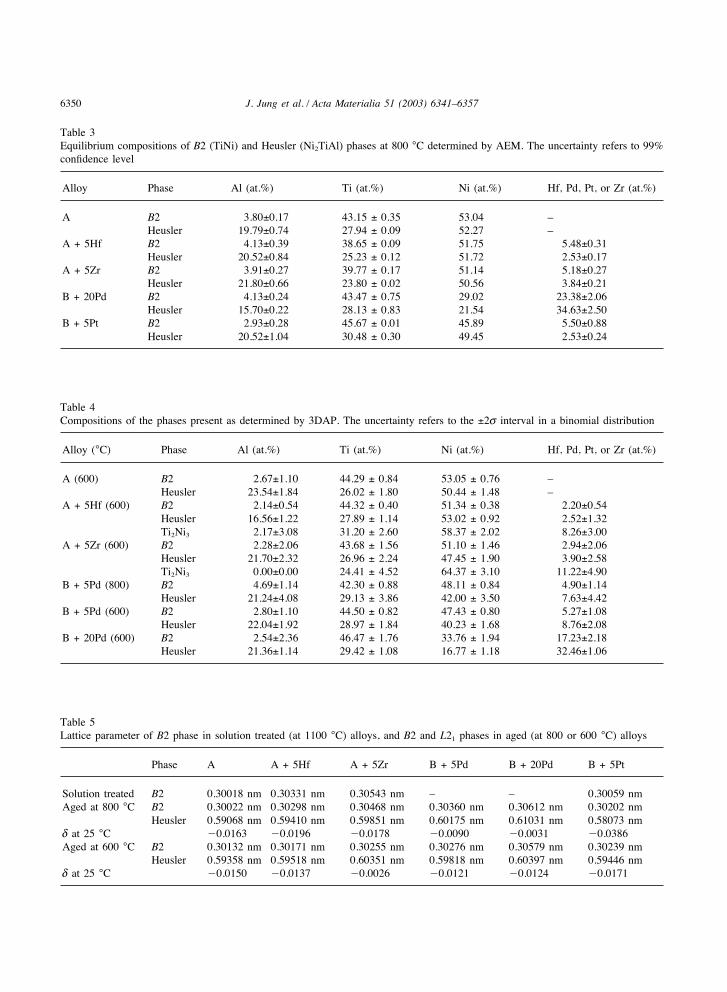
Table 3Equilibrium compositions of B2 (TiNi) and Heusler (Ni2TiAl) phases at 800 °C determined by AEM. The uncertainty refers to 99%confidence level
Alloy Phase Al (at.%) Ti (at.%) Ni (at.%) Hf, Pd, Pt, or Zr (at.%)
A B2 3.80±0.17 43.15 ± 0.35 53.04 –Heusler 19.79±0.74 27.94 ± 0.09 52.27 –
A + 5Hf B2 4.13±0.39 38.65 ± 0.09 51.75 5.48±0.31Heusler 20.52±0.84 25.23 ± 0.12 51.72 2.53±0.17
A + 5Zr B2 3.91±0.27 39.77 ± 0.17 51.14 5.18±0.27Heusler 21.80±0.66 23.80 ± 0.02 50.56 3.84±0.21
B + 20Pd B2 4.13±0.24 43.47 ± 0.75 29.02 23.38±2.06Heusler 15.70±0.22 28.13 ± 0.83 21.54 34.63±2.50
B + 5Pt B2 2.93±0.28 45.67 ± 0.01 45.89 5.50±0.88Heusler 20.52±1.04 30.48 ± 0.30 49.45 2.53±0.24
Table 4Compositions of the phases present as determined by 3DAP. The uncertainty refers to the ±2s interval in a binomial distribution
Alloy (°C) Phase Al (at.%) Ti (at.%) Ni (at.%) Hf, Pd, Pt, or Zr (at.%)
A (600) B2 2.67±1.10 44.29 ± 0.84 53.05 ± 0.76 –Heusler 23.54±1.84 26.02 ± 1.80 50.44 ± 1.48 –
A + 5Hf (600) B2 2.14±0.54 44.32 ± 0.40 51.34 ± 0.38 2.20±0.54Heusler 16.56±1.22 27.89 ± 1.14 53.02 ± 0.92 2.52±1.32Ti2Ni3 2.17±3.08 31.20 ± 2.60 58.37 ± 2.02 8.26±3.00
A + 5Zr (600) B2 2.28±2.06 43.68 ± 1.56 51.10 ± 1.46 2.94±2.06Heusler 21.70±2.32 26.96 ± 2.24 47.45 ± 1.90 3.90±2.58Ti2Ni3 0.00±0.00 24.41 ± 4.52 64.37 ± 3.10 11.22±4.90
B + 5Pd (800) B2 4.69±1.14 42.30 ± 0.88 48.11 ± 0.84 4.90±1.14Heusler 21.24±4.08 29.13 ± 3.86 42.00 ± 3.50 7.63±4.42
B + 5Pd (600) B2 2.80±1.10 44.50 ± 0.82 47.43 ± 0.80 5.27±1.08Heusler 22.04±1.92 28.97 ± 1.84 40.23 ± 1.68 8.76±2.08
B + 20Pd (600) B2 2.54±2.36 46.47 ± 1.76 33.76 ± 1.94 17.23±2.18Heusler 21.36±1.14 29.42 ± 1.08 16.77 ± 1.18 32.46±1.06
Table 5Lattice parameter of B2 phase in solution treated (at 1100 °C) alloys, and B2 and L21 phases in aged (at 800 or 600 °C) alloys
Phase A A + 5Hf A + 5Zr B + 5Pd B + 20Pd B + 5Pt
Solution treated B2 0.30018 nm 0.30331 nm 0.30543 nm – – 0.30059 nmAged at 800 °C B2 0.30022 nm 0.30298 nm 0.30468 nm 0.30360 nm 0.30612 nm 0.30202 nm
Heusler 0.59068 nm 0.59410 nm 0.59851 nm 0.60175 nm 0.61031 nm 0.58073 nmd at 25 °C #0.0163 #0.0196 #0.0178 #0.0090 #0.0031 #0.0386Aged at 600 °C B2 0.30132 nm 0.30171 nm 0.30255 nm 0.30276 nm 0.30579 nm 0.30239 nm
Heusler 0.59358 nm 0.59518 nm 0.60351 nm 0.59818 nm 0.60397 nm 0.59446 nmd at 25 °C #0.0150 #0.0137 #0.0026 #0.0121 #0.0124 #0.0171
6351J. Jung et al. / Acta Materialia 51 (2003) 6341–6357
nm3. As there are no literature lattice parameterdata of B2 Ti(Ni,Pt) alloys, the lattice parameterof the solution treated B + 5Pt specimen was usedas a reference, and we obtain 'TiNi
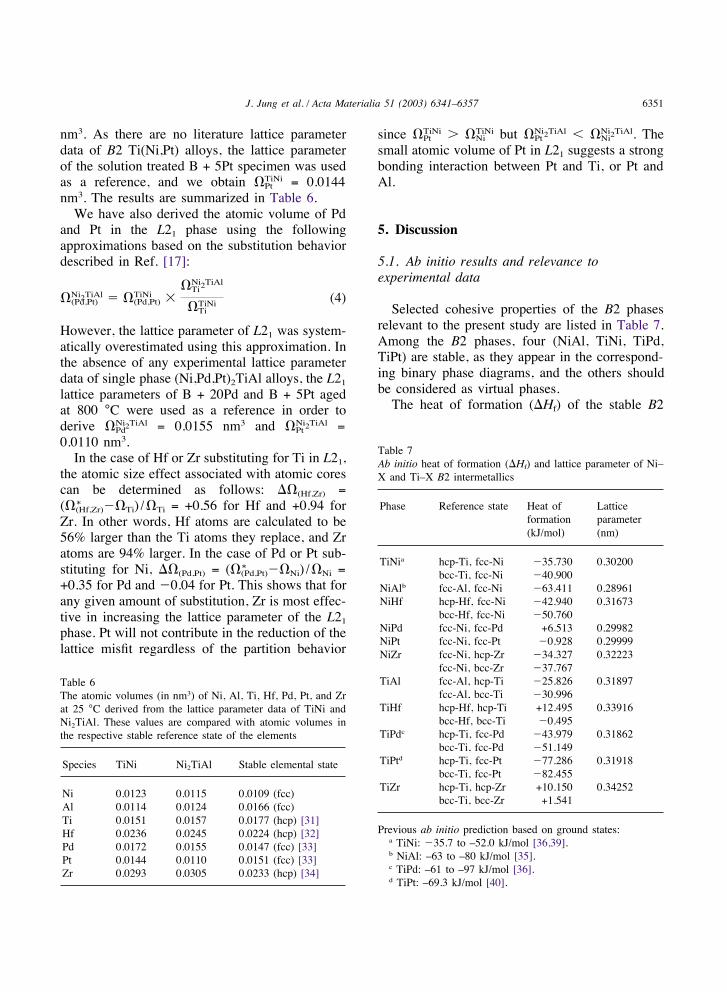
Pt = 0.0144nm3. The results are summarized in Table 6.We have also derived the atomic volume of Pd
and Pt in the L21 phase using the followingapproximations based on the substitution behaviordescribed in Ref. [17]:
'Ni2TiAl(Pd,Pt) " 'TiNi(Pd,Pt) (
'Ni2TiAlTi
'TiNiTi
(4)
However, the lattice parameter of L21 was system-atically overestimated using this approximation. Inthe absence of any experimental lattice parameterdata of single phase (Ni,Pd,Pt)2TiAl alloys, the L21lattice parameters of B + 20Pd and B + 5Pt agedat 800 °C were used as a reference in order toderive 'Ni2TiAlPd = 0.0155 nm3 and 'Ni2TiAlPt =0.0110 nm3.In the case of Hf or Zr substituting for Ti in L21,
the atomic size effect associated with atomic corescan be determined as follows: )'(Hf,Zr) =('!
(Hf,Zr)#'Ti) /'Ti = +0.56 for Hf and +0.94 forZr. In other words, Hf atoms are calculated to be56% larger than the Ti atoms they replace, and Zratoms are 94% larger. In the case of Pd or Pt sub-stituting for Ni, )'(Pd,Pt) = ('!
(Pd,Pt)#'Ni) /'Ni =+0.35 for Pd and #0.04 for Pt. This shows that forany given amount of substitution, Zr is most effec-tive in increasing the lattice parameter of the L21phase. Pt will not contribute in the reduction of thelattice misfit regardless of the partition behavior
Table 6The atomic volumes (in nm3) of Ni, Al, Ti, Hf, Pd, Pt, and Zrat 25 °C derived from the lattice parameter data of TiNi andNi2TiAl. These values are compared with atomic volumes inthe respective stable reference state of the elements
Species TiNi Ni2TiAl Stable elemental state
Ni 0.0123 0.0115 0.0109 (fcc)Al 0.0114 0.0124 0.0166 (fcc)Ti 0.0151 0.0157 0.0177 (hcp) [31]Hf 0.0236 0.0245 0.0224 (hcp) [32]Pd 0.0172 0.0155 0.0147 (fcc) [33]Pt 0.0144 0.0110 0.0151 (fcc) [33]Zr 0.0293 0.0305 0.0233 (hcp) [34]
since 'TiNiPt * 'TiNi
Ni but 'Ni2TiAlPt $ 'Ni2TiAlNi . Thesmall atomic volume of Pt in L21 suggests a strongbonding interaction between Pt and Ti, or Pt andAl.
5. Discussion
5.1. Ab initio results and relevance toexperimental data
Selected cohesive properties of the B2 phasesrelevant to the present study are listed in Table 7.Among the B2 phases, four (NiAl, TiNi, TiPd,TiPt) are stable, as they appear in the correspond-ing binary phase diagrams, and the others shouldbe considered as virtual phases.The heat of formation ()Hf) of the stable B2
Table 7Ab initio heat of formation ()Hf) and lattice parameter of Ni–X and Ti–X B2 intermetallics
Phase Reference state Heat of Latticeformation parameter(kJ/mol) (nm)
TiNia hcp-Ti, fcc-Ni #35.730 0.30200bcc-Ti, fcc-Ni #40.900
NiAlb fcc-Al, fcc-Ni #63.411 0.28961NiHf hcp-Hf, fcc-Ni #42.940 0.31673
bcc-Hf, fcc-Ni #50.760NiPd fcc-Ni, fcc-Pd +6.513 0.29982NiPt fcc-Ni, fcc-Pt #0.928 0.29999NiZr fcc-Ni, hcp-Zr #34.327 0.32223
fcc-Ni, bcc-Zr #37.767TiAl fcc-Al, hcp-Ti #25.826 0.31897
fcc-Al, bcc-Ti #30.996TiHf hcp-Hf, hcp-Ti +12.495 0.33916
bcc-Hf, bcc-Ti #0.495TiPdc hcp-Ti, fcc-Pd #43.979 0.31862
bcc-Ti, fcc-Pd #51.149TiPtd hcp-Ti, fcc-Pt #77.286 0.31918
bcc-Ti, fcc-Pt #82.455TiZr hcp-Ti, hcp-Zr +10.150 0.34252
bcc-Ti, bcc-Zr +1.541
Previous ab initio prediction based on ground states:a TiNi: #35.7 to –52.0 kJ/mol [36,39].b NiAl: –63 to –80 kJ/mol [35].c TiPd: –61 to –97 kJ/mol [36].d TiPt: –69.3 kJ/mol [40].
6352 J. Jung et al. / Acta Materialia 51 (2003) 6341–6357
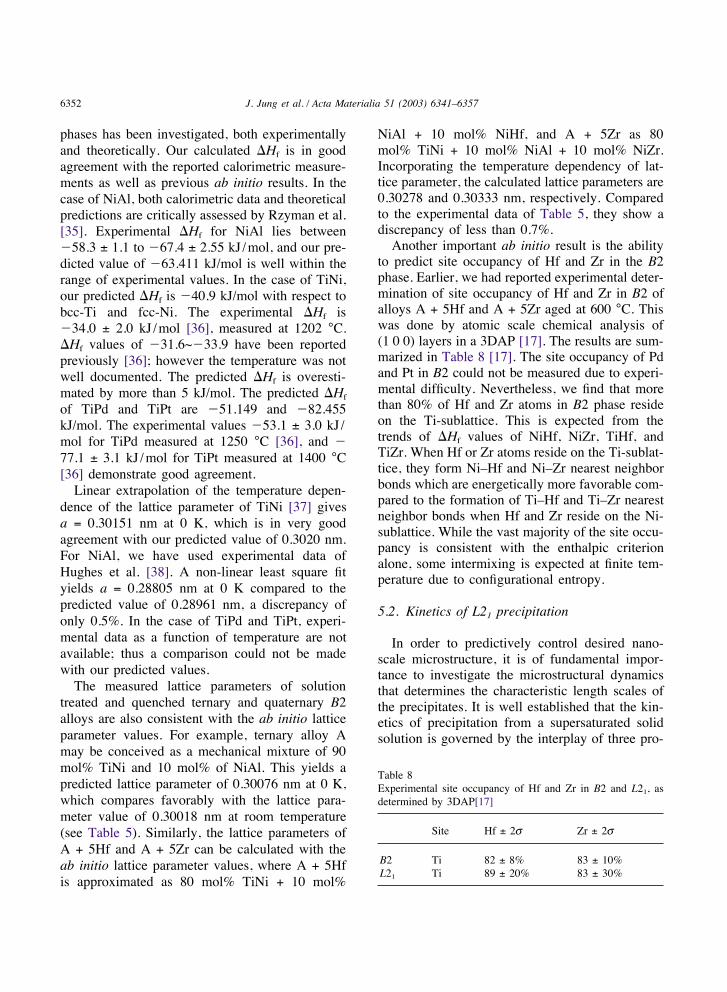
phases has been investigated, both experimentallyand theoretically. Our calculated )Hf is in goodagreement with the reported calorimetric measure-ments as well as previous ab initio results. In thecase of NiAl, both calorimetric data and theoreticalpredictions are critically assessed by Rzyman et al.[35]. Experimental )Hf for NiAl lies between#58.3 ± 1.1 to #67.4 ± 2.55 kJ /mol, and our pre-dicted value of #63.411 kJ/mol is well within therange of experimental values. In the case of TiNi,our predicted )Hf is #40.9 kJ/mol with respect tobcc-Ti and fcc-Ni. The experimental )Hf is#34.0 ± 2.0 kJ /mol [36], measured at 1202 °C.)Hf values of #31.6~#33.9 have been reportedpreviously [36]; however the temperature was notwell documented. The predicted )Hf is overesti-mated by more than 5 kJ/mol. The predicted )Hfof TiPd and TiPt are #51.149 and #82.455kJ/mol. The experimental values #53.1 ± 3.0 kJ /mol for TiPd measured at 1250 °C [36], and #77.1 ± 3.1 kJ /mol for TiPt measured at 1400 °C[36] demonstrate good agreement.Linear extrapolation of the temperature depen-
dence of the lattice parameter of TiNi [37] givesa = 0.30151 nm at 0 K, which is in very goodagreement with our predicted value of 0.3020 nm.For NiAl, we have used experimental data ofHughes et al. [38]. A non-linear least square fityields a = 0.28805 nm at 0 K compared to thepredicted value of 0.28961 nm, a discrepancy ofonly 0.5%. In the case of TiPd and TiPt, experi-mental data as a function of temperature are notavailable; thus a comparison could not be madewith our predicted values.The measured lattice parameters of solution
treated and quenched ternary and quaternary B2alloys are also consistent with the ab initio latticeparameter values. For example, ternary alloy Amay be conceived as a mechanical mixture of 90mol% TiNi and 10 mol% of NiAl. This yields apredicted lattice parameter of 0.30076 nm at 0 K,which compares favorably with the lattice para-meter value of 0.30018 nm at room temperature(see Table 5). Similarly, the lattice parameters ofA + 5Hf and A + 5Zr can be calculated with theab initio lattice parameter values, where A + 5Hfis approximated as 80 mol% TiNi + 10 mol%
NiAl + 10 mol% NiHf, and A + 5Zr as 80mol% TiNi + 10 mol% NiAl + 10 mol% NiZr.Incorporating the temperature dependency of lat-tice parameter, the calculated lattice parameters are0.30278 and 0.30333 nm, respectively. Comparedto the experimental data of Table 5, they show adiscrepancy of less than 0.7%.Another important ab initio result is the ability
to predict site occupancy of Hf and Zr in the B2phase. Earlier, we had reported experimental deter-mination of site occupancy of Hf and Zr in B2 ofalloys A + 5Hf and A + 5Zr aged at 600 °C. Thiswas done by atomic scale chemical analysis of(1 0 0) layers in a 3DAP [17]. The results are sum-marized in Table 8 [17]. The site occupancy of Pdand Pt in B2 could not be measured due to experi-mental difficulty. Nevertheless, we find that morethan 80% of Hf and Zr atoms in B2 phase resideon the Ti-sublattice. This is expected from thetrends of )Hf values of NiHf, NiZr, TiHf, andTiZr. When Hf or Zr atoms reside on the Ti-sublat-tice, they form Ni–Hf and Ni–Zr nearest neighborbonds which are energetically more favorable com-pared to the formation of Ti–Hf and Ti–Zr nearestneighbor bonds when Hf and Zr reside on the Ni-sublattice. While the vast majority of the site occu-pancy is consistent with the enthalpic criterionalone, some intermixing is expected at finite tem-perature due to configurational entropy.
5.2. Kinetics of L21 precipitation
In order to predictively control desired nano-scale microstructure, it is of fundamental impor-tance to investigate the microstructural dynamicsthat determines the characteristic length scales ofthe precipitates. It is well established that the kin-etics of precipitation from a supersaturated solidsolution is governed by the interplay of three pro-
Table 8Experimental site occupancy of Hf and Zr in B2 and L21, asdetermined by 3DAP[17]
Site Hf ± 2s Zr ± 2s
B2 Ti 82 ± 8% 83 ± 10%L21 Ti 89 ± 20% 83 ± 30%
6353J. Jung et al. / Acta Materialia 51 (2003) 6341–6357
cesses: (i) nucleation of precipitates, (ii) theirgrowth kinetics, and (iii) coarsening (or Ostwaldripening) of the precipitates. Even though the dis-tinction between the growth and coarsening stagesis somewhat arbitrary and these three processesmay overlap, we seek to identify the governingprocesses at 600 and 800 °C. Of particular interestis the competition between growth and coarsening.As shown in Fig. 1, the nucleation of L21 pre-
cipitates was suppressed during quenching follow-ing solution treatment in all alloys except B +20Pd. Therefore, all three processes may take placeduring isothermal aging in these alloys, while somenucleation has occurred in B + 20Pd during oilquenching prior to aging which may continuefurther during isothermal aging along with growthand coarsening.Since both growth and coarsening processes are
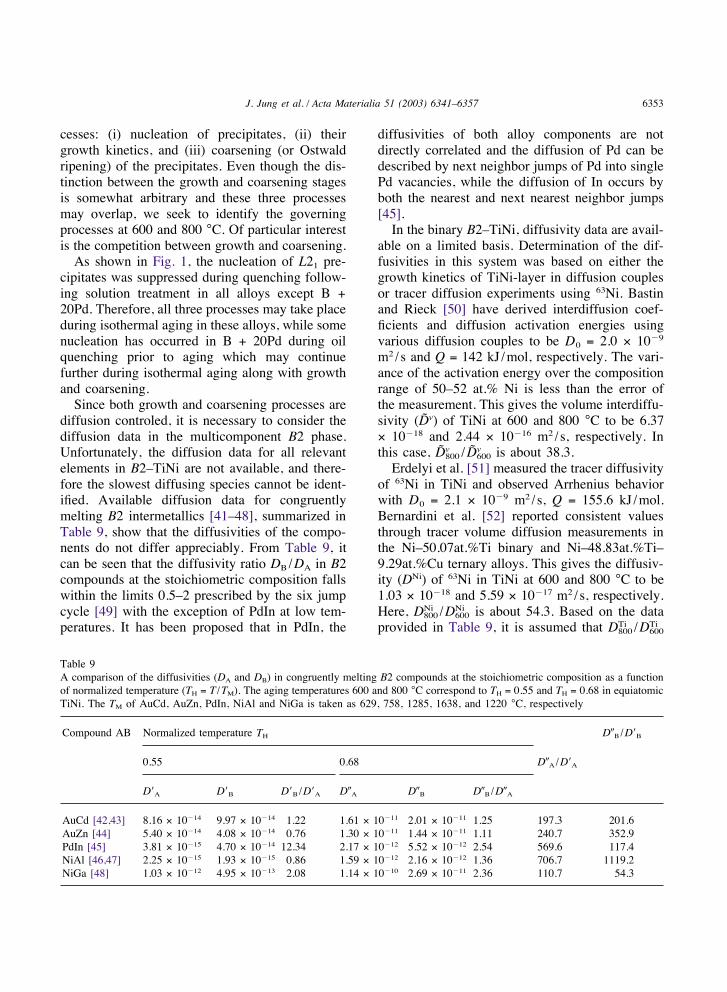
diffusion controled, it is necessary to consider thediffusion data in the multicomponent B2 phase.Unfortunately, the diffusion data for all relevantelements in B2–TiNi are not available, and there-fore the slowest diffusing species cannot be ident-ified. Available diffusion data for congruentlymelting B2 intermetallics [41–48], summarized inTable 9, show that the diffusivities of the compo-nents do not differ appreciably. From Table 9, itcan be seen that the diffusivity ratio DB /DA in B2compounds at the stoichiometric composition fallswithin the limits 0.5–2 prescribed by the six jumpcycle [49] with the exception of PdIn at low tem-peratures. It has been proposed that in PdIn, the
Table 9A comparison of the diffusivities (DA and DB) in congruently melting B2 compounds at the stoichiometric composition as a functionof normalized temperature (TH = T /TM). The aging temperatures 600 and 800 °C correspond to TH = 0.55 and TH = 0.68 in equiatomicTiNi. The TM of AuCd, AuZn, PdIn, NiAl and NiGa is taken as 629, 758, 1285, 1638, and 1220 °C, respectively
Compound AB Normalized temperature TH D+B/D!B
0.55 0.68 D+A/D!A
D!A D!B D!B/D!A D+A D+B D+B/D+A
AuCd [42,43] 8.16 × 10#14 9.97 × 10#14 1.22 1.61 × 10#11 2.01 × 10#11 1.25 197.3 201.6AuZn [44] 5.40 × 10#14 4.08 × 10#14 0.76 1.30 × 10#11 1.44 × 10#11 1.11 240.7 352.9PdIn [45] 3.81 × 10#15 4.70 × 10#14 12.34 2.17 × 10#12 5.52 × 10#12 2.54 569.6 117.4NiAl [46,47] 2.25 × 10#15 1.93 × 10#15 0.86 1.59 × 10#12 2.16 × 10#12 1.36 706.7 1119.2NiGa [48] 1.03 × 10#12 4.95 × 10#13 2.08 1.14 × 10#10 2.69 × 10#11 2.36 110.7 54.3
diffusivities of both alloy components are notdirectly correlated and the diffusion of Pd can bedescribed by next neighbor jumps of Pd into singlePd vacancies, while the diffusion of In occurs byboth the nearest and next nearest neighbor jumps[45].In the binary B2–TiNi, diffusivity data are avail-
able on a limited basis. Determination of the dif-fusivities in this system was based on either thegrowth kinetics of TiNi-layer in diffusion couplesor tracer diffusion experiments using 63Ni. Bastinand Rieck [50] have derived interdiffusion coef-ficients and diffusion activation energies usingvarious diffusion couples to be D0 = 2.0 × 10#9
m2 /s and Q = 142 kJ /mol, respectively. The vari-ance of the activation energy over the compositionrange of 50–52 at.% Ni is less than the error ofthe measurement. This gives the volume interdiffu-sivity (Dv) of TiNi at 600 and 800 °C to be 6.37× 10#18 and 2.44 × 10#16 m2 /s, respectively. Inthis case, Dv
800 / Dv600 is about 38.3.
Erdelyi et al. [51] measured the tracer diffusivityof 63Ni in TiNi and observed Arrhenius behaviorwith D0 = 2.1 × 10#9 m2 /s, Q = 155.6 kJ /mol.Bernardini et al. [52] reported consistent valuesthrough tracer volume diffusion measurements inthe Ni–50.07at.%Ti binary and Ni–48.83at.%Ti–9.29at.%Cu ternary alloys. This gives the diffusiv-ity (DNi) of 63Ni in TiNi at 600 and 800 °C to be1.03 × 10#18 and 5.59 × 10#17 m2 /s, respectively.Here, DNi800 /DNi600 is about 54.3. Based on the dataprovided in Table 9, it is assumed that DTi800 /DTi600
6354 J. Jung et al. / Acta Materialia 51 (2003) 6341–6357
will not be too different from 54.3. In the followinganalysis, both DNi800 /DNi600 and Dv
800 / Dv600 are used.
If the diffusion controled growth process isoperating at both temperatures for the isochronalheat treatment,
r800r600
%'D800D600
%7.4 (5)
using DNi values. If the volume interdiffusivity isused, the right hand side of Eq. (5) yields a valueof 6.2. Based on the measured r data for alloys A,A + 5Hf and A + 5Zr (see Table 1), r800 / r600 isabout 41–50 which is much bigger than theexpected value of 6.2–7.4 from Eq. (5). On theother hand, the r800 / r600 in alloys B + 5Pd, B +20Pd and B + 5Pt (see Table 2), is 3.6, 6.0, and14, respectively. These are much closer to theexpected value of 6.2–7.4 based on TiNi dif-fusion data.Since nucleation has occurred prior to aging in
B + 20Pd, Eq. (5) is modified as follows:
r2800#r20,800r2600#r20,600
%D800D600
%38.3 ! 54.3 (6)
where r0,800 and r0,600 are radii at the onset ofgrowth. r0,800 is measured as 2.5 nm and assumingr0,600 = r0,800, the left hand side of Eq. (6) yields36.7. Again, B + 20Pd provides a value close tothat calculated on the right hand side based onboth Dv and DNi, and therefore, the mechanism forthe kinetics of precipitation can be interpreted asdiffusion controled growth at both temperatures.While B + 5Pt could also be explained by Eq. (6),it is worth considering alternative mechanismsfor clarification.For an isochronal heat treatment, if a coarsening
process operates at both temperatures,
r800r600
%3'f800f600sSsC
D800D600
(7)
where the ratio f800 / f600 accounts for the effect ofvolume fraction on the coarsening rate constant,and sS and sC are the semicoherent and coherentinterfacial energies. The difference in molar vol-ume between 600 and 800 °C is ignored. Since thevolume fraction of L21 decreases with increasingtemperature, the ratio f800 / f600 will be always less
than unity. Assuming sS = 5sC, and f800 / f600 = 1as an upper limit, an upper bound value for theright hand side of Eq. (7) is evaluated as 5.76 basedon Dv and 6.47 based on DNi. These values areagain much smaller than experimental r800 / r600 inalloys A, A + 5Hf, A + 5Zr, but closer to those inalloys B + 5Pd, B + 20Pd and B + 5Pt.If the growth process is operating at 800 °C
while coarsening at 600 °C,
r800r600
%(X1100B2 #X 800B2 ) / (X800H #X800B2 )(D800t
3(8D600sCtVmX600B2 (1#X600B2 ) / (9RT(X600H #X600B2 )2),
Vm " NAa3
16 (8)
where X1100B2 is the concentration of Al in the sol-ution treated specimen, X800B2 and X600B2 the concen-trations of Al in B2 of the specimens aged at 800and 600 °C, respectively, X800H and X600H the concen-trations of Al in Heusler phase of the specimensaged at 800 and 600 °C, respectively. These arelisted in Tables 3 and 4. R is the gas constant, Tthe temperature in K, Vm the average molar volumeof the Heusler phase, NA Avogadro’s number anda the lattice parameter of Heusler phase at 600 °C.The concentration of Al is chosen because Al isthe solute which undergoes the largest partitioningbetween the phases. Assuming a reasonable valuefor the coherent interfacial energy sC = 20 mJ /m2, we find that r800 / r600 lies in the range of 30.5–45.0 based on DNi, and 23.6–51.0 based on Dv.This is certainly much closer to the experimentalr800 / r600 values (41–50, see Table 2) in alloys A,A + 5Hf and A + 5Zr than the two other possibledynamics discussed, but much bigger than theexperimental r800 / r600 value in alloys B + 5Pd, B+ 20Pd, and B + 5Pt.It is well established that the splitting of precipi-
tation kinetics into three distinct regimes is some-what artificial, and in reality, all three processesmay overlap. To address this issue, Langer andSchwartz [53] developed a general theory of pre-cipitation kinetics where an important parameter isthe degree of supersaturation. At high supersatu-ration, the nucleation rate is very high causing thesupersaturation to drop rapidly. The decrease insupersaturation causes the particles smaller than
6355J. Jung et al. / Acta Materialia 51 (2003) 6341–6357
critical size to dissolve. The average particle sizeis initially governed by the nucleation process andsmoothly changes to the regime governed by coars-ening. The growth stage is bypassed because allthe supersaturation is consumed during nucleationand coarsening. This seems to be the operating pro-cess at 600 °C in alloys A, A + 5Hf and A +5Zr. On the other hand at low supersaturation, theprecipitation kinetics proceeds through distinctstages of growth and coarsening. This may be theoperating mechanism at 800 °C in alloys A, A +5Hf and A + 5Zr, where the Al supersaturationratio is decreased by 60% based on our measuredtie lines. In contrast, the microstructural dynamicsin alloys B + 5Pd, B + 20Pd and B + 5Pt can bedescribed either by growth or by coarsening atboth temperatures.To account for the difference observed in the
precipitation mechanisms of alloys A vs. B, themanifold assumptions made have to be validatedcarefully. Here, the microstructural dynamics in allalloys is discussed considering the TiNi diffusiondata only, and no attempt was made to identify theslowest diffusing species in ternary and quaternaryalloys. As seen in Table 9, the diffusivity of alloycomponents in B2 at a given temperature can differsignificantly if the diffusion mechanisms are differ-ent as is the case for PdIn. As in random solidsolutions, vacancies also mediate diffusion pro-cesses in B2 compounds. However, in orderedcompounds, random vacancy motion is not poss-ible, as it would disrupt the equilibrium orderedarrangement of atoms on sublattice sites. Further-more, the degree of long-range order has a stronginfluence in B2 compounds which can be affectedby the deviation from ideal stoichiometry. In a per-fectly ordered state, the diffusion is much moresluggish compared with the case when the long-range order parameter is less than 1. A significantdeviation from the highly ordered state can lead toa change in diffusion process from a six jump cyclemechanism to a triple defect mechanism [54]. Sucha change in mechanism leads to a large disparityin DA and DB. Besides long-range order, solute-vacancy binding energy associated with variousalloying elements can also exert significant influ-ence on the diffusion kinetics.A major difference between the alloys A and B
is that in the former, the solutes (Al, Hf, or Zr)primarily reside on the Ti-sublattice, while in B,the solutes (Al, Pd or Pt) reside on both sublattices.This might have contributed to a decrease in long-range order parameter in B, thus accelerated dif-fusion kinetics. There are no solute diffusion datain TiNi base alloys, nor are there any theoreticalguidelines to estimate the solute-vacancy bindingenergy, vacancy migration energy, etc. Bothexperimental and theoretical data for diffusion inTiNi are needed to fully interpret and understandthe phase transformation kinetics in TiNi-basedalloys.To make TiNi-based shape-memory alloys
strengthened by Heusler phase amenable to engin-eering applications, the B2 matrix must transformto martensite near or above room temperature.Calorimetric study of alloys after aging treatmentdid not exhibit any martensitic transformation evenafter cooling to #150 °C. Nonetheless, the presentstudy provides fundamental information regardingthe solute contents in the matrix after low tempera-ture aging treatment. Transformable dispersion-strengthened alloys can then be designed using thephase relations obtained from these model alloys.
6. Conclusions
The precipitation of Ni2TiAl Heusler phase in aTiNi based matrix has been investigated for Ni–Ti–Al and Ni–Ti–Al–X (X = Hf, Zr, Pd, Pt) alloys.The following conclusions are drawn:
1. Precipitation of Heusler phase Ni2TiAl withL21-structure in a supersaturated B2–TiNimatrix is confirmed to form a coherent two-phase aggregate at the early stages. This is con-sistent with our motivating concept that the B2–L21 system, based on a bcc lattice, is directlyanalogous to the A1–L12 (fcc) system of γ! pre-cipitates in a γ matrix in Ni-based superalloys.
2. During isochronal aging for 1000 h, the micro-structural dynamics of L21 precipitates in Ni–Ti–Al and Ni–Ti–Al–X (X = Hf, Zr) is governedby the growth process at 800 °C and by coarsen-ing at 600 °C while kinetics in Ni–Ti–Al–X
6356 J. Jung et al. / Acta Materialia 51 (2003) 6341–6357
(X = Pd, Pt) aged for 100 h can be explainedby one process at both 600 and 800 °C.
3. For partitioning of Hf and Zr between L21 pre-cipitates and the B2 matrix at 800 °C, the par-titioning ratio is determined by AEM to be%B2/L21Hf = 2.17 for Hf, and %B2/L21Zr = 1.35 for Zr.At 600 °C, however, Hf and Zr show the inversepartitioning behavior, with values of 0.87 for Hfand 0.75 for Zr, as measured by 3DAP. The par-titioning ratio of Pd at 800 °C is determined by3DAP or AEM to be %B2/L21Pd = 0.64 and 0.68 for5 and 20 at.% substitution respectively, and%B2/L21Pt = 2.17 for Pt. At 600 °C, %B2/L21Pd =0.60 and 0.53 for B + 5Pd and B + 20Pd,respectively.
4. The measured B2 lattice parameter of solutiontreated and quenched alloys, and the measuredsite occupancy of Hf and Zr in B2 at low tem-perature are consistent with the predictions fromab initio calculations.
5. The addition of Hf or Zr to the TiNi–Ni2TiAlsystem at 800 °C is undesirable for lattice misfitreduction but useful for the control of martensitephase stability. At 600 °C, the partition behaviorof Hf and Zr is effective for lattice misfitreduction. The addition of Pd is amenable forlattice misfit reduction at both 600 and 800 °C.On the other hand, Pt is undesirable for latticemisfit reduction at both temperatures but usefulfor the control of martensite phase stability.
6. The atomic volumes of Al, Hf, Ni, Pd, Pt, Ti,and Zr in TiNi and Ni2TiAl are obtained basedon lattice parameter measurements. Simplemodels to predict the lattice parameters of B2and L21 phases are proposed for the control oflattice misfit in alloy design.
7. Key parameters have been established to sup-port predictive design of nanodispersion-strengthened shape memory alloys for high-per-formance applications.
Acknowledgements
Financial support from the National ScienceFoundation (Grant No. DMR-9806749) and theMemry Corporation, Bethel, CT is gratefullyacknowledged. The authors are also grateful to Dr.Dieter Isheim for his help with 3DAP experiments.
References
[1] Lin HC, Wu SK. Acta Metallurgica Et Materialia1994;42:1623.
[2] Koizumi Y, Ro Y, Nakazawa S, Harada H. MaterialsScience and Engineering A 1997;223:36.
[3] Kajiwara S, Kikuchi T, Ogawa K, Matsunaga T, MiyazakiS. Philosophical Magazine Letters 1996;74:137.
[4] Kajiwara S. Journal De Physique IV 2001;11:395.[5] Villars P, Calvert LD. Pearson’s handbook of crystallo-
graphic data for intermetallic phases, 2nd ed. Newbury(OH): ASTM International; 1991.
[6] Johnson WC, Voorhees PW. Solid State Phenomena1992;23:87.
[7] Sugimoto K, Kamei K, Sugimoto T, Sodeoka T. Effect ofnickel and aluminum on internal friction in Ti–Ni and Ti–Ni–Al alloys. In: The International Conference on mar-tensitic transformations. Nara, Japan: Japan Institute ofMetals; 1986.
[8] Mulder JH, Maas JH, Beyer J. Martensitic transformationsand shape memory effects in Ti–Ni–Zr alloys. In: Inter-national Conference on martensitic transformations. Mon-terey (CA): Monterey Institute for Advanced Studies;1992.
[9] Angst DR, Thoma PE, Kao MY. Journal De PhysiqueIv 1995;5:747.
[10] Donkersloot HC, Van Vucht JH. Journal of the Less-Com-mon Metals 1970;20:83.
[11] Lindquist PG. Structure and transformation behavior ofmartensitic titanium-(nickel, palladium) and titanium-(nickel, platinum) alloys. PhD thesis. University of Illinoisat Urbana-Champaign, 1988 [p. 131].
[12] Kainuma R, Ohnuma I, Ishida K. Journal De Chimie Phys-ique Et De Physico-Chimie Biologique 1997;94:978.
[13] Khalil-Allafi J, Dlouhy A, Eggeler G. Acta Materialia2002;50:4255.
[14] http://rsb.info.nih.gov/nih-image/. NIH Image program.US National Institutes of Health: Bethesda (MD), 1999.
[15] Goldstein JI, Williams DB, Cliff G. Quantitative X-rayanalysis. In: Joy DC, Romig Jr. AD, Goldstein JI, editors.Principles of analytical electron microscopy. NY: PlenumPress; 1986, p. 155.
[16] http://www.nist.gov/dtsa. Desktop spectrum analyzer.National Institute of Standards and Technology: Gaithers-burg (MD), 1997.
[17] Jung J, Ghosh G, Isheim D, Olson GB. Metallurgical andMaterials Transactions A 2003;34:1221.
[18] Horita Z, Sano T, Nemoto M. Journal of Microscopy-Oxford 1986;143:215.
[19] Williams DB. Practical analytical electron microscopy inmaterials science. Mahwah (NJ): Electron Optics Pub-lishing Group; 1987.
[20] http://www.geol.uni-erlangen.de/macsoftware/macdiff/macdiff.html. MacDiff. Petschick R, 2000.
[21] International tables for crystallography. InternationalUnion of Crystallography. Kluwer Academic Publishers:Boston (MA), 1993; p. 65.
6357J. Jung et al. / Acta Materialia 51 (2003) 6341–6357
[22] Kresse G, Furthmuller J. Physical Review B1996;54:11169.
[23] Kresse G, Furthmuller J. Computational MaterialsScience 1996;6:15.
[24] Vanderbilt D. Physical Review B 1990;41:7892.[25] Methfessel M, Paxton AT. Physical Review B
1989;40:3616.[26] Monkhorst HJ, Pack JD. Physical Review B
1976;13:5188.[27] Shabalovskaya SA. International Materials Reviews
2001;46:233.[28] Tang W, Sundman B, Sandstrom R, Qiu C. Acta
Materialia 1999;47:3457.[29] Ardell AJ, Nicholson RB. Acta Metallurgica
1966;14:1295.[30] Su CH, Voorhees PW. Acta Materialia 1996;44:2001.[31] Schmitz-Pranghe N, Dunner P. Zeitschrift Fur Met-
allkunde 1968;59:377.[32] Romans PA, Paasche OG, Kato H. Journal of the Less-
Common Metals 1965;8:213.[33] Schroder RH, Schmitz-Pranghe N, Kohlhaas R. Zeitschrift
Fur Metallkunde 1972;63:12.[34] German VN, Bakanova AA, Tarasova LA, Sumulov YN.
Soviet Physics Solid State, USSR 1970;12:490.[35] Rzyman K, Moser Z, Watson RE, Weinert M. Journal of
Phase Equilibria 1998;19:106.[36] Gachon JC, Selhaoui N, Aba B, Hertz J. Journal of Phase
Equilibria 1992;13:506.[37] Klopotov AA, Chekalkin TL, Gyunter VE. Technical
Physics 2001;46:770.[38] Hughes T, Lautenschlager EP, Cohen JB, Brittain JO.
Journal of Applied Physics 1971;42:3705.[39] Pasturel A, Colinet C, Manh DN, Paxton AT, vanSchilf-
gaarde M. Physical Review B 1995;52:15176.
[40] Fernando GW, Watson RE, Weinert M. Physical ReviewB 1992;45:8233.
[41] Mehrer H, Eggersmann M, Gude A, Salamon M, SepiolB. Materials Science and Engineering A 1997;240:889.
[42] Huntington HB, Miller NC, Nerses V. Acta Metallurgica1961;9:749.
[43] Gupta D, Lazarus D, Lieberman DS. Physical Review1967;153:863.
[44] Gupta D, Lieberman DS. Physical Review B 1971;4:1070.[45] Hahn H, Frohberg G, Wever H. Physica Status Solidi A
1983;79:559.[46] Hancock GF, McDonnel Br. Physica Status Solidi A
1971;4:143.[47] Minamino Y, Koizumi Y, Inui Y. Diffusion in B2-type
ordered NiAl intermetallic compound. In: Diffusions inMaterials: Dimat2000, Pts. 1 & 2. 2000 [p. 517].
[48] Donaldson AT, Rawlings RD. Acta Metallurgica1976;24:285.
[49] Elcock EW, McCombie CW. Physical Review1958;109:605.
[50] Bastin GF, Rieck GD. Metallurgical Transactions1974;5:1827.
[51] Erdelyi G, Erdelyi Z, Beke DL, Bernardini J, LexcellentC. Physical Review B 2000;62:11284.
[52] Bernardini J, Lexcellent C, Daroczi L, Beke D.L. Philo-sophical Magazine 2003;83:329.
[53] Langer JS, Schwartz AJ. Physical Review A 1980;21:948.[54] Murch GE, Belova IV. Theory and simulation of diffusion
kinetics in intermetallic compounds. In: Diffusion mech-anisms in crystalline materials. San Francisco (CA):Materials Research Society; 1998.