Embed Size (px)
Citation preview
CS-BIGS: 6(1) 37-46c©2015 CS-BIGS http://www.csbigs.fr
A comparative study of reciprocity in tworural social networks in Tamil Nadu, India
Subramanian ArumugamKalasalingam University, IndiaDominique HaughtonBentley University, USA, Université Paris I (Panthéon-Sorbonne) and Université Toulouse I, FranceBalasubramanian VasanthiKalasalingam University, IndiaChangan ZhangBentley University, USA and Ctrip, China
In this paper a comparative social network analysis is provided of the villages of Ayyanapuramand Sankarapandiapuram in the district of Virudhunagar of Tamil Nadu province in India.Social network data on three different types of links (monetary help, advice and companionship)reveal that, while the villages are situated close to each other geographically, they differ con-siderably in the structure of their social networks. The paper also illustrates a few commoncommunity detection algorithms.
1. Objectives and main contribu-tions of paper
This paper contributes to our understandingof rural India from the social network per-spective by analyzing two unique data setson three types of social networks (monetaryhelp, advice and companionship) collectedfrom households in two villages of Tamil Naduin southern India. Arumugam et al. (2014)investigated the social network properties ofthe village of Sankarapandiapuram; this paperproposes an extension via a study of the vil-lage of Ayyanapuram, geographically locatedclose to Sankarapandiapuram but remarkablydifferent in the structure of its social networks,
as will be evidenced here.
In addition, this paper utilizes the network ofmonetary help in crisis times to illustrate a fewcommon community detection algorithms.
2. Background
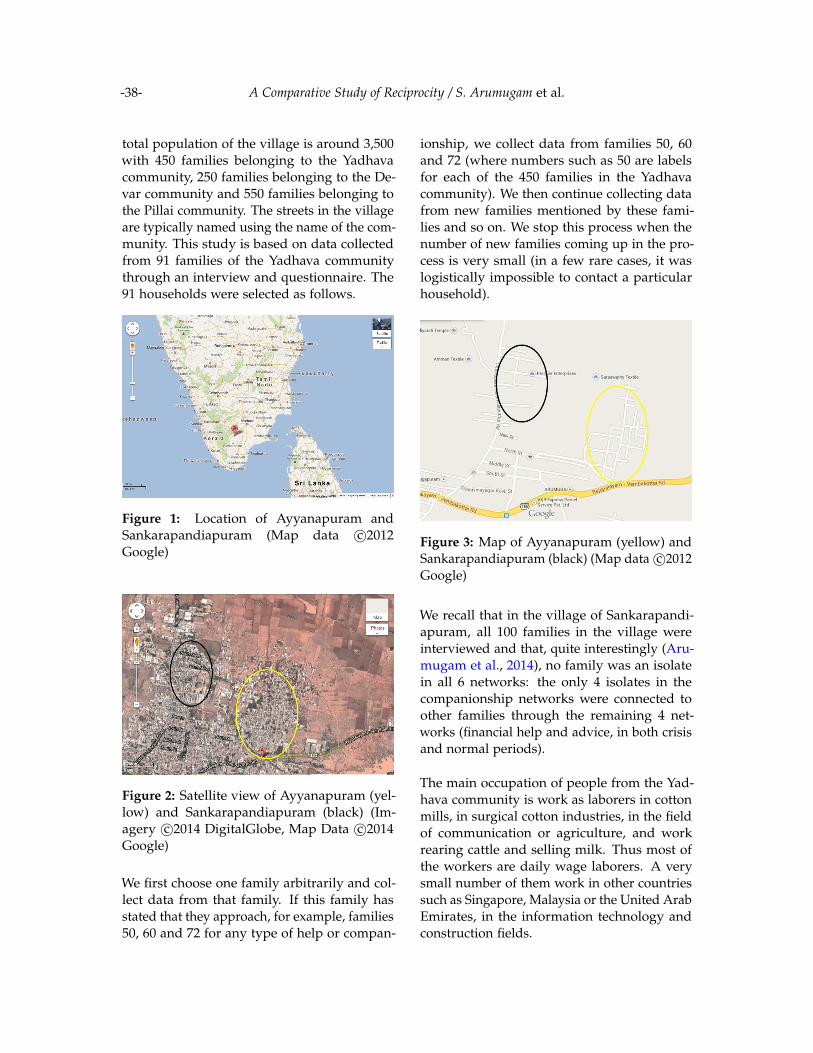
Ayyanapuram is a village situated in the east-ern side of Sankarapandiapuram village inSouthern Tami Nadu, India (see Figures 1, 2and 3); it is administered by the Melarajakulara-man Gram Panchayat (Village Council; thereare about 265,000 Gram Panchayats in India).Three different communities, Yadhava, Devarand Pillai live in harmony in this village. The
-38- A Comparative Study of Reciprocity / S. Arumugam et al.
total population of the village is around 3,500with 450 families belonging to the Yadhavacommunity, 250 families belonging to the De-var community and 550 families belonging tothe Pillai community. The streets in the villageare typically named using the name of the com-munity. This study is based on data collectedfrom 91 families of the Yadhava communitythrough an interview and questionnaire. The91 households were selected as follows.
Figure 1: Location of Ayyanapuram andSankarapandiapuram (Map data c©2012Google)
Figure 2: Satellite view of Ayyanapuram (yel-low) and Sankarapandiapuram (black) (Im-agery c©2014 DigitalGlobe, Map Data c©2014Google)
We first choose one family arbitrarily and col-lect data from that family. If this family hasstated that they approach, for example, families50, 60 and 72 for any type of help or compan-
ionship, we collect data from families 50, 60and 72 (where numbers such as 50 are labelsfor each of the 450 families in the Yadhavacommunity). We then continue collecting datafrom new families mentioned by these fami-lies and so on. We stop this process when thenumber of new families coming up in the pro-cess is very small (in a few rare cases, it waslogistically impossible to contact a particularhousehold).
Figure 3: Map of Ayyanapuram (yellow) andSankarapandiapuram (black) (Map data c©2012Google)
We recall that in the village of Sankarapandi-apuram, all 100 families in the village wereinterviewed and that, quite interestingly (Aru-mugam et al., 2014), no family was an isolatein all 6 networks: the only 4 isolates in thecompanionship networks were connected toother families through the remaining 4 net-works (financial help and advice, in both crisisand normal periods).
The main occupation of people from the Yad-hava community is work as laborers in cottonmills, in surgical cotton industries, in the fieldof communication or agriculture, and workrearing cattle and selling milk. Thus most ofthe workers are daily wage laborers. A verysmall number of them work in other countriessuch as Singapore, Malaysia or the United ArabEmirates, in the information technology andconstruction fields.
-39- A Comparative Study of Reciprocity / S. Arumugam et al.
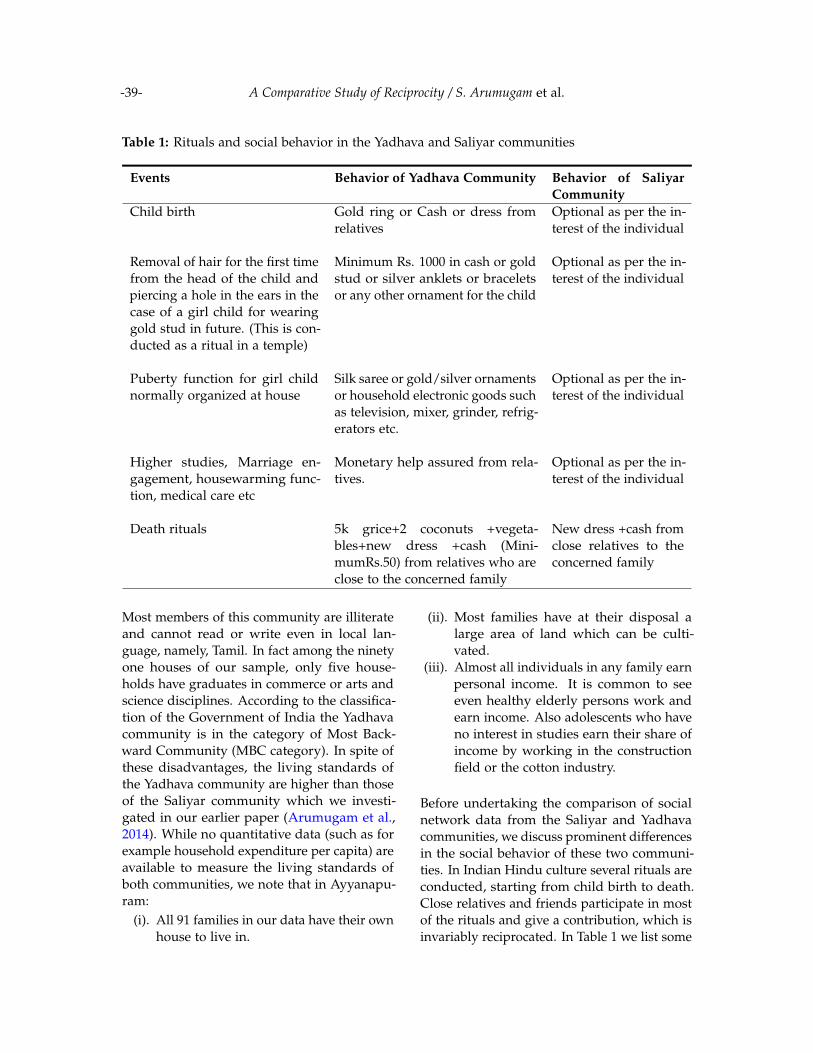
Table 1: Rituals and social behavior in the Yadhava and Saliyar communities
Events Behavior of Yadhava Community Behavior of SaliyarCommunity
Child birth Gold ring or Cash or dress fromrelatives
Optional as per the in-terest of the individual
Removal of hair for the first timefrom the head of the child andpiercing a hole in the ears in thecase of a girl child for wearinggold stud in future. (This is con-ducted as a ritual in a temple)
Minimum Rs. 1000 in cash or goldstud or silver anklets or braceletsor any other ornament for the child
Optional as per the in-terest of the individual
Puberty function for girl childnormally organized at house
Silk saree or gold/silver ornamentsor household electronic goods suchas television, mixer, grinder, refrig-erators etc.
Optional as per the in-terest of the individual
Higher studies, Marriage en-gagement, housewarming func-tion, medical care etc
Monetary help assured from rela-tives.
Optional as per the in-terest of the individual
Death rituals 5k grice+2 coconuts +vegeta-bles+new dress +cash (Mini-mumRs.50) from relatives who areclose to the concerned family
New dress +cash fromclose relatives to theconcerned family
Most members of this community are illiterateand cannot read or write even in local lan-guage, namely, Tamil. In fact among the ninetyone houses of our sample, only five house-holds have graduates in commerce or arts andscience disciplines. According to the classifica-tion of the Government of India the Yadhavacommunity is in the category of Most Back-ward Community (MBC category). In spite ofthese disadvantages, the living standards ofthe Yadhava community are higher than thoseof the Saliyar community which we investi-gated in our earlier paper (Arumugam et al.,2014). While no quantitative data (such as forexample household expenditure per capita) areavailable to measure the living standards ofboth communities, we note that in Ayyanapu-ram:
(i). All 91 families in our data have their ownhouse to live in.
(ii). Most families have at their disposal alarge area of land which can be culti-vated.
(iii). Almost all individuals in any family earnpersonal income. It is common to seeeven healthy elderly persons work andearn income. Also adolescents who haveno interest in studies earn their share ofincome by working in the constructionfield or the cotton industry.
Before undertaking the comparison of socialnetwork data from the Saliyar and Yadhavacommunities, we discuss prominent differencesin the social behavior of these two communi-ties. In Indian Hindu culture several rituals areconducted, starting from child birth to death.Close relatives and friends participate in mostof the rituals and give a contribution, which isinvariably reciprocated. In Table 1 we list some

-40- A Comparative Study of Reciprocity / S. Arumugam et al.
of the rituals and the social behavior of the twocommunities.
(a) Network of monetary help during periods of crisis
(b) Network of monetary help during normal periods
Figure 4: Network of monetary help
3. Visual investigation of the six net-works
We now proceed to investigate the six networks,namely, the network of monetary help duringcrisis periods (Figure 4a), the network of mon-etary help during normal periods (Figure 4b),the network of advisory help during crisis pe-riods (Figure 5a), the network of advisory helpduring normal periods (Figure 5b), the net-work of companionship during crisis periods(Figure 6a) and the network of companionshipduring normal periods (Figure 6b) constructedfrom the Yadhava community data. We com-pare these networks with the correspondingnetworks of the Saliyar community discussedin our earlier paper (Arumugam et al., 2014).
In this paper, as in Arumugam et al. (2014), acrisis is defined as an accident or death or anyunforeseen expenses occurring in the family.We note here that the data were collected onlyat one point of time, mostly through personalinterviews. This made it possible to obtainduring one interview information from respon-dents about whom they turned to for financialhelp, advisory help and companionship in bothnormal and crisis situations.
(a) Network of advisory help during periods of crisis
(b) Network of advisory help during normal periods
Figure 5: Network of advisory help
All six graphs were constructed with Pajek(2014) using a Fruchterman and Reingold(1991) algorithm, a force-directed graph draw-ing method which aims to provide an aestheticdisplay of the graph. This kind of algorithm im-plements a trade-off between attractive forces(associated with edges and similar to springs)and repulsive forces (associated with all pairsof nodes and similar to electrical forces).
-41- A Comparative Study of Reciprocity / S. Arumugam et al.
We note that all six networks representing Yad-hava community data have no isolated verticeswhereas many isolated vertices are observedin some of the networks of the other commu-nity (Saliyar), although, as mentioned earlier,no vertex is an isolate in all 6 networks in theSaliyar community. There are two main rea-sons for this. In the Yadhava community in thevillage of Ayyanapuram when boys or girls areready for marriage, they invariably choose abride or bridegroom from the same village. Asa consequence any two families are related orclosely related. Furthermore, all relatives in-variably attend all rituals in a family, and givea contribution, which is always reciprocated.Hence nice reciprocity is built in the systemand there are no isolated vertices in any of the6 networks.
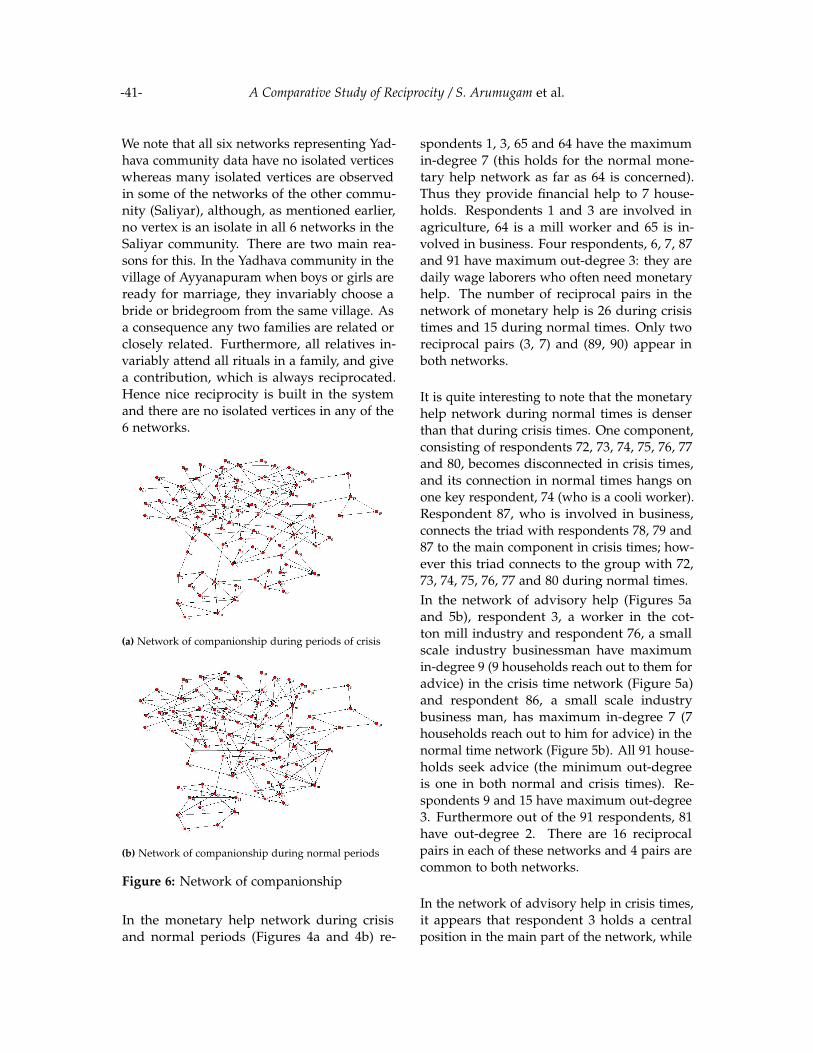
(a) Network of companionship during periods of crisis
(b) Network of companionship during normal periods
Figure 6: Network of companionship
In the monetary help network during crisisand normal periods (Figures 4a and 4b) re-
spondents 1, 3, 65 and 64 have the maximumin-degree 7 (this holds for the normal mone-tary help network as far as 64 is concerned).Thus they provide financial help to 7 house-holds. Respondents 1 and 3 are involved inagriculture, 64 is a mill worker and 65 is in-volved in business. Four respondents, 6, 7, 87and 91 have maximum out-degree 3: they aredaily wage laborers who often need monetaryhelp. The number of reciprocal pairs in thenetwork of monetary help is 26 during crisistimes and 15 during normal times. Only tworeciprocal pairs (3, 7) and (89, 90) appear inboth networks.
It is quite interesting to note that the monetaryhelp network during normal times is denserthan that during crisis times. One component,consisting of respondents 72, 73, 74, 75, 76, 77and 80, becomes disconnected in crisis times,and its connection in normal times hangs onone key respondent, 74 (who is a cooli worker).Respondent 87, who is involved in business,connects the triad with respondents 78, 79 and87 to the main component in crisis times; how-ever this triad connects to the group with 72,73, 74, 75, 76, 77 and 80 during normal times.In the network of advisory help (Figures 5aand 5b), respondent 3, a worker in the cot-ton mill industry and respondent 76, a smallscale industry businessman have maximumin-degree 9 (9 households reach out to them foradvice) in the crisis time network (Figure 5a)and respondent 86, a small scale industrybusiness man, has maximum in-degree 7 (7households reach out to him for advice) in thenormal time network (Figure 5b). All 91 house-holds seek advice (the minimum out-degreeis one in both normal and crisis times). Re-spondents 9 and 15 have maximum out-degree3. Furthermore out of the 91 respondents, 81have out-degree 2. There are 16 reciprocalpairs in each of these networks and 4 pairs arecommon to both networks.
In the network of advisory help in crisis times,it appears that respondent 3 holds a centralposition in the main part of the network, while
-42- A Comparative Study of Reciprocity / S. Arumugam et al.
respondent 76 plays an important role in thesmaller subsection consisting of respondents72, 73, 74, 75, 77, 78, 79 and 80. This subsectionbehaves quite differently in crisis and normaltimes, with different respondents playing therole of maintaining connection between thesubsection and the main group.
In the network of companionship (Figures 6aand 6b), respondent 66, involved in business,has maximum in-degree 8 in the crisis networkand respondent 3, a mill worker, has maximumin-degree 9 in the normal network. Respon-dent 86, involved in business, has maximumout-degree 4 in both networks. The number ofreciprocal pairs in the two networks is respec-tively 21 and 19; only two pairs are commonto both networks. Overall the image of the net-work is one of a tightknit community, tighterin normal than in crisis times, with memberssuch as 79 (a cooli worker) and 86 playing animportant role in keeping all subgroups con-nected.
4. Numerical summaries for the sixnetworks
We now present tables comparing the param-eters obtained from Ayyanapuram data andSankarapandiapuram data. Since any twofamilies in the Ayyanapuram data are related
to each other, for purpose of comparison wehave taken only the network of relatives inthe Sankarapandiapuram data. We first recalldefinitions of terms used in the tables.
Let G be a network with vertex set V and arcset A. For any vertex v in V, the number of arcsof the form (u, v) in A is called the in-degreeof v. The number of arcs of the form (v, u)in A is called the out-degree of v. A vertexwith both in-degree and out-degree 0 is calledan isolated vertex. A vertex with in-degree0 and out-degree greater than 0 is called atransmitter. A vertex with out-degree 0 andin-degree greater than 0 is called a receiver.A vertex with both in-degree and out-degreegreater than 0 is called a carrier.
If (u, v) is an arc but (v, u) is not an arc in thenetwork, then (u, v) is called asymmetric. Ifboth (u, v) and (v, u) are arcs, then the pair ofarcs is called a symmetric pair or a reciprocalpair.
Table 2a gives the number of reciprocal pairsin both communities for all 6 networks (CMHand NMH denote the crisis and normal mon-etary help networks, CAH and NAH denotethe crisis and normal advisory networks, andCCH and NCH denote the crisis and normalcompanionship help networks).
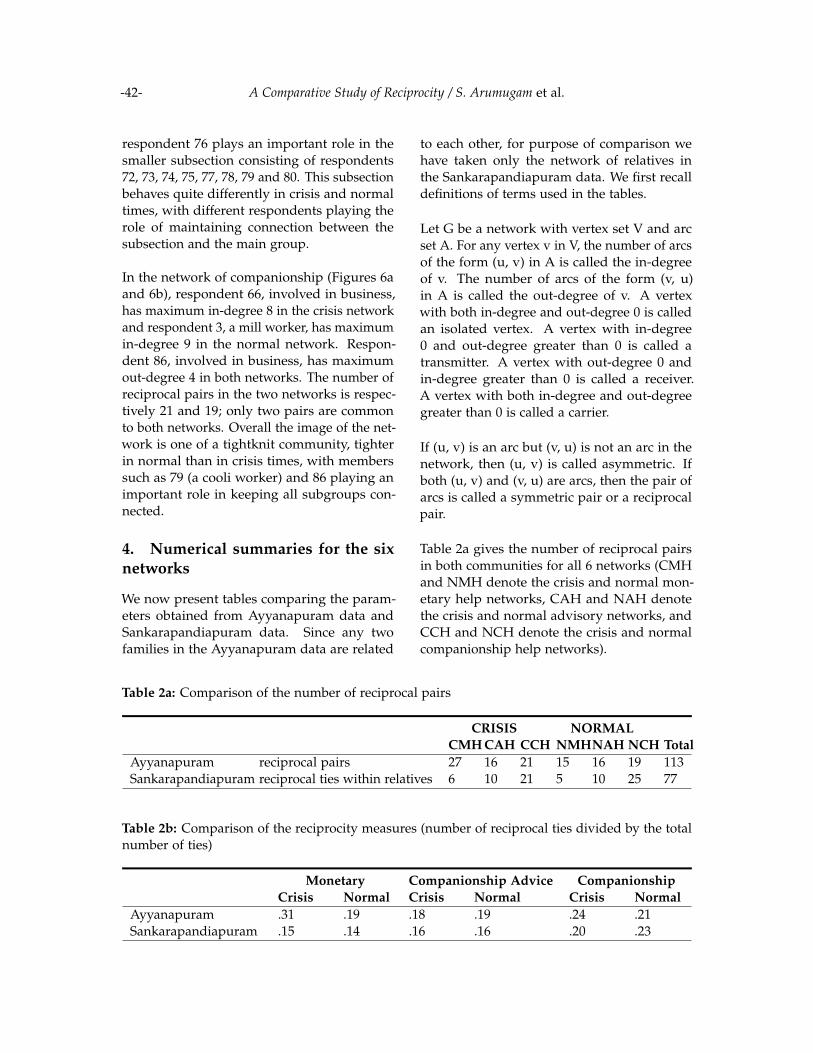
Table 2a: Comparison of the number of reciprocal pairs
CRISIS NORMALCMH CAH CCH NMHNAH NCH Total
Ayyanapuram reciprocal pairs 27 16 21 15 16 19 113Sankarapandiapuram reciprocal ties within relatives 6 10 21 5 10 25 77
Table 2b: Comparison of the reciprocity measures (number of reciprocal ties divided by the totalnumber of ties)
Monetary Companionship Advice CompanionshipCrisis Normal Crisis Normal Crisis Normal
Ayyanapuram .31 .19 .18 .19 .24 .21Sankarapandiapuram .15 .14 .16 .16 .20 .23

-43- A Comparative Study of Reciprocity / S. Arumugam et al.
Table 3: Comparison of in-degrees and out-degrees
CRISIS NORMALCMH CAH CCH NMH NAH NCH
Ayyanapuram data max in-degree 7 9 8 7 7 9Sankarapandiapuram data max in-degree 5 8 8 4 7 8Ayyanapuram data min in-degree 0 0 0 0 0 0Sankarapandiapuram data min in-degree 0 0 0 0 0 0Ayyanapuram data max out-degree 3 3 4 2 2 4Sankarapandiapuram data max out-degree 3 3 6 3 4 6Ayyanapuram data min out-degree 1 1 1 1 1 1Sankarapandiapuram data min out-degree 0 0 0 0 0 0
Table 4: Comparison of the number of isolates and other types of vertices
CRISIS NORMALCMH CAH CCH NMH NAH NCH
Ayyanapuram dataisolatesI=O=0
0 0 0 0 0 0
Sankarapandiapuram dataisolatesI=O=0
42 23 4 45 19 4
Ayyanapuram datatransmitterI=0 O>0
29 22 21 22 20 24
Sankarapandiapuram datatransmitterI=0 O>0
23 25 14 23 25 13
Ayyanapuram datareceiverI>0 O=0
0 0 0 0 0 0
Sankarapandiapuram datareceiverI>0 O=0
17 19 4 18 21 4
Ayyanapuram datacarrierI >O >0
62 69 70 69 71 67
Sankarapandiapuram datacarrierI >O >0
18 33 78 14 35 79
Table 5: Comparison of the number of isolates and other types of vertices
CRISIS NORMALCMH CAH CCH NMHNAH NCH
Ayyanapuram data asym ties 119 144 135 138 140 140Sankarapandiapuram data asym ties 35 53 83 30 52 86Ayyanapuram data reciprocal ties 54 32 42 30 32 38Sankarapandiapuram data reciprocal ties 6 10 21 5 10 25Ayyanapuram data sym and asym ties total 173 176 177 168 172 178Sankarapandiapuram data sym and asym ties total 41 63 104 35 62 111
-44- A Comparative Study of Reciprocity / S. Arumugam et al.
Table 2b gives a measure of reciprocity (equalto the proportion of ties which are recipro-cated) in all 6 networks in both communities.Interestingly, apart from the crisis monetaryhelp network in Ayyanapuram, the reciprocitymeasures are fairly similar across the two com-munities.
Table 3, 4 and 5 give the maximum and mini-mum values of the in-degrees and out-degreesfor all six networks in both communities, andcompare the numbers of isolates, transmittersand receivers as well as symmetric and asym-metric ties in the networks.
5. Community detection: an illustra-tion of a few common algorithms
We now turn our attention to a descriptionof the clusters (communities) present in thenetwork. A visual inspection of the graphsearlier in the paper tentatively identifies a ma-jor and a few minor groups in the monetaryhelp networks (and to some extent in the othernetworks). We examine this issue further bycomparing on the crisis monetary network theresults of four common community detectionalgorithms.
The problem of identifying communities ina graph in such a way as to maximize thenumber of links inside the communities andminimize the number of links between thecommunities is a difficult problem which hasspawned a sizeable literature. Fortunato (2010),gives an extensive review of methods for ex-tracting communities, pointing out that thematter of defining what a community is isnot always settled in the literature and thatcommunities are sometimes defined as theoutcome of a particular algorithm rather thanin an a-priori fashion. In particular some atten-tion has been given to algorithms which canidentify communities in very large graphs.
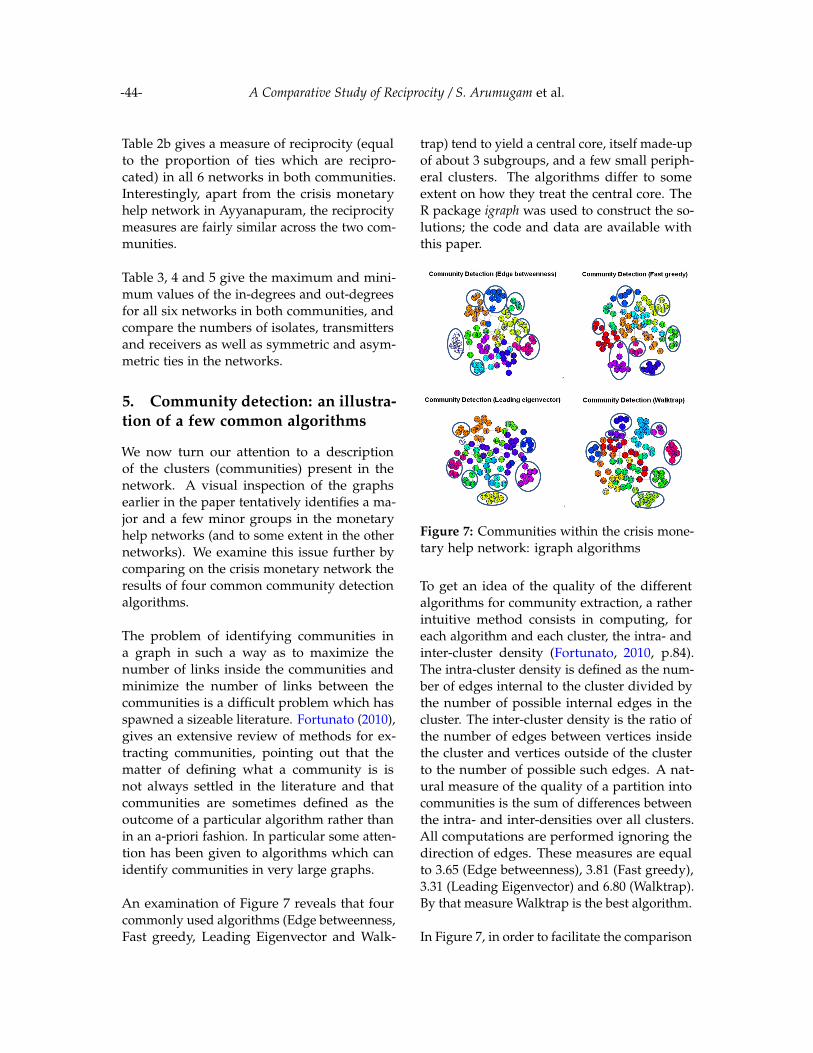
An examination of Figure 7 reveals that fourcommonly used algorithms (Edge betweenness,Fast greedy, Leading Eigenvector and Walk-
trap) tend to yield a central core, itself made-upof about 3 subgroups, and a few small periph-eral clusters. The algorithms differ to someextent on how they treat the central core. TheR package igraph was used to construct the so-lutions; the code and data are available withthis paper.
Figure 7: Communities within the crisis mone-tary help network: igraph algorithms
To get an idea of the quality of the differentalgorithms for community extraction, a ratherintuitive method consists in computing, foreach algorithm and each cluster, the intra- andinter-cluster density (Fortunato, 2010, p.84).The intra-cluster density is defined as the num-ber of edges internal to the cluster divided bythe number of possible internal edges in thecluster. The inter-cluster density is the ratio ofthe number of edges between vertices insidethe cluster and vertices outside of the clusterto the number of possible such edges. A nat-ural measure of the quality of a partition intocommunities is the sum of differences betweenthe intra- and inter-densities over all clusters.All computations are performed ignoring thedirection of edges. These measures are equalto 3.65 (Edge betweenness), 3.81 (Fast greedy),3.31 (Leading Eigenvector) and 6.80 (Walktrap).By that measure Walktrap is the best algorithm.
In Figure 7, in order to facilitate the comparison
-45- A Comparative Study of Reciprocity / S. Arumugam et al.
of results across the four algorithms, we circlethe peripheral clusters identified by the Walk-trap algorithm, and circle those same groupsin the graphs produced by the other three algo-rithms. Essentially, all algorithms agree on theidentification of the small peripheral groups,but differ in how they treat the central core.A more exhaustive comparison of communitydetection algorithms applied to the networksin this paper would be very interesting, andlies outside the scope of the current article.
6. Discussion and related work
This paper has investigated the structure of arural community in Southern Tamil Nadu, theYadhava group in the village of Ayyanapuram,and has compared it with that of a previouslyinvestigated community in a very similar ge-ographical location, the Saliyar group in thevillage of Sankarapandiapuram. The analysisin the paper has revealed that the social net-work structures of the two communities arequite different, on all three dimensions of mon-etary help, advisory help and companionship.
The social network in the Yadhava communityis much tighter than in the Saliyar communityand it is qualitatively clear that the Yadhavacommunity enjoys higher living standards.This raises the question of whether tightknitnetworks, where members help each other,yield benefits to members in the form of higherliving standards. The case we have presentedhere leads credence to the notion that socialcapital is important in communities such asthe Yadhava and Saliyar groups.
We mention here related work in the area of ru-ral development, notably in India. Matuschke(2008) suggests that a combination of socialnetwork analysis and econometrics could helpestablish which network characteristics havethe greatest impact on the adoption of inno-vative technologies among small farm holdersin rural areas and presents a case study onthe adoption of hybrid wheat in India. Spiel-man et al. (2011) also investigate innovation
systems and networks in rural areas, this timein Ethiopia. The emphasis is on understand-ing how networks facilitate the transfer ofknowledge among various actors, such theinnovators themselves, farm holders, coopera-tives, non-governmental organizations etc.
Vanneman et al. (2006) using a nationwidesurvey of 40,000 households in India, examinevariation in social capital across caste, tribe andreligion. The networks examined here involveties between households and persons in medi-cal, educational and governmental institutions.The authors find that social capital does varyacross hierarchies of caste, tribe and religionin India, but that these differences are miti-gated to some extent by wealth and education,indicating some success of the "reservation"(affirmative action) system.
Bichir and Marques (2012) investigate the roleof personal networks in the reproduction ofurban poverty in Brazil, focusing on the citiesof São Paulo and Salvador. The emphasis hereis on the size of personal networks, with afinding that poor people’s networks tend to besmaller and less diversified in their sociabilityprofiles.
While these studies focus on different aspectsof social networks, a common theme is thatsocial networks are an integral and importantpart of living standards studies. We hope andexpect that the data and analysis in this paperwill be of use to further research in this direc-tion.
In this paper, we extracted communities fromthe crisis monetary network using commoncommunity extraction algorithms. The ideaof extracting communities in such a way thatintra-community links are many but inter-community links are few is quite classical andis described for example in Newman (2004).The algorithms compared in this paper yieldsimilar sets of peripheral smaller clusters buttreat the central core differently (Figure 7).

-46- A Comparative Study of Reciprocity / S. Arumugam et al.
A recent discussion of algorithms for imple-menting divisive edge (and vertex) cutting pro-cesses can be found in Kim and Candan (2012).A very interesting future perspective wouldbe a more exhaustive comparison of commu-nity detection algorithms in the context of thenetworks in this paper.
7. Acknowledgements
We wish to convey our sincere thanks to a ref-eree for most useful comments and references.
References
Arumugam, S., Haughton, D., Vasanthi, B., andZhang, C. (2014). Reciprocity in social net-works - a case study in tamil nadu. CaseStudies in Business, Industry and GovernmentStatistics, 5(2):126–131.
Bichir, R. and Marques, E. (2012). Poverty andsociability in brazilian metropolises: Com-paring poor people’s personal networks insão paulo and salvador. Connections, 22:20–23.
Fortunato, S. (2010). Community detection ingraphs. Physics Reports, 486(3):75–174.
Fruchterman, T. and Reingold, B. (1991). Graphdrawing by force-directed placement. Soft-
ware: Practice and experience, 21(11):1129–1164.
Kim, M. and Candan, K. (2012). Sbv-cut: vertex-cut based graph partitioning using structuralbalance vertices. Data and Knowledge Engineer-ing, 72:285–303.
Matuschke, I. (2008). Evaluating the impact ofsocial networks in rural innovation systems: Anoverview, volume 816.
Newman, M. (2004). Detecting communitystructure in networks. The European Phys-ical Journal B-Condensed Matter and ComplexSystems, 38(2):321–330.
Pajek (2014). from http://pajek.imfm.si/
doku.php?id=pajek.
Spielman, D., Davis, K., Negash, M., and Ayele,G. (2011). Rural innovation systems and net-works: findings from a study of ethiopiansmallholders. Agriculture and human values,28(2):195–212.
Vanneman, R., Noon, J., Sen, M., Desai, S., andShariff, A. (2006). Social networks in india:caste, tribe and religious variations. In Pro-ceedings of the Annual Meeting of the PopulationAssociation of America.
Correspondence: [email protected].