Embed Size (px)
Citation preview
Indian J Physiol Pharmacol 1999; 43 (1) : 73-78
A COMPARISON OF DIFFERENT METHODS OF MEASURINGFAT MASS IN HEALTHY INDIANS WITH A WIDE EMI RANGE
CHAITANYA PRABHU, REEJIS STEPHEN, REBECCA KURIYAN ANDANURA V. KURPAD*
Division of Nutrition,Department of Physiology,St. John's Medical College,Bangalore - 560 0034
( Received on May 4, 1998)
Abstract: The prediction of fat mass from the measurement of bioelectricalimpedance has gained popularity because of the ease of performing themeasurement. However, the prediction equation used in this method couldbe specific for a distribution of body size. This study tested the predictionof fat mass in Indian, by the use of an equation based on bioelectricalimpedance, which had earlier been generated on a group of low body massindex (EMI 18.15±2.07 kg/m') Indians. The impedance method was testedagainst a standard skinfold method based on the sum of four skinfolds, ina group of 68 Indian males with a large range of BMI (16-26 kg/m 2). Thesubject were tested as a single group, and were also stratified into fourgroups based on their BMI, with ranges of BMI between, 15.0-17.9, 18.020.9, 21.0-23.9, and >24.0. The mean difference between the estimates offat mass from the two methods was low in the lowest body mass index(EM!) group (0.91 ± 2.00 kg), with the impedance equation over-estimatingthe fat mass in all groups. This suggests that the impedance equationshould be used with caution in groups whose BMI is above 21.
The distribution of the skinfold thickness revealed that the thicknessof the suprailiac skinfold showed the most linear and greatest increment,as the BMI increased across the groups, i.ldicating that it is probably thebest single indicator of the fat mass, among the individual skinfolds.
Key words: bioelectrical impedance skinfolds BMI
INTRODUCTION
The human body can be divided into twocompartments, the fat and the fat free mass(FFM((l). These can be measured by easyto use methods, such as skinfold andbioelectrical impedance methods (2). These
*Corresponding Author
methods, while practical, are dependent onthe use of predictive equations which relatethe measured variable (skinfold thicknessor impedance) to the fat mass. Sincepredictive equations best fit the populationfrom which they are derived, it is possiblethat an equation derived on a population of
74 Prabhu et al
thin people may not be appropriate for afatter population. This precludes the generaluse of predictive equations in differentpopulations, until they are tested. An earlierstudy (using hydrodensitometry as areference), had shown the acceptableaccuracy of the skinfold method in low BMI(Body Mass Index, Weight (kg)/Height2 (m)Indians (3). Further, the skinfold equationwas generated in subjects whose BMI wascomparable to the higher BMI subjects inthis study (4); this suggested that theskinfold method was good enough to be usedas a reference method in this study, sinceit could be used in subjects with a range ofBMI's.
Body composition measurements usingskinfolds, involve measuring the skinfoldthickness at different sites. A combinationof these skinfolds is then used to determinethe body density using regression equation(4), and the fat mass is then calculated fromthe body density (5). The bioelectricalimpedance method to measure the fat massis based on the principle of passing a minuteamount of current through the body andmeasuring the impedance to the passage ofthis current (6). The variable (Height2/
Impedance) generated from these valueswas, in an earlier report (3), subjected toregression analysis with values of FFMmeasured by the hydrodensitometricmethod, by which an equation wasgenerated for FFM estimation. Thisregression equation was specificallygenerated using a population with low BMI(mean ± SD, 18.1 ± 2.0 kg/m 2). However, itis not known if this regression equationwould apply equally well to Indian with arange of BMI's particularly in the higherrange.
Indian J Physial Pharmacal 1999; 43(1)
There fore, this experiment aimed toevaluate the general applicability of theIndian impedance equation In themeasurement of the fat mass of healthysubjects with higher BMI's, in comparisonto the same values obtained by skinfoldthickness. In addition, this experiment alsoaimed at studying the skinfold thickness atfour sites in order to assess the skinfoldwhich shows maximum change withincreasing BMI (or increasing body fat).
METHODS
The study was carried out on a group of68 males, in the age group of 17 to 25 years.The mean BMI of the whole group was20.9 ± 2.8 kg/m 2• The subjects were recruitedfrom the student population of St John'sMedical College, Bangalore. The subjectswere healthy and were not receiving anymedication at the time.
The subjects were studied at 6.30 AM,and had been fasted for a duration of eighthours, with no strenuous physical activityeight hours prior to the measurement. Theanthropometric and skinfold measurementswere carried out immediately. The subjectswere weighed in minimal clothing using adigital scale (Soehnle, Germany) which hada precision of 0.1 kg. The height of thesubjects was recorded without footwearusing a vertically mobile scale (Karrimetre,Sweden) and expressed in centimetres to thenearest 0.1 em. The following skinfoldmeasurements were made in triplicate inthe standing position on the right side ofthe body and the mean value was taken forthe calculation: biceps, triceps, sub-scapularand suprailiac. All measurements werestandardized and carried out according to

Indian J Physiol Pharmacol 1999; 43(1)
an Anthropometric reference manual (8),and were measured to the nearest 0.2 mm,using skinfold callipers (Holtain, Crymych,UK). The measurements were made by oneperson for the entire study, and the meanintra-observer variation was 0.25 mm, forfour skinfolds, which was within acceptablelimits (8).
Bioelectrical impedance, using abioelectrical impedance meter (Bodystat, Isleof Man, British Isles) and quadrupolarelectrodes, was measured after the initialanthropmentry. The procedure was carriedout according to the recommendations in theNIH Technological Assessment Statement(6). An alternating current of 800 microamperes, at a frequency of 50 Hz wasapplied between the source and the sensorelectrodes to provide a measurement ofimpedance.
The fat free mass (FFM) was calculatedby using an equation generated earlier forIndians (3).
FFM (kg) = 16.726 + 0.5977 x Ht2/1
where Ht = Height (cm), and IImpedance (ohms)
Fat Mass (kg) was then calculated bysubtracting the FFM from the body weight.
The logarithm of the sum of fourskinfolds, or of combination or either 3skinfolds, 2 skinfolds, or individual skinfoldswas used in gender and age specificequations (4) to obtain the body density,from which estimates of percentage body fat,body fat in kg were made using the equation(5):
Body Composition in Indians 75
Fat % = [(4.95/Density)-4.5J x 100
Fat Mass (kg) = Fat% x Body weight
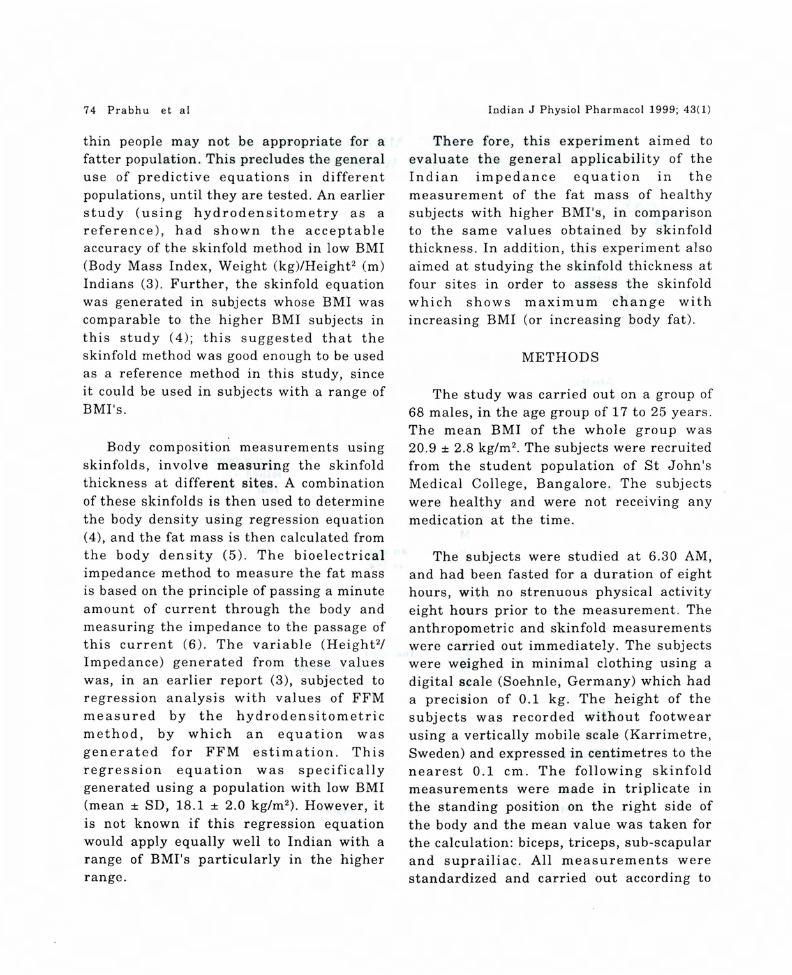
The fat mass obtained by the skinfoldmethod was compared with the fat massobtained by the bioimpedance method, usingregression, as well as analysis of bias, withskinfold as the reference method. Estimatesobtained from the skinfold method weresubtracted from the estimates obtained byusing bioimpedance (this difference is calledthe bias), and plotted against the mean fatmass estimate from both methods. This datawas also subjected to regression analysis,in order to test if the magnitude of themeasurement had any influence on the bias(7). Mean and standard deviation of the biaswere also obtained.
Fat mass was also estimated from thesum of three or two, and single skinfolds,in order to test if any particular skinfold,or combination, gave values for the fat mass,which were different form the four skinfoldestimate. These data were also subjecteci toanalysis of bias, as detailed above. Inaddition, the data was also assessed in astratified fashion, by dividing the subjectsinto four groups: BMI 15-17.9, BMI 18-20.9,BMI 21-23.9, and BM! > 24 kg/m 2•
Significant differences were tested forby using a One-Way ANOVA, and resu1tswere considered so if P < 0.05. Data arepresented as mean ± SD.
An ethical approval had been obtainedin a previous study for the samemeasurements, by the Ethics Committee ofSt. Johns Medical College, Bangalore, India.
76 PralJhu et al Indian J Physiol Pharmacol 1999; 43(1)
RESULTS "r-------------------,The anthropometry of the subjects is
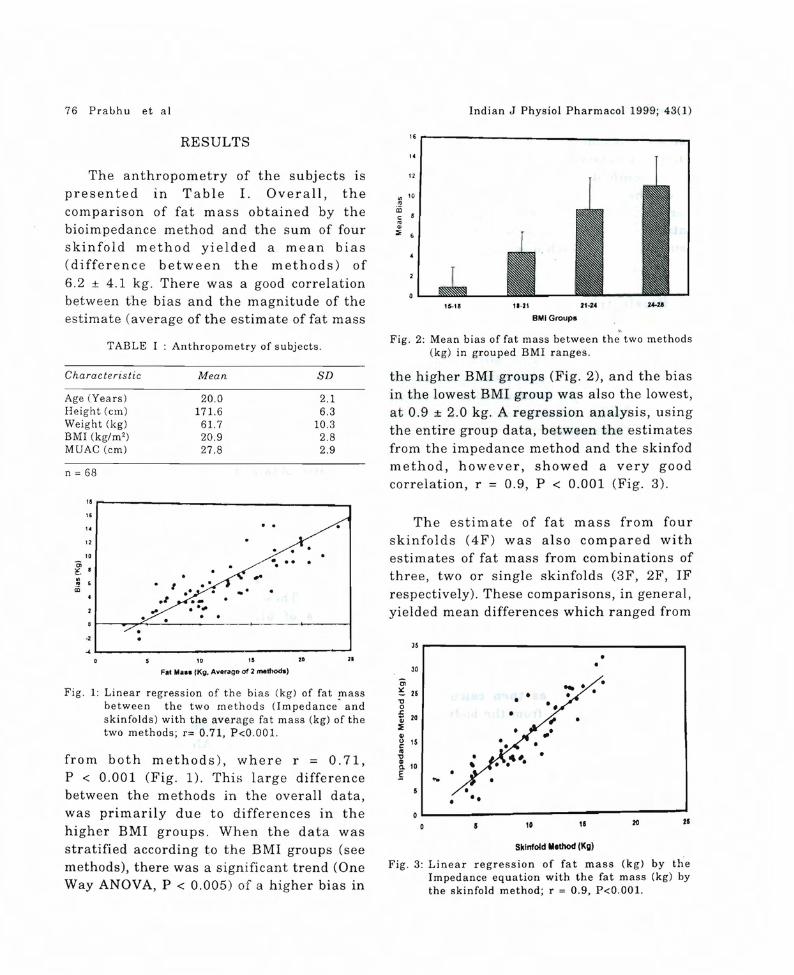
presented In Table 1. Overall, thecomparison of fat mass obtained by thebioimpedance method and the sum of fourskinfold method yielded a mean bias(difference between the methods) of6.2 ± 4.1 kg. There was a good correlationbetween the bias and the magnitude of theestimate (average of the estimate of fat mass
"12
'" 10
'"iiic:'"'":li
IS-IS 11-21 21·24
8MI Group.
24-28
TABLE I : Anthropometry of subjects.Fig. 2: Mean bias of fat mass between the two methods
(kg) in grouped BM! ranges.
Characteristic Mean SD
Age (Years) 20.0 2.1Height (em) 171.6 6.3Weight (kg) 61.7 10.3BMI (kg/m') 20.9 2.8MUAC (em) 27.8 2.9
n = 68
"r------------------,
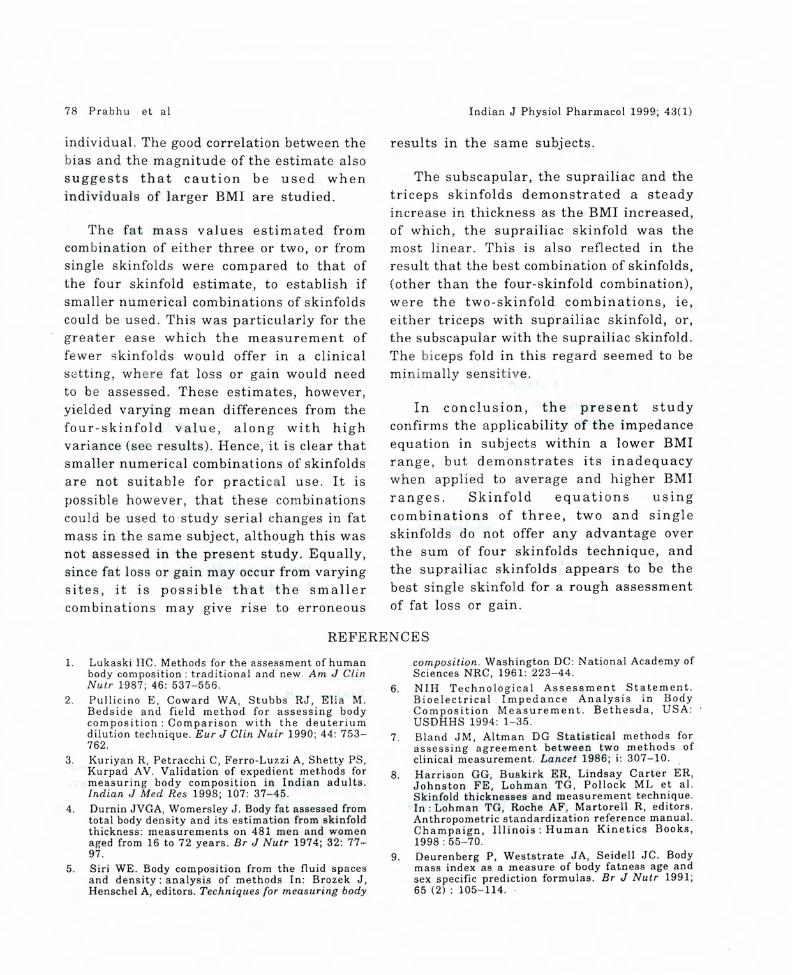
the higher BMI groups (Fig. 2), and the biasin the lowest BMI group was also the lowest,at 0.9 ± 2.0 kg. A regression analysis, usingthe entire group data, between the estimatesfrom the impedance method and the skinfodmethod, however, showed a very goodcorrelation, r = 0.9, P < 0.001 (Fig. 3).
12
10
" The estimate of fat mass from fourskinfolds (4F) was also compared withestimates of fat mass from combinations ofthree, two or single skinfolds (3F, 2F, IFrespectively). These comparisons, in general,yielded mean differences which ranged from
-. .. ...o.
o o~
o •
• I
•1..
"
..1-_-------------------'Fig, 1: Linear regression of the bias (kg) of fat mass
between the two methods (Impedance" andskinfolds) with the average fat mass (kg) of thetwo methods; r= 0.71, P<O.OO1.
from both methods), where r = 0.71,P < 0.001 (Fig. 1). This large differencebetween the methods in the overall data,was primarily due to differences in thehigher BMI groups. When the data wasstratified according to the BMI groups (seemethods), there was a significant trend (OneWay ANOVA, P < 0.005) of a higher bias in
oo
... 0oo..,_0
•••
o
"I
""
...
30
'"~ 25'0o.c0; 20:E.,g ,5..'0
8. 10
.E
35 r------------------..,
oL-------------~o 10 11 20 21
Sklnfolcl ...thod (Kg)
Fig. 3: Linear regression of fat mass (kg) by theImpedance equation with the fat mass (kg) bythe skinfold method; r = 0.9, P<O.OO1.
"10 15 20
Fa. "a.. (Kg. Average of 2 mothod1l)
o-2 0

Indian J Physiol Pharmacol 1999; 43(1)
2.1""""------------ --,.._
..:~ 12u
~
"E I<:i
" ....--,
•l------+-----2~'-~U:----~>'4115-1. "-21
8MI Rang••
Fig. 4: Mean skin fold thickness (mm) in grouped BI\IIranges.
0.02 to 2.15 kg and standard deviations ofthe mean, ranging from 0.15 to 2.07 kg. Thebest comparisons were between thecombinations of 2 skinfolds (eithersubscapular and suprailiac, or, triceps andsuprailiac) and the sum of four skinfolds.For the single skinfolds methods, thesuprailiac and subscapular were the bestindicators for fat mass. An analysis of thedistribution of skinfolds thickness at thedifferent sites showed that the bicepsskinfolds was not significantly affected byincreasing BMI, while all the other skinfoldsshowed almost linear increases withincreasing BMI ranges (Table II, Fig 4).
TABLE II Distribution of the skinfold thickness inthe various subgroups. (mm)
Biceps Triceps Subscap Suprailiac
All Groups 3.2±1.1 10.8±4.5 11.4±3.9 12.9±5.5n=68
BMI15-18 2.5±O.3 7.8±2.2 7.3±1.2 7.6±3.4n=7
BMI18-21 3.0±O.9 9.3±4.2 10.2±3.0 11.0±4.2n=32
BMI21-24 3.2±O.9 11.7±3.3 12.4±3.2 15.2±5.0n=18
BMl>24 4.4±1.3 15.5±4.5 16.0±3.7 18.8±4.3n = 11
Values are mean ± SD
Body Composition in Indians 77
DISCUSSION
The choice of the skinfold method as thereference in this study was based on anearlier study where the mean differencebetween the skinfold method andhydrodensitometry was 0.16 ± 1.1 kg, forestimates of FFM (3). The mean FFM inthat study was 43 kg, and thus, the biasbetween the methods was less than 0.5% ofthe estimate. In addition, the skinfoldmethod used equations derived from studiesof males in the same age range, but with awide range of BMI's (4). A calculation ofthe range of BMI's in that study, based onan equation that related % fat that to theBMI (9), showed that the BMI ranged fromless than 16 to over 40 kg/m2. Therefore, itwas decided that the skinfold equationscould be used as reference method for thisstudy.
The impedance equation (3) which wasderived from an Indian population, appliedwell to the lower BMI range. The fat massobtained in these subjects showed a slightpositive bias with a standard deviation ofapproximately 2 kg, which was similar tothat recorded in the earlier study whichcompared the Impedance method withhydrodensitometry (3). In the average andhigher BMI ranges, the markedoverestimation of fat mass shows that theimpedance equation cannot freely be appliedto such subjects. The increasing positivebias with increasing fat mass suggests thatthe systematic error of the estimateincreases with the BMI, the values of theSD of the bias in the two higher BMI groups(± 2.00, ± 2.08, ± 3.21, and ± 3.09 kg, ingroups 1, 2, 3 and 4 respectively, see Fig 2)also increased, suggesting that the randomerror was also dependent on the BMI of the
78 Prabhu et al
individual. The good correlation between thebias and the magnitude of the estimate alsosuggests that caution be used whenindividuals of larger BMI are studied.
The fat mass values estimated fromcombination of either three or two, or fromsingle skinfolds were compared to that ofthe four skinfold estimate, to establish ifsmaller numerical combinations of skinfoldscould be used. This was particularly for thegreater ease which the measurement offewer skinfolds would offer in a clinicalsetting, where fat loss or gain would needto be assessed. These estimates, however,yielded varying mean differences from thefour-skinfold value, along with highvariance (see results). Hence, it is clear thatsmaller numerical combinations of skinfoldsare not suitable for practic 1 use. It ispossible however, that these combinationscould be used to study serial changes in fatmass in the same subject, although this wasnot assessed in the present study. Equally,since fat loss or gain may occur from varyingsites, it is possible that the smallercombinations may give rise to erroneous
Indian J Physiol Pharmacol 1999; 43(1)
results in the same subjects.
The subscapular, the suprailiac and thetriceps skinfolds demonstrated a steadyincrease in thickness as the BMI increased,of which, the suprailiac skinfold was themost linear. This is also reflected in theresult that the best combination of skinfolds,(other than the four-skinfold combination),were the two-skinfold combinations, ie,either triceps with suprailiac skinfold, or,the subscapular with the suprailiac skinfold.The biceps fold in this regard seemed to beminimally sensitive.
In conclusion, the present studyconfirms the applicability of the impedanceequation in subjects within a lower BM!range, but demonstrates its inadequacywhen applied to average and higher BM!ranges. Skinfold equations usingcombinations of three, two and singleskinfolds do not offer any advantage overthe sum of four skinfolds technique, andthe suprailiac skinfolds appears to be thebest single skinfold for a rough assessmentof fat loss or gain.
REFERENCES
1. Lukaski HC. Methods for the assessment of humanbody composition: traditional and new. Am J ClinNutr 1987; 46: 537-556.
2. Pullicino E, Coward WA, Stubbs RJ, Elia M.Bedside and field method for assessing bodycomposition: Comparison with the deuteriumdilution technique. Eur J Clin Nuir 1990; 44: 753762.
3. Kuriyan R, Petracchi C, Ferro-Luzzi A, Shetty PS,Kurpad AV. Validation of expedient methods formeasuring body composition in Indian adults.Indian J Med Res 1998; 107: 37-45.
4. Durnin JVGA, Womersley J. Body fat assessed fromtotal body density and its estimation from skinfoldthickness: measurements on 481 men and womenaged from 16 to 72 years. Br J Nutr 1974; 32: 7797.
5. Siri WE. Body composition from the fluid spacesand density: analysis of methods In: Brozek J,Henschel A, editors. Techniques {or measuring body
composition. Washington DC: National Academy ofSciences NRC, 1961: 223-44.
6. NIH Technological Assessment Statement.Bioelectrical. Impedance Analysis in BodyComposition Measurement. Bethesda, USA:USDHHS 1994: 1-35.
7. Bland JM, Altman DG Statistical methods forassessing agreement between two methods ofclinical measurement. Lancet 1986; i: 307-10.
8. Harrison GG, Buskirk ER, Lindsay Carter ER,Johnston FE, Lohman TG, Pollock ML et al.Skinfold thicknesses and measurement technique.In: Lohman TG, Roche AF, Martorell R, editors.Anthropometric standardization reference manual.Champaign, Illinois: Human Kinetics Books,1998: 55-70.
9. Deurenberg P, Weststrate JA, Seidell JC. Bodymass index as a measure of body fatness age andsex specific prediction formulas. Br J Nutr 1991;65 (2) : 105-114.