Embed Size (px)
Citation preview
A COMPARISON OF FASHION OPINION LEADERS AND POLITICAL OPINION
LEADERS IN TERMS OF ATTITUDE TOWARD FASHION ADVERTISEMENTS WITH
POLITICAL CONTENT
by
BETH HARBEN
(Under the Direction of Soyoung Kim)
ABSTRACT
The purpose of this study was to compare how fashion opinion leadership and political
opinion leadership affected attitude toward fashion advertisements with political content as well
as attitude toward the product. Students from The University of Georgia were surveyed about
their activities involving fashion and political affairs, and their attitudes toward a fashion
advertisement with political content. Using the median split method, respondents were divided
into fashion opinion leaders and non-leaders; and political opinion leaders and non-leaders.
Multiple regression analyses revealed a significant relationship between attitude toward the
advertisement and attitude toward the product. A significant relationship was also found
between agreement with the message and advertisement attitude for political opinion leaders. No
significant relationships were found between political opinion leadership and advertisement
attitude or product attitude. The relationships between fashion opinion leadership and
advertisement attitude or product attitude also were not significant.
INDEX WORDS: Fashion advertisements, advertisement attitude, product attitude, political opinion leaders, fashion opinion leaders, advocacy advertising, political advertising
A COMPARISON OF FASHION OPINION LEADERS AND POLITICAL OPINION
LEADERS IN TERMS OF ATTITUDE TOWARD FASHION ADVERTISEMENTS WITH
POLITICAL CONTENT
by
BETH HARBEN
B.S., The University of Georgia, 2001
A Thesis Submitted to the Graduate Faculty of The University of Georgia in Partial Fulfillment
of the Requirements for the Degree
MASTER OF SCIENCE
ATHENS, GEORGIA
2004

© 2004
Beth Harben
All Rights Reserved
A COMPARISON OF FASHION OPINION LEADERS AND POLITICAL OPINION
LEADERS IN TERMS OF ATTITUDE TOWARD FASHION ADVERTISEMENTS WITH
POLITICAL CONTENT
by
BETH HARBEN
Major Professor: Soyoung Kim
Committee: Brigitte Burgess Jan Hathcote Anne Sweaney
Electronic Version Approved: Maureen Grasso Dean of the Graduate School The University of Georgia May 2004

v
ACKNOWLEDGEMENTS
There are a number of people to thank for helping me with this research. First, I want to
thank Dr. Kim for being the best major professor a student could have. Looking back on my
graduate career, I will always remember her endless encouragement and willingness to solve any
problem, as well as her humor, which was very much needed at times. Next, I want to thank my
committee, Dr. Hathcote, Dr. Sweaney, and Dr. Burgess, for their support. I will always
remember Dr. Hathcote’s warm smile and ability to convince me that any task can be done,
especially with the help of your friends. I also want to thank Dr. Sweaney for her kind advice
and for taking a chance on a girl she barely knew. I want to thank Dr. Burgess for being a
mentor to me, especially during my first year of graduate school, and for staying on my
committee even though she moved so far away. I must thank Mark Toomey for helping me with
the on-line survey and webpages and patiently answering every question I had. Thanks to Arti
Umachandran for helping me with the very professional looking advertisements. It was great to
work with you. Finally, I want to close by thanking the people most dear to me, my friends and
family. I love you and I could not have gone back to school without your support! Thank you
to Eric for being so sweet and understanding and always reassuring me that I’ll be fine.
vi
TABLE OF CONTENTS
Page
ACKNOWLEDGEMENTS .............................................................................................................v
LIST OF TABLES .........................................................................................................................viii
LIST OF FIGURES ........................................................................................................................ ix
CHAPTER
1 INTRODUCTION .........................................................................................................1
History.......................................................................................................................2
Justification................................................................................................................3
2 REVIEW OF LITERATURE ........................................................................................5
Characteristics of Fashion Leaders............................................................................5
Comparisons of Fashion Opinion Leaders and Non-leaders .....................................6
Political Opinion Leaders’ Influence in Society .......................................................7
Characteristics of Political Opinion Leaders .............................................................8
Factors Influencing Attitude toward the Advertisement .........................................10
Summary of Literature ............................................................................................11
Remaining Questions ...............................................................................................12
3 THEORETICAL RATIONALE..................................................................................13
Objectives ................................................................................................................16
Hypotheses ..............................................................................................................17
4 METHODOLOGY.......................................................................................................18
vii
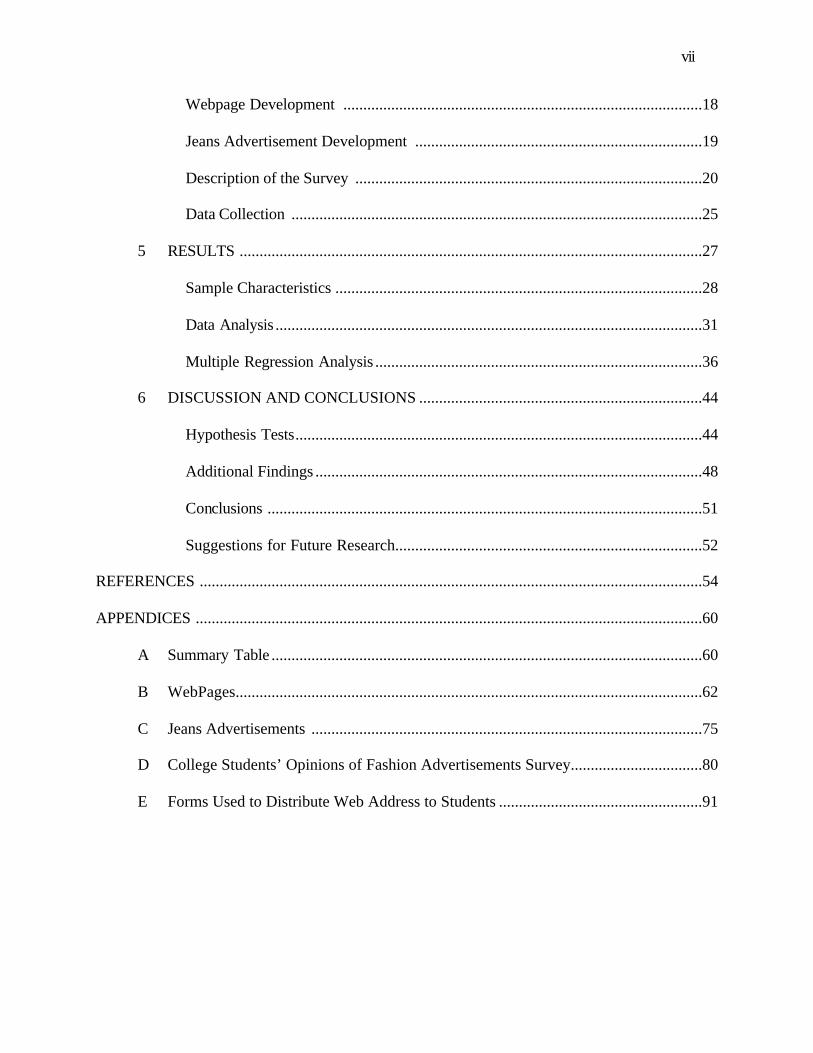
Webpage Development ..........................................................................................18
Jeans Advertisement Development ........................................................................19
Description of the Survey .......................................................................................20
Data Collection .......................................................................................................25
5 RESULTS ....................................................................................................................27
Sample Characteristics ............................................................................................28
Data Analysis ...........................................................................................................31
Multiple Regression Analysis ..................................................................................36
6 DISCUSSION AND CONCLUSIONS .......................................................................44
Hypothesis Tests......................................................................................................44
Additional Findings .................................................................................................48
Conclusions .............................................................................................................51
Suggestions for Future Research.............................................................................52
REFERENCES ..............................................................................................................................54
APPENDICES ...............................................................................................................................60
A Summary Table ............................................................................................................60
B WebPages.....................................................................................................................62
C Jeans Advertisements ..................................................................................................75
D College Students’ Opinions of Fashion Advertisements Survey.................................80
E Forms Used to Distribute Web Address to Students ...................................................91
viii
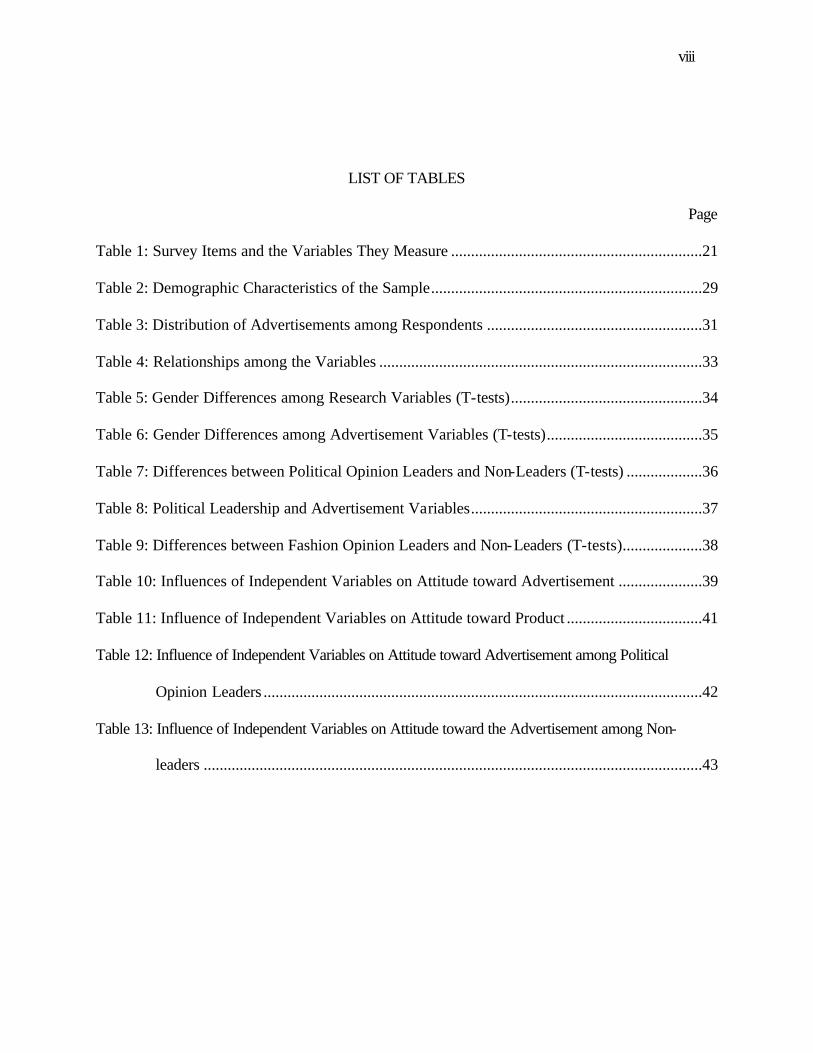
LIST OF TABLES
Page
Table 1: Survey Items and the Variables They Measure ...............................................................21
Table 2: Demographic Characteristics of the Sample....................................................................29
Table 3: Distribution of Advertisements among Respondents ......................................................31
Table 4: Relationships among the Variables .................................................................................33
Table 5: Gender Differences among Research Variables (T-tests)................................................34
Table 6: Gender Differences among Advertisement Variables (T-tests).......................................35
Table 7: Differences between Political Opinion Leaders and Non-Leaders (T-tests) ...................36
Table 8: Political Leadership and Advertisement Variables..........................................................37
Table 9: Differences between Fashion Opinion Leaders and Non-Leaders (T-tests)....................38
Table 10: Influences of Independent Variables on Attitude toward Advertisement .....................39
Table 11: Influence of Independent Variables on Attitude toward Product ..................................41
Table 12: Influence of Independent Variables on Attitude toward Advertisement among Political
Opinion Leaders ..............................................................................................................42
Table 13: Influence of Independent Variables on Attitude toward the Advertisement among Non-
leaders .............................................................................................................................43
ix
LIST OF FIGURES
Page
Figure 1: The Two Step Flow of Communication Hypothesis ......................................................15
1
Chapter 1
Introduction
In the last ten years, the focus in a growing number of fashion advertisements has been
on a political or social theme rather than on the product of the company who created the
advertisement. The question this study will investigate is how this political content affects both
fashion opinion leaders and non-leaders, and political opinion leaders and non-leaders, as they
observe the advertisement. Also, this research will examine how agreement of the political
message expressed in the advertisement affects political leaders’ attitude toward the
advertisement.
From its beginning, fashion advertisements incorporating political issues have sparked
great controversy. Fashion advertisements have covered controversial topics such as capital
punishment and abortion. The advertisements have also featured shocking images such as a nun
and a priest kissing and pictures of death row inmates (Pashupati, 2003). The advertisements
display eye-catching phrases such as “AIDS can’t be fought on a shoe string budget,” and “What
we stand for is more important than what we stand in” (Cardona, 2003, p. 568). Recently,
United Colors of Benetton has an advertisement campaign calling for an end to world hunger.
The advertisements in the campaign show pictures of Afghanistan citizens. One picture shows a
man with an artificial arm. On the end of the arm is not a hook for a hand, but a bent spoon.
The shocking nature of pictures like this is causing a great debate among consumers in the U.S.
2
History
Fashion advertisements with political content can classify as a form of advocacy
advertising. “Advocacy advertising is concerned with propagation of ideas and elucidates
controversial issues in public policy terms” (Pashupati, 2003, p.16). The first use of advocacy
advertising by individual corporations began during the Franklin D. Roosevelt presidency. Many
advertisements were from businesses opposing the New Deal reforms. In 1936, Warner and
Swasey Company began a long lasting campaign with advertisements calling for a number of
pro-business conservative policies. Advocacy advertising grew in the early 1970’s, due to an
increase in concern of environmental, occupational, and health and safety issues (Pashupati,
2003).
United Colors of Benetton brought advocacy advertising to fashion in 1984 with its
“Campaign for Racial Equality” (Tinic, 1997). The campaign “All the Colors of the World”
featured young adults from different racial groups in the advertisements. In 1985 Kenneth Cole
was one of the first apparel makers to address AIDS awareness in his advertisements (Cardona,
2003). Since then, Members Only, Diesel, and Express have also issued advertisements with
political messages (Kim, Park, & Kim, 2001).
The political content of advertisements was quickly noticed and highly discussed by the
American public. For example, United Colors of Benetton launched a campaign entitled “We,
on Death Row” which featured pictures and interviews with death row inmates (Taylor, 2000).
The advertisement caused Sears, Roebuck and Company to pull Benetton USA products from
their shelves. More recently, Kenneth Cole advertisements caused controversy as well. The fall
2001 campaign contained an advertisement that negatively portrayed the Bush-Cheney
3
administration (Murphy, 2001). After the terrorism of September 11, the designer ended the
campaign due to complaints that the advertisements were anti-patriotic.
Justification
Fashion advertisements with political content are unique because they go against the
accepted strategy of advertising. Conventional advertising shows the positive characteristics of a
product or the company itself, with the intent of selling the product to the viewer. Many
advertisements even go a step further and try to sell not only the product, but also a pleasant
situation or a desirable quality that could result from the product’s purchase. These fashion
advertisements with political content differ because they do not mention the product’s qualities.
Often the product is not even pictured in the advertisements. These advertisements show or
describe the harsh reality of the world instead of the pleasantries of a fantasy land. Thus, the
advertisements spark interest because they are so different from what society is accustomed to
experiencing.
As fashion advertisements with political content become more popular, their effects on
consumers become more important to study. For example, marketers know that these
advertisements will attract consumer’s attention, but they need to know how the consumer’s
attitude toward the advertisement will affect their attitude toward the product. This study will
determine the strength of the relationship between attitude toward these fashion advertisements
and attitude toward their products.
Marketers will also benefit by knowing how the opinion of the message in their
advertisement influences the attitude toward the advertisement for a specific group of people in
society, the political opinion leaders. Opinion leaders are the people in society most affected by

4
formal media (Katz, 1957). Thus, they are the people in society who are exposed the most to
marketer’s advertisements. It is especially important to see how the political message affects
their attitude toward the advertisement, since they will communicate their views most frequently
and most influentially than anyone in society.
5
Chapter 2
Review of Literature
The major topics of research for this study are fashion opinion leaders, political opinion
leaders, and advertising. The categories of writings on fashion opinion leaders include articles
explaining the characteristics of fashion opinion leaders, and articles comparing fashion opinion
leaders and non-leaders. Topics of writings on political opinion leaders consist of studies on
political opinion leaders’ influence in society, and characteristics of political opinion leaders.
Research on advertising includes studies on the factors that influence the attitude toward the
advertisement
Characteristics of Fashion Opinion Leaders
The study by Darden and Reynolds (1972) included in its sample men in three categories:
college men in fraternities, college men not in fraternities, and upper-middle class men, not in
college, who live in suburban areas. The researchers sought to identify common characteristics
of fashion opinion leaders in all categories using Roger’s self-designation scale to determine
opinion leadership. They also measured participants’ fashion interest, self-confidence, attitude
toward change, and information seeking using scales created by Wells and Tigert (1971). The
authors found that fashion interest and desire to discover new fashion items were the only two
characteristics that could be strong indicators of fashion opinion leadership in all three categories
of men.
6
Summers (1970) examined women fashion opinion leaders and identified characteristics
such as worldliness and gregariousness in female fashion opinion leaders. Summers found that
total magazine readership strongly correlated with fashion leadership, although other media did
not. Involvement, or interest, in clothing fashion was the strongest variable for determining
fashion leadership. The article provides many implications for marketers to take interest.
According to the article, fashion opinion leaders represent a significant target market and high
sales potential because they are price insensitive.
Behling (1992) examined ten studies from 1955 to 1988 that used Roger’s (1962) model
of self-designation to determine fashion opinion leadership. Behling measured interest in
fashion according to frequency of use and general use of specific media, particularly fashion
magazines. According to previous studies, Behling also found that eight demographic variables
were related to fashion leadership: age, marital status, children, education, income,
socioeconomic level, gender, and race. The studies indicated six psychological variables
correlate to fashion leadership: gregariousness, narcissism, conformity, willingness to try new
fashion items, and competitiveness. Findings also showed that opinion leadership is related to
interest in fashion and a positive attitude toward change.
Thus, according to the literature, prominent features of fashion opinion leaders are that
they have a strong interest in fashion, they are gregarious, and they like to try new things.
Comparisons of Fashion Opinion Leaders and Non-leaders
Polegato and Wall (1980) examined characteristics of information seeking by opinion
leaders such as type of sources used, frequency of use, and variety of sources used. Polegato and
Wall found that fashion leaders consulted a greater number of sources at a higher frequency than
7
fashion followers. The leaders and followers did not differ in the variety of sources consulted,
however. The leaders and followers also could not be distinguished by demographic
characteristics such as age, marital status, college, semester level, degree program, or residence.
Thus they found leaders and followers across all categories in the study.
Chowdhary and Dickey (1988) compared the frequency of leaders’ and non-leaders’ use
of media to gain fashion information. The researchers surveyed female college students in
northwest India to distinguish fashion leaders from non-leaders and examine how often each
group uses different media sources to acquire fashion information. Chowdhary and Dickey
found that fashion leaders used media to learn about fashion more often than non-leaders.
Indeed, fashion leaders more frequently consulted nine of the ten impersonal sources on the
survey, including fashion magazines, fashion advertisements, and newspaper articles.
In summary, the major differences between fashion opinion leaders and non-leaders is
that leaders are more interested in fashion, more knowledgeable about fashion, and use different
forms of media more often to gain information on fashion.
Political Opinion Leaders’ Influence in Society
As Huckfeldt and Sprague (1995) studied voters in South Bend, Indiana during the 1984
presidential election, they noticed that when an opinion leader was asked to list the people who
influenced their political views, they rarely named someone whom researchers had designated as
a non-leader. The researchers believed that this suggested the idea of a two-step flow of
communication in the community. The direction information, and thus influence, was moving
one way, not reciprocally, from opinion leader to non-leader.
8
Yin (1999), in an attempt to explain the formation of public opinion on the environment,
compared the two-step flow of communication model to the media diffusion model. Yin found
that the opinion leaders have a stronger influence on the public’s opinions about environmental
issues than the media has through direct contact with the public. The results showed a stronger
correlation between the leaders’ and the others’ opinions than between the media message and
the other’s opinions.
Mendelsohn (1996) also found that opinion leaders have more influence over others than
that of the media. As his study of the 1988 campaign progressed, specific issues, which were the
topics of respondents’ conversations, became more important, and leadership, which the media
focused on, was not as important to respondents. Mendelsohn believed that opinion leaders had
an advantage over the media. Medelsohn wrote, “Unlike media content, which is directed
toward a mass audience, political conversations take place within the individual’s social
networks and social structure, and can thus more easily highlight those aspects of political life
most crucial to them (p.117).”
According to these recent studies, political opinion leaders are influenced more by the
media than by other people with whom they talk. Conversely, non-leaders are influenced more
by their discussions with political opinion leaders than they are by the media.
Characteristics of Political Opinion Leaders
Robinson (1976) found distinct differences between political opinion leaders and non-
leaders. His results showed that opinion givers are more exposed to print media than opinion
receivers. He also discovered that influence moves in one direction only, from opinion giver to
opinion receiver. The opinion givers were not influenced if they perceived the person attempting
9
to influence them as less active, as an opinion receiver would be. Finally, opinion givers
participated more in organizations and were more involved in political affairs. The more active
the giver, the more exposed he was to political information from all sources. Robinson’s (1976)
finding is pertinent to the present study because it means that the opinion leaders are more
exposed to current political issues, and have most likely formed a stronger opinion than those not
as exposed.
Hellevik and Bjorklund (1991) found that opinion leaders have more extreme views than
non-leaders. When asked to rate their views on a scale from extreme right to extreme left, the
non-leaders responses revealed a bell-shaped curve; however, the political opinion leaders’ curve
was u-shaped. Thus, more political opinion leaders were found in the extreme areas of the scale.
Hellevik and Bjorklund wrote that opinion leaders might be more independent and more resistant
to the majority or mainstream opinion.
It is interesting to note that the opinion leaders in other domains, such as health, fashion,
and shopping, were almost evenly distributed across the political scale from extreme right to
extreme left (Hellevik and Bjorklund, 1991). This finding lends support for the current study
because when looking at the political message in the ad, the political opinion leaders should have
more extreme views than the opinion leaders in other areas, such as fashion, and the others who
are not opinion leaders in any area.
Elder and Greene (2003) found no gender difference concerning the impact of political
discussants on electoral choice. Both men and women were influenced by their political
discussants’ opinion about the election. These findings confirmed pre-established theories that
friends and close associates do influence people’s political choices, for both men and women.
Elder and Greene also found that both men and women can be political discussants, contrary to
10
previous studies which claim that women get their political information and are influenced
almost strictly by men (Katz and Lazarsfeld, 1955). The results showed that men and women
tend to pick discussants of the same sex, with 59% of men reporting that their primary discussant
was male and 53% of women reporting that their primary discussant was female. Finally,
women reported having slightly more political discussants than men and there was no significant
difference in the amount that women and men claimed to talk about politics with their primary
discussant. This challenged other studies which claimed that men discussed politics more than
women. This study confirmed that political opinion leaders are found across both genders.
Therefore, having both men and women participants in the survey will yield both male and
female political opinion leaders, and will allow for a survey sample that is representative of the
general population.
Factors Influencing Attitude toward the Advertisement Kim, Damhorst, and Lee (2002) found that while college students evaluated a T-shirt
advertisement, product attitude and product attribute beliefs, such as design/utility,
need/performance, and value, significantly influenced attitude toward the advertisement. Kim et
al. also found that two factors of apparel involvement, fashion involvement and need for
individuality, highly influenced how a respondent processed the advertisement. Finally, the
study discovered that personal involvement influenced how consumers determined apparel
product attribute beliefs, leading to formation of attitude toward the product.
Laczniak, Kempf, and Muehling (1999) studied the influence that advertising message
involvement, product involvement, and product knowledge have on the way a consumer
processes an advertisement. Of the three variables, advertising message involvement had the
11
strongest influence on advertisement processing. In fact, product involvement and product
knowledge had very little influence on a consumer’s response to the advertisement after
controlling the influence of advertising message involvement.
Lord, Lee, and Sauer (1995) found that message agreement and peripheral cues, such as
attitude toward advertising in general, exerted strong influence on attitude toward the
advertisement. Respondents’ attitude toward the message in an advertisement directly
influenced their attitude toward the advertisement. Advertising message also influenced product
attitude in high involvement groups, those respondents with strong interest in the product
category.
Summary of Literature
The current body of literature shows a number of concepts central to this research topic.
First, the previous studies indicate that surveys and scales can distinguish fashion and political
leaders from non-leaders. Researchers can use many personality characteristics to determine
opinion leadership. Behling (1992) found eight demographic variables and six psychological
factors. Both men and women can be both fashion and political opinion leaders. Also, the
studies show that fashion leaders and political leaders use media more frequently than non-
leaders to gain information. The research on advertising states that many factors influence the
attitude toward the advertisement, including attitude toward the product and agreement with the
message.
12
Remaining Questions
Many questions remain in the areas related to the research topic. Researchers have not
compared fashion opinion leaders and political leaders in any area, including their responses to
advertisements. Generally, researchers have not studied any opinion leaders’ responses to
advertising. Also, the topic of political messages in fashion advertisements has not been
thoroughly studied.
13
Chapter 3
Theoretical Rationale
The theory behind this research is the two-step flow of communication, which contains
three important concepts (Katz, 1957). The first of these concepts concerns the impact of
personal influence. The two cases leading to the two-step flow found that personal influence
played a more important role in disseminating messages than the media (Katz). The
homogeneity of the opinion in the opinion leader’s primary group indicated the effectiveness of
personal influence. The two cases also indicate why personal influence has a greater impact than
mass media. Katz claims that personal influence is more flexible and trustworthy to the non-
leaders than mass media.
The next concept of the theory concerns the flow of personal influence. The flow of
information moves so effectively from leader to non-leader because of the strong social influence
the leaders have over the non-leaders (Katz, 1957). Thus, the non-leaders are very interested in
what the leaders have to say. The opinion leaders also disseminate information rapidly because
they are gregarious (Katz). They communicate with those in their primary group as well as
others outside the group (Katz).
The final concept concerns opinion leaders and mass media. Opinion leaders are more
exposed to mass media than those whom they influence (Katz, 1957). Katz found that fashion
and political leaders are more affected by mass media than non-leaders in their decision-making.
The leaders rely more on mass media than interpersonal communication for their own decision-
14
making. According to Katz, leaders use media that is appropriate to their area of knowledge.
Thus, leaders in different subject areas rely on different forms of media to gather information.
For example, fashion leaders gather information about new styles and trends from appropriate
media such as television shows devoted to fashion, and more importantly for this study, fashion
magazines and the print ads in these magazines. Political leaders gather information on current
political events from television news programs and news magazines, and also most pertinent to
this study, the print ads in these magazines.
Lazarsfeld, Berelson, and Gaudet (1968) developed the theory in a study conducted on
the presidential campaign of 1940. The researchers polled citizens of Erie County, Ohio during
the 1940 presidential election to discover how the people decided their vote (Lazarsfeld et al.).
The study uncovered that interpersonal communication was the most common form of exposure
to the campaign (Lazarsfeld et al.). Researchers identified people who were most interested in
the campaign, and hence discussed the campaign most frequently among the respondents, as the
“opinion leaders” (Lazarsfeld et al.). While opinion leaders were often asked about the election,
they themselves placed the highest value on information from the formal media (Lazarsfeld et
al.). This led Lazarsfeld, Berelson, and Gaudet to create a model that described the flow of
information in a group. They hypothesized, in their two-step flow of communication concept
that information flowed from radio or print to opinion leaders and then to less active members of
the population (Lazarsfeld et al.) (See Figure 1).
15
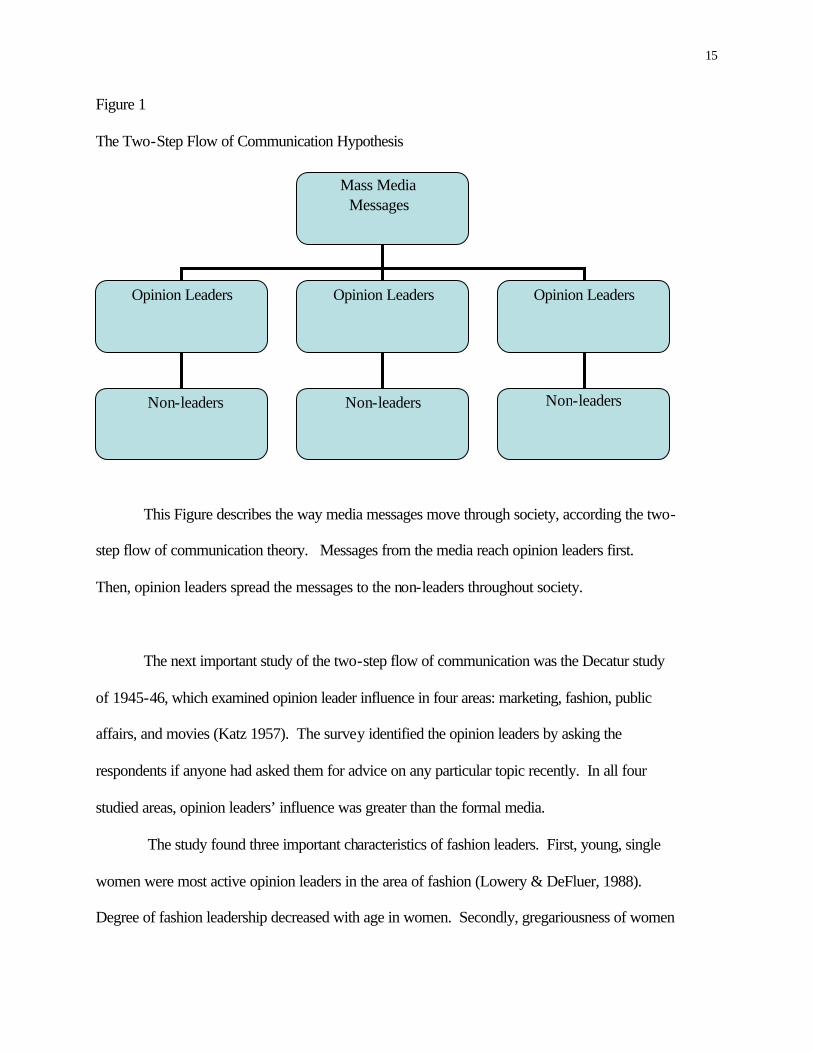
Figure 1 The Two-Step Flow of Communication Hypothesis
This Figure describes the way media messages move through society, according the two-
step flow of communication theory. Messages from the media reach opinion leaders first.
Then, opinion leaders spread the messages to the non-leaders throughout society.
The next important study of the two-step flow of communication was the Decatur study
of 1945-46, which examined opinion leader influence in four areas: marketing, fashion, public
affairs, and movies (Katz 1957). The survey identified the opinion leaders by asking the
respondents if anyone had asked them for advice on any particular topic recently. In all four
studied areas, opinion leaders’ influence was greater than the formal media.
The study found three important characteristics of fashion leaders. First, young, single
women were most active opinion leaders in the area of fashion (Lowery & DeFluer, 1988).
Degree of fashion leadership decreased with age in women. Secondly, gregariousness of women
Mass Media Messages
Opinion Leaders Opinion Leaders Opinion Leaders
Non-leaders
Non-leaders Non-leaders
16
increased fashion opinion leadership. Third, both high and middle class women were equally as
likely to be opinion leaders. The lower class was the only class not very likely to exhibit opinion
leadership.
The findings of the Decatur study concerning the characteristics of political opinion
leaders differed greatly from those of the fashion opinion leaders. Age and marital status, which
were important when discussing fashion opinion leadership, were not very important for political
leaders (Lowery & DeFluer, 1988). However, social status, which was only slightly important
for fashion leaders, was a significant consideration for political opinion leaders (Lowery &
DeFluer). Gregariousness was still a necessary characteristic for a political opinion leader
(Lowery & DeFluer). Gregariousness helps one create social contacts in the community, creates
a desire to be active in political organizations and rallies, and exposes the political opinion
leaders to people that he or she can naturally influence.
Objectives
The objectives for this study were to:
1. Compare fashion opinion leadership and political opinion leadership in terms of their
influence on attitude toward a fashion advertisement and attitude toward the product.
2. Examine the influence of attitude toward a fashion advertisement on product attitude.
17
Hypotheses
H1: Political opinion leadership will be positively related to advertisement attitude and product
attitude.
H2: Political opinion leadership will be more significantly related than fashion opinion
leadership to advertisement attitude and product attitude.
H3: Favorable attitude toward the advertisement will be significantly related to favorable attitude
toward the product.
H4: For political opinion leaders, high levels of agreement with the political message in the
advertisement will be significantly related to favorable attitude toward the advertisement.
18
Chapter 4
Methodology
Chapter four explains the methods that were used to collect the data for this research.
First, this chapter describes the development of the web pages, which contained both the fashion
advertisements and the instrument for the study, a five part on-line survey. Next, the creation of
the four fashion advertisements is explained. Finally, a complete description of the survey is
given, and the method of recruiting respondents is explained.
Webpage Development
To collect the data for this study, four webpages were designed by the researcher
(Appendix B). Each webpage included one of four jeans advertisements created by the
researcher, and a link to a five part on-line survey, also designed by the researcher. The webpage
also contained the human subjects consent form for the respondents to review before they
actually took part in the study. Directions for uploading the survey and adjusting the screen, so
respondents could view the advertisement and answer questions 22-33 simultaneously, were on
the webpage as well. The webpage was stored on the University of Georgia’s College of Family
and Consumer Sciences server.
Using a web-based survey had a number of advantages. Placing the survey on the web
saved printing and mailing costs (Dillman, 2000). It also reduced coding errors in the data, since
the electronic survey could code and record the data while the respondent was answering the
19
questions (Zhang, 1999). Another advantage was the design flexibility of a webpage, such as
drop boxes and links (Dillman, 2000; Zhang, 1999). The survey link on the webpage allowed
the student to view the advertisement while he or she answered the survey questions. Also,
professors in a variety of fields, including those not related to topics in this study, were more
willing to allow the researcher to come to their class and pass out a web address than they were
willing to allow the researcher to administer a written survey in their class. Lastly, placing the
advertisement on a webpage made it look more professional than if the ad had been shown as a
transparency during the administration of a written survey.
Jeans Advertisement Development
Four professional-looking jeans advertisements were developed by the researcher
(Appendix C). The advertisements, labeled A-D, contained: A) A pair of female jeans and a
political message, B) A pair of female jeans and a non-political message, C) A pair of male jeans
and a political message, and D) A pair of male jeans and a non-political message.
Jeans are commonly worn by both male and female students at the University of Georgia.
Therefore, jeans were chosen as the fashion product in the advertisement because they would be
very familiar to all students in the sample. A contemporary style of jeans was chosen, but the
jeans did not have trendy features that might distract the respondent. The same brand of jeans
was used for the male and the female advertisements, and therefore looked very similar in style
and color. One female pair of jeans was chosen for the female advertisements, both the
advertisement with the political message and the advertisement with the non-political message,
and one pair was chosen for both of the male advertisements.
20
The topics that were used in the messages for the ads were familiar to the sample as well.
The political message was, “While the President was busy creating a reason for war, we were
busy creating the perfect pair of jeans.” The message was referring to the controversy
surrounding the President’s decision to go to war with Iraq. This topic was chosen because it
was still being discussed among students at the University of Georgia, particularly since it
emerged as an important issue in the 2004 presidential election. This same political message was
viewed by females in advertisement A (which contained female jeans) and by males in
advertisement C (which showed male jeans). The non-political message was, “We have a fit for
every body in America.” This message simply advertises the jeans. It states that the company
makes various styles of jeans that fit the body in different ways. This same non-political
message was viewed by females in advertisement B and males in advertisement D.
Aside from the differences in gender of jeans and message, the advertisements were
made to look identical. The same background, an American flag, was used for all four ads. The
jeans were placed in the exact same position in the advertisement. The message was also in the
same position in the advertisement.
Description of the Survey
The survey link on each of the four webpages uploaded the on-line survey (Appendix D).
The survey was created using the php Easy Survey Package, a free, open source software
package. The administrative aspects of the survey, including access to questions and viewing
results, were password protected and were not accessible from the survey site used by the
respondents. The survey had a total of 39 questions, and it asked for information on five topics:
1) fashion opinion leadership, 2) political opinion leadership, 3) attitude toward the
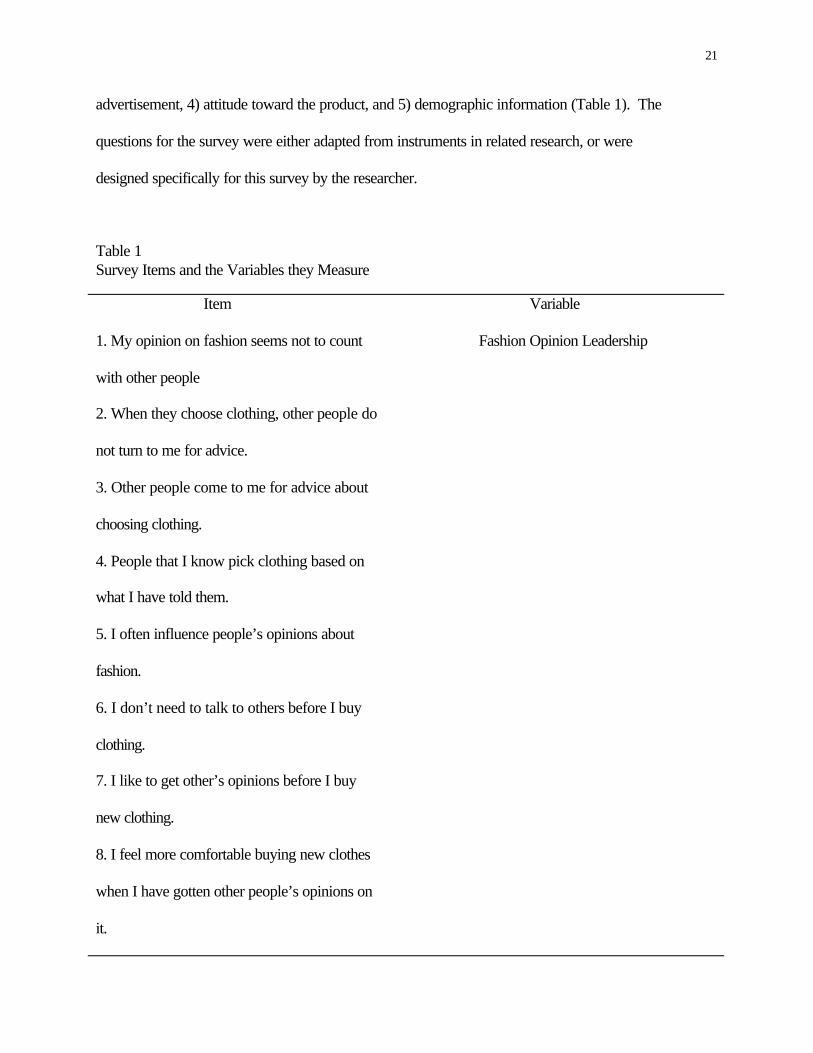
21
advertisement, 4) attitude toward the product, and 5) demographic information (Table 1). The
questions for the survey were either adapted from instruments in related research, or were
designed specifically for this survey by the researcher.
Table 1 Survey Items and the Variables they Measure Item Variable
1. My opinion on fashion seems not to count
with other people
Fashion Opinion Leadership
2. When they choose clothing, other people do
not turn to me for advice.
3. Other people come to me for advice about
choosing clothing.
4. People that I know pick clothing based on
what I have told them.
5. I often influence people’s opinions about
fashion.
6. I don’t need to talk to others before I buy
clothing.
7. I like to get other’s opinions before I buy
new clothing.
8. I feel more comfortable buying new clothes
when I have gotten other people’s opinions on
it.
22
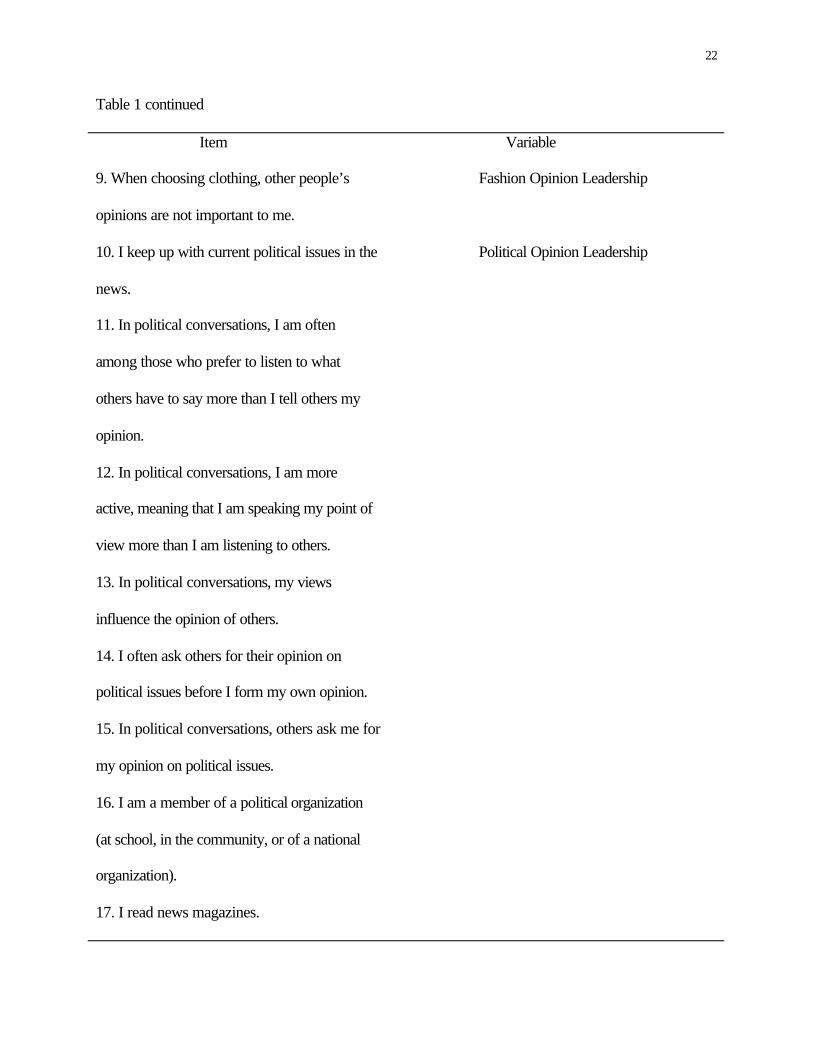
Table 1 continued Item Variable
9. When choosing clothing, other people’s
opinions are not important to me.
Fashion Opinion Leadership
10. I keep up with current political issues in the
news.
Political Opinion Leadership
11. In political conversations, I am often
among those who prefer to listen to what
others have to say more than I tell others my
opinion.
12. In political conversations, I am more
active, meaning that I am speaking my point of
view more than I am listening to others.
13. In political conversations, my views
influence the opinion of others.
14. I often ask others for their opinion on
political issues before I form my own opinion.
15. In political conversations, others ask me for
my opinion on political issues.
16. I am a member of a political organization
(at school, in the community, or of a national
organization).
17. I read news magazines.

23
Table 1continued
Item Variable
18. I watch news shows (Meet the Press,
Hardball, Crossfire, etc.)
Political Opinion Leadership
19. I watch the evening news OR read the
newspaper.
20. I engage in political conversations.
23. This ad is interesting. Advertisement Attitude
24. This ad is effective.
25. This ad is good.
26. I like this ad.
27. The product in this ad is fashionable/
stylish.
Product Attitude
28. The product in this ad is attractive.
29. Overall, I like the product in the ad.
30. I believe the ad is communicating a
political message.
Message Acknowledgement
31. I understand what the political message in
the ad is trying to say.
Understanding of Message
32. I agree with the political message in the ad. Agreement with the Message
33. I have strong feelings about the political
message in the ad.
Strength of Feelings about Message
24
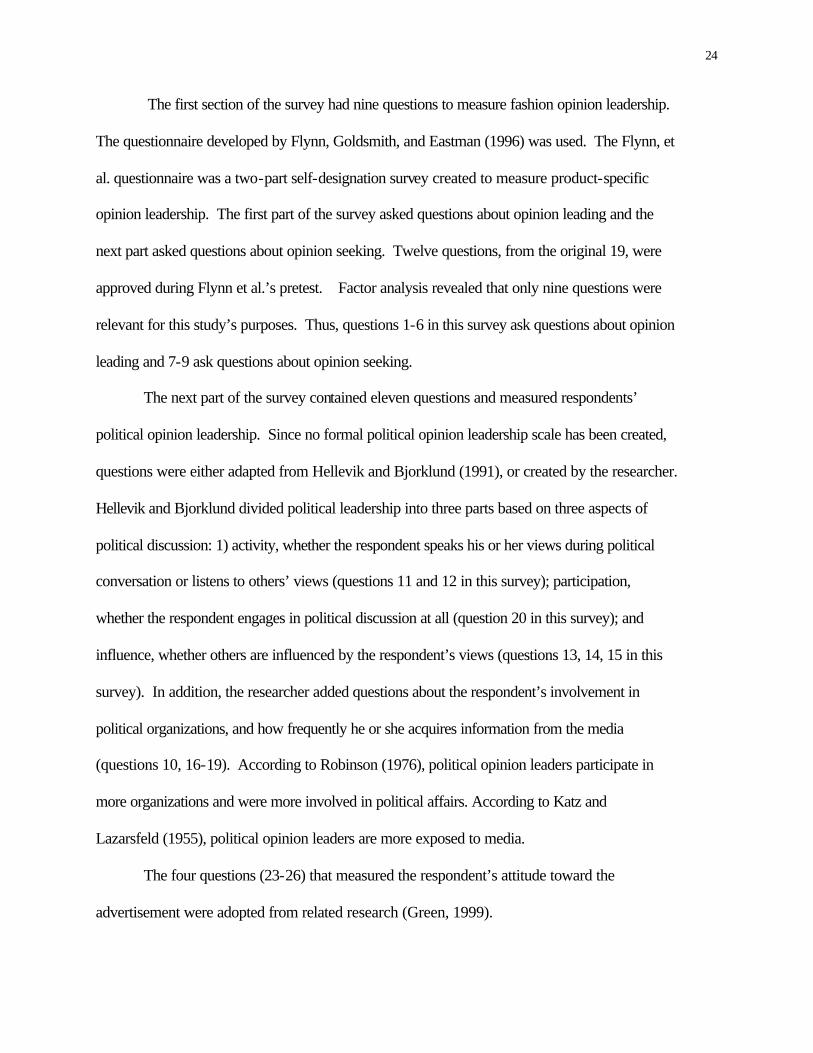
The first section of the survey had nine questions to measure fashion opinion leadership.
The questionnaire developed by Flynn, Goldsmith, and Eastman (1996) was used. The Flynn, et
al. questionnaire was a two-part self-designation survey created to measure product-specific
opinion leadership. The first part of the survey asked questions about opinion leading and the
next part asked questions about opinion seeking. Twelve questions, from the original 19, were
approved during Flynn et al.’s pretest. Factor analysis revealed that only nine questions were
relevant for this study’s purposes. Thus, questions 1-6 in this survey ask questions about opinion
leading and 7-9 ask questions about opinion seeking.
The next part of the survey contained eleven questions and measured respondents’
political opinion leadership. Since no formal political opinion leadership scale has been created,
questions were either adapted from Hellevik and Bjorklund (1991), or created by the researcher.
Hellevik and Bjorklund divided political leadership into three parts based on three aspects of
political discussion: 1) activity, whether the respondent speaks his or her views during political
conversation or listens to others’ views (questions 11 and 12 in this survey); participation,
whether the respondent engages in political discussion at all (question 20 in this survey); and
influence, whether others are influenced by the respondent’s views (questions 13, 14, 15 in this
survey). In addition, the researcher added questions about the respondent’s involvement in
political organizations, and how frequently he or she acquires information from the media
(questions 10, 16-19). According to Robinson (1976), political opinion leaders participate in
more organizations and were more involved in political affairs. According to Katz and
Lazarsfeld (1955), political opinion leaders are more exposed to media.
The four questions (23-26) that measured the respondent’s attitude toward the
advertisement were adopted from related research (Green, 1999).

25
The next three questions (27-29), which measured product attitude, were adapted from previous
studies on respondents’ attitudes toward products in advertisements (DeLong, LaBat, Nelson,
Koh, & Kim 2002; Kim, Damhorst, & Lee, 2002).
Although the majority of the questions in the survey measured variables of the research, a
few questions collected other necessary information from the respondent. For the purpose of
data analysis, question 22 asked the respondent which advertisement he or she was viewing. The
survey asked four questions (30-33) to determine whether the respondent understood and agreed
with the political message. The survey also gathered demographic information, such as the
respondent’s political views (conservative or liberal), age, marital status, children, education,
gender, and household income.
Many of the questions gave a statement and measured the strength of agreement, using a
Likert scale from 1, strongly agree to 7 strongly disagree. However, questions 17-20 asked how
frequently the respondent engaged in various activities. Questions 17 and 18 were coded on a
rating scale from 1, never, to 7, weekly, participating in the activity, and Questions 19 and 20
were coded from1, never, to 7, daily engaging in the activity. Question 21 asked about the
respondent’s political views. The question was coded on a semantic differential scale from 1,
very liberal, to 7, very conservative.
Data Collection
Classes visited were in the fields of Housing and Consumer Economics, Recreation and
Leisure Studies, Psychology, Political Science, Advertising and Public Relations, and Biology to
provide a broad sampling of the University. The classes contained both graduate and
undergraduate students. A total of 10 classes were visited, and the webpage address was given to
26
a total of 1185 students. Each classroom was visited only once; at which time the survey was
introduced to the students and the webpage address was given to them. The researcher gave each
student a blue slip of paper with the following printed on it: 1) the title of the survey, “College
Students’ Opinions of Fashion Ads,” 2) the web address for males, and the web address for
females, 3) the phrase “Your opinion counts!” to motivate the students to participate in the
survey (Appendix E). The students could take the survey at their own convenience. The
webpage was available to the students for five weeks.
27
Chapter 5
Results
This chapter contains the results of the analyses of the research data. First, response rate
and sample characteristics were studied. Next, internal reliability was examined for each
variable using Cronbach’s alpha and relationships among variables were discovered using
Pearson’s Correlation. T-tests were then used to determine if significant gender differences
existed in the variables. Finally, the influence of the independent variables on the dependent
variables was found with multiple regression analyses.
Response rate.
The survey website address was given to a total of 1185 students and 121 responded.
This yielded a relatively low response rate of 10.2%, which was not surprising given the method
used to recruit participants. A total of ten classes were visited, only once, to explain the survey
to the students and give them the survey web address. Thus, there was no repeat contact with
any of the students. Also, no incentive was offered for taking the survey. These 121 student
responses were analyzed for this study.
28
Sample Characteristics
Demographics.
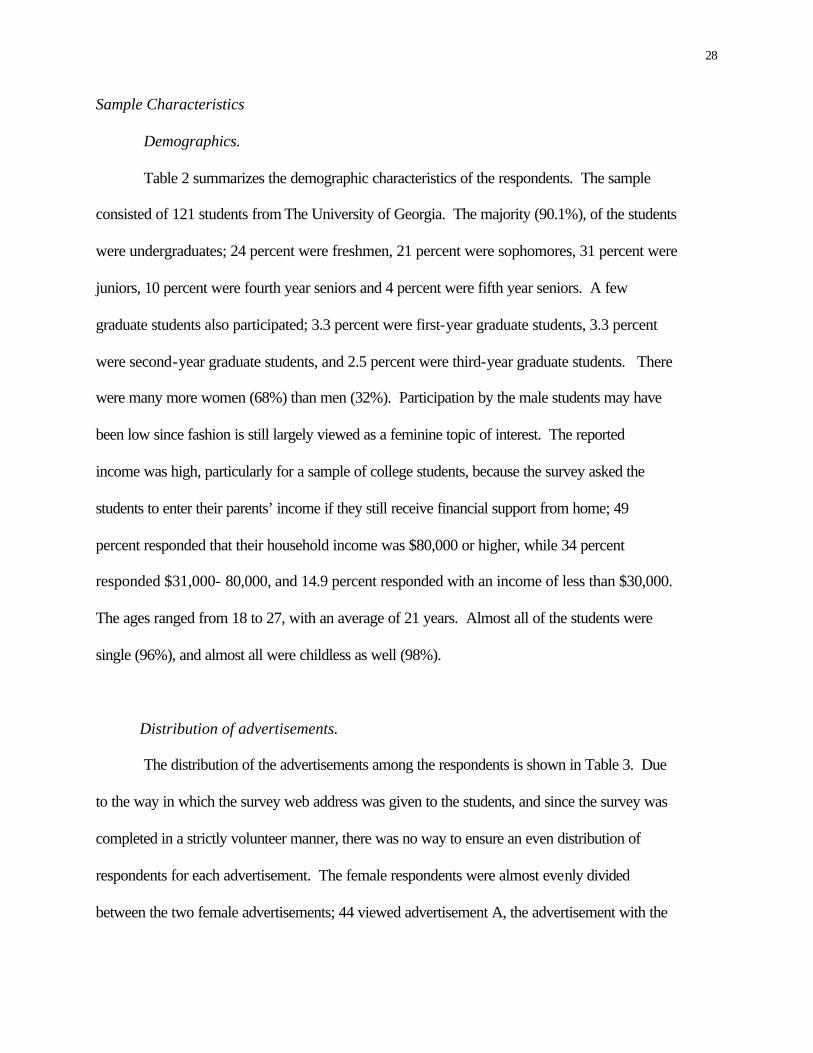
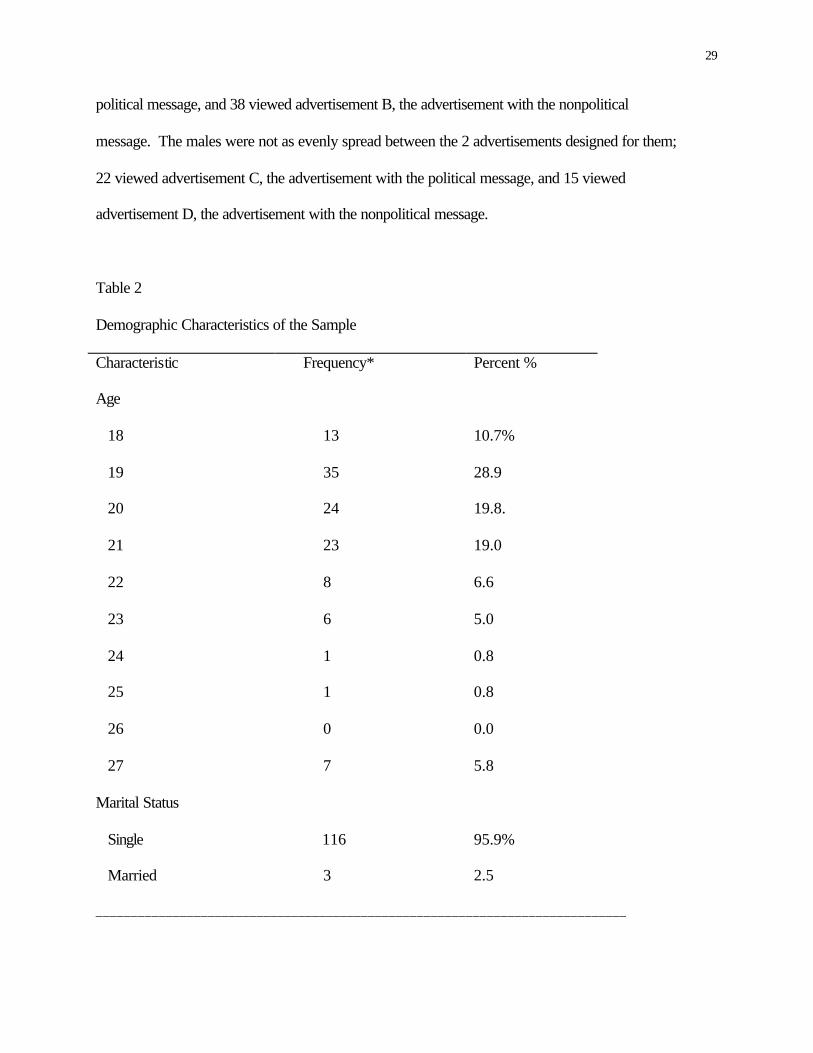
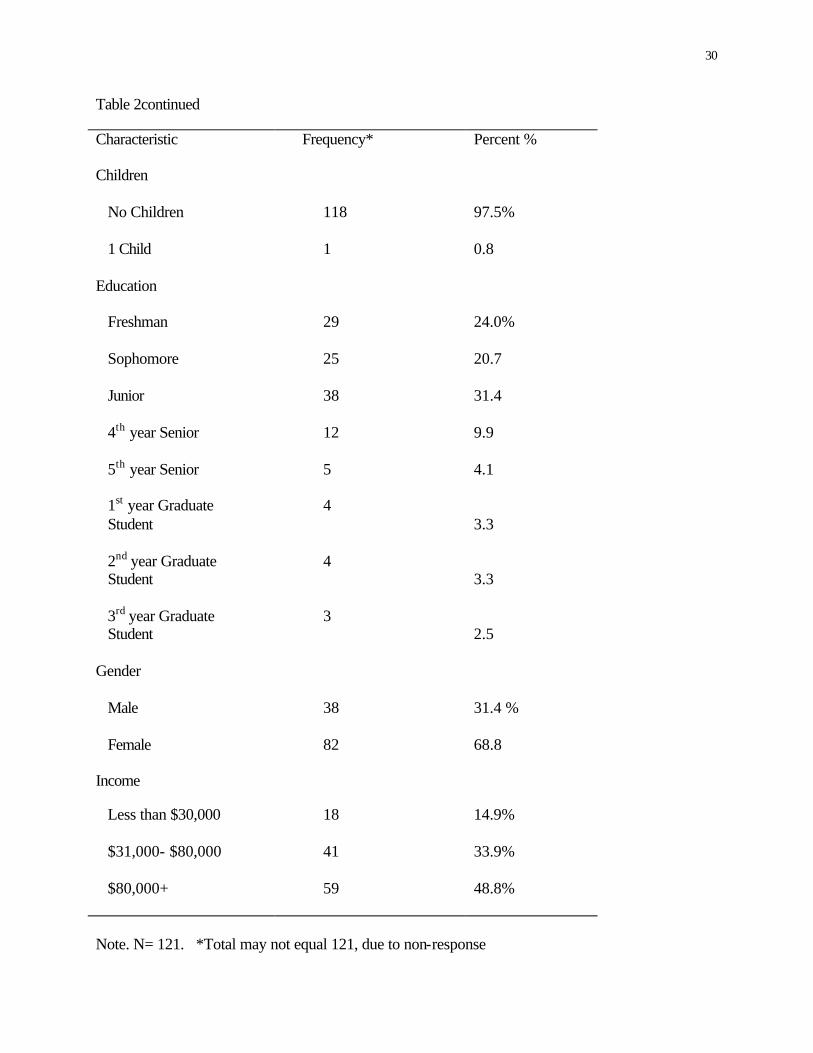
Table 2 summarizes the demographic characteristics of the respondents. The sample
consisted of 121 students from The University of Georgia. The majority (90.1%), of the students
were undergraduates; 24 percent were freshmen, 21 percent were sophomores, 31 percent were
juniors, 10 percent were fourth year seniors and 4 percent were fifth year seniors. A few
graduate students also participated; 3.3 percent were first-year graduate students, 3.3 percent
were second-year graduate students, and 2.5 percent were third-year graduate students. There
were many more women (68%) than men (32%). Participation by the male students may have
been low since fashion is still largely viewed as a feminine topic of interest. The reported
income was high, particularly for a sample of college students, because the survey asked the
students to enter their parents’ income if they still receive financial support from home; 49
percent responded that their household income was $80,000 or higher, while 34 percent
responded $31,000- 80,000, and 14.9 percent responded with an income of less than $30,000.
The ages ranged from 18 to 27, with an average of 21 years. Almost all of the students were
single (96%), and almost all were childless as well (98%).
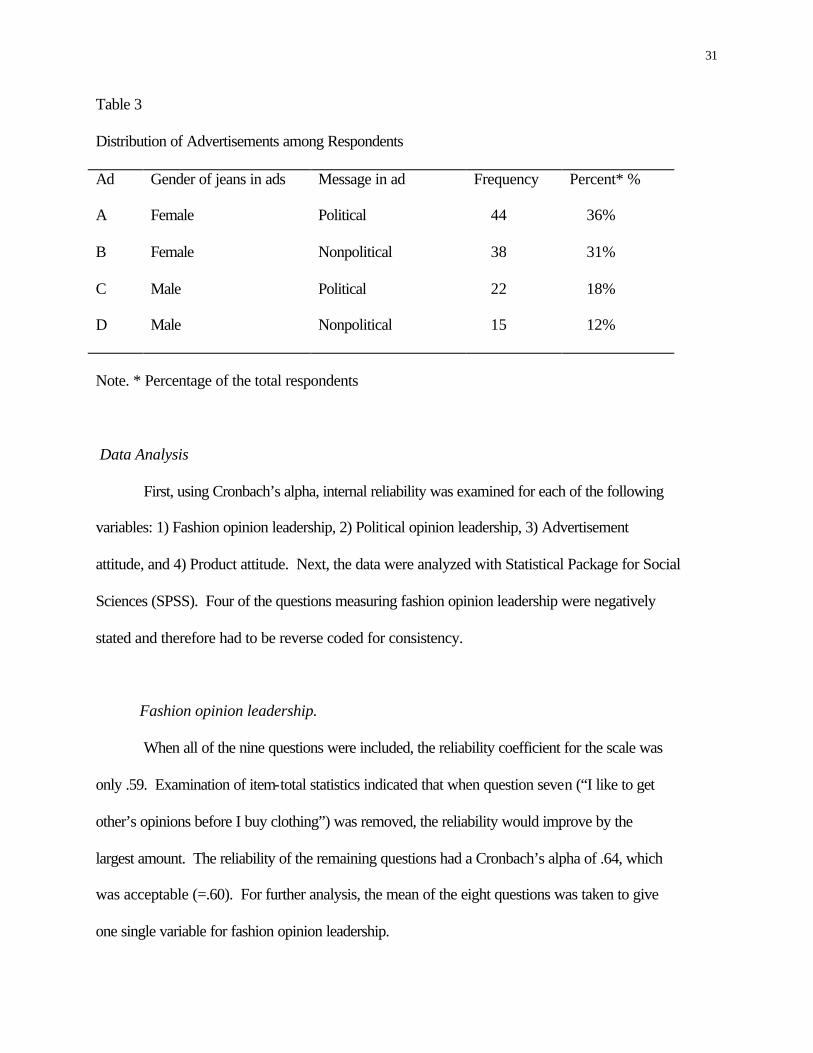
Distribution of advertisements.
The distribution of the advertisements among the respondents is shown in Table 3. Due
to the way in which the survey web address was given to the students, and since the survey was
completed in a strictly volunteer manner, there was no way to ensure an even distribution of
respondents for each advertisement. The female respondents were almost evenly divided
between the two female advertisements; 44 viewed advertisement A, the advertisement with the
29
political message, and 38 viewed advertisement B, the advertisement with the nonpolitical
message. The males were not as evenly spread between the 2 advertisements designed for them;
22 viewed advertisement C, the advertisement with the political message, and 15 viewed
advertisement D, the advertisement with the nonpolitical message.
Table 2
Demographic Characteristics of the Sample Characteristic Frequency* Percent % Age
18 13 10.7%
19 35 28.9
20 24 19.8.
21 23 19.0
22 8 6.6
23 6 5.0
24 1 0.8
25 1 0.8
26 0 0.0
27 7 5.8 Marital Status
Single 116 95.9%
Married 3 2.5 ____________________________________________________________________________
30
Table 2continued Characteristic
Frequency* Percent %
Children
No Children 118 97.5%
1 Child 1 0.8 Education
Freshman 29 24.0%
Sophomore 25 20.7
Junior
38 31.4
4th year Senior
12 9.9
5th year Senior
5 4.1
1st year Graduate Student
4 3.3
2nd year Graduate Student
4 3.3
3rd year Graduate Student
3 2.5
Gender
Male
38 31.4 %
Female
82 68.8
Income
Less than $30,000
18 14.9%
$31,000- $80,000
41 33.9%
$80,000+
59 48.8%
Note. N= 121. *Total may not equal 121, due to non-response
31
Table 3
Distribution of Advertisements among Respondents
Ad Gender of jeans in ads Message in ad Frequency Percent* %
A Female Political 44 36%
B Female Nonpolitical 38 31%
C Male Political 22 18%
D Male Nonpolitical 15 12%
Note. * Percentage of the total respondents
Data Analysis
First, using Cronbach’s alpha, internal reliability was examined for each of the following
variables: 1) Fashion opinion leadership, 2) Political opinion leadership, 3) Advertisement
attitude, and 4) Product attitude. Next, the data were analyzed with Statistical Package for Social
Sciences (SPSS). Four of the questions measuring fashion opinion leadership were negatively
stated and therefore had to be reverse coded for consistency.
Fashion opinion leadership.
When all of the nine questions were included, the reliability coefficient for the scale was
only .59. Examination of item-total statistics indicated that when question seven (“I like to get
other’s opinions before I buy clothing”) was removed, the reliability would improve by the
largest amount. The reliability of the remaining questions had a Cronbach’s alpha of .64, which
was acceptable (=.60). For further analysis, the mean of the eight questions was taken to give
one single variable for fashion opinion leadership.
32
Political opinion leadership.
All 11 questions measuring political opinion leadership were assessed with Cronbach’s
alpha, measuring an acceptable alpha of .80. The mean of these 11 questions was calculated to
give one single variable for political opinion leadership.
Attitude toward the advertisement.
The four questions measuring respondents’ attitudes toward the advertisement had an
alpha of .86. This is also acceptable, and the mean was taken to give one variable for attitude
toward the advertisement.
Product attitude.
The three questions measuring the respondents’ attitudes toward the product in the
advertisement had an acceptable alpha of .84. The mean of these three questions was taken to
yield one variable for product attitude.
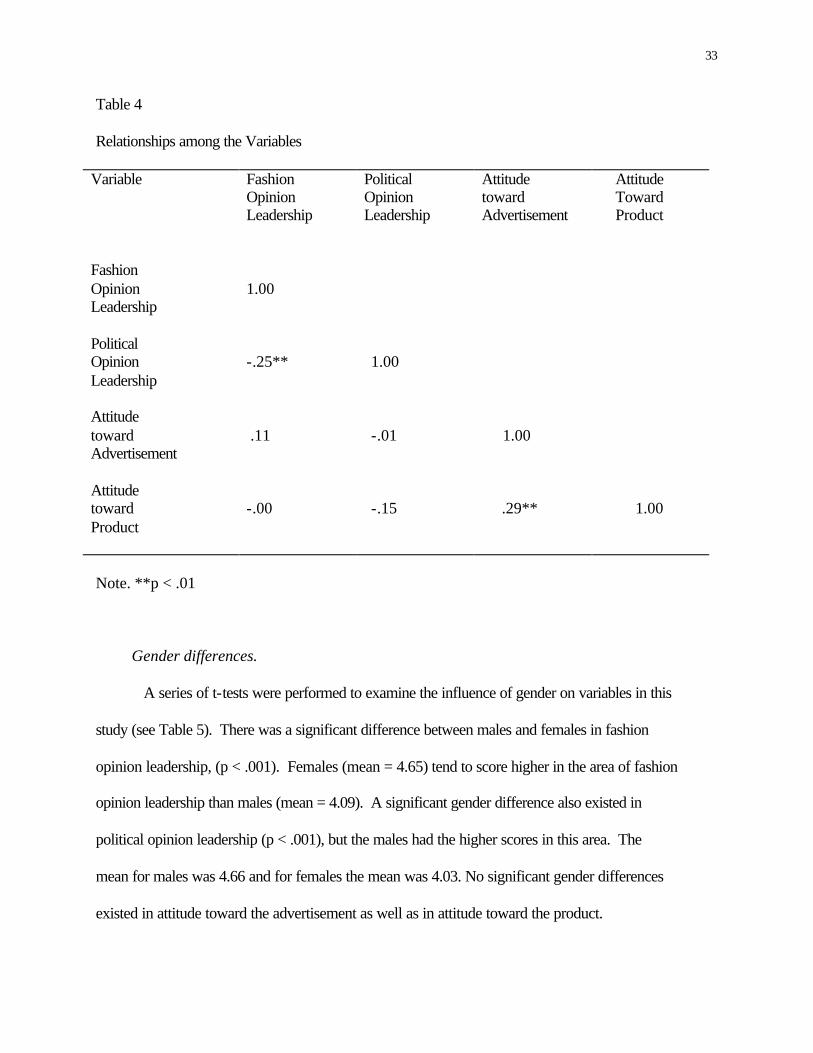
Relationships among variables.
Next, the variables were analyzed using Pearson’s Correlation (see Table 4).
Respondents with stronger fashion opinion leadership tended to have lower political opinion
leadership (r = -.25). Respondents who favorably responded to the advertisement also favorably
responded to the product (r = .29).
33
Table 4
Relationships among the Variables
Variable
Fashion Opinion Leadership
Political Opinion Leadership
Attitude toward Advertisement
Attitude Toward Product
Fashion Opinion Leadership
1.00
Political Opinion Leadership
-.25**
1.00
Attitude toward Advertisement
.11
-.01
1.00
Attitude toward Product
-.00
-.15
.29**
1.00
Note. **p < .01
Gender differences.
A series of t-tests were performed to examine the influence of gender on variables in this
study (see Table 5). There was a significant difference between males and females in fashion
opinion leadership, (p < .001). Females (mean = 4.65) tend to score higher in the area of fashion
opinion leadership than males (mean = 4.09). A significant gender difference also existed in
political opinion leadership (p < .001), but the males had the higher scores in this area. The
mean for males was 4.66 and for females the mean was 4.03. No significant gender differences
existed in attitude toward the advertisement as well as in attitude toward the product.

34
Table 5
Gender Differences among Research Variables (T-tests)
Male (n=38)
Female (n=80)
t-value
Fashion Opinion Leadership Political Opinion Leadership Attitude toward Advertisement Attitude toward Product
4.09 4.66 3.18 4.72
4.65 4.03
3.47
5.16
-3.35*** -3.37*** -0.96 -1.78
Note. *** p < .001
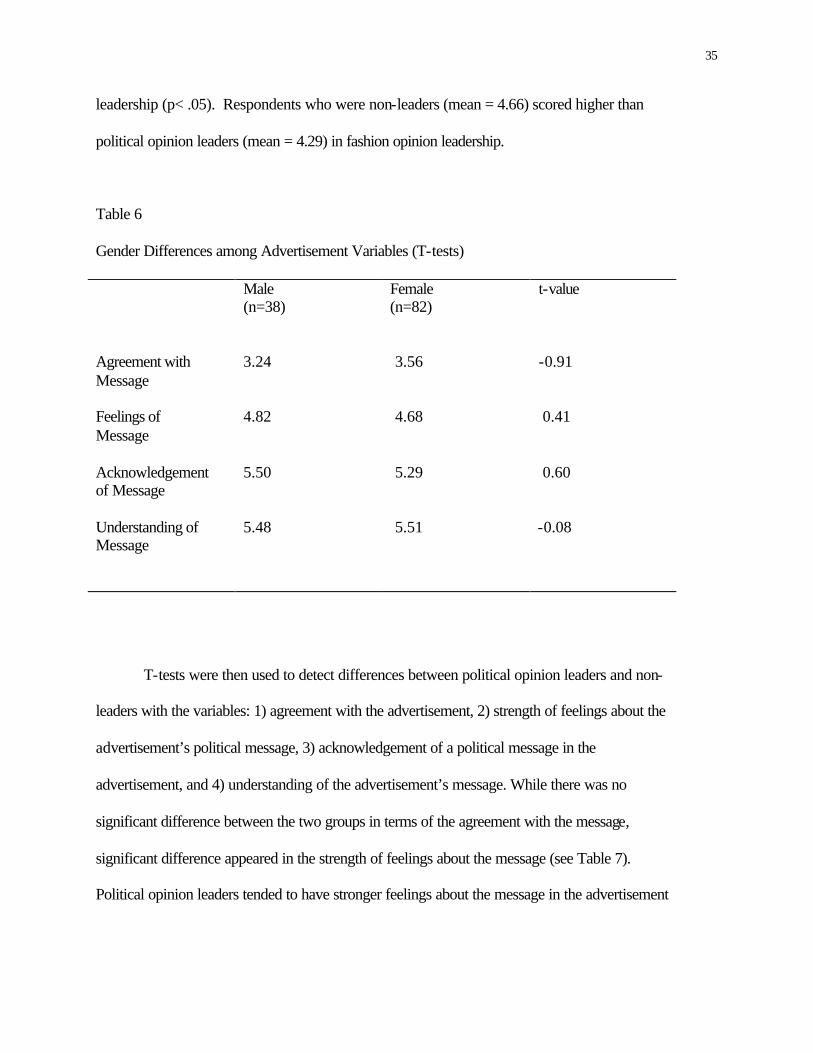
T-tests were also performed to examine the influence of gender on four factors of the
advertisement’s message (Table 6). No significant gender differences were found among
agreement with the message, feelings about the message, acknowledgement of a message, or
understanding of the message in the advertisement.
Differences between political opinion leaders and non-leaders.
Using the median split method, the respondents were divided into two subgroups
according to their political opinion leadership scores. Those who scored higher than the median
were classified as political opinion leaders and those who scored lower than the median were
classified as non-leaders. T-tests were conducted to determine differences between political
opinion leaders and non-leaders with variables in this study (see Table 7). A significant
difference was found between political leaders and non-leaders in the area of fashion opinion
35
leadership (p< .05). Respondents who were non-leaders (mean = 4.66) scored higher than
political opinion leaders (mean = 4.29) in fashion opinion leadership.
Table 6
Gender Differences among Advertisement Variables (T-tests)
Male (n=38)
Female (n=82)
t-value
Agreement with Message Feelings of Message Acknowledgement of Message Understanding of Message
3.24 4.82 5.50 5.48
3.56 4.68
5.29
5.51
-0.91 0.41 0.60 -0.08
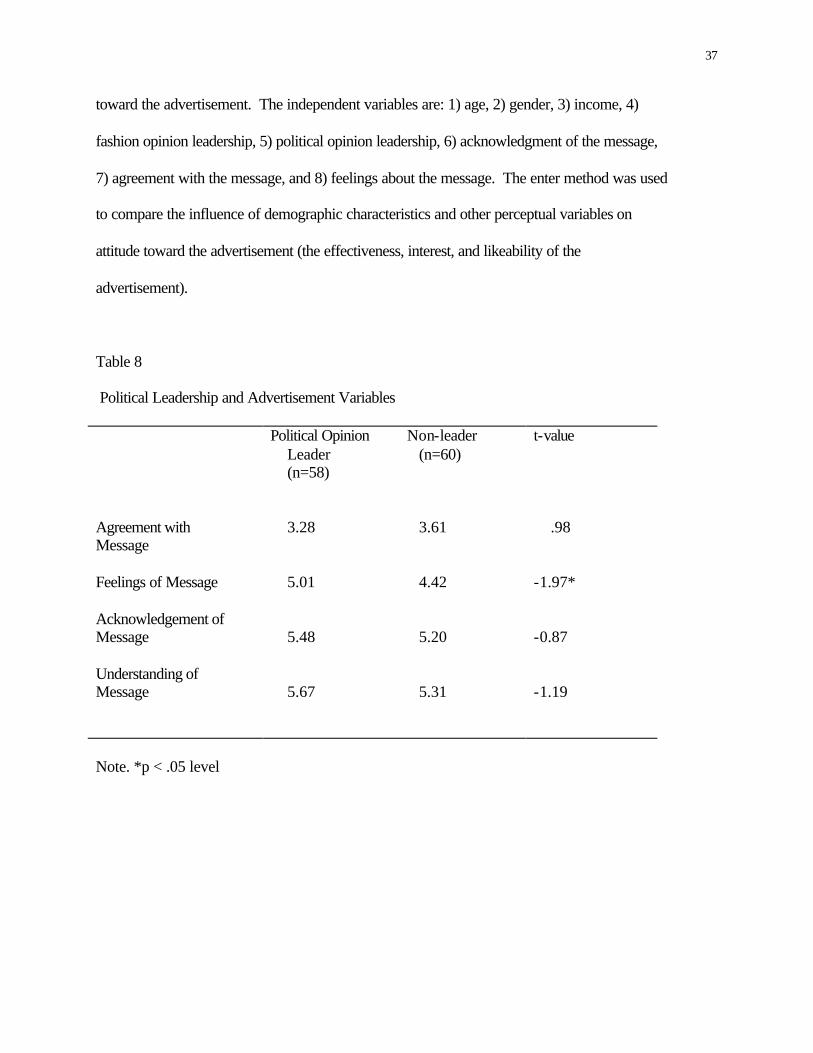
T-tests were then used to detect differences between political opinion leaders and non-
leaders with the variables: 1) agreement with the advertisement, 2) strength of feelings about the
advertisement’s political message, 3) acknowledgement of a political message in the
advertisement, and 4) understanding of the advertisement’s message. While there was no
significant difference between the two groups in terms of the agreement with the message,
significant difference appeared in the strength of feelings about the message (see Table 7).
Political opinion leaders tended to have stronger feelings about the message in the advertisement
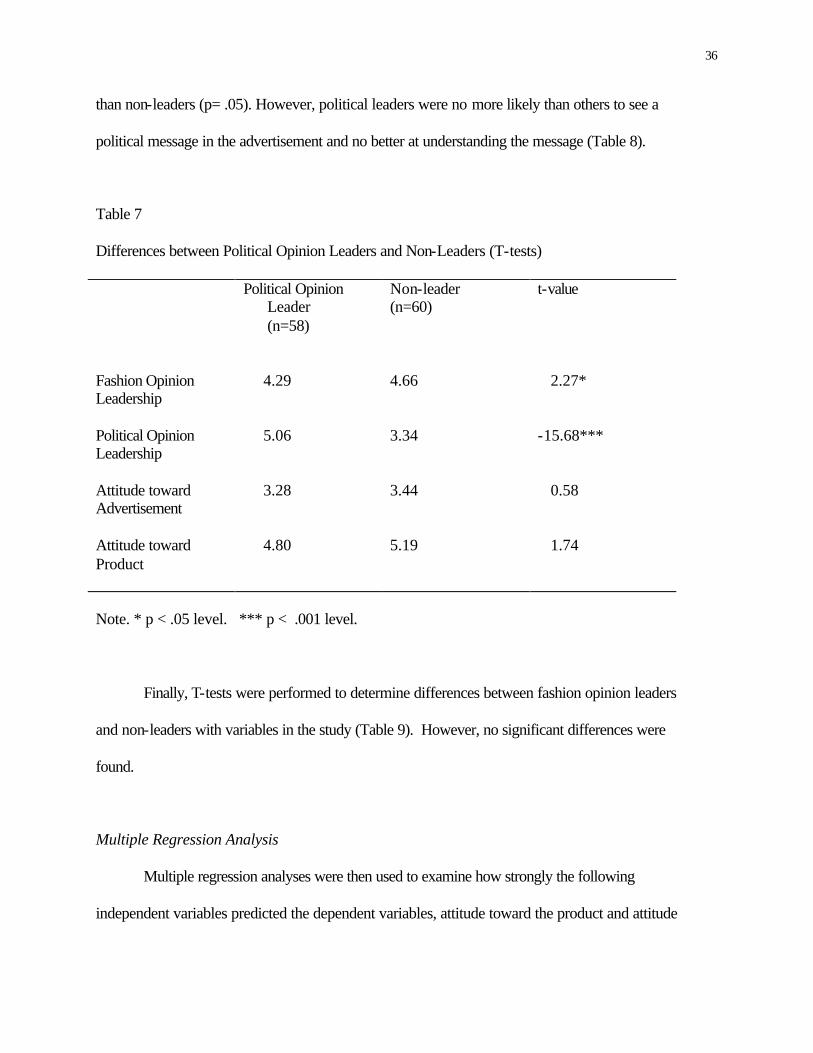
36
than non-leaders (p= .05). However, political leaders were no more likely than others to see a
political message in the advertisement and no better at understanding the message (Table 8).
Table 7
Differences between Political Opinion Leaders and Non-Leaders (T-tests)
Political Opinion Leader (n=58)
Non-leader (n=60)
t-value
Fashion Opinion Leadership Political Opinion Leadership Attitude toward Advertisement Attitude toward Product
4.29
5.06
3.28
4.80
4.66 3.34 3.44 5.19
2.27* -15.68***
0.58
1.74
Note. * p < .05 level. *** p < .001 level.
Finally, T-tests were performed to determine differences between fashion opinion leaders
and non-leaders with variables in the study (Table 9). However, no significant differences were
found.
Multiple Regression Analysis
Multiple regression analyses were then used to examine how strongly the following
independent variables predicted the dependent variables, attitude toward the product and attitude
37
toward the advertisement. The independent variables are: 1) age, 2) gender, 3) income, 4)
fashion opinion leadership, 5) political opinion leadership, 6) acknowledgment of the message,
7) agreement with the message, and 8) feelings about the message. The enter method was used
to compare the influence of demographic characteristics and other perceptual variables on
attitude toward the advertisement (the effectiveness, interest, and likeability of the
advertisement).
Table 8
Political Leadership and Advertisement Variables
Political Opinion Leader (n=58)
Non-leader (n=60)
t-value
Agreement with Message Feelings of Message Acknowledgement of Message Understanding of Message
3.28
5.01
5.48
5.67
3.61
4.42
5.20
5.31
.98 -1.97* -0.87 -1.19
Note. *p < .05 level
38
Table 9
Differences between Fashion Opinion Leaders and Non-Leaders (T-tests)
Fashion Opinion Leader (n=52)
Non-leader (n=67)
t-value
Fashion Opinion Leadership Political Opinion Leadership Attitude toward Advertisement Attitude toward Product
5.25
4.09
3.60
5.10
3.81 4.35
3.19
4.97
-12.49***
1.38 -1.47
-.42
Note. *** p < .001
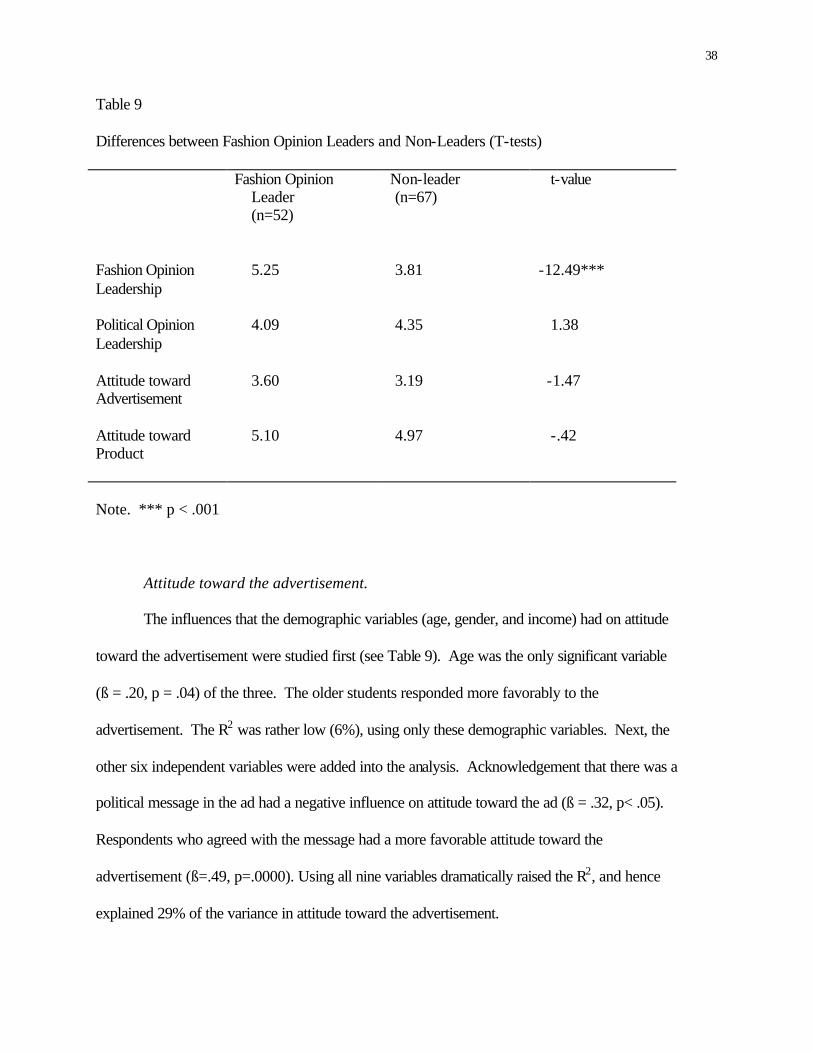
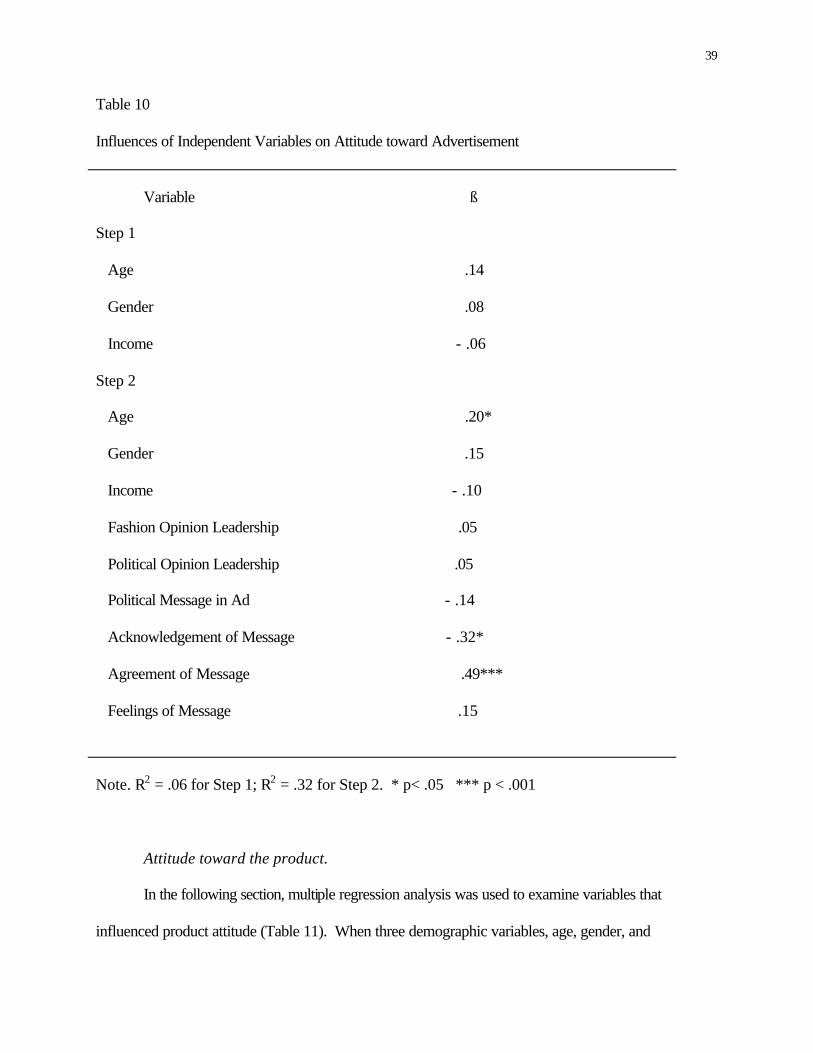
Attitude toward the advertisement.
The influences that the demographic variables (age, gender, and income) had on attitude
toward the advertisement were studied first (see Table 9). Age was the only significant variable
(ß = .20, p = .04) of the three. The older students responded more favorably to the
advertisement. The R2 was rather low (6%), using only these demographic variables. Next, the
other six independent variables were added into the analysis. Acknowledgement that there was a
political message in the ad had a negative influence on attitude toward the ad (ß = .32, p< .05).
Respondents who agreed with the message had a more favorable attitude toward the
advertisement (ß=.49, p=.0000). Using all nine variables dramatically raised the R2, and hence
explained 29% of the variance in attitude toward the advertisement.
39
Table 10
Influences of Independent Variables on Attitude toward Advertisement
Variable ß Step 1
Age .14
Gender .08
Income - .06 Step 2
Age .20* Gender .15
Income - .10
Fashion Opinion Leadership .05
Political Opinion Leadership .05
Political Message in Ad - .14
Acknowledgement of Message - .32*
Agreement of Message .49***
Feelings of Message .15
Note. R2 = .06 for Step 1; R2 = .32 for Step 2. * p< .05 *** p < .001
Attitude toward the product.
In the following section, multiple regression analysis was used to examine variables that
influenced product attitude (Table 11). When three demographic variables, age, gender, and
40
income, were used, age (p= .02), and gender (p= .007) were significant but income was not.
Older students were more likely to think the product was fashionable or stylish, to think the
product was attractive, and to like the product in the ad overall (ß=.22). Females also tended to
like the product more (ß= .26). When the other six variables were added to the analysis, attitude
toward the advertisement was significant (ß= .25, p=.02). Respondents who had a favorable
attitude toward the advertisement also had a favorable attitude toward the product in the
advertisement. Gender was still a significant variable as well (ß=.23, p=.03). Using all nine of
the independent variables together explained much more variance in product attitude (R2 =.18),
than only using three demographic variables (R2 = .10)
Attitude toward the advertisement among political opinion leaders and non-leaders.
Multiple regression analysis was performed in this section to examine, first among
political opinion leaders and then among non-leaders, how strongly attitude toward the
advertisement was predicted by the independent variables age, gender, income, fashion opinion
leadership, political opinion leadership, acknowledgement of a message, agreement with the
message, and feelings about the message.
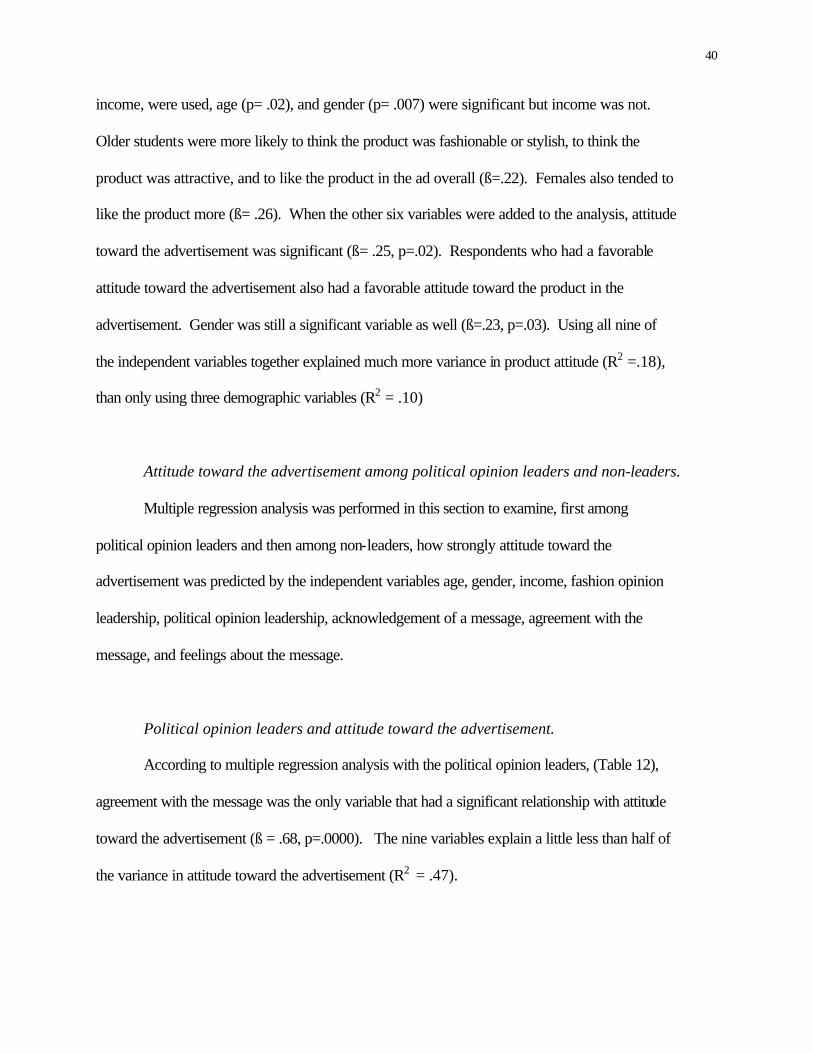
Political opinion leaders and attitude toward the advertisement.
According to multiple regression analysis with the political opinion leaders, (Table 12),
agreement with the message was the only variable that had a significant relationship with attitude
toward the advertisement (ß = .68, p=.0000). The nine variables explain a little less than half of
the variance in attitude toward the advertisement (R2 = .47).

41
Table 11
Influence of Independent Variables on Attitude toward Product Variables ß Step 1
Age .22*
Gender .26**
Income - .07 Step 2
Age .16
Gender .23*
Income -.04
Fashion Opinion Leadership -.12
Political Opinion Leadership -.06
Political Message in Ad .03
Acknowledgement of Message .08
Agreement of Message .05
Feelings of Message .07
Attitude toward the ad .25* Note. R2 = .10 for Step 1; R2 = .18 for Step 2. * p < .05 . ** p < .01
42
Table 12 Influence of Independent Variables on Attitude toward Advertisement among Political Opinion Leaders
Variable ß Age .19 Gender .03 Income - .08 Fashion Opinion Leadership - .02 Political Opinion Leadership - .08 Political Message in Ad - .22 Acknowledgement - .24 Acknowledgement of Message .12 Agreement of Message .68*** Feelings of Message .14 Note. R2 = .47 ***p < .001 .
Non-leaders and attitude toward the advertisement.
Among non-leaders, the variables that influenced attitude toward the advertisement were
acknowledgement of the message and agreement with the message. Acknowledgement of the
message had a significantly negative relationship with attitude toward the advertisement (ß = -
.48, p = .03). Respondents who perceived a political message in the advertisement had a more
43
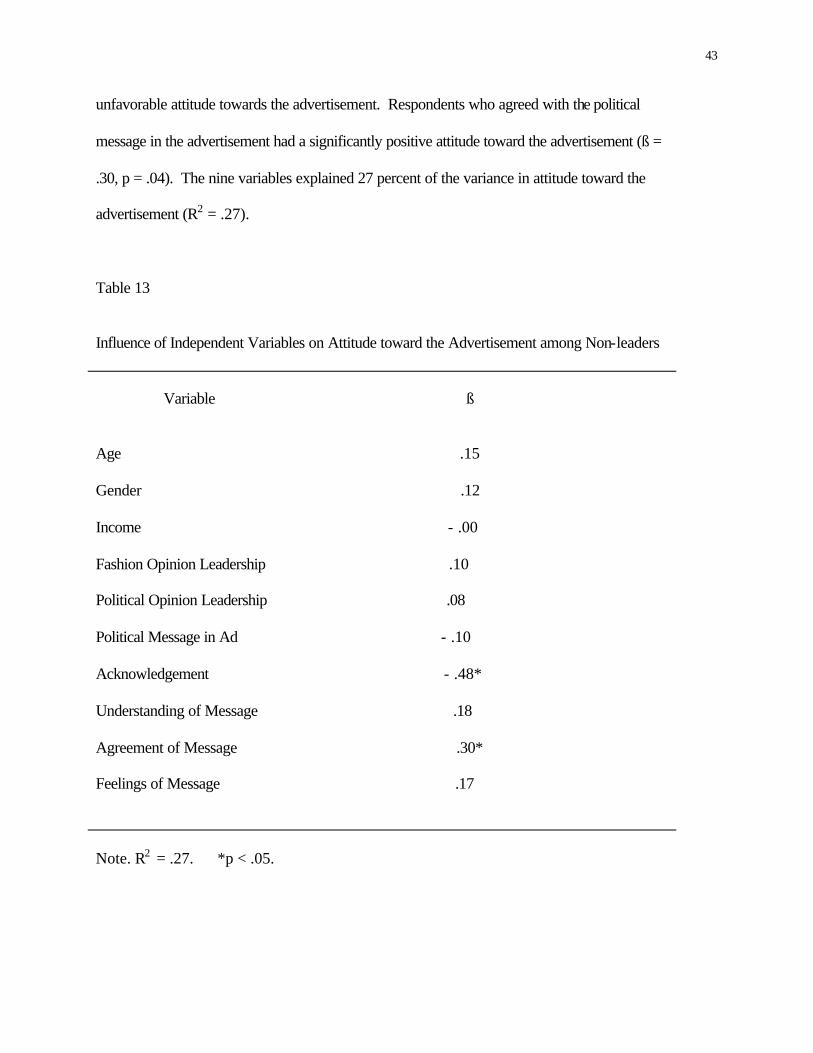
unfavorable attitude towards the advertisement. Respondents who agreed with the political
message in the advertisement had a significantly positive attitude toward the advertisement (ß =
.30, p = .04). The nine variables explained 27 percent of the variance in attitude toward the
advertisement (R2 = .27).
Table 13
Influence of Independent Variables on Attitude toward the Advertisement among Non-leaders
Variable ß Age .15 Gender .12 Income - .00
Fashion Opinion Leadership .10 Political Opinion Leadership .08 Political Message in Ad - .10 Acknowledgement - .48* Understanding of Message .18 Agreement of Message .30* Feelings of Message .17 Note. R2 = .27. *p < .05.
44
Chapter 6
Discussion and Conclusions
This chapter begins by discussing the results of the study in terms or supporting or
refuting the hypotheses. Next, some additional findings of the study are explained. Finally, the
conclusions of the research are given, and the implications for future research are offered.
Hypothesis Tests
H1: Political opinion leadership will be positively related to ad attitude and product
attitude.
The results did not support this hypothesis. Pearson’s correlation found no significant
relationships between political opinion leadership and attitude toward the advertisement or
attitude toward the product. In addition, multiple regression analyses testing the impact of
political opinion leadership on ad attitude and on product attitude had no significant results. In
addition, t-tests indicated that political opinion leaders were no more likely than non-leaders to
think the advertisement was effective, to think the advertisement was interesting, or to like the
advertisement. Political opinion leaders were also no more likely than non-leaders to think the
product was fashionable, to think the product was attractive, or to overall like the product.
Possible explanations for these findings relate to the design of the survey. Since no
established political opinion leadership scale existed, the researcher designed a number of
questions based on findings from previous studies. Questions that ask for more information from
45
the respondent or questions that ask for different information may have given a better measure of
political opinion leadership, and therefore a larger difference between political opinion leaders
and non-leaders. Many of the questions that measured political opinion leadership asked the
respondents how often they used the media to gain information on current political affairs.
These questions may not have been as appropriate for college students as they would be for the
rest of the general population. Many college students are so active with studying, working, and
campus activities that they may not place as much importance as older adults do on keeping up
with current events in the world. In addition, perhaps more questions were needed to measure
product attitude and advertisement attitude. The questions that measured both of these variables
were very broad. More detailed questions or questions that were more specific to this
advertisement may have given a more significant relationship between ad attitude or product
attitude and political opinion leadership.
H2: Political opinion leadership will be more significantly related than fashion opinion
leadership to advertisement attitude and product attitude.
The results of the survey did not support this hypothesis. Multiple regression analyses
revealed that neither political opinion leadership nor fashion opinion leadership significantly
influenced advertisement attitude and product attitude. T-tests also indicated that there was no
significant difference between political leaders and non-leaders in advertisement attitude and
product attitude, nor was there a significant difference between fashion opinion leaders and non-
leaders in the same variables.
Fashion opinion leadership may not have had a significant relationship with the
variables due to the design of the advertisements. The advertisements featured a basic fashion
46
item, a pair of jeans, with no elaborate or trendy features. Fashion opinion leaders are interested
in the current fashions (Summers, 1970). These jeans may not have interested the fashion
opinion leaders enough to show a significant relationship with attitude toward the product and
attitude toward the advertisement. Using jeans might have affected political opinion leaders in
the same way, but to a smaller degree, since they are less interested in fashion (Katz &
Larzasrfeld, 1955). Recruiting only college students for the sample may also have affected the
results of fashion opinion leadership in the study. Fashion opinion leadership is highest among
young, single women who have no children (Katz & Lazarsfeld, 1955). Thus, a college campus
is one of the best places to find fashion opinion leaders. Perhaps there was not a great enough
difference between fashion opinion leaders and non-leaders to see a strong relationship between
the groups and product attitude and advertisement attitude.
A number of possible reasons why political opinion leadership did not have a significant
relationship with product attitude and advertisement attitude were mentioned under hypothesis
one. However, another possible explanation for the lack of a significant relationship between the
variables also concerns the advertisements. The four advertisements in this study were made to
look identical, but using more than one advertisement (with a larger sample) would have created
more variations in ad attitude and product attitude, and possibly would have yielded a different
relationship between these two variables and political opinion leadership.
H3: Favorable attitude toward the advertisement will be significantly related to
favorable attitude toward the product.
The results of the study supported this hypothesis. Multiple regression analysis found
that attitude toward the advertisement was significantly related to attitude toward the product
47
(ß = .25, p =.02). Pearson’s correlation also found that product attitude and advertisement
attitude were significantly correlated (r = .29, p = .01). Therefore, participants who responded
favorably toward the advertisement responded favorably toward the product.
This finding supports previous studies that show attitude toward the advertisement
strongly influences attitude toward the product in the advertisement (Gresham & Shimp, 1985;
Park & Young, 1986; Kim, Damhorst, & Lee, 2002). Kim, Damhorst, and Lee found that
advertisement attitude, along with product attribute beliefs, influenced attitude toward the
product. In their study, consumers’ attitudes toward a T-shirt advertisement influenced their
beliefs about the product and their overall product attitude.
Kim, Damhorst, and Lee (2002) also found that product involvement, through mediating
variables, influenced product attitude for both males and females. These results contradict the
findings of this study to some degree. Fashion opinion leaders typically have high involvement
and interest in fashion (Summers, 1970). Therefore, based on Kim et al.’s findings, it was
reasonable to expect that fashion opinion leadership also would have a strong relationship with
product attitude, but the present study did not find a strong relationship between fashion opinion
leadership and product attitude and advertisement attitude.
H4: For political opinion leaders, high levels of agreement with the political message in
the advertisement will be significantly related to favorable attitude toward the
advertisement.
The findings of the study supported this hypothesis. Multiple regression analysis
indicated that among the political leaders, agreement with the advertisement’s political message
was positively related to attitude towards the advertisement (ß =.68), with very high significance,
48
(p = .0000). Multiple regression analysis using political non-leaders also indicated that
agreement with the political message in the advertisement was positively related (ß =.35), but
with much less significance, (p = .0099).
The finding that the political opinion leaders’ agreement with the message was more
strongly related to attitude toward the advertisement supports previous findings. Political
opinion leaders are more interested in and more influenced by political media messages than
non-leaders (Katz and Larzasrfeld, 1955). Lord, Lee, and Saur (1995) found that response to the
advertisement message, along with peripheral cues, played a significant role in advertisement
attitude formation.
Muehling, Laczniak, and Stoltman (1991) also found that political opinion leadership and
agreement with the message related to toward the advertisement. Under high advertising
message involvement, as political leaders had in viewing advertisements with political messages,
message related cognitive responses were likely to be associated with advertisement attitudes,
perhaps more so than product attitude.
Additional Findings
Gender.
Respondents who were political opinion leaders were more likely to be male (mean =
4.66 for male; mean = 4.03 for females, p<.001). Respondents who were fashion opinion leaders
were more likely to be female (mean =4.65 for females; mean= 4.09 for males, p<.001). This
supports the earlier findings of Katz and Lazarsfeld (1955) concerning political opinion leaders
and fashion leaders. It also supports the long-held stereotypes of men and women; that men are
interested in political affairs, and women are interested in fashion. It is surprising, given the
49
increased opportunities for women since the original research, that young college-aged women
are still not as interested in political affairs as their male peers. Perhaps if the sample had been
older adults, who are typically more interested in political affairs than college-aged adults, the
numbers of men and women political leaders would have been more similar. Fashion opinion
leaders tending to be female indicate that since Katz and Lazarsfeld’s study, men still are not as
interested in fashion as women. This also supports previous findings (Brown and Kaldenberg,
1997; Tigert, Ring, & King, 1976), that women are more involved in fashion and clothing
products than men.
The t-tests to detect gender differences in the results showed that no significant
differences in gender existed in attitude toward the advertisement or in attitude toward the
product. However, the multiple regression analyses showed that gender had a significant
relationship with attitude toward the advertisement, both when three variables were controlled,
gender, income, and age, and when all nine variables were controlled. Females tended to have a
more favorable attitude toward the product (ß = .26, p = .007 with three variables; ß = .23, p =
.03 with nine variables) when everything else remained equal. These results support the studies
of Brown and Kaldenberg (1997) and Tigert et al. (1976).
Political opinion leaders.
Political opinion leaders were no more likely than non-leaders to acknowledge a political
message in the advertisement or to understand the message. Robinson (1976) found that opinion
leaders were more exposed to print media than non-leaders, and that the more active the political
opinion leader, the more exposed he or she was to political information from all sources. Perhaps
if the advertisement’s message had been more subtle, political opinion leaders would have been
50
more likely than non-leaders to acknowledge it, having been more exposed to the subject of the
message. This greater exposure to media could also have helped the political opinion leader be
more likely than non-leaders to understand the message, if the message had been more subtle or
had addressed a more obscure topic. Political opinion leaders did have stronger feelings about
the message (ß = 5.01, p < .05), however. This finding supports Hellevik and Bjorklund’s (1991)
findings that political opinion leaders have more extreme views about political issues than non-
leaders.
Pearson’s correlation found that respondents with stronger political opinion leadership
tended to have lower fashion opinion leadership (r = -.25, p < .01). This supports the findings of
Katz and Lazarsfeld (1955) that opinion leaders tend to be leaders in only one particular area.
Katz and Lazarsfeld surveyed 704 women and found that only 2.4 percent were both fashion
opinion leaders and political opinion leaders.
Response rate.
The response rate was rather low, 10.2 percent, mainly due to the fact that there was no
repeat contact with the students. Crawford, Couper, and Lamias (2001) found that a single email
reminder doubled the amount of respondents in a web-based survey. Another reason for the low
rate of response could be that no incentive was offered, although current literature on web-based
surveys is divided on this topic. Couper (2000) found that offering an incentive had a positive
effect on response rate, while, an incentive had no effect on the findings of Cook, Heath, and
Thompson (2000).
51
Study limitations.
A few of the limitations in this study concerned the sample. The sample was limited to
students at The University of Georgia. Also, the sample was small, consisting of only 121
respondents. Finally, the sample was unbalanced in regards to both gender and age. The
majority of the respondents were females between the ages of 19-21. Other limitations involved
the fashion advertisement. Jeans were the only product in the advertisement. Also, the
advertisement only featured one political message, and thus only addressed one political issue.
Conclusions
The purpose of this study was to 1) compare political opinion leaders and fashion opinion
leaders in terms of attitude toward the advertisement and attitude toward the product 2) examine
the relationship between attitude toward the advertisement and attitude toward the product and 3)
study the influence of political opinion leadership on the relationship between attitude toward the
advertisement and attitude toward the product. The review of literature indicated that political
opinion leaders, being more interested in political affairs than non-leaders, would relate strongly
to the fashion advertisement, and that political opinion leadership would be positively related to
attitude toward the advertisement and attitude toward the product. The literature also suggested
that this relationship would be stronger than that of the fashion opinion leaders, who are mainly
interested in fashion. Although the research did not support these two hypotheses, marketers
should still pay close attention to the messages in their advertising.
Several results from this study can be applied to the advertising of apparel. This study
found a strong relationship between agreement with the message and favorable attitude toward
the advertisement. Also, attitude toward the advertisement was significantly related to attitude
52
toward the product. Thus, if consumers agree with the political message that a marketer puts in a
fashion advertisement, then the consumers will have a more favorable attitude toward the
advertisement, and indirectly, perhaps to the product.
The political opinion leaders had an especially strong relationship between attitude
toward the advertisement and attitude towards the product. This information is valuable to
marketers looking for a fast and efficient way to spread news about their product throughout
society. If marketers create a message that a political opinion leader likes, then he or she will
have a favorable attitude toward the advertisement, and he or she will share the favorable attitude
with friends and family. Conversely, if the political opinion leader does not like the message, he
or she will spread an unfavorable attitude. These findings indicate that marketers should study
the general political preferences of the consumers he is targeting. For example, if a marketer
wanted target young people in California, he would want to use a more liberal message in his
advertisement to gain favor with the political opinion leaders there.
Suggestion for Future Research
Future research on this topic would aim to reveal stronger relationships between the
variables. A sample consisting of more diverse age groups, and even including young people
who are not students at the University of Georgia, would give a better representation of the
general population. A larger sample size may show a stronger division between the political
opinion leaders and non-leaders. This could result in a stronger relationship between political
opinion leadership and attitude toward the advertisement and product attitude.
Changing the survey to include a number of various fashion advertisements, each with a
different political message, would better measure the effect of the message on respondents’
53
attitudes toward the advertisement and attitude toward the product. Also, placing different
products in the advertisement may show a stronger relationship between fashion opinion
leadership and advertisement attitude and product attitude. Items in the fashion advertisement
could range from classic to trendy in style, and could range in price, from moderately priced to
luxury goods. The survey also should include advertisements with different backgrounds, rather
than using only an American flag.
Variables should be added to future studies, such as the respondents’ purchase intentions
after viewing the advertisements. Other areas of opinion leadership could be measured in
respondents as well.
Future studies should emphasize the role of gender in this topic of research. One avenue
of research would be to compare male fashion opinion leaders (or male political opinion leaders)
and female fashion opinion leaders (or political opinion leaders) in terms of attitude toward
advertisement and product attitude.
54
References
Behling, D.U. (1992). Three and a half years of fashion adoption research: What have we
learned? Clothing and Textiles Research Journal, 10(2), 34-41.
Browne, BA., & Kaldenberg, D. O. (1997). Conceptualizing self-monitoring: Links to
materialism and product involvement. Journal of Consumer Marketing, 14(1), 31-44.
Cardona, M. M. (2003). Fashion and apparel. In The Advertising Age Encyclopedia of
Advertising (Vol. 2, pp. 567-571). New York: Fitzroy Dearborn.
Chowdhary, U., & Dickey, L. (1988). Fashion opinion leadership and media exposure among
college women in India. Home Economics Research Journal, 16(3), 183-194.
Cook, C., Heath, F., & Thompson, R. L. (2000). A Meta –analysis of response rates in web- or
internet- based surveys. Educational and Psychological Measurement, 60 (6), 821-836.
Couper, M.P. (2000). Web surveys: A review of issues and approaches. Public Opinion
Quarterly, 64, 464-494.
55
Crawford, S.D., Couper, M.P., & Lamias, M.J. (2001). Web surveys: Perceptions of burden.
Social Science Computer Review, 19(2), 146-162.
Darden, W.R., & Reynolds, F. D. (1972). Predicting opinion leadership for men’s apparel
fashions. Journal of Marketing Research, 9, 324-328.
DeLong, M., LaBat, K., Nelson, N., Koh, A., & Kim, Y. (2002). Global products, global
markets: Jeans in Korea and the United States. Clothing and Textiles Research Journal,
20(4), 238-245.
Dillman, D.A. (2000). Mail and Internet Surveys. New York: Wiley.
Elder, L., & Greene, S. (2003). Political information, gender and the vote: The differential
impact of organizations, personal discussion, and the media on the electoral decisions of
women and men. The Social Science Journal, 40, 385-399.
Flynn, L.R., Goldsmith, R.E., & Eastman, J. K. (1996). Opinion leaders and opinion seekers:
Two new measurement scales. Journal of the Academy of Marketing Science, 24(2), 137-
147.
Green C.L., (1999). Ethnic evaluations of advertising: Interaction effects of strength of ethnic
identification, media, placement, and degree of racial composition. Journal of Advertising,
28(1), 49-64.
56
Gresham, L.G., & Shimp, T.A. (1985). Attitude-toward-the-advertisement and brand attitudes:
A classical conditioning perspective. Journal of Advertising, 14(1), 10-17.
Hellevik, O., & Bjorklund, T. (1991). Opinion leadership and political extremism.
International Journal of Public Opinion Research, 3(2), 157-181.
Huckfeldt, R., & Sprague, J. (1995). Citizens, politics, and social communications: Information
and influence in an election campaign. Cambridge: Cambridge University Press.
Katz, E. (1957). The two-step flow of communication: An up-to date report of an hypothesis.
Public Opinion Quarterly, 21(1), 61-78.
Katz, E., & Lazarsfeld, P. F. (1955). Personal influence: The part played by people in the flow
of mass communication. New York: The Free Press.
Kim, H., Damhorst, M. L., & Lee, K. (2002). Apparel involvement and advertisement
processing: a model. Journal of Fashion Marketing and Management, 6,(3), 277-302.
Kim, Y., Park, J., & Kim, Y. (2001). Impact of social advertising claims on consumer response:
Implications for apparel companies. Journal of Family and Consumer Sciences, 93(5), 41-
45.
57
Laczniak, R., Kempf, D.S., & Muehling, D.D. (1999) Advertising message involvement: The
role of enduring and situational factors. Journal of Current Issues in Advertising, 21(1), 51-
61.
Lazarsfeld, P. F., Berelson, B., & Gaudet, H. (1968). The people’s choice; How the voter makes
up his mind in a presidential campaign (3rd ed.) New York: Columbia University Press.
Lord, K.R., Lee, M., Sauer, P.L. (1995). The combined influence hypothesis: Central and
peripheral antecedents of attitude toward the ad. Journal of Advertising, 24(1), 73-85.
Lowery, S. A., & DeFleur, M. L. (1988). Milestones in mass communication research (2nd ed.)
White Plains: Longman.
Mendelsohn, M. (1996). The media and interpersonal communications: The priming of issues,
leaders, and party identification. The Journal of Politics, 58(1), 112-125.
Muehling, D.D., Laczniak, R.N., & Stoltman, J.L. (1991). The moderating effects of
advertisement message involvement: A reassessment. Journal of Advertising, 20(2), 29-38.
Murphy, C. (2001, October 8). Need for unity, patriotism, reins in fashion advertisements. San
Jose Mercury News.
58
Park, C.W., & Young, S.M. (1986). Consumer response to television commercials: The impact
of involvement and background music on brand attitude formation. Journal of Marketing
Research, 23(1), 11-24.
Pashupati, K. (2003). Advocacy advertising. In The Advertising Age Encyclopedia of
Advertising (Vol. 1, pp. 16-20). New York: Fitzroy Dearborn.
Polegato, R., & Wall, M. (1980). Information seeking by fashion opinion leaders and followers.
Home Economics Research Journal, 8(5), 327-338.
Robinson, J. P. (1976). Interpersonal influence in election campaigns: Two step-flow
hypotheses. Public Opinion Quarterly, 40(3), 304-319.
Rogers, E.M. (1962). Diffusion of innovations. New York: The Free Press.
Summers, J. O. (1970). The identity of women’s clothing fashion opinion leaders. Journal of
Marketing Research, 7, 178-185.
Taylor, B. (2000, February 18). Sears cites ads in halting Benetton sales. New York Times.
p.C2
Tigert, D.J., Ring, L.R., & King, C.W. (1976). Fashion involvement and buying behavior: a
methodological study. Advances in Consumer Research, 3, 481-4.
59
Tinic, S. A. (1997). United colors and untied meanings: Benetton and the commodification of
social issues. Journal of Communication, 47(3), 3-25.
Wells, William D., & Tigert, D., (1971). Activities, interests, and opinions, Journal of
Advertising Research, 11, 27-36..
Yin, J. (1999). Elite opinion and media diffusion: Exploring environmental attitudes.
Harvard International Journal of Press/Politcs, 4(3), 62-86.
Zhang, Y. (1999). Using information for survey research: A case study. Journal of American
Society for Information Science, 51(1), 57-68.

60
Appendix A
Summary Table
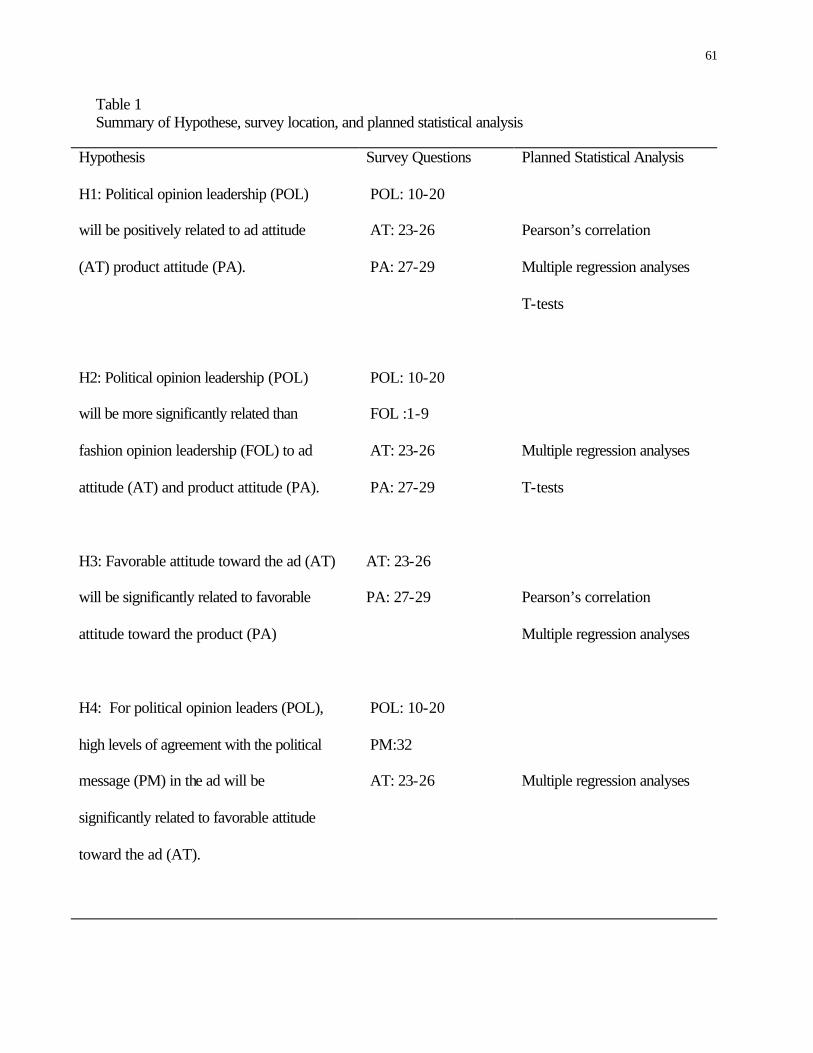
61
Table 1 Summary of Hypothese, survey location, and planned statistical analysis
Hypothesis Survey Questions Planned Statistical Analysis
H1: Political opinion leadership (POL)
will be positively related to ad attitude
(AT) product attitude (PA).
POL: 10-20
AT: 23-26
PA: 27-29
Pearson’s correlation
Multiple regression analyses
T-tests
H2: Political opinion leadership (POL)
will be more significantly related than
fashion opinion leadership (FOL) to ad
attitude (AT) and product attitude (PA).
POL: 10-20
FOL :1-9
AT: 23-26
PA: 27-29
Multiple regression analyses
T-tests
H3: Favorable attitude toward the ad (AT)
will be significantly related to favorable
attitude toward the product (PA)
AT: 23-26
PA: 27-29
Pearson’s correlation
Multiple regression analyses
H4: For political opinion leaders (POL),
high levels of agreement with the political
message (PM) in the ad will be
significantly related to favorable attitude
toward the ad (AT).
POL: 10-20
PM:32
AT: 23-26
Multiple regression analyses

62
Appendix B
WebPages
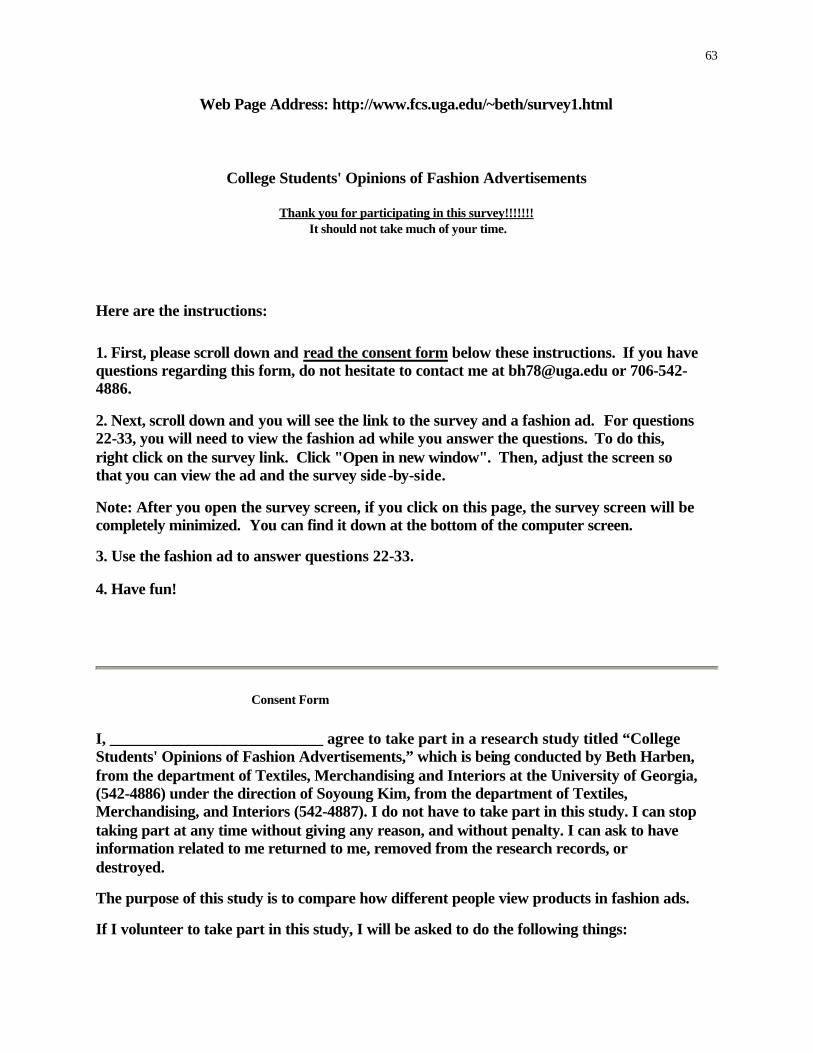
63
Web Page Address: http://www.fcs.uga.edu/~beth/survey1.html
College Students' Opinions of Fashion Advertisements
Thank you for participating in this survey!!!!!!! It should not take much of your time.
Here are the instructions:
1. First, please scroll down and read the consent form below these instructions. If you have questions regarding this form, do not hesitate to contact me at [email protected] or 706-542-4886.
2. Next, scroll down and you will see the link to the survey and a fashion ad. For questions 22-33, you will need to view the fashion ad while you answer the questions. To do this, right click on the survey link. Click "Open in new window". Then, adjust the screen so that you can view the ad and the survey side-by-side.
Note: After you open the survey screen, if you click on this page, the survey screen will be completely minimized. You can find it down at the bottom of the computer screen.
3. Use the fashion ad to answer questions 22-33.
4. Have fun!
Consent Form
I, ___________________________ agree to take part in a research study titled “College Students' Opinions of Fashion Advertisements,” which is being conducted by Beth Harben, from the department of Textiles, Merchandising and Interiors at the University of Georgia, (542-4886) under the direction of Soyoung Kim, from the department of Textiles, Merchandising, and Interiors (542-4887). I do not have to take part in this study. I can stop taking part at any time without giving any reason, and without penalty. I can ask to have information related to me returned to me, removed from the research records, or destroyed.
The purpose of this study is to compare how different people view products in fashion ads.
If I volunteer to take part in this study, I will be asked to do the following things:

64
1) Fill out a questionnaire online that will take approximately 5 minutes. 2) The questionnaire will ask me about conversations I have with others. 3) Then I will be asked to look at a fashion advertisement. 4) I will be asked to give my opinion of the product and the content of the ad. 5) Finally, I will be asked to give demographic information.
No discomforts or stresses are expected from completing the questionnaire or viewing the fashion ad.
No risks are expected from participating in this study.
Any information that is obtained in connection with this study and that can be identified with me will remain confidential and will be disclosed only with my permission or as required by law.
The researcher will answer any further questions about the research, now or during the course of the project, and can be reached at 706-542-4886.
Additional questions or problems regarding your rights as a research participant should be addressed to Chris A. Joseph, Ph.D. Human Subjects Office, University of Georgia, 606A Boyd Graduate Studies Research Center, Athens, Georgia 30602-7411; Telephone (706) 542-3199; E-Mail Address [email protected]
Link for the survey:
http://www.fcs.uga.edu/cs/phpesp/public/survey.php?name=surveyf
Here is the Fashion Ad for Questions 22-33:
Fashion ad letter: A (for question 22)
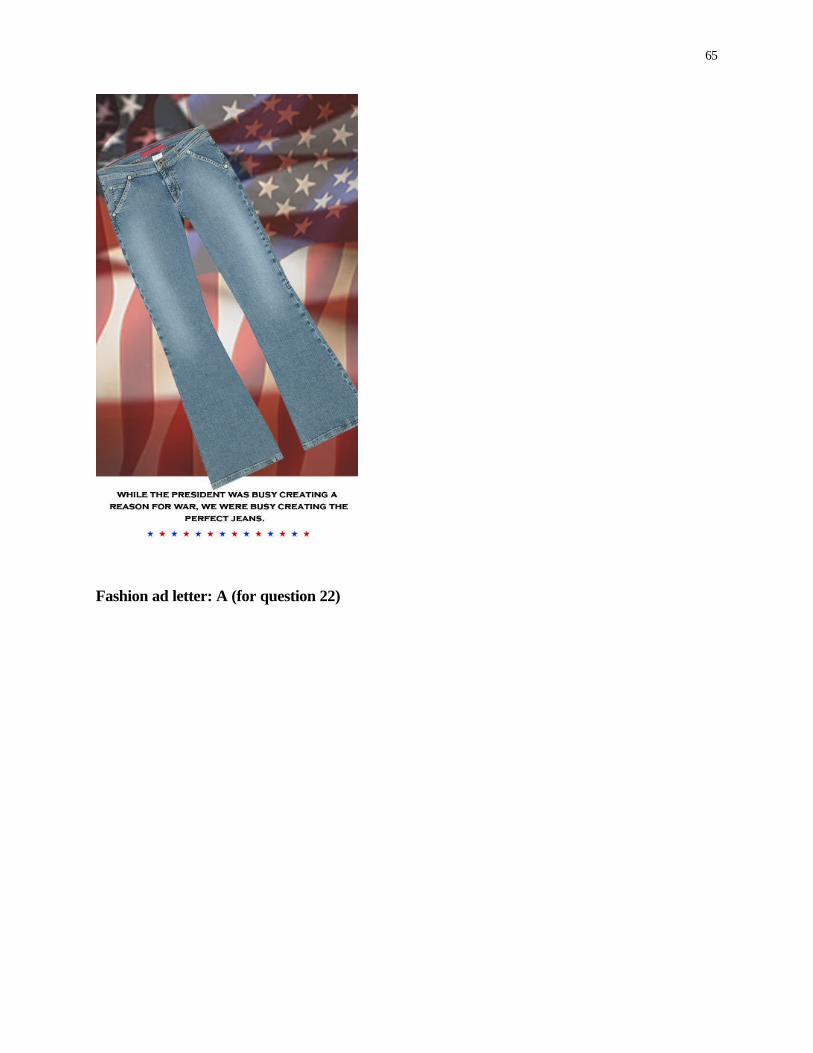
65
Fashion ad letter: A (for question 22)
66
Web Page Address: http://www.fcs.uga.edu/~beth/survey2.html
College Students' Opinions of Fashion Advertisements
Thank you for participating in this survey!!!!!!! It should not take much of your time.
Here are the instructions:
1. First, please scroll down and read the consent form below these instructions. If you have questions regarding this form, do not hesitate to contact me at [email protected] or 706-542-4886.
2. Next, scroll down and you will see the link to the survey and a fashion ad. For questions 22-33, you will need to view the fashion ad while you answer the questions. To do this, right click on the survey link. Click "Open in new window". Then, adjust the screen so that you can view the ad and the survey side-by-side.
Note: After you open the survey screen, if you click on this page, the survey screen will be completely minimized. You can find it down at the bottom of the computer screen.
3. Use the fashion ad to answer questions 22-33.
4. Have fun!
Consent Form
I, ___________________________ agree to take part in a research study titled “College Students' Opinions of Fashion Advertisements,” which is being conducted by Beth Harben, from the department of Textiles, Merchandising and Interiors at the University of Georgia, (542-4886) under the direction of Soyoung Kim, from the department of Textiles, Merchandising, and Interiors (542-4887). I do not have to take part in this study. I can stop taking part at any time without giving any reason, and without penalty. I can ask to have information related to me returned to me, removed from the research records, or destroyed.
The purpose of this study is to compare how different people view products in fashion ads.
If I volunteer to take part in this study, I will be asked to do the following things:
67
1) Fill out a questionnaire online that will take approximately 5 minutes. 2) The questionnaire will ask me about conversations I have with others. 3) Then I will be asked to look at a fashion advertisement. 4) I will be asked to give my opinion of the product and the content of the ad. 5) Finally, I will be asked to give demographic information.
No discomforts or stresses are expected from completing the questionnaire or viewing the fashion ad.
No risks are expected from participating in this study.
Any information that is obtained in connection with this study and that can be identified with me will remain confidential and will be disclosed only with my permission or as required by law.
The researcher will answer any further questions about the research, now or during the course of the project, and can be reached at 706-542-4886.
Additional questions or problems regarding your rights as a research participant should be addressed to Chris A. Joseph, Ph.D. Human Subjects Office, University of Georgia, 606A Boyd Graduate Studies Research Center, Athens, Georgia 30602-7411; Telephone (706) 542-3199; E-Mail Address [email protected]
Link for the survey:
http://www.fcs.uga.edu/cs/phpesp/public/survey.php?name=surveyf
Here is the Fashion Ad for Questions 22-33:
Fashion ad letter: B (for question 22)
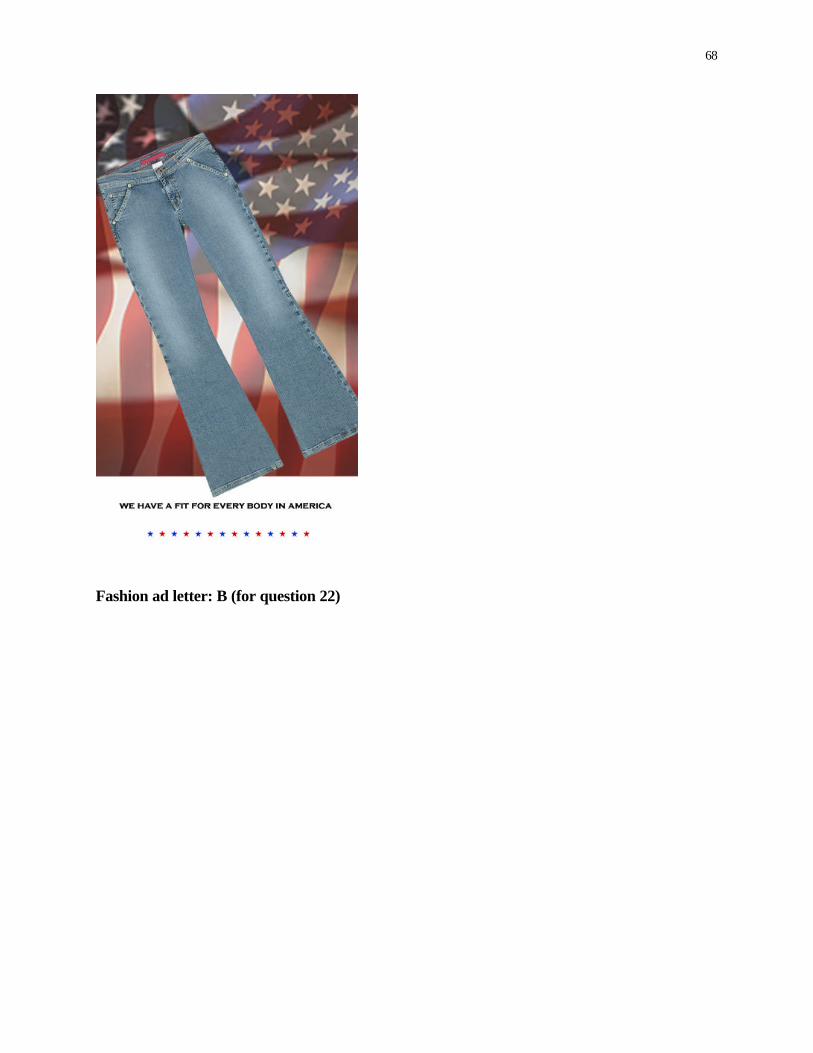
68
Fashion ad letter: B (for question 22)
69
Web Page Address: http://www.fcs.uga.edu/~beth/survey3.html
College Students' Opinions of Fashion Advertisements
Thank you for participating in this survey!!!!!!! It should not take much of your time.
Here are the instructions:
1. First, please scroll down and read the consent form below these instructions. If you have questions regarding this form, do not hesitate to contact me at [email protected] or 706-542-4886.
2. Next, scroll down and you will see the link to the survey and a fashion ad. For questions 22-33, you will need to view the fashion ad while you answer the questions. To do this, right click on the survey link. Click "Open in new window". Then, adjust the screen so that you can view the ad and the survey side-by-side.
Note: After you open the survey screen, if you click on this page, the survey screen will be completely minimized. You can find it down at the bottom of the computer screen.
3. Use the fashion ad to answer questions 22-33.
4. Have fun!
Consent Form
I, ___________________________ agree to take part in a research study titled “College Students' Opinions of Fashion Advertisements,” which is being conducted by Beth Harben, from the department of Textiles, Merchandising and Interiors at the University of Georgia, (542-4886) under the direction of Soyoung Kim, from the department of Textiles, Merchandising, and Interiors (542-4887). I do not have to take part in this study. I can stop taking part at any time without giving any reason, and without penalty. I can ask to have information related to me returned to me, removed from the research records, or destroyed.
The purpose of this study is to compare how different people view products in fashion ads.
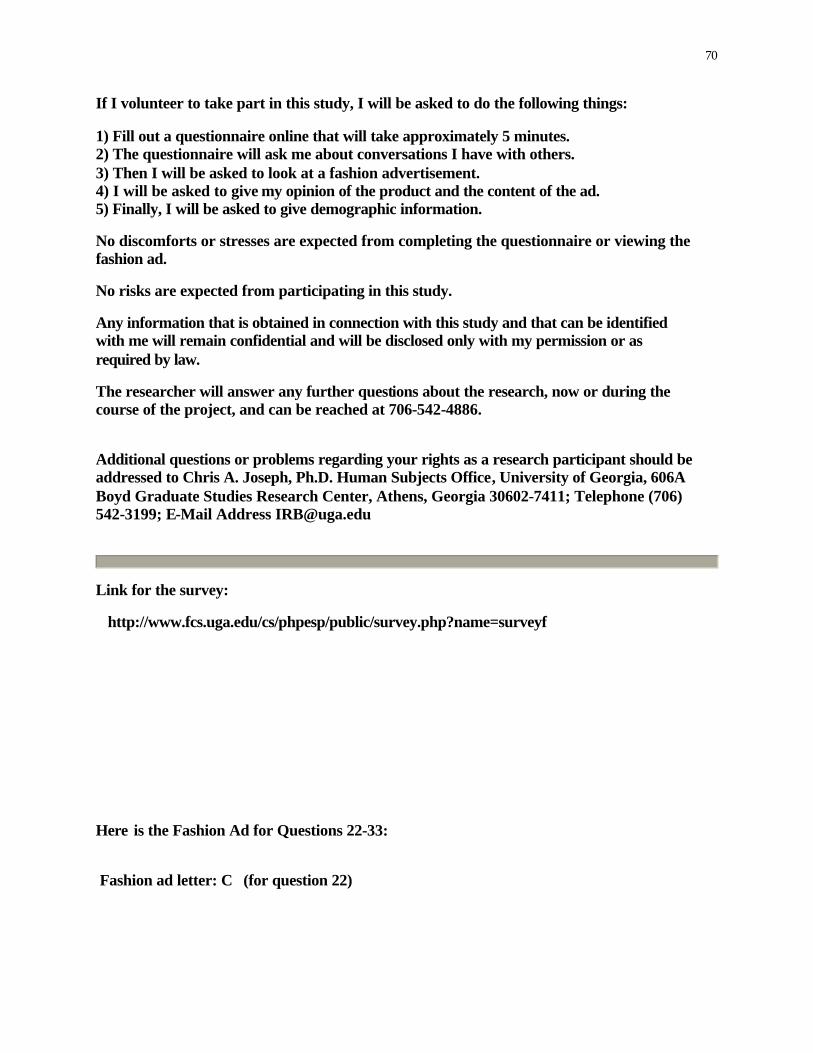
70
If I volunteer to take part in this study, I will be asked to do the following things:
1) Fill out a questionnaire online that will take approximately 5 minutes. 2) The questionnaire will ask me about conversations I have with others. 3) Then I will be asked to look at a fashion advertisement. 4) I will be asked to give my opinion of the product and the content of the ad. 5) Finally, I will be asked to give demographic information.
No discomforts or stresses are expected from completing the questionnaire or viewing the fashion ad.
No risks are expected from participating in this study.
Any information that is obtained in connection with this study and that can be identified with me will remain confidential and will be disclosed only with my permission or as required by law.
The researcher will answer any further questions about the research, now or during the course of the project, and can be reached at 706-542-4886.
Additional questions or problems regarding your rights as a research participant should be addressed to Chris A. Joseph, Ph.D. Human Subjects Office, University of Georgia, 606A Boyd Graduate Studies Research Center, Athens, Georgia 30602-7411; Telephone (706) 542-3199; E-Mail Address [email protected]
Link for the survey:
http://www.fcs.uga.edu/cs/phpesp/public/survey.php?name=surveyf
Here is the Fashion Ad for Questions 22-33:
Fashion ad letter: C (for question 22)
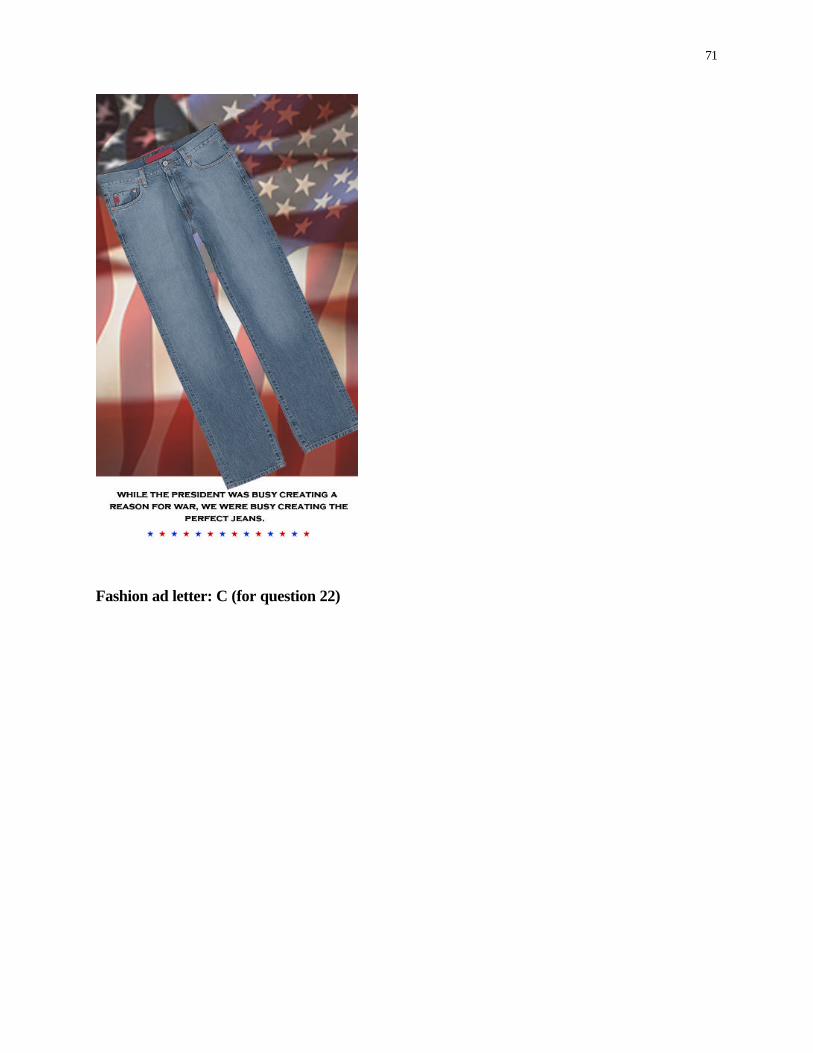
71
Fashion ad letter: C (for question 22)

72
Web Page Address: http://www.fcs.uga.edu/~beth/survey4.html
College Students' Opinions of Fashion Advertisements
Thank you for participating in this survey!!!!!!! It should not take much of your time.
Here are the instructions:
1. First, please scroll down and read the consent form below these instructions. If you have questions regarding this form, do not hesitate to contact me at [email protected] or 706-542-4886.
2. Next, scroll down and you will see the link to the survey and a fashion ad. For questions 22-33, you will need to view the fashion ad while you answer the questions. To do this, right click on the survey link. Click "Open in new window". Then, adjust the screen so that you can view the ad and the survey side-by-side.
Note: After you open the survey screen, if you click on this page, the survey screen will be completely minimized. You can find it down at the bottom of the computer screen.
3. Use the fashion ad to answer questions 22-33.
4. Have fun!
Consent Form
I, ___________________________ agree to take part in a research study titled “College Students' Opinions of Fashion Advertisements,” which is being conducted by Beth Harben, from the department of Textiles, Merchandising and Interiors at the University of Georgia, (542-4886) under the direction of Soyoung Kim, from the department of Textiles, Merchandising, and Interiors (542-4887). I do not have to take part in this study. I can stop taking part at any time without giving any reason, and without penalty. I can ask to have information related to me returned to me, removed from the research records, or destroyed.
The purpose of this study is to compare how different people view products in fashion ads.
If I volunteer to take part in this study, I will be asked to do the following things:

73
1) Fill out a questionnaire online that will take approximately 5 minutes. 2) The questionnaire will ask me about conversations I have with others. 3) Then I will be asked to look at a fashion advertisement. 4) I will be asked to give my opinion of the product and the content of the ad. 5) Finally, I will be asked to give demographic information.
No discomforts or stresses are expected from completing the questionnaire or viewing the fashion ad.
No risks are expected from participating in this study.
Any information that is obtained in connection with this study and that can be identified with me will remain confidential and will be disclosed only with my permission or as required by law.
The researcher will answer any further questions about the research, now or during the course of the project, and can be reached at 706-542-4886.
Additional questions or problems regarding your rights as a research participant should be addressed to Chris A. Joseph, Ph.D. Human Subjects Office, University of Georgia, 606A Boyd Graduate Studies Research Center, Athens, Georgia 30602-7411; Telephone (706) 542-3199; E-Mail Address [email protected]
Link for the survey:
http://www.fcs.uga.edu/cs/phpesp/public/survey.php?name=surveyf
Here is the Fashion Ad for Questions 22-33:
Fashion ad letter: D (for question 22)
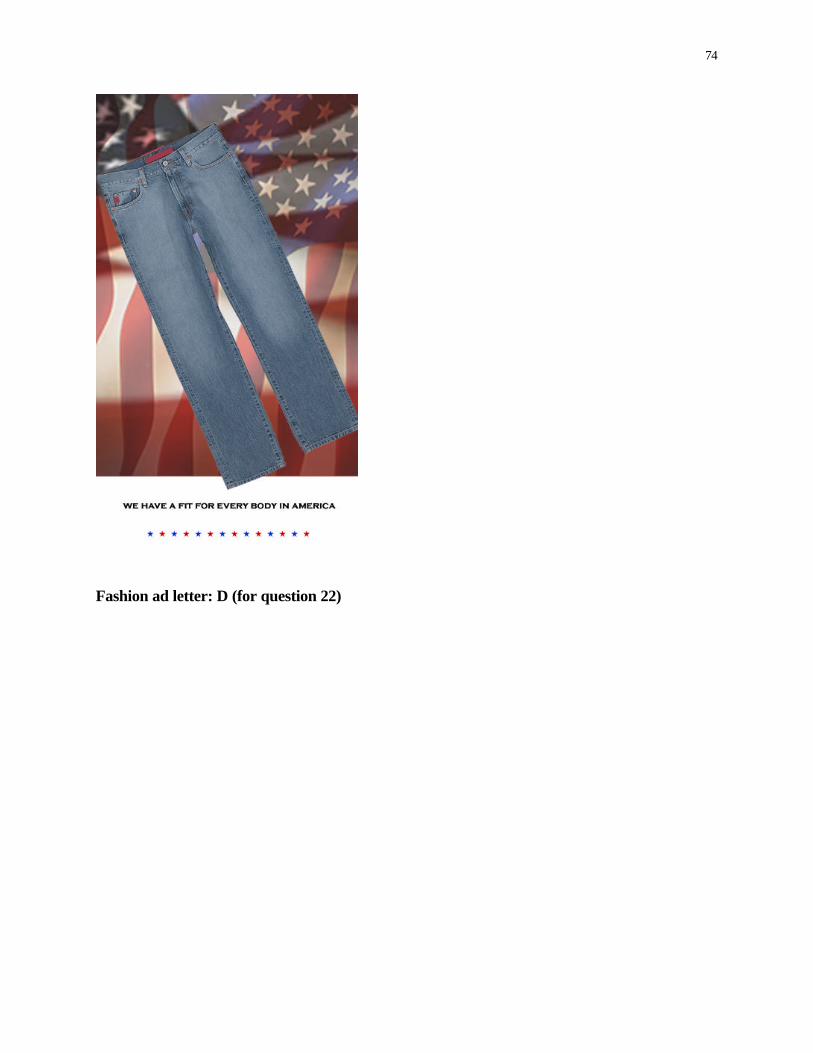
74
Fashion ad letter: D (for question 22)

75
Appendix C
Jeans Advertisements
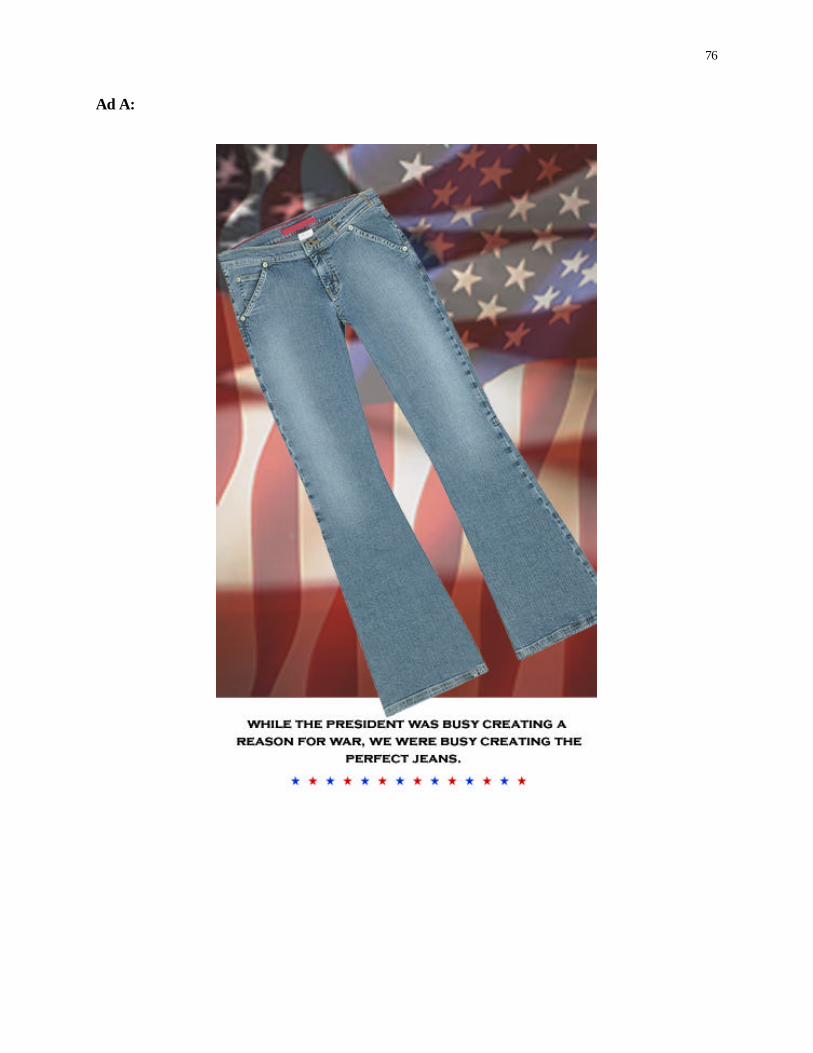
76
Ad A:
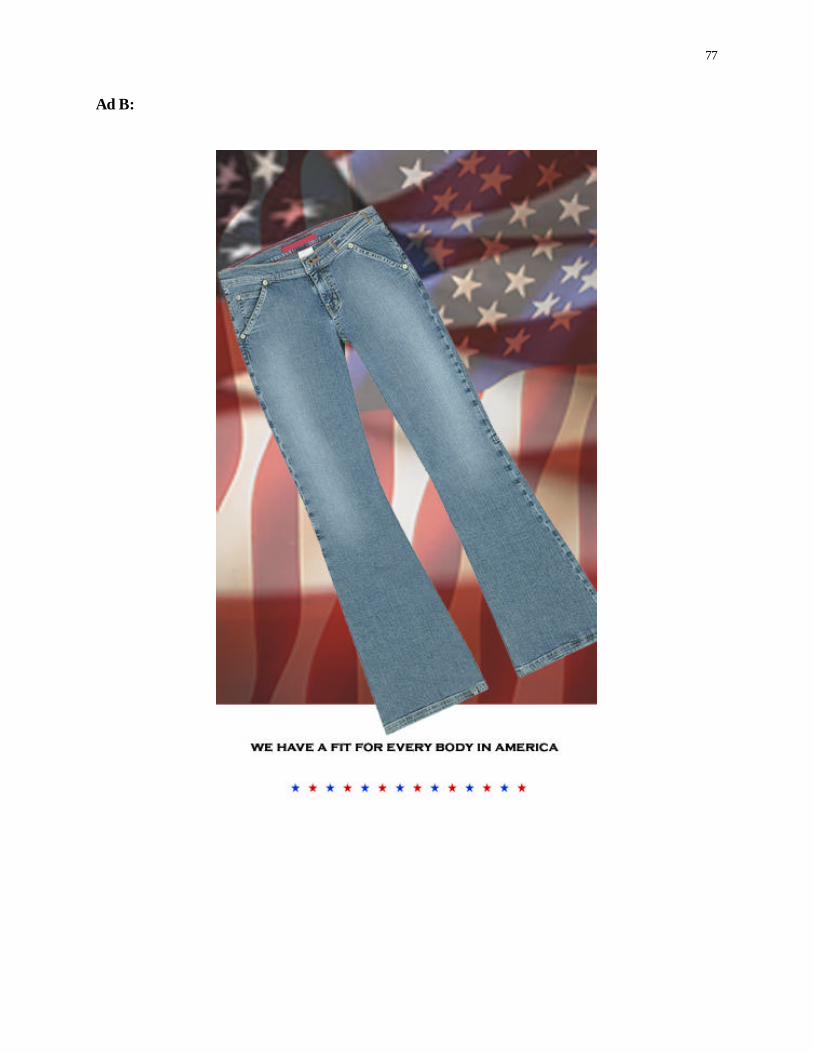
77
Ad B:
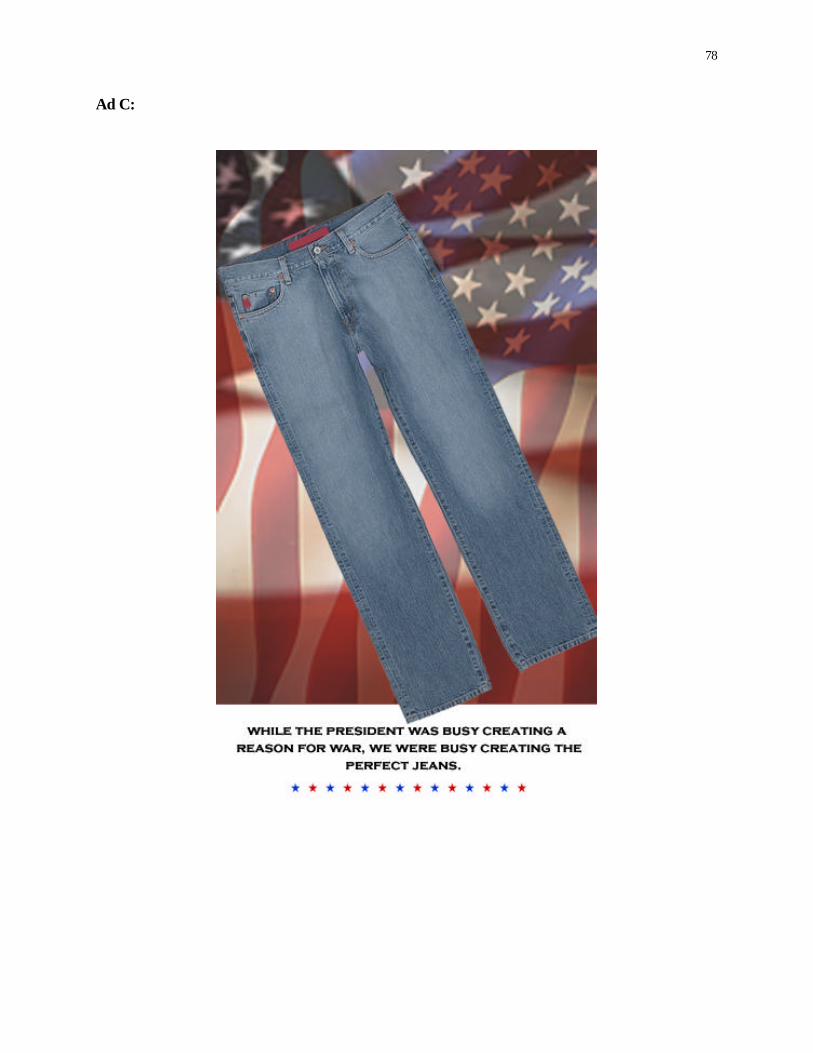
78
Ad C:
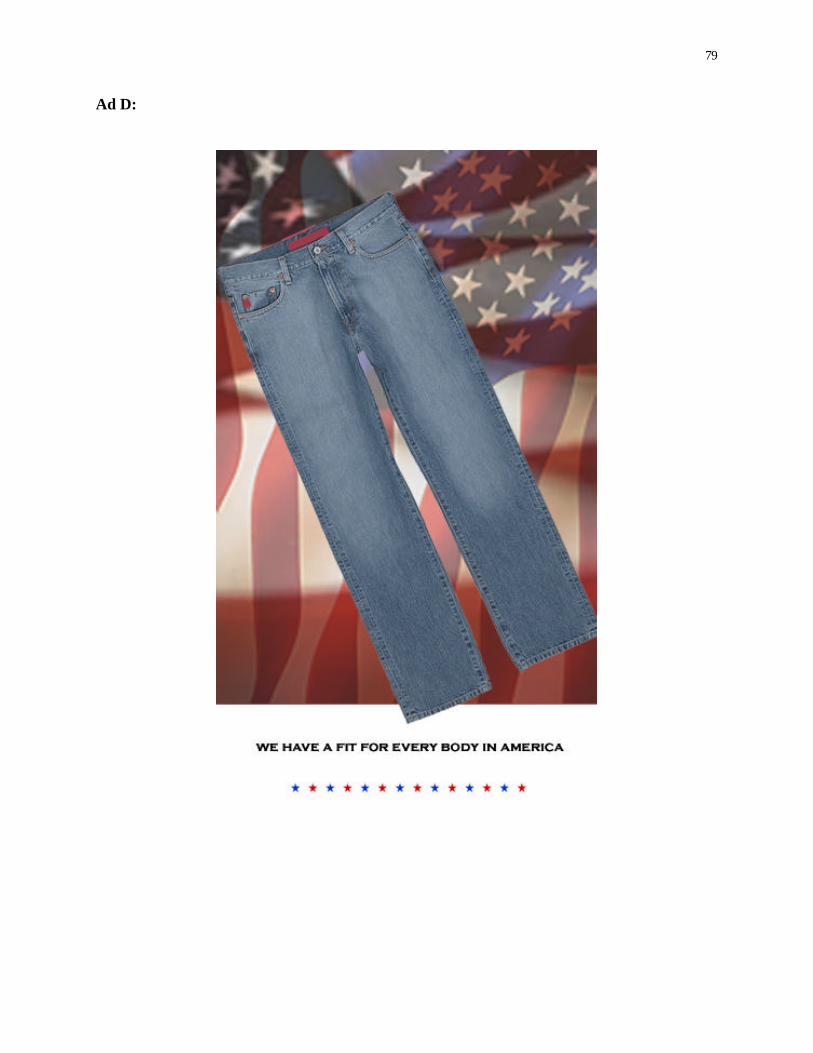
79
Ad D:

80
Appendix D
College Students’ Opinions of Fashion Advertisements Survey

81
College Students’ Opinions of Fashion Advertisements
Please check the answer that best describes how you feel about each statement. For questions 22-33, please refer to the fashion ad.
1. My opinion on fashion seems not to count with other people.
agree strongly agree somewhat no opinion/ doesn’t apply to me disagree somewhat disagree disagree strongly 2. When they choose clothing, other people do not turn to me for advice.
agree strongly agree somewhat no opinion/ doesn’t apply to me disagree somewhat disagree disagree strongly
3. Other people come to me for advice about choosing clothing.
agree strongly agree somewhat no opinion/ doesn’t apply to me disagree somewhat disagree disagree strongly
4. People that I know pick clothing based on what I have told them.
agree strongly agree somewhat no opinion/ doesn’t apply to me disagree somewhat disagree disagree strongly
82
5. I often influence people’s opinions about fashion.
agree strongly agree somewhat no opinion/ doesn’t apply to me disagree somewhat disagree disagree strongly
6. I don’t need to talk to others before I buy clothing.
agree strongly agree somewhat no opinion/ doesn’t apply to me disagree somewhat disagree disagree strongly
7. I like to get other’s opinions before I buy new clothing.
agree strongly agree somewhat no opinion/ doesn’t apply to me disagree somewhat disagree disagree strongly
8. I feel more comfortable buying new clothes when I have gotten other people’s opinions on them. agree strongly agree somewhat no opinion/ doesn’t apply to me disagree somewhat disagree disagree strongly
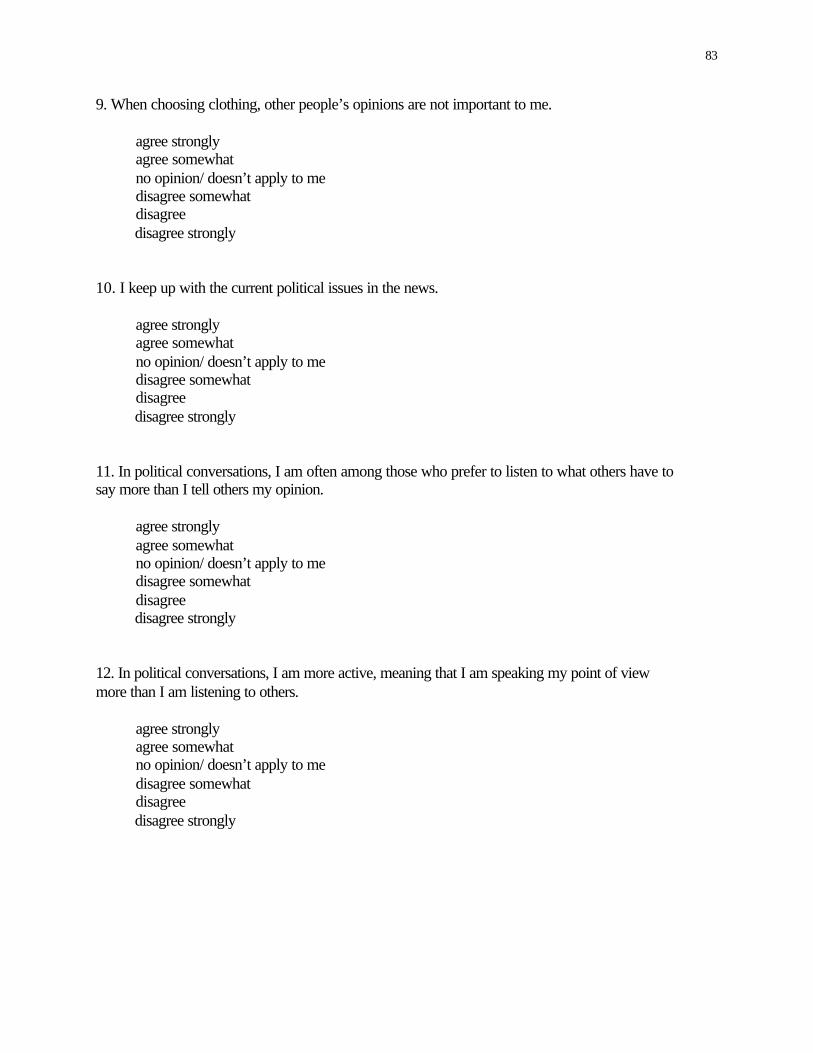
83
9. When choosing clothing, other people’s opinions are not important to me.
agree strongly agree somewhat no opinion/ doesn’t apply to me disagree somewhat disagree disagree strongly
10. I keep up with the current political issues in the news.
agree strongly agree somewhat no opinion/ doesn’t apply to me disagree somewhat disagree disagree strongly
11. In political conversations, I am often among those who prefer to listen to what others have to say more than I tell others my opinion. agree strongly agree somewhat no opinion/ doesn’t apply to me disagree somewhat disagree disagree strongly 12. In political conversations, I am more active, meaning that I am speaking my point of view more than I am listening to others. agree strongly agree somewhat no opinion/ doesn’t apply to me disagree somewhat disagree disagree strongly
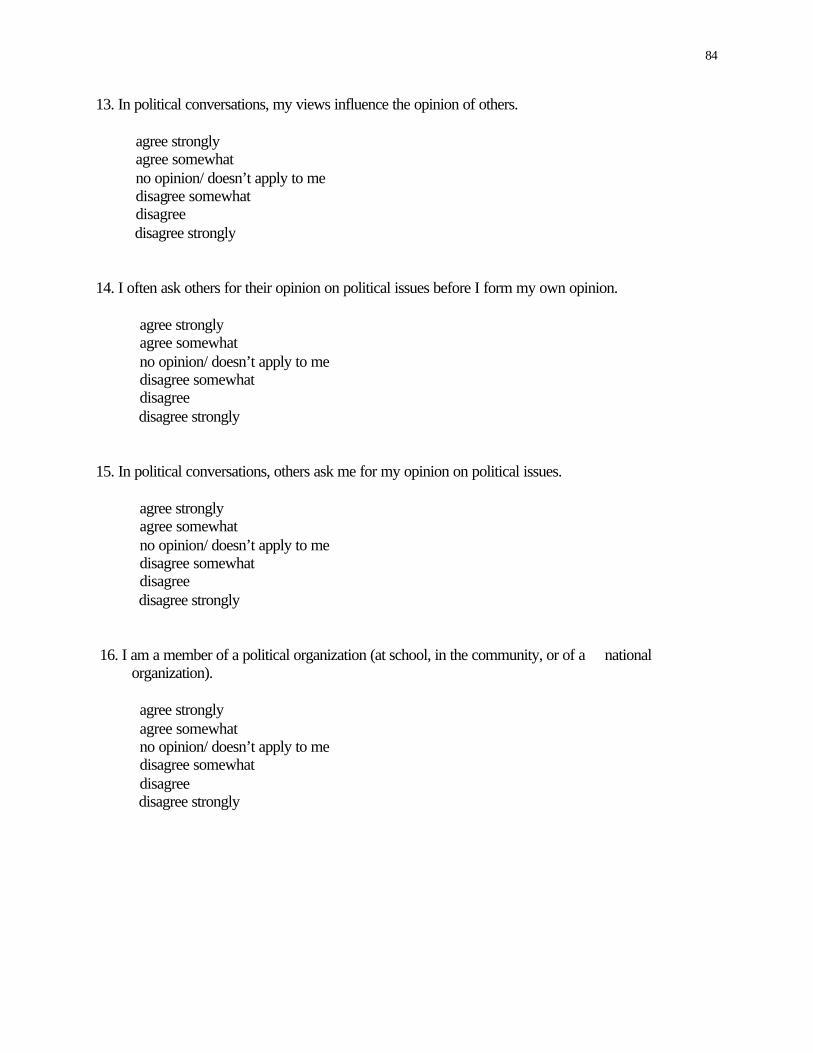
84
13. In political conversations, my views influence the opinion of others. agree strongly agree somewhat no opinion/ doesn’t apply to me disagree somewhat disagree disagree strongly 14. I often ask others for their opinion on political issues before I form my own opinion. agree strongly agree somewhat no opinion/ doesn’t apply to me disagree somewhat disagree disagree strongly 15. In political conversations, others ask me for my opinion on political issues.
agree strongly agree somewhat no opinion/ doesn’t apply to me disagree somewhat disagree disagree strongly
16. I am a member of a political organization (at school, in the community, or of a national organization).
agree strongly agree somewhat no opinion/ doesn’t apply to me disagree somewhat disagree disagree strongly
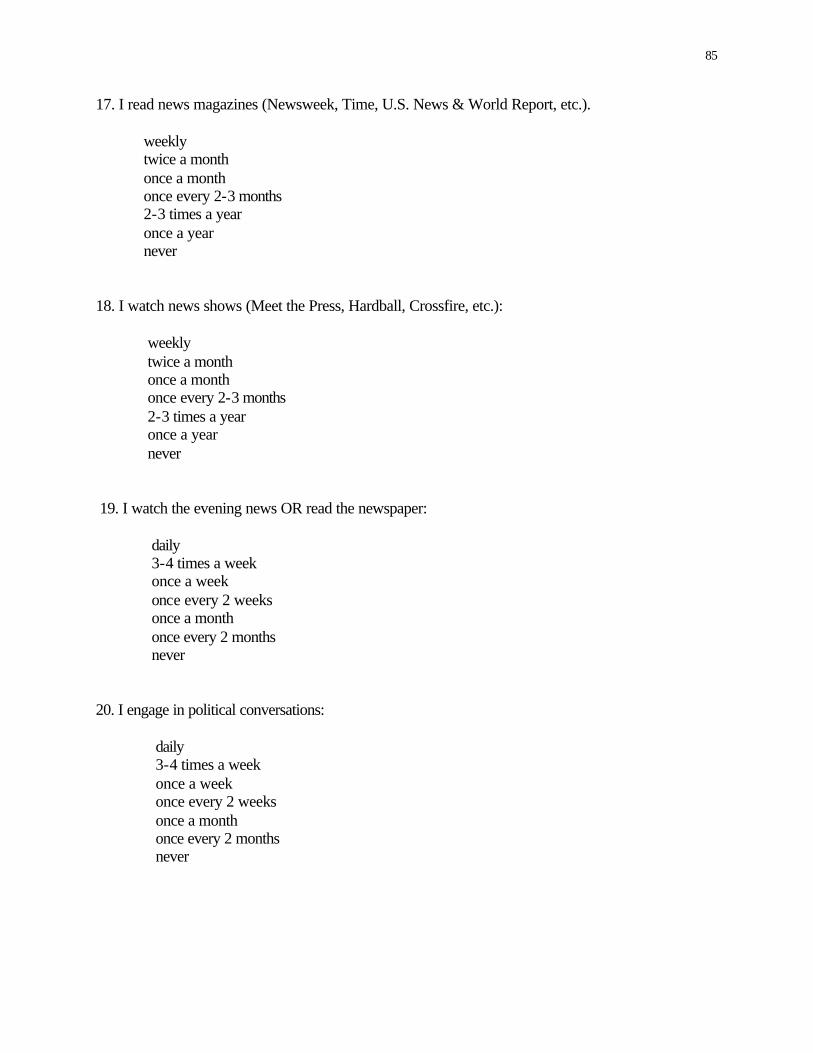
85
17. I read news magazines (Newsweek, Time, U.S. News & World Report, etc.). weekly twice a month once a month once every 2-3 months 2-3 times a year once a year never 18. I watch news shows (Meet the Press, Hardball, Crossfire, etc.): weekly twice a month once a month once every 2-3 months 2-3 times a year once a year never 19. I watch the evening news OR read the newspaper: daily 3-4 times a week once a week once every 2 weeks once a month once every 2 months never 20. I engage in political conversations: daily 3-4 times a week once a week once every 2 weeks once a month once every 2 months never

86
21. I feel that my political views are: very conservative conservative somewhat conservative in the middle somewhat liberal liberal very liberal 22. The letter by the ad I am viewing is:
A B C D
23. This ad is interesting.
agree strongly agree somewhat no opinion/ doesn’t apply to me disagree somewhat disagree disagree strongly 24. This ad is effective. agree strongly agree somewhat no opinion/ doesn’t apply to me disagree somewhat disagree disagree strongly

87
25. This ad is good.
agree strongly agree somewhat no opinion/ doesn’t apply to me disagree somewhat disagree disagree strongly
26. I like this ad.
agree strongly agree somewhat no opinion/ doesn’t apply to me disagree somewhat disagree disagree strongly
27. The product in the ad is fashionable/ stylish.
agree strongly agree somewhat no opinion/ doesn’t apply to me disagree somewhat disagree disagree strongly
28. The product in the ad is attractive.
agree strongly agree somewhat no opinion/ doesn’t apply to me disagree somewhat disagree disagree strongly

88
29. Overall, I like the product in the ad.
agree strongly agree somewhat no opinion/ doesn’t apply to me disagree somewhat disagree disagree strongly
30. I believe the ad is communicating a political message.
agree strongly agree somewhat no opinion/ doesn’t apply to me disagree somewhat disagree disagree strongly
31. I understand what the political message in the ad is trying to say.
agree strongly agree somewhat no opinion/ doesn’t apply to me disagree somewhat disagree disagree strongly
32. I agree with the political message in the ad.
agree strongly agree somewhat no opinion/ doesn’t apply to me disagree somewhat disagree disagree strongly
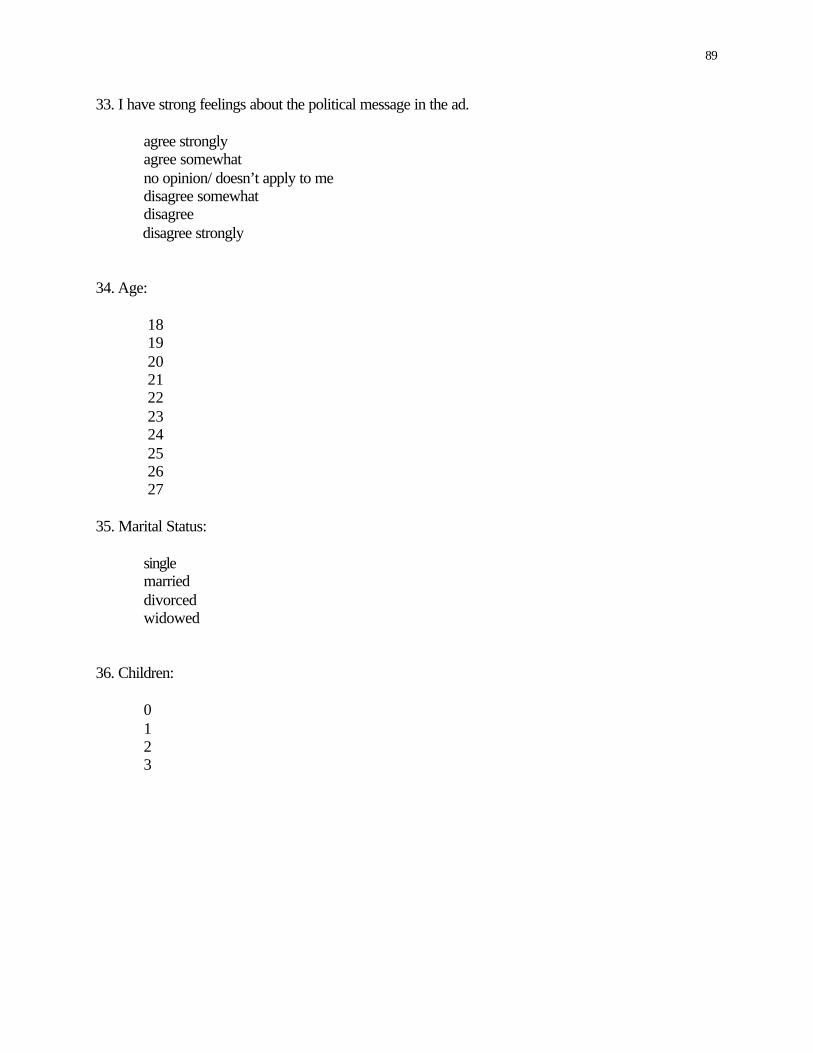
89
33. I have strong feelings about the political message in the ad.
agree strongly agree somewhat no opinion/ doesn’t apply to me disagree somewhat disagree disagree strongly
34. Age:
18 19 20 21 22 23 24 25 26 27 35. Marital Status:
single married divorced widowed 36. Children: 0 1 2 3
90
37. Education: Currently, I am a:
Freshman Sophomore Junior
Senior, 4th year Senior, 5th year 1st year graduate student 2nd year graduate student 3rd year graduate student 24. Gender: Female Male
39. Household Income: (If you still receive support from your parents, please enter their income)
less than $30,000 $31,000-$80,000 $80,000+

91
Appendix E
Forms Used to Distribute Web Address to Students
92
Forms that Were Used to Distribute the Web Address to the Students: College Student’s Opinions of Fashion Ads Your opinion counts! Males: http://www.cfs.uga.edu/~beth/survey3.html Females: http://www.fcs.uga.edu/~beth/survey1.html College Student’s Opinions of Fashion Ads Your opinion counts! Males: http://www.cfs.uga.edu/~beth/survey4.html Females: http://www.fcs.uga.edu/~beth/survey2.html