Embed Size (px)
Citation preview

RESEARCH ARTICLE
Emergence of opinion leaders in reference
networks
Mariko I. Ito1*, Hisashi Ohtsuki1, Akira Sasaki1,2
1 Department of Evolutionary Studies of Biosystems, SOKENDAI (The Graduate University for Advanced
Studies), Hayama, Kanagawa, Japan, 2 Evolution and Ecology Program, International Institute for Applied
Systems Analysis, Laxenburg, Austria
Abstract
Individuals often refer to opinions of others when they make decisions in the real world. Our
question is how the people’s reference structure self-organizes when people try to provide
correct answers by referring to more accurate agents. We constructed an adaptive network
model, in which each node represents an agent and each directed link represents a refer-
ence. In every iteration round within our model, each agent makes a decision sequentially
by following the majority of the reference partners’ opinions and rewires a reference link to a
partner if the partner’s performance falls below a given threshold. The value of this threshold
is common for all agents and represents the performance assessment severity of the popu-
lation. We found that the reference network self-organizes into a heterogeneous one with a
nearly exponential in-degree (the number of followers) distribution, where reference links
concentrate around agents with high intrinsic ability. In this heterogeneous network, the
decision-making accuracy of agents improved on average. However, the proportion of
agents who provided correct answers showed strong temporal fluctuation compared to that
observed in the case in which each agent refers to randomly selected agents. We also
found a counterintuitive phenomenon in which reference links concentrate more around
high-ability agents and the population became smarter on average when the rewiring
threshold was set lower than when it was set higher.
1 Introduction
In our society, individuals exchange information with one another [1–3]. Therefore, in many
circumstances, interdependence of individuals’ opinions is inevitable [4, 5]. This idea is often
considered in the literature of opinion formation, and the question about whether this interde-
pendence leads to a preferable result in the population has been studied extensively [4–7].
One example of opinion interdependence is found in the reference behavior called the
lead–follow relationship between financial analysts [8–13]. Financial analysts synthesize much
of information and provide reports such as forecasts of a firm’s forthcoming earnings for
investors. They revise their personal earnings forecasts at their own chosen time during the fis-
cal period. It has been suggested in the literature that less informative or less experienced
PLOS ONE | https://doi.org/10.1371/journal.pone.0193983 March 26, 2018 1 / 21
a1111111111
a1111111111
a1111111111
a1111111111
a1111111111
OPENACCESS
Citation: Ito MI, Ohtsuki H, Sasaki A (2018)
Emergence of opinion leaders in reference
networks. PLoS ONE 13(3): e0193983. https://doi.
org/10.1371/journal.pone.0193983
Editor: Long Wang, Peking University, CHINA
Received: July 31, 2017
Accepted: February 19, 2018
Published: March 26, 2018
Copyright: © 2018 Ito et al. This is an open access
article distributed under the terms of the Creative
Commons Attribution License, which permits
unrestricted use, distribution, and reproduction in
any medium, provided the original author and
source are credited.
Data Availability Statement: All relevant data are
within the paper and its Supporting Information
files.
Funding: This study was supported by a Grants-in-
Aid for Scientific Research from Japan Society for
the Promotion of Science (JSPS) to HO (KAKENHI:
16H06324, https://www.jsps.go.jp/english/e-
grants/) and in part by the Center for the Promotion
of Integrated Sciences (CPIS) of SOKENDAI (http://
cpis.soken.ac.jp/english/index.html). The funders
had no role in study design, data collection and
analysis, decision to publish, or preparation of the
manuscript.

analysts, to make their decisions more accurately, follow information developed by analysts
called lead analysts, who announced their forecasts earlier [8, 10, 13–15].
Such lead–follow behavior is not necessarily limited to financial analysts —we expect to see
it more generally in our society when each of us can refer to earlier opinions to make our deci-
sions. In this paper, we consider the process of decision-making in a population in which indi-
viduals are mutually connected by reference links. Individuals are assumed to base their
opinions on the majority of earlier opinions [16, 17] made by the referred individuals, i.e., we
assume a directed network in which each node represents an individual making his/her deci-
sion, and each directed link refers to a reference relationship. Thus, the accuracy of an agent’s
opinion depends on who the agent refers to. It is known that the majority-rule voting based on
various (independent) opinions can result in higher accuracy than the one decided by an
agent. This is known as collective intelligence [5, 17] (Table 1). However, it has also been
shown that the correlation between opinions collected for a majority vote can decrease the
advantage of collective intelligence [5, 6].
It should be natural to assume that each individual assesses the credibility of the referents
and decides to either keep or stop following them accordingly. Thus, a reference link is rewired
according to the accuracy of the referred agent, whose accuracy depends on who he/she refers
to. Therefore, we need to consider the interaction between the change in opinion caused by
network topology and the change of network topology induced by the opinion accuracy of the
nodes. This idea is related to adaptive or coevolutionary networks, in which feedback loops
between node dynamics and network topology are considered [18, 19]. There are a number of
adaptive network models under various link-rewiring rules including ones that assume game
interactions between nodes, such as the prisoner’s dilemma game and the minority game, in
which a link represents a game interaction or reference. These links are discarded and rewired
when the linked game partners are not preferable, when the linked advisers are not reliable,
and so on [16, 18–24]. Some of these models show the emergence of heterogeneous structures
in the evolved network, such as the scale-free degree distribution, in which a small number of
individuals come to acquire a large number of degrees after repeated events of rewiring, even
when starting from a homogeneous initial state [18, 20–24]. Some of these models also high-
light macroscopic quantities, such as the ratio of cooperators in the population and the quality
of propagated information (and “performance” in our model), that change through adaptive
rewiring [18, 20, 21, 24] and show, in some cases, that the evolved network with a heteroge-
neous structure has better performance than the initial homogeneous network.
In our model, we focus on the accuracy of decision-making of each individual, which we
call “performance”, in the evolved network. It is not clear whether the evolved network shows
Table 1. An example showing the effect of collective intelligence.
The way the person with the highest accuracy (p1 = 0.75) makes a
decision
Probability of answering a binary question
correctly
Independent decision 0.75
Majority vote by referring to two other persons with lower accuracy
(p2 = 0.7, p3 = 0.65)
0.785
Consider a society with three persons differing in their accuracy, or the probability, of giving the correct answer
for a binary question when they make a decision alone. Suppose their accuracy is given by p1 = 0.75, p2 = 0.7, and
p3 = 0.65. When person #1 (with accuracy p1 = 0.75) makes his/her decision independently, he/she gives the correct
answer with probability p1 = 0.75. In contrast, if he/she refers to two other persons that have lower accuracy than
him/herself for making a decision by the majority vote of all three, the probability of giving the correct answer is
raised to 0.785 (calculated as p1p2p3 + (1 − p1)p2p3 + p1(1 − p2)p3 + p1 p2(1 − p3) = 0.785).
https://doi.org/10.1371/journal.pone.0193983.t001
Emergence of opinion leaders
PLOS ONE | https://doi.org/10.1371/journal.pone.0193983 March 26, 2018 2 / 21
Competing interests: The authors have declared
that no competing interests exist.

good performance. If the evolved network has high heterogeneity, so that some individuals,
called leaders, receive a far larger number of reference edges than the others, then the opinions
of agents in the network should be highly correlated. This enhanced correlation between opin-
ions may harm the population performance in the long run. The opposite may be the case
because the network structure, which is biased toward referring to more accurate agents, may
improve the population performance. The performance in the evolved network should depend
on the network’s structure.
In the reference relationship, we ask (1) what property is generated in the in-degree (the
number of followers) distribution, that is, the correlation between the in-degree of an agent
and its ability to solve a problem, in the evolved network and (2) whether the reference rela-
tionship in the evolved network leads to higher performance than the initial random network.
To answer the questions listed above, we conducted extensive computer simulations and
developed an analytical theory to explain the results obtained in the simulations.
In Section 2, we explain our model and how it incorporates the interaction between collec-
tive intelligence and network evolution. In Section 3, we show the results —there, we see the
emergence of the heterogeneous structures with a nearly exponential in-degree distribution.
We also evaluate the performance of the evolved network. We explain these results by analyti-
cal calculations. The discussion is in Section 4.
2 Materials and methods
2.1 Model
We consider a directed network made up of N nodes, each of which represents an agent who
makes a decision. In this network, a directed link from node i to node j means that agent irefers to agent j when he/she makes a decision. If there is a directed link from i to j, we call
agent i a follower of agent j, and agent j a referent of agent i. For each agent, the number of ref-
erence links from him/her is fixed to M. Let aij be the number of reference links from agent ito agent j—(aij) is the adjacency matrix of the network (Table 2). By definition,
PNj¼1
aij ¼ M
andPN
i¼1
PNj¼1
aij ¼ NM. Here we allow for both self-loops and the overlap of links, i.e., aii is
not necessarily 0 and aij can be more than 1. Each agent in our model repeatedly makes his/her
decision while updating his/her referents by the rule explained later (Fig 1).
Table 2. Definition of symbols.
Symbol Descriptions
N Number of agents
M Number of reference links from each agent
aij Number of reference links from agent i to agent jpi Ability of agent iPi Probability that agent i gives a correct answer
yijt Evaluated performance of agent j by agent i at time t
y0 Initial value of yijt when agent i newly rewires to agent jIit The random variable whose value is 1 (0) if agent i succeeded (failed) in giving a correct answer
θ Rewiring threshold
α The extent to which people attach importance to the current result against the history so far in the
performance evaluation
Ti The mean duration that the agent i keeps his/her follower
kðpÞ The mean in-degree of an agent with ability p
https://doi.org/10.1371/journal.pone.0193983.t002
Emergence of opinion leaders
PLOS ONE | https://doi.org/10.1371/journal.pone.0193983 March 26, 2018 3 / 21
In the initial condition, each agent refers to randomly selected M referents. In other words,
a directed random regular graph with M out-degrees is used as the initial state of our model.
In our model, the same binary choice question is given to all agents. One of the choices is
correct, and the other is wrong. We assume that agents vary in their probability of solving a
problem correctly by themselves (i.e., without referring to others’ opinions). We call the proba-
bility ability. The ability of agent i is denoted by pi. For example, a question is given to financial
analysts, such as whether the earning of a company in the next quarter increases, and all will
know the correct answer at the end of the next quarter. After many trials, the analyst’s (say
agent i’s) ability is calculated as the probability that he/she forecasted the correct outcome, that
is represented by pi. For each question, all agents state their answers sequentially in a randomly
determined order. Hereafter, we call specifically an actual stated choice an answer. Now, we
explain how agent i states his/her answer. When agent i’s turn comes, he/she first sets his/her
own choice for the given question without referring to those by his/her referents. The proba-
bility that this choice is correct is given by the agent’s ability, pi. In the next step, agent i puts
his/her own choice together with the answers of referents that have already been stated and
makes a final choice among those choice/answers according to the simple majority-rule. Agent
i then states a final choice as his/her answer. For example, if agent i refers to agents i1, i2, i3, i4and i5, and agents i1 and i2 have already stated their answers, agent i collects the answer from i1and i2’s along with his/her choice and states the majority among these three. In the case of a tie
in applying the majority-rule, agent i tosses a coin to decide which choice he/she states. In the
case where aii� 1, we regard that agent i’s choice has a weight aii + 1 in i’s majority-rule voting.
Similarly, when aij� 2(i 6¼ j), we regard that agent j’s answer has a weight aij in i’s majority-
rule voting. Since agent i incorporates other agents’ answers, it is clear that agent i’s ability pi is
different from the probability with which agent i actually states a correct answer, Pi. We
denote Pi as the performance of agent i.
Fig 1. Procedure to update the network. The initial network is a random regular network. Starting from this initial
network, we iterate sequential decision-making and rewiring of the reference links. Illustrated in the top-right part is a
sample network, in which the closed dot represents the focal agent, the gray dots represent the agents referred to by the
focal agents, and the arrows are reference links.
https://doi.org/10.1371/journal.pone.0193983.g001
Emergence of opinion leaders
PLOS ONE | https://doi.org/10.1371/journal.pone.0193983 March 26, 2018 4 / 21
After all the agents state their answers, the correct answer to the question is given. We
assume that each agent monitors and evaluates the performance of his/her referents, as
explained later. Each agent breaks the link to the referent if his/her evaluated performance falls
below a certain threshold and rewires it to a randomly selected agent excluding referents that
are kicked off in this step. The assumption that the newly selected agents are determined ran-
domly is based on the idea that we cannot know the performance of strangers a priori.
We iterate decision-making and rewiring as explained above. In each iteration step t, the
evaluated performance of referent j by agent i, denoted as yijt , is updated as follows. When agent
i newly acquires referent j at time ts, his/her initial level of estimated performance, yijts , is set to
y0 for any pair of i and j. Let Ijt be a variable whose value of 0 represents the failure of agent j to
give a correct answer, and a value of 1 represents the agent’s success at the iteration time t. We
assume that the evaluated performance of agent j by agent i at iteration time t, yijt , is updated
recursively by
yijt ¼ ð1 � aÞyijt� 1 þ aIjt: ð1Þ
Here, α describes the extent to which people in the society attach importance to the current
result as compared to the referent’s past. We also assume that all agents adopt the same rewir-
ing threshold to kick-off referents, θ. The threshold represents severity of assessment in the
society. For example, if the threshold is low, people in the society are generous when they eval-
uate their referents.
2.2 Simulation conditions
We conducted agent-based simulations using parameters N = 100, M = 5, and α = 0.1. We
assume that the ability of agents, pi’s, are uniformly distributed in the range of 0.5 to 0.75 by
setting pi = 0.5 + 0.25i/N for i = 0, 1, . . ., N − 1. Note that the ability of each agent does not
change throughout a simulation run. The initial evaluated performance y0 is set to 0.625,
which is nearly equivalent to the mean ability in the population. We limit the range of the
rewiring threshold θ in 0.5� θ< y0 = 0.625. The lower limit for θ, 0.5, is only the accuracy of a
coin-toss. The upper limit y0 is set for the following reason—if we set the threshold greater
than this upper limit, the initial performance of a new referent is always evaluated lower than
the threshold.
At the initial state, the network is a directed random regular network with out-degree
M = 5, so the in-degree distribution of each agent is expected to obey the binomial distribution
with parameters NM (the total number of reference links in the population) and 1/N (the prob-
ability that a particular individual is chosen as a referent) and is approximated by the Poisson
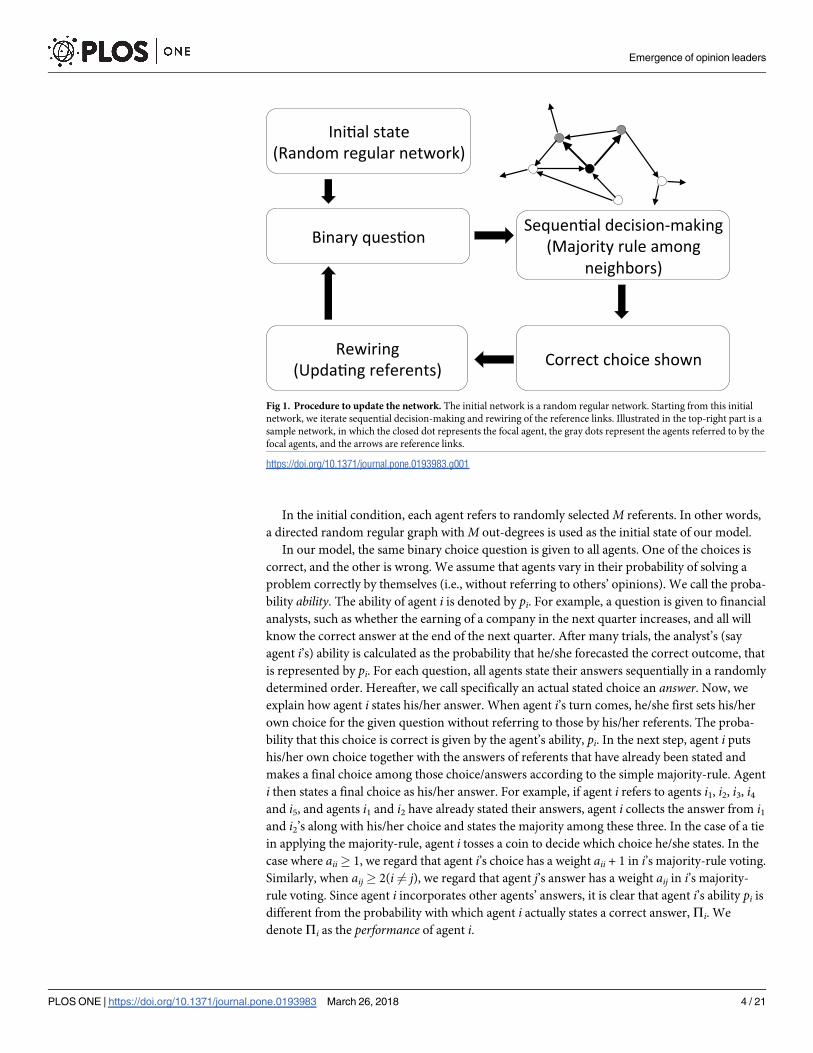
distribution with mean M, because N� 1 (Fig 2).
In our simulation, a set of sequential decision-makings of agents, followed by the rewiring
of reference links, constituted the events in a unit of time, which repeats itself until the
“evolved network” at t = Tend = 20,000 was reached. For each parameter set, the simulations
were repeated 500 times. We calculated the frequency of agents having in-degree k at each
time step t and averaged them over 500 independent runs. Pt(k) denotes the averaged fre-
quency of agents having in-degree k at time t, which must depend on the rewiring threshold θ.
We regard PTendðkÞ as the in-degree distribution in the evolved network. We evaluated the per-
formance of each agent for each simulation run in the evolved network by averaging the num-
ber of correct answers stated in the last T = 100 time steps (i.e., the performance of agent i is
the average of Iit over Tend − T + 1� t� Tend), at which point we assumed that the network
has reached an equilibrium state. The average over 500 independent runs was then calculated
Emergence of opinion leaders
PLOS ONE | https://doi.org/10.1371/journal.pone.0193983 March 26, 2018 5 / 21
and regarded as the mean performance of agent i, Pi. Therefore, the definition of Pi is
Pi ¼PTend
t¼Tend� Tþ1Iit=T , where the overline represents the average over 500 independent runs.
We also calculated the mean group performance and its standard deviation. For each single
run, we regardedPN
i¼1Iit=N as the group performance at time t and calculated the mean and
the standard deviation (SD) ofXN
i¼1Iit=N
n o
Tend� Tþ1�t�Tend
, that is, for the last T = 100 time
steps. Then we took their average over 500 independent runs to evaluate the group perfor-
mance and its fluctuation.
3 Results
3.1 The heterogeneity in the in-degree distribution
The in-degree distribution PTendðkÞ in the evolved network significantly differed from the initial
Poisson distribution for the random network (Fig 2). As the in-degrees in the evolved network
were distributed approximately exponentially, there were a few nodes that had much larger in-
degrees than the mean. In other words, high heterogeneity in the number of followers evolved
through the adaptive rewiring process. The agents attracting many followers can be interpreted
as “opinion leaders” in our model.
The mean in-degree kðpiÞ ¼PN
j¼1aij of agent i with ability pi, that is the mean number of
followers of agent i, increased exponentially with pi for each rewiring threshold θ (Fig 3).
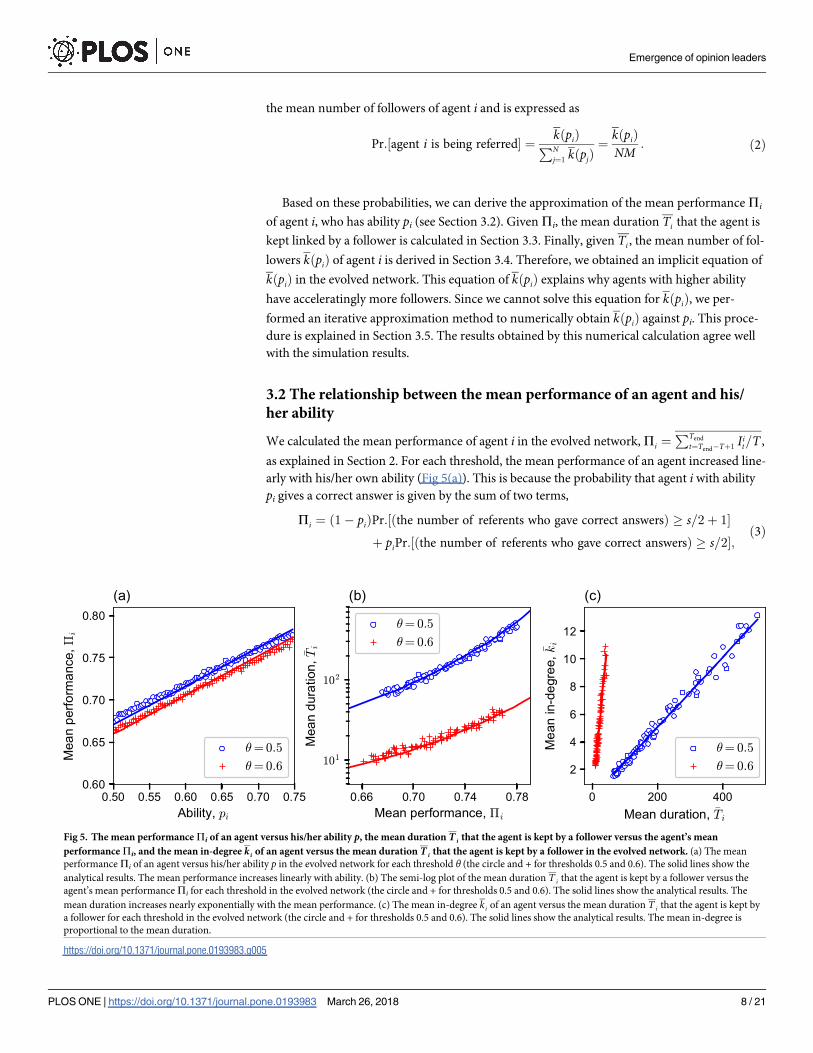
We were able to obtain an approximation equation which kðpiÞ satisfies in the equilibrium
state. Its derivation, which we will describe in detail in Sections 3.2 to 3.5, is illustrated as fol-
lows (Fig 4). Suppose we know kðpiÞ. In the equilibrium state, the probability that a randomly
sampled reference link from the population is referring to agent i should be proportional to
Fig 2. The distribution of the number of followers (in-degree) in the initial and evolved networks. (a) The solid
line is the initial Poisson distribution with a mean of 5. The markers (the circle and +) denote the in-degree
distributions of the evolved network with rewiring thresholds θ = 0.5 and 0.6, respectively, obtained over 500
independent runs of our simulation. The in-degree distributions in the evolved networks are significantly different
from the initial condition, showing much higher heterogeneity in in-degrees. (b) The same as (a) except that the
vertical axis is logarithmically scaled. We can observe the approximately exponential tails in the evolved networks.
https://doi.org/10.1371/journal.pone.0193983.g002
Emergence of opinion leaders
PLOS ONE | https://doi.org/10.1371/journal.pone.0193983 March 26, 2018 6 / 21
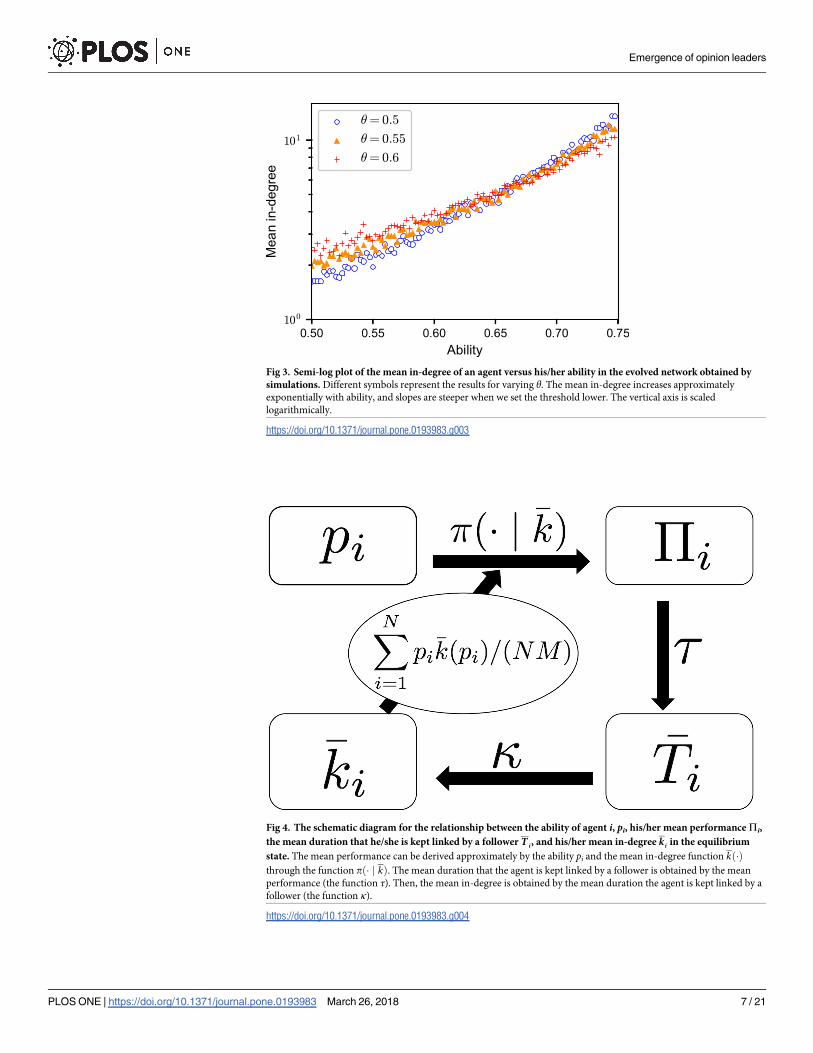
Fig 3. Semi-log plot of the mean in-degree of an agent versus his/her ability in the evolved network obtained by
simulations. Different symbols represent the results for varying θ. The mean in-degree increases approximately
exponentially with ability, and slopes are steeper when we set the threshold lower. The vertical axis is scaled
logarithmically.
https://doi.org/10.1371/journal.pone.0193983.g003
Fig 4. The schematic diagram for the relationship between the ability of agent i, pi, his/her mean performance Pi,
the mean duration that he/she is kept linked by a follower Ti, and his/her mean in-degree ki in the equilibrium
state. The mean performance can be derived approximately by the ability pi and the mean in-degree function kð�Þthrough the function pð� j kÞ. The mean duration that the agent is kept linked by a follower is obtained by the mean
performance (the function τ). Then, the mean in-degree is obtained by the mean duration the agent is kept linked by a
follower (the function κ).
https://doi.org/10.1371/journal.pone.0193983.g004
Emergence of opinion leaders
PLOS ONE | https://doi.org/10.1371/journal.pone.0193983 March 26, 2018 7 / 21
the mean number of followers of agent i and is expressed as
Pr: agent i is being referred½ � ¼kðpiÞ
PNj¼1
kðpjÞ¼
kðpiÞNM
: ð2Þ
Based on these probabilities, we can derive the approximation of the mean performance Pi
of agent i, who has ability pi (see Section 3.2). Given Pi, the mean duration Ti that the agent is
kept linked by a follower is calculated in Section 3.3. Finally, given Ti , the mean number of fol-
lowers kðpiÞ of agent i is derived in Section 3.4. Therefore, we obtained an implicit equation of
kðpiÞ in the evolved network. This equation of kðpiÞ explains why agents with higher ability
have acceleratingly more followers. Since we cannot solve this equation for kðpiÞ, we per-
formed an iterative approximation method to numerically obtain kðpiÞ against pi. This proce-
dure is explained in Section 3.5. The results obtained by this numerical calculation agree well
with the simulation results.
3.2 The relationship between the mean performance of an agent and his/
her ability
We calculated the mean performance of agent i in the evolved network, Pi ¼PTend
t¼Tend� Tþ1Iit=T ,
as explained in Section 2. For each threshold, the mean performance of an agent increased line-
arly with his/her own ability (Fig 5(a)). This is because the probability that agent i with ability
pi gives a correct answer is given by the sum of two terms,
Pi ¼ ð1 � piÞPr:½ðthe number of referents who gave correct answersÞ � s=2þ 1�
þ piPr:½ðthe number of referents who gave correct answersÞ � s=2�;ð3Þ
Fig 5. The mean performance Pi of an agent versus his/her ability p, the mean duration Ti that the agent is kept by a follower versus the agent’s mean
performance Pi, and the mean in-degree ki of an agent versus the mean duration Ti that the agent is kept by a follower in the evolved network. (a) The mean
performance Pi of an agent versus his/her ability p in the evolved network for each threshold θ (the circle and + for thresholds 0.5 and 0.6). The solid lines show the
analytical results. The mean performance increases linearly with ability. (b) The semi-log plot of the mean duration T i that the agent is kept by a follower versus the
agent’s mean performance Pi for each threshold in the evolved network (the circle and + for thresholds 0.5 and 0.6). The solid lines show the analytical results. The
mean duration increases nearly exponentially with the mean performance. (c) The mean in-degree ki of an agent versus the mean duration T i that the agent is kept by
a follower for each threshold in the evolved network (the circle and + for thresholds 0.5 and 0.6). The solid lines show the analytical results. The mean in-degree is
proportional to the mean duration.
https://doi.org/10.1371/journal.pone.0193983.g005
Emergence of opinion leaders
PLOS ONE | https://doi.org/10.1371/journal.pone.0193983 March 26, 2018 8 / 21

when the number of referents of agent i who have stated their answers before agent i stated his/
her own, which we denote by s, is even. Note that here, we neglect self-loops or overlaps in the
reference links to simplify our approximation. Also note that the expression of Pi becomes a
slightly complicated when s is odd (Section A in S1 Text) since there are s + 1 answers/choice
including his/her own and we have to consider the tie of the number of answers/choice when
the majority-rule is applied. However, Pi can again be described as a linear function of the abil-
ity pi in both cases where s is odd and where there are self-loops or overlaps in the links (Sec-
tion A in S1 Text).
Note that each term Pr.[�] in the equations above depends on the ability and the perfor-
mance of agents who the focal agent refers to; therefore, Pr.[�] depends on the distribution of
the ability of referents, which means the ability of those who are referred to by others, not on
the ability of random agents.
We can derive an approximate formula for the slope and the intercept of the linear depen-
dence of Pi on pi (Section A in S1 Text), which agrees well with the simulation results (Fig 5
(a)). For later use, let us formally denote this relation as Pi ¼ pðpi j kÞ, where pð� j kÞmaps pito Pi, which itself depends on k. The approximated slope and intercept depend on the mean
ability of referentsPN
i¼1pikðpiÞ=ðNMÞ, which is a value that represents the distribution of ref-
erents’ ability.
3.3 Relationship between the mean duration for which a referent is kept
linked by a follower and his/her performance
In our model, each agent monitors the performance of his/her referents and stops referring to
them when the evaluated performance falls below a rewiring threshold. Thus, the higher his/
her referent’s performance is, the longer duration that he/she keeps his/her follower. We
herein examine how the duration that an agent is kept referred by a follower is related to the
agent’s performance.
The mean duration that an agent is kept referred by a follower in the evolved networks
increased approximately exponentially with his/her performance (Fig 5(b)): Ti / expðbPiÞ,
where Ti is the expected duration that agent i keeps his/her follower, Pi is the performance of
agent i, and β is a positive constant.
This relationship between a referent’s performance and the mean duration for which the
referent is kept linked by a follower is derived analytically. As explained in the Method section,
an agent’s evaluation Yt of the performance of his/her referent is updated depending on
whether the referent’s t-th answer was correct (It = 1) or not (It = 0), as follows:
Yt ¼ ð1 � aÞYt� 1 þ aIt; t ¼ 1; 2; . . . ; ð4Þ
where the initial evaluation was set to Y0� y0. If the actual performance of the referent is P,
which its follower does not know, It (t = 1, 2, . . .) are mutually independent random variables
each of which takes a value of 1 with a probability of P, and a value of 0 with a probability of
1 − P. The sequence {Yt j Y0 = y0} then forms a stochastic process. Given Y0 = y, we defined
the expected time duration to the time when the evaluated performance hit θ for the first time,
TP(y), as TP(y)� E[min{t j Yt� θ} j Y0 = y]. TP(y) is the expected first hitting time to the
threshold θ of the stochastic process {Yt j Y0 = y}. Then TP(y) satisfies the recurrence equation:
TPðyÞ ¼ 1þPTPðaþ ð1 � aÞyÞ
þð1 � PÞTPðð1 � aÞyÞ; y > y;ð5Þ
Emergence of opinion leaders
PLOS ONE | https://doi.org/10.1371/journal.pone.0193983 March 26, 2018 9 / 21

and
TPðyÞ � 0; y � y: ð6Þ
Eq (5) is derived as follows: if y> θ, the referent is kept linked to the next time step; hence, the
addition of 1 in the first term on the right-hand side of (5). In the case where the referent gave
the correct answer with probability P, the evaluated performance changes from y to (1 − α)y +
α, and the expected duration after the transition is TP((1 − α)y + α). The last term is similarly
derived for the case of failure. Eq (6) simply states that TP(y) equals 0 if the evaluation y is
already less than or equal to the threshold.
The mean duration that agent i with performance Pi is linked from a follower, Ti , is then
defined by TP(y) as follows:
Ti ¼ TPiðy0Þð� tðPiÞÞ; ð7Þ
The symbol τ in Eq (7) denotes the function that maps Pi to Ti (Fig 4). Note that Ti is greater
than 0 since θ< y0. We solved recurrence Eqs (5) and (6) numerically and obtained the mean
time TP(y) until which the evaluated performance of a referent with the initial evaluated per-
formance y and the actual performance P hits the threshold θ for the first time (see Section D
in S1 Text for the numerical procedure to obtain the mean hitting time). This then led to the
mean duration of reference Ti defined in Eq (7). The analytical formulas (5)–(7) agree well
with the simulation results (Fig 5(b)).
3.4 Relationship between an agent’s mean number of followers and his/her
ability
Here, we derive the mean number of followers or the in-degree kðpiÞ of agent i as a function of
his/her ability pi.The probability that an agent is chosen as a new referent for each rewiring event is the
same as those for all the others’, because each agent rewires its link to a randomly selected
agent after he/she kicks off a referent. Thus, the expected number of reference links that
agent i receives in the evolved network is proportional to the mean lifetime of a link to agent i,Ti . Therefore, the mean in-degree kðpiÞ of agent i can be expressed as a function of Ti as fol-
lows:
kðpiÞ ¼Ti
PNj¼1
Tj
NMð� kðTiÞÞ: ð8Þ
The symbol κ in Eq (8) denotes the function that maps Ti to kðpiÞ. This expression of kðpiÞagrees well with the simulation data (Fig 5(c)). The reason why k depends (only) on the ability
pi of agent i is that τ(Pi) is a function of the agent’s performance, Pi, and pðpi j kÞ is a function
of pi. See Section C in S1 Text for a more formal derivation of kðpiÞ from a master equation for
the probability distribution of the performance of a referred agent.
As noted in the last section and shown in Fig 5(a) and 5(b), the mean duration that the ref-
erence to agent i is kept linked by a follower increases roughly exponentially (but actually
slightly faster than exponential) with his/her performance Pi, and Pi increases linearly with
his/her ability pi, resulting in an roughly exponential relationship between Ti and pi: Ti / eb0pi .
Therefore, the mean in-degree of agent i also increases roughly exponentially with his/her
Emergence of opinion leaders
PLOS ONE | https://doi.org/10.1371/journal.pone.0193983 March 26, 2018 10 / 21
ability:
kðpiÞ ¼ k � t � pð� j kÞðpiÞ � ðconst:Þ � eb0pi ; ð9Þ
where � in Eq (9) is the composition of functions.
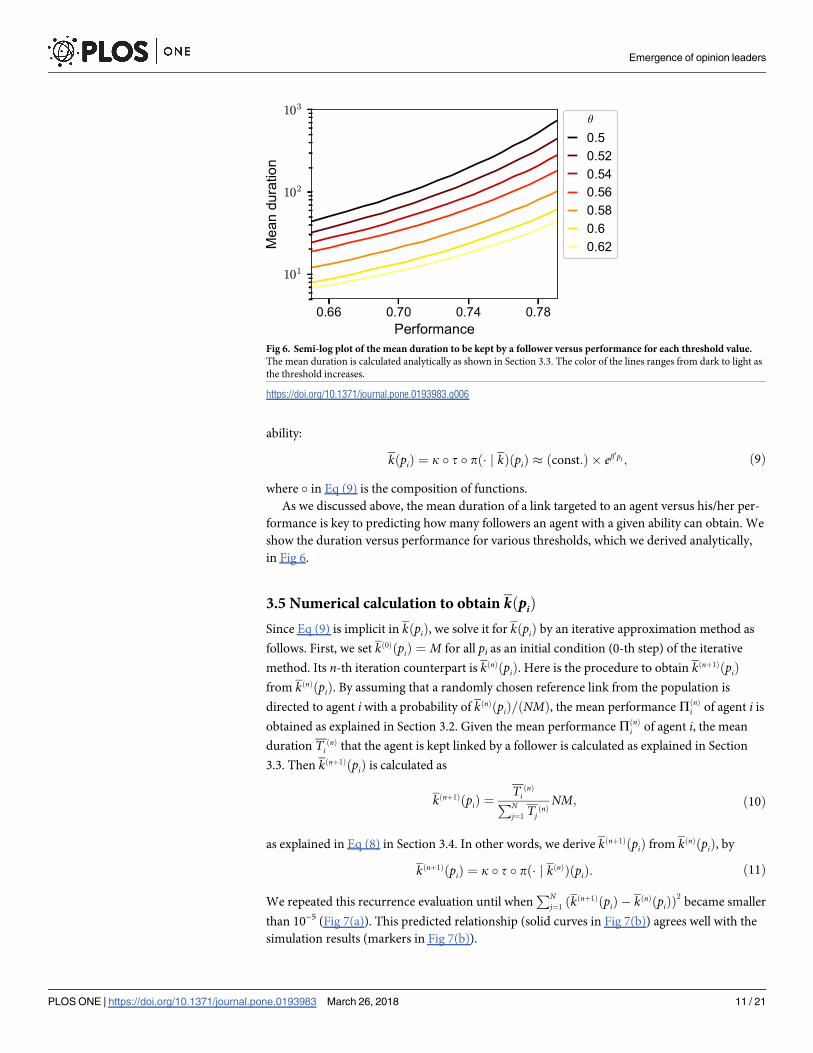
As we discussed above, the mean duration of a link targeted to an agent versus his/her per-
formance is key to predicting how many followers an agent with a given ability can obtain. We
show the duration versus performance for various thresholds, which we derived analytically,
in Fig 6.
3.5 Numerical calculation to obtain kðpiÞ
Since Eq (9) is implicit in kðpiÞ, we solve it for kðpiÞ by an iterative approximation method as
follows. First, we set kð0ÞðpiÞ ¼ M for all pi as an initial condition (0-th step) of the iterative
method. Its n-th iteration counterpart is kðnÞðpiÞ. Here is the procedure to obtain kðnþ1ÞðpiÞfrom kðnÞðpiÞ. By assuming that a randomly chosen reference link from the population is
directed to agent i with a probability of kðnÞðpiÞ=ðNMÞ, the mean performance PðnÞi of agent i is
obtained as explained in Section 3.2. Given the mean performance PðnÞi of agent i, the mean
duration TiðnÞ that the agent is kept linked by a follower is calculated as explained in Section
3.3. Then kðnþ1ÞðpiÞ is calculated as
kðnþ1ÞðpiÞ ¼TiðnÞ
PNj¼1
TjðnÞNM; ð10Þ
as explained in Eq (8) in Section 3.4. In other words, we derive kðnþ1ÞðpiÞ from kðnÞðpiÞ, by
kðnþ1ÞðpiÞ ¼ k � t � pð� j kðnÞÞðpiÞ: ð11Þ
We repeated this recurrence evaluation until whenPN
j¼1ðkðnþ1ÞðpiÞ � kðnÞðpiÞÞ
2became smaller
than 10−5 (Fig 7(a)). This predicted relationship (solid curves in Fig 7(b)) agrees well with the
simulation results (markers in Fig 7(b)).
Fig 6. Semi-log plot of the mean duration to be kept by a follower versus performance for each threshold value.
The mean duration is calculated analytically as shown in Section 3.3. The color of the lines ranges from dark to light as
the threshold increases.
https://doi.org/10.1371/journal.pone.0193983.g006
Emergence of opinion leaders
PLOS ONE | https://doi.org/10.1371/journal.pone.0193983 March 26, 2018 11 / 21
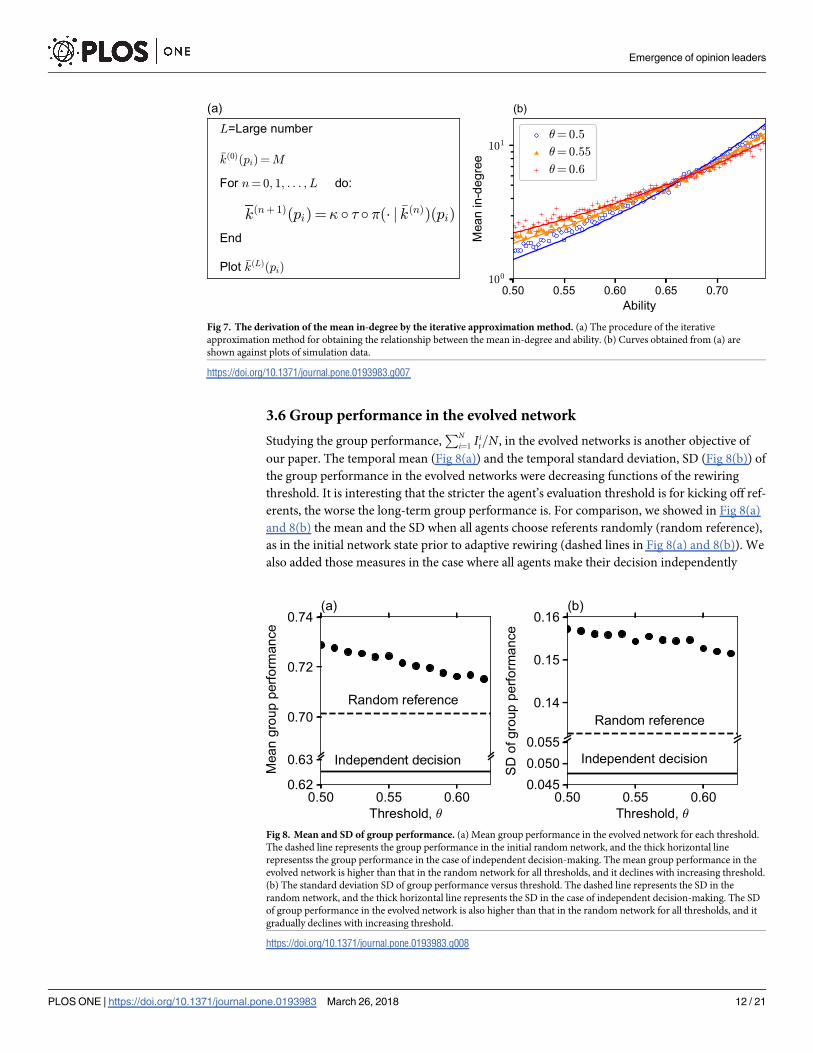
3.6 Group performance in the evolved network
Studying the group performance,PN
i¼1Iit=N, in the evolved networks is another objective of
our paper. The temporal mean (Fig 8(a)) and the temporal standard deviation, SD (Fig 8(b)) of
the group performance in the evolved networks were decreasing functions of the rewiring
threshold. It is interesting that the stricter the agent’s evaluation threshold is for kicking off ref-
erents, the worse the long-term group performance is. For comparison, we showed in Fig 8(a)
and 8(b) the mean and the SD when all agents choose referents randomly (random reference),
as in the initial network state prior to adaptive rewiring (dashed lines in Fig 8(a) and 8(b)). We
also added those measures in the case where all agents make their decision independently
Fig 7. The derivation of the mean in-degree by the iterative approximation method. (a) The procedure of the iterative
approximation method for obtaining the relationship between the mean in-degree and ability. (b) Curves obtained from (a) are
shown against plots of simulation data.
https://doi.org/10.1371/journal.pone.0193983.g007
Fig 8. Mean and SD of group performance. (a) Mean group performance in the evolved network for each threshold.
The dashed line represents the group performance in the initial random network, and the thick horizontal line
representss the group performance in the case of independent decision-making. The mean group performance in the
evolved network is higher than that in the random network for all thresholds, and it declines with increasing threshold.
(b) The standard deviation SD of group performance versus threshold. The dashed line represents the SD in the
random network, and the thick horizontal line represents the SD in the case of independent decision-making. The SD
of group performance in the evolved network is also higher than that in the random network for all thresholds, and it
gradually declines with increasing threshold.
https://doi.org/10.1371/journal.pone.0193983.g008
Emergence of opinion leaders
PLOS ONE | https://doi.org/10.1371/journal.pone.0193983 March 26, 2018 12 / 21
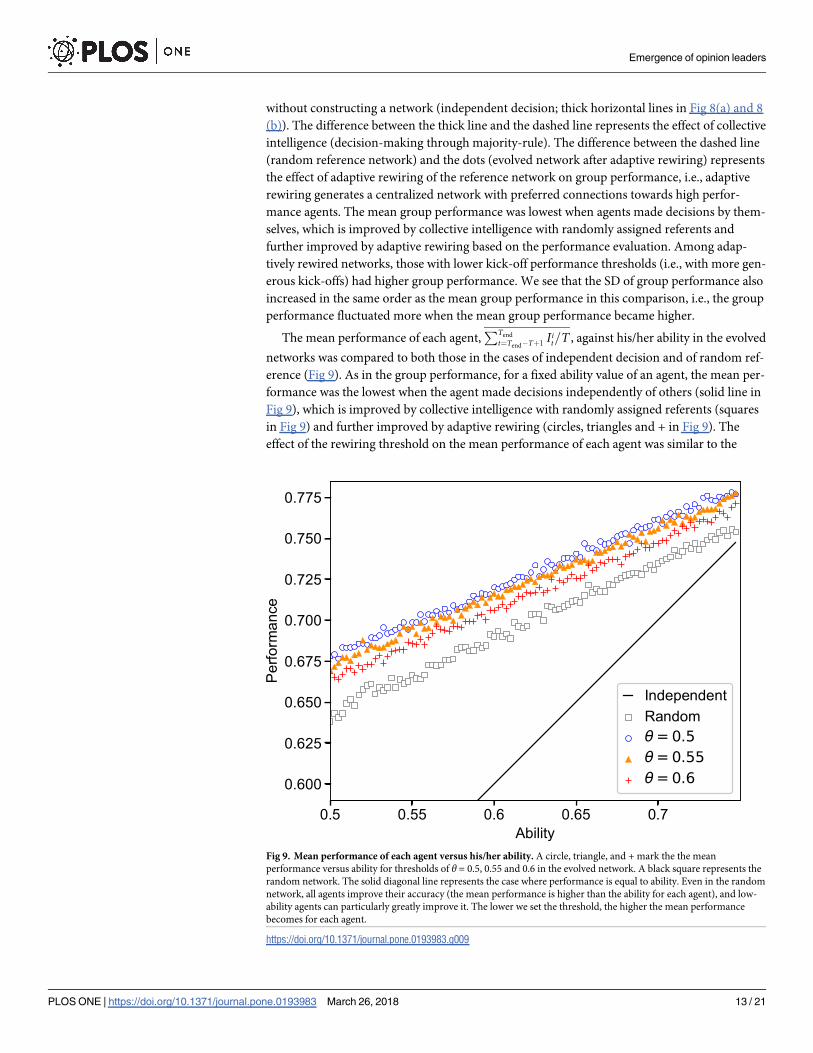
without constructing a network (independent decision; thick horizontal lines in Fig 8(a) and 8
(b)). The difference between the thick line and the dashed line represents the effect of collective
intelligence (decision-making through majority-rule). The difference between the dashed line
(random reference network) and the dots (evolved network after adaptive rewiring) represents
the effect of adaptive rewiring of the reference network on group performance, i.e., adaptive
rewiring generates a centralized network with preferred connections towards high perfor-
mance agents. The mean group performance was lowest when agents made decisions by them-
selves, which is improved by collective intelligence with randomly assigned referents and
further improved by adaptive rewiring based on the performance evaluation. Among adap-
tively rewired networks, those with lower kick-off performance thresholds (i.e., with more gen-
erous kick-offs) had higher group performance. We see that the SD of group performance also
increased in the same order as the mean group performance in this comparison, i.e., the group
performance fluctuated more when the mean group performance became higher.
The mean performance of each agent,PTend
t¼Tend� Tþ1Iit=T , against his/her ability in the evolved
networks was compared to both those in the cases of independent decision and of random ref-
erence (Fig 9). As in the group performance, for a fixed ability value of an agent, the mean per-
formance was the lowest when the agent made decisions independently of others (solid line in
Fig 9), which is improved by collective intelligence with randomly assigned referents (squares
in Fig 9) and further improved by adaptive rewiring (circles, triangles and + in Fig 9). The
effect of the rewiring threshold on the mean performance of each agent was similar to the
Fig 9. Mean performance of each agent versus his/her ability. A circle, triangle, and + mark the the mean
performance versus ability for thresholds of θ = 0.5, 0.55 and 0.6 in the evolved network. A black square represents the
random network. The solid diagonal line represents the case where performance is equal to ability. Even in the random
network, all agents improve their accuracy (the mean performance is higher than the ability for each agent), and low-
ability agents can particularly greatly improve it. The lower we set the threshold, the higher the mean performance
becomes for each agent.
https://doi.org/10.1371/journal.pone.0193983.g009
Emergence of opinion leaders
PLOS ONE | https://doi.org/10.1371/journal.pone.0193983 March 26, 2018 13 / 21
effect of the threshold on the mean group performance: a looser kick-off threshold led to a
higher performance. Fig 9 illustrates that the difference between independent decisions and
majority voting, either adaptive or not, was reflected in both the slope and the intercept of the
performance–ability relationship. However, the differences between the random and adaptive
networks and those among different rewiring thresholds were reflected only in their intercepts.
This leads to an interesting observation: agents with a lower ability were merited the most in
their performance by collective intelligence, and the performance of all agents was improved
fairly well by the adaptive rewiring irrespective of their ability.
To summarize, performance in the evolved network improved compared with the initial
random network or the case of independent decision-making. However, the group perfor-
mance fluctuated more in the evolved networks, and even more in those networks with higher
mean group performance. This implies that a highly “intelligent” population with improved
performance, though biased with reference to high-ability agents, can be at risk of a temporal
crash in group performance.
3.7 The effect of threshold on the unevenness in in-degrees
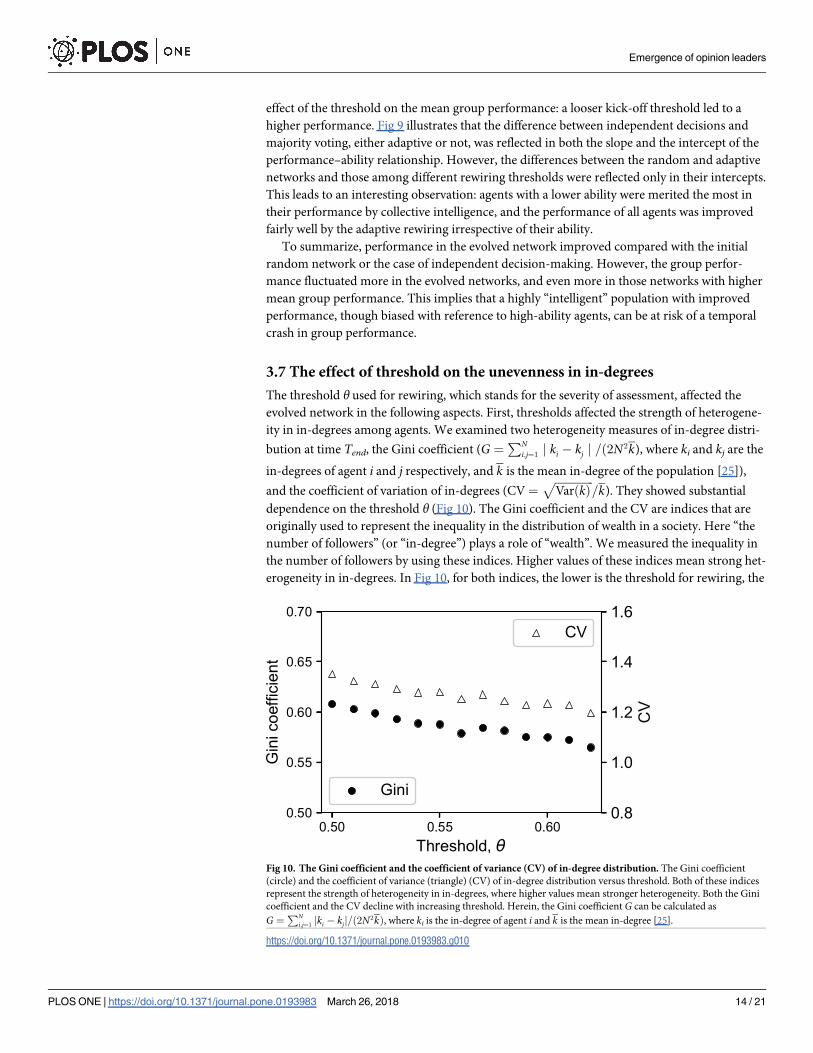
The threshold θ used for rewiring, which stands for the severity of assessment, affected the
evolved network in the following aspects. First, thresholds affected the strength of heterogene-
ity in in-degrees among agents. We examined two heterogeneity measures of in-degree distri-
bution at time Tend, the Gini coefficient (G ¼PN
i;j¼1j ki � kj j =ð2N2k), where ki and kj are the
in-degrees of agent i and j respectively, and k is the mean in-degree of the population [25]),
and the coefficient of variation of in-degrees (CV¼ffiffiffiffiffiffiffiffiffiffiffiffiffiffiVarðkÞ
p=k). They showed substantial
dependence on the threshold θ (Fig 10). The Gini coefficient and the CV are indices that are
originally used to represent the inequality in the distribution of wealth in a society. Here “the
number of followers” (or “in-degree”) plays a role of “wealth”. We measured the inequality in
the number of followers by using these indices. Higher values of these indices mean strong het-
erogeneity in in-degrees. In Fig 10, for both indices, the lower is the threshold for rewiring, the
Fig 10. The Gini coefficient and the coefficient of variance (CV) of in-degree distribution. The Gini coefficient
(circle) and the coefficient of variance (triangle) (CV) of in-degree distribution versus threshold. Both of these indices
represent the strength of heterogeneity in in-degrees, where higher values mean stronger heterogeneity. Both the Gini
coefficient and the CV decline with increasing threshold. Herein, the Gini coefficient G can be calculated as
G ¼PN
i;j¼1jki � kjj=ð2N2kÞ, where ki is the in-degree of agent i and k is the mean in-degree [25].
https://doi.org/10.1371/journal.pone.0193983.g010
Emergence of opinion leaders
PLOS ONE | https://doi.org/10.1371/journal.pone.0193983 March 26, 2018 14 / 21
higher are the values of these indices. Therefore, both of these two indices show that a lower
threshold for rewiring generates stronger inequality in the evolved in-degree distribution.
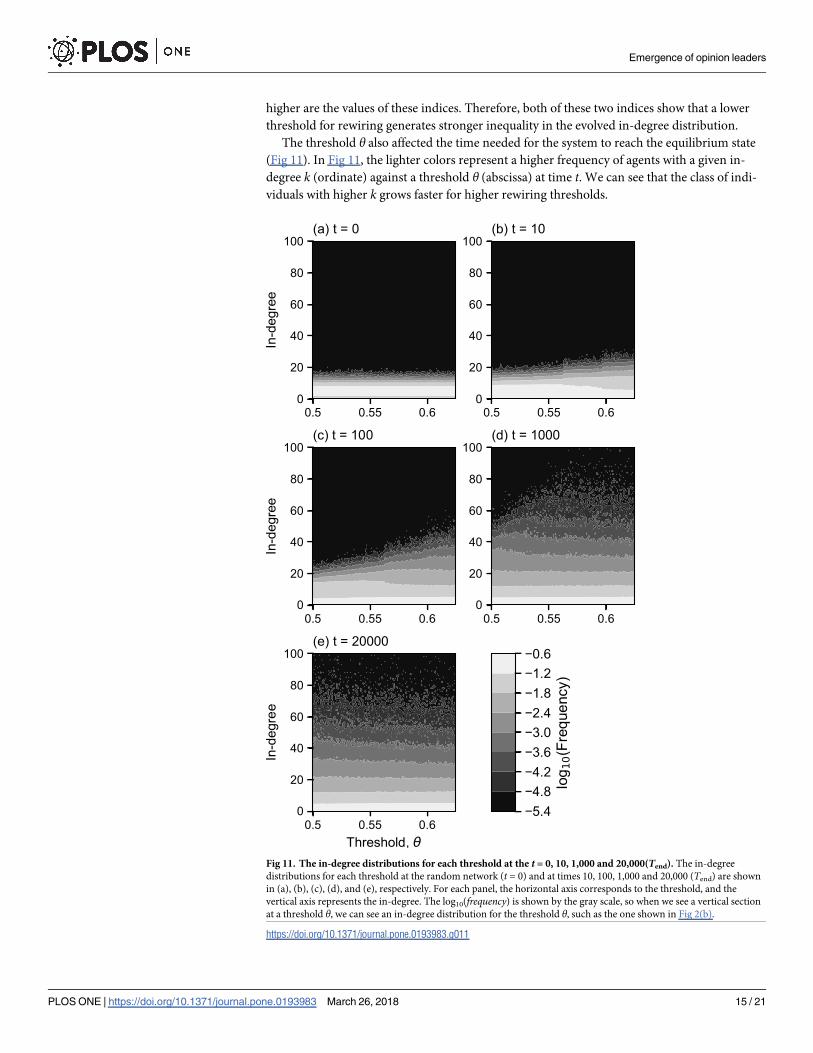
The threshold θ also affected the time needed for the system to reach the equilibrium state
(Fig 11). In Fig 11, the lighter colors represent a higher frequency of agents with a given in-
degree k (ordinate) against a threshold θ (abscissa) at time t. We can see that the class of indi-
viduals with higher k grows faster for higher rewiring thresholds.
Fig 11. The in-degree distributions for each threshold at the t = 0, 10, 1,000 and 20,000(Tend). The in-degree
distributions for each threshold at the random network (t = 0) and at times 10, 100, 1,000 and 20,000 (Tend) are shown
in (a), (b), (c), (d), and (e), respectively. For each panel, the horizontal axis corresponds to the threshold, and the
vertical axis represents the in-degree. The log10(frequency) is shown by the gray scale, so when we see a vertical section
at a threshold θ, we can see an in-degree distribution for the threshold θ, such as the one shown in Fig 2(b).
https://doi.org/10.1371/journal.pone.0193983.g011
Emergence of opinion leaders
PLOS ONE | https://doi.org/10.1371/journal.pone.0193983 March 26, 2018 15 / 21

The exponential increase of the mean in-degree kðpÞ against ability p is also affected by the
threshold θ (Fig 3). This nonlinearity in kðpÞ became stronger as the rewiring threshold θdecreased. Our analytical formula for the relationship between an agent’s mean in-degree and
ability (Eqs (8) and (9)) shows that the strongly biased links towards the agents of high ability
is due to the nonlinear dependence of the mean duration that an agent keeps a follower on
their performance. We have already seen that the extent to which the mean duration increased
with performance was stronger for lower thresholds (Figs 5(b) and 6). These results can be also
seen in Fig 12, which shows that the mean ability of referents (averaged over those who are
being referred), p� ¼PN
i¼1pikðpiÞ=ðNMÞ, was a decreasing function of the rewiring threshold.
This implies that the more the agents seek better referents, the lower is the mean ability of ref-
erents. These apparently counterintuitive results are discussed in Section 4.
The group performance and the performance of each agent also differed by the threshold.
The mean group performance and the performance of each agent became better as the thresh-
old θ decreased (Figs 8(a) and 9). The SD of the group performance, i.e., the fluctuation of the
group performance, also increased as the threshold θ decreased (Fig 8(b)).
Therefore, when we set the threshold lower, the heterogeneity in in-degrees became stron-
ger, and reference links were biased more toward higher ability agents. At the same time, we
also see that the group performance became better on average, though its temporal fluctuation
became greater. We discuss the reason why these results hold in the following Section 4.
4 Discussion
In this paper, we have shown that the reference structure of agents who try to make correct
answers by referring to credible agents self-organized into a heterogeneous structure with an
exponential in-degree distribution [26]. The mean in-degree increased exponentially with abil-
ity. Therefore small difference in ability can lead to large difference in the number of followers
in the evolved network. Our analytical calculation shows that it was the mean duration of an
agent to be kept linked by a follower that increased exponentially with his/her performance.
The performance-monitoring process in our model generated this nonlinear relationship
between performance and mean duration.
Fig 12. The mean ability of referents in the evolved network versus threshold. The lower we set the threshold, the
more the mean ability of referents increases.
https://doi.org/10.1371/journal.pone.0193983.g012
Emergence of opinion leaders
PLOS ONE | https://doi.org/10.1371/journal.pone.0193983 March 26, 2018 16 / 21
We also looked at the performance of each agent and that of the group in the evolved net-
work and compared them to those in the random network. The mean performance of each
agent and the mean group performance improved in the evolved network through adaptive
rewiring compared with the random network. However, the fluctuation of the group perfor-
mance in the evolved network was larger than the one in the random network. We discuss this
trade-off later in this section.
In addition, we found that the threshold for rewiring, that is the extent of severity, affected
the strength of heterogeneity in the in-degrees in the evolved network. When we set the thresh-
old lower, the heterogeneity in the in-degrees became larger, and at the same time, the depen-
dence of an agent’s mean in-degree on his/her ability was more exaggerated, i.e., agents refer
more to higher ability agents in the evolved network, and the mean ability of referents
increases. This leads to a higher mean performance of each agent compared with when the
threshold was larger, i.e., when the mean ability of referents was lower. Actually, in our deriva-
tion of the mean performance explained in Section 3.2 and Section A in S1 Text, which pre-
dicts the simulation result well, we can show that the mean performance of each agent is an
increasing function of the mean ability of referents (Section B in S1 Text). However, it is a little
against our intuition that agents result in referring to higher ability agents when we set the
threshold lower (i.e., when they were more generous to their referents) than when we set it
higher (when they were stricter regarding their referents). We interpret this counterintuitive
phenomenon as follows. A lower rewiring threshold makes each agent more patient and lowers
the desire to kick-off low-ability referents. However, at the same time, a lower threshold con-
tributes to keeping high-ability referents more securely, because a lower rewiring threshold
leads to a longer duration for referent-monitoring, leading to a better overall sorting of refer-
ent’s quality. From our computer simulations, we find that the later effect is stronger. There-
fore, in our model, a lower rewiring threshold contributes to generating a more biased
reference toward high-ability agents. This result in our study can be tested by an empirical
study comparing the generosity of societies and their accuracy in decision-making. For exam-
ple, we may compare a group in which rewiring occurs easily (that may correspond to a high
threshold in our model) such as a group of individuals connected by a social network service,
with a group in which rewiring is difficult (that may correspond to a low threshold in our
model) such as a group of individuals in a company who are connected tightly, to examine
which group can predict the next political leader more accurately.
As we showed so far, how long one can keep a follower greatly affects the structure of the
evolved network. The extent to which people in the society attach importance to the current
result as compared to the referent’s past is measured by the parameter α. Its reciprocal, 1/α,
gives the mean time an individual remembers a success or a failure of its referent. Indeed, the
change in the evaluated performance of the referent, yijt , per each time step is proportional to
α: Dyijt ¼ yijtþ1 � yijt ¼ aðIjtþ1 � yijt Þ. In the numerical simulations of this paper, we set α = 0.1.
As α becomes larger, the agent’s evaluation becomes less dependent on the past and more
heavily dependent on the immediate success or failure. This makes the evaluation of followers’
performance less reliable. Therefore, a larger αmakes it difficult to sort subtle difference in
performance between the referents, resulting in weaker centralization of links toward high
ability agents and low performance. The effect of the kick-off threshold θ on group perfor-
mance would also become less pronounced because of the less reliable performance evaluation.
Conversely, if α becomes smaller, the evaluation for the performance of referents would
become more reliable. However, this raises another problem for a society, because the time
required for the referent network to reach an equilibrium, in other words, to acquire high
Emergence of opinion leaders
PLOS ONE | https://doi.org/10.1371/journal.pone.0193983 March 26, 2018 17 / 21
centralization, would become too long. In fact, we confirmed those predictions on the effect of
α by computer simulations for several values of α. The results are shown in S2 Text.
There are several trade-offs in our model that affect the understanding of the quality of
decision-making by agents who are interacting with one another. First, when we set a lower
rewiring threshold, we have to wait longer until the network reaches the equilibrium state
where agents have higher mean performance. Thus, we can see a kind of speed–accuracy trade-off here. Second, along with stepwise rises of the group performance from independent deci-
sion, to random references in the initial state, and then to the high-ability-agent-oriented
evolved networks, the SD of the group performance also increased, i.e., the fluctuation became
larger in this order. When we set the threshold lower, we saw again an increase in both the
mean and the SD of the group performance in the evolved network. Therefore, an increase in
both the mean and the “stability” (suppression of fluctuation) are difficult to be compatible.
High-ability agents collect more followers in the evolved network than in the initial network;
the same is true for the evolved network of a low threshold compared with that with a high
threshold. Adaptive rewiring and a lower kick-off threshold level lead to higher mean perfor-
mance. However, this is due to a more intense concentration of reference links to high ability
agents (Section B in S1 Text). This polarization seems to be the reason for the larger fluctuation
of the group performance. The agents who attract many followers tend to be the agents with
high ability and high performance. However, there are of course cases in which high-ability
agents give wrong answers. In such an occasion of failure by agents of high influence, the
group performance results in a very low value, which results in the group performance fluctu-
ating wildly.
We have examined only a few types of distribution of agent’s ability in the population,
which gives the seeds for the generation of a heterogeneous in-degree distribution through
adaptive rewiring. Actually, we assumed two types of ability distributions—one is in the cur-
rent study, the uniform distribution, and the other is shown in Section E in S1 Text. The den-
sity distribution of ability shown in Section E in S1 Text is a linear decreasing function on the
interval [0.5, 0.75]. Although both forms of ability distribution yielded exponential in-degree
distributions against varying ability, the robustness of the results for the other forms of ability
distributions should be tested in the future.
Lastly, we discuss possible modifications of our model. In our model, we assumed that a
new link comes randomly regardless of his/her ability value. This was based on the idea that
one cannot know the status of strangers —this may be true in some cases in our society. For
example, in a population of analysts where a lead-follow relationship (references) exists, a
financial analyst may not be able to evaluate the correctness of the analysts whom he/she is not
directly following. In such situations, the only thing that an agent can do to improve his/her
own performance is to replace an already connected referent who did not give correct answers,
with a new referent randomly chosen from the population [27] as we assumed in our model.
Actually, an empirical work on a social network in a university [27] shows that such global
rewiring is commonly found in a group of individuals sharing the same interaction focus (in
our case, making decisions for the same problem). However, it may also be possible to intro-
duce “reputation” into our model; i.e., we may assume that the probability of being newly cho-
sen as a referent depends on one’s ability or performance, which is recognized by others in
some way such as via reputation. We predict that, under this assumption, we will obtain a
scale-free network, which represents strong heterogeneity. Several reasons support this predic-
tion. There are a number of studies that explain how scale-free networks are constructed. The
“good get richer” mechanism (or fitness model) is one such explanation [23, 24, 28]. In the
models using the “good get richer” mechanism, each agent is assigned a value, such as fitness,and the probability that one can obtain a link is determined based on the fitness value. In these
Emergence of opinion leaders
PLOS ONE | https://doi.org/10.1371/journal.pone.0193983 March 26, 2018 18 / 21

models, strong heterogeneity with a power-law degree distribution emerges even if the fitness
is not power-law distributed. The fitness in such models corresponds to the ability component
in our model. Thus, we can predict that we will obtain a scale-free network if the probability of
being newly chosen depends directly on one’s ability or on one’s performance. It is not clear
whether a population can achieve high performance under a structure that evolved in the pres-
ence of “reputation” and whether it has high heterogeneity and/or a strong opinion correla-
tion. In addition, we think that the following issue is worth considering in future. In our study,
we assumed that all agents follow the same strategy for decision-making and have the same
rewiring threshold. With these simple assumptions, we were able to reveal what is the primar-
ily factor leading to the centralization of reference networks, and to discuss the decision accu-
racy in the self-organized reference structure. A possible next step would be to analyze the
model that allows ability-dependent strategy for each agent, as higher ability agents may have
less motivation for referring to others than lower ability agents. If so, the presence of such
independent decision makers would improve the efficiency of collective intelligence in the
population [29].
Supporting information
S1 Text. Detailed explanation about analytical and numerical calculation in the main text.
(PDF)
S2 Text. The effect of the parameter α that represents the extent to which an agent attaches
importance to the immediate past result in evaluating the performance of referents.
(PDF)
Acknowledgments
We thank Prof. Naoki Masuda, and Drs. Mitsuhiro Nakamura and Takuya Sekiguchi for their
valuable comments. MII is grateful to Yu Uchiumi and Dr. Koichi Saeki for their help with
coding. HO acknowledges the support from the JSPS KAKENHI (16H06324). This work was
supported in part by the Center for the Promotion of Integrated Sciences (CPIS) of
SOKENDAI.
Author Contributions
Conceptualization: Mariko I. Ito, Hisashi Ohtsuki, Akira Sasaki.
Data curation: Mariko I. Ito.
Formal analysis: Mariko I. Ito, Hisashi Ohtsuki, Akira Sasaki.
Funding acquisition: Hisashi Ohtsuki, Akira Sasaki.
Investigation: Mariko I. Ito, Hisashi Ohtsuki, Akira Sasaki.
Methodology: Mariko I. Ito, Hisashi Ohtsuki, Akira Sasaki.
Project administration: Mariko I. Ito, Hisashi Ohtsuki, Akira Sasaki.
Resources: Hisashi Ohtsuki, Akira Sasaki.
Software: Mariko I. Ito.
Supervision: Hisashi Ohtsuki, Akira Sasaki.
Validation: Mariko I. Ito, Hisashi Ohtsuki, Akira Sasaki.
Emergence of opinion leaders
PLOS ONE | https://doi.org/10.1371/journal.pone.0193983 March 26, 2018 19 / 21
Visualization: Mariko I. Ito.
Writing – original draft: Mariko I. Ito.
Writing – review & editing: Mariko I. Ito, Hisashi Ohtsuki, Akira Sasaki.
References1. Bikhchandani S, Hirshleifer D, Welch I. A Theory of Fads, Fashion, Custom, and Cultural Change as
Informational Cascades. J Polit Econ. 1992; 100(5):992–1026. https://doi.org/10.1086/261849
2. Moussaid M, Garnier S, Theraulaz G, Helbing D. Collective Information Processing and Pattern Forma-
tion in Swarms, Flocks, and Crowds. Top Cogn Sci. 2009; 1(3):469–497. https://doi.org/10.1111/j.1756-
8765.2009.01028.x PMID: 25164997
3. Dall SRX, Giraldeau LA, Olsson O, McNamara JM, Stephens DW. Information and its use by animals in
evolutionary ecology. Trends Ecol Evol. 2005; 20(4):187–193. https://doi.org/10.1016/j.tree.2005.01.
010 PMID: 16701367
4. Lorenz J, Rauhut H, Schweitzer F, Helbing D. How social influence can undermine the wisdom of crowd
effect. Proc Natl Acad Sci USA. 2011; 108(22):9020–9025. https://doi.org/10.1073/pnas.1008636108
PMID: 21576485
5. Ladha KK. The Condorcet Jury Theorem, Free Speech, and Correlated Votes. Am J Polit Sci. 1992; 36
(3):617–634. https://doi.org/10.2307/2111584
6. Kao AB, Couzin ID. Decision accuracy in complex environments is often maximized by small group
sizes. Proc R Soc B. 2014; 281 (1784). https://doi.org/10.1098/rspb.2013.3305
7. King AJ, Cheng L, Starke SD, Myatt JP. Is the true ‘wisdom of the crowd’ to copy successful individuals?
Biol Lett. 2012; 8(2):197–200. https://doi.org/10.1098/rsbl.2011.0795 PMID: 21920956
8. Cooper RA, Day TE, Lewis CM. Following the leader:: a study of individual analysts’ earnings forecasts.
J Financ Econ. 2001; 61(3):383–416. https://doi.org/10.1016/S0304-405X(01)00067-8
9. Booth L, Chang B, Zhou J. Which Analysts Lead the Herd in Stock Recommendations? J Account Audit
Finance. 2014; 29(4):464–491. https://doi.org/10.1177/0148558X14537825
10. Ramnath S, Rock S, Shane P. The financial analyst forecasting literature: A taxonomy with suggestions
for further research. Int J Forecasting. 2008; 24(1):34–75. https://doi.org/10.1016/j.ijforecast.2007.12.
006
11. Clement MB, Tse SY. Financial Analyst Characteristics and Herding Behavior in Forecasting. J
Finance. 2005; 60(1):307–341. https://doi.org/10.1111/j.1540-6261.2005.00731.x
12. Hirshleifer D, Hong Teoh S. Herd Behaviour and Cascading in Capital Markets: a Review and Synthe-
sis. Eur Financ Manag. 2003; 9(1):25–66. https://doi.org/10.1111/1468-036X.00207
13. Kim Y, Lobo GJ, Song M. Analyst characteristics, timing of forecast revisions, and analyst forecasting
ability. J Bank Financ. 2011; 35(8):2158–2168. https://doi.org/10.1016/j.jbankfin.2011.01.006
14. Guttman I. The Timing of Analysts’ Earnings Forecasts. Account Rev. 2010; 85(2):513–545. https://doi.
org/10.2308/accr.2010.85.2.513
15. Zhao Z, Zhang Y, Feng X, Zhang W. An analysis of herding behavior in security analysts’ networks.
Physica A. 2014; 413:116–124. https://doi.org/10.1016/j.physa.2014.06.082
16. Benczik IJ, Benczik SZ, Schmittmann B, Zia RKP. Opinion dynamics on an adaptive random network.
Phys Rev E. 2009; 79:046104. https://doi.org/10.1103/PhysRevE.79.046104
17. Nitzan S. Collective preference and choice. Cambridge: Cambridge University Press; 2009.
18. Gross T, Blasius B. Adaptive coevolutionary networks: a review. J R Soc Interface. 2008; 5(20):259–
271. https://doi.org/10.1098/rsif.2007.1229 PMID: 17971320
19. Castellano C, Fortunato S, Loreto V. Statistical physics of social dynamics. Rev Mod Phys. 2009;
81:591–646. https://doi.org/10.1103/RevModPhys.81.591
20. Perc M, Szolnoki A. Coevolutionary games—A mini review. Biosystems. 2010; 99(2):109–125. https://
doi.org/10.1016/j.biosystems.2009.10.003 PMID: 19837129
21. Li W, Zhang X, Hu G. How scale-free networks and large-scale collective cooperation emerge in com-
plex homogeneous social systems. Phys Rev E. 2007; 76:045102. https://doi.org/10.1103/PhysRevE.
76.045102
22. Anghel M, Toroczkai Z, Bassler KE, Korniss G. Competition-Driven Network Dynamics: Emergence of
a Scale-Free Leadership Structure and Collective Efficiency. Phys Rev Lett. 2004; 92:058701. https://
doi.org/10.1103/PhysRevLett.92.058701 PMID: 14995348
Emergence of opinion leaders
PLOS ONE | https://doi.org/10.1371/journal.pone.0193983 March 26, 2018 20 / 21
23. Garlaschelli D, Capocci A, Caldarelli G. Self-organized network evolution coupled to extremal dynam-
ics. Nat Phys. 2007; 3(11):813–817. https://doi.org/10.1038/nphys729
24. Zhou T, Medo M, Cimini G, Zhang ZK, Zhang YC. Emergence of Scale-Free Leadership Structure in
Social Recommender Systems. PLOS ONE. 2011; 6(7):e20648. https://doi.org/10.1371/journal.pone.
0020648 PMID: 21857891
25. Cowell F. Measuring inequality. Oxford: Oxford University Press; 2011.
26. Albert R, Barabasi AL. Statistical mechanics of complex networks. Rev Mod Phys. 2002; 74:47–97.
https://doi.org/10.1103/RevModPhys.74.47
27. Kossinets G, Watts DJ. Empirical analysis of an evolving social network. Science. 2006; 311(5757):
88–90. https://doi.org/10.1126/science.1116869 PMID: 16400149
28. Caldarelli G, Capocci A, De Los Rios P, Muñoz MA. Scale-Free Networks from Varying Vertex Intrinsic
Fitness. Phys Rev Lett. 2002; 89:258702. https://doi.org/10.1103/PhysRevLett.89.258702 PMID:
12484927
29. Madirolas G, de Polavieja GG. Improving collective estimations using resistance to social influence.
PLoS computational biology. 2015; 11(11):e1004594. https://doi.org/10.1371/journal.pcbi.1004594
PMID: 26565619
Emergence of opinion leaders
PLOS ONE | https://doi.org/10.1371/journal.pone.0193983 March 26, 2018 21 / 21