Embed Size (px)
Citation preview
Atmos. Meas. Tech., 4, 557–570, 2011www.atmos-meas-tech.net/4/557/2011/doi:10.5194/amt-4-557-2011© Author(s) 2011. CC Attribution 3.0 License.
AtmosphericMeasurement
Techniques
A comparison of light backscattering and particle size distributionmeasurements in tropical cirrus clouds
F. Cairo1, G. Di Donfrancesco2, M. Snels1, F. Fierli1, M. Viterbini 1, S. Borrmann3,4, and W. Frey3
1Istituto di Scienze dell’Atmosfera e del Clima, Consiglio Nazionale delle Ricerche, Roma, Italy2Ente Nazionale per le Nuove tecnologie, l’Energia e l’Ambiente, Frascati, Italy3Institute of Atmospheric Physics, University of Mainz, Mainz, Germany4Max-Planck Institute for Chemistry, Particle Chemistry Department, Mainz, Germany
Received: 6 May 2010 – Published in Atmos. Meas. Tech. Discuss.: 9 September 2010Revised: 22 December 2010 – Accepted: 1 March 2011 – Published: 17 March 2011
Abstract. An FSSP-100 Optical Particle Counter designedto count and size particles in the micron range and abackscattersonde that measures in-situ particle optical prop-erties such as backscatter and depolarization ratio, are part ofthe payload of the high altitude research aircraft M55 Geo-physica. This aircraft was deployed in tropical field cam-paigns in Bauru, Brasil (TROCCINOX, 2004) Darwin, Aus-tralia (SCOUT-Darwin, 2005) and Ouagadougou, BurkinaFaso (SCOUT-AMMA, 2006). In those occasions, mea-surements of particle size distributions and optical prop-erties within cirrus cloud were performed. Scope of thepresent work is to assess and discuss the consistency betweenthe particle volume backscatter coefficient observed by thebackscattersonde and the same parameter retrieved by opti-cal scattering theory applied to particle size distributions asmeasured by the FSSP-100. In addition, empirical relation-ships linking the optical properties measured in-situ by thebackscattersonde, which generally can be obtained by remotesensing techniques (LIDAR), and microphysical bulk prop-erties like total particle number, surface and volume densitywill be presented and discussed.
1 Introduction
Cirrus clouds are a fundamental component of the climatesystem (Liou, 1986), due to their pivotal role in the waterbalance and in the radiative properties of the atmosphere,
Correspondence to:F. Cairo([email protected])
impacting both its thermal structure and dynamics. Satelliteobservations have provided a global picture of their distri-bution, that basically follows cloud activity, i.e. deep con-vection in the tropics and frontal zones in midlatitudes. Inthe tropics their occurrence tends to concentrate near thetropopause level, with a thickness from a few tens of me-ters to few kilometers, horizontal homogeneity extending tothousands of kilometers and lifetimes that can reach days.Tropical cirrus clouds have raised a particular interest for therole they play in the chemical processing and dehydration ofair entering the tropical lower stratosphere and for their con-tribution to the radiative balance of the Tropical TropopauseLayer (Hartmann et al., 2001; Holton and Gettelman, 2001;Luo et al., 2003; Corti et al., 2006). Because of their oftensmall optical depths, ground based lidars are suitable instru-ments for cirrus characterization. High tropical cirrus werefirst reported byUthe and Russell(1976) who observed cir-rus clouds between 12 and 18 km, from the ground lidar sta-tion at Kwajalein (8.7◦ N, 167.7◦ E). Since then, a molteplic-ity of lidar studies characterized cirrus morphology, oftenin conjunction with other remote sensing instruments as in-frared radiometers or millimeter radars (Platt et al., 1998;Comstock and Sassen, 2001; Wang et al., 2001; Pace et al.,2003; Immler et al., 2007).
In parallel, aircraft campaigns have been conducted toprovide their in-situ characterization. In-situ measurementsin the upper tropical troposphere have been discussed byHeymsfield(1986), who reported ice crystals with sizes up to50 µm andKnollenberg et al.(1993) who observed high con-centrations of ice crystals (≥10 cm−3) in the anvils of trop-ical convective systems.McFarquhar et al.(2004) have re-ported maximum ice crystal sizes of between 30 and 140 µm
Published by Copernicus Publications on behalf of the European Geosciences Union.

558 F. Cairo et al.: Backscattering and size distribution comparison
and modal radius of few tens of µm on a similar thin subvis-ible cirrus layer over the tropical central Pacific. Size distri-butions of cirrus clouds in the upper tropical troposphere, ex-hibiting size diameters with pronounced peak at 10 µm, havebeen reported byThomas et al.(2002), presenting observa-tions taken on board the high altitude research aircraft M55Geophysica. Ultrathin tropical tropospheric clouds (UTTC)were observed directly beneath the tropical tropopause, char-acterised by a very low ice crystal number concentration(0.05 cm−3), and a size diameters modal peak of 10 to 12 µm(Peter et al., 2003).
De Reus et al.(2009) reported cirrus measurements show-ing a peak in the ice crystal number size distribution at about10 µm diameter, whileLawson et al.(2008) reported sub-visible cirrus observations from Costa Rica with average val-ues of ice particle number concentration (0.066 cm−3), andeffective radius (8.82 µm) similar to those byMcFarquhar etal. (2004).
The observations performed from the M55 Geophysica,hosting a backscattersonde and an instrumental set for par-ticle counting and sizing, represent a unique dataset linkingin-situ observations of both microphysical properties and op-tical parameters of cirrus clouds usually obtained by remotesensing lidars. One of the geophysical observables of theelastic lidar technique is the particle volume backscatteringcoefficient. The backscattersonde offers an advantage withrespect to the lidar, whose measurement of backscattering isaffected by the molecular and particle extinction along thelaser optical path. In fact, the molecular extinction can beevaluated by the Rayleigh scattering theory from measure-ment of air density, or from a suitable atmospheric model,while the particle contribution to backscattering and extinc-tion coefficients is unknown. Both quantities are present inthe lidar equation and have to be retrieved from measure-ments. Different inversion techniques have been reported inthe literature to properly account for that effect (Klett , 1981;Fernald, 1984; Young, 1995), all assuming some a priorirelationship between particle backscattering and extinction.Such assumption is itself a source of uncertainty for the lidarderived particle backscatter coefficient (Russell et al., 1979).Attenuation is, on the contrary, of no concern in backscat-tersonde measurements: the instrument performs opticallyunattenuated in-situ measurements. Obviously, once the ef-fect of attenuation has properly been taken into account in thelidar inversion, the lidar retrieved backscattering coefficientshould attain – within its limits of accuracy and precision –that same value possibly measured in situ by a backscatter-sonde.
The possibility of connecting quantities that could beremotely observed with in-situ cirrus characterization hasdriven this work, whose aim is to assess and discuss the con-sistency between the particle volume backscatter coefficientβ observed by the backscattersonde and the same parametercomputed by optical scattering theory applied to the size dis-tributions measured by the optical particle counter and sizer.
Empirical relationships betweenβ and the bulk microphysi-cal parameters of the size distribution, such as total numberof particles, surface and volume densities, will be presentedand discussed.
2 Instrumentation and methods
2.1 Instruments and measurements
The M55 Geophysica is equipped with a complete set ofinstrumentation for the in-situ chemical and microphysicalcharacterisation of the sampled airmass, including conden-sation nuclei counters, optical counters and sizers, particleimagers, hygrometers and chemical analyzers.
An optical particle counter FSSP-SPP-100 is located in aboom beneath the left wing of the aircraft, facing forward,while the backscattersonde is in a bay beneath the pilot’scockpit, facing sideways on the right. The separation be-tween the airmasses sampled by the two instruments is onlya few metres and the two instruments can thus be consideredto perform simultaneous co-located in situ observations.
The backscattersonde MAS (Multiwavelength AerosolScatterometer) (Buontempo et al., 2006; Cairo et al., 2004)emits polarized laser light at 532 nm and at 1064 nm and col-lects the light backscattered from the portion of atmospherein close proximity (3–10 m) to the instrument, so it acts as adetector of optically detectable (i.e. whose diameter is greaterthan few tenths of µm) cloud particles and aerosols. Polariza-tion resolved light backscattering observations allow to dis-criminate particle shape, hence thermodynamical phase. Theinstrument is basically an elastic lidar system that measuresin-situ, i.e. at few metres from the mounting platform, thesame atmospheric parameters which are accessible to remotesensing ground based lidar investigations, i.e. depolarizationratioδ, backscatter ratioR and color indexC (Matthias et al.,2004; Bockmann et al., 2004; Pappalardo et al., 2004).
The sampling volume is approximatively 10−3 m−3, theresolution is 5 s, corresponding to 1 km horizontal resolutionalong the aircraft trajectory, given the average 200 m s−1 air-craft speed. The backscatter ratioR =(β+βm) / βm whereβm
is the molecular backscattering coefficient, is retrieved fromthe backscattered light signalP by a calibration procedurethat uses the pressurep and temperatureT in the state equa-tion of the ideal gas to retrieve the air density, and defines asuitable constantK – taking into account the molecular scat-tering cross section as well as the instrumental sensitivity - inorder to ensure thatR =K · P · (p/T ) equals 1 in airmasseswhere no particles are present. A total Backscatter Ratio hasbeen computed by summing its parallel and cross compo-nents, with respect to the polarization of the emitted laserlight.
The particle volume backscattering coefficient is definedas β =
∫∞
0 n(r)·drσπ (r)·nndr, whereσπ (r) is the parti-cle backscattering cross section andn(r) is the particle size
Atmos. Meas. Tech., 4, 557–570, 2011 www.atmos-meas-tech.net/4/557/2011/
F. Cairo et al.: Backscattering and size distribution comparison 559
distribution, defined as the number of particles, in a givenvolume, whose radius is within the limitsr andr + dr. Thisquantity can be retrieved from the experimentally determinedR by the following expression (Collis and Russell, 1976):
β = (R − 1) · (p
T) · Cλ × 10−9 m−1 sr−1 (1)
where C532nm= 4.508 andC1064nm= 0.280 whenp is ex-pressed inPa andT in K. In our case,p andT are pro-vided by the M55 avionic data system. Taking into accountthe uncertainties inP , p, T and in the calibration procedure,the backscattering coefficient at 532 nm, the one we haveused in our study, has a precision of 10% and an accuracyof 5× 10⁻⁹ m−1 sr−1, in the worse case when observationsare taken at 21 km of altitude, which is the Geophysica ceil-ing level.
The optical particle counter FSSP-SPP-100 detects andsizes particles by measuring the forward scattered laser lightof single particles within a scattering angle of 4◦–12◦ withina sampling volume of approximately 10−6 m3, detectingparticles whose diameters are roughly between 2.7 µm and31 µm. The time resolution of the FSSP can be made as smallas 2 s, if sufficient counting statistics is available, i.e. in thickclouds.
Using optical scattering theory, the size of a particle isrelated to the measured scattering cross section. The par-ticle size distributionn(r) is approximated by a histogramni =n(r;1ri) defined as the numbers of particles whose ra-dius is within a set of size bins1ri = (ri, ri + 1i). In prin-ciple the histogram may consist of up to 40 unequal size bins,but this resolution is usually reduced to below 10 bins (7 inthe present study) to overcome ambiguities linked to the rela-tionship between light scattering intensity and particle size,which is not always univocal, and to increase the countingstatistics in the single bin. The uncertainties of the num-ber concentrations reported by the FSSP are determined bythe uncertainty of the sample volume (approximately 20%)and mostly by poor counting statistics at low number densi-ties like those encountered in thin or subvisual cirrus clouds(Thomas et al., 2002). To increase counting statistics, dataare averaged over 10 s in cirrus clouds, or to several minutesin clear air. From the histogram, the total particle numberN ,surfaceS and volume densityV can be retrieved, as well asa particle effective radiusreff = V/S.
The FSSP instrument has been extensively used in air-borne cloud research since many decades (Dye and Baum-gardner, 1984). The version on board the Geophysica hasbeen modified by implementing digital signal processor elec-tronics (DMT Inc, Boulder, Colorado, USA) and specificchanges necessary for the ambiental conditions encounteredin the upper troposphere and lower stratosphere.
Both instruments have been deployed in tropical cam-paigns: during February 2006 in Bauru, Brasil, in the frame-work of the EU funded project TROCCINOX (Schumann,2005), during November 2005 in Darwin, Australia, in the
framework of the EU funded project SCOUT-O3 (Brunner etal., 2009) and during August 2006 in Ouagadougou, BurkinaFaso, in the framework of the EU funded projects SCOUT-O3 and AMMA joint activities (Cairo et al., 2010).
Ten M55 Geophysica flights were chosen for the presentanalysis, when simultaneous measurements of optical param-eters and size spectra were acquired in significant portions offlight time spent within cirrus clouds. These were identi-fied as regions above 10 000 m, where appreciable backscat-tering (≥1.02) and depolarization (≥10%) were observed.Roughly 7000 s of observations came from the TROCCI-NOX campaign, 5000 s from the SCOUT-AMMA dataset,while 21 000 s were from the SCOUT-Darwin campaign.The time series of the two instruments were interpolated to acommon 10 s resolution time grid, corresponding to a spatialaverage over 2 km along the aircraft trajectory.
There may be concern on the dishomogeneity of suchobservations, since the SCOUT-Darwin campaign measure-ment strategy was focussed on measurement into fresh out-flows from cumulonimbus anvils, while data from TROCCI-NOX and SCOUT-AMMA equally sampled fresh and agedoutflows, as well as cirrus of different origins. Figure1shows the dispersion of our dataset in altitude ranges and dif-ferent deployments. There, each of the eight panels (from ato h) is related to a 1000 m altitude range from 10 000 mto the ceiling altitude of the M55 Geophysica. In eachpanel, histograms of particle backscatter (left) as measuredby MAS, and corresponding temperature (right) observationsare shown, for the TROCCINOX (upper rows), SCOUT-Darwin (middle rows) and SCOUT-AMMA (lower rows).By inspecting the histograms, we can see how the majorityof observations comes from mid to high cirrus clouds, withsmall variability among the different deployments, due to thefact that cirrus sampled during SCOUT-AMMA were on theaverage lower, warmer and denser than those sampled dur-ing SCOUT Darwin, while TROCCINOX clouds have inter-mediate characteristics. The observed backscattering valuesranges from subvisible to nearly opaque cirrus clouds. Theseresults are summarized in Table1 that shows the mean valuesand standard deviations of the particle densities within eachbin of the FSSP size distribution histograms, as well as themean and standard deviation of cloud altitudes and tempera-tures, for each of the three deployments.
2.2 Optical modelling
Particle backscattering coefficients were computed from thesize distributions by means of light scattering theory as
β =
∫∞
0n(r) · π · r2
· Q(r) · dr (2)
where the backscattering cross sectionσπ (r) is expressed interms of a geometrical cross sectionπ · r2 and a scatteringefficiency Q(r). This latter quantity, depending on wave-length and particle refractive index, was computed by mean
www.atmos-meas-tech.net/4/557/2011/ Atmos. Meas. Tech., 4, 557–570, 2011

560 F. Cairo et al.: Backscattering and size distribution comparison
Fig. 1. Panels(A) through (H) show, for altitude ranges from 10 000 m to 17 000 m in 1000 m steps, the histograms of the measuredbackscatter coefficients, (left) and temperatures (right). In each panel, the observations have been grouped into different campaigns: SCOUT-AMMA, SCOUT Darwin and TROCCINOX respectively, from bottom to top.
Atmos. Meas. Tech., 4, 557–570, 2011 www.atmos-meas-tech.net/4/557/2011/
F. Cairo et al.: Backscattering and size distribution comparison 561
Table 1. Averages and standard deviations of the particle density in cm−3 within each diameter bin of the size distribution histogram arereported, as measured by the FSSP-100, for clouds observed in each of the three M55 Geophysica deployments (TROCCINOX, Bauru, 2004;SCOUT-Darwin; Darwin, 2005; SCOUT-AMMA; Ouagadougou, 2006). The diameter range of each bin is reported in the second row ofthe table, where minimum and maximum particle diameter for each bin are reported. In the two columns on the right, the mean value andstandard deviation of cloud altitudes and temperatures are reported.
n1 n2 n3 n4 n5 n6 n7 T (◦C) alt (m)D (µm) 2.7–5.1 5.1–8.3 8.3–12.0 12.0–16.3 16.3–21.4 21.4–25.4 25.4–30.9
SCOUT-AMMAmean 0.052 0.099 0.158 0.300 0.104 0.079 0.039 −56 14 080std 0.183 0.355 0.568 1.072 0.370 0.280 0.141 26 5465
SCOUT Darwinmean 0.013 0.015 0.009 0.012 0.003 0.001 0.001 −78 16 168std 0.065 0.053 0.042 0.045 0.035 0.034 0.034 8 1223
TROCCINOXmean 0.060 0.062 0.043 0.051 0.015 0.005 0.004 −72 15 150std 0.164 0.174 0.127 0.141 0.039 0.014 0.010 8 1230
of a Mie scattering code available in the literature (Bohrenand Huffman, 1983), by using the value of the refractive in-dex accepted for ice particles (Toon et al., 1994).
The size distribution was considered stepwise constantover each of seven size bins, and the integral was approxi-mated as in
β =
∑i
∫1i
ni · π · r2· Q(r) · dr (3)
Results from earlier studies on backscatter calculationson volcanic particles have shown such calculation to be ex-tremely sensitive to the histogram binning (Brock et al.,1993), at least for particles with diameters below 2 µm.
In order to rule out such dependency, an attempt to re-construct the size distributionn(r) in terms of analytic func-tions (bimodal lognormals) from the binnedni =n(r; 1ri)
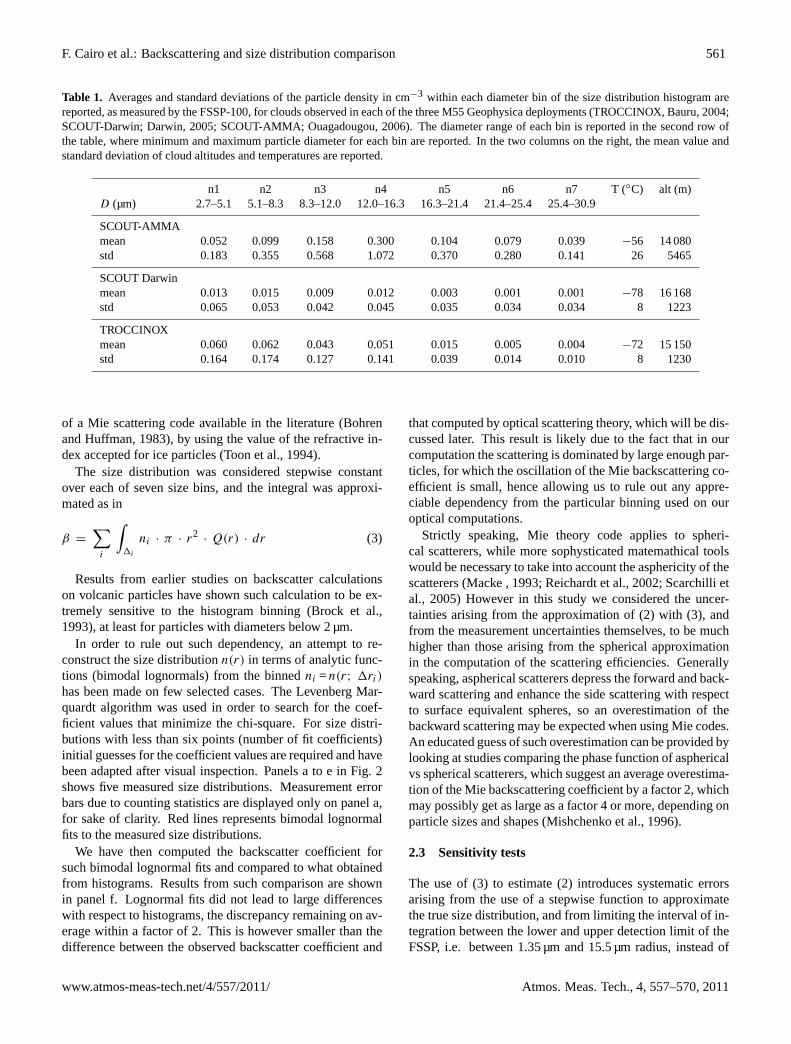
has been made on few selected cases. The Levenberg Mar-quardt algorithm was used in order to search for the coef-ficient values that minimize the chi-square. For size distri-butions with less than six points (number of fit coefficients)initial guesses for the coefficient values are required and havebeen adapted after visual inspection. Panels a to e in Fig.2shows five measured size distributions. Measurement errorbars due to counting statistics are displayed only on panel a,for sake of clarity. Red lines represents bimodal lognormalfits to the measured size distributions.
We have then computed the backscatter coefficient forsuch bimodal lognormal fits and compared to what obtainedfrom histograms. Results from such comparison are shownin panel f. Lognormal fits did not lead to large differenceswith respect to histograms, the discrepancy remaining on av-erage within a factor of 2. This is however smaller than thedifference between the observed backscatter coefficient and
that computed by optical scattering theory, which will be dis-cussed later. This result is likely due to the fact that in ourcomputation the scattering is dominated by large enough par-ticles, for which the oscillation of the Mie backscattering co-efficient is small, hence allowing us to rule out any appre-ciable dependency from the particular binning used on ouroptical computations.
Strictly speaking, Mie theory code applies to spheri-cal scatterers, while more sophysticated matemathical toolswould be necessary to take into account the asphericity of thescatterers (Macke, 1993; Reichardt et al., 2002; Scarchilli etal., 2005) However in this study we considered the uncer-tainties arising from the approximation of (2) with (3), andfrom the measurement uncertainties themselves, to be muchhigher than those arising from the spherical approximationin the computation of the scattering efficiencies. Generallyspeaking, aspherical scatterers depress the forward and back-ward scattering and enhance the side scattering with respectto surface equivalent spheres, so an overestimation of thebackward scattering may be expected when using Mie codes.An educated guess of such overestimation can be provided bylooking at studies comparing the phase function of asphericalvs spherical scatterers, which suggest an average overestima-tion of the Mie backscattering coefficient by a factor 2, whichmay possibly get as large as a factor 4 or more, depending onparticle sizes and shapes (Mishchenko et al., 1996).
2.3 Sensitivity tests
The use of (3) to estimate (2) introduces systematic errorsarising from the use of a stepwise function to approximatethe true size distribution, and from limiting the interval of in-tegration between the lower and upper detection limit of theFSSP, i.e. between 1.35 µm and 15.5 µm radius, instead of
www.atmos-meas-tech.net/4/557/2011/ Atmos. Meas. Tech., 4, 557–570, 2011
562 F. Cairo et al.: Backscattering and size distribution comparison
F. Cairo et al.: backscattering and size distribution comparison 11
Fig. 2. panel A through E show the histograms of the measured size distribution (black lines) with their error bars, shown only in panel Afor sake of clarity, and their bimodal lognormal fitting functions (red lines). Thin black lines show the two monomodal contributing to thebimodal. In panel F a scatterplot of backscattering coefficient computed from the histograms - horizontal axis - and their respective fits -vertical axis - is displayed. A grey band marks the region where the mismatch stays below a factor 2.
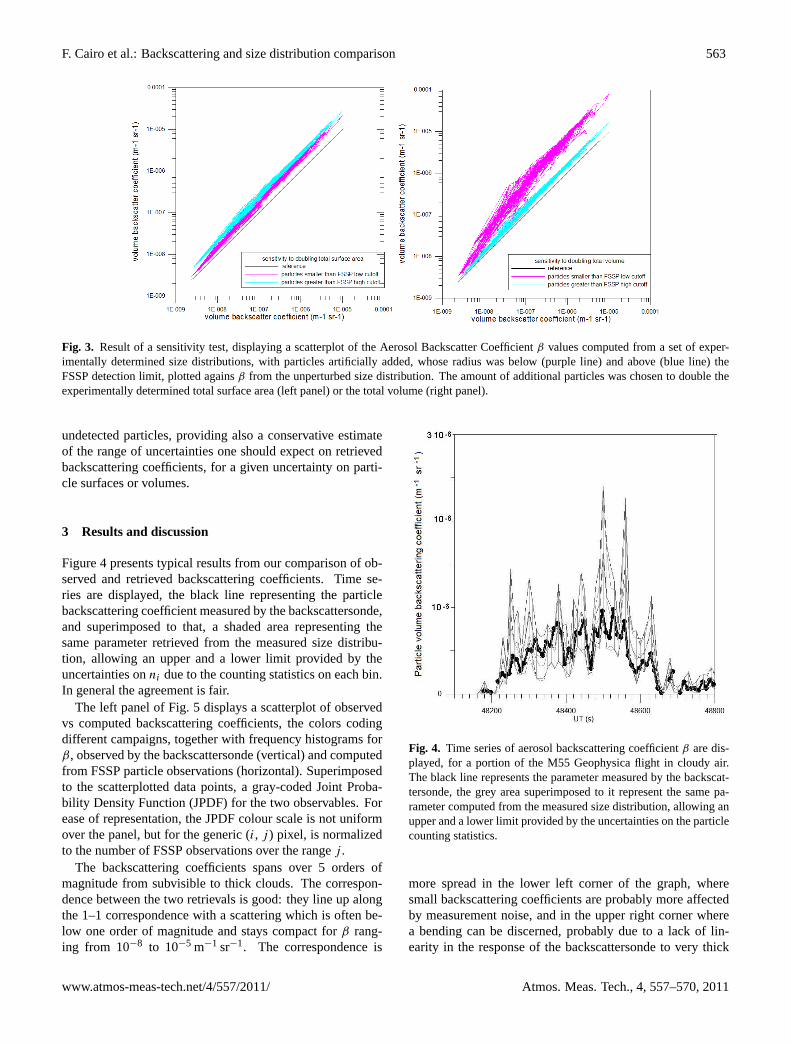
Fig. 3. Scatterplot of a sensitivity test, displaying the comparisonof the Aerosol Backscatter Coefficient β values computed from aset of experimentally determined size distributions, with particlesartificially added whose radius was below (purple line) and above(blue line) the FSSP detection limit, are plotted agains β from theunperturbed size distribution. The amount of additional particleswas chosen to double the experimentally determined total surfacearea (left panel) or the total volume (right panel)
Fig. 2. Panels(A) through(E) show the histograms of the measured size distribution (black lines) with their error bars (shown only inpanel(A) for sake of clarity) and their bimodal lognormal fitting functions (red lines). Thin black lines show the two monomodal contributingto the bimodal. In panel(F) a scatterplot of backscattering coefficient computed from the histograms – horizontal axis – and from theirrespective bimodal lognormal fits – vertical axis – is displayed. A grey band marks the region where the mismatch stays below a factor 2.
using the full range from 0 to∞. In order to estimate thesensitivity of our calculations to the presence of undetectedparticles, we have computed the integral (3) for a set of casestudies and compared with the result obtained by adding, tothe measured size distribution, particles in an additional binbelow the lower FSSP detection limit in one case, i.e. par-ticles with radii extending from 0.35 µ to 1.35 µ, and abovethe upper detection limit in a second case, i.e. particles withradii extending from 15.5 µ to 16.5 µ.
To quantify the effects of undetected particles on opticalparameters on one side, and on bulk size distribution param-eters on the other, the particle number densityni in theseadditional bins was defined in order to allocate in such binsa volume, or surface, equivalent to those actually detected bythe FSSP. This choice allows to easily extrapolate the effectsof an arbitrary amount of undetected particles, just notinghow, for particles uniformly distributed in these bins, theircontribution to the optical parameters would scale linearlywith their number, or volume, or surface.
This procedure allows to extrapolate the effects of an arbi-trary number of undetected particles, by simultaneously scal-ing their consequences both on the optical and microphysicalparameters of the particle distribution.
Results from these sensitivity tests are displayed in Fig.3,where a scatterplot of the backscatter coefficient values fromthe incremented size distribution with respect to those com-puted from the size distribution actually measured, are dis-played. On the left panel, the amount of additioned particleswas chosen in order to double the total surface, in the rightpanel, in order to double the total volume; the colors indicatethe addition of particles below (purple line) and above (blue
line) the FSSP lower and upper detection limits, respectively.The results of this analysis are the following:
1. Undetected particles whose radius is below the FSSPlower detection limit would have a large effect on theoverall optical properties. In terms of volumes, an equalratio of detected to non detected volumes would be mir-rored in tenfold variations in the scattering coefficients;in terms of surfaces, an equal ratio of detected to nondetected particles would double the backscattering co-efficient.
2. Undetected particles whose radius is above the FSSPhigher detection limit would have a smaller effect on theoverall optical properties: an equal ratio of detected tonon detected volumes would be mirrored in a twofoldvariation of the scattering coefficients, and similar ef-fects would be produced by an equal ratio of detectedvs non detected surfaces.
It should be noted that in our sensitivity study, we addedparticles in the 15.5–16.5 µm radius range, close to the up-per FSSP detection limit. Shifting their radius to larger val-ues and keeping either their volume or their surface constant,would only decrease or leave practically unchanged their op-tical effectiveness; similarly, particles in the 0.35–1.35 µmradius range would be more efficient in optical scattering,than a volume- or surface-equivalent number of particleswithin the FSSP detection limit, these properties descendingfrom the general behaviour of scattering efficiencies versusparticle dimension. Thus our choice in the sensitivity studyrepresents an upper limit to the assessment of the effect of
Atmos. Meas. Tech., 4, 557–570, 2011 www.atmos-meas-tech.net/4/557/2011/
F. Cairo et al.: Backscattering and size distribution comparison 563
Fig. 3. Result of a sensitivity test, displaying a scatterplot of the Aerosol Backscatter Coefficientβ values computed from a set of exper-imentally determined size distributions, with particles artificially added, whose radius was below (purple line) and above (blue line) theFSSP detection limit, plotted againsβ from the unperturbed size distribution. The amount of additional particles was chosen to double theexperimentally determined total surface area (left panel) or the total volume (right panel).
undetected particles, providing also a conservative estimateof the range of uncertainties one should expect on retrievedbackscattering coefficients, for a given uncertainty on parti-cle surfaces or volumes.
3 Results and discussion
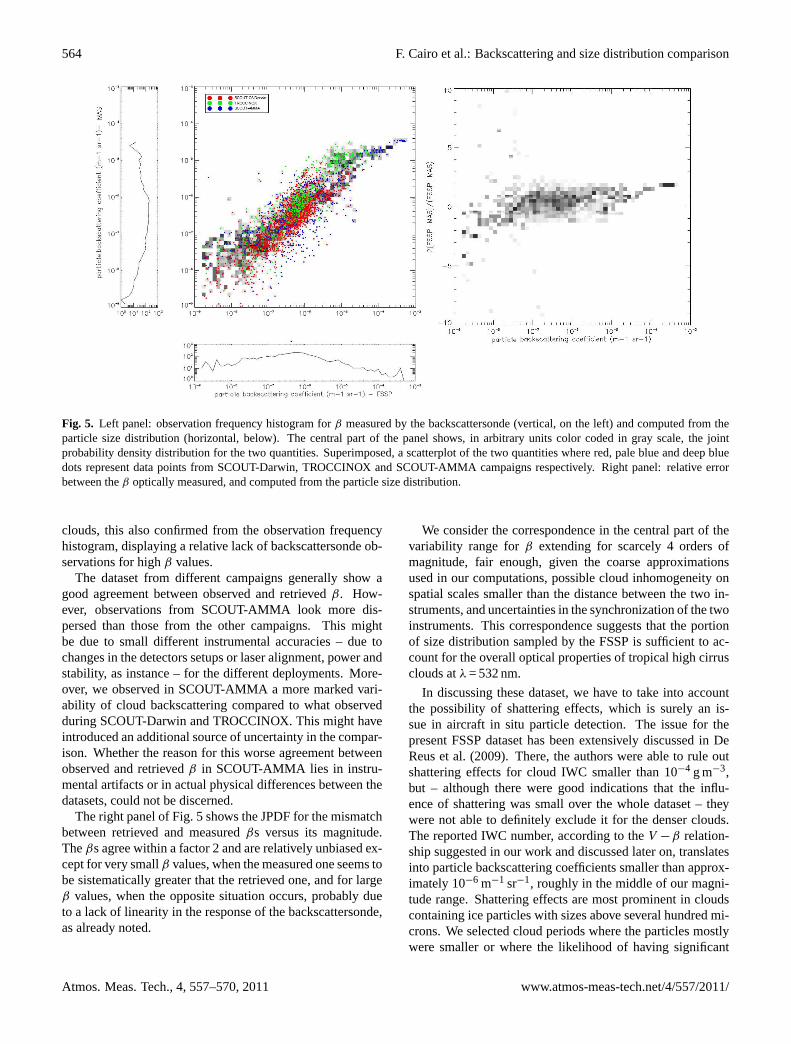
Figure4 presents typical results from our comparison of ob-served and retrieved backscattering coefficients. Time se-ries are displayed, the black line representing the particlebackscattering coefficient measured by the backscattersonde,and superimposed to that, a shaded area representing thesame parameter retrieved from the measured size distribu-tion, allowing an upper and a lower limit provided by theuncertainties onni due to the counting statistics on each bin.In general the agreement is fair.
The left panel of Fig.5 displays a scatterplot of observedvs computed backscattering coefficients, the colors codingdifferent campaigns, together with frequency histograms forβ, observed by the backscattersonde (vertical) and computedfrom FSSP particle observations (horizontal). Superimposedto the scatterplotted data points, a gray-coded Joint Proba-bility Density Function (JPDF) for the two observables. Forease of representation, the JPDF colour scale is not uniformover the panel, but for the generic (i, j ) pixel, is normalizedto the number of FSSP observations over the rangej .
The backscattering coefficients spans over 5 orders ofmagnitude from subvisible to thick clouds. The correspon-dence between the two retrievals is good: they line up alongthe 1–1 correspondence with a scattering which is often be-low one order of magnitude and stays compact forβ rang-ing from 10−8 to 10−5 m−1 sr−1. The correspondence is
F. Cairo et al.: backscattering and size distribution comparison 13
Fig. 4. Time series of aerosol backscattering coefficient β are dis-played, for a portion of the M55 Geophysica flight in cloudy air.The black line represents the parameter measured by the backscat-tersonde, the grey area superimposed to it represent the same pa-rameter computed from the measured size distribution, allowing anupper and a lower limit provided by the uncertainties on the particlecounting statistics.
Table 2. Linear relations linking the backscatter coefficient to par-ticle number, surface and volume density. Here β is expressed inm−1 sr−1, while N, S, and V are expressed respectively in cm−3,µm−2 cm−3, µm−3 cm−3
fit R-squared
N=7.0 ·104 ·β 0.73S=3.2 ·107 ·β 0.53V=9.2 ·107 ·β 0.49
Fig. 4. Time series of aerosol backscattering coefficientβ are dis-played, for a portion of the M55 Geophysica flight in cloudy air.The black line represents the parameter measured by the backscat-tersonde, the grey area superimposed to it represent the same pa-rameter computed from the measured size distribution, allowing anupper and a lower limit provided by the uncertainties on the particlecounting statistics.
more spread in the lower left corner of the graph, wheresmall backscattering coefficients are probably more affectedby measurement noise, and in the upper right corner wherea bending can be discerned, probably due to a lack of lin-earity in the response of the backscattersonde to very thick
www.atmos-meas-tech.net/4/557/2011/ Atmos. Meas. Tech., 4, 557–570, 2011
564 F. Cairo et al.: Backscattering and size distribution comparison
Fig. 5. Left panel: observation frequency histogram forβ measured by the backscattersonde (vertical, on the left) and computed from theparticle size distribution (horizontal, below). The central part of the panel shows, in arbitrary units color coded in gray scale, the jointprobability density distribution for the two quantities. Superimposed, a scatterplot of the two quantities where red, pale blue and deep bluedots represent data points from SCOUT-Darwin, TROCCINOX and SCOUT-AMMA campaigns respectively. Right panel: relative errorbetween theβ optically measured, and computed from the particle size distribution.
clouds, this also confirmed from the observation frequencyhistogram, displaying a relative lack of backscattersonde ob-servations for highβ values.
The dataset from different campaigns generally show agood agreement between observed and retrievedβ. How-ever, observations from SCOUT-AMMA look more dis-persed than those from the other campaigns. This mightbe due to small different instrumental accuracies – due tochanges in the detectors setups or laser alignment, power andstability, as instance – for the different deployments. More-over, we observed in SCOUT-AMMA a more marked vari-ability of cloud backscattering compared to what observedduring SCOUT-Darwin and TROCCINOX. This might haveintroduced an additional source of uncertainty in the compar-ison. Whether the reason for this worse agreement betweenobserved and retrievedβ in SCOUT-AMMA lies in instru-mental artifacts or in actual physical differences between thedatasets, could not be discerned.
The right panel of Fig.5 shows the JPDF for the mismatchbetween retrieved and measuredβs versus its magnitude.Theβs agree within a factor 2 and are relatively unbiased ex-cept for very smallβ values, when the measured one seems tobe sistematically greater that the retrieved one, and for largeβ values, when the opposite situation occurs, probably dueto a lack of linearity in the response of the backscattersonde,as already noted.
We consider the correspondence in the central part of thevariability range forβ extending for scarcely 4 orders ofmagnitude, fair enough, given the coarse approximationsused in our computations, possible cloud inhomogeneity onspatial scales smaller than the distance between the two in-struments, and uncertainties in the synchronization of the twoinstruments. This correspondence suggests that the portionof size distribution sampled by the FSSP is sufficient to ac-count for the overall optical properties of tropical high cirrusclouds atλ = 532 nm.
In discussing these dataset, we have to take into accountthe possibility of shattering effects, which is surely an is-sue in aircraft in situ particle detection. The issue for thepresent FSSP dataset has been extensively discussed inDeReus et al.(2009). There, the authors were able to rule outshattering effects for cloud IWC smaller than 10−4 g m−3,but – although there were good indications that the influ-ence of shattering was small over the whole dataset – theywere not able to definitely exclude it for the denser clouds.The reported IWC number, according to theV −β relation-ship suggested in our work and discussed later on, translatesinto particle backscattering coefficients smaller than approx-imately 10−6 m−1 sr−1, roughly in the middle of our magni-tude range. Shattering effects are most prominent in cloudscontaining ice particles with sizes above several hundred mi-crons. We selected cloud periods where the particles mostlywere smaller or where the likelihood of having significant
Atmos. Meas. Tech., 4, 557–570, 2011 www.atmos-meas-tech.net/4/557/2011/

F. Cairo et al.: Backscattering and size distribution comparison 565
Fig. 6. Observation frequency histogram forβ measured by the backscattersonde (horizontal, below) and for the particle number densityN
(vertical, on the left). The central panel shows, in arbitrary units color coded in gray scale, the joint probability density distribution for thetwo quantities. A linear fit with the parameters reported in Table 2, together with a region wheere the mismatch is below a factor 2, is alsodisplayed.
numbers of (too) large particles was low. As instance, thecloud cases displayed in Figure 2 only contain particles withmaximum sizes below 200 µm and small number concentra-tions. Therefore, shattering is thought to have a minor ornegligible effect (Lawson et al., 2008; Jensen et al., 2009).Moreover, these high tropical clouds seem to contain onlysimply structured particles (Lawson et al., 2010). This meansplates, elongated spheriods, droxtals and not complex ag-gregates of crystals, rimed particles, complex hydrometeors.Such large particle aggregates cause considerable shatteringeffects. As a matter of fact, if there had been low concen-trations of large particles present in the sampled air masses,then these would not have caused too much of a signal inthe backscattersonde in comparison to the more abundantsmall particles. However these particles would have gener-ated many shattered fragments which would have been de-tected as small particles by the FSSP. Then the FSSP de-rived backscatter ratios would strongly disagree (being con-sistently higher) with the MAS results. This is not the case.In fact, the size distribution detected by the FSSP well re-produces the observed backscattering, with no significant bi-ases over its range of magnitude, i.e. from thinner to thickerclouds. This seems a good indication that an underestima-tion of large crystals and overestimation of small crystals has
no leading effect, and shattering is not a major player in thesampled cloud volumes.
Figures6, 7, 8 and9 report in the horizontal axis the ob-servations frequency histogram for the measured backscat-ter coefficient, in the vertical axis the observations frequencyhistograms for particle number densityN , surface area den-sity S, condensed volume densityV and effective radiusreffrespectively. The central panels in each figure show the JPDFin gray scale, for each pair of variables under exam. As inFig. 5, the JPDF colour scale is not uniform over the panel,but for the generic (i, j ) pixel it is normalized to the numberof FSSP observations over thatj .
The linearity between the observedβ andN displayed inthe JPDF panel in Fig.6 is quite striking and indicates thatβ basically scales with the particle number densityN . Thissuggests that in the range of differences in the various shapesof the size distributions in our observations, these are practi-cally uneffective in changing the scattering properties of cir-rus clouds, at least for the wavelenght used in our study andfor the dimensional range encountered in our observations.This finding is further confirmed by the correspondence ofβ
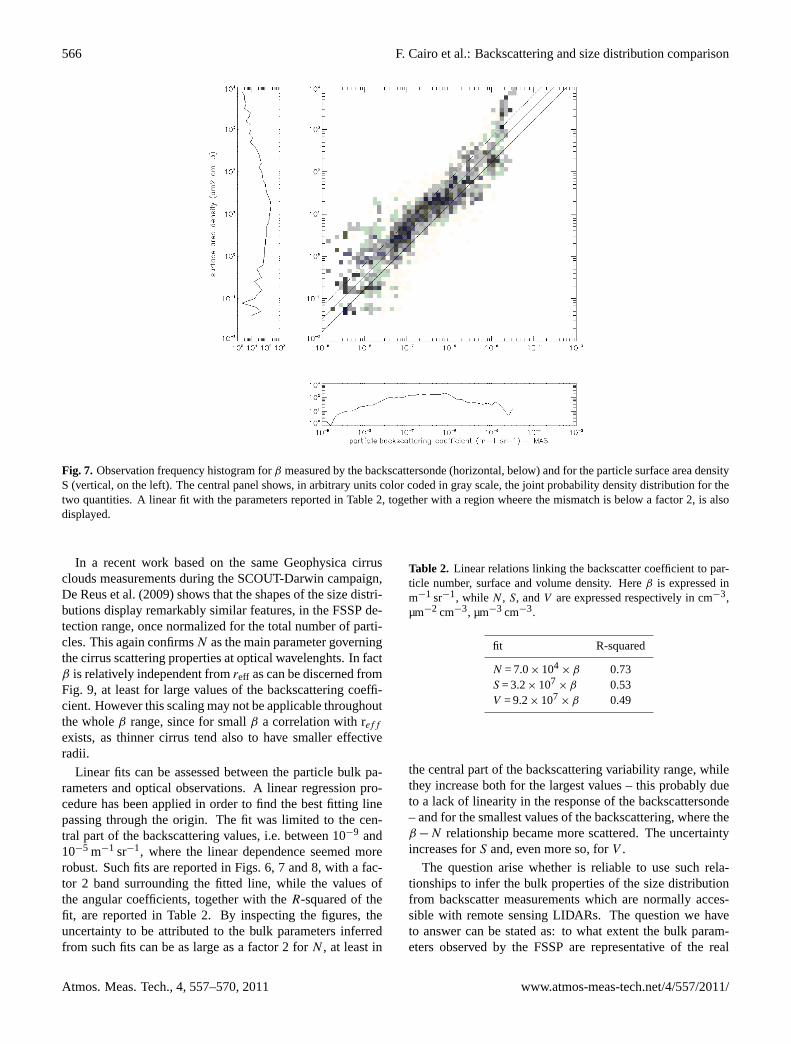
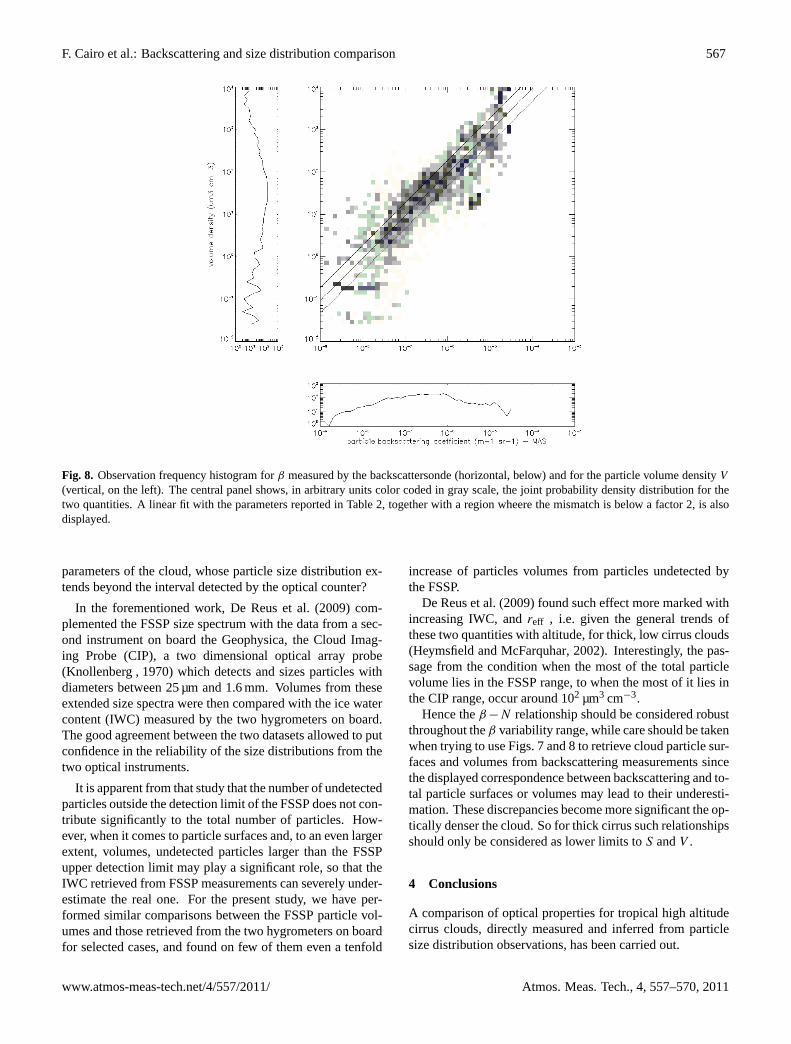
vs. S, as in Fig.7, and vs.V as in Fig.8, which show thesame linearity withβ, although more scattered.
www.atmos-meas-tech.net/4/557/2011/ Atmos. Meas. Tech., 4, 557–570, 2011
566 F. Cairo et al.: Backscattering and size distribution comparison
Fig. 7. Observation frequency histogram forβ measured by the backscattersonde (horizontal, below) and for the particle surface area densityS (vertical, on the left). The central panel shows, in arbitrary units color coded in gray scale, the joint probability density distribution for thetwo quantities. A linear fit with the parameters reported in Table 2, together with a region wheere the mismatch is below a factor 2, is alsodisplayed.
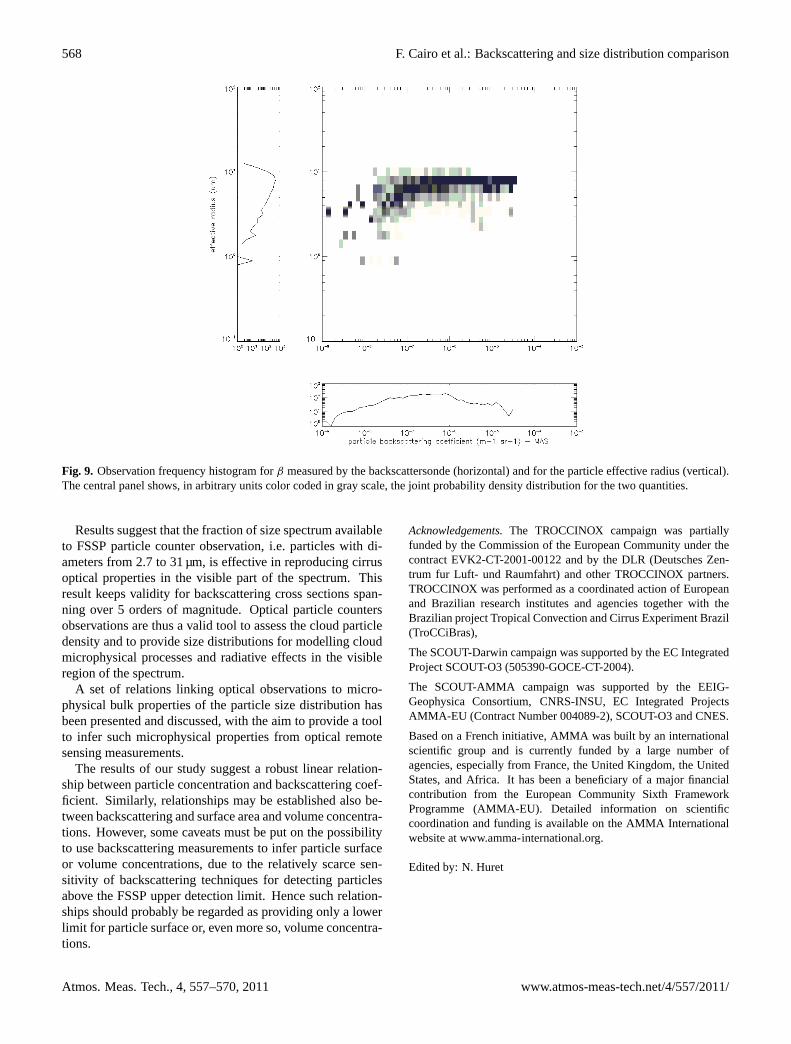
In a recent work based on the same Geophysica cirrusclouds measurements during the SCOUT-Darwin campaign,De Reus et al.(2009) shows that the shapes of the size distri-butions display remarkably similar features, in the FSSP de-tection range, once normalized for the total number of parti-cles. This again confirmsN as the main parameter governingthe cirrus scattering properties at optical wavelenghts. In factβ is relatively independent fromreff as can be discerned fromFig. 9, at least for large values of the backscattering coeffi-cient. However this scaling may not be applicable throughoutthe wholeβ range, since for smallβ a correlation with reff
exists, as thinner cirrus tend also to have smaller effectiveradii.
Linear fits can be assessed between the particle bulk pa-rameters and optical observations. A linear regression pro-cedure has been applied in order to find the best fitting linepassing through the origin. The fit was limited to the cen-tral part of the backscattering values, i.e. between 10−9 and10−5 m−1 sr−1, where the linear dependence seemed morerobust. Such fits are reported in Figs. 6, 7 and 8, with a fac-tor 2 band surrounding the fitted line, while the values ofthe angular coefficients, together with theR-squared of thefit, are reported in Table 2. By inspecting the figures, theuncertainty to be attributed to the bulk parameters inferredfrom such fits can be as large as a factor 2 forN , at least in
Table 2. Linear relations linking the backscatter coefficient to par-ticle number, surface and volume density. Hereβ is expressed inm−1 sr−1, while N , S, andV are expressed respectively in cm−3,µm−2 cm−3, µm−3 cm−3.
fit R-squared
N = 7.0× 10⁴× β 0.73
S = 3.2× 10⁷× β 0.53
V = 9.2× 10⁷× β 0.49
the central part of the backscattering variability range, whilethey increase both for the largest values – this probably dueto a lack of linearity in the response of the backscattersonde– and for the smallest values of the backscattering, where theβ −N relationship became more scattered. The uncertaintyincreases forS and, even more so, forV .
The question arise whether is reliable to use such rela-tionships to infer the bulk properties of the size distributionfrom backscatter measurements which are normally acces-sible with remote sensing LIDARs. The question we haveto answer can be stated as: to what extent the bulk param-eters observed by the FSSP are representative of the real
Atmos. Meas. Tech., 4, 557–570, 2011 www.atmos-meas-tech.net/4/557/2011/
F. Cairo et al.: Backscattering and size distribution comparison 567
Fig. 8. Observation frequency histogram forβ measured by the backscattersonde (horizontal, below) and for the particle volume densityV
(vertical, on the left). The central panel shows, in arbitrary units color coded in gray scale, the joint probability density distribution for thetwo quantities. A linear fit with the parameters reported in Table 2, together with a region wheere the mismatch is below a factor 2, is alsodisplayed.
parameters of the cloud, whose particle size distribution ex-tends beyond the interval detected by the optical counter?
In the forementioned work,De Reus et al.(2009) com-plemented the FSSP size spectrum with the data from a sec-ond instrument on board the Geophysica, the Cloud Imag-ing Probe (CIP), a two dimensional optical array probe(Knollenberg, 1970) which detects and sizes particles withdiameters between 25 µm and 1.6 mm. Volumes from theseextended size spectra were then compared with the ice watercontent (IWC) measured by the two hygrometers on board.The good agreement between the two datasets allowed to putconfidence in the reliability of the size distributions from thetwo optical instruments.
It is apparent from that study that the number of undetectedparticles outside the detection limit of the FSSP does not con-tribute significantly to the total number of particles. How-ever, when it comes to particle surfaces and, to an even largerextent, volumes, undetected particles larger than the FSSPupper detection limit may play a significant role, so that theIWC retrieved from FSSP measurements can severely under-estimate the real one. For the present study, we have per-formed similar comparisons between the FSSP particle vol-umes and those retrieved from the two hygrometers on boardfor selected cases, and found on few of them even a tenfold
increase of particles volumes from particles undetected bythe FSSP.
De Reus et al.(2009) found such effect more marked withincreasing IWC, andreff , i.e. given the general trends ofthese two quantities with altitude, for thick, low cirrus clouds(Heymsfield and McFarquhar, 2002). Interestingly, the pas-sage from the condition when the most of the total particlevolume lies in the FSSP range, to when the most of it lies inthe CIP range, occur around 102 µm3 cm−3.
Hence theβ −N relationship should be considered robustthroughout theβ variability range, while care should be takenwhen trying to use Figs.7 and8 to retrieve cloud particle sur-faces and volumes from backscattering measurements sincethe displayed correspondence between backscattering and to-tal particle surfaces or volumes may lead to their underesti-mation. These discrepancies become more significant the op-tically denser the cloud. So for thick cirrus such relationshipsshould only be considered as lower limits toS andV .
4 Conclusions
A comparison of optical properties for tropical high altitudecirrus clouds, directly measured and inferred from particlesize distribution observations, has been carried out.
www.atmos-meas-tech.net/4/557/2011/ Atmos. Meas. Tech., 4, 557–570, 2011
568 F. Cairo et al.: Backscattering and size distribution comparison
Fig. 9. Observation frequency histogram forβ measured by the backscattersonde (horizontal) and for the particle effective radius (vertical).The central panel shows, in arbitrary units color coded in gray scale, the joint probability density distribution for the two quantities.
Results suggest that the fraction of size spectrum availableto FSSP particle counter observation, i.e. particles with di-ameters from 2.7 to 31 µm, is effective in reproducing cirrusoptical properties in the visible part of the spectrum. Thisresult keeps validity for backscattering cross sections span-ning over 5 orders of magnitude. Optical particle countersobservations are thus a valid tool to assess the cloud particledensity and to provide size distributions for modelling cloudmicrophysical processes and radiative effects in the visibleregion of the spectrum.
A set of relations linking optical observations to micro-physical bulk properties of the particle size distribution hasbeen presented and discussed, with the aim to provide a toolto infer such microphysical properties from optical remotesensing measurements.
The results of our study suggest a robust linear relation-ship between particle concentration and backscattering coef-ficient. Similarly, relationships may be established also be-tween backscattering and surface area and volume concentra-tions. However, some caveats must be put on the possibilityto use backscattering measurements to infer particle surfaceor volume concentrations, due to the relatively scarce sen-sitivity of backscattering techniques for detecting particlesabove the FSSP upper detection limit. Hence such relation-ships should probably be regarded as providing only a lowerlimit for particle surface or, even more so, volume concentra-tions.
Acknowledgements.The TROCCINOX campaign was partiallyfunded by the Commission of the European Community under thecontract EVK2-CT-2001-00122 and by the DLR (Deutsches Zen-trum fur Luft- und Raumfahrt) and other TROCCINOX partners.TROCCINOX was performed as a coordinated action of Europeanand Brazilian research institutes and agencies together with theBrazilian project Tropical Convection and Cirrus Experiment Brazil(TroCCiBras),
The SCOUT-Darwin campaign was supported by the EC IntegratedProject SCOUT-O3 (505390-GOCE-CT-2004).
The SCOUT-AMMA campaign was supported by the EEIG-Geophysica Consortium, CNRS-INSU, EC Integrated ProjectsAMMA-EU (Contract Number 004089-2), SCOUT-O3 and CNES.
Based on a French initiative, AMMA was built by an internationalscientific group and is currently funded by a large number ofagencies, especially from France, the United Kingdom, the UnitedStates, and Africa. It has been a beneficiary of a major financialcontribution from the European Community Sixth FrameworkProgramme (AMMA-EU). Detailed information on scientificcoordination and funding is available on the AMMA Internationalwebsite atwww.amma-international.org.
Edited by: N. Huret
Atmos. Meas. Tech., 4, 557–570, 2011 www.atmos-meas-tech.net/4/557/2011/

F. Cairo et al.: Backscattering and size distribution comparison 569
References
Bockmann, C., Wandinger, U., Ansmann, A., Bosenberg, J.,Amiridis, V., Boselli, A., Delaval, A., De Tomasi, F., Frioud,M., Hagard, A., Horvat, M., Iarlori, M., Komguem, L.,Kreipl, S., Larcheveque, G., Matthias, V., Papayannis, A.,Pappalardo, G., Rocadembosch, F., Rodriguez, J. A., Schnei-der, J., Shcherbakov, V., and Wiegner M.: Aerosol lidar in-tercomparison in the framework of the EARLINET project,2. Aerosol backscatter algorithms, Appl. Optics, 43(4), 977–989,doi:10.1364/AO.43.000977, 2004.
Bohren, C. F. and Huffman D. R.: Absorption and Scattering ofLight by Small Particles, Wiley Interscience Publication, JohnWiley and Sons, New York, 1983.
Brock, C. A., Jonsson, H. H., Wilson, J. C., Dye, J. E., Baumgard-ner, D., Borrmann, S., Pitts, M. C., Osborn, M. T., DeCoursey, R.J., and Woods, D. C.: Relationships between optical extinction,backscatter and aerosol surface and volume in the stratospherefollowing the eruption of Mt. Pinatubo, Geophys. Res. Lett., 20,2555–2558, 1993.
Brunner, D., Siegmund, P., May, P. T., Chappel, L., Schiller, C.,Muller, R., Peter, T., Fueglistaler, S., MacKenzie, A. R., Fix,A., Schlager, H., Allen, G., Fjaeraa, A. M., Streibel, M., andHarris, N. R. P.: The SCOUT-O3 Darwin Aircraft Campaign:rationale and meteorology, Atmos. Chem. Phys., 9, 93–117,doi:10.5194/acp-9-93-2009, 2009.
Buontempo, C., Cairo, F., Di Donfrancesco, G., Morbidini, R.,Viterbini, M., and Adriani, A.:Optical measurements of atmo-spheric particles from airborne platforms, in situ and remotesensing instruments for balloons and aircrafts, Ann. Geophys.-Italy, 49, 57–65, 2006.
Cairo, F., Adriani, A., Viterbini, M., Di Donfrancesco, G., Mitev,V., Matthey, R., Bastiano, M., Redaelli, G., Dragani, R., Ferretti,R., Rizi, V., Paolucci, T., Bernardini, L., Cacciani, M., Pace, G.,and Fiocco, G.: Polar stratospheric clouds observed during theAirborne Polar Experiment Geophysica Aircraft in Antarctica(APE-GAIA) campaign, J. Geophys. Res., 109(690), D07204,doi:10.1029/2003JD003930, 2004.
Cairo, F., Pommereau, J. P., Law, K. S., Schlager, H., Garnier,A., Fierli, F., Ern, M., Streibel, M., Arabas, S., Borrmann, S.,Berthelier, J. J., Blom, C., Christensen, T., D’Amato, F., Di Don-francesco, G., Deshler, T., Diedhiou, A., Durry, G., Engelsen,O., Goutail, F., Harris, N. R. P., Kerstel, E. R. T., Khaykin, S.,Konopka, P., Kylling, A., Larsen, N., Lebel, T., Liu, X., MacKen-zie, A. R., Nielsen, J., Oulanowski, A., Parker, D. J., Pelon, J.,Polcher, J., Pyle, J. A., Ravegnani, F., Riviere, E. D., Robin-son, A. D., Rockmann, T., Schiller, C., Simoes, F., Stefanutti,L., Stroh, F., Some, L., Siegmund, P., Sitnikov, N., Vernier, J. P.,Volk, C. M., Voigt, C., von Hobe, M., Viciani, S., and Yushkov,V.: An introduction to the SCOUT-AMMA stratospheric aircraft,balloons and sondes campaign in West Africa, August 2006:rationale and roadmap, Atmos. Chem. Phys., 10, 2237–2256,doi:10.5194/acp-10-2237-2010, 2010.
Collis, R. T. H. and Russell, P. B.: Lidar Measurement of Particlesand Gases by Elastic backscattering and Differential absorption,in: Laser Monitoring of the Atmosphere, edited by: Hinkley, E.D., Springer Verlag, Berlin, Germany, 1976.
Comstock, J. M. and Sassen K. : Retrieval of Cirrus Cloud Radia-tive and Backscattering Properties Using Combined Lidar andInfrared Radiometer (LIRAD) Measurements, J. Atmos. Ocean.Tech., 18, 1658–1673, 2001.
Corti, T., Luo, B. P., Fu, Q., Vomel, H., and Peter, T.: The impactof cirrus clouds on tropical troposphere-to-stratosphere transport,Atmos. Chem. Phys., 6, 2539–2547,doi:10.5194/acp-6-2539-2006, 2006.
de Reus, M., Borrmann, S., Bansemer, A., Heymsfield, A. J.,Weigel, R., Schiller, C., Mitev, V., Frey, W., Kunkel, D., Kurten,A., Curtius, J., Sitnikov, N. M., Ulanovsky, A., and Raveg-nani, F.: Evidence for ice particles in the tropical stratospherefrom in-situ measurements, Atmos. Chem. Phys., 9, 6775–6792,doi:10.5194/acp-9-6775-2009, 2009.
Dye, J. E. D. and Baumgardner, D.: Evaluation of the forward scat-tering spectrometer probe I. Electronic and optical studies, J. At-mos. Ocean. Tech., 1, 329–344, 1984
Fernald, F. G.: Analysis of atmospheric lidar observations: somecomments, Appl. Optics, 23, 7113–7131, 1984.
Hartmann, D. L., Holton, J. R., and Fu, Q.: The heat balance of thetropical tropopause, cirrus, and stratospheric dehydration, Geo-phys. Res. Lett., 28, 1969–1972, 2001.
Heymsfield, A. J.: Ice particles observed in a cirriform cloud at−83◦C and implications for polar stratospheric clouds, J. Atmos.Sci., 43, 851-855, 1986.
Heymsfield, A. J. and McFarquhar, G. M.: Midlatitude and tropicalCirrus: Microphysical Properties, in: Cirrus, edited by: Lynch,D. K., Sassen, K., O’Starr, D., and Stephens, G., Oxford Univer-sity Press, New York, 2002.
Holton, J. R. and Gettelman, A.: Horizontal transport and the dehy-dration of the stratosphere, Geophys. Res. Lett., 28, 2799–2802,2001.
Immler, F., Kruger, K., Tegtmeier, S., Fujiwara, M., Fortuin, P.,Verver, G., and Schrems, O.: Cirrus clouds, humidity, and dehy-dration in the tropical tropopause layer observed at Paramaribo,Suriname (5.8◦ N, 55.2◦ W), J. Geophys. Res., 112, D03209,doi:10.1029/2006JD007440, 2007.
Jensen, E. J., Lawson, P., Baker, B., Pilson, B., Mo, Q., Heyms-field, A. J., Bansemer, A., Bui, T. P., McGill, M., Hlavka, D.,Heymsfield, G., Platnick, S., Arnold, G. T., and Tanelli, S.: Onthe importance of small ice crystals in tropical anvil cirrus, At-mos. Chem. Phys., 9, 5519–5537,doi:10.5194/acp-9-5519-2009,2009.
Klett, J. D.: Stable analytical inversion solution for processing lidarreturns, Appl. Optics, 20, 211–220,1981.
Knollenberg, R. G.: The optical array: an alternative to scatteringor extinction for airborne particle size determination, J. Appl.Meteorol., 9, 86-103, 1970.
Knollenberg, R. G., Kelly, K., and Wilson, J. C.: Measurementsof high number densities of ice crystals in the tops of tropicalcumulonimbus, J. Geophys. Res., 98, 8639-8664, 1993.
Lawson, R. P., Pilson, B., Baker, B., Mo, Q., Jensen, E., Pfister,L., and Bui, P.: Aircraft measurements of microphysical prop-erties of subvisible cirrus in the tropical tropopause layer, At-mos. Chem. Phys., 8, 1609–1620,doi:10.5194/acp-8-1609-2008,2008.
www.atmos-meas-tech.net/4/557/2011/ Atmos. Meas. Tech., 4, 557–570, 2011
570 F. Cairo et al.: Backscattering and size distribution comparison
Lawson, R. P., Jensen, E., Mitchell, D. L., Baker, B., Mo, Q., andPilson, B.: Microphysical and radiative properties of tropicalclouds investigated in TC4 and NAMMA, J. Geophys. Res., 115,D00J08,doi:10.1029/2009JD013017, 2010.
Liou, K. N.: Influence of Cirrus Clouds on Weather and Cli-mate Processes: A Global Perspective, Mon. Weather Rev., 114,1167–1199, 1986.
Luo, B. P., Peter, T., Fueglistaler, S., Wernli, H., Wirth, M., Kiemle,C., Flentje, H., Yushkov, V. A., Khattatov, V., Rudakov, V.,Thomas, A., Borrmann, S., Toci, G., Mazzinghi, P., Beuer-mann, J., Schiller, C., Cairo, F., Di Donfrancesco, G., Adriani,A., Volk, C. M., Strom, J., Noone, K., Mitev, V., MacKen-zie, R. A., Carslaw, K. S., Trautmann, T., Santacesaria, V.,and Stefanutti, L.: Dehydration potential of ultrathin clouds atthe tropical tropopause, Geophys. Res. Lett., 30, 1557–1561,doi:10.1029/2002GL016737, 2003.
Macke, A.: Scattering of light by polyhedral ice crystals, Appl. Op-tics, 32, 2780–2788, 1993.
Matthias, V., Bosenberg, J., Freudenthaler, V., Amodeo, A., Balis,D., Chaikovsky, A., Chourdakis, G., Comeron, A., Delaval, A.,de Tomasi, F., Eixmann, R., Hagard, A., Komguem, L., Kreipl,S., Matthey, R., Mattis, I., Rizi, V., Rodriguez, J. A., Simeonov,V., and Wang, X.: Aerosol lidar intercomparison in the frame-work of the EARLINET project, 1. Instruments, Appl. Optics,43(12), 2578–2579,doi:10.1364/AO.43.002578, 2004.
McFarquhar, G. M., Heymsfield, A. J., Spinhirne, J., and Hart, B.:Thin and subvisual tropopause tropical cirrus: observations andradiative impacts, J. Atmos. Sci., 57, 1841-1853, 2000.
Mishchenko, M. I., Travis, L. D., and Mackowski, D. W.: T-matrixcomputations of light scattering by nonspherical particles: a re-view: J. Quant. Spectrosc. Ra., 55, 535–575, 1996.
Pace, G., Cacciani, M., di Sarra, A., Fiocco, G., and Fua, D.: Li-dar observations of equatorial cirrus clouds at Mahe, Seychelles,J. Geophys. Res., 108(D8), 4236,doi:10.1029/2002JD002710,2003.
Pappalardo, G., Amodeo, A., Pandolfi, M., Wandinger, U., Ans-mann, A., Bosenberg, J., Matthias, V., Amiridis, V., De Tomasi,F., Frioud, M., Iarlori, M., Komguem, L., Papayannis, A., Roca-denbosch, F., and Wang, X.: Aerosol lidar intercomparison in theframework of the EARLINET project, 3. Raman lidar algorithmfor aerosol extinction, backscatter, and Lidar ratio, Appl. Optics,43(28), 5370–5385,doi:10.1364/AO.43.005370, 2004.
Peter, Th., Luo, B. P., Wirth, M., Kiemle, C., Flentje, H., Yushkov,V. A., Khattatov, V., Rudakov, V., Thomas, A., Borrmann, S.,Toci, G., Mazzinghi, P., Beuermann, J., Schiller, C., Cairo, F., DiDonfrancesco, G., Adriani, A., Volk, C. M., Strom, J., Noone, K.,Mitev, V., MacKenzie, R. A., Carslaw, K. S., Trautmann, T., San-tacesaria, V., and Stefanutti, L.: Ultrathin Tropical TropopauseClouds (UTTCs): I. Cloud morphology and occurrence, At-mos. Chem. Phys., 3, 1083–1091,doi:10.5194/acp-3-1083-2003,2003.
Platt, C. M. R., Young, S. A., Manson, P. J., Patterson, G. R., Mars-den, S. C., Austin, R. T., and Churnside, J. H.: The Optical Prop-erties of Equatorial Cirrus from Observations in the ARM Pi-lot Radiation Observation Experiment, J. Atmos. Sci., 55, 1977-1996, 1998
Reichardt, J., Reichardt, S., Yang, P., and McGee, T. J.: Re-trieval of polar stratospheric cloud microphysical propertiesfrom lidar measurements: Dependence on particle shape as-sumptions : SAGE III-Ozone Loss Validation Experimentand Third European Stratospheric Experiment on Ozone-2000 (SOLVE/THESEO), J. Geophys. Res., 107, SOL 25.1–SOL 25.12, 2002.
Russell, P. B., Swissler, T. J., and McCormick, M., P.: Methodologyfor error analysis and simulation of lidar aerosol measurements,Appl. Optics, 18, 3783–3797, 1979.
Scarchilli, C., Adriani, A., Cairo, F., Di Donfrancesco, G., Buon-tempo, C., Snels, M., Moriconi, M. L., Deshler, T., Larsen, N.,Luo, B., Mauersberger, K., Ovarlez, J., Rosen, J., and Schreiner,J.: Determination of polar stratospheric cloud particle refractiveindices by use of in situ optical measurements and T-matrix cal-culations, Appl. Optics, 44, 3302–3311, 2005.
Schumann, U.: TROCCINOX – Tropical Convection, Cirrus andNitrogen Oxides 795 Experiment, Overview, General Assembly2005 of the European Geosciences Union, Vienna, Austria, 24–29 April, 2005.
Thomas, A., Borrmann, S., Kiemle, C., Cairo, F., Volk, C. M.,Beuermann, J., Lepuchov, B., Santacesaria, V., Matthey, R.,Rudakov, V., Yushkov, V., Mackenzie, A. R., and Stefanutti, L.:In situ measurements of background aerosol and subvisible cirrusin the tropical tropopause region, J. Geophy. Res., 107, D2427,doi:2001JD001385, 2002.
Toon, O. B., Tolbert, M. A., Koehler, B. G., Middlebrook, A. M.,and Jordan, J.: The infrared optical constants of H2O – ice, amor-phous acid solutions, and nitric acid hydrates, J. Geophys. Res.,99, 25631–25654, 1994.
Uthe, E. E. and Russell, P. B.: Lidar observations of tropical highaltitude cirrus clouds, in: Radiation in the Atmosphere, editedby: Bolle, H. J., Science Press, Princeton, 1976.
Wang, J. R., Liu, G., Spinhirne, J. D., Racette, P., and Hart, W.D.: Observations and retrievals of cirrus cloud parameters us-ing multichannel millimeter-wave radiometric measurements, J.Geophys. Res., 106(D14), 15251-15263, 2001.
Young, S. A.: Analysis of lidar backscatter profiles in optical thinclouds, Appl. Optics, 30, 7019–7024, 1995.
Atmos. Meas. Tech., 4, 557–570, 2011 www.atmos-meas-tech.net/4/557/2011/


![Rutherford Backscattering Spectrometry (RBS) · 2013-05-14 · Rutherford Backscattering Spectrometry (RBS) Rutherford Backscattering Spectrometry . Quiz [3] “natural” unit in](https://img.pdfslide.net/doc/110x75/5fb3ede1e819350a63085fbf/rutherford-backscattering-spectrometry-rbs-2013-05-14-rutherford-backscattering.jpg)


![[Chu] Backscattering Spectrometry](https://img.pdfslide.net/doc/110x75/553e2752550346b9308b4919/chu-backscattering-spectrometry.jpg)