Embed Size (px)
Citation preview
Running head: ACADEMIC TECHNOLOGY USE ACROSS DISCIPLINES 1
A Comparison of Student and Faculty Academic Technology Use Across Disciplines
Kevin R. Guidry
Allison BrckaLorenz
Indiana University-Bloomington

ACADEMIC TECHNOLOGY USE ACROSS DISCIPLINES 2
A Comparison of Student and Faculty Academic Technology Use Across Disciplines
Technology is often believed to be an enabler, a way of surpassing our natural
limitations. In the classroom, technology is employed in the hopes that it will enable students to
learn more effectively and teachers to teach more effectively. Although the empirical research is
often mixed or contradictory with respect to the effectiveness of technology and the reasons for
that effectiveness (Bernard et al., 2004; Sitzmann, Kraiger, Stewart, & Wisher, 2006; U. S.
Department of Education, 2009), undergraduates expect faculty to use technology and use it well
(Smith, Salaway, & Karuso, 2009).
Several complex ideas must be untangled to understand this phenomenon. First, we must
unpack what kind and how often technologies are used by students and faculty. Second, we must
understand their experiences in the contexts in which they live them. Arguably, one of the most
pervasive of those contexts is the disciplinary structure that permeates American higher
education. Finally, we must explore potential differences in how students and faculty – two very
different populations who use academic technologies in very different contexts – view and use
these technologies.
Literature Review
A growing body of research has linked student engagement – a proxy of student learning
and involvement closely associated with the National Survey of Student Engagement (NSSE)
and related surveys – with technology. Using data from the College Student Experiences
Questionnaire (CSEQ), the predecessor to NSSE, Kuh and Hu (2001) found a positive
relationship between a student’s use of technologies and self-reported gains in science and
technology, vocational preparation, and intellectual development. In another study, Hu and Kuh
(2001) also found that students attending more “wired” institutions not only used computers
more frequently but they also reported higher rates of engagement than students at other

ACADEMIC TECHNOLOGY USE ACROSS DISCIPLINES 3
institutions. Data from NSSE have repeatedly indicated that student use of information
technology is not only strongly associated with measures of learning and engagement such as
academic challenge, active and collaborative learning, and student-faculty interaction but also
that students who more frequently use technology report greater gains in knowledge, skills, and
personal growth (NSSE, 2003; NSSE, 2006; Chen, Lambert, & Guidry, 2010).
Despite the research that has linked technology with positive educational outcomes and
learning, a number of researchers have argued convincingly for decades that any link between
technology and learning is indirect at best. Clark, Yates, Early, and Moulton (2009) provide an
excellent brief overview of these arguments while Clark (2001) provides an in-depth, book-
length review. These arguments typically focus on the pedagogical changes that inevitably
accompany the introduction of technology into the class or classroom, arguing that those changes
are responsible for changes in learning and not the technologies themselves. The federal
government’s now-defunct Office of Technology Assessment summarized this argument neatly:
“…it is becoming increasingly clear that technology, in and of itself, does not directly change
teaching or learning. Rather, the critical element is how technology is incorporated into
instruction” (1995, p. 57).
One possible explanation for the link between the use of technology and positive
education outcomes is that use of technology is often linked to increased time-on-task. For
example, a recent meta-analysis commissioned by the U. S. Department of Education (2009)
examined the relationship between learning outcomes and online and hybrid courses. The
authors concluded that both online and hybrid courses have a significant positive impact on
learning outcomes, with hybrid courses having a greater impact. In sympathy with the
arguments against a simple link between technology and education, the authors cautioned that

ACADEMIC TECHNOLOGY USE ACROSS DISCIPLINES 4
the “positive effects associated with blended learning should not be attributed to the media, per
se” (p. ix). In fact, a close reading of their report shows that online and hybrid courses appear to
require more time-on-task than offline courses, a potential explanation for their increased
effectiveness. Indeed, NSSE data support this conclusion. In his 2004 analysis of students’
online habits, NSSE researcher Thomas Nelson-Laird concluded that “student who devote most
of their online time to academics are more likely to engage in other effective education
practices” (abstract).
Another possible way to better understand the relationship between academic
technologies and educational outcomes is to examine the different ways that student and faculty
members in different academic disciplines use technology. In American higher education,
academic disciplines and discipline-based departments are “the foundation of scholarly
allegiance and political power, and the focal point for the definition of faculty as professionals”
(Gappa, Austin, and Trice, 2007). Disciplinary affiliation shapes how faculty conceive of
knowledge and how they teach (e.g. Prosser and Trigwell, 1999; Neumann, 2001), how they use
technology in their teaching (e.g. Waggoner, 1994), and the impact of technology on their
students (e.g. Kulik, Kulik, and Cohen, 1980).
This study extends the research into faculty and student use of contemporary academic
technologies by asking five questions: First, how often do students report using academic
technologies? Second, how often do faculty report using academic technologies? Third, do
students in different disciplines use these technologies more or less than their peers? Fourth, do
faculty in different disciplines use these technologies more or less than their peers? Finally, are
there noticeable differences between how often students and faculty use these technologies?
Methodology

ACADEMIC TECHNOLOGY USE ACROSS DISCIPLINES 5
This study examines responses to a pair of surveys – the National Survey of Student
Engagement (NSSE) and the Faculty Survey of Student Engagement (FSSE) – administered in
the spring of 2009. Eighteen American colleges and universities participating in both surveys
administered a matched set (student and faculty) of additional questions focused on academic
technology and communication media; these additional questions are in Appendices A and B.
The 18 institutions that participated in both the student and faculty surveys are a diverse
group of institutions. Eight are public institutions, eight are private non-profit institutions, and
two are for-profit institutions. These institutions range from relatively small baccalaureate
colleges through medium-sized Master’s Colleges and Universities and Special Focus
Institutions to large research universities; the average enrollment was 5300 students. And two of
the institutions are Historically Black Colleges or Universities (HBCUs).
Only the 4,503 randomly-selected senior student respondents are included in this
analysis. Unlike their classmates in their first-year of study, senior students not only have a
declared major but likely have taken and are taking many classes in their discipline. Similarly,
only the 747 faculty members who teach primarily upper-division courses or senior students
were included as they more likely teach courses that more clearly demonstrate differences
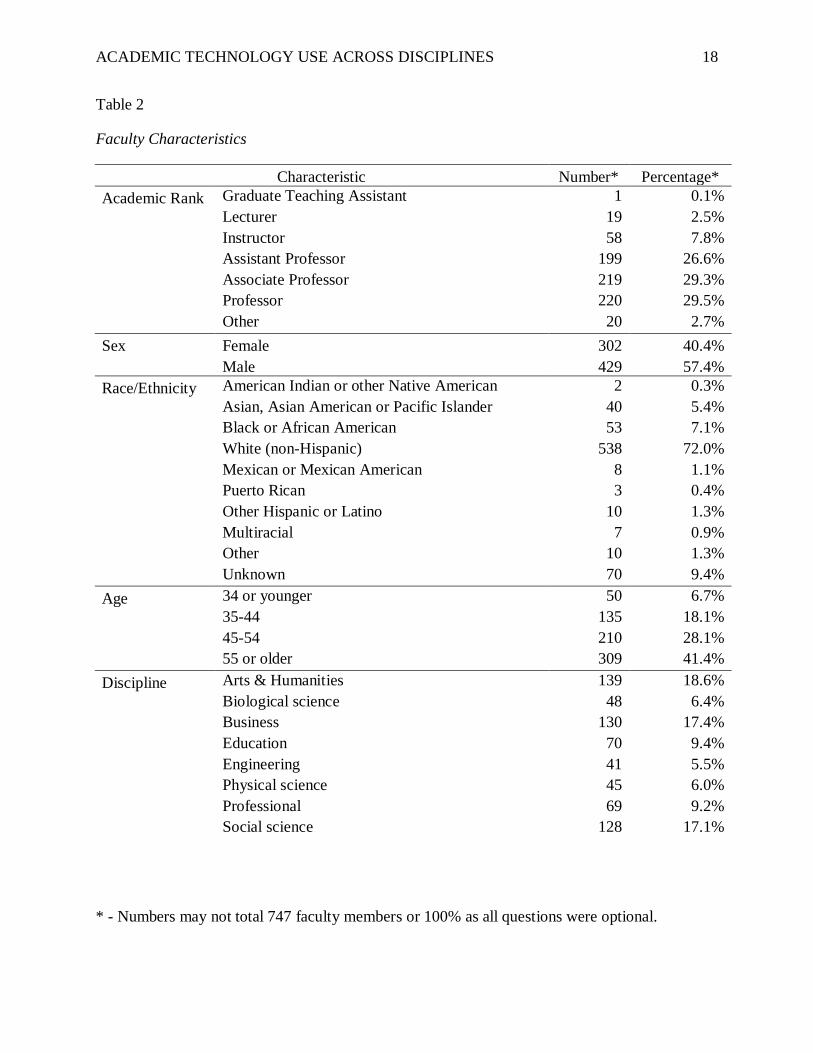
between disciplines. Most student respondents were enrolled full-time (76.7%), female (68.2%),
and White (61.7%). Most faculty respondents were male (57.4%) and White (72.0%).
Additional respondent characteristics are in Tables 1 and 2.
Further, this study only focuses on one ten-part question on the experimental instrument.
For students, this question asked: “During the current school year, about how often did you use
the following technology in your course?” Faculty were asked: “During the current school year,
how often did you use the following technology in your courses?” Following this question was a

ACADEMIC TECHNOLOGY USE ACROSS DISCIPLINES 6
list of ten technologies with the response options: Never, Sometimes, Often, Very often, I do not
know what this is. The full questions and response sets are in the appendices.
The specific technologies included:
a. Course management systems (WebCT, Blackboard, Desire2Learn, Sakai, etc.)
b. Student response systems (clickers, wireless learning calculator systems, etc.)
c. Online portfolios
d. Blogs
e. Collaborative editing software (Wikis, Google Docs, etc.)
f. Online student video projects (using YouTube, Google Video, etc.)
g. Video games, simulations, or virtual worlds (Ayiti, EleMental, Second Life,
Civilization, etc.)
h. Online survey tools (SurveyMonkey, Zoomerang, etc.)
i. Videoconferencing or Internet phone chat (Skype, TeamSpeak, etc.)
j. Plagiarism detection tools (Turnitin, DOC Cop, etc.)
Beyond those described above, particularly the criteria used to select the participants, no
controls were employed in these analyses. This study seeks to understand the student and faculty
experiences without seeking to make predictions or describe causal relationships. Not only do
the number of disciplines explored and number of faculty surveyed make it difficult to perform
complex analyses (e.g. cell sizes quickly grow very small) but the researchers hope that this
study will be readable and easily applied to practice by practitioners such as faculty developers
and information technology professionals. Although the latent social, cultural, and economic
causes are interesting and important, they are complex and beyond the scope of this study and its
two brief surveys.

ACADEMIC TECHNOLOGY USE ACROSS DISCIPLINES 7
In addition to comparing means and identifying homogenous subgroups using Tukey’s
post-hoc test, cluster analysis was performed on both student and faculty responses. Cluster
analysis is a statistical procedure that groups cases together based on similarities in specified
variables. K-means clustering, the specific method of cluster analysis employed in this study,
groups cases together based on their distance from a mean or center value of the specified
variables. The cluster assignments and center values are iteratively modified by the clustering
algorithm until clusters and center values are stable. In this instance, students and faculty
members were grouped together based on their responses to these frequency-of-use questions.
Although each cluster is described by its center values, the researchers must interpret those
values and the meanings of the clusters (Aldenderfer & Blashfield, 1984; Norušis, 2010).
In this study, the researchers discovered after repeated trials that 4-means analysis
yielded the most logical and useful clusters for students whereas 3-means analysis was most
useful for faculty. More granular clusters may have been desirable but dividing respondents in
eight disciplines into multiple clusters quickly yielded small cell sizes, reducing the researchers’
ability to perform meaningful analysis and interpretation. The four student clusters grouped
students into High use, Medium use, Low use, and No use of technology. Similarly, the faculty
were grouped into High use, Low use, and No use. For both groups of respondents, all groups
made frequent or some use of course management systems except for the No use groups.
Results
The first and second research questions asked how often students and faculty report using
academic technologies. Of the ten technologies on this survey, students use only course
management systems frequently with the average response being “often.” The other
technologies are used by some students but with low frequency and mixed variances with most
ACADEMIC TECHNOLOGY USE ACROSS DISCIPLINES 8
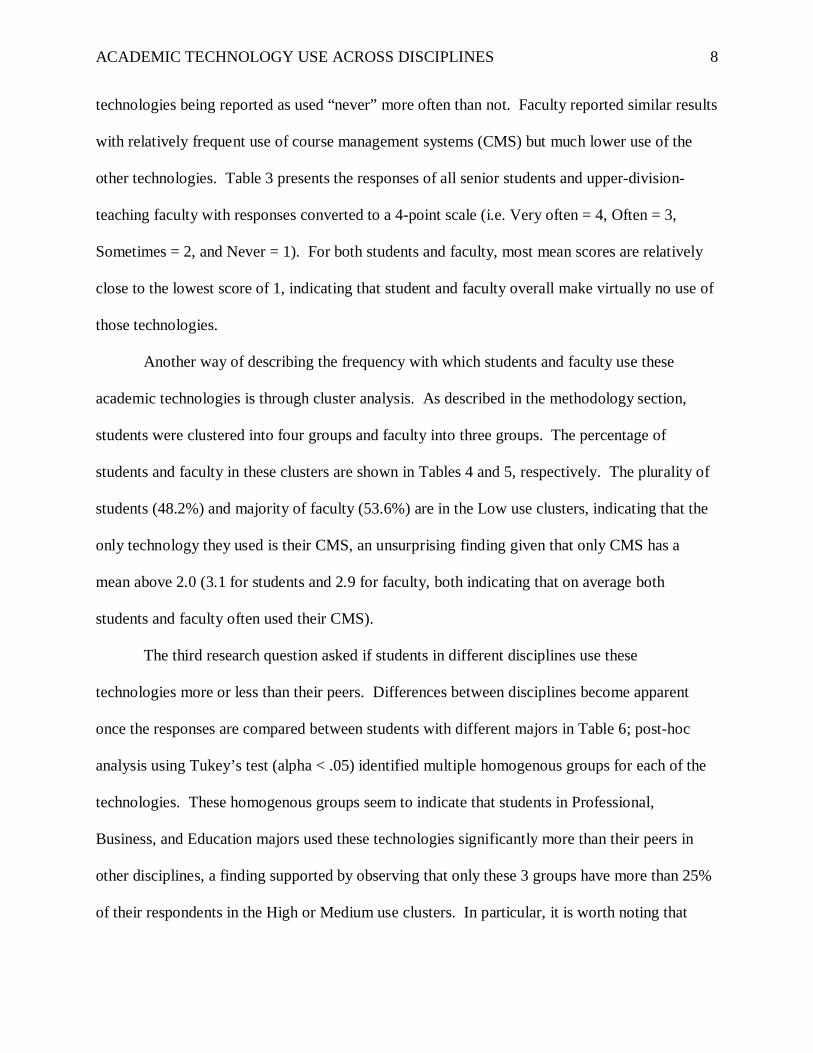
technologies being reported as used “never” more often than not. Faculty reported similar results
with relatively frequent use of course management systems (CMS) but much lower use of the
other technologies. Table 3 presents the responses of all senior students and upper-division-
teaching faculty with responses converted to a 4-point scale (i.e. Very often = 4, Often = 3,
Sometimes = 2, and Never = 1). For both students and faculty, most mean scores are relatively
close to the lowest score of 1, indicating that student and faculty overall make virtually no use of
those technologies.
Another way of describing the frequency with which students and faculty use these
academic technologies is through cluster analysis. As described in the methodology section,
students were clustered into four groups and faculty into three groups. The percentage of
students and faculty in these clusters are shown in Tables 4 and 5, respectively. The plurality of
students (48.2%) and majority of faculty (53.6%) are in the Low use clusters, indicating that the
only technology they used is their CMS, an unsurprising finding given that only CMS has a
mean above 2.0 (3.1 for students and 2.9 for faculty, both indicating that on average both
students and faculty often used their CMS).
The third research question asked if students in different disciplines use these
technologies more or less than their peers. Differences between disciplines become apparent
once the responses are compared between students with different majors in Table 6; post-hoc
analysis using Tukey’s test (alpha < .05) identified multiple homogenous groups for each of the
technologies. These homogenous groups seem to indicate that students in Professional,
Business, and Education majors used these technologies significantly more than their peers in
other disciplines, a finding supported by observing that only these 3 groups have more than 25%
of their respondents in the High or Medium use clusters. In particular, it is worth noting that
ACADEMIC TECHNOLOGY USE ACROSS DISCIPLINES 9
Professional students make significantly more use of classroom response devices (“clickers”)
and Education students make significantly more use of e-portfolios than students in all other
disciplines.
The fourth research question asked if faculty in different disciplines use these
technologies more or less than their peers. Similar to the student respondents, differences are
evident in the faculty responses although there are fewer differences (see Table 7). Examination
of the homogenous groups indicate that faculty of all disciplines reported using blogs,
collaborative editing software, and games with similar frequencies. For those technologies
which faculty employed more in specific disciplines, similar patterns were obtained as for the
student responses: Professional and Education faculty used many of these technologies more
often than other faculty.
Faculty of all disciplines make uniformly low use of some technologies: blogs,
collaborative editing tools, and games and simulations. The mean frequencies of use for these
tools near “none” (1.0) for faculty in all disciplines. Moreover, the means for all disciplines are
statistically identical at the p < .05 level of significance. In other words, the average frequencies
of use of these three technologies are virtually indistinguishable across the disciplines.
The picture is more complex, however, when one examines the faculty clusters.
Education faculty stand out as clear leaders in the use of technology. Although there are many
faculty in the Arts and Humanities disciplines who are in the High use cluster, they are also the
second largest group in the No use cluster, indicating a bifurcation where these faculty either
used multiple technologies or none. Professional faculty, on the other hand, made relatively low
use of each technology except for their CMS which nearly all of them used with some frequency.

ACADEMIC TECHNOLOGY USE ACROSS DISCIPLINES 10
The final research question asked if there are noticeable differences between how often
students and faculty use these technologies. As indicated by the mean scores and their
distribution among clusters, students indicated more frequent use of virtually all of these
technologies than faculty. This remains true when one examines the significant differences
between disciplines and when one compares the student and faculty clusters. The only exception
is plagiarism detection tools, a technology in that faculty reported using slightly more than
students.
Discussion
Students and faculty of all disciplines used their institution’s CMS much more frequently
than any other specific technology or tool. This is good news considering the ubiquity and
expense of these systems. The consistency is also heartening when juxtaposed with students’
professed desire for frequent and consistent use of CMSs in their courses (Smith, Salaway, &
Karuso, 2009). However, that excitement may be dampened by remembering that some
technologies – blogs, collaborative editing tools, and games and simulations – are uniformly
unused by faculty in all disciplines.
Students reported more use of all technologies than faculty. This may be a simple
difference in perception or an artifact of the methodology of this study but those explanations
seem incomplete and unsatisfactory. It is more likely that students are using technologies more
than faculty are requiring or expecting them to use them. For example, students in all disciplines
reported using collaborative editing tools more often than faculty. Those tools may not be
required by faculty but used by students out of class to collaborate and complete group
assignments.

ACADEMIC TECHNOLOGY USE ACROSS DISCIPLINES 11
The consistently high frequency of technology use reported by students and faculty in the
Professional, Business, and Education disciplines seems to reflect values of those professions,
resources available to them, and the specific content of the survey instrument. For example,
Education students and faculty both reported making more frequent use of e-portfolios than any
other disciplines, a usage that can be understood given the very high importance placed on
effective assessment of learning outcomes in education programs. It is also possible that some
disciplines with greater access to financial resources simply have greater access to technologies.
Finally, the technologies on the survey instrument may be more amenable to these
interdisciplinary and applied groups of disciplines.
Limitations
The greatest limitation of this study is that these two surveys were administered to two
different groups of participants in different contexts. Students respond to NSSE in the context of
all of their classes taken in the semester or quarter during which the survey is administered
(typically February through May). Faculty, on the other hand, respond either in the context of a
typical student or class they have taught in the current school year, depending on the survey
option selected by their institution. Directly comparing these responses, even with the careful
selection employed in this study, presents some obvious limitations and challenges.
Additionally, the additional technology questions asked in the supplemental survey
attached to NSSE and FSSE were not tested for reliability and validity nearly as heavily as the
questions in the main NSSE and FSSE surveys. Although the researchers are confident in the
face and construct validity of these questions, these questions remain new and relatively
untested.

ACADEMIC TECHNOLOGY USE ACROSS DISCIPLINES 12
Finally, the participants in these surveys were not selected completely at random. At
each institution, the student participants in NSSE were randomly selected or part of a census
whereas each institution selected its own sampling strategy for faculty participants in FSSE.
More importantly, the institutions invited to participate in this study were intentionally selected
to maximize diversity among institutions and respondents. Institutions could choose to not
administer these additional questions, potentially limiting the participants to those at institutions
with a particular interest in technology.
Future Research
Future studies that employ more focused surveys and other methods of research may go
beyond the descriptive findings of this study to explore relationships between disciplines and
personal and institutional characteristics. Moreover, future studies employing different methods
may be able to explore causation i.e. why particular disciplines use (or do not use) particular
technologies. This is particularly important if we are to avoid idolizing or condemning
disciplines simply for their use or non-use of academic technologies. Building off of the findings
in this study that students appear to use technologies more than faculty require their use, future
research should also focus on apparent differences between student and faculty uses and views of
technology, particularly student use of technologies not assigned or required by faculty members.
Finally, further research along the same lines as this study will always be necessary simply to
explore the uses of new technologies as they become available and grow in popularity (e.g.
microblogging, location-aware mobile technologies, and tablet computers).
Conclusion
Not only do students and faculty use technologies in different frequencies, students and
faculty in different disciplines use different technologies in different frequencies. Hence a “one-

ACADEMIC TECHNOLOGY USE ACROSS DISCIPLINES 13
size-fits-all” approach to providing and supporting academic technologies is insufficient.
Moreover, students and faculty have different expectations and use technologies in different
contexts, differences that may create tension and misunderstandings between these two groups.

ACADEMIC TECHNOLOGY USE ACROSS DISCIPLINES 14
References
Aldenderfer, M. S., & Blashfield, R. K. (1984). Cluster analysis. In R. G. Niemi (Series Ed.),
Series: Quantitative applications in the social sciences (Vol. 44). Newbury Park, CA:
SAGE Publications.
Bernard, R., et al. (2004). How does distance education compare with classroom instruction? A
meta-analysis of the empirical literature. Review of Educational Research, 74, 379–439.
Clark, R. E. (Ed.) (2001). Learning from media: Argument, analysis, and evidence. Greenwich,
CT: Information Age Publishing.
Clark, R. E., Yates, K., Early, S. & Moulton, K. (2009). An analysis of the failure of electronic
media and discovery-based learning: Evidence for the performance benefits of guided
training methods. In K. H. Silber, & R. Foshay, (Eds.). Handbook of improving
workplace performance, Volume I: Instructional design and training delivery (pp. 263-
297). Washington, DC: International Society for Performance Improvement.
Gappa, J. M., Austin, A. E., & Trice, A. G. (2007). Rethinking faculty work: Higher education’s
strategic imperative. San Francisco, CA: Jossey-Bass.
Hu, S., & Kuh, G. D. (2001, November 24). Computing experience and good practices in
undergraduate education: Does the degree of campus “wiredness” matter? Education
Policy Analysis Archives, 9(49). Retrieved from http://epaa.asu.edu/epaa/v9n49.html
Kuh, G. D., & Hu, S. (2001). The relationships between computer and information technology
use, student learning, and other college experiences. Journal of College Student
Development, 42, 217-232.
Kulik, C., Kulik, J. A., & Cohen, P. A. (1980). Instructional technology and college teaching.
Teaching of psychology, 7(4), 199-205.

ACADEMIC TECHNOLOGY USE ACROSS DISCIPLINES 15
National Survey of Student Engagement. (2003). NSSE viewpoint: Converting data into action:
expanding the boundaries of institutional improvement. Bloomington, IN: Indiana
University.
National Survey of Student Engagement. (2006). Engaged learning: Fostering success for all
students. Bloomington, IN: Indiana University.
Nelson Laird, T. F. (2004). Surfin' with a purpose: Examining how spending time online is
related to student engagement. Student Affairs On-Line, 5(3).
Neumann, R. (2001). Disciplinary differences and university teaching. Studies in higher
education, 26(2), 135-146.
Norušis, M. J. (2010). PASW Statistics 18 statistical procedures companion. Upper Saddle River,
NJ: Pearson.
Office of Technology Assessment. (1995). Teachers & technology: Making the connection.
Washington, DC: Author.
Prosser, M., & Trigwell, K. (1999). Understanding learning and teaching: The experience in
higher education. Malabar, FA: Open University Press.
Sitzmann, T., Kraiger, K., Stewart, D., & Wisher, R. (2006). The comparative effectiveness of
web-based and classroom instruction: A meta-analysis. Personnel Psychology, 59, 623-
664.
Smith, S. D., Salaway, G., & Karuso, J. B. (2009). The ECAR study of undergraduate students
and information technology, 2009. Boulder, CO: EDUCAUSE Center for Applied
Research.

ACADEMIC TECHNOLOGY USE ACROSS DISCIPLINES 16
U. S. Department of Education (2009). Evaluation of evidence-based practices in online
learning: A meta-analysis and review of online learning studies. Washington, DC: U. S.
Department of Education.
Waggoner, M. D. (1994). Disciplinary differences and the integration of technology into
teaching. Technology, pedagogy and education, 3(2), 175-186.

ACADEMIC TECHNOLOGY USE ACROSS DISCIPLINES 17
Table 1
Student Characteristics
Characteristic Number* Percentage* Enrollment Status Full-time 3,455 76.7% Less than full-time 1,047 23.3% Sex Female 3,070 68.2% Male 1,431 31.8% Race/Ethnicity African American/Black 584 13.0%
American Indian/Alaska Native 25 0.6%
Asian/Pacific Islander 178 4.0% Caucasian/White 2,780 61.7% Hispanic 251 5.6% Other 75 1.7% Foreign 54 1.2% Multi-racial/ethnic 8 0.2% Unknown 131 2.9% Age Non-traditional (24 or older) 1,823 40.5% Traditional (less than 24) 2,645 58.7% Major Arts and Humanities 530 11.8%
Biological Sciences 326 7.2%
Business 867 19.3%
Education 561 12.5%
Engineering 210 4.7%
Physical Science 155 3.4%
Professional 514 11.4%
Social Science 619 13.7%
Other 653 14.5%
Undecided 2 0.0%
* - Numbers may not total 4,503 students or 100% as all questions were optional.
ACADEMIC TECHNOLOGY USE ACROSS DISCIPLINES 18
Table 2
Faculty Characteristics
Characteristic Number* Percentage* Academic Rank Graduate Teaching Assistant 1 0.1% Lecturer 19 2.5% Instructor 58 7.8% Assistant Professor 199 26.6% Associate Professor 219 29.3% Professor 220 29.5% Other 20 2.7% Sex Female 302 40.4% Male 429 57.4% Race/Ethnicity American Indian or other Native American 2 0.3% Asian, Asian American or Pacific Islander 40 5.4% Black or African American 53 7.1% White (non-Hispanic) 538 72.0% Mexican or Mexican American 8 1.1% Puerto Rican 3 0.4% Other Hispanic or Latino 10 1.3% Multiracial 7 0.9% Other 10 1.3% Unknown 70 9.4% Age 34 or younger 50 6.7% 35-44 135 18.1% 45-54 210 28.1% 55 or older 309 41.4% Discipline Arts & Humanities 139 18.6%
Biological science 48 6.4%
Business 130 17.4%
Education 70 9.4%
Engineering 41 5.5%
Physical science 45 6.0%
Professional 69 9.2%
Social science 128 17.1%
* - Numbers may not total 747 faculty members or 100% as all questions were optional.

ACADEMIC TECHNOLOGY USE ACROSS DISCIPLINES 19
Table 3
Responses
N Mean Std. Deviation Students CMS 4,106 3.1 1.0
Clickers 3,626 1.6 1.0
e-portfolios 3,797 1.5 0.9
Blogs 4,079 1.3 0.7
Collaborative editing software 3,980 1.8 1.1
Video 4,220 1.6 0.9
Games 4,094 1.2 0.6
Surveys 4,057 1.4 0.7
Video or voice conferencing 4,119 1.2 0.6
Plagiarism detection 4,048 1.4 0.8
Faculty CMS 710 2.9 1.3
Clickers 667 1.3 0.7
e-portfolios 688 1.4 0.8
Blogs 694 1.2 0.6
Collaborative editing software 683 1.2 0.6
Video 699 1.4 0.8
Games 692 1.2 0.5
Surveys 693 1.2 0.6
Voice or video conferencing 692 1.2 0.6
Plagiarism detection 695 1.5 0.9

ACADEMIC TECHNOLOGY USE ACROSS DISCIPLINES 20
Table 4
Student Clusters
High Use Medium Use Low Use No use
Arts and Humanities 2.1% 16.6% 43.2% 38.1% Biological Sciences 2.6% 18.5% 48.1% 30.9% Business 5.4% 23.4% 51.5% 19.6% Education 7.0% 21.4% 42.9% 28.7% Engineering 4.1% 13.0% 43.8% 39.0% Physical Science 1.9% 12.1% 50.5% 35.5% Professional 7.6% 22.8% 50.0% 19.6% Social Science 4.3% 18.9% 52.2% 24.6% All 4.8% 19.8% 48.2% 27.1%

ACADEMIC TECHNOLOGY USE ACROSS DISCIPLINES 21
Table 5
Faculty Clusters
High use Low use No use Arts and Humanities 11.7% 33.0% 55.3% Biological Sciences 7.3% 53.7% 39.0% Business 6.0% 67.0% 27.0% Education 17.9% 42.9% 39.3% Engineering 8.8% 35.3% 55.9% Physical Science 5.9% 52.9% 41.2% Professional 5.9% 86.3% 7.8% Social Science 7.0% 57.0% 36.0% All 8.9% 53.6% 37.6%

ACADEMIC TECHNOLOGY USE ACROSS DISCIPLINES 22
Table 6
Student Responses by Discipline*
Arts and Humanities Engineering
Physical Science
Biological Sciences
Social Science Education Business
CMS Professional
2.8 2.8 2.8 3.0 3.0
3.0 3.0 3.1
3.0 3.1 3.3
3.1 3.3 3.3
Clickers 1.4 1.4 1.4 1.5
1.4 1.4 1.5 1.6 1.6 1.6
1.9
e-portfolios 1.3 1.3 1.3 1.2 1.3 1.3 1.3 1.3 1.3
1.4 1.4
2.3
Blogs 1.3 1.3 1.2 1.2 1.3 1.3 1.4
1.3 1.3
1.3 1.4 1.3 1.4
Collab. editing software
1.5 1.7 1.5 1.7 1.7 1.8
1.7 1.7 1.7 1.8 1.9 1.8
Video 1.3 1.3 1.5 1.6
1.5 1.6 1.6 1.6 1.6
Games 1.1 1.2 1.1 1.2 1.2 1.2 1.1 1.2
1.2 1.2 1.2
1.3
1.2 1.2 1.2 1.2 1.3 1.3
Surveys 1.2 1.3 1.2 1.3 1.4
1.2 1.3
1.3
1.4
1.4
1.3 1.4 1.4 1.5 1.4
Video or voice conferencing
1.1
1.1 1.1 1.2 1.2 1.2 1.2
1.3 1.2 1.2 1.2
Plagiarism detection
1.3 1.3 1.3 1.4 1.4
1.4
1.3
1.4 1.4 1.5 1.4
1.4 1.4 1.5 1.4 1.6
* - Each row is a homogenous subgroups (Tukey’s test; p < .05)

ACADEMIC TECHNOLOGY USE ACROSS DISCIPLINES 23
Table 7
Faculty Responses by Discipline*
Arts and Humanities Engineering
Physical Science
Biological Sciences
Social Science Education Business
CMS Professional
2.4 2.5 2.9 2.8 2.9 2.9
2.5 2.9 2.8 2.9 2.9 3.1
3.1 3.7
Clickers 1.1 1.3 1.2 1.3 1.2 1.2 1.2 1.3 1.2 1.3 1.2 1.2 1.2 1.6
e-portfolios 1.3 1.4 1.2 1.3 1.2 1.3 1.3
2.1 Blogs 1.3 1.1 1.1 1.2 1.2 1.3 1.1 1.2
Collab. Editing tools
1.2 1.2 1.1 1.2 1.2 1.4 1.2 1.1
Video 1.3 1.2 1.1 1.3 1.4 1.3 1.3
1.3 1.3 1.4 1.6 1.3 1.3
Games 1.1 1.2 1.2 1.0 1.1 1.2 1.2 1.3
Surveys 1.1 1.3 1.1 1.1 1.3 1.4 1.3 1.1 1.3 1.3 1.4 1.3 1.4
Voice or video conferencing
1.1
1.0 1.1
1.1
1.1
1.3
1.1
1.1 1.3
1.3
1.1 1.4 1.1 1.3
1.4 1.3 1.4 1.3
Plagiarism detection
1.3 1.2 1.4 1.5 1.4 1.4
1.7 1.3
1.4 1.5 1.4 1.4
1.7 1.4 1.5 1.4 1.4 1.8
* - Each row is a homogenous subgroups (Tukey’s test; p < .05)
ACADEMIC TECHNOLOGY USE ACROSS DISCIPLINES 24
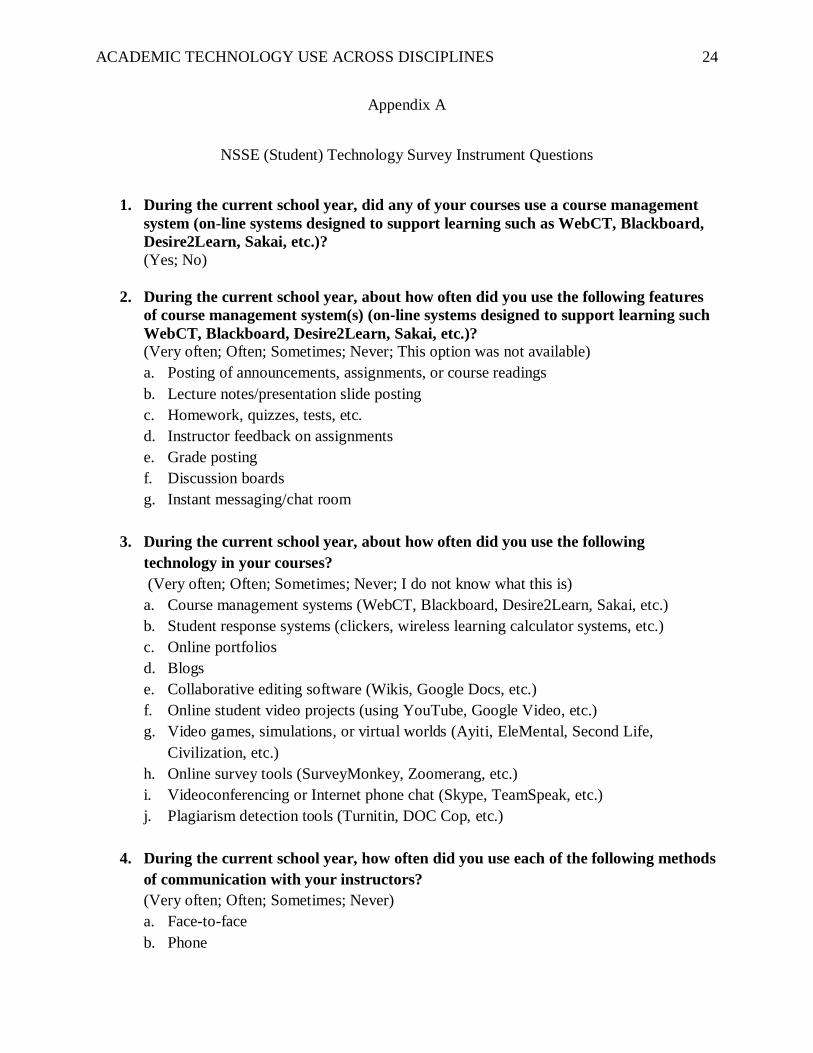
Appendix A
NSSE (Student) Technology Survey Instrument Questions
1. During the current school year, did any of your courses use a course management system (on-line systems designed to support learning such as WebCT, Blackboard, Desire2Learn, Sakai, etc.)? (Yes; No)
2. During the current school year, about how often did you use the following features of course management system(s) (on-line systems designed to support learning such WebCT, Blackboard, Desire2Learn, Sakai, etc.)? (Very often; Often; Sometimes; Never; This option was not available) a. Posting of announcements, assignments, or course readings b. Lecture notes/presentation slide posting c. Homework, quizzes, tests, etc. d. Instructor feedback on assignments e. Grade posting f. Discussion boards g. Instant messaging/chat room
3. During the current school year, about how often did you use the following technology in your courses? (Very often; Often; Sometimes; Never; I do not know what this is) a. Course management systems (WebCT, Blackboard, Desire2Learn, Sakai, etc.) b. Student response systems (clickers, wireless learning calculator systems, etc.) c. Online portfolios d. Blogs e. Collaborative editing software (Wikis, Google Docs, etc.) f. Online student video projects (using YouTube, Google Video, etc.) g. Video games, simulations, or virtual worlds (Ayiti, EleMental, Second Life,
Civilization, etc.) h. Online survey tools (SurveyMonkey, Zoomerang, etc.) i. Videoconferencing or Internet phone chat (Skype, TeamSpeak, etc.) j. Plagiarism detection tools (Turnitin, DOC Cop, etc.)
4. During the current school year, how often did you use each of the following methods of communication with your instructors? (Very often; Often; Sometimes; Never) a. Face-to-face b. Phone

ACADEMIC TECHNOLOGY USE ACROSS DISCIPLINES 25
c. Text messaging on a cell phone d. E-mail e. Discussion boards/course management system postings f. Instant messaging/chat rooms g. Social network sites (Facebook, LinkedIn, MySpace, etc.) h. Other (write-in)
5. During the current school year, about how many of your classes did you take
entirely online? (All; Most; Some; None)

ACADEMIC TECHNOLOGY USE ACROSS DISCIPLINES 26
Appendix B
FSSE (Faculty) Technology Survey Instrument Questions
For the following questions, please answer with regard to the undergraduate courses that you teach.
1. During the current school year, did you use a course management system(s) (online systems designed to support learning such as WebCT, Blackboard, Desire2Learn, Sakai, etc.)? (Yes; No)
Note: Respondents that answer “no” to question 1 did not receive questions 2 and 3.
2. Do you use your institution or department’s supported course management system(s)? (Yes; No, my institution or department supports a course management system(s), but I use something else; No, my institution or department does not support a course management system (s))
3. During the current school year, about how often did you use the following features
of a course management system(s)? (Very often; Often; Sometimes; Never; This option was not available) a. Posting of announcements, assignments, or course readings b. Lecture notes/presentation slide posting c. Homework, quizzes, tests, etc. d. Instructor feedback on assignments e. Grade posting f. Discussion boards g. Instant messaging/chat room
4. During the current school year, about how often did you use the following
technology in your courses? (Very often; Often; Sometimes; Never; I do not know what this is) a. Course management systems (WebCT, Blackboard, Desire2Learn, Sakai, etc.) b. Student response systems (clickers, wireless learning calculator systems, etc.) c. Online portfolios d. Blogs e. Collaborative editing software (Wikis, Google Docs, etc.) f. Online student video projects (using YouTube, Google Video, etc.)

ACADEMIC TECHNOLOGY USE ACROSS DISCIPLINES 27
g. Video games, simulations, or virtual worlds (Ayiti, EleMental, Second Life, Civilization, etc.)
h. Online survey tools (SurveyMonkey, Zoomerang, etc.) i. Videoconferencing or Internet phone chat (Skype, TeamSpeak, etc.) j. Plagiarism detection tools (Turnitin, DOC Cop, etc.)
5. During the current school year, how often did you use each of the following methods
of communication with your students? (Very often; Often; Sometimes; Never) a. Face-to-face b. Phone c. Text messaging on a cell phone d. E-mail e. Discussion boards/course management system postings f. Instant messaging/chat rooms g. Social network sites (Facebook, LinkedIn, MySpace, etc.) h. Other (write-in)
6. During the current school year, about how many of your courses did you teach
entirely online? (All; Most; Some; None)