Embed Size (px)
Citation preview
February 2010
NASA/TP–2010-216200
A Comprehensive Validation Methodology for Sparse Experimental Data Ryan B. Norman University of Tennessee, Knoxville, Tennessee
Steve R. Blattnig Langley Research Center, Hampton, Virginia

NASA STI Program . . . in Profile
Since its founding, NASA has been dedicated to the advancement of aeronautics and space science. The NASA scientific and technical information (STI) program plays a key part in helping NASA maintain this important role.
The NASA STI program operates under the auspices of the Agency Chief Information Officer. It collects, organizes, provides for archiving, and disseminates NASA’s STI. The NASA STI program provides access to the NASA Aeronautics and Space Database and its public interface, the NASA Technical Report Server, thus providing one of the largest collections of aeronautical and space science STI in the world. Results are published in both non-NASA channels and by NASA in the NASA STI Report Series, which includes the following report types:
• TECHNICAL PUBLICATION. Reports of
completed research or a major significant phase of research that present the results of NASA programs and include extensive data or theoretical analysis. Includes compilations of significant scientific and technical data and information deemed to be of continuing reference value. NASA counterpart of peer-reviewed formal professional papers, but having less stringent limitations on manuscript length and extent of graphic presentations.
• TECHNICAL MEMORANDUM. Scientific
and technical findings that are preliminary or of specialized interest, e.g., quick release reports, working papers, and bibliographies that contain minimal annotation. Does not contain extensive analysis.
• CONTRACTOR REPORT. Scientific and
technical findings by NASA-sponsored contractors and grantees.
• CONFERENCE PUBLICATION. Collected
papers from scientific and technical conferences, symposia, seminars, or other meetings sponsored or co-sponsored by NASA.
• SPECIAL PUBLICATION. Scientific,
technical, or historical information from NASA programs, projects, and missions, often concerned with subjects having substantial public interest.
• TECHNICAL TRANSLATION. English-
language translations of foreign scientific and technical material pertinent to NASA’s mission.
Specialized services also include creating custom thesauri, building customized databases, and organizing and publishing research results. For more information about the NASA STI program, see the following: • Access the NASA STI program home page at
http://www.sti.nasa.gov • E-mail your question via the Internet to
[email protected] • Fax your question to the NASA STI Help Desk
at 443-757-5803 • Phone the NASA STI Help Desk at
443-757-5802 • Write to:
NASA STI Help Desk NASA Center for AeroSpace Information 7115 Standard Drive Hanover, MD 21076-1320
National Aeronautics and Space Administration Langley Research Center Hampton, Virginia 23681-2199
February 2010
NASA/TP–2010-216200
A Comprehensive Validation Methodology for Sparse Experimental Data Ryan B. Norman University of Tennessee, Knoxville, Tennessee
Steve R. Blattnig Langley Research Center, Hampton, Virginia
Available from:
NASA Center for AeroSpace Information 7115 Standard Drive
Hanover, MD 21076-1320 443-757-5802
Acknowledgments
The authors would like to thank Lawrence Townsend, William Oberkampf, Mike Hemsch, and Cary Zeitlin for their insight and helpful discussions concerning this work and Francis Cucinotta for access to the QMSFRG database. The authors would also like to thank Dimos Sampsonidis for kindly allowing us access to experimental data. This work was supported, in part, by NASA Research Grant NNX08AM65A.
Contents
1 Introduction 1
2 Nuclear Models used for Space Radiation 2
2.1 The NUCFRG2 Model . . . . . . . . . . . . . . . . . . . . . . . . . . . . . . . . . 42.2 The QMSFRG Model . . . . . . . . . . . . . . . . . . . . . . . . . . . . . . . . . 4
3 Model Validation 5
3.1 Cumulative Uncertainty Metrics . . . . . . . . . . . . . . . . . . . . . . . . . . . 73.1.1 Cumulative Absolute Uncertainty . . . . . . . . . . . . . . . . . . . . . . . 7
3.2 Validation metric based on median statistics . . . . . . . . . . . . . . . . . . . . . 133.3 Application of the Median Metric . . . . . . . . . . . . . . . . . . . . . . . . . . . 14
4 Summary and Conclusions 18
References 21
Appendix A QMSFRG Interpolation 24
Appendix B Cumulative Relative Uncertainty 26
iii
List of Figures
1 An illustration of the functions D+(xi) and D−(xi) for arbitrary model and ex-perimental values. . . . . . . . . . . . . . . . . . . . . . . . . . . . . . . . . . . . 9
2 Cumulative absolute uncertainty distributions for NUCFRG2 and interpolatedQMSFRG compared to the experimental database, along with the distributionfor the cumulative uncertainty due to experiment. . . . . . . . . . . . . . . . . . 11
3 Same as Fig. 2 with focus on the .9 to 1.0 fraction of data. . . . . . . . . . . . . 124 Median uncertainty for NUCFRG2 and interpolated QMSFRG along with the
median uncertainty due to the experiment for the experimental database [7, 11–39] as a function of projectile type. . . . . . . . . . . . . . . . . . . . . . . . . . . 15
5 Same as Fig. 4, except as a function of ∆Z, the charge removed from the projectile. 166 Same as Fig. 4, except as a function of the fragment charge, Zfrag. . . . . . . . . 177 Same as Fig. 4, except as a function of target. . . . . . . . . . . . . . . . . . . . . 188 Cumulative relative uncertainty distributions for NUCFRG2 and interpolated
QMSFRG compared to the experimental database, along with the distributionsfor cumulative uncertainty due to the experiment for both models. . . . . . . . . 27
List of Tables
1 Overview of the experimental database [7, 11–39] assembled for validation. . . . . 82 Median uncertainty for NUCFRG2 and interpolated QMSFRG along with the
uncertainty due to the experiment for the experimental database [7, 11–39] shownfor 3 projectile energy domains. . . . . . . . . . . . . . . . . . . . . . . . . . . . . 14
3 QMSFRG cross sections reported in Ref. [8] published 2007. . . . . . . . . . . . . 244 QMSFRG cross sections reported in Ref. [11] published 2001. . . . . . . . . . . . 25
iv
Abstract
A comprehensive program of verification and validation has been undertaken to as-sess the applicability of models to space radiation shielding applications and to trackprogress as models are developed over time. The models are placed under configura-tion control, and automated validation tests are used so that comparisons can readilybe made as models are improved. Though direct comparisons between theoreticalresults and experimental data are desired for validation purposes, such comparisonsare not always possible due to lack of data. In this work, two uncertainty metricsare introduced that are suitable for validating theoretical models against sparse ex-perimental databases. The nuclear physics models, NUCFRG2 and QMSFRG, arecompared to an experimental database consisting of over 3600 experimental crosssections to demonstrate the applicability of the metrics. A cumulative uncertaintymetric is applied to the question of overall model accuracy, while a metric based onthe median uncertainty is used to analyze the models from the perspective of modeldevelopment by analyzing subsets of the model parameter space.
1 Introduction
With NASA’s vision for space exploration emphasizing human exploration beyond low Earthorbit (LEO), radiation exposure concerns have become increasingly important. As explorationmoves beyond LEO to radiation environments where much less data is available, models will bemore heavily relied upon to make decisions regarding vehicle shield design and overall missionplanning. This reliance on model results makes it critical to effectively validate these models inorder to determine their accuracy and reliability. In order to ensure confidence in the validationassessment, reliable and repeatable processes must be implemented. A validation assessmentdoes not lead to credible results if the validation process is unreliable or if the data or analyses arenot sufficient to make the appropriate conclusions. See Oberkampf and Barone [1], Oberkampfet al. [2], and Blattnig et al. [3] for further discussion on assessing model results.
The degree of confidence in a model is not only an issue of accuracy, but also of the rigorand completeness of the assessment itself. An essential aspect of a comprehensive validationeffort is the development of configuration-controlled verification and validation (V&V) test cases.Configuration control (also called configuration management) is a process in which consistency isestablished for a product (i.e. a model or a software suite), and any changes made to the productare tracked. The effects of the changes on the product are documented, and therefore, problemscaused by changes to the product can be backtracked. The models reviewed in this paper havebeen placed under configuration control with the criteria that the V&V test cases will be runwhen significant changes are made to those models. This approach allows accuracy to be trackedacross the relevant range of applications and avoid situations where model changes intended fora specific calculation or application actually decrease the overall accuracy. In addition, it willenable more complete accuracy assessments to measure progress against goals as the models andcodes are updated and as new data become available for validation. It also helps ensure modelresults are repeatable.
1
To properly assess the accuracy of a model, quantitative validation metrics [1] need to bedeveloped that are targeted at the applications of interest. A validation metric is a mathematicaloperator that quantitatively measures the difference between a model and experiment for anoutput value or system response quantity (SRQ) of interest. In general, a validation metric cantake any SRQ as an input. Different metrics or different SRQs may be required for different typesof applications and experimental databases. Additionally, ease of use and simplicity need to betaken into account when developing such metrics. Not only will researchers need to be able touse and understand such metrics when validating models, but also, the results of the validationactivity will need to be communicated to managers and decision makers. In that regard, thispaper uses two nuclear fragmentation models as a case study of the validation strategy currentlybeing implemented in several of NASA’s space radiation projects.
An important component of a comprehensive validation program is the experimental databaseused to validate the models. The database assembled for validation should be as comprehensiveas possible so that all phenomena of interest to the problem are represented. This process servesto help model developers understand what is essential to the problem and how well the modelsrepresent the phenomena. To validate the nuclear models used by NASA in space radiation ap-plications, a thorough literature survey was performed, and all available experimental datasetscontaining nuclear fragmentation total cross sections were assembled. Nuclear fragmentationtotal cross sections are the SRQs of the nuclear models used in space radiation applications.At the conclusion of the literature search, an experimental database of over 3600 cross sectionsfrom 30 different publications with data taken at 8 different experimental facilities from aroundthe world was assembled for validation.
2 Nuclear Models used for Space Radiation
Understanding nuclear interactions of heavy ions is of fundamental importance to the safe andreliable exploration of space. Outside the safety of Earth’s atmosphere and geomagnetic field,there is a nearly isotropic background of high energy, fully ionized radiation called galacticcosmic rays (GCR). The GCR spectrum consists mainly of protons and helium ions but includesall naturally occurring isotopes. A significant drop in flux of GCRs occurs for ions heavier thannickel. Prolonged exposure to GCR radiation can have dangerous health effects [4].
The effects of radiation on microelectronics is also of significance. As solid state devices havedecreased in size, the device current of the microelectronic is lowered. As a consequence, lessenergetic particles, which are more plentiful, can generate errors in which one or more logic bitshave their state changed. The errors caused by cosmic ray interactions can have adverse effectson computer systems integral to space operations.
To understand and quantify the risk to astronauts from space radiation exposure, a computersoftware suite is used which takes as input a given radiation environment, then uses an appropri-ate radiation transport algorithm to transport the radiation through material. This transportprocess requires cross sections to determine how the radiation is modified by the interveningmaterials. A measure of risk is then determined from the flux of radiation remaining after thetransport process [5, 6].
Nuclear fragmentation, the process through which energetic heavy ions interact with target
2
nuclei and break apart, is a significant contributor to the nuclear interactions of heavy ions. Wedefine heavy ions as fully ionized atomic nuclei with charge greater than helium. In addition, thepossibility of multiple heavy ion fragments being created makes this an interesting and complexphysical process. From a radiation shielding point of view, this must be accounted for whendetermining radiation exposure to astronauts and sensitive electronics.
To account for the modification of the radiation environment through interactions with in-tervening spacecraft shielding and human tissue, a nuclear fragmentation cross section databaseis used by radiation transport codes. A cross section is defined in terms of a beam of incidentparticles impacting a target and the number of particles scattered from the beam. The numberof particles scattered per unit time, N , is given as
N = Lσ, (1)
where L is the beam luminosity or flux (number of particles per unit time passing through aunit area transverse to the beam), and σ is the cross section. Eq. (1) gives a working definitionof a cross section.
The dimensional unit of cross section is area, and is understood to represent the effectivearea removed from the incident particles through interaction and is a measure of the likelihoodof an interaction occurring. The usual unit of a cross section in nuclear physics is a millibarn(mb), which is equal to 10−27 cm2. A cross section is essentially a probability of a certain typeof reaction taking place. Note that the particles considered herein are fundamentally quantummechanical in nature, so any reaction that does not violate conservation laws has a nonzeroprobability of occurring. Also, even with perfectly known initial conditions, the results of ascattering experiment are still probabilistic. Specifically, consider a flux of particles of type Pand energy E, LP (E), hitting a target. The projectile has some probability of breaking upand producing a fragment of type F . The number of fragments of type F produced per unittime can be found from Eq. (1) if we know the cross section for production of fragment F fromparticle P interacting with a given target. Note that because the problem is quantum mechanicaland fundamentally probabilistic, this only holds in the limit where the flux goes to infinity. Thefundamentally probabilistic nature of the problem is due to the fact that predictions in quantummechanics only pertain to probability distributions which describe the dynamics of ensemblesof particles. The probabilistic nature is not, however, because of variations in initial conditionsbut due to a fundamentally probabilistic nature of the interaction.
An accurate understanding of the nuclear fragmentation process is important to accuratelydetermine the biological effect of cosmic radiation on astronauts. The uncertainty of modelsused to generate the nuclear fragmentation database used in radiation transport codes must bequantified in order to understand the total uncertainty of the radiation transport codes. Oncethe total uncertainty of the radiation transport codes is quantified, then the contribution ofradiation transport code uncertainty to mission risk can be determined.
Two models of nuclear fragmentation commonly used in space radiation transport codes,NUCFRG2 [7] and QMSFRG [8], have been chosen to demonstrate the validation process.However, due to lack of access to the source code for QMSFRG, a table of values generated fromQMSFRG was used. Interpolation was used to produce cross sections not found in the database.All conclusions drawn from this paper apply only to the database and not the original model
3
since the error due to interpolation is not known exactly. However, the use of the databaseversion of QMSFRG is sufficient to demonstrate the validation process and the metrics used.Further discussion of each model is presented below.
2.1 The NUCFRG2 Model
NUCFRG2 [7] models the projectile fragmentation in heavy ion collisions using the classical,geometric abrasion-ablation formulation [9]. In the abrasion-ablation formalism, a heavy ioncollision is modeled in two stages. During the abrasion stage, a portion of the projectile is shearedaway during the interaction with the target. The residual nucleus (called the prefragment) isthen left in an excited state and decays during the ablation stage through particle emission. Thedetails of the interaction between the projectile and target rely only on the projectile energyand relative physical overlap between the target and projectile nucleus.
During the ablation stage of projectile fragmentation, the prefragment is left in a highlyunstable state. NUCFRG2 assumes the charge ratio of nucleons left in the prefragment is equalto that of the charge ratio of the projectile prior to interaction. This approximation is onlyappropriate at high energies where the projectile does not have time to react to the target.A crude visualization of the prefragment after the abrasion stage is to think of a spheroidwith a channel gouged out of it. In addition to abrasion and ablation, NUCFRG2 includeselectromagnetic dissociation for the production of nucleons. Further details concerning theNUCFRG2 model can be found in Wilson et al. [7].
2.2 The QMSFRG Model
The formalism used in the quantum multiple scattering fragmentation (QMSFRG) model fornuclear fragmentation is based on the multiple scattering series as formulated by Glauber [10]for two heavy ions. The multiple scattering series is solved using the impulse and eikonalapproximations [8] to obtain a closed-form solution to the abrasion stage cross section spectrum.QMSFRG assumes the fragmentation reaction occurs through an abrasion stage producing aprefragment, which is outside the region of overlap, and a fireball fragment produced from theprojectile-target overlap region. Following the abrasion stage, an ablation stage occurs where theprefragment becomes the final projectile fragment through nuclear de-excitation. The ablationstage is described by a stochastic process using a Master equation for de-excitation throughparticle emission [8]. In addition to abrasion and ablation processes, QMSFRG also includescluster knockout, electromagnetic dissociation for the production of nucleons, and a coalescencemodel of light ion (A ≤ 4) formation.
Access to QMSFRG through a machine executable file or source code was not available duringour analysis. QMSFRG produced a cross section table that used linear interpolation over eightenergy points (25, 75, 150, 300, 600, 1200, 2400, 7200 MeV/nucleon) and linear interpolationor extrapolation over six target isotopes (1H, 12C, 16O, 27Al, 40Ca, 56Fe) for values not foundin the database. All conclusions drawn from this paper apply only to the interpolated databaseversion. The error introduced by using the interpolated database version of QMSFRG has beenestimated as 5%. This is a rough estimate and a discussion of the uncertainty due to the use ofthe database is found in Appendix A.
4
3 Model Validation
There are multiple aims when performing a validation assessment. One possible aim is todetermine the overall accuracy of the model for the application of interest. Another possible aimis to produce information on how to improve a model, determine which assumptions are correctand what effects are important. To demonstrate the two metrics developed in this work, eachmetric will be applied to a separate component of the nuclear fragmentation validation problem.The validation problem is divided into two subproblems. The first is a global assessment usingcumulative uncertainty distributions as metrics in which the accuracy of the model is measuredagainst all available experimental data. The global assessment attempts to quantify how wella model can be expected to perform for the application of interest. The second subproblemis a more detailed set of comparisons to data divided into different energy regions, projectiletypes, target types, and fragments produced. By performing the analysis as a function differentvariables of the validation space (e.g. energy, projectile type, etc.) the analysis can focus ondetails that are useful to researchers interested in improving models. Due to the differing goalsof model development and overall accuracy assessment, the metrics applied to them should havethese goals in mind. For model development, the metric should be flexible enough to handledividing the phase space into regions which are functions of the independent variables thatspan the phase space. In addition, the metric must give detailed enough information to allowmodel developers and analysts to determine domains of applicability for the model and possiblemodel improvements needed to better represent the experimental data. For overall accuracy,the validation process should quantify the model accuracy over the entire experimental databaseand should have the ability to separate the uncertainty due to the model from the uncertaintydue to the experiment. Also, the validation process needs to have the ability to be summarizedin a relatively simple form so that decisions can be made in a relatively objective manner andthe results can be communicated effectively to those who will make decision based on them.
One of the keys to this overall strategy of validation is to have both the models and the val-idation benchmarks, which include the data and the software needed to make the comparisons,under configuration management. Then, as models are modified or new data are published, thevalidation software suite can identify the global effect of the changes. Performing validation inthis manner helps to prevent models developing biases towards data subsets or improvementsthat decrease model uncertainty in a local region but cause global model uncertainty to increase.Validation comparisons can then be used to choose between models for particular applications,help model developers be certain that “improvements” in models are actually global improve-ments, track accuracy against programmatic goals, and give researchers information needed toimprove models. In addition, the ability to separate the uncertainty due to the model fromthe uncertainty due to the experimental measurement will allow an assessment to be made asto whether making additional, more accurate measurements would be useful if measurementuncertainty is the dominating factor.
The experimental database assembled for validation should ideally cover the complete phasespace of interest to validation with appropriate resolution for each independent variable. There-fore, in the case of nuclear fragmentation models used in space radiation shielding analysis, theexperimental database should closely represent the galactic cosmic ray background which has an
5
energy spectrum that encompasses approximately 5 orders of magnitude (10 MeV - 105 MeV),a projectile distribution of 128 isotopes of elements from hydrogen to nickel, and contain datafrom targets commonly used in spacecraft shielding [4]. In addition, information on all possiblefragments produced from a given projectile-target combination are important. This is a vastphase space to cover for validation purposes.
In order to assess the accuracy of the nuclear fragmentation models, a database of experi-mental nuclear fragmentation total inclusive cross sections was assembled. The first task in thevalidation activity was to perform a comprehensive literature search. All experimental data inthe open literature were assembled and a database was created which consists of over 3600 crosssections with 25 distinct projectile isotopes from 10B to 58Ni, a projectile kinetic energy rangeof 90 MeV/nucleon to 14500 MeV/nucleon, and both elemental and compound targets rangingfrom hydrogen to uranium [7, 11–39]. The experimental data were taken from 30 different pub-lications which described experiments done at 8 different facilities around the world, includingthe Joint Institute for Nuclear Research in Dubna, Russia, the Heavy Ion Medical Acceleratorin Chiba, Japan, and the Super Proton Synchrotron at CERN near Geneva, Switzerland.
Measurement uncertainty reported for most experimental data sets is a combination of sys-tematic and statistical uncertainty with some experiments only reporting statistical uncertainty.Overall, the systematic uncertainty reported in the experimental papers tended to be of thesame order as the reported statistical uncertainty.
Table 1 gives an overview of the experimental database assembled for validation of the nuclearmodels. There is a distinct lack of data in the low energy (≤ 300 MeV/nucleon) and high energy(> 5000 MeV/nucleon) regions for most projectile-target combinations. In addition, there is alack of a consistent, robust energy range for many projectiles. There is also a lack of data forlarge values of the charge removed from the projectile. For a good number of experiments, onlycross sections for fragments with charge equal to half the projectile or larger were reported.
One of the motivations for the validation process is to quantify the uncertainty of the nuclearmodels. Understanding the uncertainty in all components of any system is important to under-standing all the uncertainty involved in any decision based on that system. In any validationeffort, however, the experimental data is only taken at representative points in the phase space,and the representative points may not even span the complete phase space. Many times, thevalidation process only attempts to test the consistency of a model with the experimental data.On the other hand, the validation process outlined in this paper is attempting to determine themodel’s accuracy, which is much different than testing the consistency of a model with exper-imental data. For the application of space radiation, the models will be relied on for makingdecisions for regions of the phase space that are not covered by experimental data. Therefore,quantifying the uncertainty in a way that does not simply measure the consistency of the modelwith the experiments is important. This is the reason the validation process must have theability to separate the uncertainty due to the experiment from the model uncertainty.
One issue that is not addressed in this paper is the completeness of the experimental dataset in covering the validation phase space. A large portion of the experimental data assem-bled for validation did not have space radiation applications in mind when the experimentswere performed. Many of the experimental measurements were concerned with discovering newfundamental physics or attempting to shed new light on fundamental physics problems. In ad-
6
dition, due to the goals of these experiments and large relative cost of the experiments, thereare very few experimental results that were reproduced by other experiments. However, therewere a series of experiments carried out by a group at Lawrence Berkeley National Laboratorywhich were commissioned by NASA for use in validating models used in the space radiationproblem [11–15]. The phase space for validation is immense, and therefore, measurements weretypically only taken at representative sample points. While the experiments commissioned byNASA were chosen to cover the validation phase space, there may exist more measurementsin certain regions of phase space than in others, or there may be a complete lack of data inregions which can bias the representation. In addition, certain portions of the phase space willbe more important to the applications under consideration. The completeness of this and othernuclear fragmentation datasets is currently being investigated and will be published in anotherwork. One way this problem could potentially be addressed is to perform sensitivity analyses forparticular applications and develop weights that could be used in the validation metrics. Theseissues, however, are beyond the scope of this paper and will be addressed in future work.
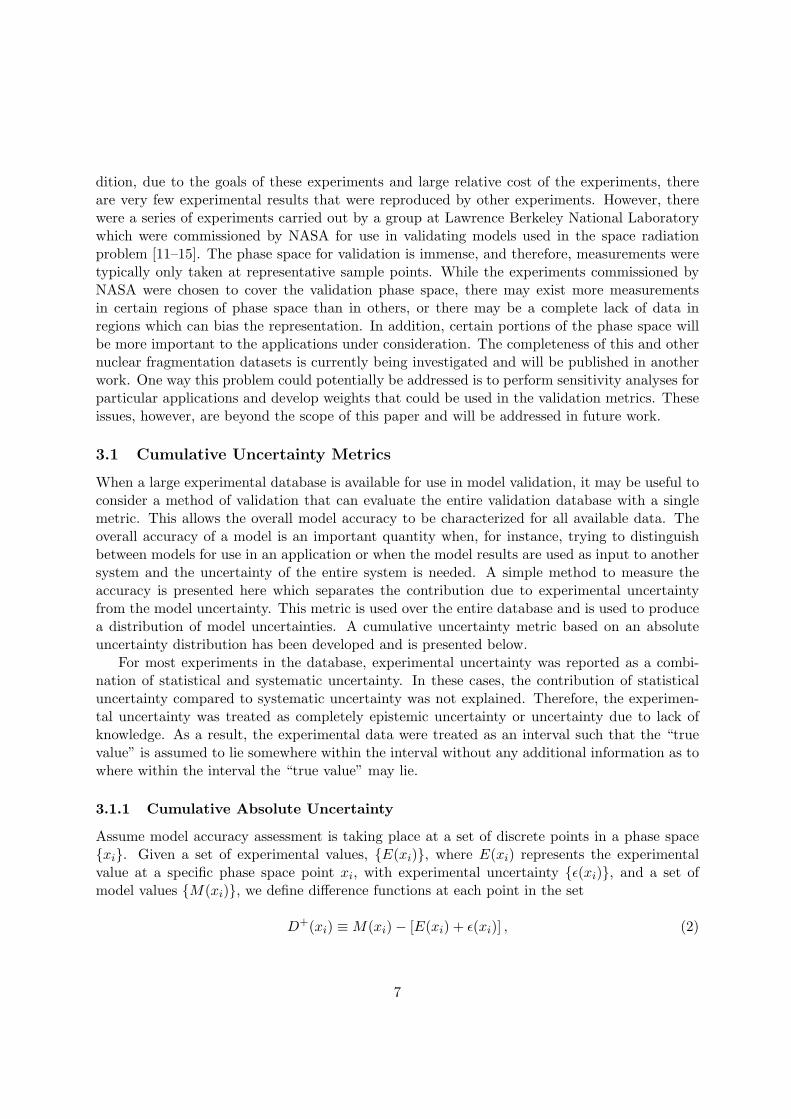
3.1 Cumulative Uncertainty Metrics
When a large experimental database is available for use in model validation, it may be useful toconsider a method of validation that can evaluate the entire validation database with a singlemetric. This allows the overall model accuracy to be characterized for all available data. Theoverall accuracy of a model is an important quantity when, for instance, trying to distinguishbetween models for use in an application or when the model results are used as input to anothersystem and the uncertainty of the entire system is needed. A simple method to measure theaccuracy is presented here which separates the contribution due to experimental uncertaintyfrom the model uncertainty. This metric is used over the entire database and is used to producea distribution of model uncertainties. A cumulative uncertainty metric based on an absoluteuncertainty distribution has been developed and is presented below.
For most experiments in the database, experimental uncertainty was reported as a combi-nation of statistical and systematic uncertainty. In these cases, the contribution of statisticaluncertainty compared to systematic uncertainty was not explained. Therefore, the experimen-tal uncertainty was treated as completely epistemic uncertainty or uncertainty due to lack ofknowledge. As a result, the experimental data were treated as an interval such that the “truevalue” is assumed to lie somewhere within the interval without any additional information as towhere within the interval the “true value” may lie.
3.1.1 Cumulative Absolute Uncertainty
Assume model accuracy assessment is taking place at a set of discrete points in a phase space{xi}. Given a set of experimental values, {E(xi)}, where E(xi) represents the experimentalvalue at a specific phase space point xi, with experimental uncertainty {ǫ(xi)}, and a set ofmodel values {M(xi)}, we define difference functions at each point in the set
D+(xi) ≡ M(xi) − [E(xi) + ǫ(xi)] , (2)
7
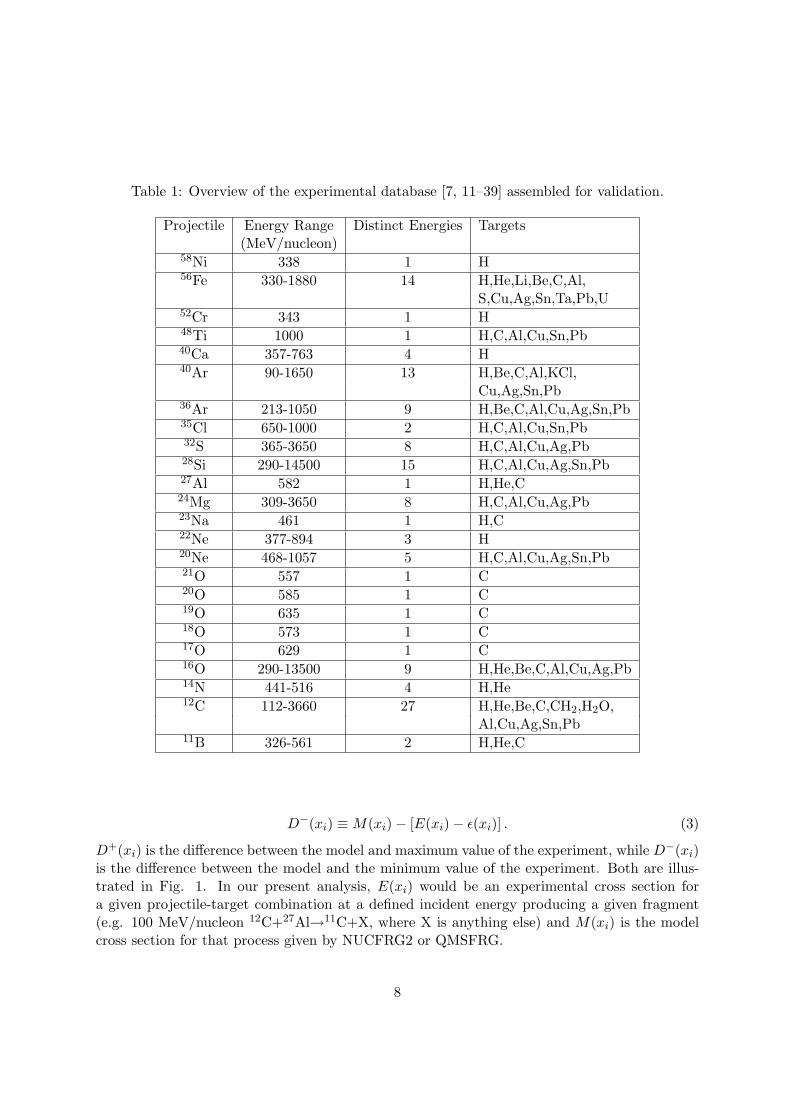
Table 1: Overview of the experimental database [7, 11–39] assembled for validation.
Projectile Energy Range Distinct Energies Targets(MeV/nucleon)
58Ni 338 1 H56Fe 330-1880 14 H,He,Li,Be,C,Al,
S,Cu,Ag,Sn,Ta,Pb,U52Cr 343 1 H48Ti 1000 1 H,C,Al,Cu,Sn,Pb40Ca 357-763 4 H40Ar 90-1650 13 H,Be,C,Al,KCl,
Cu,Ag,Sn,Pb36Ar 213-1050 9 H,Be,C,Al,Cu,Ag,Sn,Pb35Cl 650-1000 2 H,C,Al,Cu,Sn,Pb32S 365-3650 8 H,C,Al,Cu,Ag,Pb28Si 290-14500 15 H,C,Al,Cu,Ag,Sn,Pb27Al 582 1 H,He,C24Mg 309-3650 8 H,C,Al,Cu,Ag,Pb23Na 461 1 H,C22Ne 377-894 3 H20Ne 468-1057 5 H,C,Al,Cu,Ag,Sn,Pb21O 557 1 C20O 585 1 C19O 635 1 C18O 573 1 C17O 629 1 C16O 290-13500 9 H,He,Be,C,Al,Cu,Ag,Pb14N 441-516 4 H,He12C 112-3660 27 H,He,Be,C,CH2,H2O,
Al,Cu,Ag,Sn,Pb11B 326-561 2 H,He,C
D−(xi) ≡ M(xi) − [E(xi) − ǫ(xi)] . (3)
D+(xi) is the difference between the model and maximum value of the experiment, while D−(xi)is the difference between the model and the minimum value of the experiment. Both are illus-trated in Fig. 1. In our present analysis, E(xi) would be an experimental cross section fora given projectile-target combination at a defined incident energy producing a given fragment(e.g. 100 MeV/nucleon 12C+27Al→11C+X, where X is anything else) and M(xi) is the modelcross section for that process given by NUCFRG2 or QMSFRG.
8

0.6 0.8 1 1.2 1.4x
i
0
2
4
6
8
10
12
14
Syst
em R
espo
nse
Qua
ntity
Experimental ValueModel Value
D-(x
i)
D+(x
i)
D+(x
i)-D
-(x
i)=2ε(x
i)
Figure 1: An illustration of the functions D+(xi) and D−(xi) for arbitrary model and experi-mental values.
We define the absolute model uncertainty U at the measurement point xi as
U(xi) ≡ MAX(
|D+(xi)|, |D−(xi)|
)
, (4)
where MAX denotes taking the maximum value of the two possibilities. U is an absoluteuncertainty because it is positive definite and carries the same units as the model and experiment.It is important to understand the choice of the maximum value as opposed to the minimum valuein Eq. (4). If the minimum value was used in Eq. (4), the metric would have the undesirablequality that when the uncertainty in the experiment increased, the metric would show that modelwas more accurate. This is because using the minimum value would correspond to testing forconsistency of the model with the data. Choosing the maximum value, however, answers thequestion of how accurate the model is proven to be using the data. Therefore, the maximumvalue is used when we define the uncertainty in Eq. (4).
It should be noted that when the model result falls within the range of the experimental un-certainty, all the uncertainty is due to that of the experimental data. Also, note that in the limit
9
when the experimental uncertainty, ǫxi, goes to zero, U(xi) reduces to the traditional definitionof absolute uncertainty, U(xi) = |M(xi) − E(xi)|. Since the uncertainty in the experimentalmeasurement is available for all data in this work, a metric was created to quantify the experi-mental uncertainty. Since the experimental data were treated as an interval, the uncertainty inthe experimental measurement is defined as
U e(xi) ≡ |D+(xi) − D−(xi)| = 2ǫ(xi). (5)
Note that this method does not give information about the contribution to model uncertaintydue to areas where there is a lack of experimental data.
Separating the uncertainty due to the experiment from the model uncertainty is importantbecause it allows the validation analysis to account for the inherent uncertainty in the experimentwithout unjustly penalizing the model [1]. Moreover, separating the uncertainty in the modelfrom the uncertainty due to the experiment helps determine if more accurate experiments wouldbe useful to model validation.
The absolute model uncertainty, as defined above, has the same dimensional units as themodel and experiment. In the case of nuclear fragmentation, an absolute uncertainty is usefulwhen assessing the impact of the model on biological quantities such as radiation dose, sincethe models are used as inputs to radiation transport codes (i.e. HZETRN [5] and HETC-HEDS[40]) which are concerned with the biological impact of radiation. Because the risk involved withexposure to radiation is typically dependent on the absolute value of the exposure, discussionis restricted to absolute uncertainty. As a complement to the cumulative absolute uncertaintymetric and for the sake of completeness, a cumulative relative uncertainty metric is developedin Appendix B.
A cumulative uncertainty distribution has been developed based on the idea of the cumu-lative distribution function. In general, the cumulative distribution function, D(x), gives theprobability that a random variable has a value less than or equal to x. If some random value yis chosen, the fraction of the database which has uncertainty less than or equal to y is definedas
Fraction of Data ≡1
n
Umax∑
U=0
P (U ≤ y), (6)
where n is the number of experimental data points, U is the absolute model uncertainty definedin Eq. (4) with the dependence of the specific point in phase space xi suppressed, Umax is thelargest value of uncertainty, and
P (U ≤ y) ≡
{
1 if U ≤ y0 if U > y
. (7)
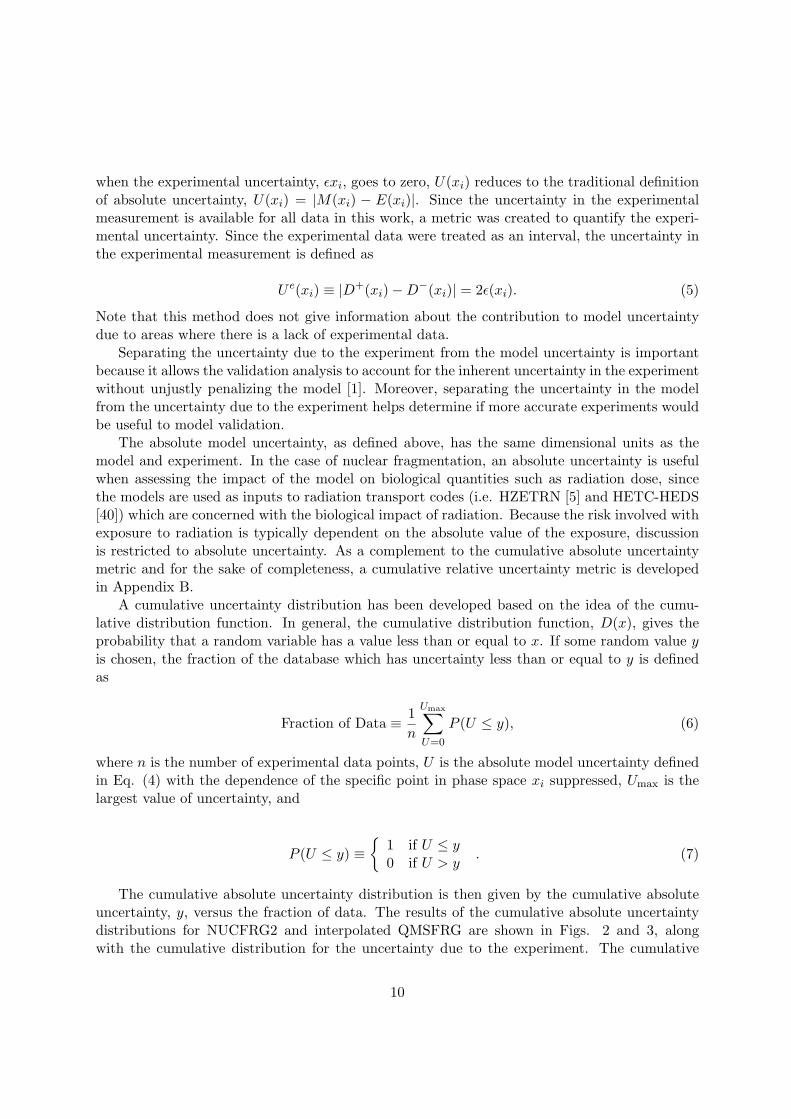
The cumulative absolute uncertainty distribution is then given by the cumulative absoluteuncertainty, y, versus the fraction of data. The results of the cumulative absolute uncertaintydistributions for NUCFRG2 and interpolated QMSFRG are shown in Figs. 2 and 3, alongwith the cumulative distribution for the uncertainty due to the experiment. The cumulative
10
0
25
50
75
100
125
0 0.1 0.2 0.3 0.4 0.5 0.6 0.7 0.8 0.9 1
Cu
mu
lati
ve A
bso
lute
Un
cert
ain
ty (
mb
)
Fraction of Data
NUCFRG2QMSFRG InterpolationUncertainty due to Experiment
Figure 2: Cumulative absolute uncertainty distributions for NUCFRG2 and interpolated QMS-FRG compared to the experimental database, along with the distribution for the cumulativeuncertainty due to experiment.
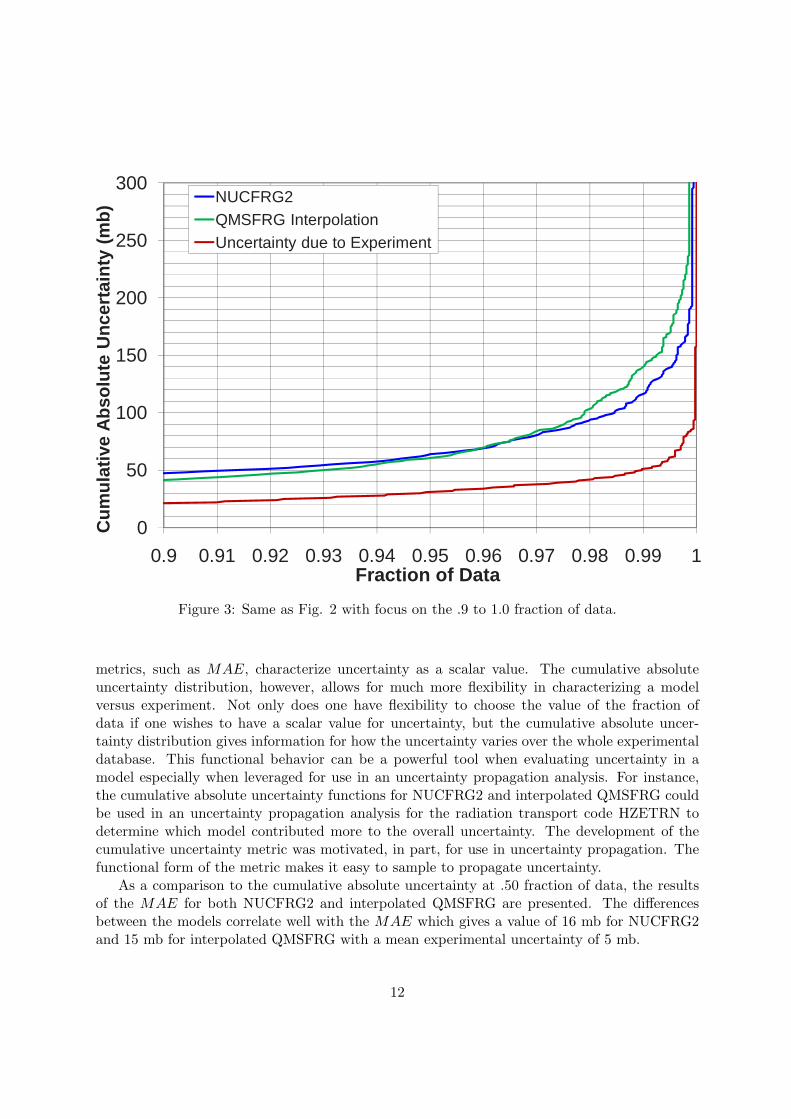
distribution for the uncertainty due to the experiment is found by substituting U e for U inEqs. (6) and (7). From Fig. 2, one might be tempted to conclude that QMSFRG is a moreaccurate model of the experimental database than NUCFRG2. For instance, at .50 fraction ofdata, there is an absolute uncertainty of 15 mb for NUCFRG2 and 12 mb for QMSFRG, whilethe uncertainty due to experiment at .50 fraction of data was 6 mb. For all values of fractionof data, however, the uncertainty due to the experiment is larger than the difference betweenthe models. Therefore, within the accuracy of the experiments, we cannot conclude that eithermodel is more accurate. In addition, if the larger values of the fraction of data are investigated,as shown in Fig. 3, QMSFRG has more outliers compared to NUCFRG2.
The more traditional metric of mean absolute error (MAE), which is defined as
MAE ≡1
n
n∑
i=1
|M(xi) − E(xi)|, (8)
is presented here as a contrast to the cumulative absolute uncertainty distribution. Traditional
11
0
50
100
150
200
250
300
0.9 0.91 0.92 0.93 0.94 0.95 0.96 0.97 0.98 0.99 1
Cu
mu
lati
ve A
bso
lute
Un
cert
ain
ty (
mb
)
Fraction of Data
NUCFRG2QMSFRG InterpolationUncertainty due to Experiment
Figure 3: Same as Fig. 2 with focus on the .9 to 1.0 fraction of data.
metrics, such as MAE, characterize uncertainty as a scalar value. The cumulative absoluteuncertainty distribution, however, allows for much more flexibility in characterizing a modelversus experiment. Not only does one have flexibility to choose the value of the fraction ofdata if one wishes to have a scalar value for uncertainty, but the cumulative absolute uncer-tainty distribution gives information for how the uncertainty varies over the whole experimentaldatabase. This functional behavior can be a powerful tool when evaluating uncertainty in amodel especially when leveraged for use in an uncertainty propagation analysis. For instance,the cumulative absolute uncertainty functions for NUCFRG2 and interpolated QMSFRG couldbe used in an uncertainty propagation analysis for the radiation transport code HZETRN todetermine which model contributed more to the overall uncertainty. The development of thecumulative uncertainty metric was motivated, in part, for use in uncertainty propagation. Thefunctional form of the metric makes it easy to sample to propagate uncertainty.
As a comparison to the cumulative absolute uncertainty at .50 fraction of data, the resultsof the MAE for both NUCFRG2 and interpolated QMSFRG are presented. The differencesbetween the models correlate well with the MAE which gives a value of 16 mb for NUCFRG2and 15 mb for interpolated QMSFRG with a mean experimental uncertainty of 5 mb.
12
Analysis of the absolute uncertainty for both models found the difference between the modelswas smaller than the uncertainty due to the experiment. Therefore, neither model can be consid-ered more accurate for the available data. However, an uncertainty propagation analysis usingthe cumulative absolute uncertainty functions might provide enough information to determineif one model is superior to the other.
3.2 Validation metric based on median statistics
In order to analyze the models more closely and identify regions of model disagreement withthe experimental data, the validation phase space was split into subsets and each subset wasanalyzed with a newly developed metric based on robust statistical methods. Identifying regionsof disagreement and agreement with experimental data allows model developers to define regionsof model applicability and should give clues on how to extend and modify their model to betterrepresent the experimental data. In the case of small or sparsely covered experimental datasets,the size of the database does not allow the use of the cumulative uncertainty distributionsdeveloped earlier. In addition, an outlier in the validation metric can quickly overwhelm theanalysis when small or sparse experimental databases are used. The issue of outliers is at thecenter of the consideration of how to validate and choose a validation metric appropriately.
Using an established measure of uncertainty based on mean values (e.g. root mean squareerror) has the unwanted effect of magnifying the contribution of outliers. Traditionally, thereare a few ways to deal with outliers: leave them as they are, correct, or delete them. If theoutliers are left in the analysis, they skew the mean value which may nullify any meaningfulconclusions. If they are altered (e.g. using a weighting function) or deleted (e.g. rejection rule)from the analysis, either method requires a clear justification that is very easily criticized [41].
A proposed solution to the problem of outliers in a validation effort utilizing a small or sparseexperimental database based upon the use of the median value in place of the mean is presented.Given an ordered set {Yi} with n elements, the median of {Yi} is defined as
Y ≡
{
Y(n+1)/2 if n is odd12 [Yn/2 + Y(n+1)/2] if n is even
. (9)
The median is a more robust measure of the central tendency than the mean [41] and is usedto develop a validation metric appropriate for small or sparse experimental datasets. Insteadof developing a cumulative uncertainty distribution, as was done previously in Section 3.1,the functions are utilized to represent model uncertainty as a number. Although flexibility islost when the uncertainty is distilled from a distribution to a number, the applicability of thisvalidation metric to sparse experimental datasets for which a meaningful cumulative uncertaintydistribution cannot be created is an important quality.
The new validation metric, the median uncertainty (MU), is defined as
MU ≡ U − U e, (10)
where U is the median value of the set of total uncertainty values ,{U(xi)}, and U e is themedian of the set of the uncertainty due to the experiment values, {U e(xi)}. U(xi) and U e(xi)are defined in Eqs. 4 and 5, respectively.
13
The median uncertainty defined in Eq. (10) is a measure of the consistency of the model withthe experimental data. The aim of this metric is model development; therefore, consistency withthe experimental data is what the metric should quantify. The median uncertainty, combinedwith the uncertainty due to the experiment, allows for an analysis of whether model validationwould benefit more from resources invested in model development or investing in more precisemeasurements for the data currently available. Note that the question of whether additionaldata are needed where there are currently no data is not addressed by this metric.
3.3 Application of the Median Metric
The complete experimental database of nuclear fragmentation cross sections described previouslyhas been divided into different subsections and analyzed. An analysis is presented using themedian validation metric defined in Eq. (10) and using the same models and experimentaldatabase discussed earlier. The metric is applied as a function of the following parameters:projectile beam element, charge removed from the projectile (∆Z ≡ Zprojectile − Zfragment),fragment charge, projectile energy, and target. When the validation metric is examined as afunction of these parameters, differences that may not have been apparent when looking at theoverall accuracy across the entire experimental database may become clear. By segregating thedatabase in this way, the deficiencies in the models and experimental data can be identified.Additionally, areas that are important from the perspective of space radiation hazards can beidentified.
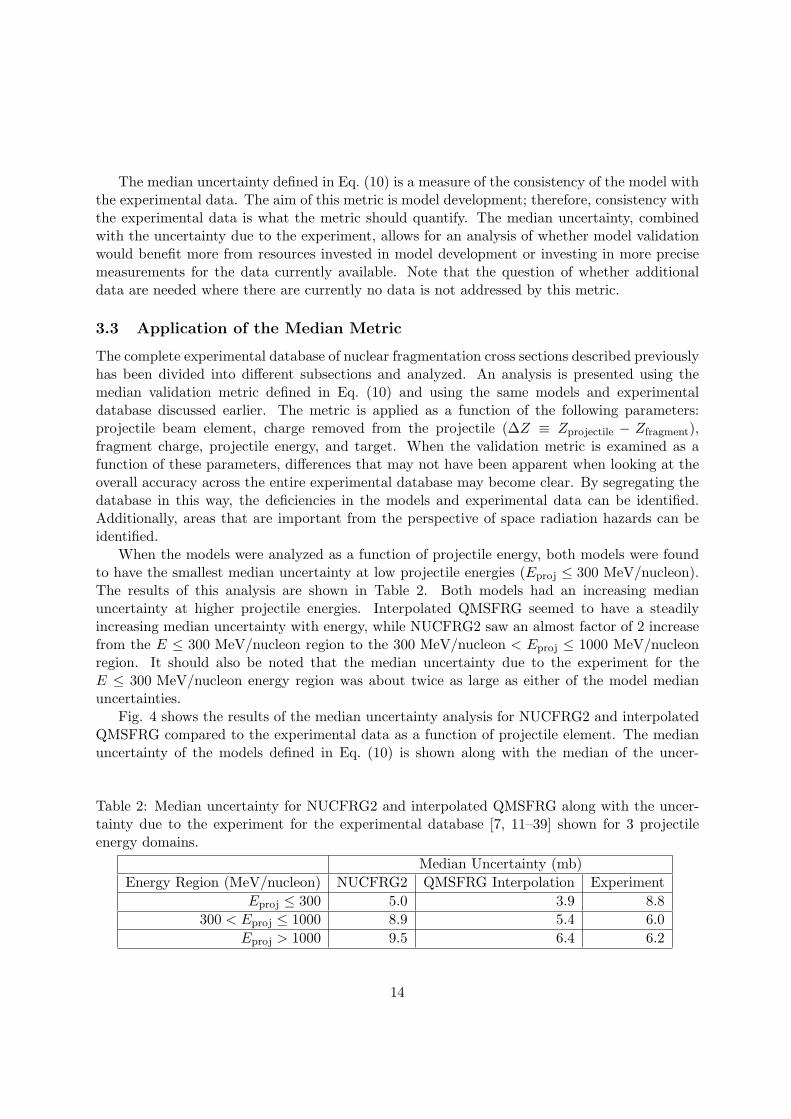
When the models were analyzed as a function of projectile energy, both models were foundto have the smallest median uncertainty at low projectile energies (Eproj ≤ 300 MeV/nucleon).The results of this analysis are shown in Table 2. Both models had an increasing medianuncertainty at higher projectile energies. Interpolated QMSFRG seemed to have a steadilyincreasing median uncertainty with energy, while NUCFRG2 saw an almost factor of 2 increasefrom the E ≤ 300 MeV/nucleon region to the 300 MeV/nucleon < Eproj ≤ 1000 MeV/nucleonregion. It should also be noted that the median uncertainty due to the experiment for theE ≤ 300 MeV/nucleon energy region was about twice as large as either of the model medianuncertainties.
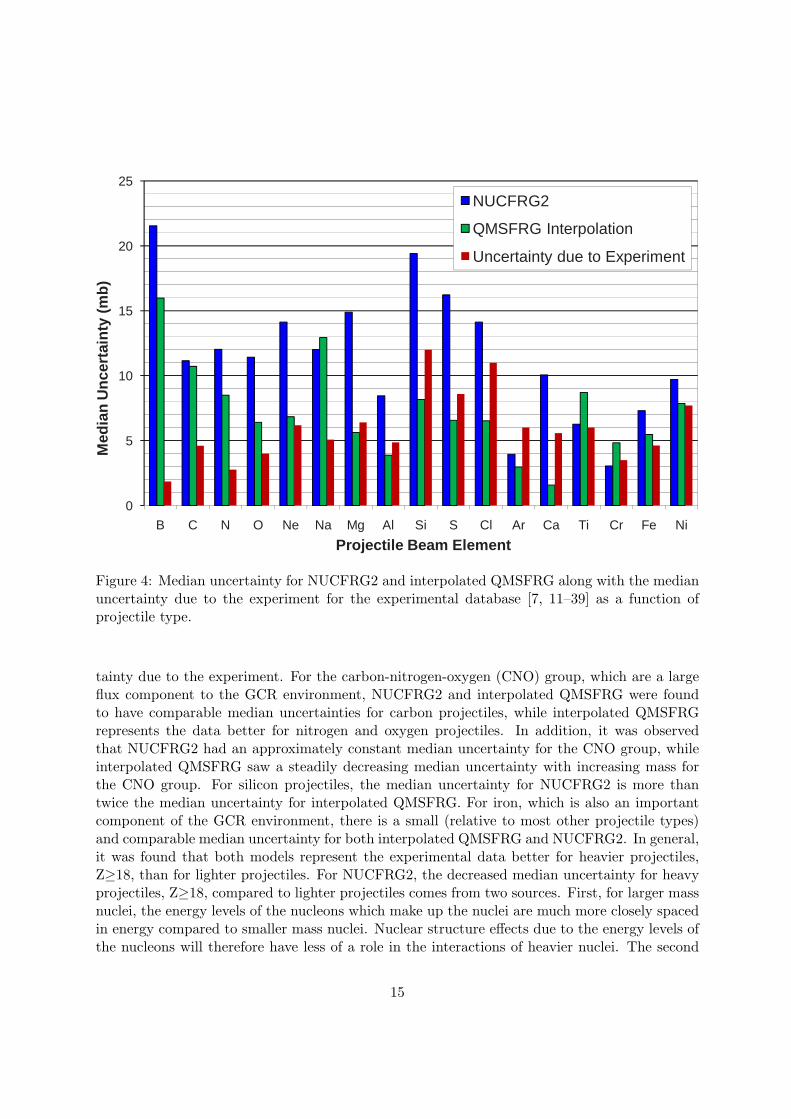
Fig. 4 shows the results of the median uncertainty analysis for NUCFRG2 and interpolatedQMSFRG compared to the experimental data as a function of projectile element. The medianuncertainty of the models defined in Eq. (10) is shown along with the median of the uncer-
Table 2: Median uncertainty for NUCFRG2 and interpolated QMSFRG along with the uncer-tainty due to the experiment for the experimental database [7, 11–39] shown for 3 projectileenergy domains.
Median Uncertainty (mb)
Energy Region (MeV/nucleon) NUCFRG2 QMSFRG Interpolation Experiment
Eproj ≤ 300 5.0 3.9 8.8
300 < Eproj ≤ 1000 8.9 5.4 6.0
Eproj > 1000 9.5 6.4 6.2
14
0
5
10
15
20
25
B C N O Ne Na Mg Al Si S Cl Ar Ca Ti Cr Fe Ni
Med
ian
Un
cert
ain
ty (
mb
)
Projectile Beam Element
NUCFRG2
QMSFRG Interpolation
Uncertainty due to Experiment
Figure 4: Median uncertainty for NUCFRG2 and interpolated QMSFRG along with the medianuncertainty due to the experiment for the experimental database [7, 11–39] as a function ofprojectile type.
tainty due to the experiment. For the carbon-nitrogen-oxygen (CNO) group, which are a largeflux component to the GCR environment, NUCFRG2 and interpolated QMSFRG were foundto have comparable median uncertainties for carbon projectiles, while interpolated QMSFRGrepresents the data better for nitrogen and oxygen projectiles. In addition, it was observedthat NUCFRG2 had an approximately constant median uncertainty for the CNO group, whileinterpolated QMSFRG saw a steadily decreasing median uncertainty with increasing mass forthe CNO group. For silicon projectiles, the median uncertainty for NUCFRG2 is more thantwice the median uncertainty for interpolated QMSFRG. For iron, which is also an importantcomponent of the GCR environment, there is a small (relative to most other projectile types)and comparable median uncertainty for both interpolated QMSFRG and NUCFRG2. In general,it was found that both models represent the experimental data better for heavier projectiles,Z≥18, than for lighter projectiles. For NUCFRG2, the decreased median uncertainty for heavyprojectiles, Z≥18, compared to lighter projectiles comes from two sources. First, for larger massnuclei, the energy levels of the nucleons which make up the nuclei are much more closely spacedin energy compared to smaller mass nuclei. Nuclear structure effects due to the energy levels ofthe nucleons will therefore have less of a role in the interactions of heavier nuclei. The second
15
0
5
10
15
20
1 2 3 4 5 6 7 8 9 10 11 12 13 14 15 16
Med
ian
Un
cert
ain
ty (
mb
)
∆∆∆∆Z
NUCFRG2QMSFRG InterpolationUncertainty due to Experiement
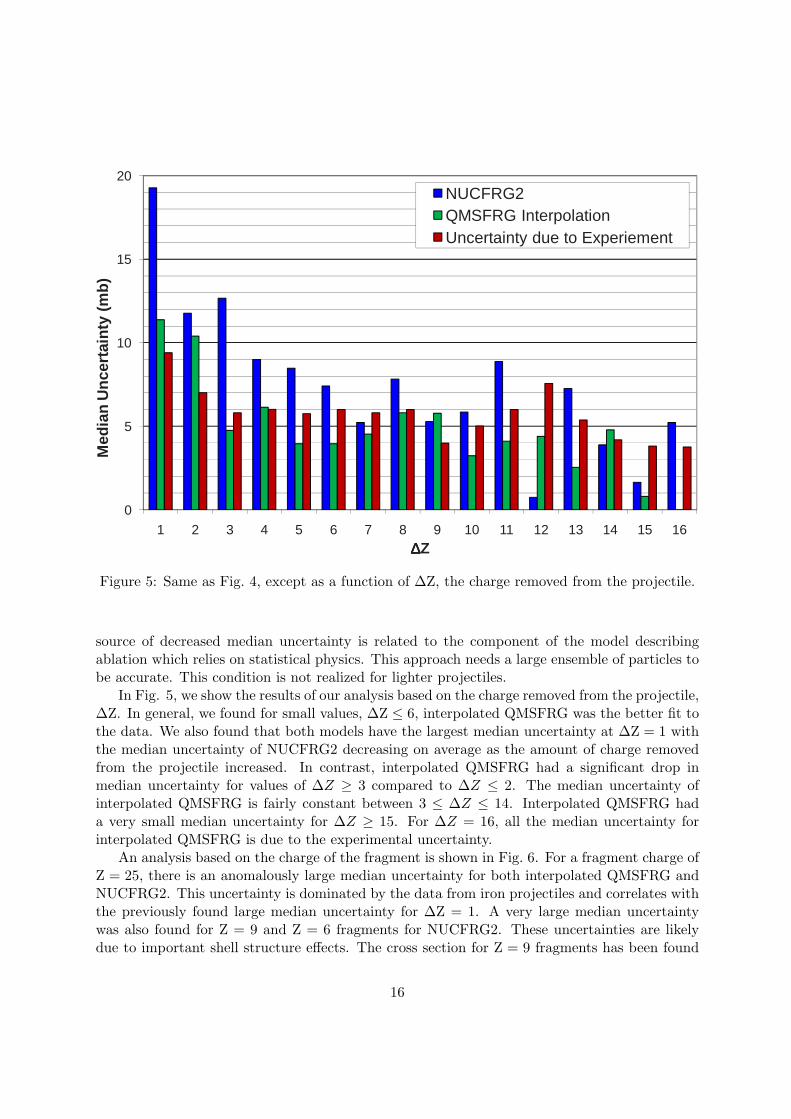
Figure 5: Same as Fig. 4, except as a function of ∆Z, the charge removed from the projectile.
source of decreased median uncertainty is related to the component of the model describingablation which relies on statistical physics. This approach needs a large ensemble of particles tobe accurate. This condition is not realized for lighter projectiles.
In Fig. 5, we show the results of our analysis based on the charge removed from the projectile,∆Z. In general, we found for small values, ∆Z ≤ 6, interpolated QMSFRG was the better fit tothe data. We also found that both models have the largest median uncertainty at ∆Z = 1 withthe median uncertainty of NUCFRG2 decreasing on average as the amount of charge removedfrom the projectile increased. In contrast, interpolated QMSFRG had a significant drop inmedian uncertainty for values of ∆Z ≥ 3 compared to ∆Z ≤ 2. The median uncertainty ofinterpolated QMSFRG is fairly constant between 3 ≤ ∆Z ≤ 14. Interpolated QMSFRG hada very small median uncertainty for ∆Z ≥ 15. For ∆Z = 16, all the median uncertainty forinterpolated QMSFRG is due to the experimental uncertainty.
An analysis based on the charge of the fragment is shown in Fig. 6. For a fragment charge ofZ = 25, there is an anomalously large median uncertainty for both interpolated QMSFRG andNUCFRG2. This uncertainty is dominated by the data from iron projectiles and correlates withthe previously found large median uncertainty for ∆Z = 1. A very large median uncertaintywas also found for Z = 9 and Z = 6 fragments for NUCFRG2. These uncertainties are likelydue to important shell structure effects. The cross section for Z = 9 fragments has been found
16
0
5
10
15
20
25
3 4 5 6 7 8 9 10 11 12 13 14 15 16 17 18 19 20 21 22 23 24 25 26
Med
ian
Un
cert
ain
ty (
mb
)
Zfrag
NUCFRG2QMSFRG InterpolationUncertainty due to Experiment
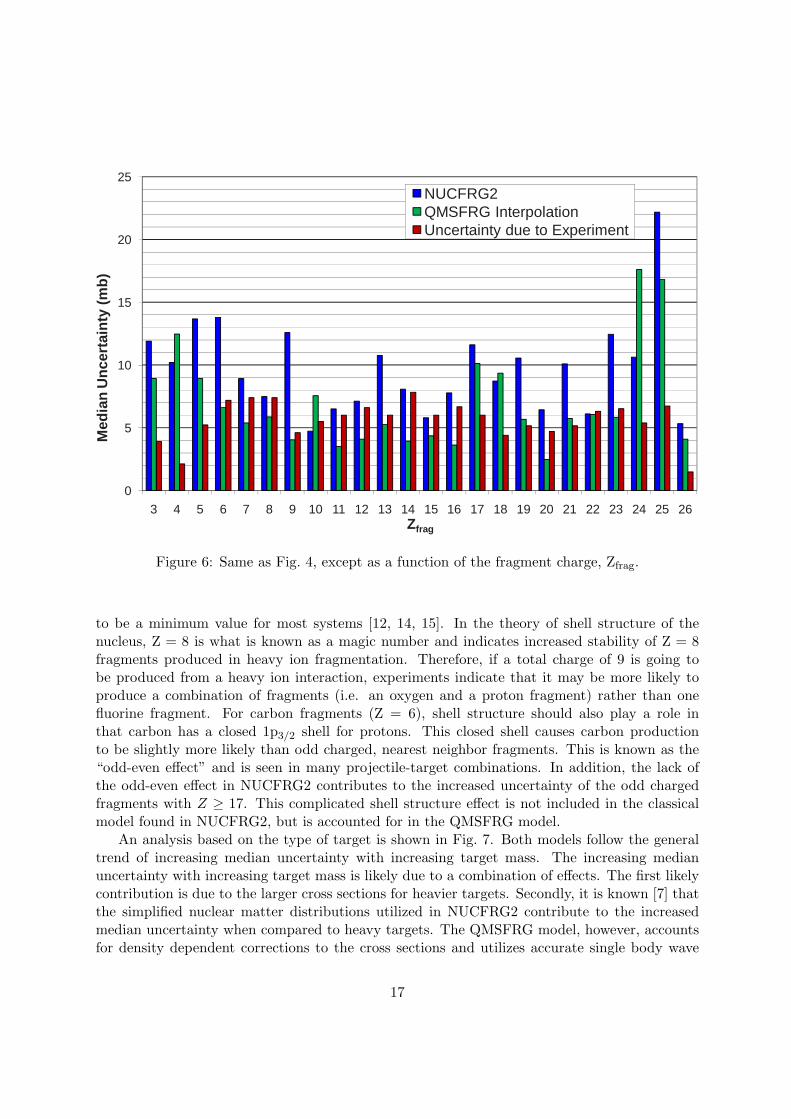
Figure 6: Same as Fig. 4, except as a function of the fragment charge, Zfrag.
to be a minimum value for most systems [12, 14, 15]. In the theory of shell structure of thenucleus, Z = 8 is what is known as a magic number and indicates increased stability of Z = 8fragments produced in heavy ion fragmentation. Therefore, if a total charge of 9 is going tobe produced from a heavy ion interaction, experiments indicate that it may be more likely toproduce a combination of fragments (i.e. an oxygen and a proton fragment) rather than onefluorine fragment. For carbon fragments (Z = 6), shell structure should also play a role inthat carbon has a closed 1p3/2 shell for protons. This closed shell causes carbon productionto be slightly more likely than odd charged, nearest neighbor fragments. This is known as the“odd-even effect” and is seen in many projectile-target combinations. In addition, the lack ofthe odd-even effect in NUCFRG2 contributes to the increased uncertainty of the odd chargedfragments with Z ≥ 17. This complicated shell structure effect is not included in the classicalmodel found in NUCFRG2, but is accounted for in the QMSFRG model.
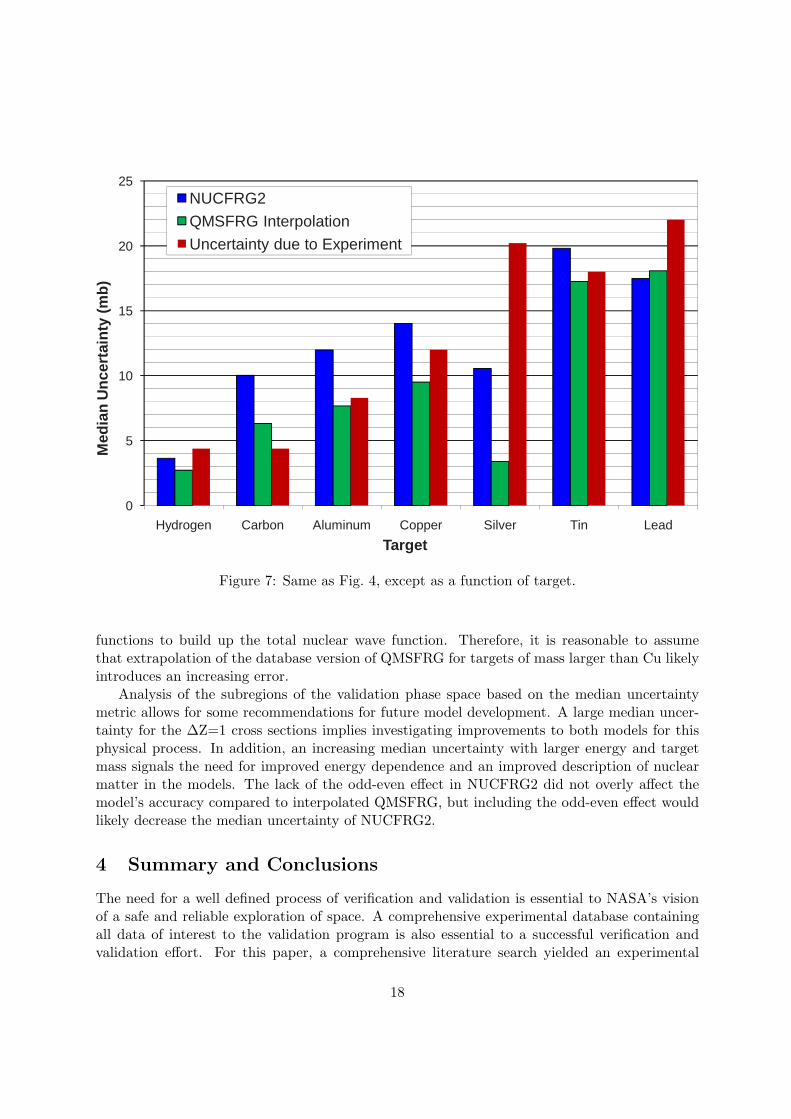
An analysis based on the type of target is shown in Fig. 7. Both models follow the generaltrend of increasing median uncertainty with increasing target mass. The increasing medianuncertainty with increasing target mass is likely due to a combination of effects. The first likelycontribution is due to the larger cross sections for heavier targets. Secondly, it is known [7] thatthe simplified nuclear matter distributions utilized in NUCFRG2 contribute to the increasedmedian uncertainty when compared to heavy targets. The QMSFRG model, however, accountsfor density dependent corrections to the cross sections and utilizes accurate single body wave
17
0
5
10
15
20
25
Hydrogen Carbon Aluminum Copper Silver Tin Lead
Med
ian
Un
cert
ain
ty (
mb
)
Target
NUCFRG2
QMSFRG Interpolation
Uncertainty due to Experiment
Figure 7: Same as Fig. 4, except as a function of target.
functions to build up the total nuclear wave function. Therefore, it is reasonable to assumethat extrapolation of the database version of QMSFRG for targets of mass larger than Cu likelyintroduces an increasing error.
Analysis of the subregions of the validation phase space based on the median uncertaintymetric allows for some recommendations for future model development. A large median uncer-tainty for the ∆Z=1 cross sections implies investigating improvements to both models for thisphysical process. In addition, an increasing median uncertainty with larger energy and targetmass signals the need for improved energy dependence and an improved description of nuclearmatter in the models. The lack of the odd-even effect in NUCFRG2 did not overly affect themodel’s accuracy compared to interpolated QMSFRG, but including the odd-even effect wouldlikely decrease the median uncertainty of NUCFRG2.
4 Summary and Conclusions
The need for a well defined process of verification and validation is essential to NASA’s visionof a safe and reliable exploration of space. A comprehensive experimental database containingall data of interest to the validation program is also essential to a successful verification andvalidation effort. For this paper, a comprehensive literature search yielded an experimental
18
database with more then 3600 experimental nuclear fragmentation cross sections. The experi-mental database contained 25 distinct projectile isotopes from 10B to 58Ni, a projectile kineticenergy range from 90 MeV/nucleon to 14500 MeV/nucleon and both elemental and compoundtargets ranging from hydrogen to uranium. It is important to note that this should still be con-sidered a sparse database, since the GCR background spans more than 5 orders of magnitudein energy and contains 128 isotopes of elements from hydrogen to nickel.
Two validation metrics were developed in this paper and applied to different components ofthe validation of nuclear physics models used by NASA. The first metric was used to quantify theoverall accuracy of the nuclear physics models for the entire experimental database assembledfor validation. To determine the overall accuracy, a cumulative absolute uncertainty distribu-tion was introduced. The functional nature of the cumulative absolute uncertainty distributionallows for a quantitative assessment of the accuracy of a model compared to experiment, forflexibility in determining the desired confidence level of the results, and can be leveraged for un-certainty propagation in the radiation transport codes which utilize these nuclear models. Whenthe overall accuracy of the models was analyzed using the cumulative absolute uncertainty dis-tributions, an absolute model uncertainty of 15 mb and 12 mb was found at .50 fraction of datafor NUCFRG2 and interpolated QMSFRG, respectively. The uncertainty due to experiment at.50 fraction of data was found to be 6 mb. For all values of the fraction of data, the uncertaintydue to experiment was larger than the difference in uncertainty between the models. This factled to the conclusion that neither model can be considered more accurate given the currentexperimental data available. Although the models were found to be quantitatively similar intheir accuracy, fundamental qualitative differences in the models are known to exist.
A second type of metric was developed in this work based on median statistics which wasappropriate for use with sparse or small experimental databases and it was applied to the taskof model improvement and analysis. This metric was applied to the analysis of subsets ofthe experimental database based on different variables in the validation phase space and wasdeveloped specifically to be insensitive to outliers which may skew the analysis. Regions of modelimprovement and regions of model agreement for both models were identified using the medianuncertainty based metric. The importance of quantum effects and shell structure to the nuclearfragmentation process was found through comparison of the quantum multiple scattering modelQMSFRG to the classical, geometric approach of NUCFRG2. The importance of shell structurewas most clearly shown for the median uncertainty analysis as a function of fragment chargewhere the median uncertainty of NUCFRG2 for fluorine and carbon fragments, along with oddcharged fragments with Z ≥ 17, was disproportionately large compared to other fragments. Ingeneral, our analysis found a steadily increasing median uncertainty with increasing target massand increasing projectile energy for both models. In addition, a small median uncertainty wasfound for iron projectiles compared to other projectiles for both models and a general trend forthe models to fit the data better for higher charge and mass projectiles. Lastly, a relatively largemedian uncertainty for ∆Z = 1 fragments was found, where ∆Z is the difference between theprojectile and fragment charge.
Given our analysis of the subsets of the validation phase space based on the median un-certainty metric, some recommendations for future model development can be made. A largemedian uncertainty for the ∆Z=1 cross sections was found and investigating improvements to
19
both models for this physical process is recommended. Improved energy dependence and animproved description of nuclear matter used in the models should be investigated to rectify theincreasing median uncertainty with larger energy and target mass, respectively. The lack of theodd-even effect in NUCFRG2 did not overly affect the model’s accuracy compared to interpo-lated QMSFRG, but including the odd-even effect would likely decrease the median uncertaintyof NUCFRG2.
These results and conclusions are tempered by the completeness of the experimental data set.The application of these models for use in space radiation analysis creates a high-dimensionalphase space of validation parameters. The GCR background spans more than 5 orders of mag-nitude in energy and contains 128 isotopes of elements from hydrogen to nickel. An analysismust contain data for all targets commonly used in spacecraft shielding and all possible frag-ments produced from interactions. The amount of time, effort, and money required to blanketthis phase space with experiments is prohibitive, and therefore, the experimental database as-sembled for validation, though it consists of all known, published experimental data sets, doescontain gaps. The question of whether the data are complete enough to capture all the impor-tant physics is currently being investigated. Further analysis the authors hope to perform is asensitivity analysis to identify subregions of the phase space important for particular applica-tions. The authors would also like to investigate the feasibility and effect of weighting schemesfor the important subregions of phase space. In addition, the authros would like to carry out anuncertainty propagation study using the cumulative absolute uncertainty distributions for theradiation transport codes which use these nuclear models.
20
References
[1] W. L. Oberkampf and M. F. Barone, Measures of agreement between computation andexperiment: Validation metrics, J. Comput. Phys. 217, 5 (2006).
[2] W. L. Oberkampf, M. Pilch and T. G. Trucano, Predictive capability maturity model forcomputational modeling and simulation, Sandia Report SAND2007-5948 (2007).
[3] S. R. Blattnig, L. L. Green, J. M. Luckring, J. H. Morrison, R. K. Tripathi andT. A. Zang, Towards a credibility assessment of models and simulations, in 49thAIAA/ASME/ASCE/AHS/ASC Structures, Structural Dynamics, and Materials Confer-ence, Shaumburg, Illinois, (2008).
[4] National Council on Radiation Protection and Measurements, Information needed to makeradiation protection recommendations for space missions beyond low-Earth orbit, NCRPReport no. 153, (2006).
[5] J. W. Wilson, R. K. Tripathi, F. F. Badavi and F. A. Cucinotta, Standardized radiationshield design methods: 2005 HZETRN, in Proceedings of the 36th Conference on Environ-mental Systems (ICES), Norfolk, Virginia, (2006).
[6] F. A. Cucinotta, M.-H. Y. Kim and L. Ren, Evaluating shielding effectiveness for reducingspace radiation cancer risks, Radiat. Meas. 41, 1103 (2006).
[7] J. W. Wilson, R. K. Tripathi, F. A. Cucinotta, J. L. Shinn, F. F. Badavi, S. Y. Chun,J. W. Norbury, C. J. Zeitlin, L. Heilbronn and J. Miller, NUCFRG2 An evaluation of thesemiempirical nuclear fragmentation database, NASA Technical Paper 3533 (1995).
[8] F. A. Cucinotta, M.-H. Kim, S. I. Schneider and D. M. Hassler, Description of light ionproduction cross sections and fluxes on the Mars surface using the QMSFRG model, Radiat.Environ. Biophys. 46, 101 (2007).
[9] J. D. Bowman, W. J. Swiatecki and C. F. Tsang, Abrasion and ablation of heavy ions,Lawrence Berkeley Laboratory Report LBL-2908 (1973).
[10] R. J. Glauber, Lectures in theoretical physics (Interscience, New York, 1959), p. 315.
[11] C. Zeitlin, A. Fukumura, L. Heilbronn, Y. Iwata, J. Miller and T. Murakami, Fragmentationcross sections of 600 MeV/nucleon 20Ne on elemental targets, Phys. Rev. C 64, 024902(2001).
[12] C. Zeitlin, L. Heilbronn, J. Miller, S. E. Rademacher, T. Borak, T. R. Carter, K. A. Frankel,W. Schimmerling and C. E. Stronach, Heavy fragment production cross sections from 1.05GeV/nucleon 56Fe in C, Al, Cu, Pb, and CH2 targets, Phys. Rev. C 56, 388 (1997).
[13] C. Zeitlin and S. Guetersloh and L. Heilbronn and J. Miller and A. Fukumura and Y. Iwataand T. Murakami, Fragmentation cross sections of 290 MeV/nucleon and 400- MeV/nucleon12C beams on elemental targets, Phys. Rev. C 76, 014911 (2007).
21
[14] C. Zeitlin, A. Fukumura, S. B. Guetersloh, L. H. Heilbronn, Y. Iwata, J. Miller and T. Mu-rakami, Fragmentation cross sections of 28Si at beam energies from 290 A MeV to 1200 AMeV, Nucl. Phys. A 784, 341 (2007).
[15] C. Zeitlin, S. Guetersloh, L. Heilbronn, J. Miller, A. Fukumura, Y. Iwata, T. Murakami,L. Sihver and D. Mancusi, Fragmentation cross sections of medium-energy 35Cl, 40Ar, and48Ti beams on elemental targets, Phys. Rev. C 77, 034605 (2008).
[16] W. R. Webber, J. C. Kish and D. A. Schrier, Individual charge changing fragmentationcross sections of relativistic nuclei in hydrogen, helium, and carbon targets, Phys. Rev. C41, 533 (1990).
[17] W. R. Webber, J. C. Kish and D. A. Schrier, Individual isotopic fragmentation crosssections of relativistic nuclei in hydrogen, helium, and carbon targets, Phys. Rev. C 41,547 (1990).
[18] J. R. Cummings, W. R. Binns, T. L. Garrard, M. H. Israel, J. Klarmann, E. C. Stone andC. J. Waddington, Determination of the cross sections for the production of fragments fromrelativistic nucleus-nucleus interactions. I. Measurements, Phys. Rev. C 42, 2508 (1990).
[19] G. D. Westfall, L. W. Wilson, P. J. Lindstrom, H. J. Crawford, D. E. Greiner and H. H.Heckman, Fragmentation of relativistic 56Fe, Phys. Rev. C 19, 1309 (1979).
[20] D. L. Olson, B. L. Berman, D. E. Greiner, H. H. Heckman, P. J. Lindstrom and H. J. Craw-ford, Factorization of fragment-production cross sections in relativistic heavy-ion collisions,Phys. Rev. C 28, 1602 (1983).
[21] C. E. Tull, Relativistic heavy ion fragmentation at HISS, Lawrence Berkeley LaboratoryReport LBL-29718 (1990).
[22] A. N. Golovchenko, J. Skvarc, N. Yasuda, M. Giacomelli, S. P. Tretyakova, R. Ilic, R. Bim-bot, M. Toulemonde and T. Murakami, Total charge-changing and partial cross-sectionmeasurements in the reactions of ∼ 110 − 250 MeV/nucleon 12C in carbon, paraffin, andwater, Phys. Rev. C 66, 014609 (2002).
[23] S. Momota et al., Production of projectile-like fragments at intermediate energies, Nucl.Phys. A 701, 150 (2002).
[24] C. Brechtmann and W. Heinrich, Measurements of elemental fragmentation cross sectionfor relativistic heavy ions using CR39 plastic nuclear track detectors, Nucl. Instr. and Meth.B 29, 675 (1988).
[25] C. Brechtmann and W. Heinrich, Fragmentation Cross Sections of 32S at 0.7, 1.2 and 200GeV/Nucleon, Z. Phys. A 331, 463 (1988).
[26] C. Brechtmann, W. Heinrich and E. V. Benton, Fragmentation cross sections of 28Si at14.5 GeV/nucleon, Phys. Rev. C 39, 2222 (1989).
22

[27] C. Brechtmann, H. Drechsel, J. Beer and W. Heinrich, Cross sections for the production offragments with Z≥8 by fragmentation of 9≤Z≤26 nuclei, Nucl. Tracks 12, 361 (1986).
[28] F. Flesch, G. Iancu, W. Heinrich and H. Yasuda, Projectile fragmentation of silicon ionsat 490 A MeV, Radiat. Meas. 34, 237 (2001).
[29] A. Leistenschneider et al., Fragmentation of unstable neutron-rich oxygen beams, Phys.Rev. C 65, 064607 (2002).
[30] G. Iancu, F. Flesch and W. Heinrich, Nuclear fragmentation cross-sections of 400 A MeV36Ar and 40Ar in collisions with light and heavy target nuclei, Radiat. Meas. 39, 525 (2005).
[31] Y. P. Viyogi et al., Fragmentations of 40Ar at 213 MeV/Nucleon, Phys. Rev. Lett. 42, 33(1979).
[32] A. Korejwo, T. Dzikowski, M. Giller, J. Wdowczyk, V. V. Perelygin and A. V. Zarubin,The measurement of isotopic cross sections of 12C beam fragmentation on liquid hydrogenat 3.66 GeV/nucleon, J. Phys. G: Nucl. Part. Phys. 26, 1171 (2000).
[33] A. Korejwo, M. Giller, T. Dzikowski, V. V. Perelygin and A. V. Zarubin, Isotopic cross-sections of 12C fragmentation on hydrogen measured at 1.87 and 2.69 GeV/nucleon, J.Phys. G: Nucl. Part. Phys. 28, 1199 (2002).
[34] M. Caamano, D. Cortina-Gil, K. Summerer, J. Benlliure, E. Casarejos, H. Geissel, G. Mun-zenberg and J. Pereira, Production cross-sections and momentum distributions of fragmentsfrom neutron-deficient 36Ar at 1.05 A GeV, Nucl. Phys. A 733, 187 (2004).
[35] C. N. Knott et al., Interactions of relativistic neon to nickel projectiles in hydrogen, ele-mental production cross sections, Phys. Rev. C 53, 347 (1996).
[36] C. N. Knott et al., Interactions of relativistic 36Ar and 40Ar nuclei in hydrogen: Isotopicproduction cross sections, Phys. Rev. C 56, 398 (1997).
[37] P. Napolitani, K.-H. Schmidt, A. S. Botvina, F. Rejmund, L. Tassan-Got and C. Villa-grasa, High-resolution velocity measurements on fully identified light nuclides produced in56Fe+hydrogen and 56Fe+titanium systems, Phys. Rev. C 70, 054607 (2004).
[38] S. E. Hirzebruch, W. Heinrich, K. D. Tolstov, A. D. Kovalenko and E. V. Benton, Frag-mentation cross sections of 16O between 0.9 and 200 GeV/nucleon, Phys. Rev. C 46, 1487(1992).
[39] D. Sampsonidis, E. Papanastassiou, M. Zamani, M. Debeauvais, J. C. Adloff, B. A. Kulakov,M. I. Krivopustov and V. S. Butsev, Fragmentation cross sections of 16O, 24Mg, and 32Sprojectiles at 3.65 GeV/nucleon, Phys. Rev. C 51, 3304 (1995).
[40] L. W. Townsend, T. M. Miller and T. A. Gabriel, HETC radiation transport code devel-opment for cosmic ray shielding applications in space, Rad. Prot. Dos. 116, 135 (2005).
[41] J. W. Muller, Possible advantages of a robust evaluation of comparisons, J. Res. Natl. Inst.Stand. Technol. 105, 551 (2000).
23
Appendix A QMSFRG Interpolation
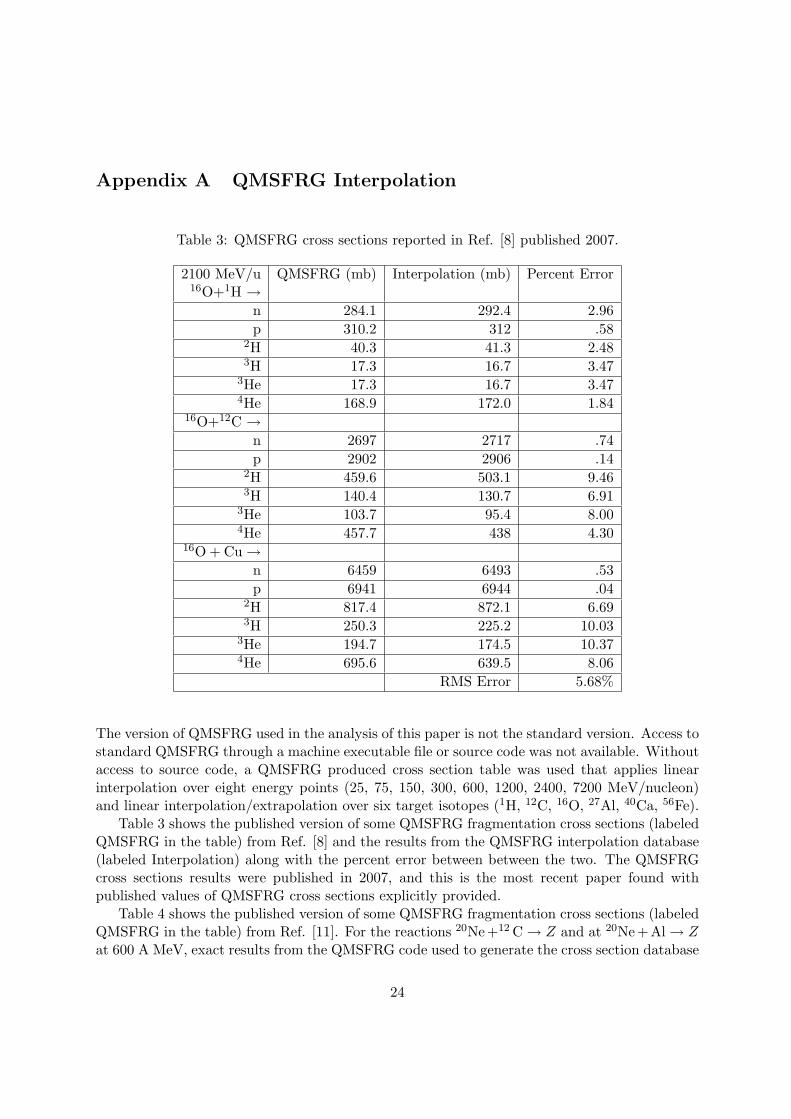
Table 3: QMSFRG cross sections reported in Ref. [8] published 2007.
2100 MeV/u QMSFRG (mb) Interpolation (mb) Percent Error16O+1H →
n 284.1 292.4 2.96
p 310.2 312 .582H 40.3 41.3 2.483H 17.3 16.7 3.47
3He 17.3 16.7 3.474He 168.9 172.0 1.84
16O+12C →
n 2697 2717 .74
p 2902 2906 .142H 459.6 503.1 9.463H 140.4 130.7 6.91
3He 103.7 95.4 8.004He 457.7 438 4.30
16O + Cu →
n 6459 6493 .53
p 6941 6944 .042H 817.4 872.1 6.693H 250.3 225.2 10.03
3He 194.7 174.5 10.374He 695.6 639.5 8.06
RMS Error 5.68%
The version of QMSFRG used in the analysis of this paper is not the standard version. Access tostandard QMSFRG through a machine executable file or source code was not available. Withoutaccess to source code, a QMSFRG produced cross section table was used that applies linearinterpolation over eight energy points (25, 75, 150, 300, 600, 1200, 2400, 7200 MeV/nucleon)and linear interpolation/extrapolation over six target isotopes (1H, 12C, 16O, 27Al, 40Ca, 56Fe).
Table 3 shows the published version of some QMSFRG fragmentation cross sections (labeledQMSFRG in the table) from Ref. [8] and the results from the QMSFRG interpolation database(labeled Interpolation) along with the percent error between between the two. The QMSFRGcross sections results were published in 2007, and this is the most recent paper found withpublished values of QMSFRG cross sections explicitly provided.
Table 4 shows the published version of some QMSFRG fragmentation cross sections (labeledQMSFRG in the table) from Ref. [11]. For the reactions 20Ne+12 C → Z and at 20Ne+Al → Zat 600 A MeV, exact results from the QMSFRG code used to generate the cross section database
24
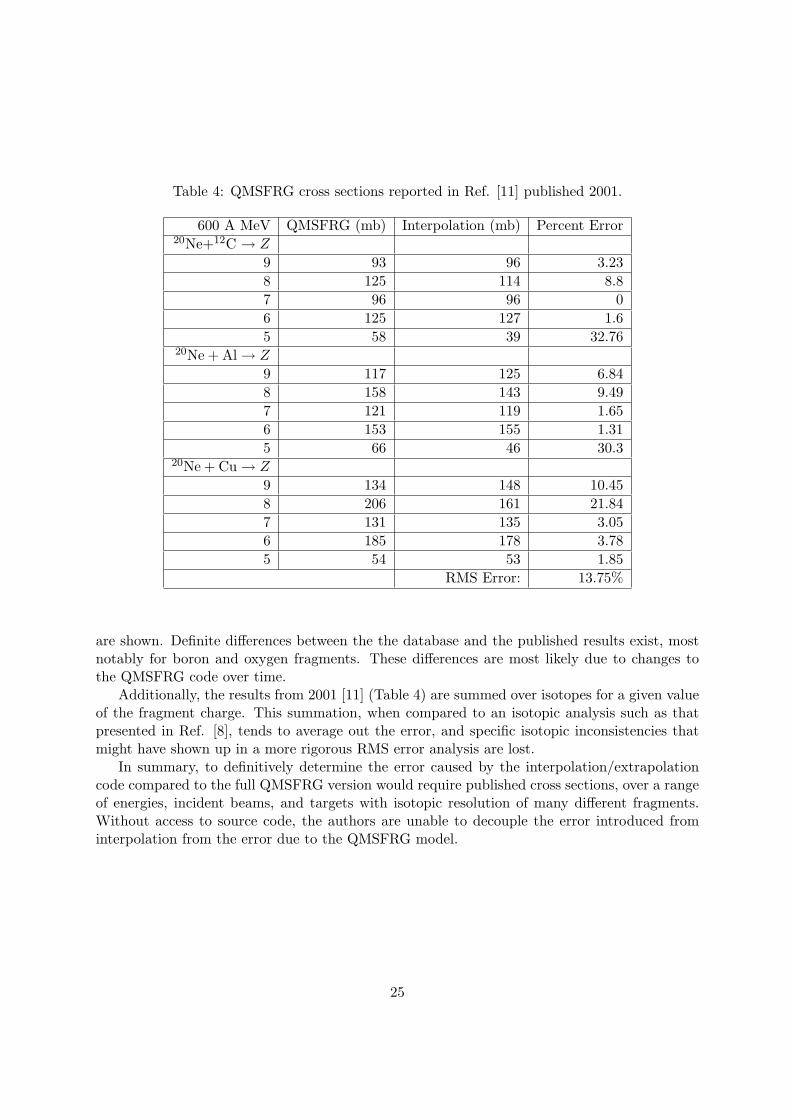
Table 4: QMSFRG cross sections reported in Ref. [11] published 2001.
600 A MeV QMSFRG (mb) Interpolation (mb) Percent Error20Ne+12C → Z
9 93 96 3.23
8 125 114 8.8
7 96 96 0
6 125 127 1.6
5 58 39 32.7620Ne + Al → Z
9 117 125 6.84
8 158 143 9.49
7 121 119 1.65
6 153 155 1.31
5 66 46 30.320Ne + Cu → Z
9 134 148 10.45
8 206 161 21.84
7 131 135 3.05
6 185 178 3.78
5 54 53 1.85
RMS Error: 13.75%
are shown. Definite differences between the the database and the published results exist, mostnotably for boron and oxygen fragments. These differences are most likely due to changes tothe QMSFRG code over time.
Additionally, the results from 2001 [11] (Table 4) are summed over isotopes for a given valueof the fragment charge. This summation, when compared to an isotopic analysis such as thatpresented in Ref. [8], tends to average out the error, and specific isotopic inconsistencies thatmight have shown up in a more rigorous RMS error analysis are lost.
In summary, to definitively determine the error caused by the interpolation/extrapolationcode compared to the full QMSFRG version would require published cross sections, over a rangeof energies, incident beams, and targets with isotopic resolution of many different fragments.Without access to source code, the authors are unable to decouple the error introduced frominterpolation from the error due to the QMSFRG model.
25
Appendix B Cumulative Relative Uncertainty
A cumulative relative uncertainty metric is presented here. Although not of importance to thepresent analysis, a relative uncertainty can be of interest in a validation program. For instance,in the case of high linear energy transfer (LET) radiation having a small flux compared to otherradiation present in the analysis. An absolute value of uncertainty based on the flux, however,might under-represent the importance of this radiation from a biological point of view. In thecase of high LET radiation or any other SRQ which might be better characterized by a relativevalue, a validation metric based on relative differences might be more appropriate. If a relativequantity is of interest, Eqs. (2) and (3) can be redefined as
D+ ≡M(xi) − [E(xi) + ǫ(xi)]
E(xi) + ǫ(xi), (B.1)
D− ≡M(xi) − [E(xi) − ǫ(xi)]
E(xi) − ǫ(xi), (B.2)
with the relative model uncertainty defined as
U(xi) ≡ MAX(
|D+(xi)|, |D−(xi)|
)
, (B.3)
which is consistent with Eq. (4). The relative uncertainty due to the experiment is given by
U e(xi) ≡ |D+(xi) − D−(xi)|. (B.4)
It should be noted that the difference functions D+ and D−, defined in Eqs. (B.1) and (B.2)respectively, are not relative to the same value. The difference functions were defined in thisway to be consistent with the interval representation of the data discussed in Section 3.1. Thisinconsistency in the difference functions, however, leads Eq. (B.4) to have a dependence on themodel value. Expanding Eq. (B.4) gives,
U e =2ǫM
E2 − ǫ2, (B.5)
where the dependence on the validation phase space point xi has been omitted. The lineardependence of U e on the model value M can lead to some confusion in how to interpret Eq.(B.5) since each model will have a distinct value of U e for the same experimental data. Oneinterpretation of U e for the relative case is the contribution of the experimental measurementuncertainty relative to E weighted by the ratio of M/E. This interpretation is the first orderapproximation of Eq. (B.5) when the ratio ǫ/E is small, which should be the case for most“good” experiments. Eq. (B.5) can then be interpreted as a measure of the importance ofthe uncertainty due to the experiment relative to the both the experiment and the model. Inaddition, it is important to remember that the uncertainty due to the experiment should alwaysbe used in conjunction with the total uncertainty from Eq. (B.3) since the uncertainty due tothe experiment will be largely used to determine if more precise experiments are needed to helpdetermine model accuracy.
26
0
0.5
1
1.5
2
2.5
3
0 0.1 0.2 0.3 0.4 0.5 0.6 0.7 0.8 0.9 1
Cu
mu
lati
ve R
elat
ive
Un
cert
ain
ty
Fraction of Data
NUCFRG2
QMSFRG Interpolation
NUCFRG2 Uncertainty due to Experiment
QMSFRG Interpolation Uncertainty due to Experiment
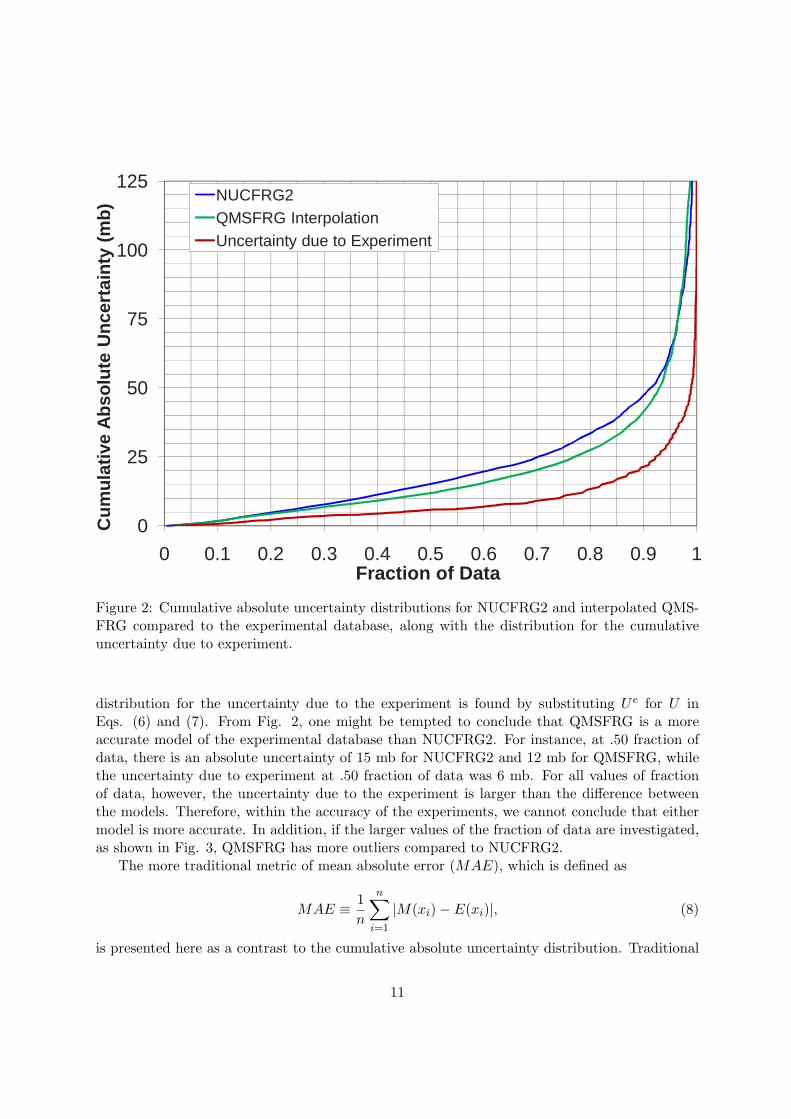
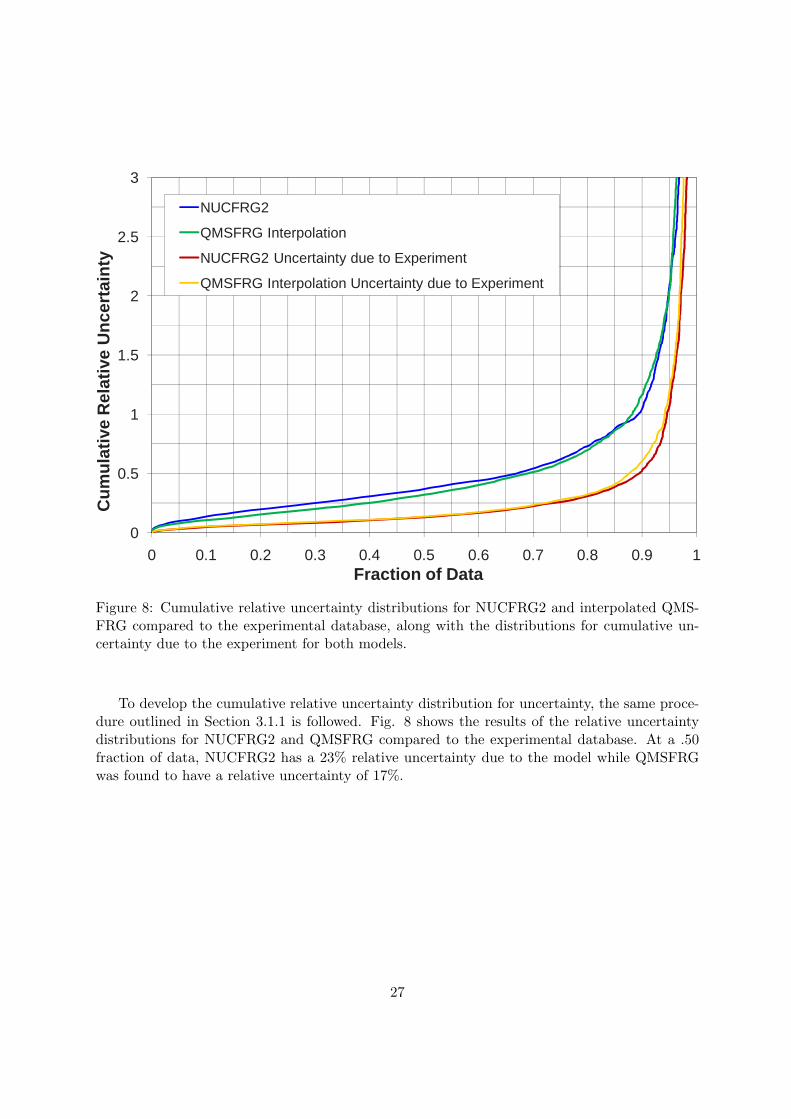
Figure 8: Cumulative relative uncertainty distributions for NUCFRG2 and interpolated QMS-FRG compared to the experimental database, along with the distributions for cumulative un-certainty due to the experiment for both models.
To develop the cumulative relative uncertainty distribution for uncertainty, the same proce-dure outlined in Section 3.1.1 is followed. Fig. 8 shows the results of the relative uncertaintydistributions for NUCFRG2 and QMSFRG compared to the experimental database. At a .50fraction of data, NUCFRG2 has a 23% relative uncertainty due to the model while QMSFRGwas found to have a relative uncertainty of 17%.
27
REPORT DOCUMENTATION PAGE Form ApprovedOMB No. 0704-0188
2. REPORT TYPE Technical Publication
4. TITLE AND SUBTITLEA Comprehensive Validation Methodology for Sparse Experimental Data
5a. CONTRACT NUMBER
6. AUTHOR(S)
Norman, Ryan B.; Blattnig, Steve R.
7. PERFORMING ORGANIZATION NAME(S) AND ADDRESS(ES)NASA Langley Research CenterHampton, VA 23681-2199
9. SPONSORING/MONITORING AGENCY NAME(S) AND ADDRESS(ES)National Aeronautics and Space AdministrationWashington, DC 20546-0001
8. PERFORMING ORGANIZATION REPORT NUMBER
L-19828
10. SPONSOR/MONITOR'S ACRONYM(S)
NASA
13. SUPPLEMENTARY NOTES
12. DISTRIBUTION/AVAILABILITY STATEMENTUnclassified - UnlimitedSubject Category 93Availability: NASA CASI (443) 757-5802
19a. NAME OF RESPONSIBLE PERSON
STI Help Desk (email: [email protected])
14. ABSTRACT
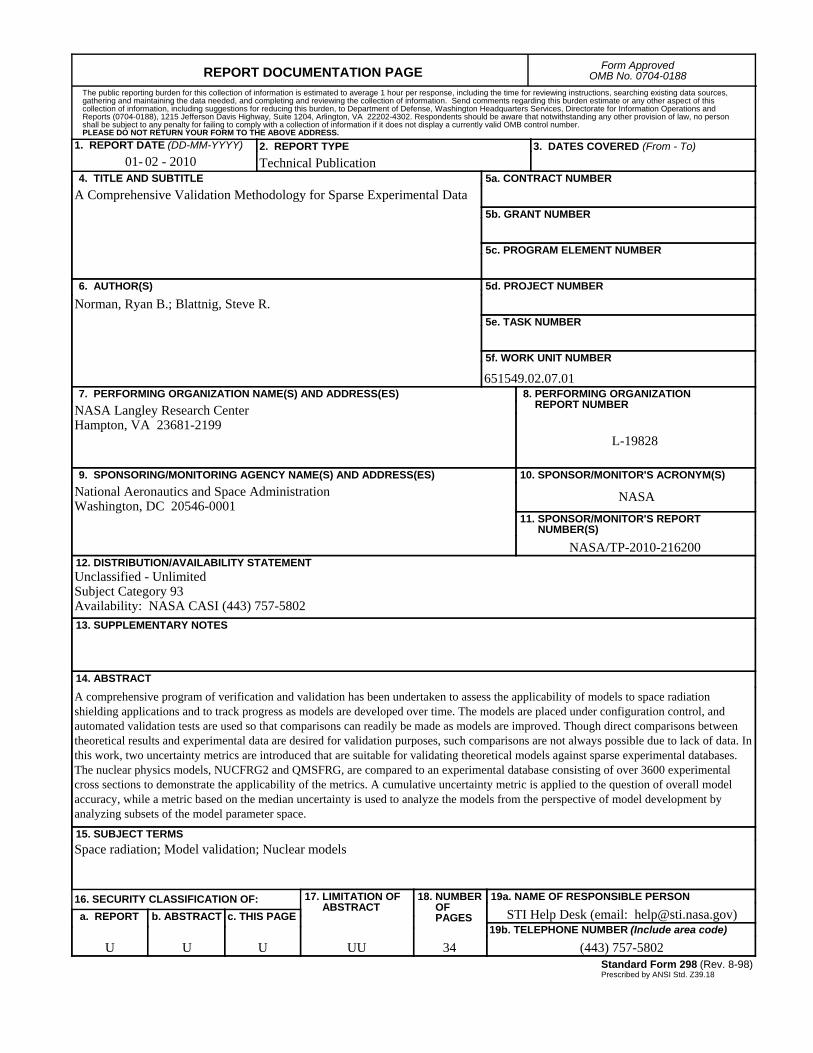
A comprehensive program of verification and validation has been undertaken to assess the applicability of models to space radiation shielding applications and to track progress as models are developed over time. The models are placed under configuration control, and automated validation tests are used so that comparisons can readily be made as models are improved. Though direct comparisons between theoretical results and experimental data are desired for validation purposes, such comparisons are not always possible due to lack of data. In this work, two uncertainty metrics are introduced that are suitable for validating theoretical models against sparse experimental databases. The nuclear physics models, NUCFRG2 and QMSFRG, are compared to an experimental database consisting of over 3600 experimental cross sections to demonstrate the applicability of the metrics. A cumulative uncertainty metric is applied to the question of overall model accuracy, while a metric based on the median uncertainty is used to analyze the models from the perspective of model development by analyzing subsets of the model parameter space.
15. SUBJECT TERMSSpace radiation; Model validation; Nuclear models
18. NUMBER OF PAGES
3419b. TELEPHONE NUMBER (Include area code)
(443) 757-5802
a. REPORT
U
c. THIS PAGE
U
b. ABSTRACT
U
17. LIMITATION OF ABSTRACT
UU
Prescribed by ANSI Std. Z39.18Standard Form 298 (Rev. 8-98)
3. DATES COVERED (From - To)
5b. GRANT NUMBER
5c. PROGRAM ELEMENT NUMBER
5d. PROJECT NUMBER
5e. TASK NUMBER
5f. WORK UNIT NUMBER
651549.02.07.01
11. SPONSOR/MONITOR'S REPORT NUMBER(S)
NASA/TP-2010-216200
16. SECURITY CLASSIFICATION OF:
The public reporting burden for this collection of information is estimated to average 1 hour per response, including the time for reviewing instructions, searching existing data sources, gathering and maintaining the data needed, and completing and reviewing the collection of information. Send comments regarding this burden estimate or any other aspect of this collection of information, including suggestions for reducing this burden, to Department of Defense, Washington Headquarters Services, Directorate for Information Operations and Reports (0704-0188), 1215 Jefferson Davis Highway, Suite 1204, Arlington, VA 22202-4302. Respondents should be aware that notwithstanding any other provision of law, no person shall be subject to any penalty for failing to comply with a collection of information if it does not display a currently valid OMB control number.PLEASE DO NOT RETURN YOUR FORM TO THE ABOVE ADDRESS.
1. REPORT DATE (DD-MM-YYYY)02 - 201001-