Embed Size (px)
Citation preview

A Conserved Endoplasmic Reticulum Membrane ProteinComplex (EMC) Facilitates Phospholipid Transfer fromthe ER to MitochondriaSujoy Lahiri1., Jesse T. Chao2., Shabnam Tavassoli2, Andrew K. O. Wong2, Vineet Choudhary1,
Barry P. Young2, Christopher J. R. Loewen2*, William A. Prinz1*
1 Laboratory of Cell and Molecular Biology, National Institute of Diabetes and Digestive and Kidney Diseases, National Institutes of Health, Bethesda, Maryland, United
States of America, 2 Department of Cellular and Physiological Sciences, Life Sciences Institute, University of British Columbia, Vancouver, British Columbia, Canada
Abstract
Mitochondrial membrane biogenesis and lipid metabolism require phospholipid transfer from the endoplasmic reticulum(ER) to mitochondria. Transfer is thought to occur at regions of close contact of these organelles and to be nonvesicular, butthe mechanism is not known. Here we used a novel genetic screen in S. cerevisiae to identify mutants with defects in lipidexchange between the ER and mitochondria. We show that a strain missing multiple components of the conserved ERmembrane protein complex (EMC) has decreased phosphatidylserine (PS) transfer from the ER to mitochondria.Mitochondria from this strain have significantly reduced levels of PS and its derivative phosphatidylethanolamine (PE). Cellslacking EMC proteins and the ER–mitochondria tethering complex called ERMES (the ER–mitochondria encounter structure)are inviable, suggesting that the EMC also functions as a tether. These defects are corrected by expression of an engineeredER–mitochondrial tethering protein that artificially tethers the ER to mitochondria. EMC mutants have a significant reductionin the amount of ER tethered to mitochondria even though ERMES remained intact in these mutants, suggesting that theEMC performs an additional tethering function to ERMES. We find that all Emc proteins interact with the mitochondrialtranslocase of the outer membrane (TOM) complex protein Tom5 and this interaction is important for PS transfer and cellgrowth, suggesting that the EMC forms a tether by associating with the TOM complex. Together, our findings support thatthe EMC tethers ER to mitochondria, which is required for phospholipid synthesis and cell growth.
Citation: Lahiri S, Chao JT, Tavassoli S, Wong AKO, Choudhary V, et al. (2014) A Conserved Endoplasmic Reticulum Membrane Protein Complex (EMC) FacilitatesPhospholipid Transfer from the ER to Mitochondria. PLoS Biol 12(10): e1001969. doi:10.1371/journal.pbio.1001969
Academic Editor: Sandra L. Schmid, UT Southwestern Medical Center, United States of America
Received May 21, 2014; Accepted September 3, 2014; Published October 14, 2014
This is an open-access article, free of all copyright, and may be freely reproduced, distributed, transmitted, modified, built upon, or otherwise used by anyone forany lawful purpose. The work is made available under the Creative Commons CC0 public domain dedication.
Data Availability: The authors confirm that all data underlying the findings are fully available without restriction. All relevant data are within the paper and itsSupporting Information files.
Funding: S.L., V.C., and W.A.P. were supported by the Intramural Research Program of the National Institute of Diabetes and Digestive and Kidney Diseases(http://irp.nih.gov/our-research/our-programs/niddk). C.L. was supported by the Canadian Institutes of Health Research (http://www.cihr-irsc.gc.ca/e/193.html),the Natural Sciences and Engineering Research Council of Canada (http://www.nserc-crsng.gc.ca/index_eng.asp), the Michael Smith Foundation for HealthResearch (http://www.msfhr.org), the Canada Foundation for Innovation (http://www.innovation.ca), and the Tula Foundation (http://tula.org). The funders hadno role in study design, data collection and analysis, decision to publish, or preparation of the manuscript.
Competing Interests: The authors have declared that no competing interests exist.
Abbreviations: 5-FOA, 5-fluoroorotic acid; CL, cardiolipin; DAG, diacylglycerol; EM, electron microscopy; EMC, endoplasmic reticulum membrane proteincomplex; ER, endoplasmic reticulum; ERMES, ER–mitochondria encounter structure; MAM, mitochondrial-associated membranes; PA, phosphatidic acid; PC,phosphatidylcholine; PCA, protein-fragment complementation assay; PE, phosphatidylethanolamine; PS, phosphatidylserine; SGA, synthetic genetic array; TAP,tandem affinity purification; TOM, mitochondrial translocase of the outer membrane; UPR, unfolded protein response.
* Email: [email protected] (C.J.R.L.); [email protected] (W.A.P.)
. These authors contributed equally to this work.
Introduction
Mitochondria are critical cellular components that are needed
for energy production, lipid metabolism, calcium regulation, and
apoptosis. Most proteins and lipids necessary for mitochondrial
biogenesis are not synthesized in mitochondria and must be
imported. Although protein import into mitochondria is relatively
well understood, much less is known about phospholipid transfer
to mitochondria. Phospholipid synthesis occurs largely in the
endoplasmic reticulum (ER), and mitochondria acquire phospho-
lipids from the ER at regions of close contact between these
organelles [1–3]. Zones of close contact between organelles, often
called membrane contact sites, are regions where lipids, small
molecules, and other signals are transferred between organelles
[4–6]. Contacts between the ER and mitochondria are not only
important for lipid exchange and signaling between these
organelles, but have also been proposed to play a role in calcium
signaling, apoptosis, Alzheimer’s disease pathology, and viral
replication [7–10].
Protein complexes proposed to mediate ER–mitochondria
contacts have been identified in mammalian cells and in
Saccharomyces cerevisiae [11–14]. The only such complex that
has been found in yeast to date is called the ER–mitochondria
encounter structure (ERMES), which comprises the integral ER
glycoprotein, Mmm1, the cytosolic protein, Mdm12, and two
proteins of the outer mitochondrial membrane, Mdm10 and
PLOS Biology | www.plosbiology.org 1 October 2014 | Volume 12 | Issue 10 | e1001969

Mdm34 [14]. The ERMES complex may play a role in
phospholipid exchange between the ER and mitochondria.
Notably, three of the four proteins contain a domain that may
facilitate lipid exchange between closely apposed membranes [15].
The study that identified the ERMES complex found that
phospholipid exchange between the ER and mitochondria
decreases 2–5-fold in cells missing this complex [14]. However,
two subsequent studies found that the transfer of phosphatidylser-
ine (PS) from the ER, where it is produced [16], to mitochondria,
did not significantly slow in cells lacking the ERMES complex
[17,18]. These findings suggest that protein complexes in addition
to ERMES mediate ER–mitochondria tethering, as lipid exchange
between these organelles probably occurs only at contacts. In
addition, the fact that cells lacking ERMES are viable suggests
there may be other tethering complexes, as ER–mitochondria
tethering is probably essential [19].
The mechanism of phospholipid exchange between the ER and
mitochondria at sites of contact between these organelles is not
well understood, but is thought to be nonvesicular [2,3]. A small
number of mutants that reduce ER to mitochondria lipid transfer
have been identified. One is missing Met30, a subunit of an
ubiquitin ligase complex [20] that ubiquitinates the transcription
factor Met4, which in turn regulates PS transfer to mitochondria
[21]. Cells missing both the ERMES complex and proteins needed
to shape the ER have a similar ,50% decrease in ER to
mitochondria PS transfer [18]. However, why lipid exchange slows
in these mutants is not understood.
PS transfer to mitochondria is required for the synthesis of
phosphatidylethanolamine (PE) in mitochondria [2]. PE is critical
for mitochondrial function [22,23]. Although PE can be made
outside mitochondria, for unknown reasons this PE is not
efficiently transferred to mitochondria [24]. Failure to import PE
may explain why all cells from yeast to humans have an enzyme
that converts PS to PE in the mitochondrial matrix. In yeast, this
protein is called PS decarboxylase 1 or Psd1 (Figure 1A) [25,26].
PE produced in mitochondria by Psd1 can be transferred back to
the ER and converted to phosphatidylcholine (PC) by the
methyltransferases, Cho2 and Opi3 (Figure 1A). There is a second
PS decarboxylase in yeast, called Psd2, which may reside in the
Golgi complex, endosomal system, or vacuole [27]. PE can also be
synthesized from diacylglycerol (DAG) and CDP–ethanolamine, a
metabolic pathway known as the Kennedy pathway (Figure 1A)
[28]. The Kennedy pathway can also produce PC from DAG and
CDP–choline (Figure 1A).
In this study, we employed an array-based genetic interaction
screen to identify genes required for phospholipid exchange
between the ER and mitochondria. We found that mutants
missing multiple proteins of the ER-membrane protein complex
(EMC) had defects in PS transfer to mitochondria, reduced ER–
mitochondrial tethering, and impaired mitochondria function.
This complex contains six conserved proteins, called Emc1–6 [29].
The EMC has been suggested to play roles in the cellular response
to ER stress, in membrane protein folding, or the unfolded protein
response (UPR) in the ER [29–33]. However, the molecular
functions of the EMC are not known. Our findings indicate that
the EMC mediates lipid transfer from the ER to mitochondria by
facilitating tethering between these organelles.
Results
Genetic Screen for Components That Mediate Transfer ofPhospholipids Between ER and Mitochondria
In a prior synthetic genetic array (SGA) screen for the PSD1gene, we uncovered an aggravating genetic interaction with the
CHO2 gene. We found that the growth defect of the Dpsd1Dcho2mutant was rescued by the addition of ethanolamine or choline to
the medium (Figure 1B), which allows cells to make PE and PC via
the Kennedy pathway, indicating that this mutant had a defect in
PE synthesis from PS (Figure 1A). We reasoned that genes
required for transfer of PS from ER to mitochondria and PE
from mitochondria to ER would similarly have negative genetic
interactions with CHO2 that would be rescued by ethanolamine or
choline. Therefore, we performed SGA screens for the CHO2gene in the absence and presence of choline to identify genes that
functioned in lipid transfer between ER and mitochondria. The
results of this genome-wide screen are shown in Figure 1C, in
which we plotted the growth of double mutants in the absence of
choline versus their growth in its presence. We identified 209
aggravating genetic interactions in total, 187 that we deemed were
rescued by choline addition (Figure 1C and Table S1). We found
significant enrichment for various functional classifications for this
set of genes, and these are shown in Figure 1D (see also Table S2).
Membrane-associated functions were highly represented among
these groups and included ER, vacuole, and endosomal compart-
ments.
Genetic Interactions Reveal That the EMC Functions inPhospholipid Synthesis
In the Cellular Component category, we noticed an almost 30-
fold enrichment for subunits of the EMC, a conserved unchar-
acterized ER membrane protein complex (Figure 1D) [29]. In our
screen, genes encoding the six subunits of the EMC showed strong
aggravating genetic interactions with CHO2 that were rescued by
choline addition (Figure 2A). We verified these genetic interactions
and their rescue by choline by spot assay (Figure S1). Interestingly,
these interactions were not rescued by ethanolamine, suggesting
that the EMC has functions distinct from PE production by Psd1.
To uncover additional functional information about the EMC,
we examined the global genetic interaction network, which is a
comprehensive map of pairwise genetic interactions in which
genes with similar functions form coherent clusters [34]. We
noticed that all EMC genes except for EMC5, which was not
present in the global network, formed a discrete cluster, suggesting
EMC genes share similar functions (Figure 2B). Interestingly, also
Author Summary
Mitochondrial membrane biogenesis and lipid metabolismdepend on the transfer of phospholipid from theendoplasmic reticulum to mitochondria. This transfer isthought to occur at regions where these organelles are inclose contact, and, although the process is thought not toinvolve vesicles, the mechanism is not known. In thisstudy, we found a complex of proteins in the endoplasmicreticulum that is required for the transfer of onephospholipid—phosphatidylserine—from the endoplas-mic reticulum to mitochondria. Cells lacking this proteincomplex have nonfunctional mitochondria with an abnor-mal lipid composition. We show that the complex isrequired to maintain close contacts between the endo-plasmic reticulum and mitochondria; the complex proba-bly directly interacts with at least one protein on thesurface of mitochondria. In addition, cells lacking thiscomplex and a second previously identified tetheringcomplex are not viable. Thus, our findings suggest thattethering of the endoplasmic reticulum and mitochondriais essential for cell growth, likely because it is necessary forlipid exchange between these organelles.
The EMC Facilitates ER to Mitochondria PS Transfer
PLOS Biology | www.plosbiology.org 2 October 2014 | Volume 12 | Issue 10 | e1001969

Figure 1. Genome-wide screen for regulators of phospholipid synthesis. (A) Phospholipid synthesis in the methylation pathway iscompartmentalized between ER and mitochondria. PS synthesized in the ER is transferred to mitochondria for conversion into PE and transportedback to the ER for conversion to PC. The Kennedy pathway synthesizes PE and PC from ethanolamine (etn) and choline (cho) independent of lipidtransfer between ER and mitochondria. (B) Yeast growth assays for the indicated mutants in the absence (nil) or presence of ethanolamine (+ etn) orcholine (+ cho). (C) Results of SGA screen for CHO2 in the absence (–) and presence (+) of choline. Genetic interactions are plotted as the log2 of the
The EMC Facilitates ER to Mitochondria PS Transfer
PLOS Biology | www.plosbiology.org 3 October 2014 | Volume 12 | Issue 10 | e1001969

in this cluster were CHO2 and OPI3, which encode the two
methyltransferases that convert PE to PC (Figure 1A), supporting
a role for EMC genes in phospholipid metabolism. EMC genes
showed primarily aggravating genetic interactions with a cluster of
genes with roles in lipid metabolism including ICE2, INO2, and
INO4. The latter two encode both subunits of the Ino2/4
transcriptional activator complex required for expression of genes
involved in phospholipid synthesis, including OPI3.
Next, we performed an SGA screen for one of the EMC genes,
EMC6, to further define functions for the EMC complex. We
identified 37 aggravating and 45 alleviating genetic interactions
with EMC6 (Table S3). Genetic interactions with EMC6 revealed
enrichment for functions associated with lipid metabolism,
mitochondria, membrane traffic, cell polarity and morphogenesis,
cell signaling, and chromatin (Figure 2C). Although EMC genes
have been found to have links to the UPR [29–31], we did not find
significant enrichment for ER stress response functions and EMC6did not interact genetically with either HAC1 or IRE1, two key
factors required for induction of the UPR. Our screen did uncover
genetic interactions with key regulators of phospholipid metabo-
lism, INO2, INO4, and SCS2, as well as CHO2 (Figure 2C),
further supporting a role for EMC proteins in phospholipid
synthesis. We also did not observe aggravating genetic interactions
between EMC6 and any of the remaining EMC genes (Table S3).
EMC Proteins Form a Complex in the EREMC proteins 1–6 were first identified by their ability to
interact in an affinity purification experiment [29]. We now
examined their individual localizations by tagging the endogenous
proteins with GFP and imaging by confocal microscopy. We found
that each of Emc1–6 localized throughout the yeast ER and were
expressed at similar levels (Figure 3A). Next we verified interac-
tions between each EMC protein by Protein-Fragment Comple-
mentation Assay (PCA) in which we tagged each endogenous Emc
protein with one half of the Venus fluorescent protein. When two
proteins interact, the two halves of Venus bind each other
(probably irreversibly) and form a fluorescent protein. Shown in
Figure 3B is the matrix containing all pair-wise interactions
between the EMC proteins. We observed PCA interactions in the
ER between most EMC proteins, and there was no single EMC
protein that failed to interact with any other EMC protein,
suggesting that all six EMC proteins did indeed form a complex
within the ER. Interestingly, we did not detect interactions
between Emc1 and Emc3 or Emc1 and Emc4, whereas all other
EMC proteins interacted, suggesting that Emc1 was organized
distinctly within the complex.
ER to Mitochondria PS Transfer Decreases in Cells MissingMultiple EMC Proteins
To determine if the EMC plays a role in phospholipid exchange
between the ER and mitochondria, we used an in vivo assay to
measure PS import into mitochondria from the ER. After synthesis
in the ER, PS can be transferred to mitochondria and converted to
PE by Psd1 [28]. Thus, the conversion of newly synthesized PS to
PE has been used to estimate the amount of PS transfer from the
ER to mitochondria [21]. We metabolically labeled cells with
[3H]serine, which is used for PS production in the ER [16].
Previously, we have shown that using the labeling conditions
described in Materials and Methods, cells produce PS and PE at
linear rates and that little of the radiolabeled PE is converted to PC
[35]. Strains were labeled with [3H]serine for 30 min and the ratio
of [3H]PE to [3H]PS calculated. In a wild-type strain, this ratio
was 2.5. Cells missing either Psd1 or Psd2 had a significant
decrease in the [3H]PE to [3H]PS ratio, and this ratio was close to
zero in a strain missing both proteins (Figure 4A).
Using this assay we determined the amount of PS converted to
PE in cells missing any one of the Emc proteins. We found that the
amount of PS converted to PE did not decrease significantly in
these strains (Figure 4A). However, in cells missing multiple EMC
proteins, PS to PE conversion was significantly slowed. A strain
lacking Emc2 and Emc6 had a ,25% decrease in the ratio of
[3H]PE to [3H]PS compared to wild-type. Cells missing additional
Emc proteins had more substantial transfer defects; a strain
missing Emc1, Emc2, Emc3, and Emc6 (4x-emc) or one missing
these proteins and Emc5 (5x-emc) had ,50% reduction in the
ratio of [3H]PE to [3H]PS (Figure 4A). These strains contain Psd2,
which is outside mitochondria and converts a significant fraction
of newly synthesized PS to PE (Figure 4A). Because the amount of
PS to PE conversion in 4x-emc and 5x-emc cells was about the
same as that of cells lacking Psd1, our findings suggest that very
little PS to PE conversion occurs in the mitochondria of these
strains.
To rule out that the decrease in PS to PE conversion in 5x-emc
cells was caused by a reduction in Psd1 activity or mislocalization
of Psd1, we determined the amount of Psd activity in mitochondria
derived from 5x-emc cells. An in vitro Psd assay was performed
using a fluorescent PS analog [7-nitro-2–1,3-benzoxadiazol-4-yl]-
PS (NBD-PS). We found mitochondrial Psd activity was not
reduced in mitochondria from 5x-emc cells compared to those
from wild-type cells, but rather was significantly increased, for
unknown reasons (Figure 4C). In addition, we ruled out that the
decrease in PS to PE conversion in 5x-emc cells was due to
differences in total PS production during the labeling; there was no
significant difference between total PS produced in wild-type and
the EMC mutants (Figure S2A). We also confirmed that the rates
of PS and PE production were linear in wild-type [35] and 5x-emc
cells over the course of the 30-min labeling (Figure S2B). These
findings confirm that 5x-emc cells have a significant decrease in
the transfer of PS from the ER to mitochondria.
To test whether most of the PS converted to PE in 5x-emc cells
was due to Psd2, we sought to make a 5x-emc psd2D strain and
hence to measure PS to PE conversion only in the mitochondrial
pathway. However, we found that 5x-emc psd2D cells were not
viable. We transformed 5x-emc cells with a plasmid containing
PSD2 and URA3 and then deleted PSD2 on the chromosome.
The resulting strain was not able to grow on medium with 5-
fluoroorotic acid (5-FOA), which is toxic to URA3 strains and
selects against the plasmid carrying the URA3 and PSD2 genes
(Figure 4B), confirming that the 5x-emc psd2D mutant was not
viable. Adding ethanolamine to the medium, which is used to
make PE by the Kennedy pathway (Figure 1A), and which
restored viability of psd1D psd2D cells, did not rescue the 5x-emc
psd2D mutant (Figure 4B). This suggests that the 5x-emc mutant
might have lipid metabolism defects in addition to significantly
reduced PS transfer to mitochondria. For example, it is possible
that PE synthesis by the Kennedy pathway or the conversion of PE
ratio of growth of single versus double mutants with Dcho2 in the absence and presence of choline. Interactions rescued by choline (green triangles)predominately clustered on the x axis, whereas interactions not rescued (red squares) were present on the diagonal. (D) Enrichment of functionalgroups for the genes that showed interactions and were rescued by choline in (C). Fold enrichment represents the frequency of a given term in ourdataset relative to the frequency of that term in the whole genome.doi:10.1371/journal.pbio.1001969.g001
The EMC Facilitates ER to Mitochondria PS Transfer
PLOS Biology | www.plosbiology.org 4 October 2014 | Volume 12 | Issue 10 | e1001969
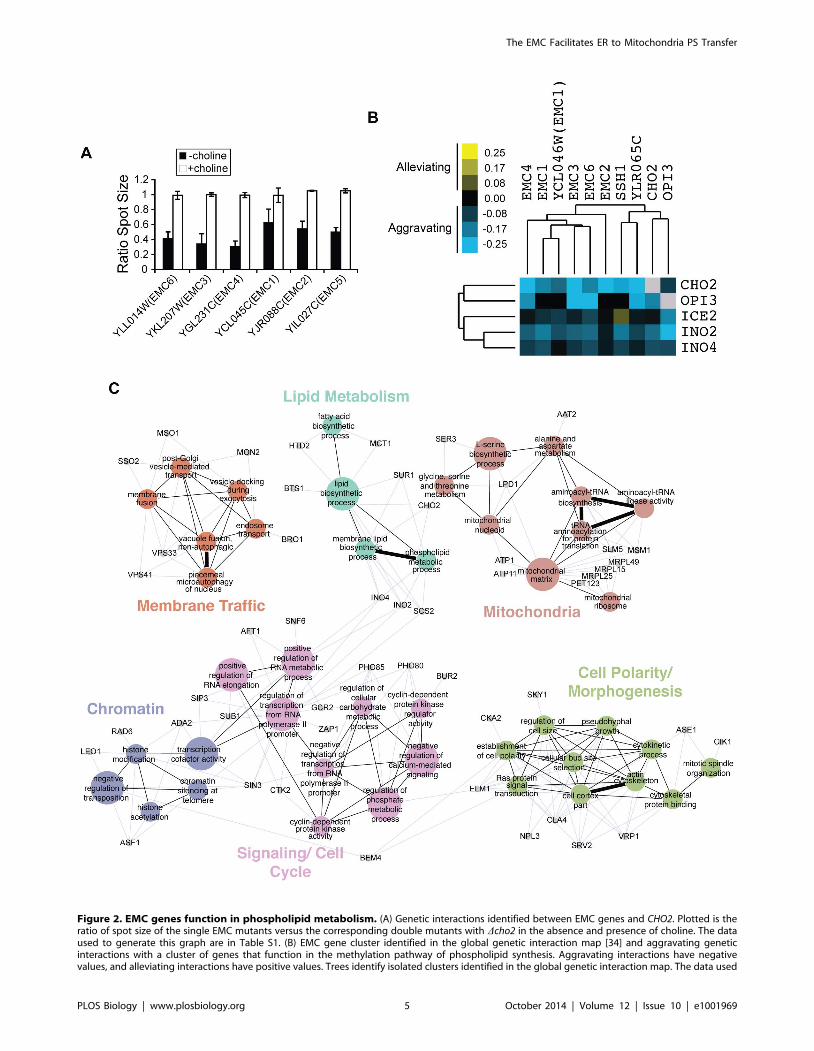
Figure 2. EMC genes function in phospholipid metabolism. (A) Genetic interactions identified between EMC genes and CHO2. Plotted is theratio of spot size of the single EMC mutants versus the corresponding double mutants with Dcho2 in the absence and presence of choline. The dataused to generate this graph are in Table S1. (B) EMC gene cluster identified in the global genetic interaction map [34] and aggravating geneticinteractions with a cluster of genes that function in the methylation pathway of phospholipid synthesis. Aggravating interactions have negativevalues, and alleviating interactions have positive values. Trees identify isolated clusters identified in the global genetic interaction map. The data used
The EMC Facilitates ER to Mitochondria PS Transfer
PLOS Biology | www.plosbiology.org 5 October 2014 | Volume 12 | Issue 10 | e1001969

to PC is defective in 5x-emc cells. However, we found that both
processes occurred at similar rates in wild-type and 5x-emc cells
(Figure S3). Therefore, it remains unclear why 5x-emc psd2D cells
are not viable even when grown in media containing ethanol-
amine.
Mitochondria in 5x-emc Cells Are Nonfunctional andHave Abnormal Phospholipid Levels
Because 5x-emc cells have reduced PS transfer from ER to
mitochondria, we suspected that mitochondria from 5x-emc cells
would have reduced amounts of PS and PE. To measure
phospholipid levels, wild-type and 5x-emc cells were labeled with
[3H]acetate for at least 3–4 generations and the relative
abundance of the major phospholipids in purified mitochondria
was determined. We found that PS levels in the mitochondria from
5x-emc cells were about 50% lower than those in wild-type
mitochondria (Figure 5A). Therefore, reduced ER to mitochon-
dria PS transfer in 5x-emc cells results in decreased steady-state PS
levels in mitochondria. Notably, PE levels were also reduced about
50%. This reduction is probably caused by the defect in ER to
mitochondria PS transfer in 5x-emc cells, as most PE in
mitochondria is generated from PS by Psd1 [24]. Interestingly,
the relative abundance of other phospholipids was increased in 5x-
emc mitochondria, particularly phosphatidic acid (PA) and
cardiolipin (CL) (Figure 5A). It may be that the transfer of PA
and other CL precursors into mitochondria is not as sensitive to
the loss of the EMC as is PS transfer. Alternatively, the increase in
PA and CL may reflect a mechanism by which cells compensate
for low levels of mitochondrial PE, which is thought to be critical
for proper mitochondrial function [22].
Because the lipid profile of mitochondria in 5x-emc cells was
dramatically altered, we wondered if the mitochondria were
functional. Yeast strains with nonfunctional mitochondria cannot
grow on media containing nonfermentable carbon sources such as
glycerol. We found that 5x-emc cells and other strains missing
multiple EMC proteins did not grow on the glycerol-containing
medium, YPGly, as has previously been found for cells lacking the
ERMES component Mmm1 (Figure 5B) [36]. Therefore cells
missing multiple EMC proteins do not have functional mitochon-
dria, probably because of the abnormal levels of phospholipids in
the mitochondria of these strains. Interestingly, 5x-emc cells also
had a substantial growth defect even on glucose-containing media
(Figures 4B and 5B).
5x-emc Cells Have a Reduced Rate of ER to MitochondriaPS Transfer in Vitro
Because we found that 5x-emc cells have reduced ER to
mitochondria PS transfer in vivo, we wondered if a similar defect
could be detected in vitro. We used a previously established two-
step assay to monitor the transfer of newly synthesized PS from the
ER to mitochondria [18,37]. In the first step, crude mitochondria
are incubated for 20 min with [3H]serine and Mn2+. We have
shown that crude mitochondria have tightly associated ER-derived
membranes that contain PS synthase [18]. The presence of Mn2+
is required by PS synthase but inhibits the conversion of [3H]PS to
[3H]PE by Psd1 [37]. Thus, in the second step of the reaction,
Mn2+ is chelated by EDTA and the PS to PE conversion rate was
determined. Because Psd2 is not active in this assay [18], all PS to
PE conversions in this assay are mediated by Psd1 and indicate the
rate of PS transfer from ER to mitochondria. Using mitochondria
derived from wild-type cells, we found that about 1% of [3H]PS
synthesized was converted to PE per minute (Figure 6A). When
mitochondria from 3x-emc (missing Emc2, Emc5, and Emc6) and
5x-emc cells were used, this rate decreased about 2- and 3-fold,
respectively (Figure 6A). It should be noted that for all the strains
tested, the rate of PS to PE conversion was linear (R2$0.9).
Because mitochondria derived from 5x-emc cells have Psd activity
that is not lower than those from wild-type (Figure 4C), these
findings indicate that the rate of ER to mitochondria PS transfer is
significantly reduced in crude mitochondria derived from 5x-emc
cells.
The EMC and ERMES Complexes Are Required forViability and ER to Mitochondria PS Transfer
Because the ERMES complex is thought to function as a tether
between the ER and mitochondria, we wondered whether PS
transfer would be slower in crude mitochondria missing Emc
proteins and the ERMES complex. As disruption of a single
ERMES component causes disassembly of the entire complex
[14], we sought to delete one of the four genes encoding the
ERMES proteins in 5x-emc cells. However, we were unable to
delete MMM1 in 5x-emc cells, probably because the resulting
strain was not viable. Therefore, we introduced the conditional
mmm1-1 allele into 5x-emc cells. The 5x-emc mmm1-1 strain was
not viable at the nonpermissive temperature of 37uC (Figure 6B),
indicating that cells required either ERMES or the EMC for
viability.
We next asked if ER to mitochondria PS transfer was more
reduced in cells missing both ERMES and the EMC than in cells
missing only the EMC. We found that when 5x-emc mmm1-1 cells
were shifted to the restrictive temperature (37uC) they stopped
growing after ,4 h. Therefore, we isolated crude mitochondria
from 5x-emc mmm1-1 cells 3 h after shift to 37uC, to insure that
the cells were still viable. In these mitochondria, the rate of PS to
PE conversion was reduced ,5-fold (Figure 6A). Because mito-
chondria derived from 5x-emc mmm1-1 cells do not have less Psd
activity than those from wild-type (Figure 4C), these findings
suggested that cells missing both ERMES and the EMC have very
little PS transfer from the ER to mitochondria, which was
consistent with the growth defect of these cells. The difference
between the rates for 5x-emc and 5x-emc mmm1-1 mutants was
not statistically significant, likely because of their already low rates
of transfer. However, we found that the rate of PS to PE
conversion in membranes derived from mmm1-1 single mutant
cells was not significantly lower than wild-type, suggesting that the
EMC was the critical component mediating ER to mitochondria
PS transfer in vitro.
Cells Missing the EMC or the ERMES Complex HaveReduced ER–Mitochondrial Tethering
The decrease in ER to mitochondria PS transfer in cells missing
EMC proteins could be caused by a decreased ability to transfer
PS or by inefficient tethering of the ER to mitochondria. The
EMC might play a direct role in these processes or it could
regulate the proteins that mediate lipid transfer or tethering. To
characterize the nature of the PS transfer defect in cells missing
to generate this figure have been published [34]. (C) Functional map for EMC6 derived using genetic interactions identified in the EMC6 SGA screen.Colored nodes represent functional groups, and edges define associations between groups. Node size and edge thickness indicate their level ofsignificance within the network. Genes (grey nodes) identified in the screen that are associated with each functional group are shown (blue edges).doi:10.1371/journal.pbio.1001969.g002
The EMC Facilitates ER to Mitochondria PS Transfer
PLOS Biology | www.plosbiology.org 6 October 2014 | Volume 12 | Issue 10 | e1001969

EMC proteins, we determined if artificially tethering the ER and
mitochondria corrects the PS transfer defect in mitochondria
derived from 5x-emc and 5x-emc mmm1-1 cells. For these studies
we used a fusion protein called ChiMERA, which has previously
been shown to tether the ER and mitochondria [14]. When this
fusion protein was expressed in 5x-emc and 5x-emc mmm1-1 cells,
it corrected the ER to mitochondria PS transfer defect in
mitochondria derived from these strains (Figure 6B). It also
restored the ability of 5x-emc mmm1-1 cells to grow at elevated
temperature (Figure 6C). These findings suggest that the defect in
Figure 3. EMC proteins form a complex in the ER. (A) Yeast expressing EMC proteins endogenously tagged with GFP imaged by confocalmicroscopy; top panel, fluorescence image; bottom panel, DIC. (B) Interactions between EMC proteins in the ER imaged using Venus PCA. Images ofcells expressing proteins fused to either of the two halves of the Venus proteins (VF1 or VF2). Scale bars, 2 mm.doi:10.1371/journal.pbio.1001969.g003
The EMC Facilitates ER to Mitochondria PS Transfer
PLOS Biology | www.plosbiology.org 7 October 2014 | Volume 12 | Issue 10 | e1001969

ER to mitochondria PS transfer in 5x-emc and 5x-emc mmm1-1cells may be caused by inefficient tethering of the ER and
mitochondria.
To more directly determine if cells missing the EMC or
ERMES complexes have defects in ER–mitochondria tethering,
we used a previously described assay to quantitatively measure the
association of these organelles [12]. A subdomain of the ER, often
called the mitochondrial-associated membrane (MAM), remains
tightly associated with mitochondria after their purification, and is
thought to be the portion of the ER that forms ER–mitochondria
contacts. To quantitatively measure these contacts, we determined
the percent of the ER that copurifies with mitochondria by
measuring the fraction of the ER proteins, Dpm1 and Kar2, in
purified mitochondria. We found a significant decrease in the
percent for ER co-purifying with mitochondria from mmm1D or
5x-emc cells (Figure 7A). Because there were no significant
differences in the percentages of mitochondria purified from the
strains (Figure 7A, right panel), these results indicate that there is a
dramatic decrease in ER–mitochondria tethering in mmm1D and
5x-emc cells.
Figure 4. Cells missing multiple EMC proteins have defects in PS transfer from the ER to mitochondria. (A) Cells with the indicatedgenotypes were labeled with [3H]serine for 30 min and the ratio of [3H]PS converted to [3H]PE determined (mean 6s.d., n = 3–5 independentexperiments). The dashed red line indicates the amount of conversion that occurred in psd1D cells. * p,0.05 compared to wild-type, independenttwo-tailed t test. (B) The 10-fold serial dilutions of cultures of the indicated strains were spotted onto SC medium with or without 5-FOA andethanolamine. The plates were incubated at 30uC for 4 d. (C) PSD activity of crude mitochondria incubated with NBD-PS for 1 h at 30uC. PSD activitywas normalized to that of wild-type crude-mitochondria (mean 6s.d., n = 2–3 independent experiments). * p,0.05 compared to wild-type,independent two-tailed t test. The data used to generate panels A and C are in Table S4.doi:10.1371/journal.pbio.1001969.g004
The EMC Facilitates ER to Mitochondria PS Transfer
PLOS Biology | www.plosbiology.org 8 October 2014 | Volume 12 | Issue 10 | e1001969

We confirmed the decrease in ER–mitochondrial tethering in
mmm1D and 5x-emc by ultrastructural analysis using transmission
electron microscopy (EM). We quantified the length of contacts
where the ER membrane was within a distance of 30 nm to the
mitochondria membrane and the ratio of the length of ER–
mitochondria contacts to mitochondrial perimeter. Contacts were
significantly reduced in both mmm1D and 5x-emc cells (Fig-
ure 7B). There was also a significant difference between 5x-emc
cells and 5x-emc mmm1-1 cells, suggesting that both EMC and
ERMES tether independently of one another. Notably, this is the
first demonstration of a reduction in ER–mitochondrial tethering
in cells missing the ERMES complex.
The defect in ER–mitochondria tethering we found in 5x-emc
cells was not because ERMES complex formation was compro-
mised in these cells. In wild-type cells, the ERMES complex forms
about 1–10 puncta per cell [14]. These structures are thought to
form at sites of ER–mitochondria tethering. In cells missing any
one of the four ERMES proteins, the remaining proteins do not
form puncta [14]. Therefore, if ERMES puncta are visible in 5x-
emc cells, the EMC is not necessary for ERMES assembly. Indeed,
we found that the ERMES protein Mmm1-GFP forms puncta in
5x-emc cells (Figure 8A). In contrast, Mmm1-GFP was seen all
over the ER in cells missing the ERMES protein Mdm10
(Figure 8A, right panel). We also compared the number and
intensity of Mmm1-GFP puncta between wild-type and 5x-emc
cells. The ERMES puncta in the mutant were more numerous but
slightly less intense than those in the wild-type cells, indicating that
ERMES complex formation is not dramatically affected in the
mutant. Thus, the ERMES complex can still assemble in 5x-emc
cells, indicating that the ER–mitochondria tethering defect in 5x-
emc cells is likely independent of ERMES-mediated tethering.
This finding suggests that there must be ER–mitochondrial
tethering proteins in addition to the ERMES complex.
Even though the EMC is not required for ERMES assembly, it
might play a role in the assembly of other tethering complexes, as
it has been implicated in protein folding or quality control in the
Figure 5. Mitochondria from cells missing Emc proteins have reduced levels of PS and PE and are not functional. (A) Wild-type and 5x-emc cells were grown for at least three generations in medium containing [3H]acetate, and the amount of the six major phospholipids in purifiedmitochondria was determined (mean 6s.d., n = 3 independent experiments). * p,0.05, independent two-tailed t test. The data used to generate thisgraph are in Table S5. (B) The 10-fold serial dilutions of the indicated strains on YPD and YPGly plates. The plates were incubated at 30uC for 3 d.doi:10.1371/journal.pbio.1001969.g005
The EMC Facilitates ER to Mitochondria PS Transfer
PLOS Biology | www.plosbiology.org 9 October 2014 | Volume 12 | Issue 10 | e1001969

ER [29–33]. If there was a general defect in protein folding in
mutants missing the EMC, the UPR might be induced in these
cells. However, we found that the UPR was not induced in 5x-emc
cells and that a UPR-responsive promoter is activated by ER stress
in these cells (Figure S4).
The EMC Interacts with Tom5 at ER–MitochondriaContact Sites
Because the EMC might directly participate in ER–mitochon-
dria tethering, we sought to identify proteins in the outer
mitochondrial membrane with which it could partner. We
searched for genes identified in the CHO2 SGA screen that
encoded mitochondrial outer membrane proteins. One gene,
TOM5, showed a strong genetic interaction with CHO2 that was
rescued by choline (Table S1). TOM5 encodes one of three small
integral membrane proteins in the outer membrane of mito-
chondria, which are nonessential subunits of the translocase of
the outer membrane (TOM) complex that imports proteins into
mitochondria [38]. Thus, Tom5 was a good candidate for
interacting with the EMC, and we used PCA to determine if it
interacts with EMC proteins. We found that all the Emc proteins
interacted with Tom5 in puncta (Figures 9A,B and S5A) that
were suggestive of the localization of the ERMES complex [14].
Interestingly, when we deleted the transmembrane domain of
Tom5, Tom5DTM now interacted with Emc2 on the ER
(Figure 9C), indicating that insertion of Tom5 in the outer
mitochondrial membrane was not required for its interaction with
the EMC.
Figure 6. 5x-emc mmm1-1 cells are not viable and have a dramatic reduction in ER to mitochondria PS transfer at nonpermissivetemperature. (A) Crude mitochondria were incubated with [3H]serine and Mn2+. After 20 min at 30uC, EDTA and an excess of unlabeled serine wereadded; chelation of Mn2+ by EDTA inhibits PS synthase and allows Psd1 to function. The samples were collected over 15 min, and the rate of [3H]PS to[3H]PE conversion per minute was calculated (mean 6s.d., n = 3–5 independent experiments). * p,0.05 compared to wild-type, two-tailed t test. (B)The rate of PS to PE conversion of strains expressing ChiMERA was determined as in (A) (mean 6s.d., n = 3 independent experiments). The data usedto generate panels A and B are in Table S6. (C) Cultures of strains with the indicated genotypes were grown at 23uC and 10-fold serial dilutions werespotted on to YPD plates and incubated at 23uC or 37uC for 4 d.doi:10.1371/journal.pbio.1001969.g006
The EMC Facilitates ER to Mitochondria PS Transfer
PLOS Biology | www.plosbiology.org 10 October 2014 | Volume 12 | Issue 10 | e1001969

We next determined if the Emc–Tom5 PCA occurs at the same
ER–mitochondria junctions where ERMES is localized. Remark-
ably, we found that in 100% of the cells we examined, the Emc1–
Tom5 PCA puncta colocalized with ERMES foci (Figure 9D).
This indicated that the EMC–Tom5 interaction likely formed a
tether between ER and mitochondria at the same or nearby
contact sites as defined by ERMES. We did not detect an
interaction between Tom5 and another integral ER protein, Ale1,
using PCA, even though Ale1–GFP localized throughout the ER
similar to EMC proteins (Figure S5B). Ale1 has a cytoplasmically
oriented C-terminus, which should be accessible to Tom5 on
mitochondria [39]. These findings support a specific role for the
EMC at contacts between ER and mitochondria.
To obtain more direct evidence for the interaction between the
EMC and Tom5, we used co-immuoprecipitation. Lysates from
cells expressing GFP-tagged Emc1, Emc2, or Emc5 and Tom5
fused to the tandem affinity purification (TAP) tag were
immunoprecipitated with agarose beads conjugated to anti-GFP
antibodies. TAP–Tom5 co-immunoprecipitated with all three of
the Emc proteins we tested (Figure 9E). These results suggest that
Emc proteins bind Tom5 and that the EMC may directly
participate in ER–mitochondria tethering by interacting with the
Tom complex. These data are also consistent with our PCA data
showing that all the Emc proteins interact with Tom5, which may
explain why it was necessary to ablate a number of these proteins
to obtain significant defects in PS transfer from the ER to
mitochondria.
Next we examined the functional relevance of the EMC–Tom5
interaction. To begin, we deleted TOM5 and measured PS
transfer using the in vivo PS transfer assay; we found no PS
transfer defect in cells missing Tom5. However, we noticed that
the PCA interaction on the ER between Emc2 and Tom5DTM
caused cells to grow very poorly (Figure 9F), whereas the PCA
with full-length Tom5 grew similarly to wild-type, suggesting that
the interaction of nonmitochondrial Tom5DTM with the EMC
on the ER interfered with tethering and PS transfer from the ER
to mitochondria. Therefore, we measured PS transfer in vivo in
cells expressing either Emc2–VF2 or Tom5DTM–VF1 or both
(VF1 and VF2 are the two halves of the Venus fluorescent protein
used in the PCA). ER to mitochondria PS transfer was decreased
to ,40% of that of wild-type in cells expressing both Emc2–VF2
and Tom5DTM–VF1, whereas transfer was only modestly
decreased in cells expressing only Tom5DTM–VF1 (Figure 9G).
Therefore, the PCA between Tom5DTM and Emc2 slowed PS
transfer from the ER to mitochondria, suggesting the Emc may
directly tether the ER and mitochondria by interacting with
Tom5 in the outer mitochondrial membrane, and that this
interaction is disrupted by the PCA between Emc2 and
Tom5DTM.
Discussion
Lipid exchange between the ER and mitochondria is critical for
mitochondrial membrane biogenesis and lipid metabolism. We
found that cells missing multiple components of a conserved
protein complex in the ER, called EMC, had dramatic reductions
in the amount of PS transferred from the ER to mitochondria both
in vitro and in intact cells. These cells also had significantly lower
levels of PS and PE in mitochondria. We found that the reduced
ER to mitochondria PS transfer is probably caused by a significant
reduction in the extent of tethering between the ER and
mitochondria. Finally, we also demonstrate a role for the EMC
in phospholipid metabolism and mitochondrial function by our
unbiased global genetic analyses. Taken together, these findings
strongly support that the EMC mediates lipid trafficking between
the ER and mitochondria.
We propose the EMC mediates ER–mitochondrial tethering
independent of the previously identified ERMES complex. A
number of findings support this claim. First, we found a significant
decrease in the amount of ER associated with mitochondria both
by determining the fraction of ER that copurified with mitochon-
dria and by EM. Second, the PS transfer defect in cells missing
multiple EMC proteins was ameliorated by expression of the
artificial ER–mitochondria tether, ChiMERA. Third, we found a
strong aggravating genetic interaction between the 5x-emc mutant
and an ERMES temperature-sensitive allele, mmm1-1, suggesting
that the EMC contributes to an essential overlapping function with
the ERMES. And finally, expression of ChiMERA completely
rescued the synthetic lethality of the 5x-emc mmm1-1 combined
mutant, confirming that this lethality arose as a result of deficient
ER–mitochondrial tethering.
How might the EMC mediate ER–mitochondrial tethering?
Because the EMC has been implicated in protein folding and
quality control in the ER [29–33], the EMC could be necessary for
the folding or processing of proteins directly involved in tethering
(or lipid transfer), rather than participating in tethering directly.
However, we found that ERMES complex assembly was not
compromised in 5x-emc cells, indicating that the tethering defect
we found in this strain was not due to a failure of ERMES proteins
to assemble. We also found that in 5x-emc cells the UPR was not
induced and occurred normally in response to ER stress (Figure
S4). Importantly, we provide evidence by two independent
methods that multiple Emc proteins interact with the mitochon-
drial outer membrane protein Tom5, suggesting that the EMC–
Tom5 interaction is important for tethering ER and mitochondria.
Consistent with this, loss of the mitochondrial anchor for this
tether by deleting the C-terminal transmembrane domain of
Tom5 interfered with PS transfer to mitochondria and disrupted
mitochondrial function. Therefore, we favor a model in which the
EMC directly facilitates ER–mitochondrial tethering.
Our findings indicate that the EMC and ERMES perform
tethering functions independently of one another, as we found a
significant decrease in tethering in mutants missing either
complex. Whether the tethering defects due to loss of either
complex are additive remains unclear. Why there are multiple
tethering complexes is not yet known, but a plausible explanation
is that each tether may facilitate a different type of communication
between the ER and mitochondria. Given that there is a
significant decrease in ER to mitochondria PS transfer in cells
missing EMC, but not in cells lacking ERMES [17,18], it may be
that ERMES facilitates the exchange of other lipids or perhaps is
involved in other forms of signaling/transport between the ER and
mitochondria. Another possibility is that the proteins necessary for
PS transfer associate with the EMC but not ERMES (Figure S6).
Another notable difference between the EMC and ERMES is that
only the EMC is conserved in higher eukaryotes [29,40]. Whether
the mammalian EMC homologue also facilitates ER–mitochon-
dria tethering and PS transfer remains an important question.
Interestingly, our findings also suggest that 5x-emc cells have
lipid metabolism defects in addition to reduced PS transfer
between the ER and mitochondria. We found that 5x-emc psd2Dcells were not viable and did not grow even when supplemented
with ethanolamine. Because psd1D psd2D cells grow when
ethanolamine is present in the medium, 5x-emc psd2D cells must
have greater defects in lipid metabolism in addition to altered PS
transfer to Psd1 in mitochondria. This conclusion is further
supported by the results of our SGA screen with EMC6, which
identifies functional links to global transcriptional control of
The EMC Facilitates ER to Mitochondria PS Transfer
PLOS Biology | www.plosbiology.org 11 October 2014 | Volume 12 | Issue 10 | e1001969
Figure 7. Cells lacking the EMC or the ERMES complex have reduced ER-mitochondria contacts. (A) Mitochondria were purified from theindicated strains and the percent of the ER proteins Dpm1 or Kar2 and the mitochondrial protein Por1 determined (mean 6s.d., n = 3 independentexperiments). (B) Representative EM image shows a portion of a wild-type cell (top left). The same image is shown with reduced contrast (top right) toindicate the length of ER to mitochondria contact, highlighted with red lines. EM images showing portions of mutant cells are shown in the middlepanels. Red arrows indicate a contact between the ER and mitochondria (M), and the blue arrows show a contact between the ER and the plasmamembrane (PM). The bottom panels show the average ER–mitochondria ratio and average length of contacts (mean 6s.d., n = 15 individual cells). TheER–mitochondria ratio was determined by measuring the length of contacts between the ER and mitochondria divided by the length ofmitochondrial perimeter in each image. * p,0.05, ** p,0.005 compared to wild-type, independent two-tailed t test. The data used to generate thegraphs are in Table S7.doi:10.1371/journal.pbio.1001969.g007
The EMC Facilitates ER to Mitochondria PS Transfer
PLOS Biology | www.plosbiology.org 12 October 2014 | Volume 12 | Issue 10 | e1001969

phospholipid metabolism (INO2, INO4) and fatty acid biosynthe-
sis (HTD2, MCT1). It is also likely that the EMC has functions in
addition to its role in ER-mitochondrial membrane tethering, as
indicated by other studies and as is implied by its uniform
localization throughout the ER, which is not restricted to contacts
[29–33].
One of the more perplexing aspects of EMC function is the
apparent redundancy between individual Emc proteins and Tom5
in tethering and PS transfer. That is, why is deletion of individual
Emc proteins or Tom5 not sufficient to reduce PS transfer to
mitochondria? Although there is no shared sequence identity
amongst Emc proteins that would suggest obvious functional
redundancy, our finding that multiple Emc proteins interact with
Tom5 provides a sound alternative explanation for functional
overlap in tethering. However, one would then expect that
deletion of Tom5 would disrupt tethering and PS transfer,
similarly to loss of multiple Emc proteins. That this appears not
to be the case suggests that there is additional redundancy in
tethering on the mitochondrial membrane, perhaps involving
other TOM complex proteins. Although there is no sequence
identity between Tom5 and the two other small TOM subunits,
Tom6 and Tom7, all these proteins are similar in size and
topology and appear to be functionally redundant within the
TOM complex [41,42]. Hence, the EMC may interact with Tom6
and Tom7, and, indeed, preliminary PCA evidence indicates that
Tom6 and Tom7 interact with certain Emc proteins (unpublished
data). A role for the TOM complex in tethering between the
mitochondrial outer and inner membranes through interaction
with the translocase of the inner membrane (TIM) complex is well
established [43]. Thus, our work further implies that tethering
between TOM and the EMC, and TOM and TIM may facilitate
efficient PS transfer from the ER to the inner mitochondrial
membrane, the location of PS decarboxylation by Psd1 [16].
Materials and Methods
Strains, Plasmids, and Growth MediaStrains and plasmids used in this study are listed in Table S13.
Media used were YPD (1% yeast extract, 2% peptone, 2%
glucose), YPGly (1% yeast extract, 2% peptone, 3% glycerol), and
synthetic complete (SC) media (2% glucose, 0.67% yeast nitrogen
base without amino acids, and amino acid dropout mix from
BIO101). Where indicated, ethanolamine or choline was added to
a concentration of 5 mM. 5-FOA was added at a concentration of
1 mg/ml.
Single deletion strains were obtained from freezer stocks of the
haploid yeast deletion collection (BY4741, Mat a, KanMX, a gift
from C. Boone) unless otherwise stated. Other gene deletions were
constructed using the PCR method with the heterologous markers
S. pombe HIS5 (pKT128), K. lactis URA3 (pKT209), or NatR(p4339). Double deletion strains were derived from the meiotic
products of heterozygous diploids with at least three spores of each
genotype being compared. All yeast cells expressing GFP fusion
proteins were tagged endogenously in haploids unless otherwise
indicated. C-terminally tagged GFP strains were constructed by
standard methods involving single-step gene replacement using the
pKT128 (SpHIS5) plasmid [44] in the wild-type Y7043 back-
ground and crossed to the indicated single deletion mutants
Figure 8. Formation of ERMES complex is not altered in 5x-emc cells. (A) Images of wild-type, 5x-emc, or mdm10D cells expressing Mmm1–GFP on the chromosome. Scale bar, 1 mm. (B) Number of puncta per cell in the indicated strains (mean 6s.d., n = 80 cells). (C) Average intensity ofpuncta in the indicated strains (mean 6s.d., n = 80 cells). * p,0.05 compared to wild-type, independent two-tailed t test. The data used to generatepanels B and C are in Table S8.doi:10.1371/journal.pbio.1001969.g008
The EMC Facilitates ER to Mitochondria PS Transfer
PLOS Biology | www.plosbiology.org 13 October 2014 | Volume 12 | Issue 10 | e1001969

(BY4741; kanMX). Mdm12–RFP was created similarly to C-
terminal GFP fusions except using pMRFP–NAT in BY4741. For
PCA, the plasmids used for C-terminal genomic tagging were
created as follows: Venus–YFP fragments F1 and F2 were
amplified by PCR from p413–TEF–Zip linker–Venus YFP-F1
and p415–TEF–Zip linker–Venus YFP-F2 (gift of S. Michnick
[45]), and cloned into plasmids pKT128 and pKT209 [44],
respectively, replacing yEGFP and including a myc tag (MEQK-
LISEEDL) in the linker region to give pHVF1CT (pFA6a–myc–
VF1–HIS5) and pUVF2CT (pFA6a–myc–VF2–URA3). For N-
Figure 9. The EMC interacts with Tom5 at ER-mitochondria contacts. (A and B) Interactions between Tom5 and Emc1 (A) and Emc2 (B)proteins imaged by Venus PCA. (C) Interaction between Tom5DTM and Emc2 by PCA. (D) Colocalization of the Tom5–Emc interaction and Mdm12–RFP of the ERMES complex. (E) Coimmunoprecipitation of TAP–Tom5 and Emc1p, Emc2p, or Emc5p fused to GFP. Expression of TAP–Tom5 wasinduced in medium containing galactose (Gal) and repressed in medium with glucose (Dex). (F) Yeast growth assays for the indicated strains onmedia containing glucose (YPD) or glycerol (YPGly). Tom5 6 Emc2 and Tom5DTM 6 Emc2 indicate haploid strains used for PCA containing Tom5tagged with VF1 and Emc2 tagged with VF2. (G) Cells with the indicated genotypes were labeled with [3H]serine as in Figure 4A. The ratio of [3H]PSconverted to [3H]PE was determined and expressed as a percent of wild-type cells (mean 6s.d., n = 3 independent experiments). * p,0.05 comparedto wild-type, independent two-tailed t test. All scale bars, 2 mm. The data used to generate this graph are in Table S9.doi:10.1371/journal.pbio.1001969.g009
The EMC Facilitates ER to Mitochondria PS Transfer
PLOS Biology | www.plosbiology.org 14 October 2014 | Volume 12 | Issue 10 | e1001969

terminal integrations, plasmid pHVF1NT (HIS5–PHO5–VF1)
was created by replacing eGFP in plasmid pTLHPG (HIS5–
PHO5–GFP; gift of T. Levine) with the Venus F1 PCR fragment.
To create the Tom5DTM–VF1 strain, the C-terminal 21 amino
acids of endogenous TOM5 were replaced in frame by VF1.
SGA Analysis for CHO2 and EMC6SGA analysis was performed according to established protocols
[46] essentially as previously described [47] using a Singer RoToR
Colony Arraying robot (Singer Instruments). Dcho2::URA3 and
Demc6::URA3 query strains were constructed using standard
techniques in strain background Y7092 and crossed to the yeast
haploid deletion mutant array (DMA) using a Singer RoToR
HDA robot. Following diploid selection, spots were replicated
three times and sporulated for 5 d. Haploids were germinated on
SD-media lacking histidine, arginine, and lysine supplemented
with thialysine and canavanine (both at 100 mg/ml). Control sets
of single deletion strains were generated by plating on media
containing 5-FOA to counterselect for the Dcho2::URA3 or
Demc6::URA3 alleles and G418 sulfate (200 mg/ml) to select for
the DMA strain, whereas double mutants were selected for by
plating on media lacking uracil and containing G418 sulfate. A
further round of selection was performed on the same media. For
the CHO2 SGA screen in the presence of choline, all plates
additionally contained 1 mM choline. Arrays were imaged using a
flatbed scanner. Balony software (http://code.google.com/p/
balony/) was used to measure spot sizes, determine cutoff values
for genetic interactions, and define strains that showed statistically
significant changes in growth rate [48]. Cutoff values for genetic
interactions were defined for each screen by determining three
standard deviations from the mean of the ratios of the double
mutant to single mutant growth rates. Double mutant strains that
met the cutoff and showed significant changes in growth relative to
the corresponding single mutant control (one-tailed student’s t test;
p,0.05; n = 3) were considered as genetic interactions. For the
CHO2 SGA screen, aggravating genetic interactions identified in
the screen done in the absence of choline were considered rescued
if they were no longer identified as genetic interactions according
to the above criteria in the screen done in the presence of choline.
Gene ontology analysis was performed using Funspec (http://
funspec.med.utoronto.ca) and Cytoscape (http://www.cytoscape.
org) [49,50].
Fluorescence MicroscopyLog phase live yeast cells were imaged using a Zeiss LSM-5
Pascal confocal microscope and Zeiss Pascal software. Unless
otherwise stated, all proteins were tagged at the C-terminus of the
endogenous protein. Optical slices were taken through the center
of each cell, and images being directly compared were captured
with identical microscope settings on the same day.
For the studies with cells expressing Mmm1–GFP, cells were
imaged live at room temperature by using an Olympus BX61
microscope, a UPlanApo6100/1.35 lens, a QImaging Retiga EX
camera, and IVision software (version v 4.0.5).
PCAThe Venus–YFP variant of PCA was used to examine protein–
protein interactions in live yeast. Unless otherwise stated,
endogenous proteins were tagged in haploid yeast by the PCR
method with either VF1 or VF2 in the BY4741 and Y7043 strains,
respectively. Correct integration and expression was confirmed by
colony PCR and Western blot analysis with anti-myc antibodies
(Sigma) for each fusion protein. The VF1 and VF2 strains to be
assayed were then crossed, and haploid meiotic progenies with
both alleles were recovered by random spore analysis or tetrad
dissection. Finally, the PCA was visualized in log phase yeast by
confocal microscopy.
In Vivo Labeling with [3H]serineCells were labeled with L-[3-3H]serine (American Radiolabeled
Chemicals) as described [35] with the following modifications.
About 2 OD600 units of cells from a saturated culture were added
to 25 ml of SC medium and incubated at 30uC. When the cultures
reached an OD600 of about 0.3, 10 mg/ml myriocin (SigmaAl-
drich, stock = 500 mg/ml in methanol) was added to the medium,
the cells were grown for 30 min, and 10 mg/ml cerulenin
(SigmaAldrich, stock = 5 mg/ml in dimethyl sulfoxide) was added
to the medium. About 5 min later, 50 mCi of [3H]serine was
added to the medium, and the cells were grown for an additional
30 min. The culture was then added to an equal volume of ice-
cold water, and it was washed once with ice-cold water. Cells were
lysed in a Mini-BeadBeater-8 (BioSpec). Lipids were extracted as
described [51], separated by HPLC [52], and the fractions
containing PS, PE, and PC were collected and analyzed by liquid
scintillation counting.
Mitochondrial Extracts and in Vitro [3H]serine LabelingCrude mitochondria were prepared as described [18]. Briefly
cells were grown in YPD medium to an OD600 of ,0.3, washed
once with water, and incubated in 1 ml 0.1 M Tris-SO4 (pH 9.4)
containing 10 mM DTT for 10 min at 30uC. They were washed
once with spheroplast buffer (1.2 M sorbitol, 20 mM Tris pH 7.4)
and resuspended in 1.5 ml of the same buffer containing 1 mg/ml
zymolyase 20T (Seikagaku Biobusiness, Japan). After incubation
for 60 min at 30uC, cells were pelleted (5 min, 5006g) and washed
twice with spheroplast buffer. Cells were resuspended in ice-cold
lysis buffer (0.6 M mannitol, 2.0 mM Tris pH 7.4, 1 mM EDTA,
1 mM PMSF and protease inhibitors, [Roche]) and lysed with a
dounce using a B-pestle. The extract was centrifuged twice for
5 min at 3,0006g to remove unlysed cells and debris. The
supernatant was centrifuged at 9,6006g for 10 min and the pellet
containing crude mitochondria was resuspended in lysis buffer
using a dounce (B-pestle).
The method of labeling crude mitochondria with [3H]serine was
adapted from [37]. We heated 1–2 mg of crude mitochondria in
1 ml of lysis buffer to 30uC, and 0.6 ma MnCl2 and 10 mCi of L-
[3-3H]serine (American Radiolabeled Chemicals) were added. After
20 min, 0.5 mM serine and 5 mM EDTA were added. Samples of
200 ml were taken after 0, 5, 10, and 15 min and added to 6 ml of
chloroform:methanol (1:2). Lipids were extracted, separated by
HPLC, and extracted as described in the previous section.
Metabolic Labeling with [3H]ethanolamineForty OD600 of yeast cells were grown to mid-log phase in SC
media and collected by centrifugation. After washing once in 0.67%
w/v Yeast Nitrogen Base, cells were resuspended in 12 ml of 0.67%
yeast nitrogen base containing 2% dextrose and 12 mCi [3H]eth-
anolamine (Perkin-Elmer). After labeling for 30 min at 37uC, the
suspension was diluted to a final volume of 120 ml in synthetic
defined media. The culture was placed in a shaking incubator at
30uC and 20 ml aliquots taken every 30 min. Lipids were extracted
and separated by HPLC as described in the previous section.
Mitochondrial Purification and Determination ofMitochondrial Lipid Content
About 2 OD600 units of cells from a saturated culture were
washed with water, resuspended in 50 ml of fresh SC medium
The EMC Facilitates ER to Mitochondria PS Transfer
PLOS Biology | www.plosbiology.org 15 October 2014 | Volume 12 | Issue 10 | e1001969

containing 200 mCi of [3H]acetate (American Radiolabeled
Chemicals), and grown at 30uC for at least 3–4 generations.
Crude mitochondria were purified as described in the previous
section and further purified by equilibrium centrifugation using
density gradients made from OptiPrep (Axis-Shield, Oslo, Nor-
way) as described [53]. Lipids were extracted and separated by
one-dimensional TLC as described by [54]. TLC plates were
scanned on a RITA Star Thin Layer Analyzer (Raytest).
Quantification of ER Co-Purified Along with PureMitochondria
Mitochondria were purified as described in the previous section.
Portions of the cell lysates and purified mitochondria were
immunoblotted using antibodies against the ER-membrane
proteins Dpm1 (Invitrogen) or Kar2 (gift from R. Schekman)
and the mitochondrial membrane protein Por1 (Invitrogen). The
immunoblots were quantitated using the Odyssey infrared imaging
system (LI-COR Biosciences), and the percentage of each marker
in the purified mitochondria was determined.
Psd AssayPsd assays were performed as described [35] except that the
concentration of the substrate, 1-oleoyl-2-[12-[(7-nitro-2-1,
3-benzoxadiazol-4-yl)amino]dodecanoyl]-sn-glycero-3-phosphoserine
(Avanti Polar Lipids), was 500 mM.
Co-Immunoprecipitation of Emc Proteins and Tom5Yeast cultures were grown in YP+2% galactose or YP+2%
dextrose to express or suppress TAP–Tom5, respectively. Log
phase cultures (30 OD600 units) were collected by centrifugation
and resuspended in 400 ml of lysis buffer (250 mM NaCl, 50 mM
Tris-HCl pH 7.4, 50 mM NaF, 5 mM EDTA, 1 mM DTT,
1 mM AEBSF, and 0.1% NP-40). Cells were disrupted with glass
beads for 5 min at 4uC. The resulting lysate was centrifuged at
16,1006g for 5 min, and a sample of the supernatant was
collected. The supernatant was then incubated under rotation with
20 ml of prewashed GFP–Trap_A bead slurry (Chromotek) for 1 h
at 4uC. The supernatant was removed and the beads were washed
with lysis buffer (361 ml, then 36500 ml with 5-min incubations).
Beads were resuspended in 100 ml of sample buffer (50 mM Tris-
HCl pH 6.8, 10% glycerol, 2% SDS, 4% 2-mercaptoethanol, and
0.02% bromophenol blue) and eluted by heating at 65uC for
20 min. The eluted protein was subjected to SDS-PAGE (10%
polyacrylamide) and immunoblotted with anti-TAP (1:5,000
dilution, Pierce, CAB1001) or anti-GFP (1:5,000 dilution, Roche,
11814460001) antibodies. Goat anti-rabbit IgG-HRP (1:5,000
dilution, Bio-Rad, 172-1019) and goat anti-mouse IgG-HRP
(1:5,000 dilution, Bio-Rad, 172-1011) were used as secondary
antibodies. Blots were imaged with either Supersignal West Pico or
Femto ECL substrate (Thermo Scientific).
EMCells were grown to mid-logarithmic growth phase, and 10
OD600 units of cells were fixed in 1 ml of fixative media (1%
glutaraldehyde, 0.2% paraformaldehyde, and 40 mM potassium
phosphate, pH 7.0) for 10 min at room temperature. The cells
were pelleted and resuspended in 1 ml of fresh fixative media and
incubated on ice for 50 min, washed twice with 0.9% NaCl and
once with water. They were then incubated with 2% solution of
KMnO4 for 5 min at room temperature, centrifuged, and
resuspended with a freshly prepared solution of 2% KMmO4 for
45 min at room temperature for en-bloc staining. The cells were
then dehydrated using a graded series of ethanol solutions (50%,
70%, 80%, 90%, 95%, and 100%) for 10 min each, with two
more incubations in 100% ethanol from a freshly opened bottle.
The samples were subsequently embedded stepwise using Spurr’s
low viscosity resin (EMS, Hatfield, PA). Samples were infiltrated
for 2 h each with a 3:1, 1:1, and 1:3 dehydrating agent–
embedding media mixture. Cells were incubated overnight with
100% fresh resin. The next day, the cells were resuspended in
fresh 100% resin for 2–3 h, transferred into BEEM embedding
capsules, and polymerized at 70uC for 72 h. Semi- and ultrathin
sections were produced with a diamond knife (Diatome, Biel,
Switzerland) on an ultra-microtome (Ultracut UCT, Leica-
Microsystems), collected on 200 mesh copper grids (EMS,
Hatfield, PA), poststained with uranyl acetate and lead citrate,
and visualized with a FEI Tecnai T12 TEM, operating at 120 kV.
Pictures were recorded on a below mounted Gatan 2k62k CCD
camera.
Contact sites between the ER and mitochondria were defined as
regions where these organelles come within 30 nm of one another.
The ER–mitochondria ratio was determined by measuring the
length of contacts between the ER and mitochondria divided by
the length of mitochondrial perimeter in each image.
b-Galactosidase AssayCells were transformed with pMCZ-Y, a plasmid encoding the
lacZ gene under the KAR2 promoter. Where indicated, 1 mM
DTT was added to growing cells 1 h before the assay. b-
Galactosidase assay was performed as described [55].
Supporting Information
Figure S1 Yeast growth assays of mutants identified inthe CHO2 SGA screen, related to Figure 1. Serial dilutions
of the indicated strains were spotted onto agar plates containing
SC medium with or without ethanolamine or choline.
(TIF)
Figure S2 PS synthesis and conversion to PE is linear in5x-emc cells, related to Figure 4A. (A) Total amount of
[3H]PS synthesized in the experiments in Figure 4A (total [3H]PS
synthesized = [3H]PS + [3H]PE); mean 6s.d., n = 2–5 indepen-
dent experiments. (B) 5x-emc cells were labeled as in Figure 4A,
and the amount of radiolabeled PS and PE per OD600 was
determined (mean 6s.d., n = 3 independent experiments). The
data used to generate these graphs are in Table S10.
(TIF)
Figure S3 PE synthesis by the Kennedy pathway and PEmethylation are not reduced in 5x-emc cells, related toFigure 4B. Wild-type and 5x-emc cells were labeled with
[3H]ethanolamine for the indicated times, and lipids were
extracted, separated, and quantified by HPLC and scintillation
counting (mean 6s.d., n = 3). Total counts in PE and PC were not
significantly different between wild-type and 5x-emc at each time
point. The ,1.7-fold increase in PC synthesized in the 5x-emc
mutant at 90 min was significant (p,0.005). The data used to
generate these graphs are in Table S11.
(TIFF)
Figure S4 The UPR is not induced in 5x-emc cells,related to Figure 8. Wild-type and 5x-emc cells were
transformed with pMCZ-Y, a high copy plasmid carrying the
lacZ gene under the KAR2 promoter. Cells were grown to mid-
logarithmic growth phase in the presence or absence of 1 mM
DTT for 1 h, and b-Galactosidase activity was determined (mean
6s.d., n = 3). (A) Mean b-Galactosidase activity. (B) Ratio (fold
increase) of b-Galactosidase activity between cells with and
The EMC Facilitates ER to Mitochondria PS Transfer
PLOS Biology | www.plosbiology.org 16 October 2014 | Volume 12 | Issue 10 | e1001969

without DTT. The data used to generate these graphs are in Table
S12.
(TIF)
Figure S5 Interaction of other Emc proteins and Tom,related to Figure 9A. (A) PCA interaction of Tom5 and the
indicated Emc proteins were visualized as in Figure 9A. (B) Ale1
control for PCA between the EMC and Tom5, related to Figure 7.
Emc1 6Tom5 PCA (left panels) and Ale1 6Tom5 PCA (center
panels) in diploids captured with identical microscope settings.
Ale1 tagged at the endogenous gene locus with GFP (right panels).
All scale bars, 2 mm.
(TIF)
Figure S6 Model of the role of tethering in PS transferfrom ER to mitochondria. In wild-type cells (top left), tethers
are formed by both ERMES (red) and the interaction of the EMC
(blue) with the TOM complex (brown). A putative transport
complex (purple) associates with the EMC and facilitates PS
transfer from the ER to mitochondria. In cells missing ERMES
(top right), tethering is reduced but the transporter can still
function at contacts mediated by the EMC. In cells missing the
EMC (bottom right), the transporter is not enriched at contact sites
and PS transport is reduced. When ChiMERA (green) is expressed
in cells missing the EMC (bottom right), the increased tethering of
the ER and mitochondria allows the PS transporter to function.
(TIF)
Table S1 CHO2 aggravating genetic interactions res-cued by choline, related to Figure 1. Aggravating genetic
interactions with CHO2 and rescue by 1 mM choline determined
using Balony software are listed. Genetic interaction strength is
plotted as the ratio (Ratio) of the growth of the double mutant with
Dcho2 (Exp) versus the Dcho2 single mutant (Ctrl) and as the
difference (Diff) in growth by subtracting the growth of the single
mutant (Ctrl) from the double mutant (Exp). The p values were
calculated using a one-tailed Student’s t test by comparing growth
of the single versus double mutants (n = 3).
(XLS)
Table S2 Functional group enrichment for genes iden-tified in the CHO2 SGA screen, related to Figure 1. Only
genes whose interactions were rescued by choline (Table S1) were
used in the analysis.
(XLS)
Table S3 Genetic interactions with EMC6, related toFigure 2. Aggravating and alleviating genetic interactions
identified by SGA analysis are listed along with the strength of
the interactions, plotted as in Table S1.
(XLSX)
Table S4 Data for graphs in Figure 4A and 4C.
(XLS)
Table S5 Data for graph in Figure 5A.
(XLS)
Table S6 Data for graphs in Figure 6A and 6B.
(XLS)
Table S7 Data for graphs in Figure 7A and 7B.
(XLS)
Table S8 Data for graphs in Figure 8B and 8C.
(XLSX)
Table S9 Data for graphs in Figure 9G.
(XLS)
Table S10 Data for graphs in Figure S2A and S2B.
(XLS)
Table S11 Data for graphs in Figure S3.
(XLS)
Table S12 Data for graphs in Figure S4A and S4B.
(XLS)
Table S13 Strains and plasmids used in this study.
(XLS)
Acknowledgments
We thank B. Kornmann for providing the ChiMERA plasmid and R.
Schekman for anti-Kar2 antibody.
Author Contributions
The author(s) have made the following declarations about their
contributions: Conceived and designed the experiments: SL JTC ST
AKOW VC BPY CJRL WAP. Performed the experiments: SL JTC ST
AKOW VC BPY. Analyzed the data: SL JTC ST AKOW VC BPY CJRL
WAP. Wrote the paper: SL JTC CJRL WAP.
References
1. Prinz WA (2010) Lipid trafficking sans vesicles: where, why, how? Cell 143: 870–
874.
2. Osman C, Voelker DR, Langer T (2011) Making heads or tails of phospholipids
in mitochondria. J Cell Biol 192: 7–16.
3. Flis VV, Daum G (2013) Lipid transport between the endoplasmic reticulum and
mitochondria. Cold Spring Harb Perspect Biol 5.
4. Toulmay A, Prinz WA (2011) Lipid transfer and signaling at organelle contact
sites: the tip of the iceberg. Curr Opin Cell Biol 23: 458–463.
5. Elbaz Y, Schuldiner M (2011) Staying in touch: the molecular era of organelle
contact sites. Trends Biochem Sci 36: 616–623.
6. Helle SC, Kanfer G, Kolar K, Lang A, Michel AH, et al. (2013) Organization and
function of membrane contact sites. Biochim Biophys Acta 1833: 2526–2541.
7. Raturi A, Simmen T (2012) Where the endoplasmic reticulum and the
mitochondrion tie the knot: the mitochondria-associated membrane (MAM).
Biochim Biophys Acta 1833(1): 213–224.
8. Area-Gomez E, Del Carmen Lara Castillo M, Tambini MD, Guardia-Laguarta
C, de Groof AJ, et al. (2012) Upregulated function of mitochondria-associated
ER membranes in Alzheimer disease. EMBO J 31(21): 4106–4123.
9. Williamson CD, DeBiasi RL, Colberg-Poley AM (2012) Viral product trafficking
to mitochondria, mechanisms and roles in pathogenesis. Infect Disord Drug
Targets 12: 18–37.
10. Kornmann B (2013) The molecular hug between the ER and the mitochondria.
Curr Opin Cell Biol 25: 443–448.
11. Szabadkai G, Bianchi K, Varnai P, De Stefani D, Wieckowski MR, et al. (2006)
Chaperone-mediated coupling of endoplasmic reticulum and mitochondrial
Ca2+ channels. J Cell Biol 175: 901–911.
12. de Brito OM, Scorrano L (2008) Mitofusin 2 tethers endoplasmic reticulum to
mitochondria. Nature 456: 605–610.
13. Giorgi C, De Stefani D, Bononi A, Rizzuto R, Pinton P (2009) Structural and
functional link between the mitochondrial network and the endoplasmic
reticulum. Int J Biochem Cell Biol 41: 1817–1827.
14. Kornmann B, Currie E, Collins SR, Schuldiner M, Nunnari J, et al. (2009) An
ER-mitochondria tethering complex revealed by a synthetic biology screen.
Science 325: 477–481.
15. Schauder CM, Wu X, Saheki Y, Narayanaswamy P, Torta F, et al. (2014)
Structure of a lipid-bound extended synaptotagmin indicates a role in lipid
transfer. Nature 510: 552–555.
16. Zinser E, Sperka-Gottlieb CD, Fasch EV, Kohlwein SD, Paltauf F, et al. (1991)
Phospholipid synthesis and lipid composition of subcellular membranes in the
unicellular eukaryote Saccharomyces cerevisiae. J Bacteriol 173: 2026–2034.
17. Nguyen TT, Lewandowska A, Choi JY, Markgraf DF, Junker M, et al. (2012)
Gem1 and ERMES do not directly affect phosphatidylserine transport from ER
to mitochondria or mitochondrial inheritance. Traffic 13(6): 880–890.
18. Voss C, Lahiri S, Young BP, Loewen CJ, Prinz WA (2012) ER-shaping proteins
facilitate lipid exchange between the ER and mitochondria in S. cerevisiae.
J Cell Sci 125(Pt 20): 4791–4799.
The EMC Facilitates ER to Mitochondria PS Transfer
PLOS Biology | www.plosbiology.org 17 October 2014 | Volume 12 | Issue 10 | e1001969

19. Kornmann B, Walter P (2010) ERMES-mediated ER-mitochondria contacts:
molecular hubs for the regulation of mitochondrial biology. J Cell Sci 123:1389–1393.
20. Schumacher MM, Choi JY, Voelker DR (2002) Phosphatidylserine transport to
the mitochondria is regulated by ubiquitination. J Biol Chem 277: 51033–51042.
21. Voelker DR (2009) Genetic and biochemical analysis of non-vesicular lipidtraffic. Annu Rev Biochem 78: 827–856.
22. Gohil VM, Greenberg ML (2009) Mitochondrial membrane biogenesis:
phospholipids and proteins go hand in hand. J Cell Biol 184: 469–472.23. Chan EY, McQuibban GA (2012) Phosphatidylserine decarboxylase 1 (Psd1)
promotes mitochondrial fusion by regulating the biophysical properties of themitochondrial membrane and alternative topogenesis of mitochondrial genome
maintenance protein 1 (Mgm1). J Biol Chem 287: 40131–40139.24. Burgermeister M, Birner-Grunberger R, Nebauer R, Daum G (2004)
Contribution of different pathways to the supply of phosphatidylethanolamine
and phosphatidylcholine to mitochondrial membranes of the yeast Saccharo-myces cerevisiae. Biochim Biophys Acta 1686: 161–168.
25. Trotter PJ, Pedretti J, Voelker DR (1993) Phosphatidylserine decarboxylase fromSaccharomyces cerevisiae. Isolation of mutants, cloning of the gene, and creation
of a null allele. J Biol Chem 268: 21416–21424.
26. Clancey CJ, Chang SC, Dowhan W (1993) Cloning of a gene (PSD1) encodingphosphatidylserine decarboxylase from Saccharomyces cerevisiae by comple-
mentation of an Escherichia coli mutant. J Biol Chem 268: 24580–24590.27. Trotter PJ, Pedretti J, Yates R, Voelker DR (1995) Phosphatidylserine
decarboxylase 2 of Saccharomyces cerevisiae. Cloning and mapping of thegene, heterologous expression, and creation of the null allele. J Biol Chem 270:
6071–6080.
28. Henry SA, Kohlwein SD, Carman GM (2012) Metabolism and regulation ofglycerolipids in the yeast Saccharomyces cerevisiae. Genetics 190: 317–349.
29. Jonikas MC, Collins SR, Denic V, Oh E, Quan EM, et al. (2009)Comprehensive characterization of genes required for protein folding in the
endoplasmic reticulum. Science 323: 1693–1697.
30. Bircham PW, Maass DR, Roberts CA, Kiew PY, Low YS, et al. (2011) Secretorypathway genes assessed by high-throughput microscopy and synthetic genetic
array analysis. Mol Biosyst 7: 2589–2598.31. Christianson JC, Olzmann JA, Shaler TA, Sowa ME, Bennett EJ, et al. (2012)
Defining human ERAD networks through an integrative mapping strategy. NatCell Biol 14: 93–105.
32. Louie RJ, Guo J, Rodgers JW, White R, Shah NA, et al. (2012) A yeast
phenomic model for the gene interaction network modulating CFTR-DeltaF508protein biogenesis. Genome Med 4: 103.
33. Richard M, Boulin T, Robert VJ, Richmond JE, Bessereau JL (2013)Biosynthesis of ionotropic acetylcholine receptors requires the evolutionarily
conserved ER membrane complex. Proc Natl Acad Sci U S A 110: E1055–
E1063.34. Costanzo M, Baryshnikova A, Bellay J, Kim Y, Spear ED, et al. (2010) The
genetic landscape of a cell. Science 327: 425–431.35. Raychaudhuri S, Prinz WA (2008) Nonvesicular phospholipid transfer between
peroxisomes and the endoplasmic reticulum. Proc Natl Acad Sci U S A 105:15785–15790.
36. Dimmer KS, Fritz S, Fuchs F, Messerschmitt M, Weinbach N, et al. (2002)
Genetic basis of mitochondrial function and morphology in Saccharomycescerevisiae. Mol Biol Cell 13: 847–853.
37. Achleitner G, Gaigg B, Krasser A, Kainersdorfer E, Kohlwein SD, et al. (1999)Association between the endoplasmic reticulum and mitochondria of yeast
facilitates interorganelle transport of phospholipids through membrane contact.
Eur J Biochem 264: 545–553.
38. Dudek J, Rehling P, van der Laan M (2012) Mitochondrial protein import:
common principles and physiological networks. Biochim Biophys Acta 1833(2):
274–285.
39. Pagac M, de la Mora HV, Duperrex C, Roubaty C, Vionnet C, et al. (2011)
Topology of 1-acyl-sn-glycerol-3-phosphate acyltransferases SLC1 and ALE1
and related membrane-bound O-acyltransferases (MBOATs) of Saccharomyces
cerevisiae. J Biol Chem 286: 36438–36447.
40. Wideman JG, Gawryluk RM, Gray MW, Dacks JB (2013) The ancient and
widespread nature of the ER-mitochondria encounter structure. Mol Biol Evol
30: 2044–2049.
41. Alconada A, Kubrich M, Moczko M, Honlinger A, Pfanner N (1995) The
mitochondrial receptor complex: the small subunit Mom8b/Isp6 supports
association of receptors with the general insertion pore and transfer of
preproteins. Mol Cell Biol 15: 6196–6205.
42. Honlinger A, Bomer U, Alconada A, Eckerskorn C, Lottspeich F, et al. (1996)
Tom7 modulates the dynamics of the mitochondrial outer membrane translo-
case and plays a pathway-related role in protein import. EMBO J 15: 2125–
2137.
43. Dekker PJ, Martin F, Maarse AC, Bomer U, Muller H, et al. (1997) The Tim
core complex defines the number of mitochondrial translocation contact sites
and can hold arrested preproteins in the absence of matrix Hsp70-Tim44.
EMBO J 16: 5408–5419.
44. Sheff MA, Thorn KS (2004) Optimized cassettes for fluorescent protein tagging
in Saccharomyces cerevisiae. Yeast 21: 661–670.
45. Tarassov K, Messier V, Landry CR, Radinovic S, Serna Molina MM, et al.
(2008) An in vivo map of the yeast protein interactome. Science 320: 1465–1470.
46. Tong AH, Boone C (2006) Synthetic genetic array analysis in Saccharomyces
cerevisiae. Methods Mol Biol 313: 171–192.
47. Young BP, Shin JJ, Orij R, Chao JT, Li SC, et al. (2010) Phosphatidic acid is a
pH biosensor that links membrane biogenesis to metabolism. Science 329: 1085–
1088.
48. Young BP, Loewen CJ (2013) Balony: a software package for analysis of data
generated by synthetic genetic array experiments. BMC Bioinformatics 14: 354.
49. Robinson MD, Grigull J, Mohammad N, Hughes TR (2002) FunSpec: a web-
based cluster interpreter for yeast. BMC Bioinformatics 3: 35.
50. Cline MS, Smoot M, Cerami E, Kuchinsky A, Landys N, et al. (2007)
Integration of biological networks and gene expression data using Cytoscape.
Nat Protoc 2: 2366–2382.
51. Parks LW, Bottema CD, Rodriguez RJ, Lewis TA (1985) Yeast sterols: yeast
mutants as tools for the study of sterol metabolism. Methods Enzymol 111: 333–
346.
52. Wang F, Zhao Y, Wang P (2003) Separation and determination of phospholipids
in biological samples by high-performance liquid chromatography. J Chroma-
togr Sci 41: 142–144.
53. Nunnari J, Wong ED, Meeusen S, Wagner JA (2002) Studying the behavior of
mitochondria. Methods Enzymol 351: 381–393.
54. Vaden DL, Gohil VM, Gu Z, Greenberg ML (2005) Separation of yeast
phospholipids using one-dimensional thin-layer chromatography. Anal Biochem
338: 162–164.
55. Pagani M, Fabbri M, Benedetti C, Fassio A, Pilati S, et al. (2000) Endoplasmic
reticulum oxidoreductin 1-lbeta (ERO1-Lbeta), a human gene induced in the
course of the unfolded protein response. J Biol Chem 275: 23685–23692.
The EMC Facilitates ER to Mitochondria PS Transfer
PLOS Biology | www.plosbiology.org 18 October 2014 | Volume 12 | Issue 10 | e1001969


![Endoplasmic reticulum[1]](https://img.pdfslide.net/doc/110x75/58ed5fc71a28aba1678b4611/endoplasmic-reticulum1.jpg)