Embed Size (px)
Citation preview
1
A critical assessment of two real-time polymerase chain reaction assays targeting the
(SSU) rRNA and gdh genes for the molecular identification of Giardia intestinalis in a
clinical laboratory
Samuel Boadi1, Spencer D. Polley
1, Sally Kilburn
2, Graham A. Mills
3, Peter L. Chiodini
1, 4
1 Department of Clinical Parasitology
Hospital for Tropical Diseases
University College London Hospitals NHS Foundation Trust
Mortimer Market, London WC1E 6JB, UK
2 School of Health Sciences and Social Work
University of Portsmouth
2 King Richard 1 Road
Portsmouth PO1 2FR, UK
3 School of Pharmacy and Biomedical Science
University of Portsmouth
White Swan Road
Portsmouth PO1 2DT, UK
4 London School of Hygiene and Tropical Medicine,
Keppel Street
2
London
WC1E 7HT, UK
Correspondence:
Dr Samuel Boadi, Department of Clinical Parasitology, Hospital for Tropical Diseases,
University College London Hospitals NHS Foundation Trust, Mortimer Market, London
WC1E 6JB, UK.
Email: [email protected]
Tel.: +44 203 447 5414
Fax: +44 207 38 00041
Keywords: Giardia intestinalis, Real-time polymerase chain reaction, Diagnostic accuracy,
Sensitivity, Specificity.
Word count: 2600
3
Abstract:
Introduction Giardiasis is an intestinal diarrhoeal illness caused by the flagellate protozoan
parasite Giardia intestinalis. Molecular techniques for the identification of Giardia
intestinalis have generally been shown to offer a better detection rate of the parasite than the
traditional faecal concentration and microscopy techniques.
Aim The aim of this study was to critically assess the performance of a commercial and a
published real-time PCR assay for their potential use as frontline tests for the diagnosis of
giardiasis.
Methods A composite reference standard of enzyme immunoassay and rapid membrane test
was used in a diagnostic accuracy study to assess the performance of Primerdesign Ltd. and
Verweij et al. (2004) Giardia intestinalis real-time PCR assays comparing them with the
traditional ova, cysts, and parasite microscopy test (OCP-M).
Results The Verweij real-time PCR used primers for the (SSU) rRNA gene and produced a
diagnostic sensitivity of 93.4 % (95 % CI: 88.30 to 98.50 %) and an efficiency of 100 %. The
Primerdesign Ltd. real-time PCR used primers for the glutamate dehydrogenase gene and
produced a diagnostic sensitivity of 61.5 % (95 % CI: 51.50 to 71.50 %) and an efficiency of
203 %. The OCP-M sensitivity was 83.5 % (95 % CI: 75.87 to 91.13 %).
Conclusions The Verweij real-time PCR was robust and the most sensitive assay suited for
use as a first line diagnostic test for giardiasis.
4
1. INTRODUCTION
Giardiasis is an intestinal diarrhoeal illness caused by the flagellate protozoan parasite
Giardia intestinalis (synonymous with Giardia lamblia and Giardia duodenalis).
Traditionally, faecal concentration technique described by Allen and Ridley 1-2
has been used
to diagnose Giardiasis. Faecal concentration and microscopy techniques are cumbersome and
rely heavily on the expertise of the person reading the slides. However, it is considered to be
the gold standard for the diagnosis of giardiasis, even though it has relatively low sensitivity.
Sensitivity has been reported to increase from 73 % to 85 % when multiple samples taken on
different days were examined.3 Molecular-based assays for the detection of Giardia
intestinalis have been shown to be more sensitive than conventional methods. 4-8
However,
their amplification efficiency (E) and correlation coefficient (linearity, R2) have not been
critically assessed for use in routine diagnosis. In this study, the Verweij et al. (2004) real-
time PCR assay which targets the (SSU) rRNA gene,8 and the Primerdesign Ltd. real-time
PCR which targets the glutamate dehydrogenase gene (gdh) of Giardia assemblages A and B
only (the subtypes known to infect humans), were compared with the traditional ova, cysts,
and parasite microscopy (OCP-M) in a diagnostic accuracy study. The performances of the
two PCR assays were also assessed for E and R2.
2. MATERIALS AND METHODS
2.1 Samples
Stool samples (n = 213), from patients with suspected gastrointestinal infection, submitted for
testing were archived from 30th March 2010 to 22nd July 2011 after performing the
traditional faecal concentration technique (Parasep, DiaSys Europe Ltd.) on them. Before
archiving, the faecal concentrates were examined microscopically using the x10 objective,
5
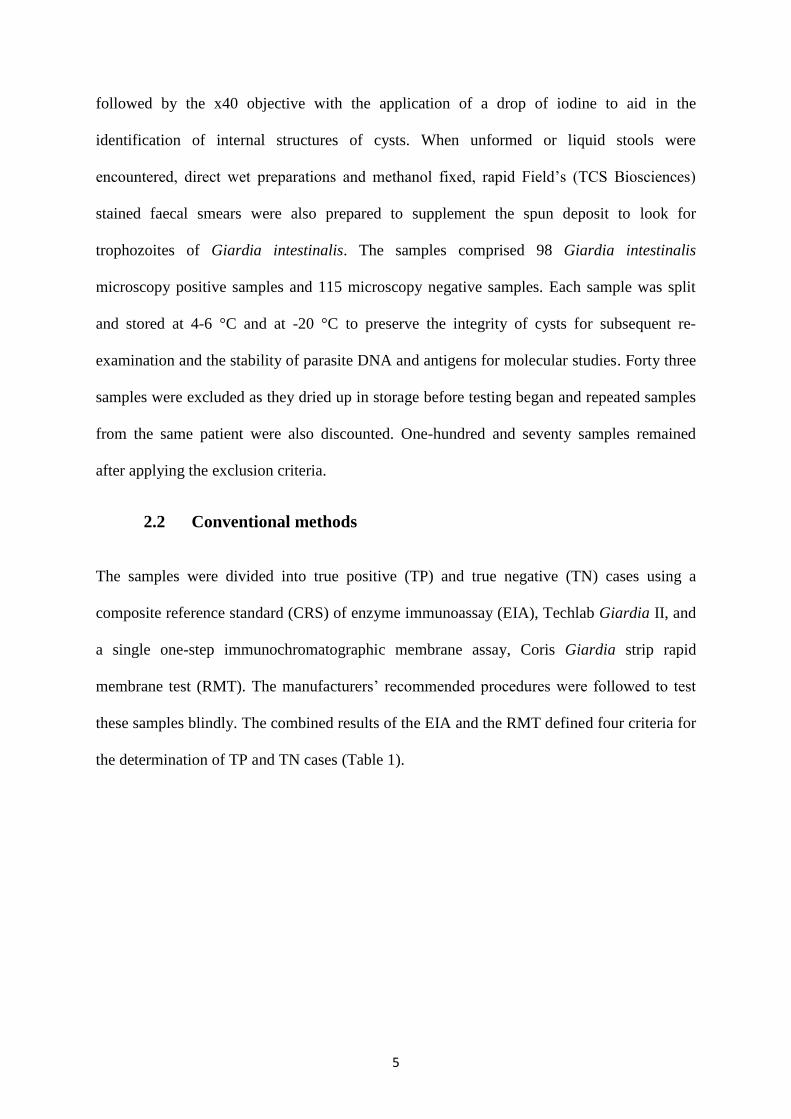
followed by the x40 objective with the application of a drop of iodine to aid in the
identification of internal structures of cysts. When unformed or liquid stools were
encountered, direct wet preparations and methanol fixed, rapid Field’s (TCS Biosciences)
stained faecal smears were also prepared to supplement the spun deposit to look for
trophozoites of Giardia intestinalis. The samples comprised 98 Giardia intestinalis
microscopy positive samples and 115 microscopy negative samples. Each sample was split
and stored at 4-6 °C and at -20 °C to preserve the integrity of cysts for subsequent re-
examination and the stability of parasite DNA and antigens for molecular studies. Forty three
samples were excluded as they dried up in storage before testing began and repeated samples
from the same patient were also discounted. One-hundred and seventy samples remained
after applying the exclusion criteria.
2.2 Conventional methods
The samples were divided into true positive (TP) and true negative (TN) cases using a
composite reference standard (CRS) of enzyme immunoassay (EIA), Techlab Giardia II, and
a single one-step immunochromatographic membrane assay, Coris Giardia strip rapid
membrane test (RMT). The manufacturers’ recommended procedures were followed to test
these samples blindly. The combined results of the EIA and the RMT defined four criteria for
the determination of TP and TN cases (Table 1).
6
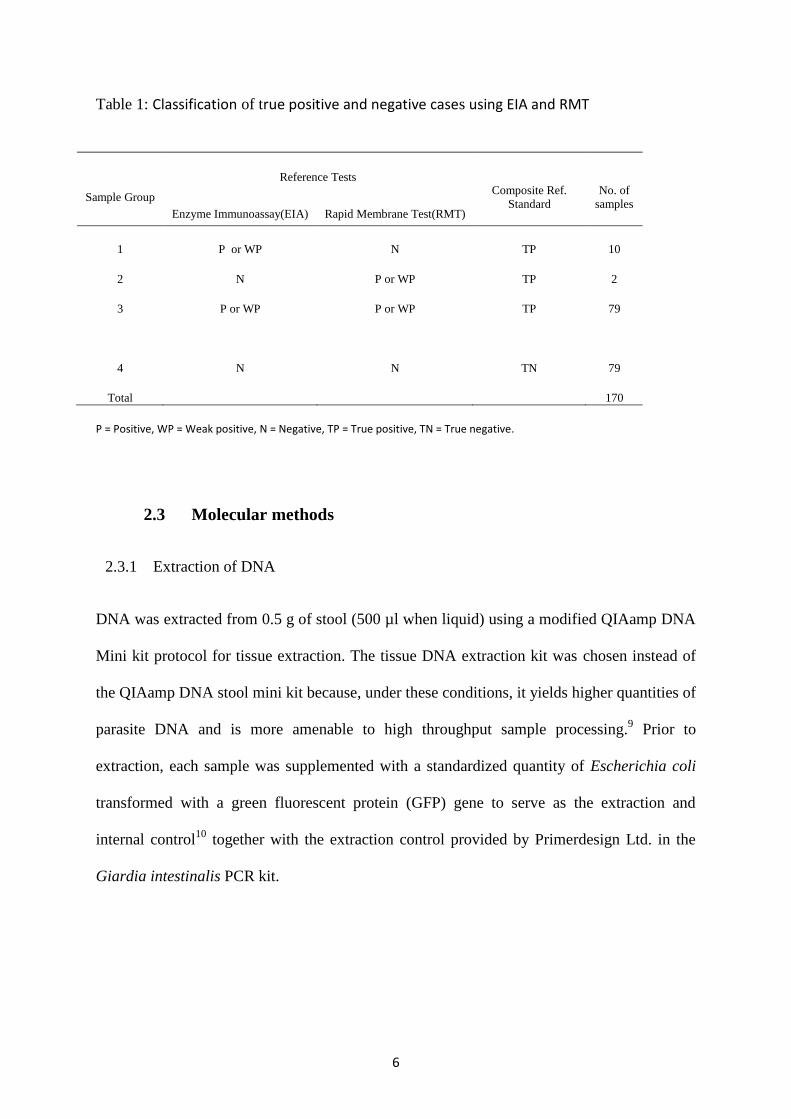
Table 1: Classification of true positive and negative cases using EIA and RMT
Sample Group
Reference Tests Composite Ref.
Standard
No. of
samples Enzyme Immunoassay(EIA) Rapid Membrane Test(RMT)
1 P or WP N TP 10
2 N P or WP TP 2
3 P or WP P or WP TP 79
4
Total
N N TN
79
170
P = Positive, WP = Weak positive, N = Negative, TP = True positive, TN = True negative.
2.3 Molecular methods
2.3.1 Extraction of DNA
DNA was extracted from 0.5 g of stool (500 µl when liquid) using a modified QIAamp DNA
Mini kit protocol for tissue extraction. The tissue DNA extraction kit was chosen instead of
the QIAamp DNA stool mini kit because, under these conditions, it yields higher quantities of
parasite DNA and is more amenable to high throughput sample processing.9 Prior to
extraction, each sample was supplemented with a standardized quantity of Escherichia coli
transformed with a green fluorescent protein (GFP) gene to serve as the extraction and
internal control10
together with the extraction control provided by Primerdesign Ltd. in the
Giardia intestinalis PCR kit.
7
2.3.2 Real-time PCR assay
The Verweij et al. (2004) real-time PCR primers and probe set consisted of forward primer
Giardia-80F and reverse primer Giardia-127R, and the Giardia intestinalis-specific double-
labelled probe Giardia-105T (Biolegio, Malden, The Netherlands) (Table 2).
The primers were used at a final concentration of 400 nM each for the forward and reverse
primers and 120 nM for the probe in 25 µl reactions containing 5 µl templates DNA.
Amplification was performed in a Rotor-Gene Q 6000 (Corbett Life Sciences) using
TaqMan(R) Environmental Master Mix 2.0 (Applied Biosystems). The cycling conditions
were: 95 oC (10 min), 95
oC (15 s), 60
oC (60 s) for 45 cycles.
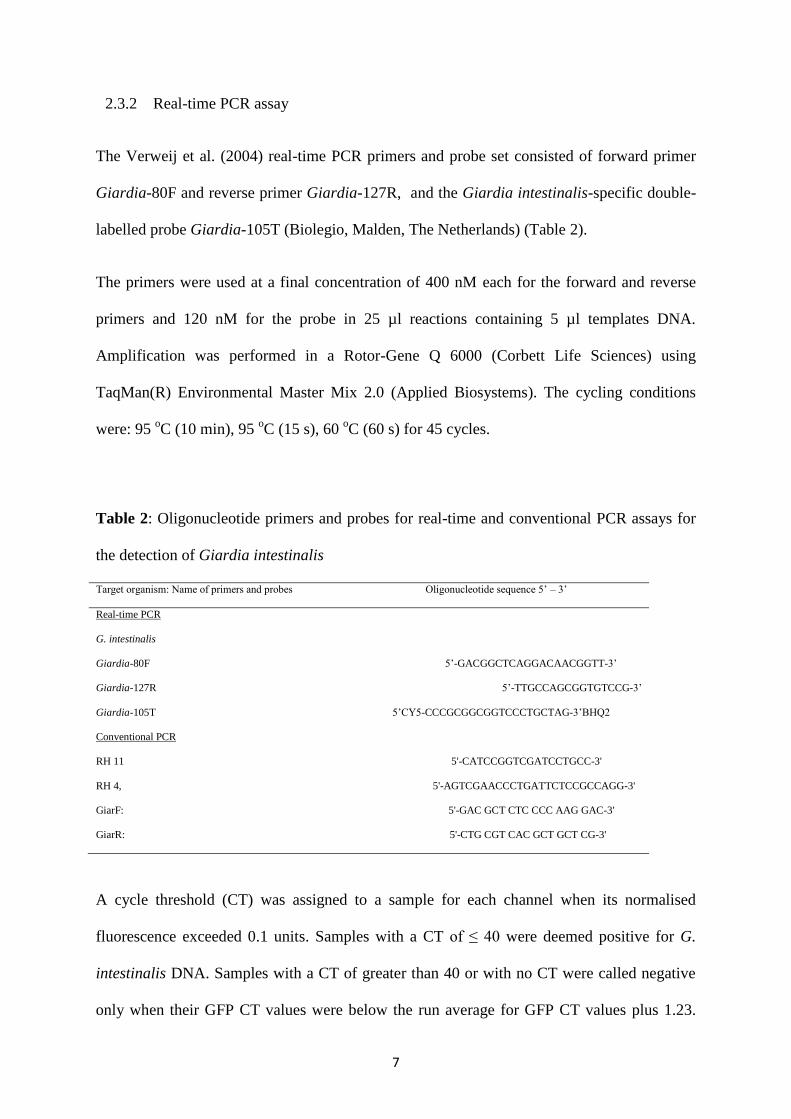
Table 2: Oligonucleotide primers and probes for real-time and conventional PCR assays for
the detection of Giardia intestinalis
Target organism: Name of primers and probes Oligonucleotide sequence 5’ – 3’
Real-time PCR
G. intestinalis
Giardia-80F 5’-GACGGCTCAGGACAACGGTT-3’
Giardia-127R 5’-TTGCCAGCGGTGTCCG-3’
Giardia-105T 5’CY5-CCCGCGGCGGTCCCTGCTAG-3’BHQ2
Conventional PCR
RH 11 5'-CATCCGGTCGATCCTGCC-3'
RH 4, 5'-AGTCGAACCCTGATTCTCCGCCAGG-3'
GiarF: 5'-GAC GCT CTC CCC AAG GAC-3'
GiarR: 5'-CTG CGT CAC GCT GCT CG-3'
A cycle threshold (CT) was assigned to a sample for each channel when its normalised
fluorescence exceeded 0.1 units. Samples with a CT of ≤ 40 were deemed positive for G.
intestinalis DNA. Samples with a CT of greater than 40 or with no CT were called negative
only when their GFP CT values were below the run average for GFP CT values plus 1.23.
8
This is the value determined as the optimal cut off for a 5 % rejection rate through the
analysis of multiple runs within the laboratory (data not shown). For negative samples whose
GFP CT exceeded this value, the sample was repeated with a 1 in 10 dilution according to
internal validation criteria to examine the effect of PCR inhibitors. Any diluted sample whose
CT was greater than the run mean plus 5 CT was considered a technical failure, requiring re-
extraction and re-amplification. The Primerdesign Ltd. assay did not have such a stringent
criteria for determining positivity. According to the manufacturer’s instructions (Genesig
Advanced kit handbook, HB10.03.03), CT values of 31±3 are within the normal range for the
internal extraction control, and any outside this range were treated as run failures and re-
extracted and re-amplified.
2.3.3 Conventional single round PCR
The real-time PCR primer pairs, Giardia-80F and Giardia-127R, were used but
without the probe in a conventional PCR amplification and analysis by gel-electrophoresis for
the 62 bp amplicons of Giardia intestinalis to investigate apparent false positive samples. A
G-Storm Thermocycler (Kapa Biosystems Model GS00001) was used with the following
protocol: heated lid 110 oC; hot start 1 cycle for 95 min and 15 min; 95
oC (45 s) and 60
oC
(90 s) repeated for a total of 45 cycles; 72 oC for 1 cycle followed by a holding temperature
of 10 oC. The amplification protocol was repeated with the same set of primers as a two step
reaction to maximize the yield of 62 bp amplicons for potential sequencing.
2.3.4 Conventional nested PCR
Conventional nested PCR was run to investigate further apparent false positive
results. The nested PCR used two different sets of primers to amplify a 130bp fragment of the
Giardia intestinalis (SSU) rRNA gene for visualization using gel electrophoresis 11
. In the
nest 1 reaction, the RH11/RH4 primers (Table 2) amplified a 292-bp region of the 5' end of
the (SSU) rRNA gene. The PCR amplification was performed in 25 µl volumes with the final
9
mix containing 5-50 ng DNA as per published method 12
using Biomix red (Bioline product).
The amplification process consisted of 1 cycle at 95 oC (2 min); 94
oC (20 s), 59
oC (20 s),
and 72 o
C (30 s) repeated for a total of 40 cycles; 72 oC (7 min) for 1 cycle. The nest 2
primers which amplified 130 bp fragment were: GiarF and GiarR13
(Table 2). A Thermo
Electron Px2 thermal cycler was used with the following amplification protocol: 1 cycle at 95
oC (2 min); 94
oC (20 s), 59
oC (20 s), and 72
oC (30 s) repeated for a total of 45 cycles; 72
oC
(7 min) for 1 cycle as per published protocol using Biomix red 12-13
.
2.4 Analytical sensitivity and specificity
The analytical potential of all the tests (both index and reference) deployed in this study were
verified by the estimation of their limit of detection prior to the estimation of their diagnostic
accuracy measures. The limit of detection (LOD) of the five assays were determined using
DNA extracted from a serially diluted 5-fold dilutions of a Giardia-positive stool sample to
provide the range of estimated cysts concentration of 71,000 cysts/ml to 4.6 cysts/ml of stool
(Table 3). The diluent was a Giardia-negative stool liquefied with phosphate buffered saline
(PBS) pH 7.2. The real-time assays were tested in triplicate.
Analytical specificity was ascertained by using a pooled Giardia-negative stool with various
types of parasitic, bacterial, and fungal organisms including Entamoeba coli, Endolimax
nana, Entamoeba histolytica/dispar, Yeasts, Escherichia coli, Klebsiella sp., Citrobacter sp.,
Proteus sp. and Enterococcus faecalis, Cyclospora cayetanensis and Cryptosporidium sp.
Bacterial pathogens were not available but had already been tested in a previous study7.
2.5 Real-time PCR performance evaluation
A set of 10-fold serial dilutions of a Giardia intestinalis DNA template solutions prepared
from the 71,000 cysts/ml solution in Table 3 were tested in triplicate. The E and R2
from the
regression lines were compared with the equivalent values generated from the 5-fold serial
10
dilutions used for the LOD testing. The calculation of E was based the formula E = 10(-
1/slope) – 1 for standard curve generated by a R2 of the plotted points.
14
2.6 Diagnostic accuracy
A composite reference standard (CRS) of RMT and EIA was used in a diagnostic
study of the three index tests (OCP-M, Verweij real-time PCR, and Primerdesign Ltd.
Giardia real-time PCR) as recommended by the Health Technology Assessment for
diagnostic accuracy studies when there is no gold standard.15
McNemar statistics was used in
a pair wise comparison to establish the significance of any differences in the performance of
the diagnostic tests before diagnostic accuracy measures were calculated using cross
tabulation statistics (2x2-table): sensitivity = (number of true positives)/(number of true
positives + number of false negatives) percent, and specificity = (number of true
negatives)/(number of true negatives + number of false positives) percent.16
Positive
likelihood ratio (LR+) was calculated as (sensitivity)/(1 - specificity), and negative
likelihood ratio (LR-) was calculated as (1 - sensitivity)/(specificity).17
3. RESULTS
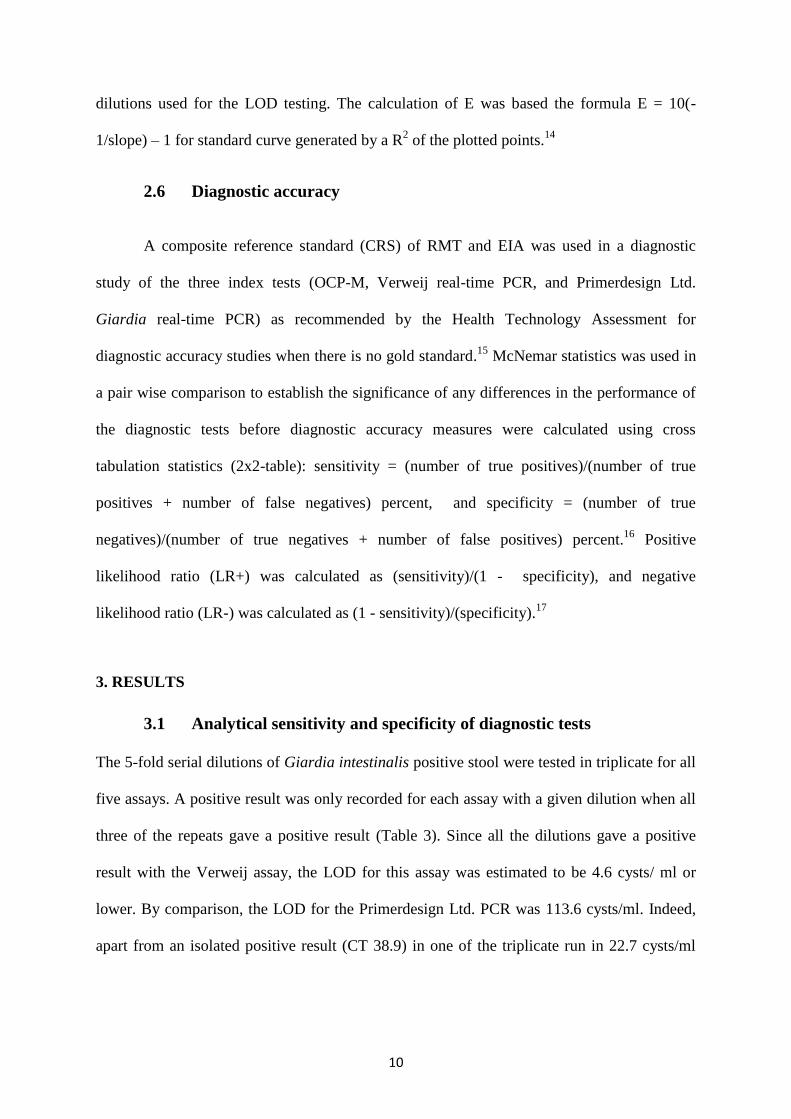
3.1 Analytical sensitivity and specificity of diagnostic tests
The 5-fold serial dilutions of Giardia intestinalis positive stool were tested in triplicate for all
five assays. A positive result was only recorded for each assay with a given dilution when all
three of the repeats gave a positive result (Table 3). Since all the dilutions gave a positive
result with the Verweij assay, the LOD for this assay was estimated to be 4.6 cysts/ ml or
lower. By comparison, the LOD for the Primerdesign Ltd. PCR was 113.6 cysts/ml. Indeed,
apart from an isolated positive result (CT 38.9) in one of the triplicate run in 22.7 cysts/ml
11
tube, the Primerdesign Ltd. assay did not detect any positivity in any replicates involving less
than 113.6 cysts/ ml.
Table 3: Determination of limit of detection (LOD) using Giardia intestinalis positive stool
sample containing 71,000 cysts/ ml. The cysts were counted using C-Chip counting chamber
and diluted 1 in 5 down to 4.6 cysts/ ml.
Test
Analytical sensitivity (cysts/ml of stool) Analytical specificity
(pooled Giardia-negative
stool) 71,000 14,200 2,840 568 113.6 22.7 4.6
RMT
OCP-M
EIA
Primerdesign Ltd.
Verweij real-time
+
+
+
+
+
-
+
+
+
+
-
-
+
+
+
nt
-
-
+
+
nt
-
-
+
+
nt
-
-
-
+
nt
-
-
-
+
-
-
-
-
-
Keys: nt = not tested; + = positive; - = negative; RMT = Rapid Membrane Test; OCP-M =
Ova, Cysts, and Parasite Microscopy; EIA = Enzyme Immunoassay.
The RMT and the EIA formed the constituent tests for the CRS with a combined LOD of ≤
2,840 cysts/ml (Table 3). Analytical specificity was 100 % for each of the diagnostic tests
evaluated as these all gave a negative result with the pooled Giardia-negative stool (Table 3).
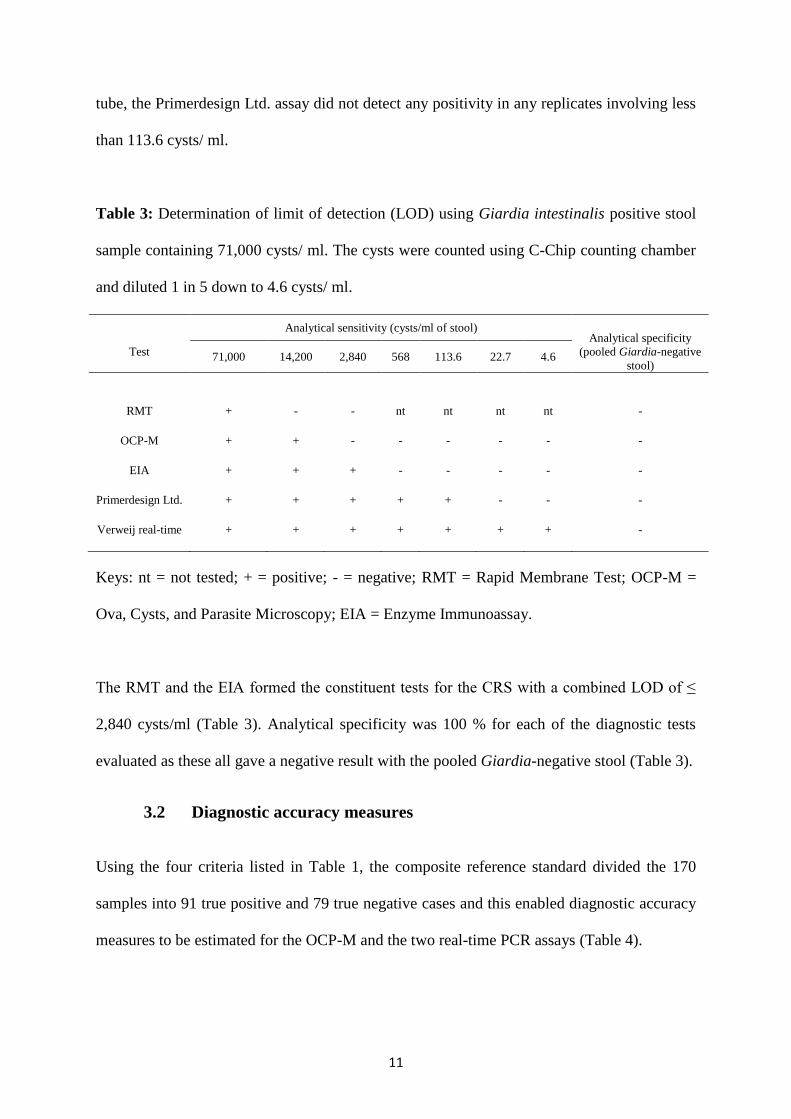
3.2 Diagnostic accuracy measures
Using the four criteria listed in Table 1, the composite reference standard divided the 170
samples into 91 true positive and 79 true negative cases and this enabled diagnostic accuracy
measures to be estimated for the OCP-M and the two real-time PCR assays (Table 4).
12
Table 4: Delineation of true positive and true negative cases
Index test Composite reference standard of EIA and RMT (TP: 91, TN: 79)
TP (TPF) FN (FNF) TN (TNF) FP (FPF) TP +FN+ TN+FP
OCP-M 76 (83.5%) 15 (16.5%) 76 (96.2%) 3 (3.8%) 170
Primerdesign 56 (61.5%) 35 (38.5%) 78 (98.7%) 1 (1.3%) 170
Verweij 85 (93.4%) 6 (6.6%) 59 (74.7%) 20 (25.3%) 170
TP = true positive; TN = true negative; TPF = true positive fraction; TNF = true negative fraction, FPF = false positive
fraction; FNF = false negative fraction.
McNemar test results produced p-values < 0.05 for each paired test (i.e OCP-M vs.
Primerdesign; OCP-M vs Verweij; and Primerdesign vs Verweij) indicating significant
differences in performance which warranted a further investigation with cross tabulation
statistics (2x2 table) to calculate the diagnostic accuracy measures shown in Table 5. The
Verweij assay was diagnostically more sensitivity [93.4 % (95 % CI: 88.30 to 98.50 %)] than
the Primerdesign Ltd. assay [61.5 % (95 % CI: 51.50 to 71.50 %)] (Table 5).
Table 5: Comparative diagnostic performance results of real-time PCR assays and the
traditional OCP-M method for the laboratory detection of Giardia intestinalis.
Index test Sensitivity (SN) Specificity (SP) Likelihood ratios (LR)
SN 95 % CI SP 95 % CI LR+ 95 % CI LR- 95 % CI
OCP-M 83.5 75.87 to 91.13 96.2 91.98 to 100.00* 22.0 13.49 to 30.51 0.17 -0.74 to 1.08
Primerdesign 61.5 51.50 to 71.50 98.7 96.20 to 100.00* 47.3 37.04 to 57.56 0.39 -0.98 to 1.76
Verweij 93.4 88.30 to 98.50 74.7 65.11 to 84.29 3.7 -0.18 to 7.58 0.09 -0.57 to 0.75
LR+ = positive likelihood ratio; LR- = negative likelihood ratio; 95 % CI = 95 % confidence interval. * These values have
been curtailed to 100 % since a specificity of greater than this value is biologically meaningless.
13
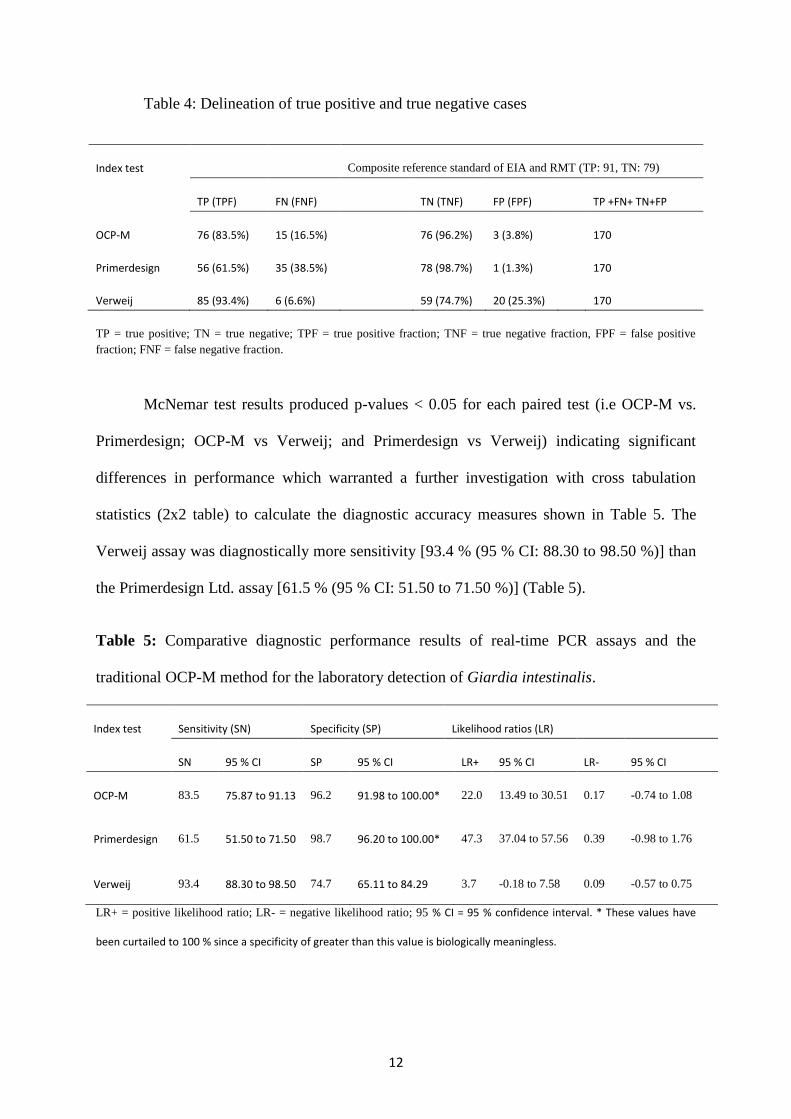
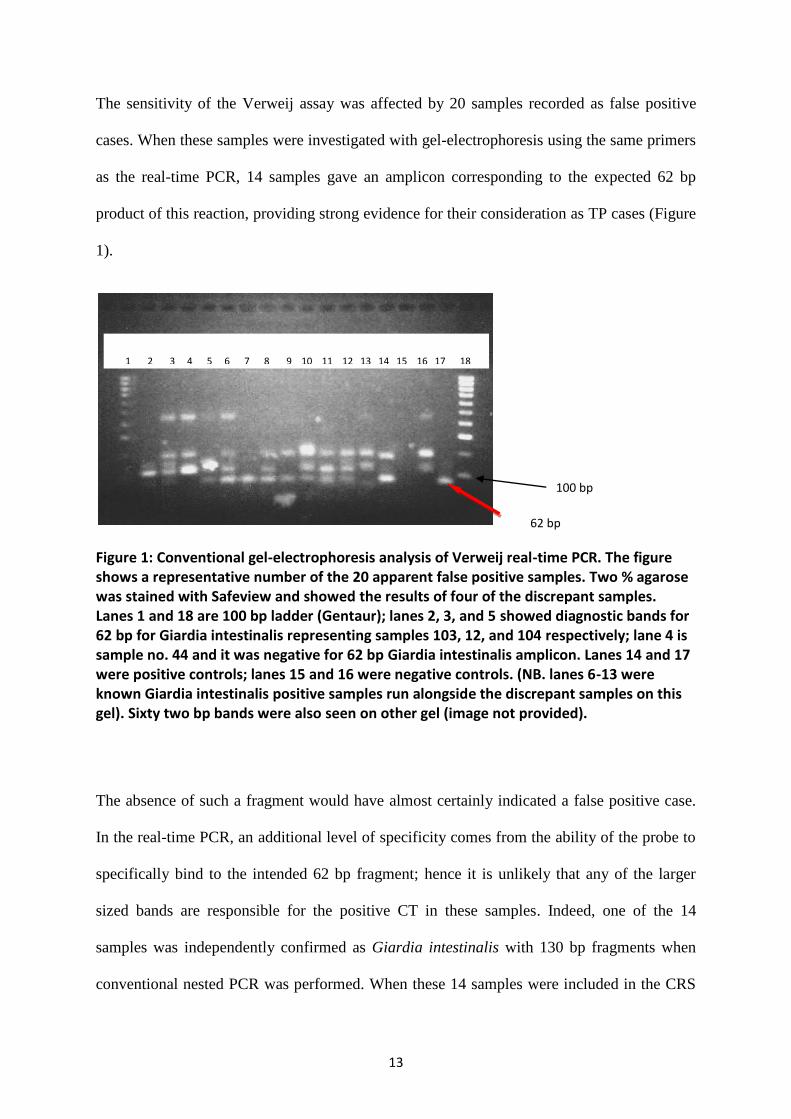
The sensitivity of the Verweij assay was affected by 20 samples recorded as false positive
cases. When these samples were investigated with gel-electrophoresis using the same primers
as the real-time PCR, 14 samples gave an amplicon corresponding to the expected 62 bp
product of this reaction, providing strong evidence for their consideration as TP cases (Figure
1).
Figure 1: Conventional gel-electrophoresis analysis of Verweij real-time PCR. The figure shows a representative number of the 20 apparent false positive samples. Two % agarose was stained with Safeview and showed the results of four of the discrepant samples. Lanes 1 and 18 are 100 bp ladder (Gentaur); lanes 2, 3, and 5 showed diagnostic bands for 62 bp for Giardia intestinalis representing samples 103, 12, and 104 respectively; lane 4 is sample no. 44 and it was negative for 62 bp Giardia intestinalis amplicon. Lanes 14 and 17 were positive controls; lanes 15 and 16 were negative controls. (NB. lanes 6-13 were known Giardia intestinalis positive samples run alongside the discrepant samples on this gel). Sixty two bp bands were also seen on other gel (image not provided).
The absence of such a fragment would have almost certainly indicated a false positive case.
In the real-time PCR, an additional level of specificity comes from the ability of the probe to
specifically bind to the intended 62 bp fragment; hence it is unlikely that any of the larger
sized bands are responsible for the positive CT in these samples. Indeed, one of the 14
samples was independently confirmed as Giardia intestinalis with 130 bp fragments when
conventional nested PCR was performed. When these 14 samples were included in the CRS
62 bp
100 bp
1 2 3 4 5 6 7 8 9 10 11 12 13 14 15 16 17 18
14
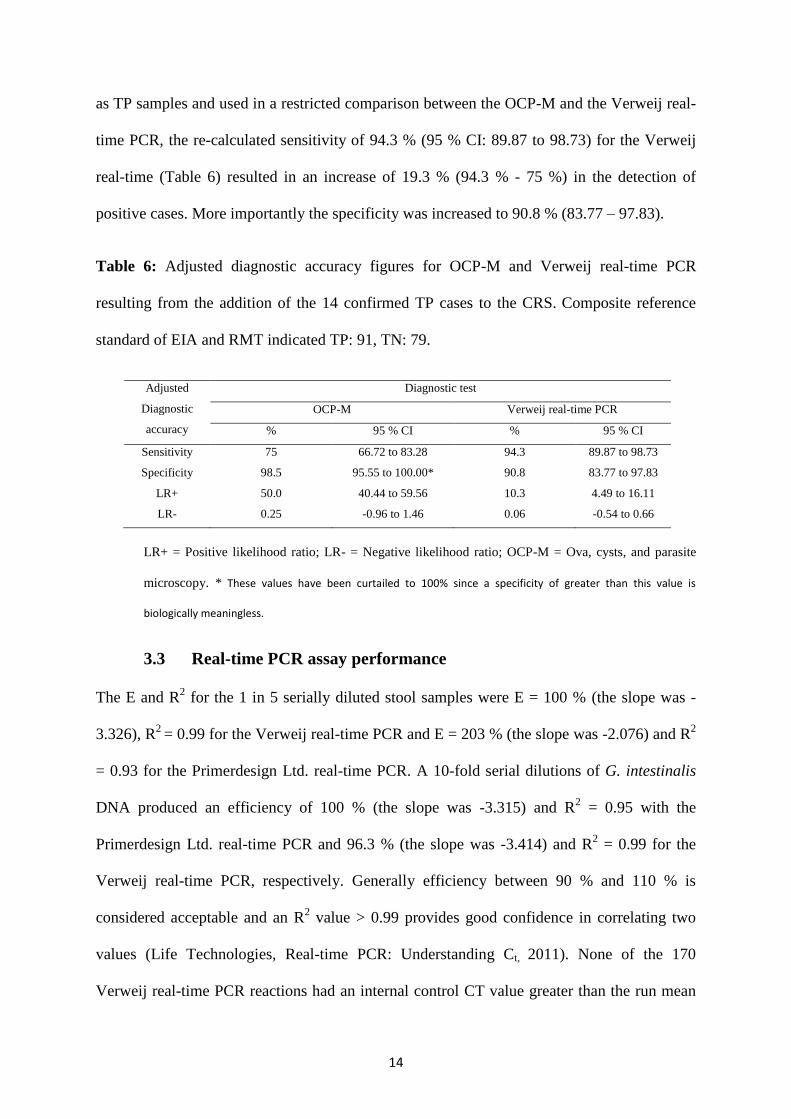
as TP samples and used in a restricted comparison between the OCP-M and the Verweij real-
time PCR, the re-calculated sensitivity of 94.3 % (95 % CI: 89.87 to 98.73) for the Verweij
real-time (Table 6) resulted in an increase of 19.3 % (94.3 % - 75 %) in the detection of
positive cases. More importantly the specificity was increased to 90.8 % (83.77 – 97.83).
Table 6: Adjusted diagnostic accuracy figures for OCP-M and Verweij real-time PCR
resulting from the addition of the 14 confirmed TP cases to the CRS. Composite reference
standard of EIA and RMT indicated TP: 91, TN: 79.
Adjusted
Diagnostic
accuracy
Diagnostic test
OCP-M Verweij real-time PCR
% 95 % CI % 95 % CI
Sensitivity 75 66.72 to 83.28 94.3 89.87 to 98.73
Specificity 98.5 95.55 to 100.00* 90.8 83.77 to 97.83
LR+ 50.0 40.44 to 59.56 10.3 4.49 to 16.11
LR- 0.25 -0.96 to 1.46 0.06 -0.54 to 0.66
LR+ = Positive likelihood ratio; LR- = Negative likelihood ratio; OCP-M = Ova, cysts, and parasite
microscopy. * These values have been curtailed to 100% since a specificity of greater than this value is
biologically meaningless.
3.3 Real-time PCR assay performance
The E and R2 for the 1 in 5 serially diluted stool samples were E = 100 % (the slope was -
3.326), R2
= 0.99 for the Verweij real-time PCR and E = 203 % (the slope was -2.076) and R2
= 0.93 for the Primerdesign Ltd. real-time PCR. A 10-fold serial dilutions of G. intestinalis
DNA produced an efficiency of 100 % (the slope was -3.315) and R2 = 0.95 with the
Primerdesign Ltd. real-time PCR and 96.3 % (the slope was -3.414) and R2 = 0.99 for the
Verweij real-time PCR, respectively. Generally efficiency between 90 % and 110 % is
considered acceptable and an R2 value > 0.99 provides good confidence in correlating two
values (Life Technologies, Real-time PCR: Understanding Ct, 2011). None of the 170
Verweij real-time PCR reactions had an internal control CT value greater than the run mean
15
CT plus 1.23. Using our rejection criteria, this means than none of the samples were
considered to show levels of inhibition that would identify the sample as a run failure. The
Primerdesign Ltd. real-time PCR however showed 48 out of the 170 samples (28.2 %) to
have CTs higher than manufacturer’s quoted range of 31±3.
4. DISCUSSION
The aim of this study was to use a composite reference standard (CRS) to critically
assess the diagnostic accuracy of both OCP-M and real-time PCR methodology for use as a
frontline test for the laboratory diagnosis of giardiasis. The failure of the OCP-M to detect
Giardia in at least 16.5 % Giardia intestinalis positive stool samples (as determined by the
Composite Reference Standard - CRS) may explain why symptoms highly indicative of
chronic giardiasis (include diarrhoea and malabsorption) persist in some patients despite
repeatedly negative stool microscopy results. Indeed, many of such patients when treated
empirically for giardiasis using tinidazole show clinical resolution of their symptoms (data
not shown), strongly supporting the clinical need for implementation of new diagnostic
approaches with increased sensitivity.
The Verweij assay has proven to be both sensitive and robust when applied to clinical
stool samples submitted for routine diagnosis of giardiasis. The initial low specificity of the
assay (74.7 %) compared to OCP-M (96.2 %) could be a potential draw back with the assay,
leading to unnecessary treatment of patients for giardiasis. However, there is good evidence
to suggest that 70 % of the Verweij real-time PCR apparent false positive cases (14/20) were
true positives because of the presence of appropriately sized amplicons (62 bp) (Figure 1).
These amplicons did not yield enough DNA for sequencing when they were excised and
16
extracted from the conventional electrophoresis gel, thus limiting our investigations to visual
interpretation of gel images. An increased sensitivity with the Verweij assay is also supported
by the dramatic differences in the LOD for this assay (< 5 cysts/ml), OCP-M (14,200
cysts/ml) and CRS (≤ 2,840 cysts/ml). Re-evaluating these 14 samples as true positives gives
a specificity of 90.8 %. The effects of the sensitivity and specificity can be seen by examining
the likelihood ratios18
, calculated in diagnostic accuracy studies to determine the presence or
absence of an abnormality17
. The lower specificity of the Verweij assay compared to OCP-M
resulted in a decrease in LR+ of 50.0 to 10.3, meaning patients diagnosed as being positive
are less likely to have active giardiasis. The improvement in sensitivity resulted in a reduction
of LR- from 0.25 (achieved with OCP-M) to 0.06 (Table 6). Thus patients who are negative
with this assay can be classified as true negatives with a far higher certainty than can be
achieved with conventional diagnostic approaches. Tinidazole is a well-tolerated drug with
few side effects. Using a regret theory approach to decision curve analysis, implementation of
a diagnostic test with a very high level of sensitivity but lower level of specificity may
therefore be associated with a far lower level of regret compared to existing diagnostics with
higher specificity but lower sensitivity. The inclusion of these 14 likely additional true
positive cases in the CRS would result in a 19.3 % increase in the detection of positive cases
compared to OCP-M (Tables 6). There was only one apparent amplification failure where
cysts were seen on microscopy but the Verweij real-time PCR failed to give a positive result
even though the GFP extraction control was positive. The problem was most likely a
sampling issue caused by the uneven distribution of the Giardia intestinalis parasite in the
stool sample. The issue was resolved when the stool (study case no. 142) was re-extracted
and the PCR repeated. The intermittent excretion and uneven distribution of the parasite in
faecal samples are confounding problems with stool microscopy, which a very sensitive test
can only partially mitigate it would seem.
17
The Verweij real-time PCR did not appear to be affected by PCR inhibitors because all CTs
for the GFP internal control were within the acceptance criteria of the mean CT plus 1.23.
The resilience of the Verweij assay to PCR inhibition is also supported by the tight
concordance of the efficiencies generated from DNA extracted from the stool dilution series
and a dilution of purified G. intestinalis DNA in molecular grade water. With both of these
standards, efficiencies remained in the acceptable range of 90-110 %. The Primerdesign PCR
did not appear to fare so well with PCR inhibition: About 28 % of the internal control CTs for
the Primerdesign PCR were greater than 34, the higher end of the normal range given by the
manufacturer. This may well explain the high discrepancy between the efficiency of
amplification achieved with the two sets of G. intestinalis DNA standards. In addition our
data support a lower sensitivity for assays targeting the gdh gene compared to those targeting
the (SSU) rRNA 19-20
, suggesting an optimal downstream deployment for the Primerdesign
PCR reserved for the molecular characterization of G. intestinalis parasites into assemblages
or subspecies.
Real-time PCR technology has become an appealing alternative to conventional methods for
diagnosing infectious diseases21
and has already brought improvement in laboratory
workflows and turnaround times for epidemiological typing of clinical isolates of G.
intestinalis.22
A future extension of this study will be analysis of G. intestinalis genotypes
using a multi-locus approach to explore host specificity, transmission patterns and possible
targets for drug resistance. The increase in sensitivity offered by this technique opens up the
possibility of using real-time PCR to monitor patients post treatment as a test of cure. Before
this can be done, however, it will be critical to determine the length of time DNA from non-
viable G. Intestinalis can be detected in patients following successful treatment. Such work
will also require the ability to differentiate between viable and non-viable parasites, possibly
using reverse transcriptase PCR.
18
Take home messages
1. The Verweij real-time PCR protocol with (SSU)-rRNA primers detected
approximately 10 % more Giardia intestinalis parasites than the traditional ova, cysts,
and parasite microscopy (OCP-M) method and 32 % more than the Primerdesign Ltd.
real-time Giardia PCR assay.
2. The Primerdesign Ltd. Giardia real-time PCR assay was more suited for
epidemiological studies involving the molecular characterization of Giardia
intestinalis into assemblages A and B.
3. The Verweij assay was shown to be more optimised and robust in the harsh
environment of stool samples with reaction efficiency well within the acceptable
range of 90 – 110 % and a R2 ≥ 0.99 making it more applicable as a frontline
diagnostic test.
4. Likelihood ratios (LR+ and LR-) were better with the (SSU)-rRNA primers at 95 %
CI.
Acknowledgements
We are indebted to Zung To for ordering materials; Mr. David Manser and biomedical
scientists in the Department of Clinical Parasitology for their support during the specimen
collection. PLC and SDP are supported by the National Institute for Health Research
University College London Hospitals Biomedical Research Centre.
Funding
This work was funded by the Trustees of the Hospital for Tropical Diseases whose research
committee provided advice on the study design.
19
Contributors
All authors contributed to the design of the study and revision of the manuscript. SB
performed the bulk of the laboratory work and drafted the manuscript. SDP made
substantial contribution to the statistical analysis and interpretation of the experimental data.
SK and GM reviewed the manuscript critically for important intellectual and sound scientific
content. PLC contributed to the conception of the study and critically revised the manuscript
for sound clinical content. As the guarantor, PLC is responsible for the overall content of this
study. All the authors approved the final version of the manuscript for submission.
Licence for Publication
The Corresponding Author has the right to grant on behalf of all authors and does grant on
behalf of all authors, an exclusive licence (or non exclusive for government employees) on a
worldwide basis to the BMJ Publishing Group Ltd to permit this article (if accepted) to be
published in JCP and any other BMJPGL products and sublicences such use and exploit all
subsidiary rights, as set out in our licence
(http://group.bmj.com/products/journals/instructions-for-authors/licence-forms).
Competing Interest: None declared.
Ethics approval: The stool samples were submitted as part of the usual clinical practice for
diagnostic purposes. Ethical approval was not required under National Health Service (NHS)
research governance arrangements (NHS-Research Ethics Committees (NHS REC) 12
November 2009).
Provenance and peer review: Not commissioned; externally peer reviewed.
20
REFERENCES
1. Allen AVH, Ridley DS. Technical Methods: Further observations on the Formol-
ether concentration technique for faecal parasites. J Clin Pathol. 1970;23:545-546.
2. Ridley DS. The value of formol-ether concentration of faecal cysts and ova. J Clin
Pathol. 1956;9:74-76.
3. Goka AK, Rolston DD, Mathan VI, et al. The relative merits of faecal and duodenal
juice microscopy in the diagnosis of giardiasis. Trans R Soc Trop Med Hyg. 1990;84:66-7.
4. Calderaro A, Gorrini C, Montecchini S, et al. Evaluation of a real-time polymerase
chain reaction assay for the laboratory diagnosis of giardiasis. Diagn Microbiol Infect Dis.
2010;66:261-7.
5. Haque R, Roy S, Siddique A, et al. Multiplex real-time PCR assay for detection of
Entamoeba histolytica, Giardia intestinalis, and Cryptosporidium spp. Am J Trop Med Hyg.
2007;76:713-7.
6. Schuurman T, van Zwet A, Lankamp P, et al. Comparison of microscopy, real-
time PCR and a rapid immunoassay for the detection of Giardia lamblia in human stool
specimens. Clin Microbiol Infect. 2007;13:1186 - 1191.
7. Verweij JJ, Schinkel J, Laeijendecker D, et al. Real-time PCR for the detection of
Giardia lamblia. Mol Cell Probes. 2003;17:223-225.
8. Verweij JJ, Blangé R, Templeton K, et al. Simultaneous detection of Entamoeba
histolytica, Giardia lamblia, and Cryptosporidium parvum in fecal samples by using
multiplex real-time PCR. J Clin Microbiol. 2004;42:1220-3.
9. Polley SD, Boadi S, Watson J, et al. Detection and species identification of
microsporidial infections using SYBR Green real-time PCR. J Med Microbiol. 2011;60:459-
66.
10. Murphy NM, McLauchlin J, Ohai C, et al. Construction and evaluation of a
microbiological positive process internal control for PCR-based examination of food samples
for Listeria monocytogenes and Salmonella enterica. Int J Food Microbiol. 2007;120:110-9.
11. Nantavisai K, Mungthin M, Tan-ariya P, et al. Evaluation of the sensitivities of
DNA extraction and PCR methods for detection of Giardia duodenalis in stool specimens. J
Clin Microbiol. 2007;45:581-3.
12. Hopkins RM, Meloni BP, Groth DM, et al. Ribosomal RNA sequencing reveals
differences between the genotypes of Giardia isolates recovered from humans and dogs living
in the same locality. J Parasitol. 1997;83:44-51.
13. Read C, Walters J, Robertson ID, et al. Correlation between genotype of Giardia
duodenalis and diarrhoea. Int J Parasitol. 2002;32:229-231.
14. Lee C, Kim J, Shin SG, et al. Absolute and relative QPCR quantification of plasmid
copy number in Escherichia coli. J Biotechnol. 2006;123:273-80.
21
15. Rutjes AWS, Reitsma JB, Coomarasamy A, et al. Evaluation of diagnostic tests
when there is no gold standard. A review of methods. Health Technol Assess. 2007;11:1-72.
16. Sloan LM. Real-time PCR in clinical microbiology: verification, validation, and
contamination control. Clin Microbiol Newsl. 2007;29:87-95.
17. Deeks JJ, Altman DG. Diagnostic tests 4: likelihood ratios. BMJ. 2004;329:168-169.
18. Cook C, Cleland J, Huijbregts P. Creation and Critique of Studies of Diagnostic
Accuracy: Use of the STARD and QUADAS Methodological Quality Assessment Tools. J
Man Manip Ther. 2007;15:93-102.
19. Boontanom P, Siripattanapipong S, Mungthin M, et al. Improved sensitivity of
PCR amplification of glutamate dehydrogenase gene for detection and genotyping of Giardia
duodenalis in stool specimen. Southeast Asian J Trop Med Public Health. 2010;41:280-4.
20. Feng Y, Xiao L. Zoonotic potential and molecular epidemiology of Giardia species
and giardiasis. Clin Microbiol Rev. 2011;24:110-40.
21. Espy MJ, Uhl JR, Sloan LM, et al. Real-time PCR in clinical microbiology:
applications for routine laboratory testing. Clin Microbiol Rev. 2006;19:165-256.
22. Elwin K, Fairclough HV, Hadfield SJ, et al. Giardia duodenalis typing from stools:
a comparison of three approaches to extracting DNA, and validation of a probe-based real-
time PCR typing assay. J Med Microbiol. 2014;63:38-44.