Embed Size (px)
Citation preview
POLICY AND PROGRAM STUDIES SERVICE
A Descriptive Evaluation of the Federal Class-Size Reduction Program
Final Report
2004
U.S. DEPARTMENT OF EDUCATION DOC. # 2004-18
OFFICE OF THE DEPUTY SECRETARY
A Descriptive Evaluation of the Federal Class-Size Reduction Program
Final Report
By Mary Ann Millsap Jennifer Giancola W. Carter Smith
Dana Hunt Abt Associates Inc. Cambridge, Mass.
Daniel C. Humphrey Marjorie E. Wechsler
Lori M. Riehl SRI International
Menlo Park, Calif.
Prepared for: U.S. Department of Education Office of the Deputy Secretary
Policy and Program Studies Service
2004
This report was prepared for the U.S. Department of Education under Contract No. HS 282-98-0006, Task 19. The project monitors were Stacy Kotzin and Tracy Rimdzius in the Policy and Program Studies Service. The views expressed herein are those of the contractor. No official endorsement by the U.S. Department of Education is intended or should be inferred. U.S. Department of Education Rod Paige Secretary Office of the Deputy Secretary Eugene W. Hickok Deputy Secretary Policy and Program Studies Service Alan L. Ginsburg Director Program and Analytic Studies Division David Goodwin Director August 2004 This report is in the public domain. Authorization to produce it in whole or in part is granted. Although permission to reprint this publication is not necessary, the citation should be: U.S. Department of Education, Office of the Deputy Secretary, Policy and Program Studies Service, A Descriptive Evaluation of the Federal Class-Size Reduction Program: Final Report, Washington, D.C., 2004. This report is also available on the Department’s Web site at http://www.ed.gov/about/offices/list/ods/ppss/reports.html. On request, this publication is available in alternative formats, such as Braille, large print, audiotape, or computer diskette. For more information, please contact the Department’s Alternate Format Center at (202) 260-9895 or (202) 205-8113.

iii
Acknowledgments
We want to thank the more than 500 district staff and almost 500 principals who completed the two national surveys on class-size reduction. We also appreciate the cooperation and goodwill of the six states, 12 districts, and 24 schools whose personnel were so generous with their time as we visited their offices, schools, and classrooms. We are particularly pleased with our collaborative relationship with SRI International, which was an equal partner with us in each aspect of this evaluation. SRI researchers visited half the states, and authored Chapter 3. Their prior knowledge of the class-size reduction efforts in California greatly informed this evaluation. We also want to thank our colleagues at the CSR Research Consortium, the partnership researching California’s class size reduction reform. They were very generous in sharing their early evaluation findings as well as their instruments; we adapted several survey items for use in our surveys. We also appreciate the advice, support, and guidance of our federal Project Officers Tracy Rimdzius and Stacy Kotzin at the U.S. Department of Education.

iv
v
Contents
Acknowledgments………………………………………………………………………………….....iii List of Tables………………………………………………………………………………………....vii Chapter 1: Introduction and Summary......................................................................................1
Overview of the Program..................................................................................................1 Purposes of the Evaluation ................................................................................................1 Methodology ....................................................................................................................2
District Survey .....................................................................................................2 School Survey ......................................................................................................3 Site Visits ............................................................................................................4
Research on Class-Size Reduction .....................................................................................4 Findings from the Federal Evaluation.................................................................................5
Distribution and Uses of Funds..............................................................................5 Implementation ....................................................................................................6 Changes in Class Size ...........................................................................................7
Organization of the Final Report........................................................................................7 Chapter 2: Allocation of Federal Class-Size Reduction Funds ....................................................9
Overview .........................................................................................................................9 Major Findings .................................................................................................................9 Distribution and Uses of Federal CSR Funds .................................................................... 10 Teachers Hired with Federal CSR Funds .......................................................................... 12
How Districts Chose Schools for CSR Teachers ............................................................... 13 District Decision Makers..................................................................................... 13 Criteria for Selecting Schools .............................................................................. 13
Use of Waivers and Carryover Funding............................................................................ 15 Waivers ............................................................................................................. 15
Carryover Funds ................................................................................................. 16 Coordinating Federal CSR Funds with Other Funding ....................................................... 19 Conclusion ..................................................................................................................... 21 Chapter 3: Implementation of the Federal Class-Size Reduction Program..............................23
Overview ....................................................................................................................... 23 Major Findings ............................................................................................................... 23
Hiring Teachers.................................................................................................. 23 Professional Development ................................................................................... 24 Resources........................................................................................................... 24 Classroom Practices............................................................................................ 24
Hiring Teachers.............................................................................................................. 25 Availability of Credentialed Teachers .................................................................. 25 Recruitment ....................................................................................................... 27 Characteristics of CSR Teachers.......................................................................... 30
Professional Development ............................................................................................... 33 Participants in Federal CSR-Funded Professional Development ............................. 34
Content and Types of Professional Development Provided under the Auspices of the Federal CSR Program.................................................................................... 36
vi
Challenges with Implementing Federal CSR-Funded Professional Development..... 40 Resources....................................................................................................................... 43
Facility Resource Issues...................................................................................... 43 Strategies to Counter Facilities Problems.............................................................. 45 Financial Resource Issues.................................................................................... 47
Classroom Practices........................................................................................................ 48 Conclusion ..................................................................................................................... 48 Chapter 4: Changes in Class Size ..............................................................................................51
Overview ....................................................................................................................... 51 Major Findings ............................................................................................................... 51 Reduction in Class Size................................................................................................... 52
Determining the Unique Role of Federal CSR Funds on Class Size ........................ 54 Methods Used to Reduce Class Size................................................................................. 55
Class-Size Reduction in Specific Subjects ............................................................ 56 Grades in Which Class Size Was Reduced ....................................................................... 56
Schools That Did not Focus on K-3 ..................................................................... 57 Class Size in Non-Targeted Grades.................................................................................. 58 Effects of Enrollment Increases on Class-Size Reduction .................................................. 59 Conclusion ..................................................................................................................... 60
References.................................................................................................................................63 Appendix A: Survey of District Personnel............................................................................A-1 Survey of School Principals ...........................................................................A-22
vii
Tables
Table 1.1 Respondents and Response Rates, Survey of District Personnel, National Evaluation of the Federal CSR Program, 2001 ................................................................2
Table 1.2 Weighting Responses from the Survey of District Personnel for the National Evaluation of the Federal CSR Program, 2001 ................................................................3
Table 1.3 Respondents and Response Rates, Survey of School Principals, National Evaluation of the Federal CSR Program, 2001 ................................................................3
Table 2.1 Allocation of Federal CSR Funds, by Size of District................................................................10
Table 2.2 Average Percentage (Standard Error) of Federal CSR Funds Spent or Projected to be Spent on Various Expenditures during the 1999-2000 and 2000-01 School Years, by Size of District ................................................................................................11
Table 2.3 Number Teachers Fully or Partially Funded by Federal CSR in the 2000-01 School Year, by Size of District................................................................................................12
Table 2.4 Percentage of Districts Reporting on Who Influences Decisions on Which Schools Participate in Federal CSR Initiatives..........................................................................................14
Table 2.5 Types of Schools Selected to Receive Teachers through Federal CSR Funding in 2000-01, by Size of District................................................................................................15
Table 2.6 Percent (Standard Error) of Districts Receiving Waivers to Federal Class-Size Program Requirements, by Type of Waiver and Size of District................................ 16
Table 2.7 Federal CSR Funds Carried Over from the 1999-2000 School Year, by Size of District................................................................................................................................17
Table 2.8 Percent (Standard Error) of Districts Reporting Various Factors Affecting Their Ability to Expend the 1999-2000 School Year Federal CSR Allocation, by Size of District................................................................................................................................18
Table 2.9 Proportion (Standard Error) of Districts Coordinating Federal CSR with Other Funding Sources, by Size of District ...........................................................................................20
Table 2.10 District Participation in All CSR Initiatives in 2000-01, by Size of District................................20
Table 3.1 Percentage of Districts Reporting Types of Difficulties Hiring Teachers with
Federal CSR Funds, by District Size ...........................................................................................27
Table 3.2 Percentage of Districts Reporting Using Federal CSR Resources for Various Recruitment and Hiring Activities, by District Size ................................................................29
Table 3.3 Distribution of Teaching Certificates of Teachers in Reduced- and Non-Reduced Size Classes, 2000-01 ................................................................................................31
Table 3.4 Highest Degree Held by Teachers in Reduced- and Non-Reduced Size Classes, 2000-01 ................................................................................................................................32
Table 3.5 Levels of Teacher Experience in Reduced- and Non-Reduced Size Classes, 2000-01 ................................................................................................................................33
viii
Tables (cont.)
Table 3.6 Percentage of Districts Reporting on Types of Teachers Who Participated in CSR-Funded Professional Development ..............................................................................................35
Table 3.7 Percentage of Principals Reporting on Teacher Participation in Various Professional Development Topics, 2000-01................................................................38
Table 3.8 Percentage of Districts Reporting on Topics of Staff Development under Federal CSR Funding, 2000-01 ................................................................................................39
Table 3.9 Percentage of Districts Reporting Difficulty in Performing Professional Development Activities, 2000-01................................................................................................41
Table 3.10 Percentage of Districts Reporting Level of Influence of Federal CSR on District’s Professional Development Activities, 2000-01................................................................42
Table 3.11 Percentage of Districts Reporting Various Facilities Problems Due to Federal CSR Program Implementation, by District Size ................................................................ 44
Table 3.12 Percentage of Districts Reporting Use of Various Strategies to Provide Space for Additional Teachers, by District Size ..........................................................................................46
Table 4.1 Average Class Size (Standard Error) in Grades K-3, Before and After
Implementation of Federal CSR................................................................................................53
Table 4.2 Average Class Size in Grades K-3 with CSR Teachers in Separate Classrooms, Before and After Implementation of Federal CSR and With or Without Student Enrollment Increases................................................................................................54
Table 4.3 Percentage (Standard Error) of Schools Using Various Methods to Reduce Class Size in 2000-01........................................................................................................................55
Table 4.4 Percentage (Standard Error) of Schools Targeting Specific Subjects with Federal CSR Funds in 2000-01 ................................................................................................56
Table 4.5 Percentage (Standard Error) of Schools Reporting Using Federal CSR Funds to Reduce Class Size in Various Grade Levels in 2000-01..............................................................57
Table 4.6 Percentage (Standard Error) of Schools Reporting Using Federal CSR Funds to Reduce Class Size in Specific Combinations of Grades in 2000-01 ................................58
Table 4.7 Percentage (Standard Error) of Districts Reporting That Reducing Class Size in Grades K-3 Created Larger Classes in Other Grades in 2000-01................................59
Table 4.8 Percentage (Standard Error) of Districts Reporting Impact of Growth in Total Student Enrollment on Implementation of Federal CSR Program in 2000-01 ...............................60
1
Chapter 1 Introduction and Summary
Overview of the Program
The federal Class-Size Reduction (CSR) Program, P.L. 105-277, begun in Fiscal Year 1999, represented a major federal commitment to help school districts hire additional qualified teachers, especially in the early elementary grades, so children would learn in smaller classes. The CSR program also allowed funds to be spent as professional development, in part to help teachers take advantage of instructional opportunities in smaller classes. The ultimate goal of the program was to improve student achievement, particularly in reading, by reducing class sizes in grades K-3 to an average of 18 students per class. Through the Department of Education Appropriations Act of 1999, $1.2 billion was initially appropriated for this program. States allocated 100 percent of the funds to school districts based upon a formula distribution using poverty and enrollment data. There was neither a ceiling nor a floor on district allocations. School districts were required to use a minimum of 82 percent of the funds for recruiting, training new teachers, and teacher salaries. No more than 3 percent was to be used for local administration and no more than 15 percent to pay such costs as professional development. The initial emphasis was on reducing class size in grades 1 to 3. In FY 2000, the appropriation totaled $1.3 billion, the grade span was expanded to include kindergarten, and the proportion of funds potentially available for professional development increased from 15 percent to 25 percent, whereas the portion to be used on teacher salaries correspondingly decreased from a minimum of 82 to 72 percent. The FY 2001 appropriation rose to $1.623 billion. As part of the reauthorization of the Elementary and Secondary Education Act of 1965 (ESEA), the CSR program was folded into Title II, Part A, of the No Child Left Behind Act of 2001 (NCLB). Although no longer a separate federal program, class-size reduction remains an allowable use of funds under Title II, Part A. It is one of many ways that districts can use their Title II, Part A, funds to improve teacher quality and student achievement in their schools. Therefore, this evaluation provides valuable lessons not just about the federal CSR program, but also about a major component of Title II, Part A, of NCLB.
Purposes of the Evaluation
The evaluation was designed to address multiple research questions, organized into three main categories: (1) distribution and uses of federal CSR funds; (2) implementation of CSR; (3) and effects of CSR on class size. This evaluation was not intended to provide data on the effects of CSR on classroom practices or student achievement. Under the uses of funds category, we were particularly interested in how districts used their funds, the numbers of teachers hired, the schools selected to receive CSR teachers, spending issues such as the extent of carryover from 1999-2000, and the coordination of federal CSR funds with other funding sources. Questions about CSR implementation included sources and qualifications of new teachers, types of recruitment activities undertaken, nature and quality of professional development provided, and availability of facilities for reducing class size. To assess the impact of the federal CSR program on class size, we were
Evaluation of the Federal CSR Program: Chapter 1 2
interested in the methods used to reduce class size as well as average class size before and after the program went into effect.1
Methodology The evaluation used mixed data collection methods. Surveys of district staff and school principals provided generalizable information about the federal CSR program, while site visits to six states, 12 districts (two in each state), 24 schools (two in each district), and 48 CSR teachers (two in each school) provided qualitative information that illuminated and helped verify the survey findings. The surveys and site visits were conducted in the spring of 2001, during the federal CSR program’s second year of funding, and most data correspond to the 2000-01 school year. Data collection methods are elaborated below. District Survey
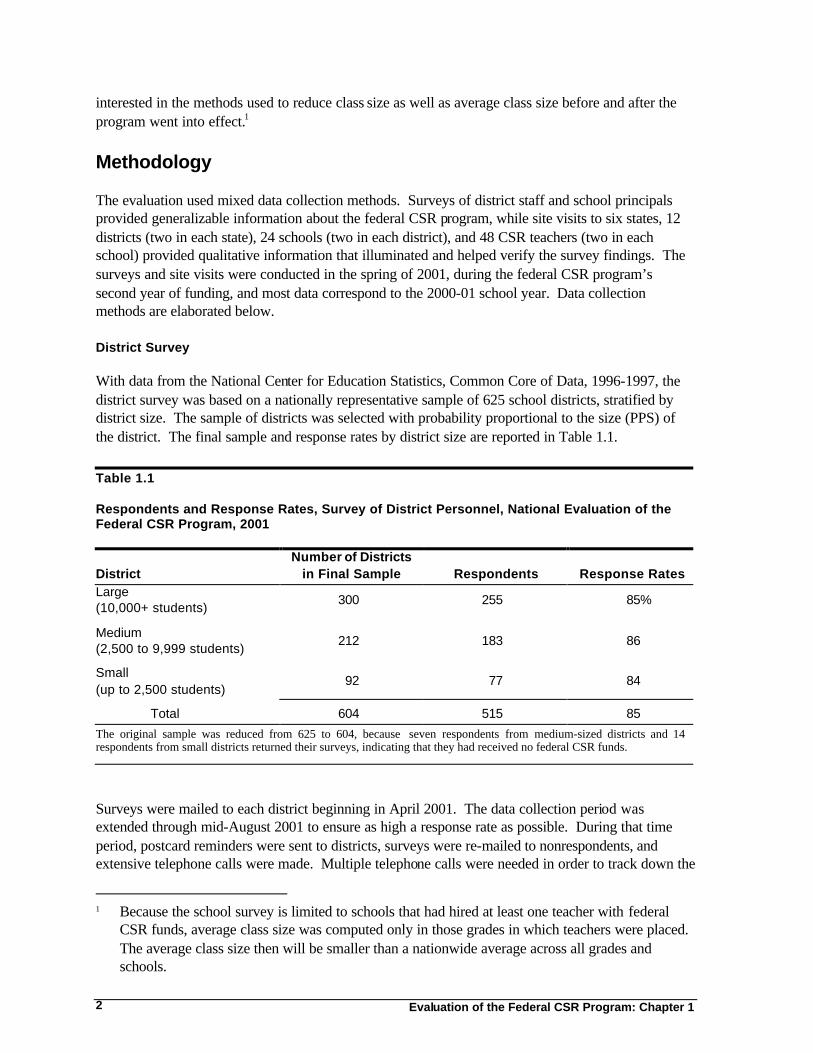
With data from the National Center for Education Statistics, Common Core of Data, 1996-1997, the district survey was based on a nationally representative sample of 625 school districts, stratified by district size. The sample of districts was selected with probability proportional to the size (PPS) of the district. The final sample and response rates by district size are reported in Table 1.1.
Table 1.1 Respondents and Response Rates, Survey of District Personnel, National Evaluation of the Federal CSR Program, 2001
District Number of Districts
in Final Sample Respondents Response Rates Large (10,000+ students)
300 255 85%
Medium (2,500 to 9,999 students)
212 183 86
Small (up to 2,500 students)
92 77 84
Total 604 515 85
The original sample was reduced from 625 to 604, because seven respondents from medium-sized districts and 14 respondents from small districts returned their surveys, indicating that they had received no federal CSR funds.
Surveys were mailed to each district beginning in April 2001. The data collection period was extended through mid-August 2001 to ensure as high a response rate as possible. During that time period, postcard reminders were sent to districts, surveys were re-mailed to nonrespondents, and extensive telephone calls were made. Multiple telephone calls were needed in order to track down the
1 Because the school survey is limited to schools that had hired at least one teacher with federal
CSR funds, average class size was computed only in those grades in which teachers were placed. The average class size then will be smaller than a nationwide average across all grades and schools.
Evaluation of the Federal CSR Program: Chapter 1 3
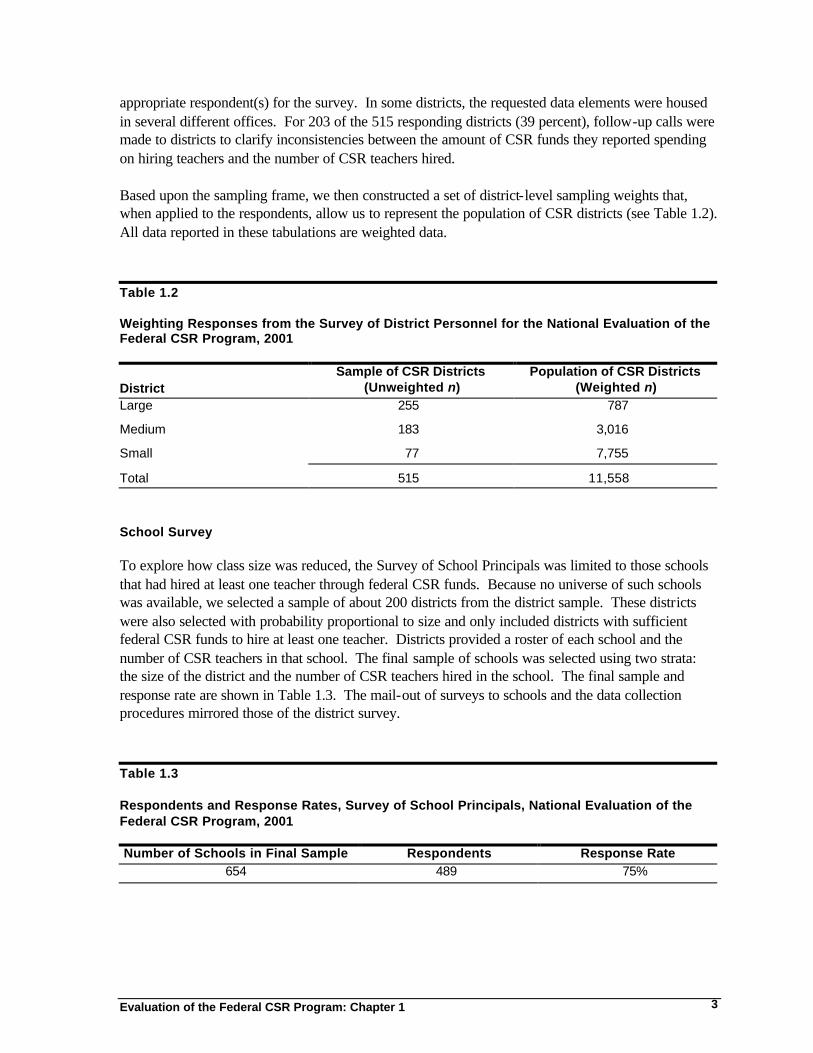
appropriate respondent(s) for the survey. In some districts, the requested data elements were housed in several different offices. For 203 of the 515 responding districts (39 percent), follow-up calls were made to districts to clarify inconsistencies between the amount of CSR funds they reported spending on hiring teachers and the number of CSR teachers hired. Based upon the sampling frame, we then constructed a set of district-level sampling weights that, when applied to the respondents, allow us to represent the population of CSR districts (see Table 1.2). All data reported in these tabulations are weighted data.
Table 1.2 Weighting Responses from the Survey of District Personnel for the National Evaluation of the Federal CSR Program, 2001
District Sample of CSR Districts
(Unweighted n) Population of CSR Districts
(Weighted n) Large 255 787
Medium 183 3,016
Small 77 7,755
Total 515 11,558 School Survey
To explore how class size was reduced, the Survey of School Principals was limited to those schools that had hired at least one teacher through federal CSR funds. Because no universe of such schools was available, we selected a sample of about 200 districts from the district sample. These districts were also selected with probability proportional to size and only included districts with sufficient federal CSR funds to hire at least one teacher. Districts provided a roster of each school and the number of CSR teachers in that school. The final sample of schools was selected using two strata: the size of the district and the number of CSR teachers hired in the school. The final sample and response rate are shown in Table 1.3. The mail-out of surveys to schools and the data collection procedures mirrored those of the district survey. Table 1.3 Respondents and Response Rates, Survey of School Principals, National Evaluation of the Federal CSR Program, 2001 Number of Schools in Final Sample Respondents Response Rate
654 489 75%
Evaluation of the Federal CSR Program: Chapter 1 4
Site Visits
Six states were selected for on-site case studies. They represented a range in federal CSR funds, state efforts to reduce class size, and regional location. We deliberately excluded from the site visits states that were already involved in other reduced class size evaluation efforts (e.g., California, Tennessee, and Wisconsin) to minimize their respondent burden. Within each state, we selected two districts. We chose very large enrollment districts because most federal CSR funds are distributed to urban districts, and because urban districts would be more likely to face the greatest challenges in implementing this program, given existing teacher shortages and limited facilities. Finally, we selected two Title I schools within each district that were participating in CSR. Neither states nor districts are named in this report order to protect their confidentiality. Within each state, we conducted in-person individual interviews with the state superintendent of public instruction (or designee), coordinator of the federal CSR program, human resources staff, and research and evaluation staff. At the district level, we interviewed the superintendent (or designee), the coordinator of the federal CSR program, other district staff with whom the CSR program was coordinated, human resources staff, and others as appropriate. Within each school visited, we interviewed the principal, the Title I coordinator for the school, the lead teacher for the grade with class-size reduction, and at least two CSR teachers, whose classrooms we observed for a two-hour block.
Research on Class-Size Reduction
Support for the federal CSR program was based on research that found that small classes could have a positive influence on student achievement. For example, research from Tennessee’s Project STAR (Student-Teacher Achievement Ratio) found that students who had been randomly assigned to small classes (13 to 17 students) in grades K-3 outperformed their peers in regular classes (22 to 25 students) and in regular classes that also had aides on standardized and curriculum-based tests (Achilles et al., 1996). Additionally, by eighth grade, those students who had been placed in small classes through Project STAR were still outperforming students who had been placed in regular classes or regular-plus-aide classes in K-3 (Finn, 1998; Nye, 1995). The Wisconsin Student Achievement Guarantee in Education (SAGE) study led to conclusions similar to the STAR study—students in SAGE classrooms (12 to 15 students) achieved higher scores than students in comparison classrooms (21 to 25 students) (Molnar et al., 1999). The SAGE study also begins to shed light on how instructional practices change in the smaller classes. In interviews and surveys, teachers reported that they had more knowledge about students, instructional time allowing them to cover more content and individualize instruction, and fewer discipline problems. These changes in their classrooms increased job satisfaction, reduced the stress of teaching too many students, and allowed teachers to work with other teachers in more effective ways. Other researchers, however, have argued that the external validity of the Tennessee experiment (STAR) has not been established sufficiently to warrant generalizing the results across different populations and settings in the United States. These critics claim that further randomized experiments are needed (Hanushek, 1999). They also claim that class-size reduction in the context of teacher shortages can reduce teacher quality and effectiveness and can shrink or eliminate any benefits of having fewer students in the classroom (Jepsen & Rivkin, 2001). Additionally, researchers suggest
Evaluation of the Federal CSR Program: Chapter 1 5
that most teachers do not change their instructional practices when class size is reduced, and “only teachers whose instructional methods benefit from smaller classes—e.g., those who work with small groups, those who depend on personal relationships with students, those who emphasize hands-on projects—are more productive with smaller than with larger classes” (Ehrenberg, Brewer, Gamoran and Willms, 2001). Findings from California’s class-size reduction initiative confirm some of these critics’ concerns. Under a law passed in 1996, the state provided districts with $650 per student for each K-3 classroom with 20 or fewer students. An evaluation of this class-size reduction initiative found that class-size reduction was associated with declines in teacher qualifications and inequitable distribution of credentialed teachers; i.e., as districts reduced class size in K-3 classrooms, they hired more teachers without full credentials, most of whom were hired by schools serving the most disadvantaged students. Additionally, although parents said they liked the reduced size classes, and teachers reported giving students more individualized attention in these classes, teachers did not report covering more curriculum as a result of small class size, nor did the evaluation link reduced class size to changes in student achievement (Bohrnstedt and Stecher, 2002).
Findings from the Federal Evaluation
Distribution and Uses of Funds
• In the first year, federal CSR funds were distributed to states based upon the greater of a state’s share of funds under Part A of Title I or the Eisenhower Professional Development State Grants program. In years 2 and 3, state distributions were proportional to the year 1 distribution. Within states, all funds were distributed to school districts based on the number of children in poverty (80 percent) and school enrollment (20 percent).
• States and districts received their funding allocations under the law, and spent it
according to the mandated guidelines. In 2000-2001 for example, teacher salaries made up 84 percent of the funding, with 14 percent for professional development and one percent each for administrative procedures and new teacher training and testing.
• In 2000-01, about 25,000 teachers were hired with federal CSR funds. Ninety-four
percent were regular classroom teachers rather than specialist teachers. Three percent were reading specia lists and 2 percent were in other categories. Schools with the largest class sizes in their district were typically the recipients of the federally funded CSR teachers. Sixty percent of schools hired one teacher, 30 percent hired two teachers, and 10 percent hired more than two teachers.
• In keeping with the law’s explicit intent, two-thirds of all districts coordinated federal
CSR funding with other funding sources, including funds from Title I of the Elementary and Secondary Education Act and Title II of the Higher Education Act, as well as state and local CSR initiatives. When districts received state or local CSR funds, those funds were typically five times the size of the federal CSR allocation but often came with more strings attached, such as restricting funding to teachers in separate classrooms.
Evaluation of the Federal CSR Program: Chapter 1 6
• Although only 1 percent of the teachers hired with federal CSR funds were special education teachers, 16 percent of districts reported coordinating their CSR program with the Individuals with Disabilities Education Act (IDEA). The study did not explore how these programs were coordinated. In addition, 69 percent of the districts offering professional development with CSR funds reported including special education teachers in this professional development. It is not clear why the professional development was not offered to special education teachers in every district.
• The single largest funding issue was the large carryover of first year funds into a second
year of activities, not unexpected given the very short timeline to hire teachers and the uncertainty of second year funding. More than 60 percent of large districts, and 34 percent of medium and small districts, carried over funds from 1999-2000 to 2000-01. Some made a strategic decision in 1999-2000 to carry funds over, whereas others either did not have enough time to hire teachers or could not find qualified teachers. Some $150 million were carried over to the 2000-01 school year.
Implementation
• Recruiting and hiring fully certified teachers was a problem in almost one-third of large districts, and in 10 percent of smaller districts. Many large districts were engaged in large-scale recruitment initiatives (often with different funding sources), but a lack of credentialed applicants was a major problem (and more of a problem than non-competi-tive salaries or single year funding). In 40 percent of all districts, over 50 percent of the new hires were novice teachers.
• Although permitted to use up to 15 percent of federal CSR funds in 1999-2000 for
professional development, and up to 25 percent in 2000-01, districts spent an average of only 13 percent in 1999-2000 and 14 percent in 2000-01. Moreover, only 39 percent of districts chose to spend CSR funds on professional development activities. According to district personnel, the professional development offered typically focused on reading (80 percent of districts) and math (57 percent) rather than on instructional strategies to optimize the use of small class size (38 percent). In lieu of professional development, districts used funds to hire teachers to reduce class size.
• Just as large districts had trouble finding qualified teachers, they also were more likely
than smaller districts to have shortages of space. Almost 60 percent of large distric ts reported facilities problems, typically not enough additional rooms and insufficient funds to modify existing facilities. In response, districts promoted team teaching or converted nonclassroom space (other instructional rooms like gymnasiums, or noninstructional rooms like teachers’ lounges) into classrooms. Overall, 42 percent of the schools that hired CSR teachers did not place them in self-contained classrooms.
• CSR implementation has been affected by other administrative and resource-related
issues: the lack of state administrative funds resulted in minimal state involvement in the program; districts were unable to hire teachers due to the late notification of the availability of funds; district administrators were wary about the uncertainty of the program’s future; and allocations for rural districts were too small to create a meaningful program.
Evaluation of the Federal CSR Program: Chapter 1 7
• Based upon observations in 48 CSR classrooms in 24 schools, some teachers took
advantage of smaller classes to tailor instruction and maximize one-on-one time with students, giving students more time and attention. At the same time, other CSR classes functioned like non-CSR classes, with desks in rows and the teacher lecturing from the front of the room.
Changes in Class Size
• In the schools and grades where federally funded CSR teachers were placed, average class size decreased with the advent of federal CSR funds, typically by one or two students. After the federal CSR program, average class size overall ranged from 18 students per class in kindergarten, to 20 in grade 1 and 21 students per class in grades 2 and 3. There are two reasons for the modest reduction in average class size. Many schools (44 percent) did not assign the CSR teacher to a separate classroom, but rather assigned the teacher to special subjects or team teaching. Even in schools where teachers were assigned to their own classrooms, 52 percent had simultaneous increases in enrollment that mitigated class size reduction. Overall, 73 percent of schools either did not assign teachers to separate classes or had enrollment increases that reduced CSR’s impact.
• In grade 1, the largest decrease in the average class size in a single school was nine
students per classroom; in grade 2, the largest decrease was 10 students per classroom, and in grade 3, the largest decrease was 12 students per classroom.
• To reduce class size, 57 percent of schools placed CSR teachers in separate classrooms,
24 percent hired teachers to reduce class size in particular subjects (e.g., reading or mathematics). One in six schools (17 percent) created additional sections in priority subjects, and about 10 percent used team teaching.
• Schools most often used federal CSR funds to reduce class size in grades 1-3. Based
upon our case studies, grade 1 was targeted to advance early literacy goals, whereas grade 3 was targeted to prepare students for state-mandated grade 4 assessments.
Organization of the Final Report
The report’s structure reflects the four sets of evaluation questions. Chapter 2 addresses the distribution and uses of funds. Chapter 3 addresses recruitment and hiring of teachers, professional development, and resources for implementation. Last, Chapter 4 examines the impact of the federal CSR program on class size. Appendix A includes copies of the district and school surveys.

8
9
Chapter 2 Allocation of Federal Class-Size Reduction Funds
Overview
The CSR program was intended to enable schools to hire new classroom teachers beginning in the 1999-2000 school year and for the following two years. Over the course of those years, a total of about $4 billion was allotted to states. This chapter sets the stage for CSR implementation by addressing the descriptive questions about the distribution and uses of funds, the number of teachers hired, and coordination of funds with other funding sources. The nuances of implementation are analyzed in Chapter 3. The multiple evaluation questions related to the uses of federal CSR funds include:
• How were federal CSR funds distributed and used (e.g., teachers’ salarie s, professional development, administration, and recruitment)?
• How many teachers were hired with federal CSR funds?
• How did districts select schools to receive CSR teachers?
• To what extent did districts use waivers and carry over federal CSR funds?
• To what extent were federal CSR funds coordinated with other federal, state, and local reform efforts?
The data for this chapter come primarily from the national survey of school district personnel, conducted in the spring of 2001. Site visits to large districts are used to elaborate on the survey findings.
Major Findings
• In 2000-01, teacher salaries took up 84 percent of district CSR funding, with 14 percent for professional development, and 1 percent each for administrative procedures and new teacher training and testing. These spending allocations were in keeping with federal program guidelines that required districts to use a minimum of 82 percent of funding for teacher salaries, recruiting and training teachers.
• About 25,000 teachers were hired with federal CSR funds in the 2000-01 school year.
Ninety-four percent were regular classroom teachers, 3 percent were reading specialists, 1 percent were special education teachers, and 2 percent were in other categories.
• Schools with the largest class sizes were most often the recipients of the federally funded
CSR teachers. Sixty percent of schools hired one teacher, 30 percent hired two teachers, and 10 percent hired more than two teachers.
• About one-fifth of small districts requested waivers from ED in 1999-2000 for increased
spending flexibility, nearly three times the rate of such requests from large districts.
Evaluation of the Federal CSR Program: Chapter 2 10
Small districts tended to ask for waivers from the limit on professional development spending and from the requirement to form consortia with other districts to receive sufficient funding to hire a teacher. Large districts generally asked for waivers to reduce class size in grades other than the early elementary grades.
• More than 60 percent of large districts, but only 34 percent of medium and small districts,
carried over funds from 1999-2000 to 2000-01. Some made a strategic decision to carry funds over, whereas others either did not have enough time to hire teachers or could not find qualified teachers.
• Two-thirds of all districts coordinated federal CSR funding with other funding sources,
including funds from Title I of the Elementary and Secondary Education Act and Title II of the Higher Education Act, as well as state and local CSR initiatives. When districts received state or local CSR funds, those funds were typically five times the size of the federal CSR allocation but often came with more strings attached, such as funding only for teachers in separate classrooms.
Distribution and Uses of Federal CSR Funds
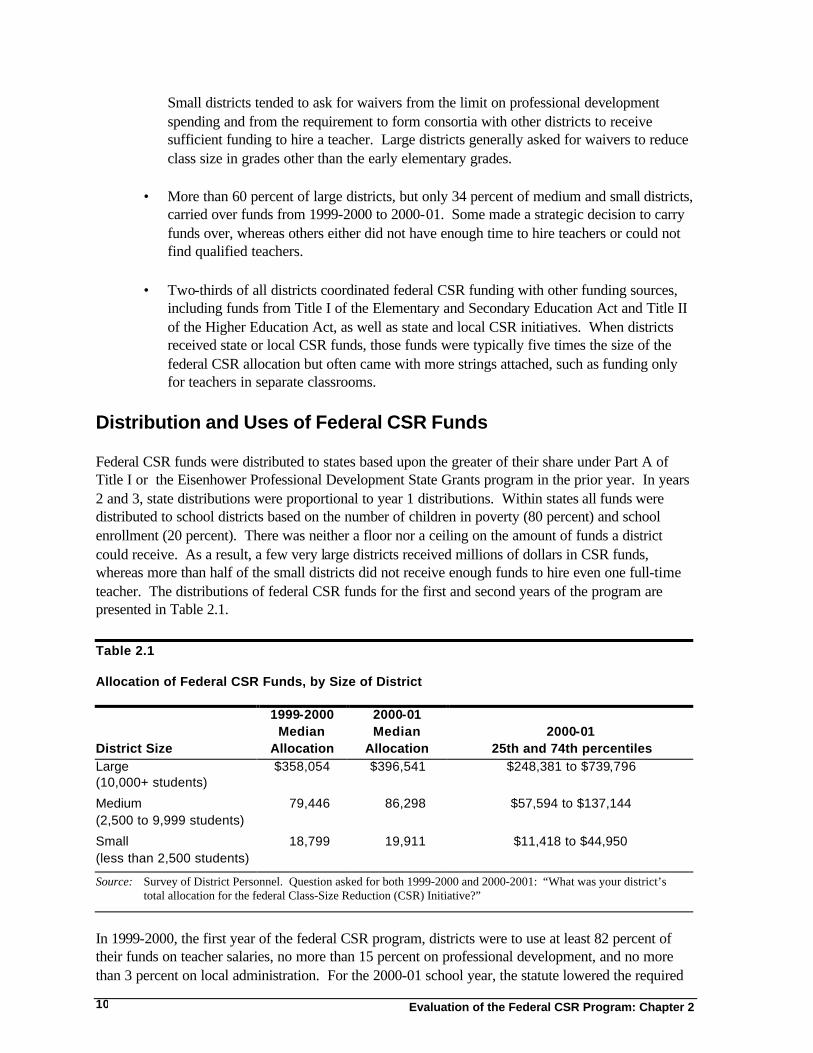
Federal CSR funds were distributed to states based upon the greater of their share under Part A of Title I or the Eisenhower Professional Development State Grants program in the prior year. In years 2 and 3, state distributions were proportional to year 1 distributions. Within states all funds were distributed to school districts based on the number of children in poverty (80 percent) and school enrollment (20 percent). There was neither a floor nor a ceiling on the amount of funds a district could receive. As a result, a few very large districts received millions of dollars in CSR funds, whereas more than half of the small districts did not receive enough funds to hire even one full-time teacher. The distributions of federal CSR funds for the first and second years of the program are presented in Table 2.1. Table 2.1 Allocation of Federal CSR Funds, by Size of District
District Size
1999-2000 Median
Allocation
2000-01 Median
Allocation 2000-01
25th and 74th percentiles Large (10,000+ students)
$358,054 $396,541 $248,381 to $739,796
Medium (2,500 to 9,999 students)
79,446 86,298 $57,594 to $137,144
Small (less than 2,500 students)
18,799 19,911 $11,418 to $44,950
Source: Survey of District Personnel. Question asked for both 1999-2000 and 2000-2001: “What was your district’s total allocation for the federal Class-Size Reduction (CSR) Initiative?”
In 1999-2000, the first year of the federal CSR program, districts were to use at least 82 percent of their funds on teacher salaries, no more than 15 percent on professional development, and no more than 3 percent on local administration. For the 2000-01 school year, the statute lowered the required
Evaluation of the Federal CSR Program: Chapter 2 11
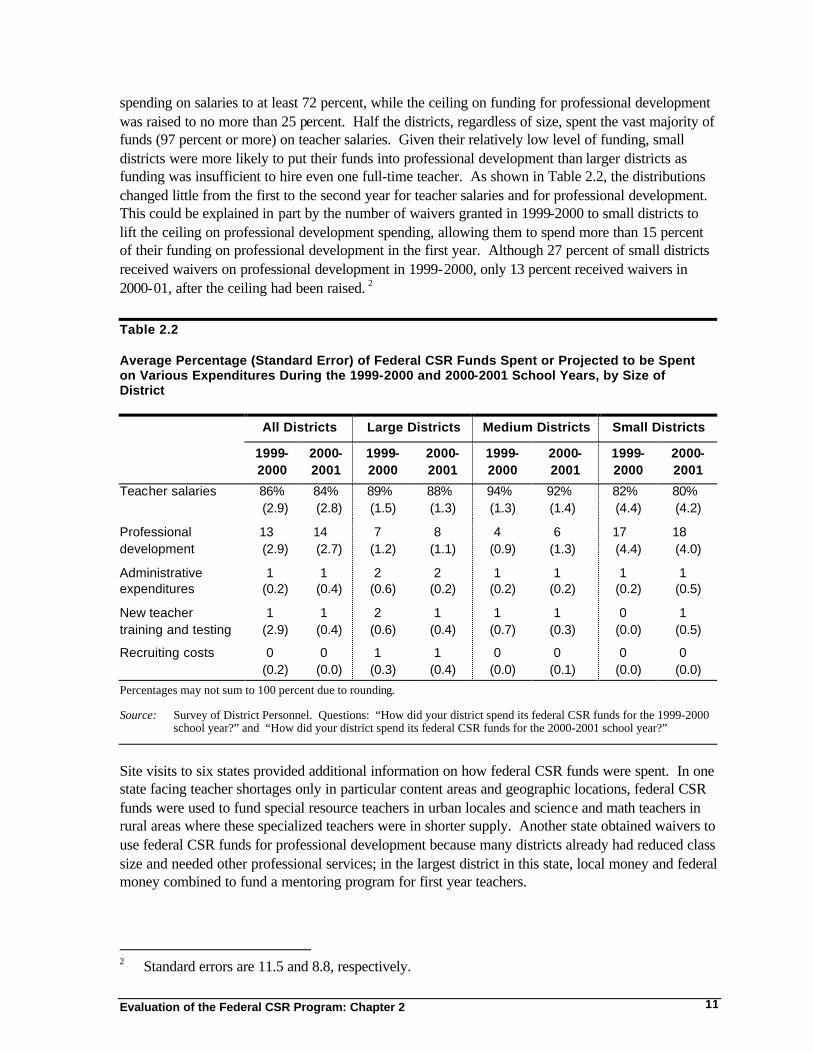
spending on salaries to at least 72 percent, while the ceiling on funding for professional development was raised to no more than 25 percent. Half the districts, regardless of size, spent the vast majority of funds (97 percent or more) on teacher salaries. Given their relatively low level of funding, small districts were more likely to put their funds into professional development than larger districts as funding was insufficient to hire even one full-time teacher. As shown in Table 2.2, the distributions changed little from the first to the second year for teacher salaries and for professional development. This could be explained in part by the number of waivers granted in 1999-2000 to small districts to lift the ceiling on professional development spending, allowing them to spend more than 15 percent of their funding on professional development in the first year. Although 27 percent of small districts received waivers on professional development in 1999-2000, only 13 percent received waivers in 2000-01, after the ceiling had been raised. 2
Table 2.2 Average Percentage (Standard Error) of Federal CSR Funds Spent or Projected to be Spent on Various Expenditures During the 1999-2000 and 2000-2001 School Years, by Size of District
All Districts Large Districts Medium Districts Small Districts
1999-2000
2000- 2001
1999- 2000
2000- 2001
1999- 2000
2000-2001
1999-2000
2000- 2001
Teacher salaries 86% (2.9)
84% (2.8)
89% (1.5)
88% (1.3)
94% (1.3)
92% (1.4)
82% (4.4)
80% (4.2)
Professional development
13 (2.9)
14 (2.7)
7 (1.2)
8 (1.1)
4 (0.9)
6 (1.3)
17 (4.4)
18 (4.0)
Administrative expenditures
1 (0.2)
1 (0.4)
2 (0.6)
2 (0.2)
1 (0.2)
1 (0.2)
1 (0.2)
1 (0.5)
New teacher training and testing
1 (2.9)
1 (0.4)
2 (0.6)
1 (0.4)
1 (0.7)
1 (0.3)
0 (0.0)
1 (0.5)
Recruiting costs 0 (0.2)
0 (0.0)
1 (0.3)
1 (0.4)
0 (0.0)
0 (0.1)
0 (0.0)
0 (0.0)
Percentages may not sum to 100 percent due to rounding.
Source: Survey of District Personnel. Questions: “How did your district spend its federal CSR funds for the 1999-2000 school year?” and “How did your district spend its federal CSR funds for the 2000-2001 school year?”
Site visits to six states provided additional information on how federal CSR funds were spent. In one state facing teacher shortages only in particular content areas and geographic locations, federal CSR funds were used to fund special resource teachers in urban locales and science and math teachers in rural areas where these specialized teachers were in shorter supply. Another state obtained waivers to use federal CSR funds for professional development because many districts already had reduced class size and needed other professional services; in the largest district in this state, local money and federal money combined to fund a mentoring program for first year teachers.
2 Standard errors are 11.5 and 8.8, respectively.
Evaluation of the Federal CSR Program: Chapter 2 12
Teachers Hired with Federal CSR Funds
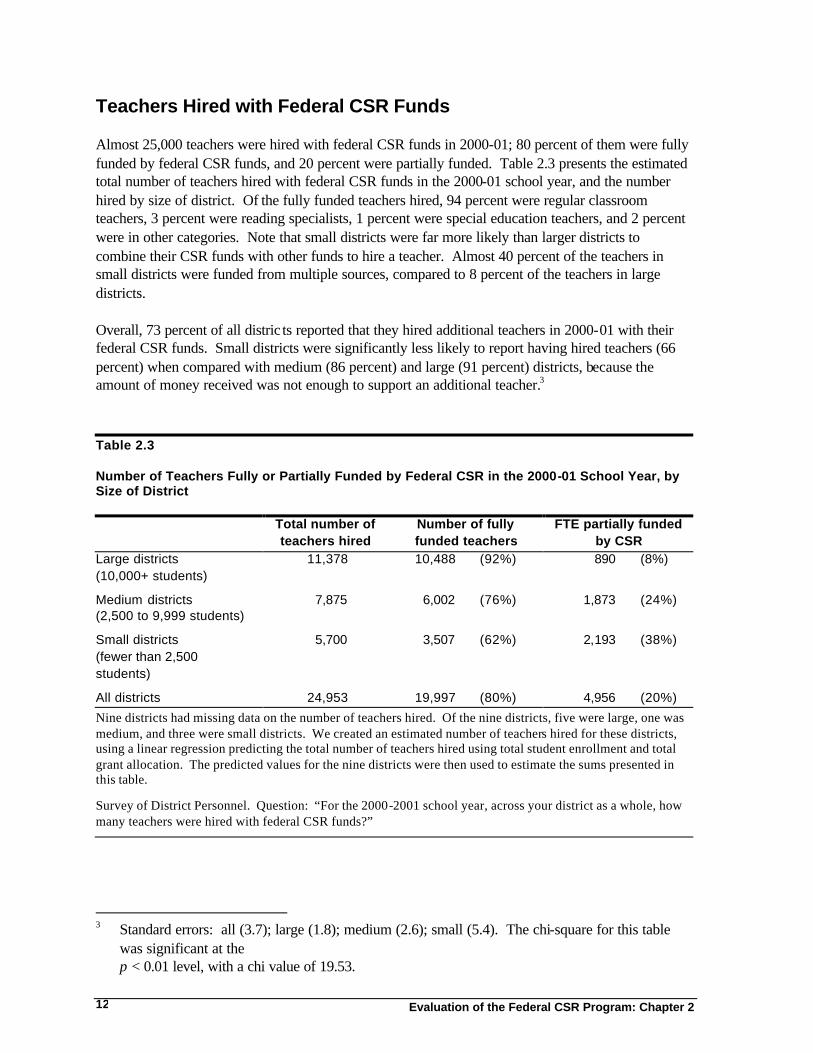
Almost 25,000 teachers were hired with federal CSR funds in 2000-01; 80 percent of them were fully funded by federal CSR funds, and 20 percent were partially funded. Table 2.3 presents the estimated total number of teachers hired with federal CSR funds in the 2000-01 school year, and the number hired by size of district. Of the fully funded teachers hired, 94 percent were regular classroom teachers, 3 percent were reading specialists, 1 percent were special education teachers, and 2 percent were in other categories. Note that small districts were far more likely than larger districts to combine their CSR funds with other funds to hire a teacher. Almost 40 percent of the teachers in small districts were funded from multiple sources, compared to 8 percent of the teachers in large districts. Overall, 73 percent of all distric ts reported that they hired additional teachers in 2000-01 with their federal CSR funds. Small districts were significantly less likely to report having hired teachers (66 percent) when compared with medium (86 percent) and large (91 percent) districts, because the amount of money received was not enough to support an additional teacher.3 Table 2.3 Number of Teachers Fully or Partially Funded by Federal CSR in the 2000-01 School Year, by Size of District
Total number of teachers hired
Number of fully funded teachers
FTE partially funded by CSR
Large districts (10,000+ students)
11,378 10,488 (92%) 890 (8%)
Medium districts (2,500 to 9,999 students)
7,875 6,002 (76%) 1,873 (24%)
Small districts (fewer than 2,500 students)
5,700 3,507 (62%) 2,193 (38%)
All districts 24,953 19,997 (80%) 4,956 (20%)
Nine districts had missing data on the number of teachers hired. Of the nine districts, five were large, one was medium, and three were small districts. We created an estimated number of teachers hired for these districts, using a linear regression predicting the total number of teachers hired using total student enrollment and total grant allocation. The predicted values for the nine districts were then used to estimate the sums presented in this table.
Survey of District Personnel. Question: “For the 2000-2001 school year, across your district as a whole, how many teachers were hired with federal CSR funds?”
3 Standard errors: all (3.7); large (1.8); medium (2.6); small (5.4). The chi-square for this table
was significant at the p < 0.01 level, with a chi value of 19.53.
Evaluation of the Federal CSR Program: Chapter 2 13
How Districts Chose Schools for CSR Teachers
District Decision Makers
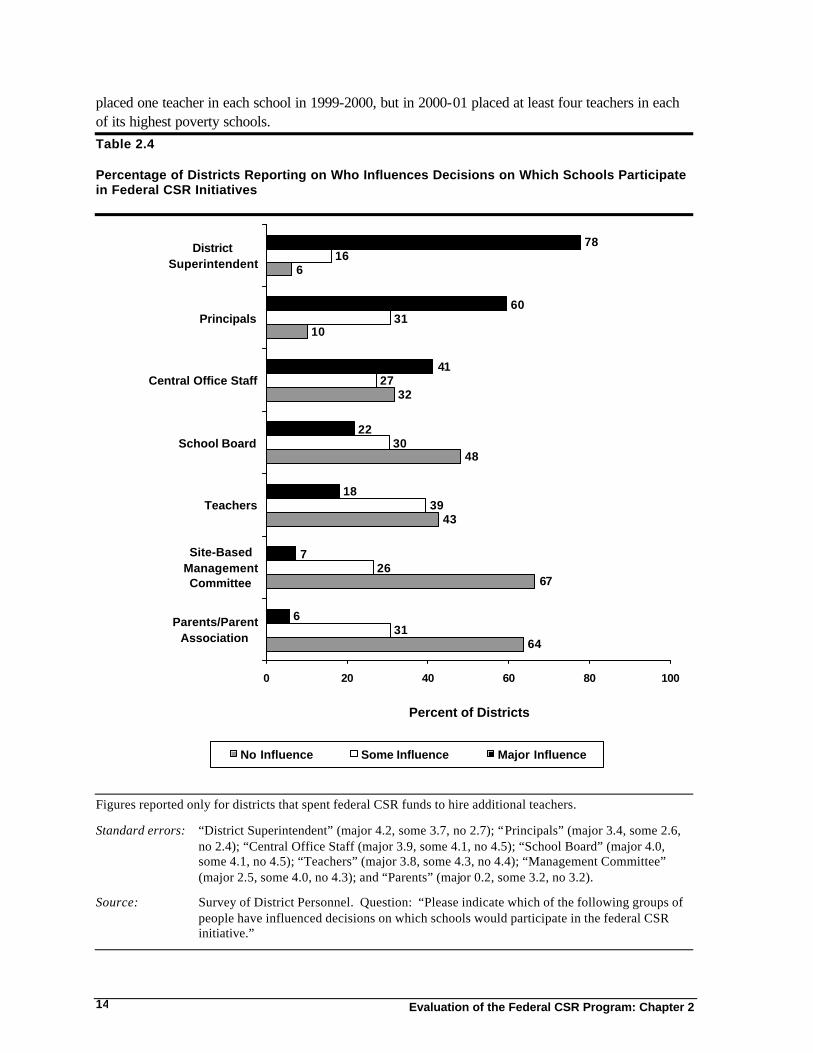
To receive federal CSR funds, districts applied to their state as part of their federal consolidated Title VI applications and described how they measure class size, how the funds would be spent, the number of teachers to be hired, and current class size, among other items (U.S. Department of Education, 2000, pp. 19-21). In making decisions about how to allocate funds within districts, 78 percent of districts reported superintendents as a major influence in these decisions, and 60 percent reported principals as a major influence (Table 2.4). There was little variation by the size of the district in who exercised influence, though larger districts were more likely to have more layers of management than smaller ones. The overwhelming majority of districts (98 percent4) also reported that districts selected which schools received additional CSR teachers in the 2000-01 school year, rather than having schools compete for CSR funds or using other methods. Criteria for Selecting Schools
The federal guidance suggested criteria for school selection:
…[Districts] might find that the best results come from targeting the funds to the poorest schools, the lowest performing schools, or to the schools with the largest classes. As indicated in the “Research” section [of the Guidance], the benefits of class-size reduction are greatest for disadvantaged and minority students, and the intervention seems to be most effective when implemented in the child’s first school year (U.S. Department of Education, 2000, p. 25).
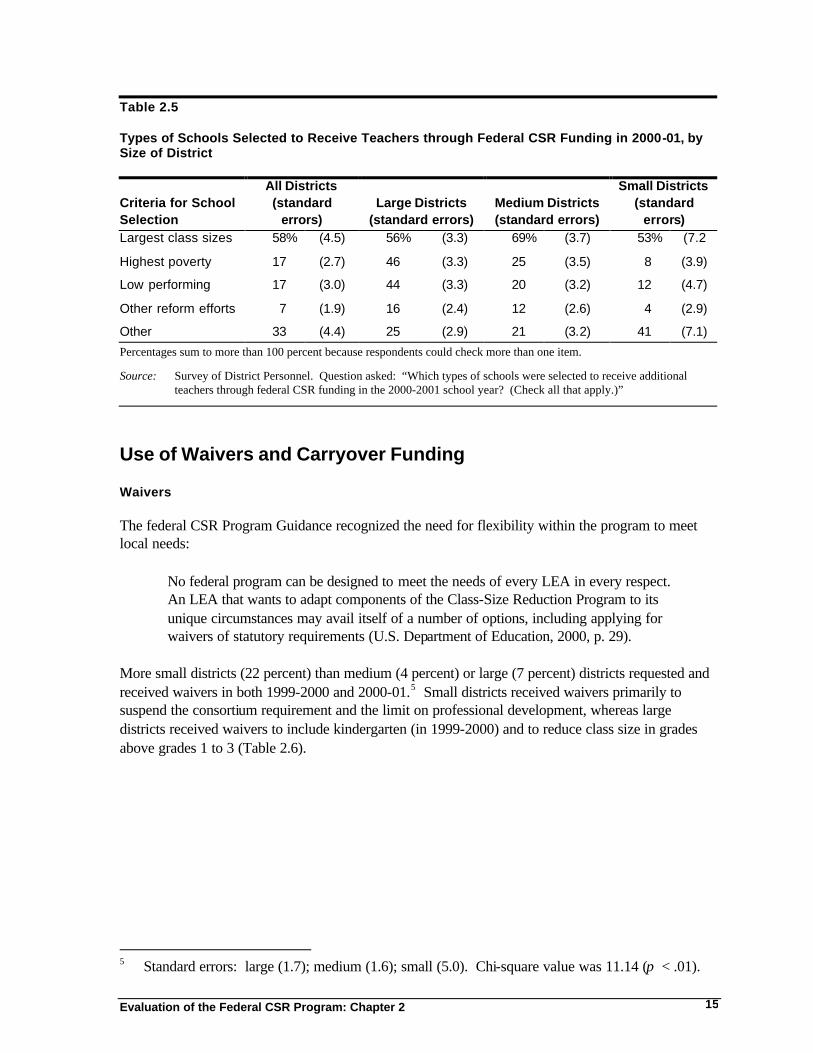
Across all districts, regardless of size, most districts reported choosing schools that had the largest classes (Table 2.5). Large districts also chose schools that were low performing or high poverty, whereas medium and small districts were less likely to use either of these criteria. Across the schools selected to receive CSR-funded teachers, 60 percent hired one teacher, 30 percent hired two, and 10 percent of the schools hired three or more federally funded CSR teachers. Site visits also confirmed (in a limited number of districts or states) that most schools had hired only one teacher through federal CSR funds. Among the very large districts we visited, one reported that they had so many schools meeting poverty, achievement, and class-size criteria that they incorporated “other” more subjective selection criteria like “a receptive principal” or an integrated reform plan into their decision-making process. Another district, with more eligible schools than available funds, targeted schools with large proportions of limited English proficient students. A third district placed a priority on the largest and poorest performing schools; one teacher was placed in each of the 23 schools and two teachers in the lowest performing, highest poverty school for a total of 25 new teachers. Yet another large district
4 Standard error is 1.3.
Evaluation of the Federal CSR Program: Chapter 2 14
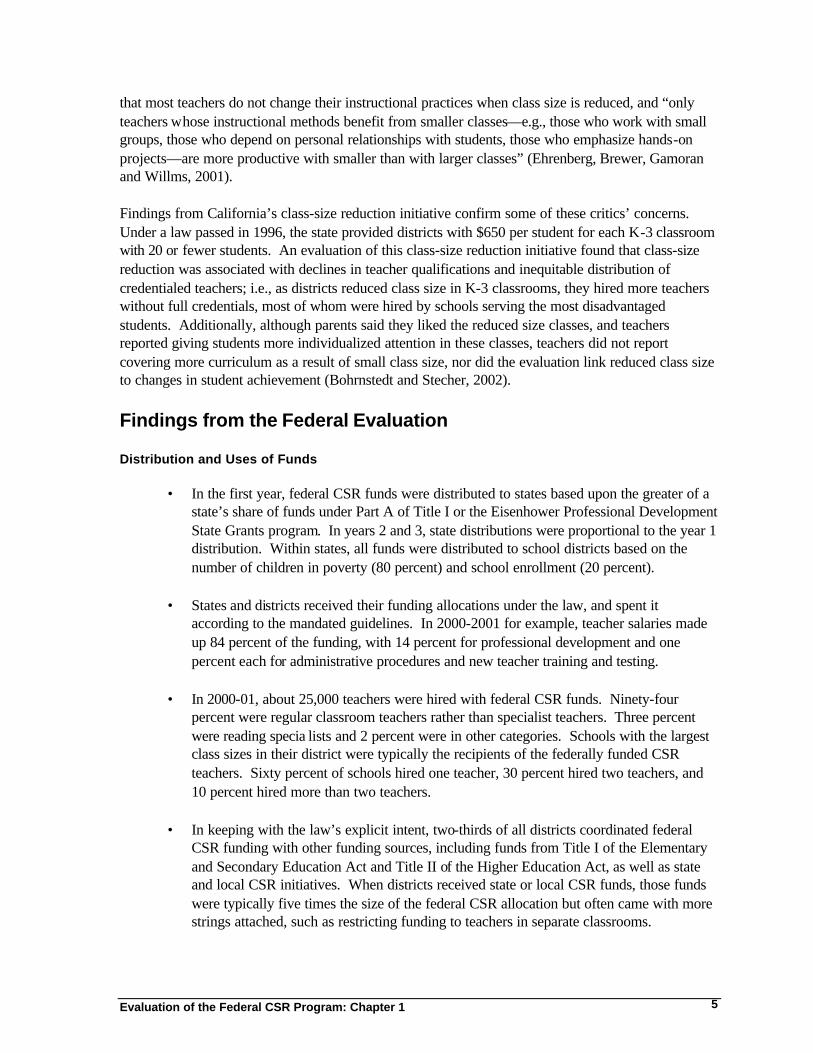
placed one teacher in each school in 1999-2000, but in 2000-01 placed at least four teachers in each of its highest poverty schools. Table 2.4 Percentage of Districts Reporting on Who Influences Decisions on Which Schools Participate in Federal CSR Initiatives
64
67
43
48
32
10
6
31
26
39
30
27
31
16
6
7
18
22
41
60
78
0 20 40 60 80 100
Parents/ParentAssociation
Site-BasedManagementCommittee
Teachers
School Board
Central Office Staff
Principals
DistrictSuperintendent
Percent of Districts
No Influence Some Influence Major Influence
Figures reported only for districts that spent federal CSR funds to hire additional teachers.
Standard errors: “District Superintendent” (major 4.2, some 3.7, no 2.7); “Principals” (major 3.4, some 2.6, no 2.4); “Central Office Staff (major 3.9, some 4.1, no 4.5); “School Board” (major 4.0, some 4.1, no 4.5); “Teachers” (major 3.8, some 4.3, no 4.4); “Management Committee” (major 2.5, some 4.0, no 4.3); and “Parents” (major 0.2, some 3.2, no 3.2).
Source: Survey of District Personnel. Question: “Please indicate which of the following groups of people have influenced decisions on which schools would participate in the federal CSR initiative.”
Evaluation of the Federal CSR Program: Chapter 2 15
Table 2.5 Types of Schools Selected to Receive Teachers through Federal CSR Funding in 2000-01, by Size of District
Criteria for School Selection
All Districts (standard
errors) Large Districts
(standard errors) Medium Districts (standard errors)
Small Districts (standard
errors) Largest class sizes 58% (4.5) 56% (3.3) 69% (3.7) 53% (7.2
Highest poverty 17 (2.7) 46 (3.3) 25 (3.5) 8 (3.9)
Low performing 17 (3.0) 44 (3.3) 20 (3.2) 12 (4.7)
Other reform efforts 7 (1.9) 16 (2.4) 12 (2.6) 4 (2.9)
Other 33 (4.4) 25 (2.9) 21 (3.2) 41 (7.1)
Percentages sum to more than 100 percent because respondents could check more than one item.
Source: Survey of District Personnel. Question asked: “Which types of schools were selected to receive additional teachers through federal CSR funding in the 2000-2001 school year? (Check all that apply.)”
Use of Waivers and Carryover Funding
Waivers
The federal CSR Program Guidance recognized the need for flexibility within the program to meet local needs:
No federal program can be designed to meet the needs of every LEA in every respect. An LEA that wants to adapt components of the Class-Size Reduction Program to its unique circumstances may avail itself of a number of options, including applying for waivers of statutory requirements (U.S. Department of Education, 2000, p. 29).
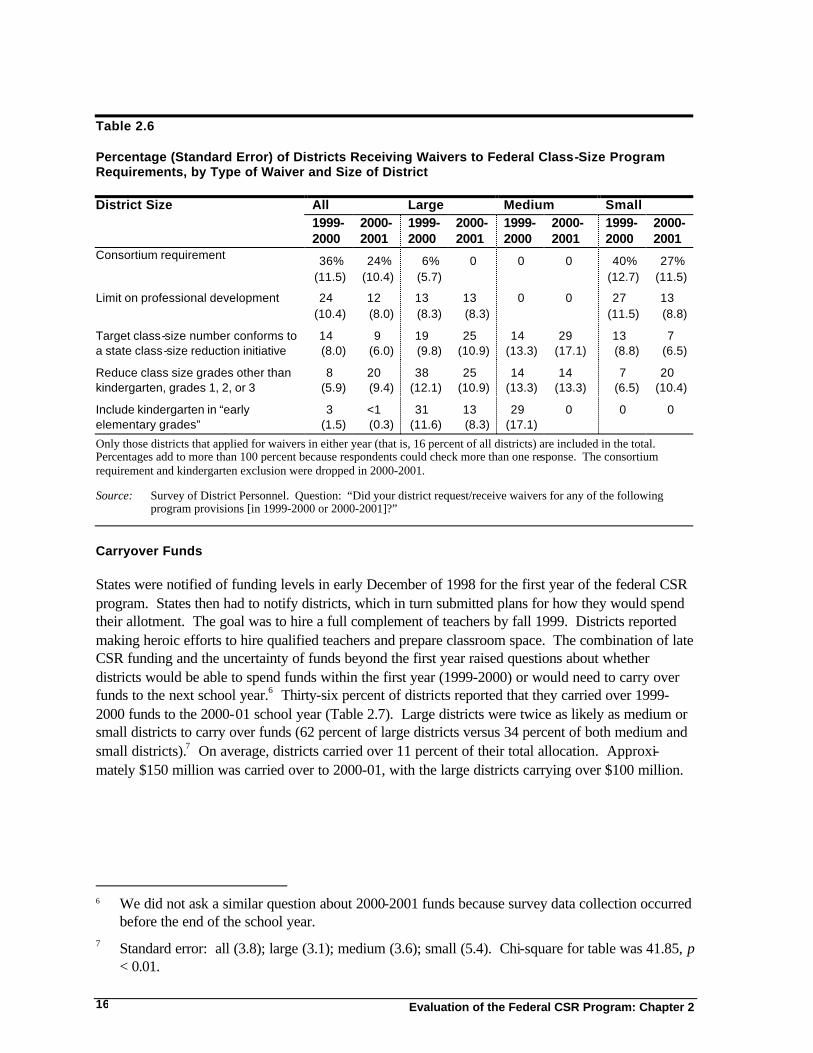
More small districts (22 percent) than medium (4 percent) or large (7 percent) districts requested and received waivers in both 1999-2000 and 2000-01.5 Small districts received waivers primarily to suspend the consortium requirement and the limit on professional development, whereas large districts received waivers to include kindergarten (in 1999-2000) and to reduce class size in grades above grades 1 to 3 (Table 2.6).
5 Standard errors: large (1.7); medium (1.6); small (5.0). Chi-square value was 11.14 (p < .01).
Evaluation of the Federal CSR Program: Chapter 2 16
Table 2.6 Percentage (Standard Error) of Districts Receiving Waivers to Federal Class-Size Program Requirements, by Type of Waiver and Size of District District Size All Large Medium Small 1999-
2000 2000- 2001
1999- 2000
2000- 2001
1999-2000
2000-2001
1999-2000
2000- 2001
Consortium requirement 36% (11.5)
24% (10.4)
6% (5.7)
0 0 0 40% (12.7)
27% (11.5)
Limit on professional development 24 (10.4)
12 (8.0)
13 (8.3)
13 (8.3)
0 0 27 (11.5)
13 (8.8)
Target class-size number conforms to a state class-size reduction initiative
14 (8.0)
9 (6.0)
19 (9.8)
25 (10.9)
14 (13.3)
29 (17.1)
13 (8.8)
7 (6.5)
Reduce class size grades other than kindergarten, grades 1, 2, or 3
8 (5.9)
20 (9.4)
38 (12.1)
25 (10.9)
14 (13.3)
14 (13.3)
7 (6.5)
20 (10.4)
Include kindergarten in “early elementary grades”
3 (1.5)
<1 (0.3)
31 (11.6)
13 (8.3)
29 (17.1)
0 0 0
Only those districts that applied for waivers in either year (that is, 16 percent of all districts) are included in the total. Percentages add to more than 100 percent because respondents could check more than one response. The consortium requirement and kindergarten exclusion were dropped in 2000-2001.
Source: Survey of District Personnel. Question: “Did your district request/receive waivers for any of the following program provisions [in 1999-2000 or 2000-2001]?”
Carryover Funds
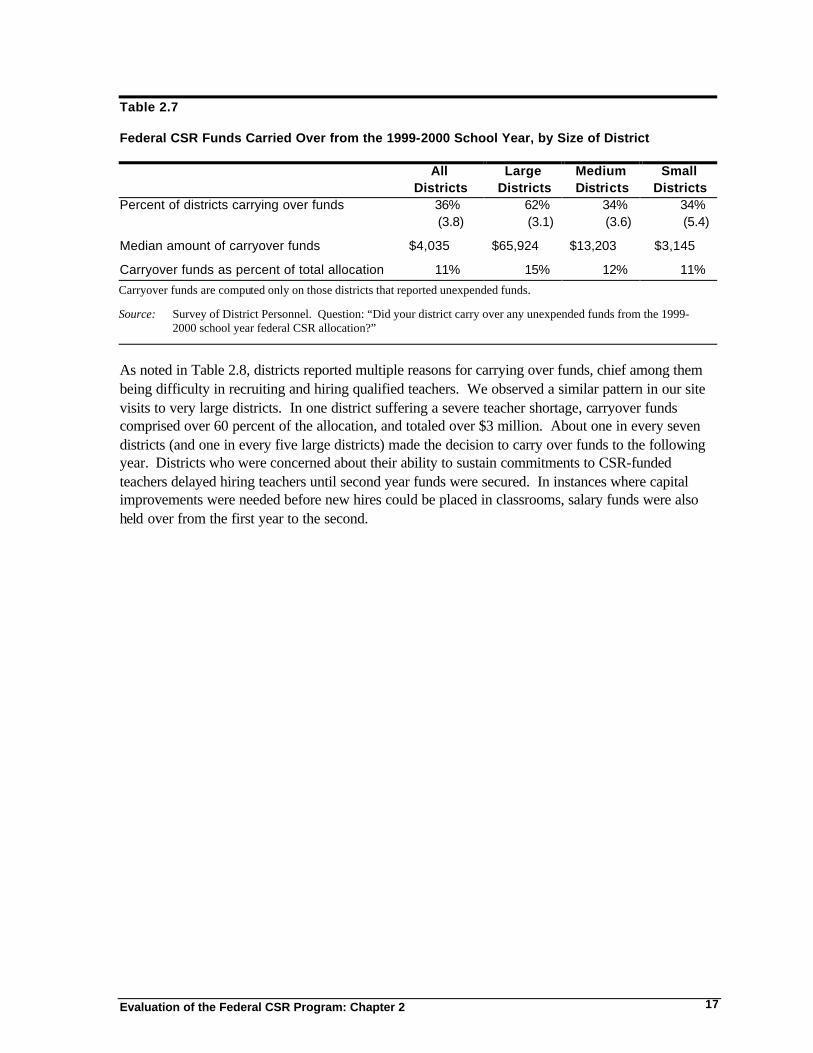
States were notified of funding levels in early December of 1998 for the first year of the federal CSR program. States then had to notify districts, which in turn submitted plans for how they would spend their allotment. The goal was to hire a full complement of teachers by fall 1999. Districts reported making heroic efforts to hire qualified teachers and prepare classroom space. The combination of late CSR funding and the uncertainty of funds beyond the first year raised questions about whether districts would be able to spend funds within the first year (1999-2000) or would need to carry over funds to the next school year.6 Thirty-six percent of districts reported that they carried over 1999-2000 funds to the 2000-01 school year (Table 2.7). Large districts were twice as likely as medium or small districts to carry over funds (62 percent of large districts versus 34 percent of both medium and small districts).7 On average, districts carried over 11 percent of their total allocation. Approxi-mately $150 million was carried over to 2000-01, with the large districts carrying over $100 million.
6 We did not ask a similar question about 2000-2001 funds because survey data collection occurred
before the end of the school year. 7 Standard error: all (3.8); large (3.1); medium (3.6); small (5.4). Chi-square for table was 41.85, p
< 0.01.
Evaluation of the Federal CSR Program: Chapter 2 17
Table 2.7 Federal CSR Funds Carried Over from the 1999-2000 School Year, by Size of District
All
Districts Large
Districts Medium Districts
Small Districts
Percent of districts carrying over funds 36% (3.8)
62% (3.1)
34% (3.6)
34% (5.4)
Median amount of carryover funds $4,035 $65,924 $13,203 $3,145
Carryover funds as percent of total allocation 11% 15% 12% 11%
Carryover funds are computed only on those districts that reported unexpended funds.
Source: Survey of District Personnel. Question: “Did your district carry over any unexpended funds from the 1999-2000 school year federal CSR allocation?”
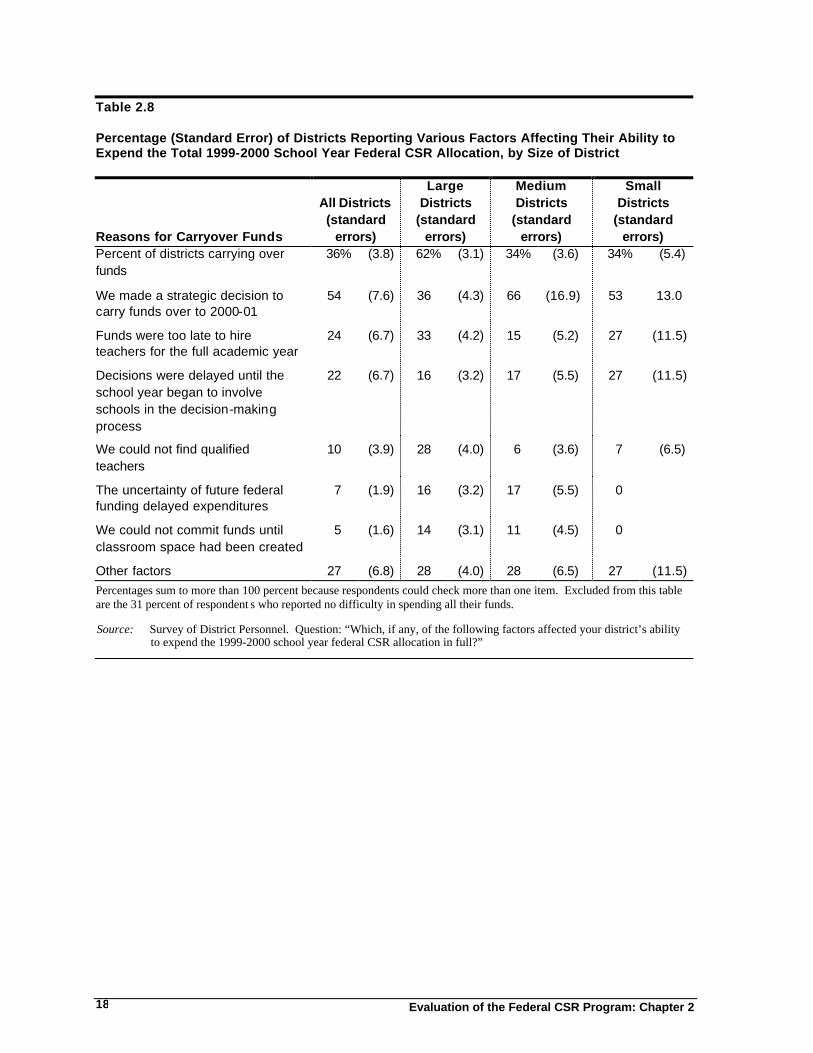
As noted in Table 2.8, districts reported multiple reasons for carrying over funds, chief among them being difficulty in recruiting and hiring qualified teachers. We observed a similar pattern in our site visits to very large districts. In one district suffering a severe teacher shortage, carryover funds comprised over 60 percent of the allocation, and totaled over $3 million. About one in every seven districts (and one in every five large districts) made the decision to carry over funds to the following year. Districts who were concerned about their ability to sustain commitments to CSR-funded teachers delayed hiring teachers until second year funds were secured. In instances where capital improvements were needed before new hires could be placed in classrooms, salary funds were also held over from the first year to the second.
Evaluation of the Federal CSR Program: Chapter 2 18
Table 2.8 Percentage (Standard Error) of Districts Reporting Various Factors Affecting Their Ability to Expend the Total 1999-2000 School Year Federal CSR Allocation, by Size of District
Reasons for Carryover Funds
All Districts (standard
errors)
Large Districts
(standard errors)
Medium Districts
(standard errors)
Small Districts
(standard errors)
Percent of districts carrying over funds
36% (3.8) 62% (3.1) 34% (3.6) 34% (5.4)
We made a strategic decision to carry funds over to 2000-01
54 (7.6) 36 (4.3) 66 (16.9) 53 13.0
Funds were too late to hire teachers for the full academic year
24 (6.7) 33 (4.2) 15 (5.2) 27 (11.5)
Decisions were delayed until the school year began to involve schools in the decision-making process
22 (6.7) 16 (3.2) 17 (5.5) 27 (11.5)
We could not find qualified teachers
10 (3.9) 28 (4.0) 6 (3.6) 7 (6.5)
The uncertainty of future federal funding delayed expenditures
7 (1.9) 16 (3.2) 17 (5.5) 0
We could not commit funds until classroom space had been created
5 (1.6) 14 (3.1) 11 (4.5) 0
Other factors 27 (6.8) 28 (4.0) 28 (6.5) 27 (11.5) Percentages sum to more than 100 percent because respondents could check more than one item. Excluded from this table are the 31 percent of respondent s who reported no difficulty in spending all their funds.
Source: Survey of District Personnel. Question: “Which, if any, of the following factors affected your district’s ability to expend the 1999-2000 school year federal CSR allocation in full?”
Evaluation of the Federal CSR Program: Chapter 2 19
Coordinating Federal CSR Funds with Other Funding
Federal program guidance strongly recommended using federal CSR funds in conjunction with other programs. The federal guidelines stated:
To be most effective, the Class-Size Reduction Program should work hand-in-hand with other Federal, State, and local programs that have related purposes (U.S. Department of Education, 2000, p. 10).
Multiple federal programs were mentioned, including Title I of ESEA, the Reading Excellence Act, Eisenhower Professional Development Program, and Title II of the Higher Education Act, as well as state and local class-size reduction efforts:
School districts and schools that participate in these programs are encouraged to pursue a coordinated strategy to strengthen instruction in reading and other subjects in early grades and help all students reach challenging standards—by creating smaller classes, staffing them with well-prepared teachers, and providing extra help for those who need it (p. 11).
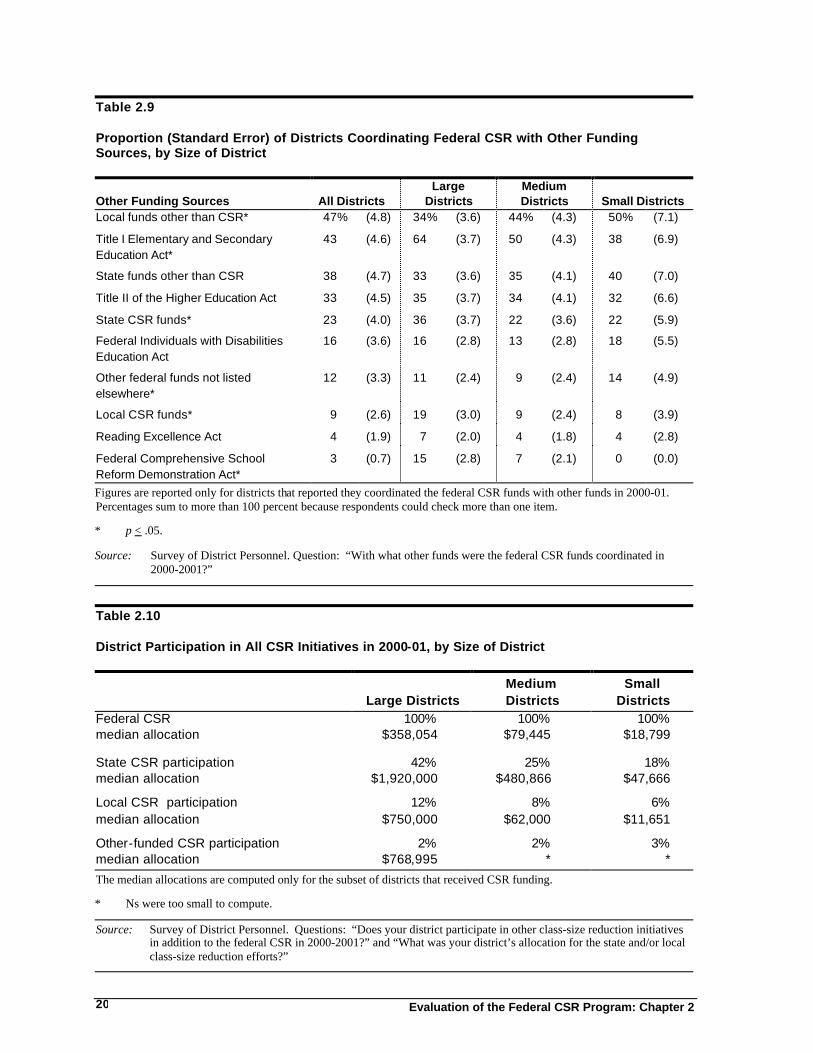
In keeping with federal guidance, 68 percent8 of districts, regardless of enrollment size, reported coordinating federal CSR funds with other funding. When districts coordinated spending, multiple sources were often used, as illustrated in Table 2.9. Among federal initiatives, the most frequently cited were Title I of the Elementary and Secondary Education Act and Title II of the Higher Education Act. For over a dozen years, Title I has frequently supported reduced class sizes in high poverty schoolwide projects, and Title II is a source of professional development funds. State and local funds were also frequently cited, including state CSR funding. The reasons cited for coordinating CSR and other funding were consistent across districts and were equally important. Hiring additional teachers, complementing school reform efforts, and integrating funds for professional development were cited by 42 percent, 41 percent, and 40 percent of all districts, respectively. 9 We learned of a variety of coordination efforts in our site visits, and in some districts the coordination process was becoming more standardized. One state, for example, requires districts to prepare a strategic plan that includes a gap analysis and that notes how different sources of funds fit into the analysis. How states coordinated activities is discussed in greater detail in Chapter 3. We were particularly interested in how the federal CSR initiative was coordinated with state and local CSR initiatives, many of which predated the passage of the federal program. One-quarter of the districts surveyed (28 percent) reported having received class-size reduction funding from some other source (state, local, or other). Large districts were much more likely to have other funding sources (50 percent) than medium (32 percent) or small (24 percent).10 By far, the state CSR initiatives
8 Standard error is 3.8. 9 Standard errors are 4.7, 4.7, and 4.7, respectively. 10 Standard errors: all (3.4); large (3.2); medium (3.5); small (4.9). Chi-square test significant at
the p < 0.01 level (chi value was 25.68).
Evaluation of the Federal CSR Program: Chapter 2 20
Table 2.9 Proportion (Standard Error) of Districts Coordinating Federal CSR with Other Funding Sources, by Size of District
Other Funding Sources All Districts Large
Districts Medium Districts Small Districts
Local funds other than CSR* 47% (4.8) 34% (3.6) 44% (4.3) 50% (7.1)
Title I Elementary and Secondary Education Act*
43 (4.6) 64 (3.7) 50 (4.3) 38 (6.9)
State funds other than CSR 38 (4.7) 33 (3.6) 35 (4.1) 40 (7.0)
Title II of the Higher Education Act 33 (4.5) 35 (3.7) 34 (4.1) 32 (6.6)
State CSR funds* 23 (4.0) 36 (3.7) 22 (3.6) 22 (5.9)
Federal Individuals with Disabilities Education Act
16 (3.6) 16 (2.8) 13 (2.8) 18 (5.5)
Other federal funds not listed elsewhere*
12 (3.3) 11 (2.4) 9 (2.4) 14 (4.9)
Local CSR funds* 9 (2.6) 19 (3.0) 9 (2.4) 8 (3.9)
Reading Excellence Act 4 (1.9) 7 (2.0) 4 (1.8) 4 (2.8)
Federal Comprehensive School Reform Demonstration Act*
3 (0.7) 15 (2.8) 7 (2.1) 0 (0.0)
Figures are reported only for districts that reported they coordinated the federal CSR funds with other funds in 2000-01. Percentages sum to more than 100 percent because respondents could check more than one item.
* p < .05.
Source: Survey of District Personnel. Question: “With what other funds were the federal CSR funds coordinated in 2000-2001?”
Table 2.10 District Participation in All CSR Initiatives in 2000-01, by Size of District
Large Districts Medium Districts
Small Districts
Federal CSR median allocation
100% $358,054
100% $79,445
100% $18,799
State CSR participation median allocation
42% $1,920,000
25% $480,866
18% $47,666
Local CSR participation median allocation
12% $750,000
8% $62,000
6% $11,651
Other-funded CSR participation median allocation
2% $768,995
2% *
3% *
The median allocations are computed only for the subset of districts that received CSR funding.
* Ns were too small to compute.
Source: Survey of District Personnel. Questions: “Does your district participate in other class-size reduction initiatives in addition to the federal CSR in 2000-2001?” and “What was your district’s allocation for the state and/or local class-size reduction efforts?”
Evaluation of the Federal CSR Program: Chapter 2 21
provided districts with considerably larger sums of money for class-size reduction than did the federal CSR program. As shown in Table 2.10, for medium and large districts that received state CSR funds, the state funds were at least five times the size of the federal allocation. The ratio of federal, state, and local CSR funds did not change significantly from the 1999-2000 to the 2000-01 school years. Five of the six states visited also had state CSR initiatives. How these funds were used varied depending on local education priorities and interests, legislative restrictions on use, different real world constraints, and the availability of local resources. These five state initiatives were generally more restrictive in both school eligibility and allowable uses of funds, so federal funds were perceived as more flexible. In one large state, state CSR funds were restricted to capital improvements and the hiring of full-time teachers in separate classrooms. The federal dollars, on the other hand, allowed districts to use such alternative approaches as team teaching, the use of specialist teachers for certain subjects, and professional development. In one district visited, this allowed “everybody to get something,” by using the funding pools in a complementary fashion.
Conclusion
Over the first two years of the CSR program, federal funds were distributed to the states and districts for which they were intended. Districts spent the funds according to the distribution requirements of the law, and spent more on teacher salaries than mandated by the law (and correspondingly less on professional development). Rarely did districts assign multiple CSR-funded teachers in a school; rather, three-fifths of the schools hired only a single federal CSR-funded teacher. In keeping with the intent of the law, districts often coordinated their federal CSR funds with other funding sources, whether they be Title I (ESEA), Title II (HEA), or state and local CSR funds. It was clear from the survey and case study data that many districts targeted funds on increasing services and reducing class size in the early elementary grades. The most serious funding issue occurred in large districts (those with 10,000 or more students), where 62 percent carried funds over from the first to second year of the program. In these districts, about $100 million of federal CSR funds went unspent in the first year. Chapter 3 elaborates on the implementation issues associated with the federal CSR program, especially around recruiting qualified teachers and providing sufficient facilities for the newly hired staff.

Evaluation of the Federal CSR Program: Chapter 2 22
23
Chapter 3 Implementation of the Federal Class-Size Reduction Program
Overview
The CSR program may seem relatively straightforward compared with other federal education programs such as Title I of the Elementary and Secondary Education Act or Title II of the Higher Education Act. CSR allowed few options for uses of funds, and federal program guidance focused primarily on discussing the allowable spending options and clarifying when waivers from the program statute were appropriate (e.g., when fully certified teachers are not available or when class size is already reduced in the targeted grades). Despite the program’s relative simplicity, however, contextual variations led to considerable implementation differences across districts and schools. The local teacher supply, availability of additional classroom space (or the ability to create new classroom space), local professional development priorities and plans, and other administrative and resource-related issues all affected districts’ and schools’ experiences with CSR implementation. This chapter focuses on CSR implementation and addresses the following questions:
• What were the sources and qualifications of new teachers? What recruitment activities were undertaken to attract qualified teachers?
• What were the nature and quality of professional development provided? and
• To what extent were facilities available for reducing class size?
• How is reduced class size reflected in classroom practices? These questions are informed by the survey of a nationally representative sample of school districts, by the survey of a national sample of schools that hired at least one CSR teacher, and by case studies in six states, 12 districts (typically the two largest in each state), and 24 schools (two in each district).
Major Findings
Hiring Teachers
• Federal CSR legislation required that all teachers hired under the CSR program be fully certified to teach the grades and subjects to which they are assigned. Twelve percent of districts, however—predominantly large, urban districts—had difficulty finding teachers, in most cases because there were not enough credentialed applicants available.
• Only a small percentage (5 percent) of districts used CSR funds to recruit teachers.
Although many of the large districts in our case studies were engaged in large-scale recruitment initiatives, funding for these purposes came from sources other than CSR.
24 Evaluation of the Federal CSR Program: Chapter 3
• Teachers in reduced-size classrooms (whether federally funded or not) were similar to other newly hired teachers with regard to background and experience. Compared to non-CSR teachers, a slightly greater percentage of CSR teachers had standard state teaching certificates rather than advanced professional certificates, held bachelor’s degrees in their subject areas rather than master’s degrees or higher, and had fewer years of teaching experience.
Professional Development
• Although one-quarter of federal CSR funds could support teacher professional development in 2000-01, only 39 percent of districts reported using a portion of their CSR allocation for this purpose, spending an average of 14 percent of their total funds. Of those districts spending CSR funds on professional development, most reported focusing on the content of reading (80 percent of districts) or math (57 percent), whereas 38 percent offered professional development on working with students in small classes.
• Because federal CSR funds were a small proportion of the budget for most districts, the
influence of such funds on a district’s overall professional development activities was minimal.
Resources
• Nearly one-third of districts had facilities problems related to the CSR initiative, such as not having enough additional rooms available to convert to classroom use or having insufficient funds to modify facilities. In response to this somewhat negative and unintended circumstance, districts promoted team teaching or converted nonclassroom space (other instructional rooms like gymnasiums, or noninstructional rooms like teachers’ lounges) into classrooms.
• CSR implementation has been affected by other administrative and resource-related
issues: the lack of state administrative funds resulted in minimal state involvement in the program; districts were unable to hire teachers due to the late notification of funds; district administrators were wary about the uncertainty of the program’s future; and allocations for rural districts were too small to create a meaningful program.
Classroom Practices
• Based upon observations and interviews in 48 CSR classrooms across 24 schools, some teachers tailored instruction and maximized one-on-one time with students, to give students more time and attention. They credited smaller classes with these changes in practices. At the same time, other CSR classes functioned like non-CSR classes, with desks in rows and the teacher lecturing from the front of the room.
Evaluation of the Federal CSR Program: Chapter 3 25
Hiring Teachers
Availability of Credentialed Teachers
For the second year of the federal CSR program, the teacher qualification requirements were strengthened, as described in the federal program guidance: “All teachers hired under the Class-Size Reduction Program must be fully certified to teach the grades and/or subjects to which they are assigned” (U.S. Department of Education, 2000, p. 10). The implementation of CSR hinged on districts’ and schools’ ability to hire qualified, credentialed teachers. Our survey data reveal substantial variation in districts’ abilities to hire additional qualified teachers. A large majority of districts (88 percent) reported having no difficulty recruiting and hiring additional teachers for the CSR program. The remaining 12 percent, however, were severely affected by local teacher shortages and, thus, were challenged to implement the program as intended (i.e., staffing classrooms with credentialed teachers). Large districts reported having more difficulty with recruiting and hiring than did medium or small districts, with nearly one out of three large districts (31 percent) reporting problems, compared with just under one in ten small districts (9 percent).11 The most frequently cited reason for having difficulty recruiting and hiring additional teachers for the CSR program was a lack of credentialed applicants (Table 3.1). This problem was cited by nearly three out of four districts (70 percent) experiencing hiring difficulties. Higher percentages of large and medium-sized districts (88 percent and 83 percent, respectively) than of small districts (57 percent) reported that insufficient numbers of credentialed applicants presented an obstacle. A greater percentage of large districts (15 percent) than of medium districts (8 percent) also cited problems hiring and recruiting due to the late notification of funds. Higher percentages of medium-sized districts than large districts reported difficulty recruiting and hiring because of noncompetitive salaries and an inability to offer multiple -year contracts due to uncertainty of continued funding. Clearly these issues affected large and medium districts—no small districts reported any issues related to lateness of funding or funding uncertainty. Our case study sites included both districts that had a sufficient teacher labor supply and those experiencing sizable shortages. Several of our case study sites experienced little difficulty finding qualified teachers and had mult iple credentialed applicants for open positions. At the extreme, one district received 10,000 applicants for 310 open positions districtwide, 70 percent of whom were elementary teachers and thus eligible for the K-3 focus of the CSR program. In this district, teacher candidates often applied for teacher aide and long-term substitute positions simply to teach within the district, hoping that this initial step would lead to full-time teaching positions. Another district received about 1,000 applications for 450 positions. Having such flush teacher labor markets enabled these districts to be selective in their hiring decisions generally, as well as for their CSR-funded positions specifically. Even desirable districts and districts with a large supply of credentialed teachers experienced teacher shortages in certain high-demand, low-availability areas, such as special education, bilingual education, and specialized programming such as music, art, and physical
11 Standard errors for having difficulty recruiting and hiring additional teachers for the CSR
program are: all districts (2.4); large districts (2.9); medium districts (2.5); and small districts (3.4).
26 Evaluation of the Federal CSR Program: Chapter 3
education, but the difficulty in filling these staff positions rarely affected a district’s ability to hire CSR teachers. Several other case study sites, in contrast, had difficulty merely filling their regular classrooms with credentialed teachers. One state, for example, was experiencing severe teacher shortages in all areas of the state. In 1999-2000, this state needed more than 10,000 new teachers, and the state’s teacher preparation programs produced just 4,000 teachers. These shortages reflected a variety of factors, including increasing teacher retirement rates, declining enrollment in teacher preparation programs, high teacher attrition rates in the first few years of teaching, teacher mobility, and state reform policies that provide financial incentives for reducing class size. The existing statewide teacher shortage was further exacerbated by the federal CSR program’s demand for even more teachers. Where teacher shortages existed, large urban areas tended to be hardest hit. Characterized by persistent underachievement and crowded conditions, schools in these areas were the least desirable for both new and veteran teachers. Given the option, teachers chose schools that were more stable and that offered less challenging environments. With demand for teachers surpassing supply, hard-to-staff schools often relied on substitutes, retired teachers, or teachers with conditional certificates to staff classrooms. One district we visited was only able to fill 17 of its 25 allocated CSR slots with credentialed, full-time teachers. Of the remaining eight open positions, three were filled with long-term substitutes, and five positions remained vacant in the spring, so students remained in larger classrooms. In this district, the CSR program was competing with the statewide reform program for teachers, which had priority for new hires. As one respondent said, there was “competition with and between schools” in this district for teachers. Another school we visited had ten unfilled positions in the spring because the principal could not find certified teachers, and five teachers who were new hires from out of state left in the middle of the year. The cornerstone of the CSR program was bringing more teachers into K-3 classrooms. In some states, districts, and schools, reducing class size with skilled teachers was easily accomplished. In other geographic areas, it was nearly impossible. Although all districts enthusiastically welcomed CSR funds, the promises the funds brought of creating more effective learning environments were less attainable in large urban districts already facing teacher shortages. Providing funds for additional teachers did not help the students in these districts when qualified teachers could not be found. Further, where principals could not fill their regular classrooms with certified teachers, increasing the number of teaching positions created additional strain in already stressed schools.
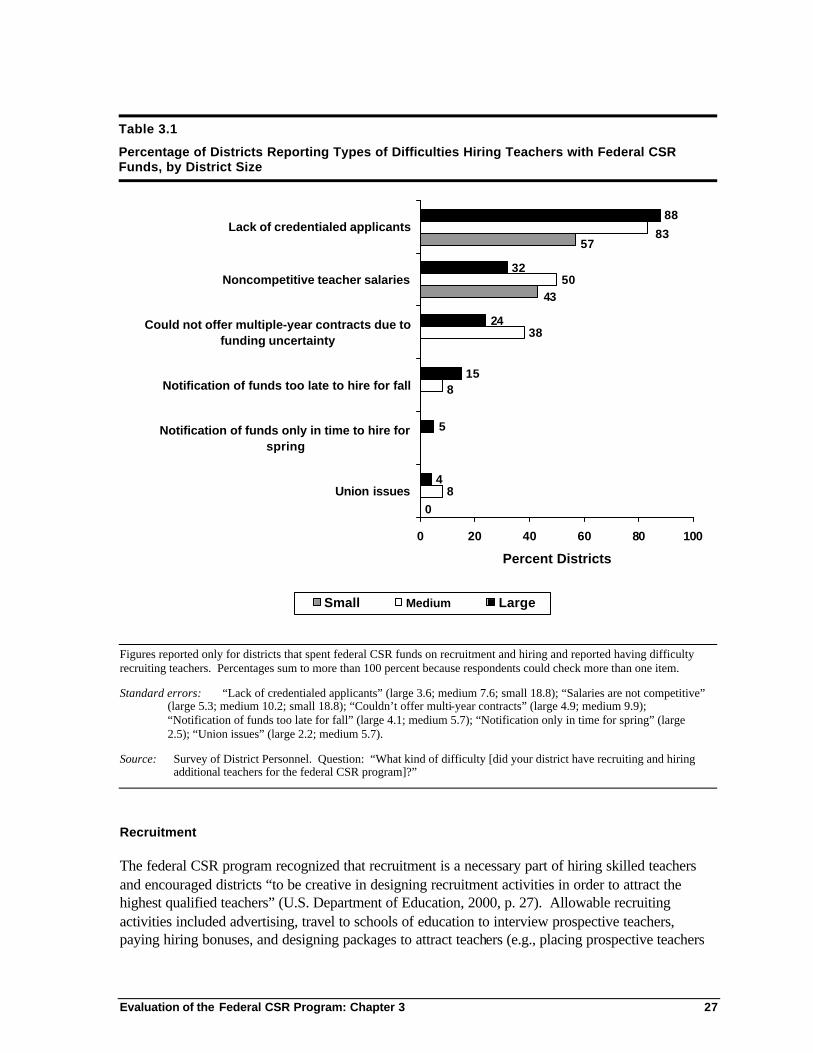
Evaluation of the Federal CSR Program: Chapter 3 27
Table 3.1
Percentage of Districts Reporting Types of Difficulties Hiring Teachers with Federal CSR Funds, by District Size
8
38
50
4
5
15
24
32
88
57
43
0
83
8
0 20 40 60 80 100
Union issues
Notification of funds only in time to hire forspring
Notification of funds too late to hire for fall
Could not offer multiple-year contracts due tofunding uncertainty
Noncompetitive teacher salaries
Lack of credentialed applicants
Percent Districts
Small Medium Large
Figures reported only for districts that spent federal CSR funds on recruitment and hiring and reported having difficulty recruiting teachers. Percentages sum to more than 100 percent because respondents could check more than one item.
Standard errors: “Lack of credentialed applicants” (large 3.6; medium 7.6; small 18.8); “Salaries are not competitive” (large 5.3; medium 10.2; small 18.8); “Couldn’t offer multi-year contracts” (large 4.9; medium 9.9); “Notification of funds too late for fall” (large 4.1; medium 5.7); “Notification only in time for spring” (large 2.5); “Union issues” (large 2.2; medium 5.7).
Source: Survey of District Personnel. Question: “What kind of difficulty [did your district have recruiting and hiring additional teachers for the federal CSR program]?”
Recruitment
The federal CSR program recognized that recruitment is a necessary part of hiring skilled teachers and encouraged districts “to be creative in designing recruitment activities in order to attract the highest qualified teachers” (U.S. Department of Education, 2000, p. 27). Allowable recruiting activities included advertising, travel to schools of education to interview prospective teachers, paying hiring bonuses, and designing packages to attract teachers (e.g., placing prospective teachers
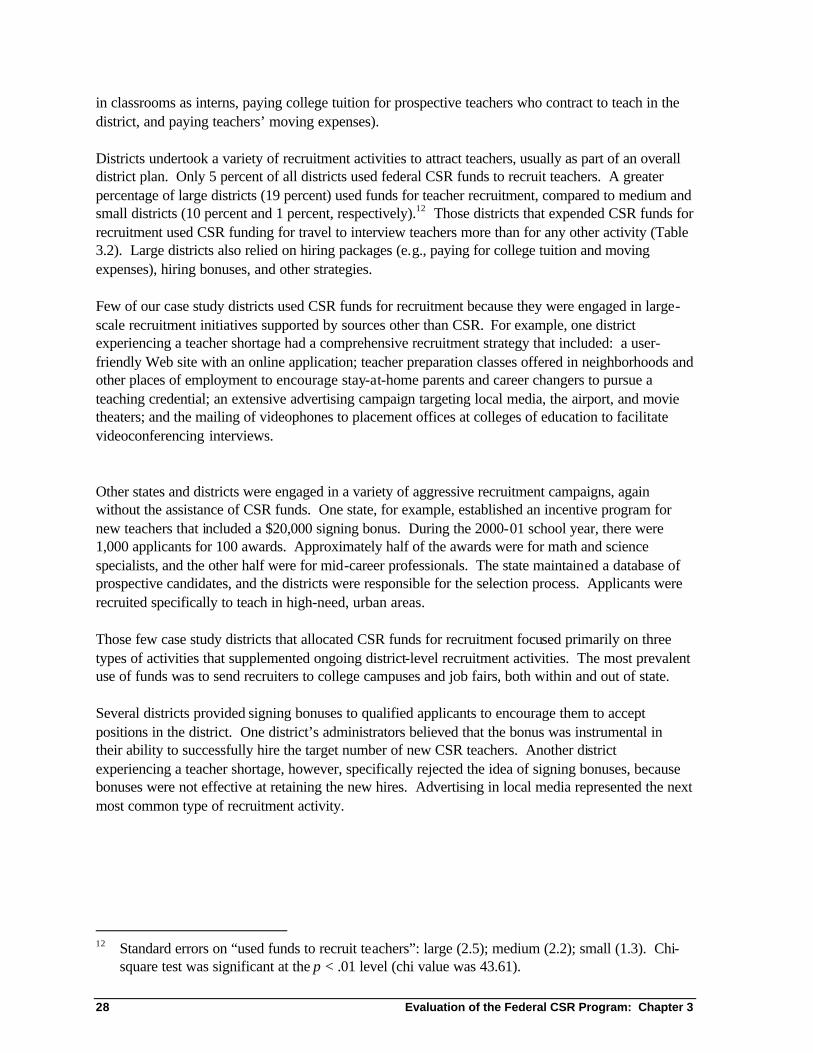
28 Evaluation of the Federal CSR Program: Chapter 3
in classrooms as interns, paying college tuition for prospective teachers who contract to teach in the district, and paying teachers’ moving expenses). Districts undertook a variety of recruitment activities to attract teachers, usually as part of an overall district plan. Only 5 percent of all districts used federal CSR funds to recruit teachers. A greater percentage of large districts (19 percent) used funds for teacher recruitment, compared to medium and small districts (10 percent and 1 percent, respectively).12 Those districts that expended CSR funds for recruitment used CSR funding for travel to interview teachers more than for any other activity (Table 3.2). Large districts also relied on hiring packages (e.g., paying for college tuition and moving expenses), hiring bonuses, and other strategies. Few of our case study districts used CSR funds for recruitment because they were engaged in large-scale recruitment initiatives supported by sources other than CSR. For example, one district experiencing a teacher shortage had a comprehensive recruitment strategy that included: a user-friendly Web site with an online application; teacher preparation classes offered in neighborhoods and other places of employment to encourage stay-at-home parents and career changers to pursue a teaching credential; an extensive advertising campaign targeting local media, the airport, and movie theaters; and the mailing of videophones to placement offices at colleges of education to facilitate videoconferencing interviews. Other states and districts were engaged in a variety of aggressive recruitment campaigns, again without the assistance of CSR funds. One state, for example, established an incentive program for new teachers that included a $20,000 signing bonus. During the 2000-01 school year, there were 1,000 applicants for 100 awards. Approximately half of the awards were for math and science specialists, and the other half were for mid-career professionals. The state maintained a database of prospective candidates, and the districts were responsible for the selection process. Applicants were recruited specifically to teach in high-need, urban areas. Those few case study districts that allocated CSR funds for recruitment focused primarily on three types of activities that supplemented ongoing district-level recruitment activities. The most prevalent use of funds was to send recruiters to college campuses and job fairs, both within and out of state. Several districts provided signing bonuses to qualified applicants to encourage them to accept positions in the district. One district’s administrators believed that the bonus was instrumental in their ability to successfully hire the target number of new CSR teachers. Another district experiencing a teacher shortage, however, specifically rejected the idea of signing bonuses, because bonuses were not effective at retaining the new hires. Advertising in local media represented the next most common type of recruitment activity.
12 Standard errors on “used funds to recruit teachers”: large (2.5); medium (2.2); small (1.3). Chi-
square test was significant at the p < .01 level (chi value was 43.61).
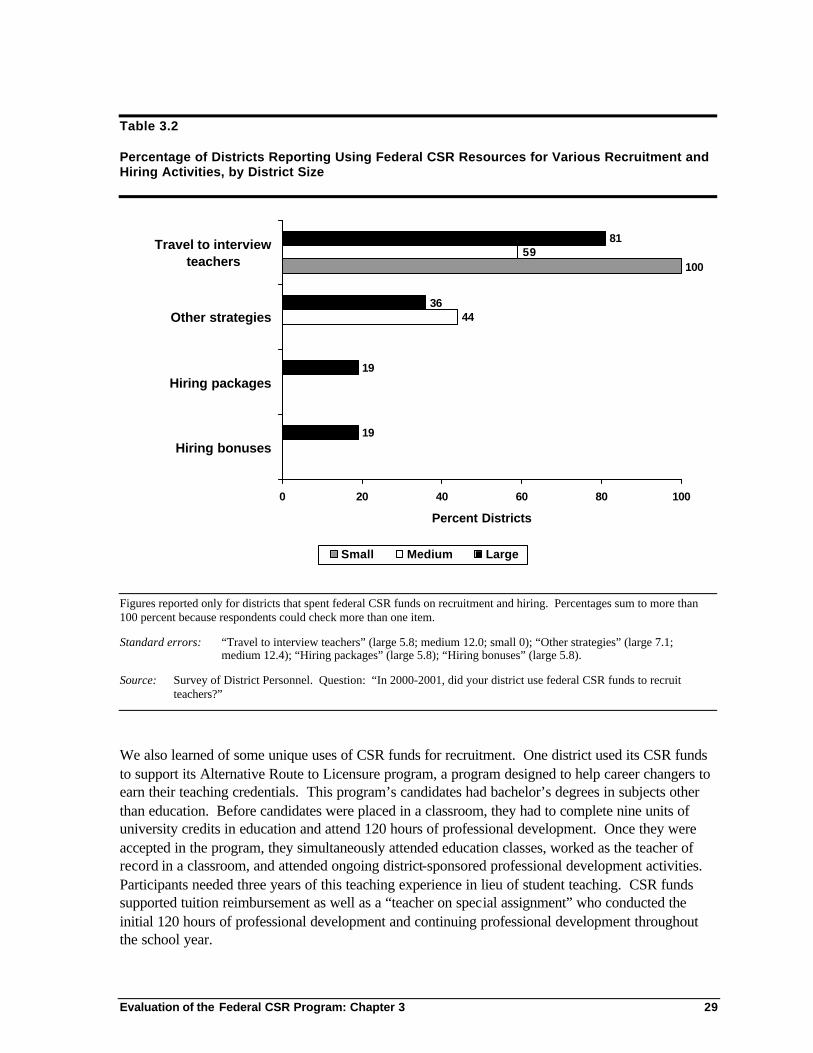
Evaluation of the Federal CSR Program: Chapter 3 29
Table 3.2 Percentage of Districts Reporting Using Federal CSR Resources for Various Recruitment and Hiring Activities, by District Size
44
19
19
36
81
10059
0 20 40 60 80 100
Hiring bonuses
Hiring packages
Other strategies
Travel to interviewteachers
Percent Districts
Small Medium Large
Figures reported only for districts that spent federal CSR funds on recruitment and hiring. Percentages sum to more than 100 percent because respondents could check more than one item.
Standard errors: “Travel to interview teachers” (large 5.8; medium 12.0; small 0); “Other strategies” (large 7.1; medium 12.4); “Hiring packages” (large 5.8); “Hiring bonuses” (large 5.8).
Source: Survey of District Personnel. Question: “In 2000-2001, did your district use federal CSR funds to recruit teachers?”
We also learned of some unique uses of CSR funds for recruitment. One district used its CSR funds to support its Alternative Route to Licensure program, a program designed to help career changers to earn their teaching credentials. This program’s candidates had bachelor’s degrees in subjects other than education. Before candidates were placed in a classroom, they had to complete nine units of university credits in education and attend 120 hours of professional development. Once they were accepted in the program, they simultaneously attended education classes, worked as the teacher of record in a classroom, and attended ongoing district-sponsored professional development activities. Participants needed three years of this teaching experience in lieu of student teaching. CSR funds supported tuition reimbursement as well as a “teacher on special assignment” who conducted the initial 120 hours of professional development and continuing professional development throughout the school year.
30 Evaluation of the Federal CSR Program: Chapter 3
In sum, for districts that were experiencing teacher shortages, recruitment was a core process, often with several district administrators dedicated to the task. These districts were engaged in recruitment prior to CSR and had already devoted district funds to this essential activity. CSR allowed these districts to increase their recruitment budgets by a small percentage; however, they continued to engage in the same recruitment activities already under way. Districts without teacher shortages did not need to invest in large-scale recruitment activities and thus did not allocate their CSR funds for recruitment. Characteristics of CSR Teachers
Principals in the schools that hired CSR teachers were asked to compare the credentials of CSR teachers to teachers in non-CSR classrooms.13 In 2000-01, nearly all teachers of both CSR and non-CSR classes (97 percent for both groups, standard errors 1.0 and 0.8) had the appropriate state teaching certificate in their main assignment field. There were only minor differences in the preparation and years of experience between CSR and non-CSR teachers. More teachers of CSR classes had a standard state teaching certificate than did teachers in non-CSR classrooms (87 and 77 percent, respectively), whereas slightly more non-CSR teachers had advanced professional certificates (Table 3.3). Seventy-one percent of teachers of CSR classes had bachelors’ degrees in their subject areas, compared with 54 percent of teachers of non-CSR classes; 42 percent of teachers of non-CSR classes had masters’ degrees or higher in their subject areas, compared with 27 percent of teachers of CSR classes (Table 3.4). Teachers of non-CSR classes had slightly more years of experience than teachers in reduced-size classes (Table 3.5). Half (51 percent) of teachers of non-CSR classes had six or more years of experience, compared with 42 percent of teachers of CSR classes. One-quarter (26 percent) of teachers of CSR classes were novices, with only one or two years of experience, whereas only 17 percent of teachers of non-CSR classes were novices. Our case study districts confirmed to us that teachers hired with CSR funds were generally similar to other newly hired teachers with regard to background and experience, although one district used its CSR funds to hire literacy specialists who were veteran teachers with a great deal more experience than new hires for regular teaching positions. Even in this district, however, other CSR teachers (i.e., those hired for classroom, not for specialist positions) mirrored the background and experience of the general new-teacher pool.
13 In this section, “teachers of CSR classes” refers to all teachers in classes whose size was reduced,
not just to those teachers hired with federal CSR funds. Principals often do not know the funding source for new staff so they would have been unable to identify the teacher(s) hired through federal funds.
Evaluation of the Federal CSR Program: Chapter 3 31
Table 3.3 Distribution of Teaching Certificates of Teachers in Reduced- and Non-Reduced Size Classes, 2000-2001
87
6 6
77
148
0
20
40
60
80
100
Standard StateCertificate
Advanced ProfessionalCertificate
Provisional,Probationary, or
Emergency Certificate orWaiver
Per
cent
of
Teac
hers
CSR Teachers Non-CSR Teachers
The figures for teachers in classrooms that were not reduced in size were computed by subtracting the number of CSR teachers from the total number of teachers provided.
Standard errors: Standard State (CSR: 2.7; non-CSR: 3.4); Advanced Professional (CSR: 1.4; non-CSR: 3.0); Provisional (CSR: 2.1; non-CSR: 3.0).
Source: Survey of School Principals. Question: “Please indicate the total number of [teachers in reduced-size classes or full-time classroom teachers] in your school for [the 2000-2001 school year] who had the following types of teaching certificates: Advanced professional certificate; Regular or standard state certificate; The certificate offered in your state to persons who have completed what the state calls an “alternative certification program”; Provisional, probationary, or emergency certificate or waiver; Other certification.”
In all, there were only slight differences between CSR and non-CSR teachers in types of state certification held, degrees earned, and years of experience. Although most CSR teachers were fully credentialed, as is mandated under the federal legislation, there were some exceptions. One district we visited was experiencing such a severe teacher shortage that some of its CSR teachers were hired on emergency permits—they held no state teaching credentials.14 The local teacher supply had a considerable effect on a district’s ability to provide students with well-qualified teachers, one of the basic elements of creating effective instructional environments. Again, it was most often students in large urban areas who were negatively affected by a lack of well-qualified teachers.
14 Under the federal CSR Program Guidance (U.S. Department of Education, 2000, p. 10), these teachers hired under the
CSR program would have to become fully certified by the end of that school year.
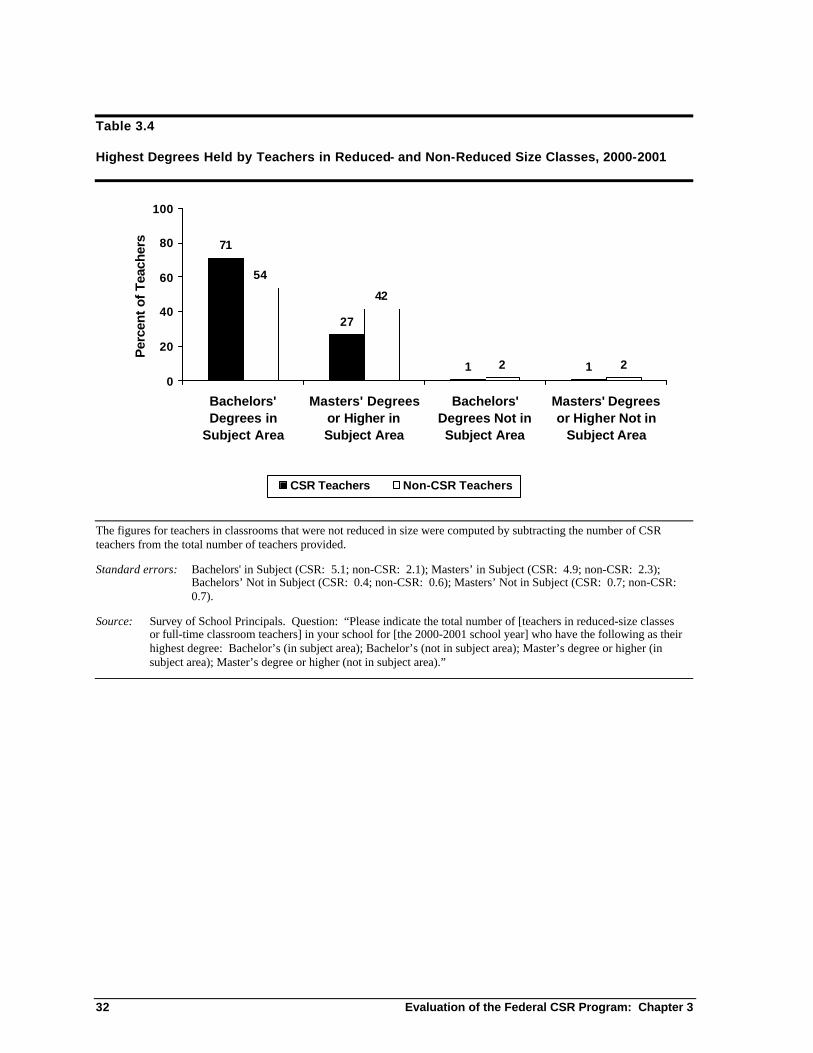
32 Evaluation of the Federal CSR Program: Chapter 3
Table 3.4 Highest Degrees Held by Teachers in Reduced- and Non-Reduced Size Classes, 2000-2001
71
27
1 1
54
42
2 20
20
40
60
80
100
Bachelors'Degrees in
Subject Area
Masters' Degreesor Higher inSubject Area
Bachelors'Degrees Not inSubject Area
Masters' Degreesor Higher Not in
Subject Area
Per
cent
of
Teac
hers
CSR Teachers Non-CSR Teachers
The figures for teachers in classrooms that were not reduced in size were computed by subtracting the number of CSR teachers from the total number of teachers provided.
Standard errors: Bachelors' in Subject (CSR: 5.1; non-CSR: 2.1); Masters’ in Subject (CSR: 4.9; non-CSR: 2.3); Bachelors’ Not in Subject (CSR: 0.4; non-CSR: 0.6); Masters’ Not in Subject (CSR: 0.7; non-CSR: 0.7).
Source: Survey of School Principals. Question: “Please indicate the total number of [teachers in reduced-size classes or full-time classroom teachers] in your school for [the 2000-2001 school year] who have the following as their highest degree: Bachelor’s (in subject area); Bachelor’s (not in subject area); Master’s degree or higher (in subject area); Master’s degree or higher (not in subject area).”
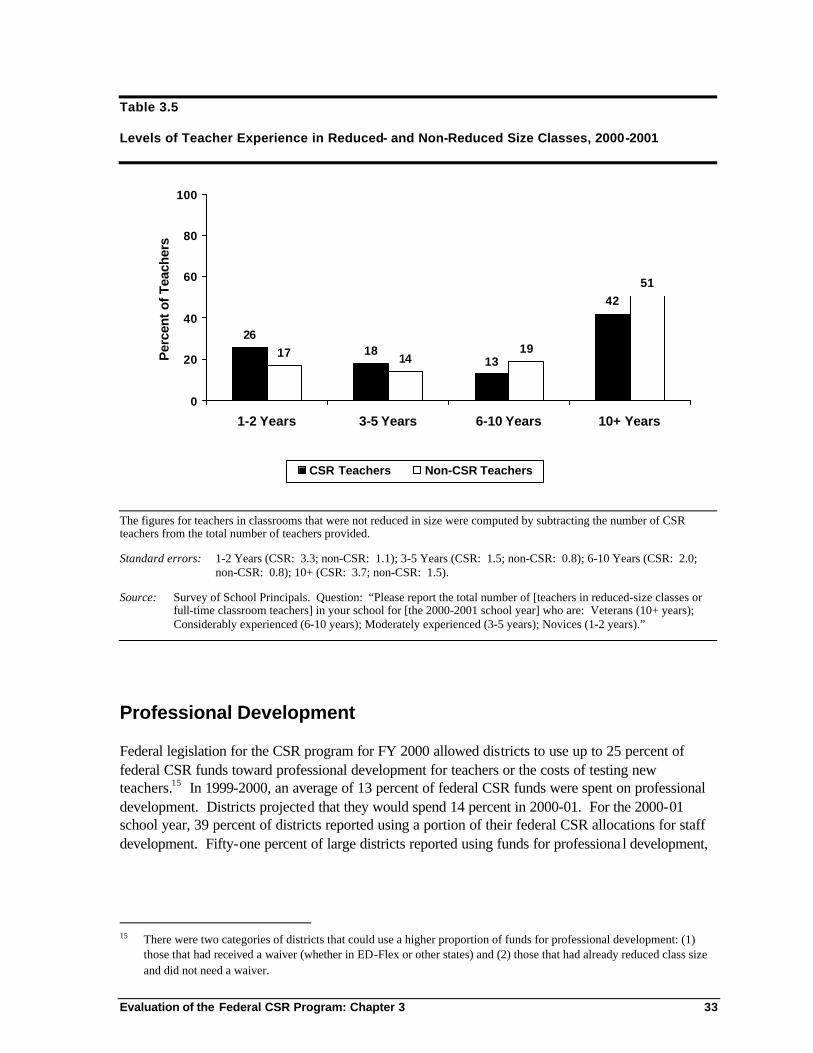
Evaluation of the Federal CSR Program: Chapter 3 33
Table 3.5 Levels of Teacher Experience in Reduced- and Non-Reduced Size Classes, 2000-2001
2618
13
42
17 1419
51
0
20
40
60
80
100
1-2 Years 3-5 Years 6-10 Years 10+ Years
Per
cent
of
Teac
hers
CSR Teachers Non-CSR Teachers
The figures for teachers in classrooms that were not reduced in size were computed by subtracting the number of CSR teachers from the total number of teachers provided.
Standard errors: 1-2 Years (CSR: 3.3; non-CSR: 1.1); 3-5 Years (CSR: 1.5; non-CSR: 0.8); 6-10 Years (CSR: 2.0; non-CSR: 0.8); 10+ (CSR: 3.7; non-CSR: 1.5).
Source: Survey of School Principals. Question: “Please report the total number of [teachers in reduced-size classes or full-time classroom teachers] in your school for [the 2000-2001 school year] who are: Veterans (10+ years); Considerably experienced (6-10 years); Moderately experienced (3-5 years); Novices (1-2 years).”
Professional Development
Federal legislation for the CSR program for FY 2000 allowed districts to use up to 25 percent of federal CSR funds toward professional development for teachers or the costs of testing new teachers.15 In 1999-2000, an average of 13 percent of federal CSR funds were spent on professional development. Districts projected that they would spend 14 percent in 2000-01. For the 2000-01 school year, 39 percent of districts reported using a portion of their federal CSR allocations for staff development. Fifty-one percent of large districts reported using funds for professiona l development,
15 There were two categories of districts that could use a higher proportion of funds for professional development: (1)
those that had received a waiver (whether in ED-Flex or other states) and (2) those that had already reduced class size and did not need a waiver.
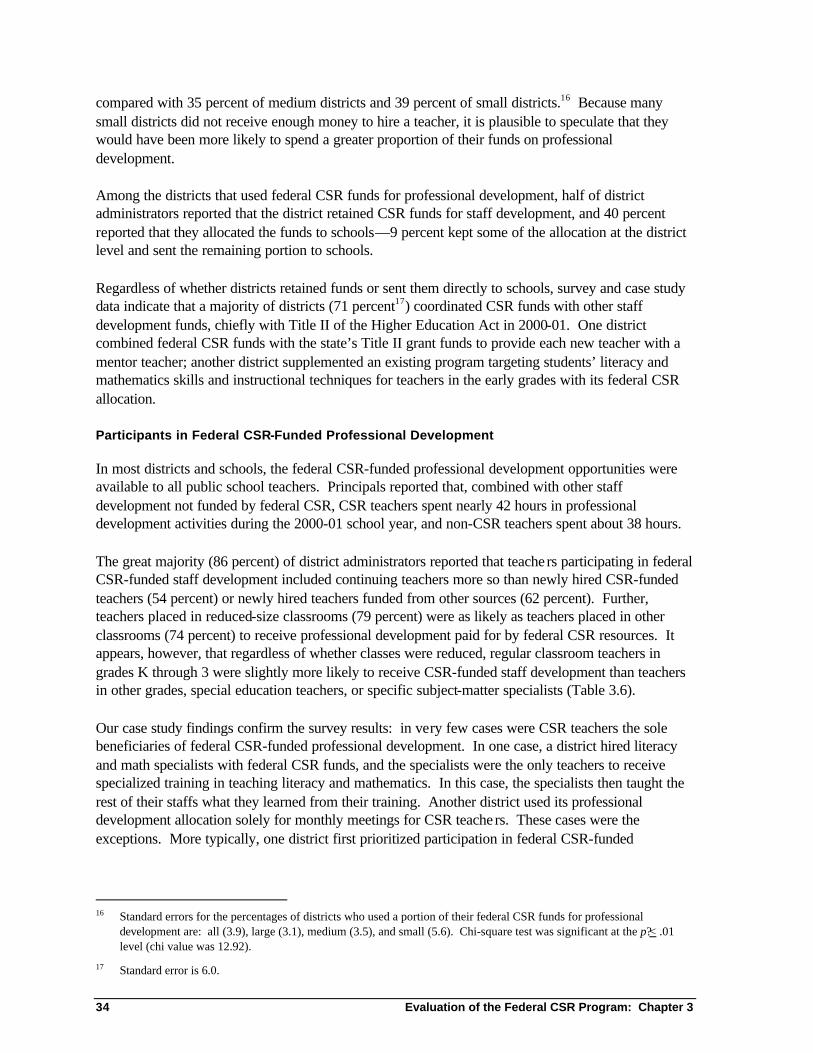
34 Evaluation of the Federal CSR Program: Chapter 3
compared with 35 percent of medium districts and 39 percent of small districts.16 Because many small districts did not receive enough money to hire a teacher, it is plausible to speculate that they would have been more likely to spend a greater proportion of their funds on professional development. Among the districts that used federal CSR funds for professional development, half of district administrators reported that the district retained CSR funds for staff development, and 40 percent reported that they allocated the funds to schools—9 percent kept some of the allocation at the district level and sent the remaining portion to schools. Regardless of whether districts retained funds or sent them directly to schools, survey and case study data indicate that a majority of districts (71 percent17) coordinated CSR funds with other staff development funds, chiefly with Title II of the Higher Education Act in 2000-01. One district combined federal CSR funds with the state’s Title II grant funds to provide each new teacher with a mentor teacher; another district supplemented an existing program targeting students’ literacy and mathematics skills and instructional techniques for teachers in the early grades with its federal CSR allocation. Participants in Federal CSR-Funded Professional Development
In most districts and schools, the federal CSR-funded professional development opportunities were available to all public school teachers. Principals reported that, combined with other staff development not funded by federal CSR, CSR teachers spent nearly 42 hours in professional development activities during the 2000-01 school year, and non-CSR teachers spent about 38 hours. The great majority (86 percent) of district administrators reported that teache rs participating in federal CSR-funded staff development included continuing teachers more so than newly hired CSR-funded teachers (54 percent) or newly hired teachers funded from other sources (62 percent). Further, teachers placed in reduced-size classrooms (79 percent) were as likely as teachers placed in other classrooms (74 percent) to receive professional development paid for by federal CSR resources. It appears, however, that regardless of whether classes were reduced, regular classroom teachers in grades K through 3 were slightly more likely to receive CSR-funded staff development than teachers in other grades, special education teachers, or specific subject-matter specialists (Table 3.6). Our case study findings confirm the survey results: in very few cases were CSR teachers the sole beneficiaries of federal CSR-funded professional development. In one case, a district hired literacy and math specialists with federal CSR funds, and the specialists were the only teachers to receive specialized training in teaching literacy and mathematics. In this case, the specialists then taught the rest of their staffs what they learned from their training. Another district used its professional development allocation solely for monthly meetings for CSR teache rs. These cases were the exceptions. More typically, one district first prioritized participation in federal CSR-funded
16 Standard errors for the percentages of districts who used a portion of their federal CSR funds for professional
development are: all (3.9), large (3.1), medium (3.5), and small (5.6). Chi-square test was significant at the p? < .01 level (chi value was 12.92).
17 Standard error is 6.0.
Evaluation of the Federal CSR Program: Chapter 3 35
Table 3.6 Percentage of Districts Reporting on Types of Teachers Who Participated in CSR-Funded Professional Development
12
58
69
70
84
54
62
86
74
79
0 20 40 60 80 100
Teachers from nonpublic schools
Specific subject-matter or content specialistteachers
Special education teachers
Regular classroom teachers in any othergrades
Regular classroom teachers in K through 3
Newly hired CSR-funded teachers
Newly hired teachers funded from othersources
Continuing teachers
Teachers placed in any other classes
Teachers placed in reduced-size classes
Percent of Districts
Figures reported only for districts that spent federal CSR funds on professional development. Percentages sum to more than 100 percent because respondents could check more than one item.
Standard errors: “Teachers placed in reduced-size classes” (5.8); “Teachers placed in any other classes” (5.7); “Continuing teachers” (4.4); “Newly hired teachers funded from other sources” (6.3); “Newly hired CSR-funded teachers (6.4); “Regular classroom teachers in K through 3” (4.8); “Regular classroom teachers in any other grades” (5.5); “Special education teachers” (5.7); “Specific subject-matter or content specialist teachers” (6.2); “Teachers from nonpublic schools” (3.4).
Source: Survey of District Personnel. Question: “What types of teachers participated in federal CSR-funded professional development during the 2000-01 school year? (Check all that apply.)”
professional development for CSR teachers, then opened the participation to other non-CSR teachers in the same schools.
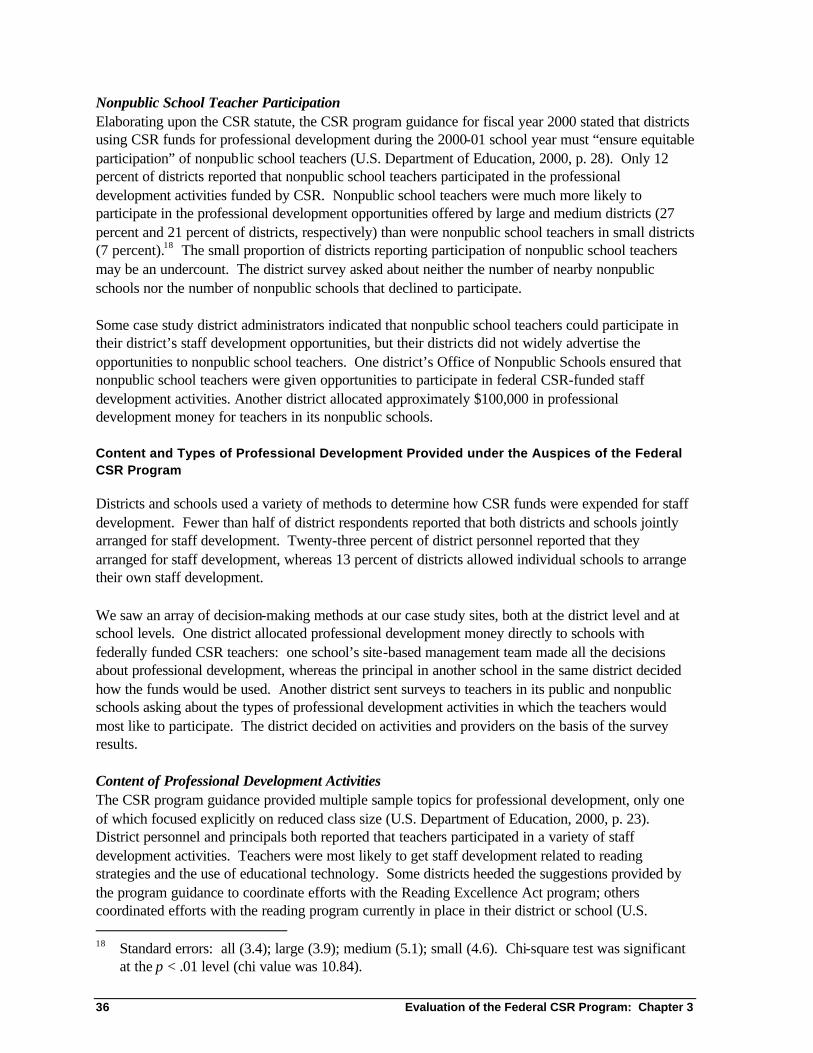
36 Evaluation of the Federal CSR Program: Chapter 3
Nonpublic School Teacher Participation Elaborating upon the CSR statute, the CSR program guidance for fiscal year 2000 stated that districts using CSR funds for professional development during the 2000-01 school year must “ensure equitable participation” of nonpublic school teachers (U.S. Department of Education, 2000, p. 28). Only 12 percent of districts reported that nonpublic school teachers participated in the professional development activities funded by CSR. Nonpublic school teachers were much more likely to participate in the professional development opportunities offered by large and medium districts (27 percent and 21 percent of districts, respectively) than were nonpublic school teachers in small districts (7 percent).18 The small proportion of districts reporting participation of nonpublic school teachers may be an undercount. The district survey asked about neither the number of nearby nonpublic schools nor the number of nonpublic schools that declined to participate. Some case study district administrators indicated that nonpublic school teachers could participate in their district’s staff development opportunities, but their districts did not widely advertise the opportunities to nonpublic school teachers. One district’s Office of Nonpublic Schools ensured that nonpublic school teachers were given opportunities to participate in federal CSR-funded staff development activities. Another district allocated approximately $100,000 in professional development money for teachers in its nonpublic schools. Content and Types of Professional Development Provided under the Auspices of the Federal CSR Program
Districts and schools used a variety of methods to determine how CSR funds were expended for staff development. Fewer than half of district respondents reported that both districts and schools jointly arranged for staff development. Twenty-three percent of district personnel reported that they arranged for staff development, whereas 13 percent of districts allowed individual schools to arrange their own staff development. We saw an array of decision-making methods at our case study sites, both at the district level and at school levels. One district allocated professional development money directly to schools with federally funded CSR teachers: one school’s site-based management team made all the decisions about professional development, whereas the principal in another school in the same district decided how the funds would be used. Another district sent surveys to teachers in its public and nonpublic schools asking about the types of professional development activities in which the teachers would most like to participate. The district decided on activities and providers on the basis of the survey results. Content of Professional Development Activities The CSR program guidance provided multiple sample topics for professional development, only one of which focused explicitly on reduced class size (U.S. Department of Education, 2000, p. 23). District personnel and principals both reported that teachers participated in a variety of staff development activities. Teachers were most likely to get staff development related to reading strategies and the use of educational technology. Some districts heeded the suggestions provided by the program guidance to coordinate efforts with the Reading Excellence Act program; others coordinated efforts with the reading program currently in place in their district or school (U.S. 18 Standard errors: all (3.4); large (3.9); medium (5.1); small (4.6). Chi-square test was significant
at the p < .01 level (chi value was 10.84).
Evaluation of the Federal CSR Program: Chapter 3 37
Department of Education, 2000, p. 23). Few teachers participated in activities related to working in reduced-size classes. Principals reported that their teachers’ professional development activities (not necessarily funded by federal CSR) focused on reading strategies or instruction techniques and the use of educational technology. Further, teachers in CSR classrooms were just as likely as teachers in non-CSR classrooms to receive professional development (Table 3.7), except that teachers in CSR classrooms were more likely to receive professional development about instruction for reduced-size classrooms than teachers in non-CSR classrooms (22 and 12 percent, respectively). Like principals, few district administrators reported that teachers received training on instructional techniques appropriate for reduced-size classrooms. Only 38 percent of district respondents reported that teachers participated in activities related to pedagogical techniques for working with students in small classes (Table 3.8). A majority of districts reported that their federal-CSR-supported profes-sional development activities were related to subject matter content in reading (80 percent), and 73 percent of districts reported that the focus of staff development was general teaching techniques. Our case study data illustrate several examples of professional development activities paid for with federal CSR funds that focused on reading and literacy. In one district, CSR-funded professional development was coordinated with Reading Excellence Act training to help teachers work with diverse student populations and their parents. Another district also focused its federal-CSR-funded staff development on reading through workshops titled “Improving Reading and Science Instruction” and “Incorporating Reading and Science.”
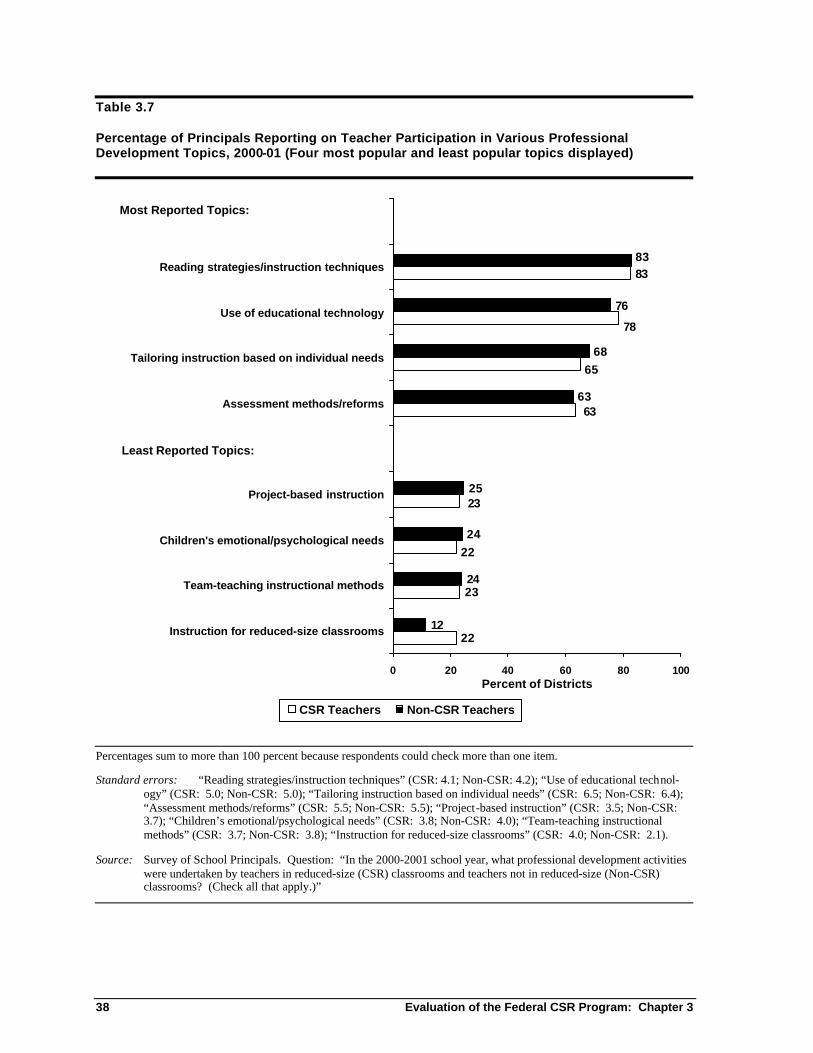
38 Evaluation of the Federal CSR Program: Chapter 3
Table 3.7 Percentage of Principals Reporting on Teacher Participation in Various Professional Development Topics, 2000-01 (Four most popular and least popular topics displayed)
22
23
83
12
24
24
25
63
68
76
22
23
65
78
63
83
0 20 40 60 80 100
Instruction for reduced-size classrooms
Team-teaching instructional methods
Children's emotional/psychological needs
Project-based instruction
Assessment methods/reforms
Tailoring instruction based on individual needs
Use of educational technology
Reading strategies/instruction techniques
Percent of Districts
CSR Teachers Non-CSR Teachers
Percentages sum to more than 100 percent because respondents could check more than one item.
Standard errors: “Reading strategies/instruction techniques” (CSR: 4.1; Non-CSR: 4.2); “Use of educational technol-ogy” (CSR: 5.0; Non-CSR: 5.0); “Tailoring instruction based on individual needs” (CSR: 6.5; Non-CSR: 6.4); “Assessment methods/reforms” (CSR: 5.5; Non-CSR: 5.5); “Project-based instruction” (CSR: 3.5; Non-CSR: 3.7); “Children’s emotional/psychological needs” (CSR: 3.8; Non-CSR: 4.0); “Team-teaching instructional methods” (CSR: 3.7; Non-CSR: 3.8); “Instruction for reduced-size classrooms” (CSR: 4.0; Non-CSR: 2.1).
Source: Survey of School Principals. Question: “In the 2000-2001 school year, what professional development activities were undertaken by teachers in reduced-size (CSR) classrooms and teachers not in reduced-size (Non-CSR) classrooms? (Check all that apply.)”
Most Reported Topics:
Least Reported Topics:
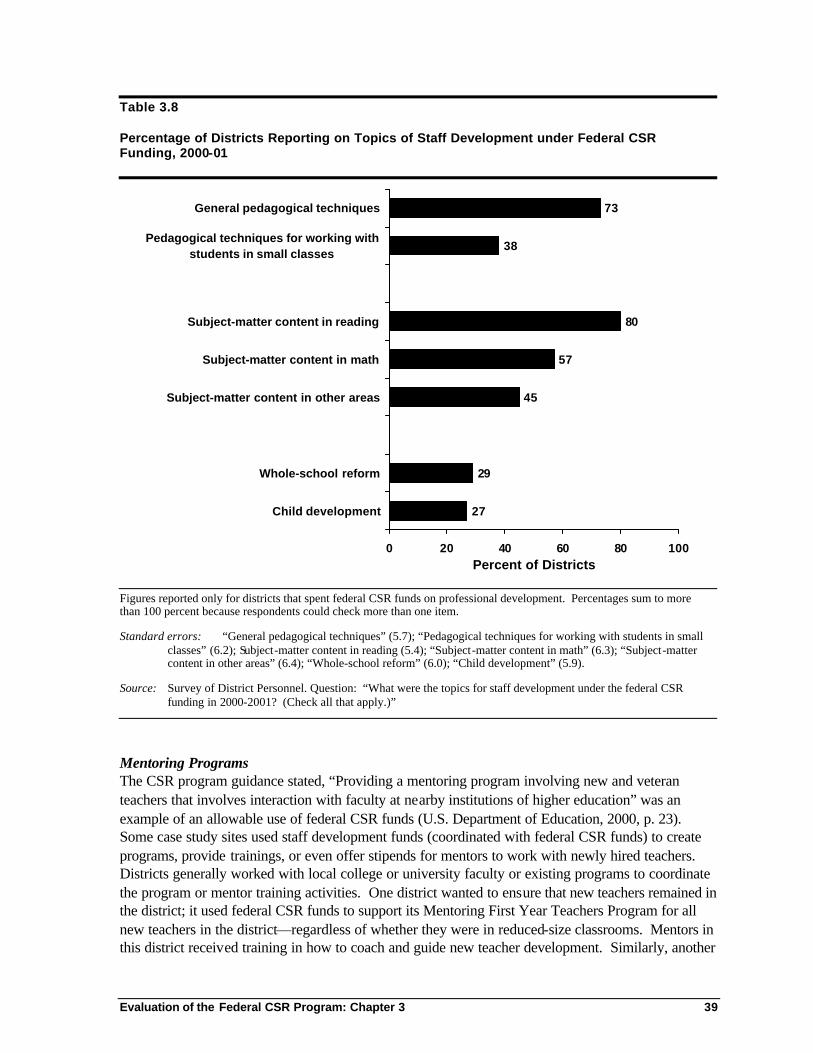
Evaluation of the Federal CSR Program: Chapter 3 39
Table 3.8 Percentage of Districts Reporting on Topics of Staff Development under Federal CSR Funding, 2000-01
27
29
45
57
80
38
73
0 20 40 60 80 100
Child development
Whole-school reform
Subject-matter content in other areas
Subject-matter content in math
Subject-matter content in reading
Pedagogical techniques for working withstudents in small classes
General pedagogical techniques
Percent of Districts
Figures reported only for districts that spent federal CSR funds on professional development. Percentages sum to more than 100 percent because respondents could check more than one item.
Standard errors: “General pedagogical techniques” (5.7); “Pedagogical techniques for working with students in small classes” (6.2); Subject-matter content in reading (5.4); “Subject-matter content in math” (6.3); “Subject-matter content in other areas” (6.4); “Whole-school reform” (6.0); “Child development” (5.9).
Source: Survey of District Personnel. Question: “What were the topics for staff development under the federal CSR funding in 2000-2001? (Check all that apply.)”
Mentoring Programs The CSR program guidance stated, “Providing a mentoring program involving new and veteran teachers that involves interaction with faculty at nearby institutions of higher education” was an example of an allowable use of federal CSR funds (U.S. Department of Education, 2000, p. 23). Some case study sites used staff development funds (coordinated with federal CSR funds) to create programs, provide trainings, or even offer stipends for mentors to work with newly hired teachers. Districts generally worked with local college or university faculty or existing programs to coordinate the program or mentor training activities. One district wanted to ensure that new teachers remained in the district; it used federal CSR funds to support its Mentoring First Year Teachers Program for all new teachers in the district—regardless of whether they were in reduced-size classrooms. Mentors in this district received training in how to coach and guide new teacher development. Similarly, another
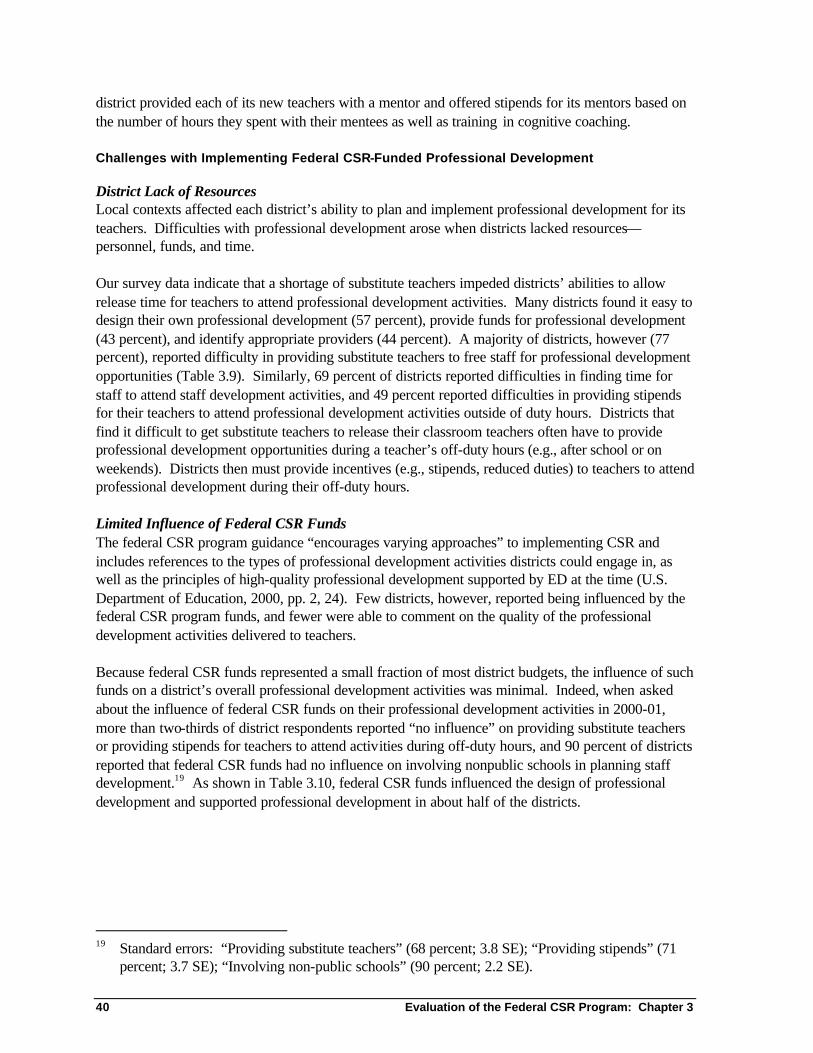
40 Evaluation of the Federal CSR Program: Chapter 3
district provided each of its new teachers with a mentor and offered stipends for its mentors based on the number of hours they spent with their mentees as well as training in cognitive coaching. Challenges with Implementing Federal CSR-Funded Professional Development
District Lack of Resources Local contexts affected each district’s ability to plan and implement professional development for its teachers. Difficulties with professional development arose when districts lacked resources—personnel, funds, and time. Our survey data indicate that a shortage of substitute teachers impeded districts’ abilities to allow release time for teachers to attend professional development activities. Many districts found it easy to design their own professional development (57 percent), provide funds for professional development (43 percent), and identify appropriate providers (44 percent). A majority of districts, however (77 percent), reported difficulty in providing substitute teachers to free staff for professional development opportunities (Table 3.9). Similarly, 69 percent of districts reported difficulties in finding time for staff to attend staff development activities, and 49 percent reported difficulties in providing stipends for their teachers to attend professional development activities outside of duty hours. Districts that find it difficult to get substitute teachers to release their classroom teachers often have to provide professional development opportunities during a teacher’s off-duty hours (e.g., after school or on weekends). Districts then must provide incentives (e.g., stipends, reduced duties) to teachers to attend professional development during their off-duty hours. Limited Influence of Federal CSR Funds The federal CSR program guidance “encourages varying approaches” to implementing CSR and includes references to the types of professional development activities districts could engage in, as well as the principles of high-quality professional development supported by ED at the time (U.S. Department of Education, 2000, pp. 2, 24). Few districts, however, reported being influenced by the federal CSR program funds, and fewer were able to comment on the quality of the professional development activities delivered to teachers. Because federal CSR funds represented a small fraction of most district budgets, the influence of such funds on a district’s overall professional development activities was minimal. Indeed, when asked about the influence of federal CSR funds on their professional development activities in 2000-01, more than two-thirds of district respondents reported “no influence” on providing substitute teachers or providing stipends for teachers to attend activities during off-duty hours, and 90 percent of districts reported that federal CSR funds had no influence on involving nonpublic schools in planning staff development.19 As shown in Table 3.10, federal CSR funds influenced the design of professional development and supported professional development in about half of the districts.
19 Standard errors: “Providing substitute teachers” (68 percent; 3.8 SE); “Providing stipends” (71
percent; 3.7 SE); “Involving non-public schools” (90 percent; 2.2 SE).
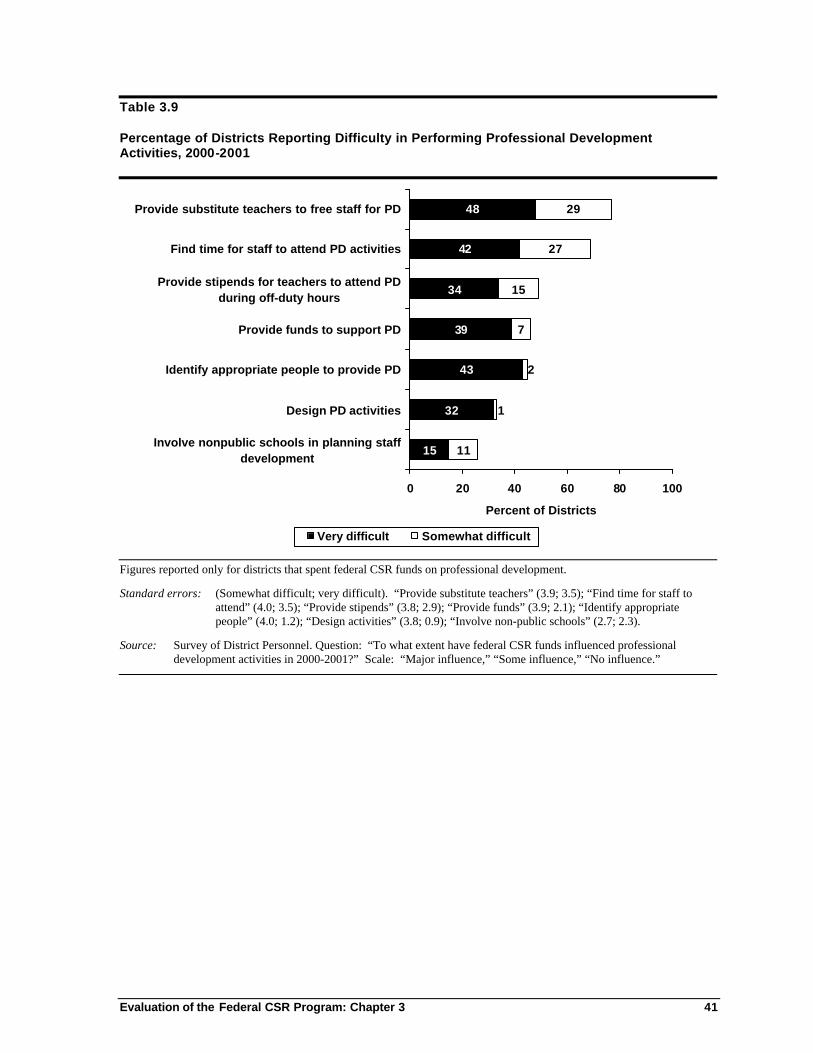
Evaluation of the Federal CSR Program: Chapter 3 41
Table 3.9 Percentage of Districts Reporting Difficulty in Performing Professional Development Activities, 2000-2001
15
32
43
39
34
42
48
11
7
15
27
29
2
1
0 20 40 60 80 100
Involve nonpublic schools in planning staffdevelopment
Design PD activities
Identify appropriate people to provide PD
Provide funds to support PD
Provide stipends for teachers to attend PDduring off-duty hours
Find time for staff to attend PD activities
Provide substitute teachers to free staff for PD
Percent of Districts
Very difficult Somewhat difficult
Figures reported only for districts that spent federal CSR funds on professional development.
Standard errors: (Somewhat difficult; very difficult). “Provide substitute teachers” (3.9; 3.5); “Find time for staff to attend” (4.0; 3.5); “Provide stipends” (3.8; 2.9); “Provide funds” (3.9; 2.1); “Identify appropriate people” (4.0; 1.2); “Design activities” (3.8; 0.9); “Involve non-public schools” (2.7; 2.3).
Source: Survey of District Personnel. Question: “To what extent have federal CSR funds influenced professional development activities in 2000-2001?” Scale: “Major influence,” “Some influence,” “No influence.”
42 Evaluation of the Federal CSR Program: Chapter 3
Table 3.10 Percentage of Districts Reporting Level of Influence of Federal CSR on District’s Professional Development Activities, 2000-2001
1
11
8
10
13
25
19
9
18
24
26
26
21
30
0 20 40 60 80 100
Involve nonpublic schools in planning staffdevelopment
Provide stipends for teachers to attend PDduring off-duty hours
Provide substitute teachers to free staff for PD
Identify appropriate people to provide PD
Find time for staff to attend PD activities
Provide funds to support PD
Design PD activities
Percent of Districts
Major influence Some influence
Figures reported only for districts that spent federal CSR funds on professional development.
Standard errors: “Design PD activities” (major 3.3; some 3.7); “Provide funds to support PD” (major 3.6; some 3.2); “Find time for staff to attend PD activities” (major 2.8; some 3.6); “Identify appropriate people to provide PD” (major 2.5; some 3.6); “Provide substitute teachers to free staff for PD” (major 2.4; some 3.5); “Provide stipends for teachers to attend PD during off-duty hours” (major 2.6; some 3.1); “Involve non-public schools in planning staff development” (major 0.9; some 2.0).
Source: Survey of District Personnel. Question: “In school year 2000-2001, how easy or difficult was it to perform the following professional development activities in your district?” Scale: “Not applicable,” “Easy,” “Somewhat difficult,” “Very Difficult,” “Unable to hire.”
Our case study data indicate that federal CSR funds had little influence in those districts that supple -mented existing activities or implemented programs for all teachers, regardless of whether they taught in a reduced-size classroom. In one district with an existing districtwide literacy and mathematics program, professional development funds supplemented training activities for the specialists who were already working in schools as part of the program. Another district with a long-standing alternative certification program used CSR funds for professional materials and a library for teacher candidates in the program. In these two districts, federal CSR funds simply supplemented extant activities.
Evaluation of the Federal CSR Program: Chapter 3 43
Few, if any, districts evaluated the quality of CSR-funded professional development provided to teachers. Our case study data suggest that evaluation efforts were typically informal, with teachers sharing their impressions of the workshops with other teachers at their schools or with district administrators. In some cases, the providers asked participants to submit evaluation forms, but rarely did districts or schools see the results of such evaluations. In one district, participants completed an evaluation after each professional development session, and some district staff developers attended the sessions. In another district, informal evaluations of a federal CSR-funded professional development activity led to the conclusion that the activity was “good.” Summary Districts that used federal CSR funds for professional development often used the funds to supplement reading initiatives or other local projects already underway, prior to federal CSR implementation. CSR funds were rarely used to support professional development focused on improving instruction in reduced-size classrooms. Overall, the federal CSR program had minimal influence on districts’ professional development activities.
Resources
Facility Resource Issues
Reducing class size necessitated the availability or creation of additional classroom space; federal CSR funds could not be used for facilities, however. Further, although CSR initially was conceived to be accompanied by other legislation to provide federal support for school construction, its partner legislation was never approved by Congress. The implementation of CSR thus varies greatly across districts, not only according to districts’ ability to hire qualified teachers but also according to districts’ ability to find space for any additional classes created by reducing the number of students in each class. Overall, the majority of districts (70 percent) reported having no facilities-related problems due to the CSR initia tive. Whereas less than one-quarter (22 percent) of small districts reported facilities problems, over one-third (39 percent) of medium districts and more than half (59 percent) of large districts had problems. As shown in Table 3.11, the two most frequently cited facility problems were insufficient classrooms and insufficient funds to modify existing facilities. Almost 90 percent of large districts reported that they lacked additional rooms to convert to classroom use, and more than 60 percent reported insufficient funds available to modify existing facilities.
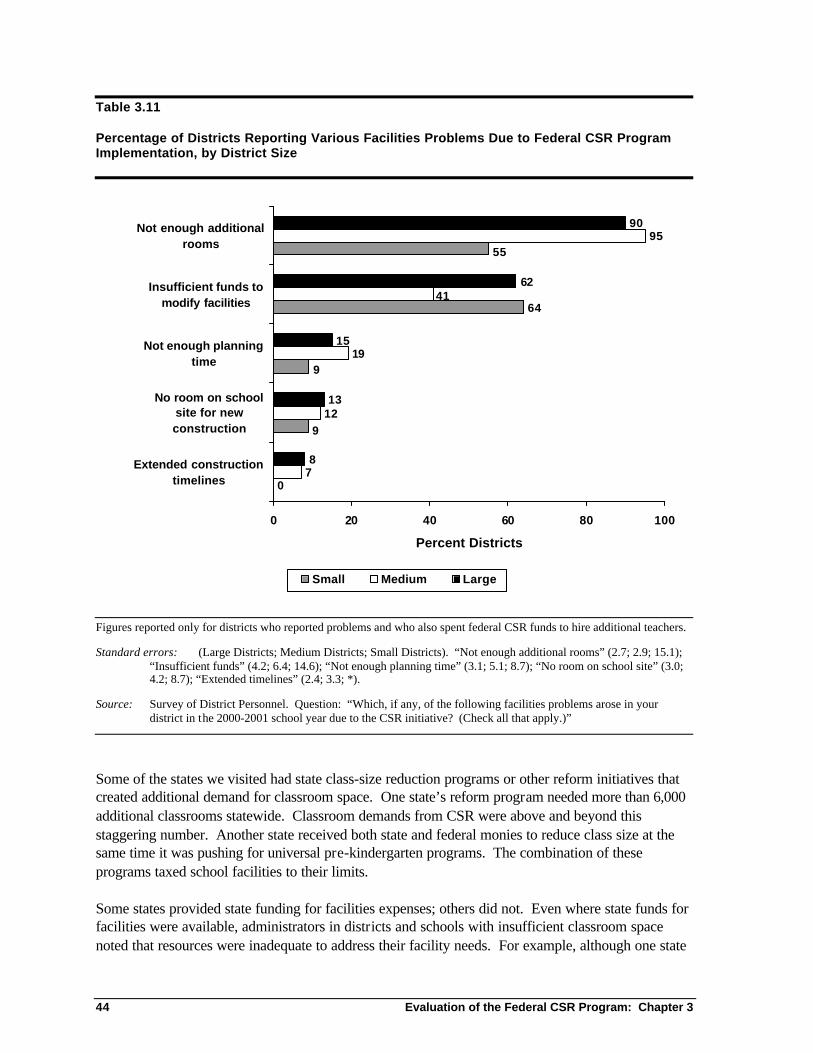
44 Evaluation of the Federal CSR Program: Chapter 3
Table 3.11 Percentage of Districts Reporting Various Facilities Problems Due to Federal CSR Program Implementation, by District Size
0
64
7
12
19
95
8
13
15
62
90
9
9
55
41
0 20 40 60 80 100
Extended constructiontimelines
No room on schoolsite for newconstruction
Not enough planningtime
Insufficient funds tomodify facilities
Not enough additionalrooms
Percent Districts
Small Medium Large
Figures reported only for districts who reported problems and who also spent federal CSR funds to hire additional teachers.
Standard errors: (Large Districts; Medium Districts; Small Districts). “Not enough additional rooms” (2.7; 2.9; 15.1); “Insufficient funds” (4.2; 6.4; 14.6); “Not enough planning time” (3.1; 5.1; 8.7); “No room on school site” (3.0; 4.2; 8.7); “Extended timelines” (2.4; 3.3; *).
Source: Survey of District Personnel. Question: “Which, if any, of the following facilities problems arose in your district in the 2000-2001 school year due to the CSR initiative? (Check all that apply.)”
Some of the states we visited had state class-size reduction programs or other reform initiatives that created additional demand for classroom space. One state’s reform program needed more than 6,000 additional classrooms statewide. Classroom demands from CSR were above and beyond this staggering number. Another state received both state and federal monies to reduce class size at the same time it was pushing for universal pre-kindergarten programs. The combination of these programs taxed school facilities to their limits. Some states provided state funding for facilities expenses; others did not. Even where state funds for facilities were available, administrators in districts and schools with insufficient classroom space noted that resources were inadequate to address their facility needs. For example, although one state
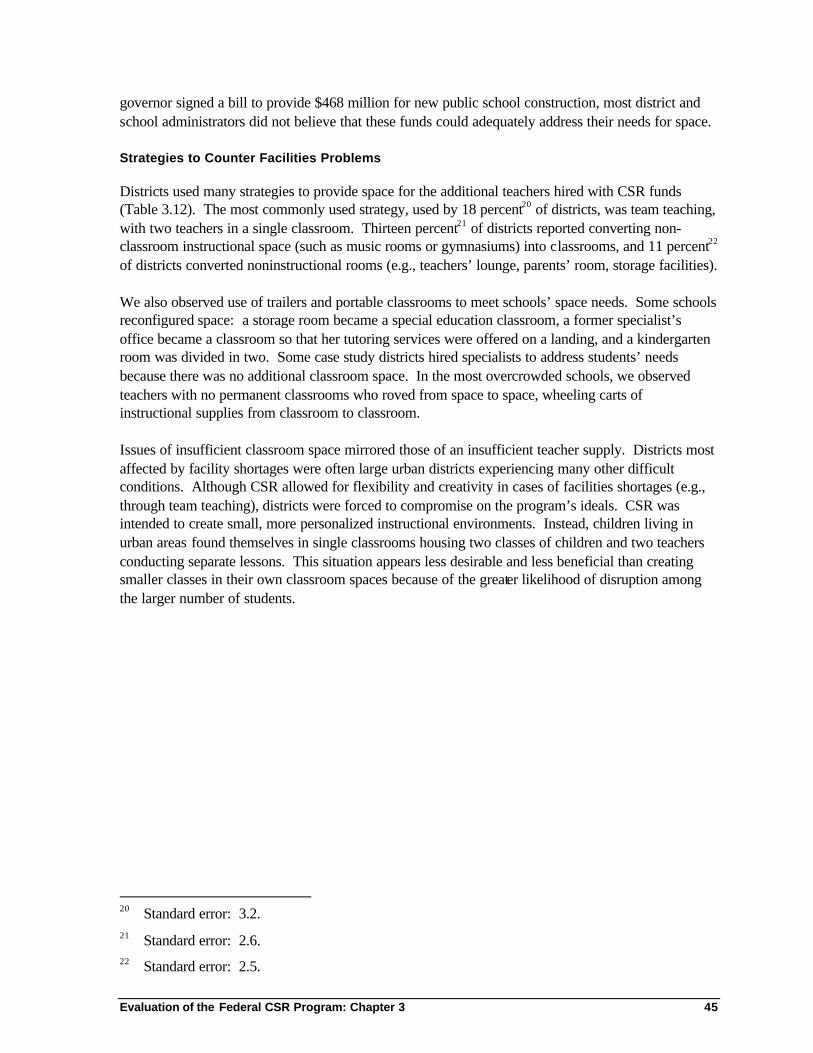
Evaluation of the Federal CSR Program: Chapter 3 45
governor signed a bill to provide $468 million for new public school construction, most district and school administrators did not believe that these funds could adequately address their needs for space. Strategies to Counter Facilities Problems
Districts used many strategies to provide space for the additional teachers hired with CSR funds (Table 3.12). The most commonly used strategy, used by 18 percent20 of districts, was team teaching, with two teachers in a single classroom. Thirteen percent21 of districts reported converting non-classroom instructional space (such as music rooms or gymnasiums) into classrooms, and 11 percent22 of districts converted noninstructional rooms (e.g., teachers’ lounge, parents’ room, storage facilities). We also observed use of trailers and portable classrooms to meet schools’ space needs. Some schools reconfigured space: a storage room became a special education classroom, a former specialist’s office became a classroom so that her tutoring services were offered on a landing, and a kindergarten room was divided in two. Some case study districts hired specialists to address students’ needs because there was no additional classroom space. In the most overcrowded schools, we observed teachers with no permanent classrooms who roved from space to space, wheeling carts of instructional supplies from classroom to classroom. Issues of insufficient classroom space mirrored those of an insufficient teacher supply. Districts most affected by facility shortages were often large urban districts experiencing many other difficult conditions. Although CSR allowed for flexibility and creativity in cases of facilities shortages (e.g., through team teaching), districts were forced to compromise on the program’s ideals. CSR was intended to create small, more personalized instructional environments. Instead, children living in urban areas found themselves in single classrooms housing two classes of children and two teachers conducting separate lessons. This situation appears less desirable and less beneficial than creating smaller classes in their own classroom spaces because of the greater likelihood of disruption among the larger number of students.
20 Standard error: 3.2. 21 Standard error: 2.6. 22 Standard error: 2.5.
46 Evaluation of the Federal CSR Program: Chapter 3
Table 3.12 Percentage of Districts Reporting Use of Various Strategies to Provide Space for Additional Teachers, by District Size
7
21
29
21
29
29
36
3
8
13
23
17
28
42
42
2
9
23
30
37
37
46
58
0 20 40 60 80 100
Used off-site facilities
Added newconstruction
Created additionalclassrooms with
partitions
Placed resourceteachers in multiple
classrooms
Added portables
Convertednoninstructional
rooms
Converted otherinstructional rooms
into classrooms
Used team teaching
Percent of Districts
Small Medium Large
Figures reported only for districts that spent federal CSR funds to hire additional teachers. Percentages sum to more than 100 percent because respondents could check more than one item.
Standard errors: (Large Districts; Medium Districts; Small Districts). “Used team teaching” (4.2; 6.4; 12.9); “Converted other instructional rooms” (4.2; 6.4; 12.2); “Converted noninstructional rooms” (4.1; 5.8; 12.2); “Added portables” (4.1; 4.8; 11.0); “Placed resource teachers” (3.8; 5.5; 12.2); “Created additional classrooms with partitions” (3.5; 4.4; 11.0); “Added new construction” (2.4; 3.6; 6.9); “Used off-site facilities” (1.2; 2.3; *).
Source: Survey of District Personnel. Question: “To provide space for the additional teachers hired, what did your district do in 2000-2001? (Check all that apply.)”
Evaluation of the Federal CSR Program: Chapter 3 47
Financial Resource Issues
CSR implementation was also affected by other administrative and resource-related issues. The CSR statute allowed no funds to be used for state-level program administration. States were, however, able to “use funds appropriated for Title VI of the Elementary and Secondary Education Act [that are] reserved for State administration costs to help pay for administrative costs associated with this program” (U.S. Department of Education, 2000, p. 15). Even so, the lack of state administrative funds resulted in minimal state involvement in the program and the common perception that the federal CSR program was a burden on the state. In most states, CSR implementation was only one of many tasks assigned to a single administrator. State administrators spent time completing the tasks necessary to run the program, such as writing the federal grant application, reviewing district applications, monitoring waivers, and distributing funds. They spent limited time on other tasks, however, such as providing technical assistance to districts and collecting data on the uses or effectiveness of the program. District and school administrators expressed concern about the late notification of the availability of CSR funds in 1999-2000. One district was not notified of its CSR allocation until the beginning of October 1999. Because of the late notification, this district and others either were unable to hire all the teachers they had been allocated or, as one district respondent noted, had to choose from the “lower-end teachers who require a lot of energy and resources.” One district had a carryover of approximately $1 million because the district’s area superintendents received confirmation of the funding too late to hire teachers. In spring 2001, most districts were not affected by the uncertain future of the CSR program.23 Most of the districts we visited believed that if the program were cancelled, they would be able to retain CSR teachers and absorb them into the system through the regular attrition of teachers. Some districts even offered CSR teachers a regular teaching contract. In a few districts, however, the uncertainty of the program’s future had a negative impact on the program. Local administrators were careful about placing teachers in CSR positions—they were reluctant to place their veteran and highly skilled teachers in provisional positions. They also were uncomfortable hiring new teachers when they did not know the long-term funding prospects because they would not be able to continue paying for the positions. One district administrator commented that although CSR teachers could be retained because of normal teacher attrition, teachers who receive a pink slip (and then are rehired when funding is guaranteed) look for more job security in other districts. In a majority of our case study states, small rural districts opted to forgo CSR funds because their allocation was too small to hire a teacher or implement any program of substance. Further, because of the prohibitive distances between rural districts, forming a consortium to share a teacher was neither compelling nor feasible to district administrators. (A consortium was required in 1999–2000 only among districts receiving small allocations.) These resource-related issues point to the importance of having implementation considerations taken into account at the federal level. Because the announcement and the distribution of federal CSR funds were not coordinated with districts’ hiring schedules, the intent of the program was 23 In January 2002, under the reauthorization of the Elementary and Secondary Education Act
(ESEA) by the No Child Left Behind Act, class-size reduction became an allowable activity under Title II, Part A, of ESEA, rather than a separately funded, mandated program.
48 Evaluation of the Federal CSR Program: Chapter 3
compromised when districts were unable to hire the most qualified teachers. The lack of funding for state administration resulted in state administrators serving as compliance monitors rather than technical assistance providers. The formula for distributing CSR funds among districts resulted in allocations for rural districts that were so meager that some rural districts turned down the money. These federal decisions had a real, influential impact on states’ and districts’ ability to implement the program most effectively.
Classroom Practices
Visits were made to 24 schools in 12 large districts across six states. At least two CSR classrooms were observed in each school, for a total of 48 classrooms and 48 teachers. In nearly every interview, teachers and principals emphasized that the primary benefit of CSR classes was the opportunity to give students more time and attention. They argued that this allowed them to know their students’ academic, social, and emotional needs more accurate ly than they could in non-CSR classes. During our classroom observations, some teachers reported that due to smaller classes, they now tailored instruction and maximized one-on-one time. It was not unusual to see teachers conducting a variety of hands-on activities with small groups of students, whereas the rest of the class worked indepen-dently. In these cases, nearly all students were “on task” all of the time, and teachers reported satisfaction with their shift in instructional practices. Teachers also reported that smaller classes allowed them to better address students’ social and emotional needs, along with their academic needs. Despite the positive reports of principals and teachers, however, evidence from our classroom observations also suggested that small classes did not guarantee more effective instruction. Among our classroom observations, we also found CSR classes functioning like non-CSR classes. We found smaller classes that were arranged in a traditional manner with desks in rows with the teacher lecturing from the front of the classroom. Although some teachers took advantage of smaller classes to improve instructional effectiveness, others used smaller classes to reduce their own workload. In a few cases, we found team teaching arrangements where teachers simply traded off responsibility for instruction. Our observations and self-reported teacher and principal data reveal a mixed picture of instructional practices in CSR classes. Because we did not conduct an independent analysis of the impact of CSR on teaching practice or on student outcomes, however, we cannot draw any conclusions about the effects of CSR on teaching and learning.
Conclusion
The variation in program implementation across districts demonstrates the limited ability of small amounts of federal funds to create more effective learning environments for students throughout the nation. Where conditions were right—where there were ample supplies of well-qualified and credentialed teachers, where classroom space was available, where professional development plans were coherent and relevant to teaching in smaller classes, and where districts were able to hire teachers year-round and absorb them into the system should funds be eliminated—the program was more likely to be implemented as intended by the legislation. Students could be placed in reduced-size classes with well-qualified teachers. Many districts across the country, however, did not have these prerequisite conditions and were in areas experiencing acute teacher shortages. Facilities were limited, and opening new classrooms was not an option. Late funding notification meant positions
Evaluation of the Federal CSR Program: Chapter 3 49
could not be filled—the few credentialed teachers in the labor market had long since been hired. CSR funds certainly provided additional value to these districts and were enthusiastically welcomed by districts and schools; however, their effect was not as strong as in districts with more manageable contextual conditions. The federal CSR legislation assumed that both teachers and classroom space were universally available; neither is. Further, the limited amounts of funds available for this program constrained districts’ and schools’ abilities to make substantial changes with the funds. CSR was a small program that resulted in the hiring of very few teachers in any given school. Funds used for purposes other than hiring teachers (e.g., recruitment and professional development) were even more limited. Thus, districts and schools used CSR funds to supplement existing programs rather than to develop efforts specifically related to reduced class sizes. CSR funds for professional development were used primarily to augment preexisting professional development programs designed to support other reform efforts, often in reading. Professiona l development programs were not geared toward improving teachers’ effectiveness with smaller classes. Likewise, CSR funds for recruitment supplemented preexisting recruitment activities, primarily travel. In other words, CSR enabled districts to augment, moderately or slightly, what they were already doing.

50 Evaluation of the Federal CSR Program: Chapter 3
51
Chapter 4 Changes in Class Size
Overview
The goal of the federal CSR program was to help school districts reduce class sizes in the early elementary grades to no more than 18 students per teacher. Schools were encouraged to reach this target class size by creating additional, independent classrooms, but alternative arrangements, such as team teaching or subject matter specialists were allowable. This chapter examines the extent to which class size was reduced during the time frame of the federal program. Class size in this study is defined as the number of students per classroom, in those grades and schools where classroom teachers were added to reduce class size. Hence, the class size figures we computed are smaller than would be found nationwide. The evaluation questions that frame this chapter are the following:
• What reductions in class sizes were found in grades K-3 in those schools that hired at least one CSR teacher?
• What methods were used to reduce class size?
• In what grades were class sizes reduced? For what reasons?
• Did reductions in class sizes in grades K-3 have spillover effects in non-targeted grades?
• Did enrollment increases wipe out reductions in class size? The district and principal surveys provide data at the national level of the overall effects of the program on class size, the most commonly used methods for reducing class size, and the problems most frequently encountered. The case studies in six states and 12 large districts illustrate why some states and districts have targeted particular early elementary grades and also describe variations in approaches to reducing class size.
Major Findings
• After implementation of the federal CSR program, the average class size in the targeted grades decreased by one to two students, depending on grade level. In 2000-01, overall average class sizes ranged from 18 students per classroom in kindergarten to 20 in grade one, and 21 students per classroom in grades 2 and 3. There are two reasons for the modest reduction in average class size. Many schools (44 percent) did not assign the CSR teacher to a separate classroom but rather assigned the teacher to special subjects or team teaching. Even in schools where teachers were assigned to their own classrooms, 52 percent had simultaneous increases in enrollment that mitigated class size reduction. Overall, 73 percent of schools either did not assign teachers to separate classes or had enrollment increases that reduced CSR’s impact.
• Before implementation of the federal CSR program, many districts were already working
to reduce class sizes in the early elementary grades, either because of state mandates, contractual bargaining agreements with teachers’ unions, or strong local commitment to smaller learning communities.
52 Evaluation of the Federal CSR Program: Chapter 4
• Schools used a variety of methods to reduce class size. More than half (57 percent) of
schools using federal CSR funds placed CSR teachers in separate classrooms. One in four schools (24 percent) hired teachers to assist students with priority subjects (e.g., reading or mathematics) in multiple classrooms, one in six schools (17 percent) created additional class sections in priority subjects, and about 10 percent used team-teaching arrangements. Case studies indicated that state restrictions on the use of state CSR funds sometimes affected how federal funds were used to reduce class size. Several districts used their state CSR funds to staff additional separate classrooms first, then used federal CSR funds to place a supplementary teacher in a large classroom or to hire a subject specialist for multiple classrooms (arrangements not allowed under state restrictions).
• Schools most often used federal CSR funds to reduce class sizes in grades 1-3. In 2000-
2001, 49 percent of schools targeted first grade, 43 percent targeted second grade, and 45 percent targeted third grade. Fifteen percent of schools targeted kindergarten. According to our case studies, some schools reduced class sizes in the first grade to advance early literacy goals, whereas others targeted third grade to prepare students for state-mandated fourth-grade assessment tests.
• On balance, reducing class sizes in grades K-3 did not result in increased class sizes in
the fourth and fifth grades, with some exceptions.
• In small and medium size districts, enrollment increases did not appear to mitigate the effects of the class-size reduction program, but severe teacher shortages, especially in large urban districts, did hinder districts’ ability to reduce class size.
Reduction in Class Size
To measure the changes in class size associated with the federal program, class size ratios were computed from the school survey data using the total number of students divided by the total number of classrooms (Student-Classroom Ratio). Note that the survey of school principals provides data only from those schools and for those grade levels in which federal CSR teachers were hired. Hence, the class-size ratios reported here are lower than national estimates of student-classroom ratios. Table 4.1 displays the average class size in grades K-3 before and after implementation of federal CSR. Note that kindergarten was not covered in the federal CSR program until 2000-01. Seventy-eight percent of these schools began to reduce cla ss size in the 1999-2000 school year. The remaining 20 percent of schools began reduction of class size during the 2000-01 school year.
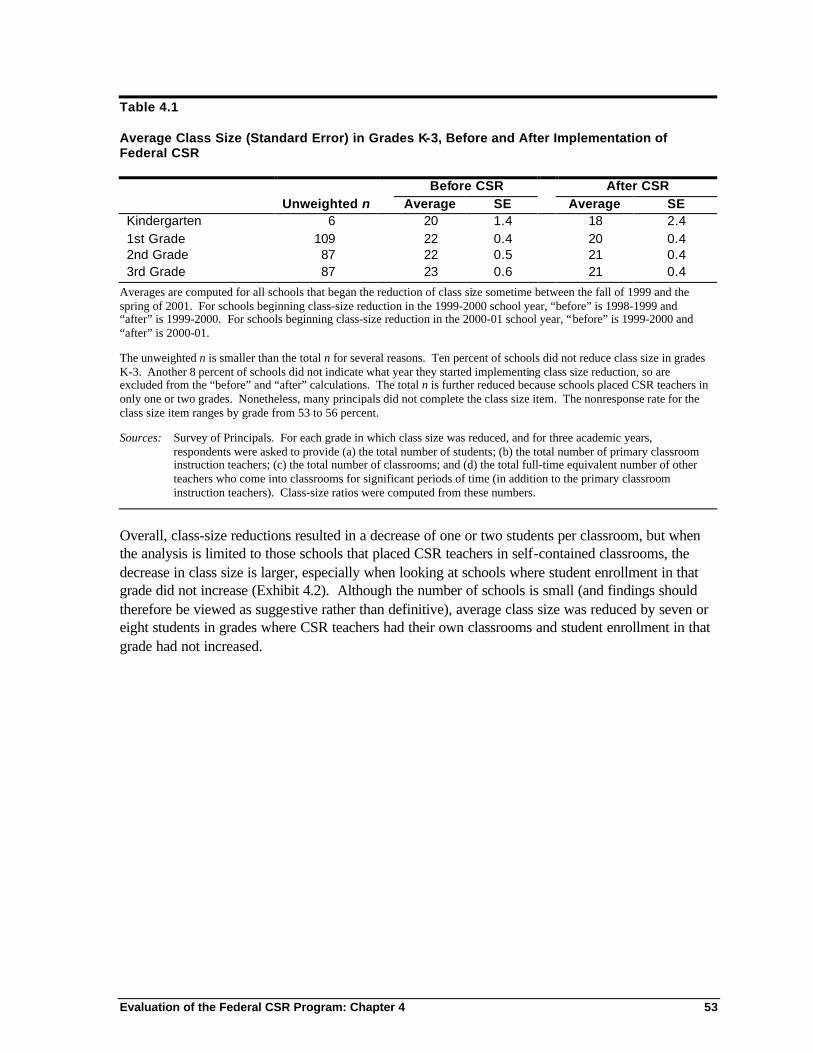
Evaluation of the Federal CSR Program: Chapter 4 53
Table 4.1 Average Class Size (Standard Error) in Grades K-3, Before and After Implementation of Federal CSR
Before CSR After CSR Unweighted n Average SE Average SE
Kindergarten 6 20 1.4 18 2.4 1st Grade 109 22 0.4 20 0.4 2nd Grade 87 22 0.5 21 0.4 3rd Grade 87 23 0.6 21 0.4
Averages are computed for all schools that began the reduction of class size sometime between the fall of 1999 and the spring of 2001. For schools beginning class-size reduction in the 1999-2000 school year, “before” is 1998-1999 and “after” is 1999-2000. For schools beginning class-size reduction in the 2000-01 school year, “before” is 1999-2000 and “after” is 2000-01.
The unweighted n is smaller than the total n for several reasons. Ten percent of schools did not reduce class size in grades K-3. Another 8 percent of schools did not indicate what year they started implementing class size reduction, so are excluded from the “before” and “after” calculations. The total n is further reduced because schools placed CSR teachers in only one or two grades. Nonetheless, many principals did not complete the class size item. The nonresponse rate for the class size item ranges by grade from 53 to 56 percent.
Sources: Survey of Principals. For each grade in which class size was reduced, and for three academic years, respondents were asked to provide (a) the total number of students; (b) the total number of primary classroom instruction teachers; (c) the total number of classrooms; and (d) the total full-time equivalent number of other teachers who come into classrooms for significant periods of time (in addition to the primary classroom instruction teachers). Class-size ratios were computed from these numbers.
Overall, class-size reductions resulted in a decrease of one or two students per classroom, but when the analysis is limited to those schools that placed CSR teachers in self-contained classrooms, the decrease in class size is larger, especially when looking at schools where student enrollment in that grade did not increase (Exhibit 4.2). Although the number of schools is small (and findings should therefore be viewed as suggestive rather than definitive), average class size was reduced by seven or eight students in grades where CSR teachers had their own classrooms and student enrollment in that grade had not increased.
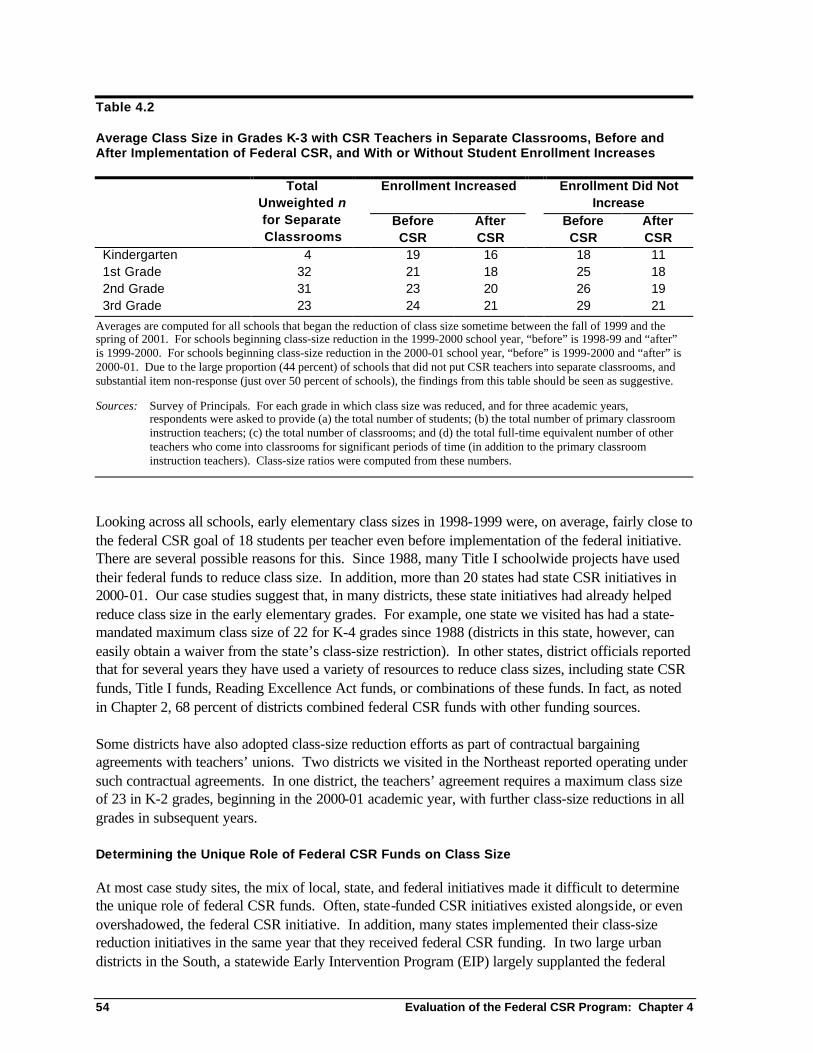
54 Evaluation of the Federal CSR Program: Chapter 4
Table 4.2 Average Class Size in Grades K-3 with CSR Teachers in Separate Classrooms, Before and After Implementation of Federal CSR, and With or Without Student Enrollment Increases
Enrollment Increased Enrollment Did Not Increase
Total Unweighted n for Separate Classrooms
Before CSR
After CSR
Before CSR
After CSR
Kindergarten 4 19 16 18 11 1st Grade 32 21 18 25 18 2nd Grade 31 23 20 26 19 3rd Grade 23 24 21 29 21
Averages are computed for all schools that began the reduction of class size sometime between the fall of 1999 and the spring of 2001. For schools beginning class-size reduction in the 1999-2000 school year, “before” is 1998-99 and “after” is 1999-2000. For schools beginning class-size reduction in the 2000-01 school year, “before” is 1999-2000 and “after” is 2000-01. Due to the large proportion (44 percent) of schools that did not put CSR teachers into separate classrooms, and substantial item non-response (just over 50 percent of schools), the findings from this table should be seen as suggestive.
Sources: Survey of Principals. For each grade in which class size was reduced, and for three academic years, respondents were asked to provide (a) the total number of students; (b) the total number of primary classroom instruction teachers; (c) the total number of classrooms; and (d) the total full-time equivalent number of other teachers who come into classrooms for significant periods of time (in addition to the primary classroom instruction teachers). Class-size ratios were computed from these numbers.
Looking across all schools, early elementary class sizes in 1998-1999 were, on average, fairly close to the federal CSR goal of 18 students per teacher even before implementation of the federal initiative. There are several possible reasons for this. Since 1988, many Title I schoolwide projects have used their federal funds to reduce class size. In addition, more than 20 states had state CSR initiatives in 2000-01. Our case studies suggest that, in many districts, these state initiatives had already helped reduce class size in the early elementary grades. For example, one state we visited has had a state-mandated maximum class size of 22 for K-4 grades since 1988 (districts in this state, however, can easily obtain a waiver from the state’s class-size restriction). In other states, district officials reported that for several years they have used a variety of resources to reduce class sizes, including state CSR funds, Title I funds, Reading Excellence Act funds, or combinations of these funds. In fact, as noted in Chapter 2, 68 percent of districts combined federal CSR funds with other funding sources. Some districts have also adopted class-size reduction efforts as part of contractual bargaining agreements with teachers’ unions. Two districts we visited in the Northeast reported operating under such contractual agreements. In one district, the teachers’ agreement requires a maximum class size of 23 in K-2 grades, beginning in the 2000-01 academic year, with further class-size reductions in all grades in subsequent years. Determining the Unique Role of Federal CSR Funds on Class Size
At most case study sites, the mix of local, state, and federal initiatives made it difficult to determine the unique role of federal CSR funds. Often, state-funded CSR initiatives existed alongside, or even overshadowed, the federal CSR initiative. In addition, many states implemented their class-size reduction initiatives in the same year that they received federal CSR funding. In two large urban districts in the South, a statewide Early Intervention Program (EIP) largely supplanted the federal
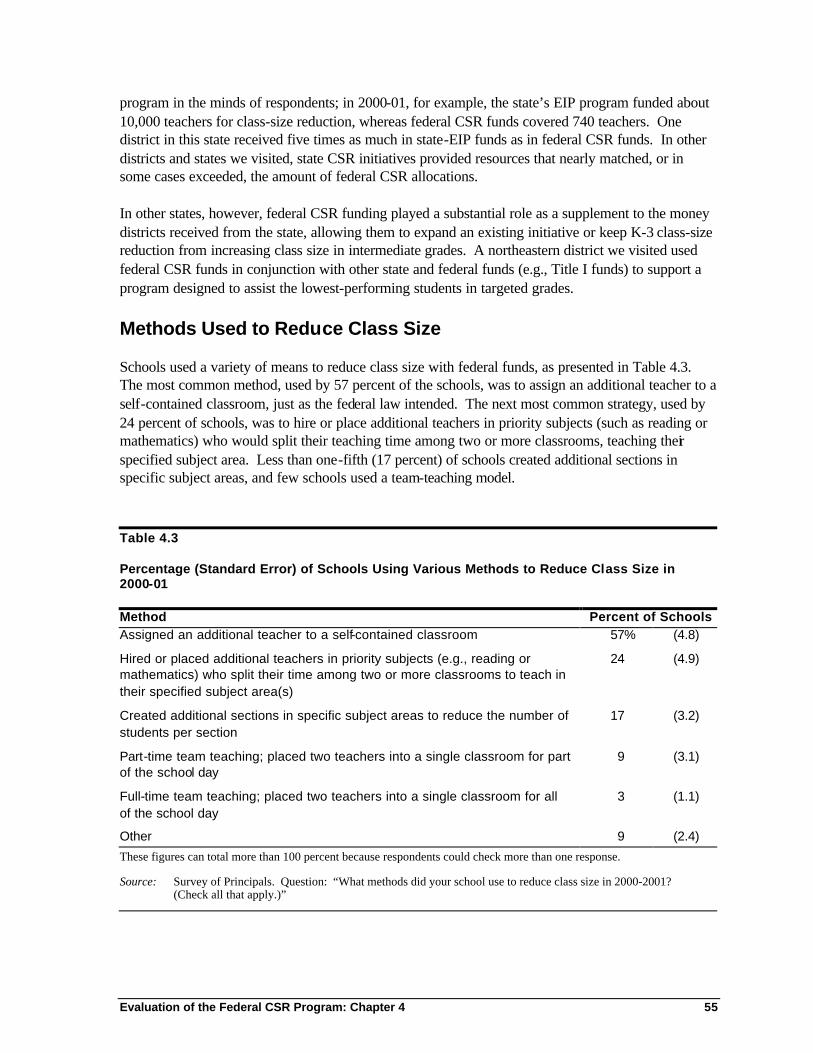
Evaluation of the Federal CSR Program: Chapter 4 55
program in the minds of respondents; in 2000-01, for example, the state’s EIP program funded about 10,000 teachers for class-size reduction, whereas federal CSR funds covered 740 teachers. One district in this state received five times as much in state-EIP funds as in federal CSR funds. In other districts and states we visited, state CSR initiatives provided resources that nearly matched, or in some cases exceeded, the amount of federal CSR allocations. In other states, however, federal CSR funding played a substantial role as a supplement to the money districts received from the state, allowing them to expand an existing initiative or keep K-3 class-size reduction from increasing class size in intermediate grades. A northeastern district we visited used federal CSR funds in conjunction with other state and federal funds (e.g., Title I funds) to support a program designed to assist the lowest-performing students in targeted grades.
Methods Used to Reduce Class Size
Schools used a variety of means to reduce class size with federal funds, as presented in Table 4.3. The most common method, used by 57 percent of the schools, was to assign an additional teacher to a self-contained classroom, just as the federal law intended. The next most common strategy, used by 24 percent of schools, was to hire or place additional teachers in priority subjects (such as reading or mathematics) who would split their teaching time among two or more classrooms, teaching their specified subject area. Less than one-fifth (17 percent) of schools created additional sections in specific subject areas, and few schools used a team-teaching model.
Table 4.3 Percentage (Standard Error) of Schools Using Various Methods to Reduce Class Size in 2000-01 Method Percent of Schools Assigned an additional teacher to a self-contained classroom 57% (4.8)
Hired or placed additional teachers in priority subjects (e.g., reading or mathematics) who split their time among two or more classrooms to teach in their specified subject area(s)
24 (4.9)
Created additional sections in specific subject areas to reduce the number of students per section
17 (3.2)
Part-time team teaching; placed two teachers into a single classroom for part of the school day
9 (3.1)
Full-time team teaching; placed two teachers into a single classroom for all of the school day
3 (1.1)
Other 9 (2.4)
These figures can total more than 100 percent because respondents could check more than one response.
Source: Survey of Principals. Question: “What methods did your school use to reduce class size in 2000-2001? (Check all that apply.)”
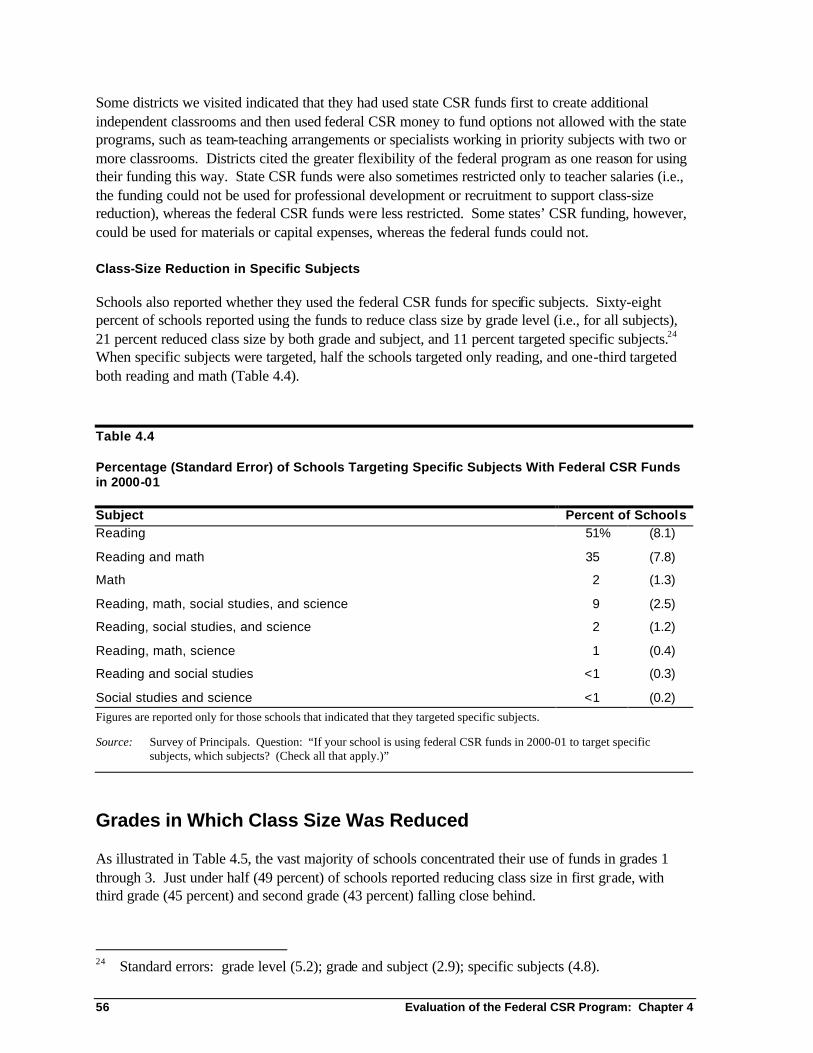
56 Evaluation of the Federal CSR Program: Chapter 4
Some districts we visited indicated that they had used state CSR funds first to create additional independent classrooms and then used federal CSR money to fund options not allowed with the state programs, such as team-teaching arrangements or specialists working in priority subjects with two or more classrooms. Districts cited the greater flexibility of the federal program as one reason for using their funding this way. State CSR funds were also sometimes restricted only to teacher salaries (i.e., the funding could not be used for professional development or recruitment to support class-size reduction), whereas the federal CSR funds were less restricted. Some states’ CSR funding, however, could be used for materials or capital expenses, whereas the federal funds could not. Class-Size Reduction in Specific Subjects
Schools also reported whether they used the federal CSR funds for specific subjects. Sixty-eight percent of schools reported using the funds to reduce class size by grade level (i.e., for all subjects), 21 percent reduced class size by both grade and subject, and 11 percent targeted specific subjects.24 When specific subjects were targeted, half the schools targeted only reading, and one-third targeted both reading and math (Table 4.4).
Table 4.4 Percentage (Standard Error) of Schools Targeting Specific Subjects With Federal CSR Funds in 2000-01 Subject Percent of Schools Reading 51% (8.1)
Reading and math 35 (7.8)
Math 2 (1.3)
Reading, math, social studies, and science 9 (2.5)
Reading, social studies, and science 2 (1.2)
Reading, math, science 1 (0.4)
Reading and social studies <1 (0.3)
Social studies and science <1 (0.2) Figures are reported only for those schools that indicated that they targeted specific subjects.
Source: Survey of Principals. Question: “If your school is using federal CSR funds in 2000-01 to target specific subjects, which subjects? (Check all that apply.)”
Grades in Which Class Size Was Reduced
As illustrated in Table 4.5, the vast majority of schools concentrated their use of funds in grades 1 through 3. Just under half (49 percent) of schools reported reducing class size in first grade, with third grade (45 percent) and second grade (43 percent) falling close behind.
24 Standard errors: grade level (5.2); grade and subject (2.9); specific subjects (4.8).
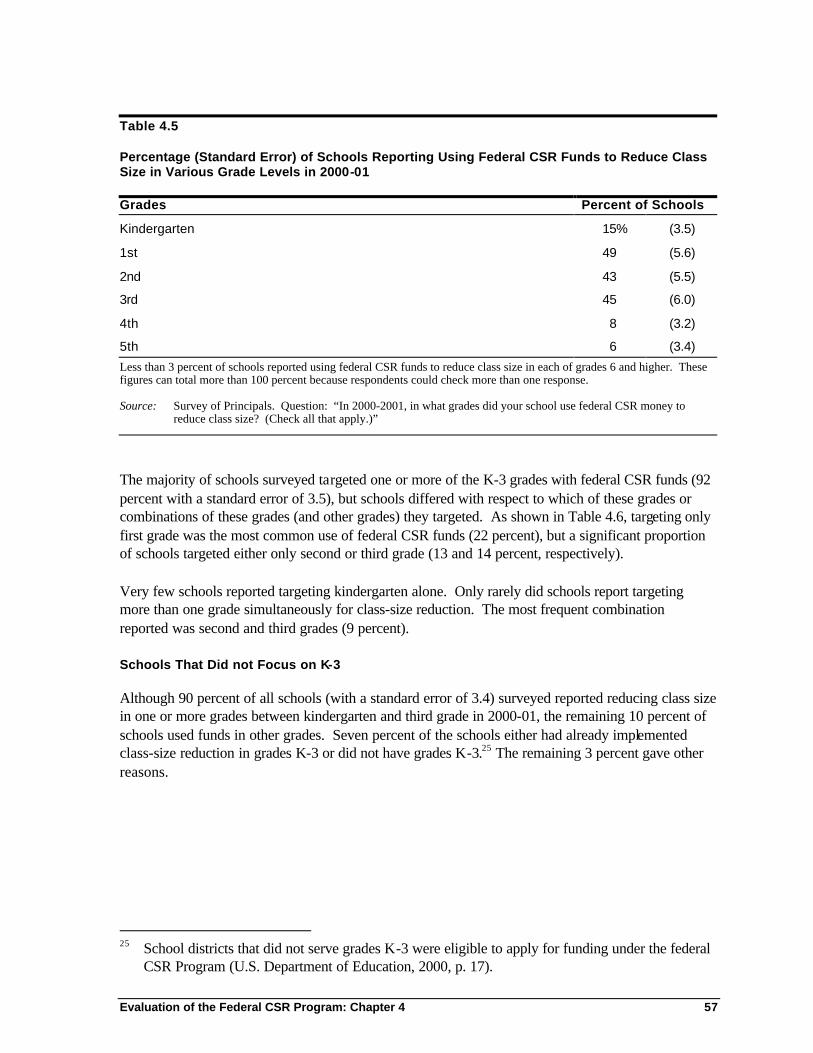
Evaluation of the Federal CSR Program: Chapter 4 57
Table 4.5 Percentage (Standard Error) of Schools Reporting Using Federal CSR Funds to Reduce Class Size in Various Grade Levels in 2000-01 Grades Percent of Schools
Kindergarten 15% (3.5)
1st 49 (5.6)
2nd 43 (5.5)
3rd 45 (6.0)
4th 8 (3.2)
5th 6 (3.4)
Less than 3 percent of schools reported using federal CSR funds to reduce class size in each of grades 6 and higher. These figures can total more than 100 percent because respondents could check more than one response.
Source: Survey of Principals. Question: “In 2000-2001, in what grades did your school use federal CSR money to reduce class size? (Check all that apply.)”
The majority of schools surveyed targeted one or more of the K-3 grades with federal CSR funds (92 percent with a standard error of 3.5), but schools differed with respect to which of these grades or combinations of these grades (and other grades) they targeted. As shown in Table 4.6, targeting only first grade was the most common use of federal CSR funds (22 percent), but a significant proportion of schools targeted either only second or third grade (13 and 14 percent, respectively). Very few schools reported targeting kindergarten alone. Only rarely did schools report targeting more than one grade simultaneously for class-size reduction. The most frequent combination reported was second and third grades (9 percent). Schools That Did not Focus on K-3
Although 90 percent of all schools (with a standard error of 3.4) surveyed reported reducing class size in one or more grades between kindergarten and third grade in 2000-01, the remaining 10 percent of schools used funds in other grades. Seven percent of the schools either had already implemented class-size reduction in grades K-3 or did not have grades K-3.25 The remaining 3 percent gave other reasons.
25 School districts that did not serve grades K-3 were eligible to apply for funding under the federal
CSR Program (U.S. Department of Education, 2000, p. 17).
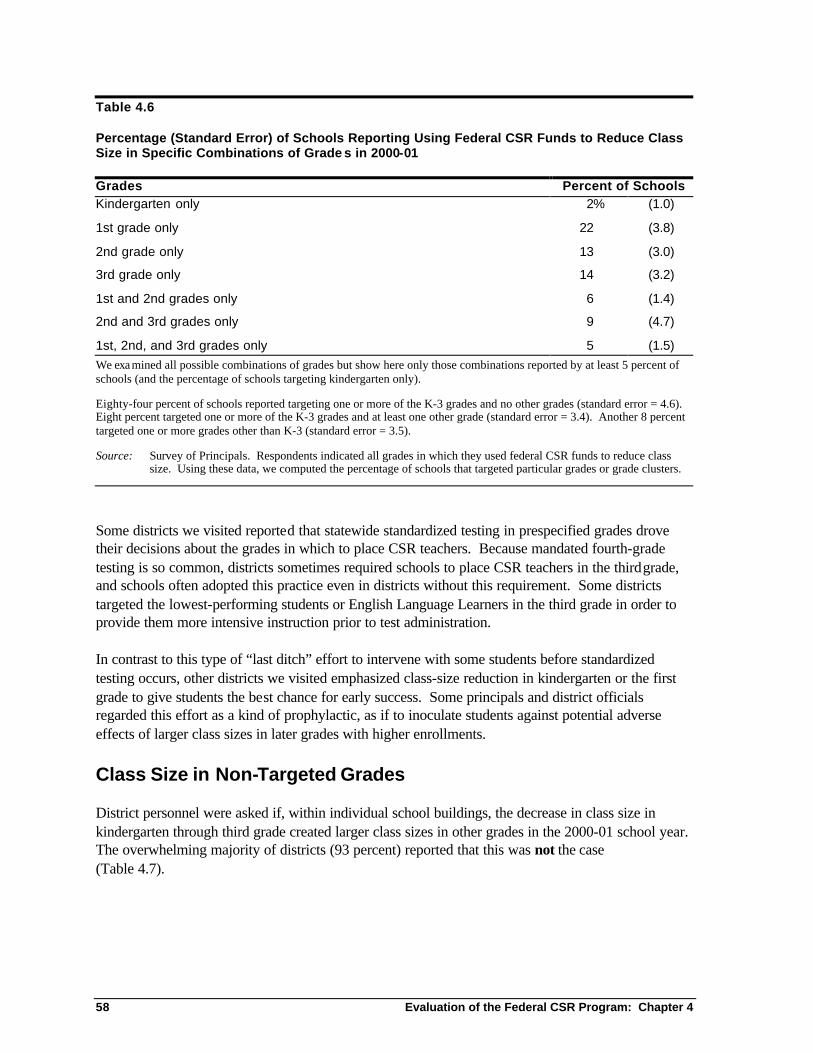
58 Evaluation of the Federal CSR Program: Chapter 4
Table 4.6 Percentage (Standard Error) of Schools Reporting Using Federal CSR Funds to Reduce Class Size in Specific Combinations of Grade s in 2000-01 Grades Percent of Schools Kindergarten only 2% (1.0)
1st grade only 22 (3.8)
2nd grade only 13 (3.0)
3rd grade only 14 (3.2)
1st and 2nd grades only 6 (1.4)
2nd and 3rd grades only 9 (4.7)
1st, 2nd, and 3rd grades only 5 (1.5) We exa mined all possible combinations of grades but show here only those combinations reported by at least 5 percent of schools (and the percentage of schools targeting kindergarten only).
Eighty-four percent of schools reported targeting one or more of the K-3 grades and no other grades (standard error = 4.6). Eight percent targeted one or more of the K-3 grades and at least one other grade (standard error = 3.4). Another 8 percent targeted one or more grades other than K-3 (standard error = 3.5).
Source: Survey of Principals. Respondents indicated all grades in which they used federal CSR funds to reduce class size. Using these data, we computed the percentage of schools that targeted particular grades or grade clusters.
Some districts we visited reported that statewide standardized testing in prespecified grades drove their decisions about the grades in which to place CSR teachers. Because mandated fourth-grade testing is so common, districts sometimes required schools to place CSR teachers in the third grade, and schools often adopted this practice even in districts without this requirement. Some districts targeted the lowest-performing students or English Language Learners in the third grade in order to provide them more intensive instruction prior to test administration. In contrast to this type of “last ditch” effort to intervene with some students before standardized testing occurs, other districts we visited emphasized class-size reduction in kindergarten or the first grade to give students the best chance for early success. Some principals and district officials regarded this effort as a kind of prophylactic, as if to inoculate students against potential adverse effects of larger class sizes in later grades with higher enrollments.
Class Size in Non-Targeted Grades
District personnel were asked if, within individual school buildings, the decrease in class size in kindergarten through third grade created larger class sizes in other grades in the 2000-01 school year. The overwhelming majority of districts (93 percent) reported that this was not the case (Table 4.7).
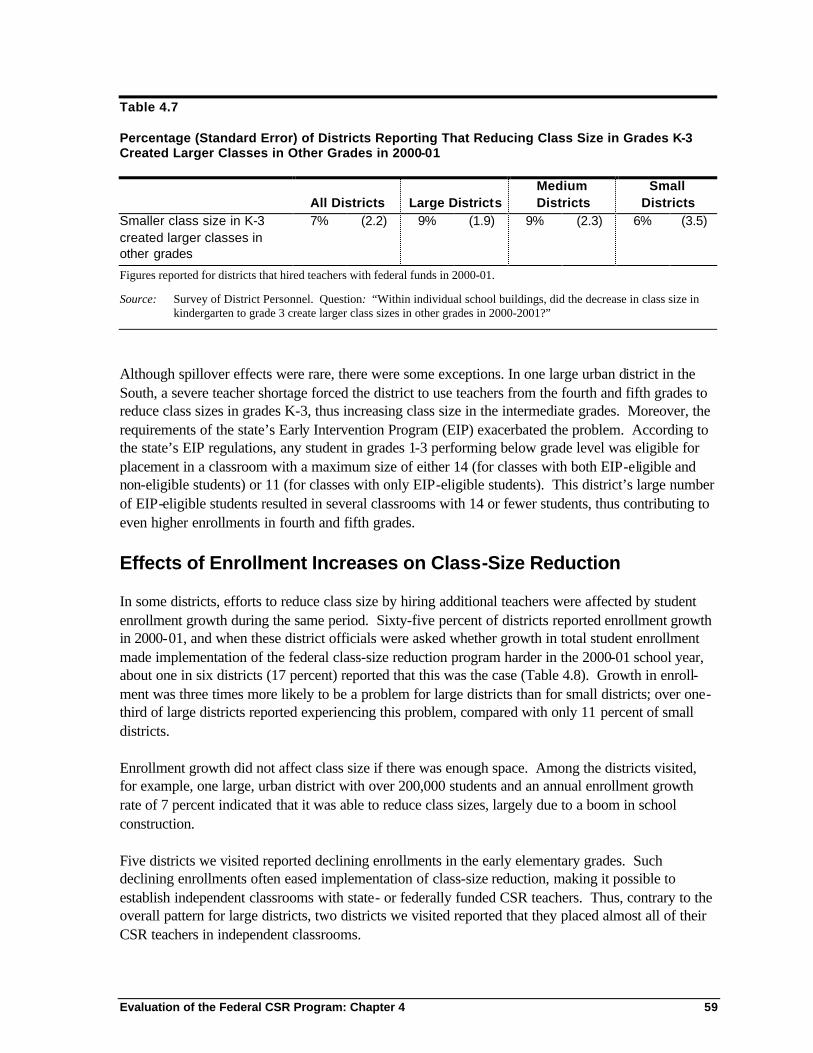
Evaluation of the Federal CSR Program: Chapter 4 59
Table 4.7 Percentage (Standard Error) of Districts Reporting That Reducing Class Size in Grades K-3 Created Larger Classes in Other Grades in 2000-01
All Districts Large Districts Medium Districts
Small Districts
Smaller class size in K-3 created larger classes in other grades
7% (2.2) 9% (1.9) 9% (2.3) 6% (3.5)
Figures reported for districts that hired teachers with federal funds in 2000-01.
Source: Survey of District Personnel. Question: “Within individual school buildings, did the decrease in class size in kindergarten to grade 3 create larger class sizes in other grades in 2000-2001?”
Although spillover effects were rare, there were some exceptions. In one large urban district in the South, a severe teacher shortage forced the district to use teachers from the fourth and fifth grades to reduce class sizes in grades K-3, thus increasing class size in the intermediate grades. Moreover, the requirements of the state’s Early Intervention Program (EIP) exacerbated the problem. According to the state’s EIP regulations, any student in grades 1-3 performing below grade level was eligible for placement in a classroom with a maximum size of either 14 (for classes with both EIP-eligible and non-eligible students) or 11 (for classes with only EIP-eligible students). This district’s large number of EIP-eligible students resulted in several classrooms with 14 or fewer students, thus contributing to even higher enrollments in fourth and fifth grades.
Effects of Enrollment Increases on Class-Size Reduction
In some districts, efforts to reduce class size by hiring additional teachers were affected by student enrollment growth during the same period. Sixty-five percent of districts reported enrollment growth in 2000-01, and when these district officials were asked whether growth in total student enrollment made implementation of the federal class-size reduction program harder in the 2000-01 school year, about one in six districts (17 percent) reported that this was the case (Table 4.8). Growth in enroll-ment was three times more likely to be a problem for large districts than for small districts; over one-third of large districts reported experiencing this problem, compared with only 11 percent of small districts. Enrollment growth did not affect class size if there was enough space. Among the districts visited, for example, one large, urban district with over 200,000 students and an annual enrollment growth rate of 7 percent indicated that it was able to reduce class sizes, largely due to a boom in school construction. Five districts we visited reported declining enrollments in the early elementary grades. Such declining enrollments often eased implementation of class-size reduction, making it possible to establish independent classrooms with state- or federally funded CSR teachers. Thus, contrary to the overall pattern for large districts, two districts we visited reported that they placed almost all of their CSR teachers in independent classrooms.
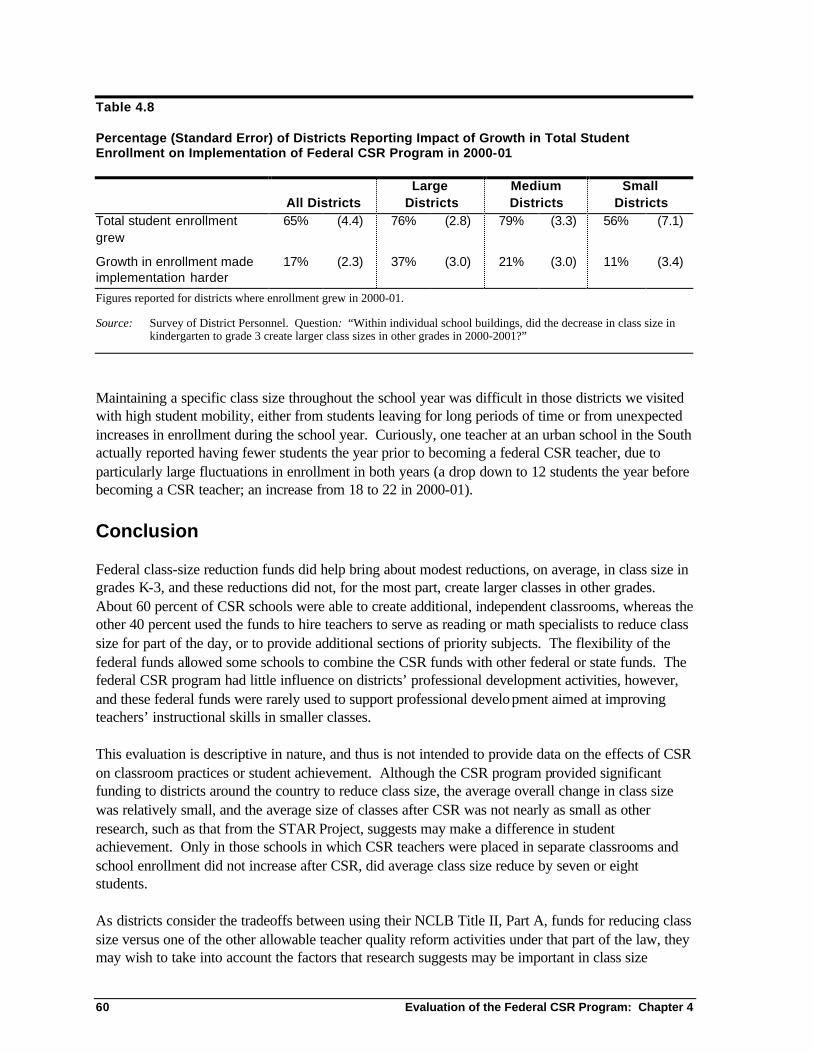
60 Evaluation of the Federal CSR Program: Chapter 4
Table 4.8 Percentage (Standard Error) of Districts Reporting Impact of Growth in Total Student Enrollment on Implementation of Federal CSR Program in 2000-01
All Districts Large
Districts Medium Districts
Small Districts
Total student enrollment grew
65% (4.4) 76% (2.8) 79% (3.3) 56% (7.1)
Growth in enrollment made implementation harder
17% (2.3) 37% (3.0) 21% (3.0) 11% (3.4)
Figures reported for districts where enrollment grew in 2000-01.
Source: Survey of District Personnel. Question: “Within individual school buildings, did the decrease in class size in kindergarten to grade 3 create larger class sizes in other grades in 2000-2001?”
Maintaining a specific class size throughout the school year was difficult in those districts we visited with high student mobility, either from students leaving for long periods of time or from unexpected increases in enrollment during the school year. Curiously, one teacher at an urban school in the South actually reported having fewer students the year prior to becoming a federal CSR teacher, due to particularly large fluctuations in enrollment in both years (a drop down to 12 students the year before becoming a CSR teacher; an increase from 18 to 22 in 2000-01).
Conclusion
Federal class-size reduction funds did help bring about modest reductions, on average, in class size in grades K-3, and these reductions did not, for the most part, create larger classes in other grades. About 60 percent of CSR schools were able to create additional, independent classrooms, whereas the other 40 percent used the funds to hire teachers to serve as reading or math specialists to reduce class size for part of the day, or to provide additional sections of priority subjects. The flexibility of the federal funds allowed some schools to combine the CSR funds with other federal or state funds. The federal CSR program had little influence on districts’ professional development activities, however, and these federal funds were rarely used to support professional development aimed at improving teachers’ instructional skills in smaller classes. This evaluation is descriptive in nature, and thus is not intended to provide data on the effects of CSR on classroom practices or student achievement. Although the CSR program provided significant funding to districts around the country to reduce class size, the average overall change in class size was relatively small, and the average size of classes after CSR was not nearly as small as other research, such as that from the STAR Project, suggests may make a difference in student achievement. Only in those schools in which CSR teachers were placed in separate classrooms and school enrollment did not increase after CSR, did average class size reduce by seven or eight students. As districts consider the tradeoffs between using their NCLB Title II, Part A, funds for reducing class size versus one of the other allowable teacher quality reform activities under that part of the law, they may wish to take into account the factors that research suggests may be important in class size
Evaluation of the Federal CSR Program: Chapter 4 61
reduction efforts. For example, the supply of qualified teachers and available classroom space, the availability of professional development activities focused on teachers’ instructional practices in smaller classes, the relative amount of change in class size that funds may produce, and the extent to which student enrollment is likely to change are all factors that districts may want to consider as they determine whether to use their Title II, Part A, funds for class-size reduction or other reform efforts.

62 Evaluation of the Federal CSR Program: Chapter 4
Evaluation of the Federal CSR Program: References 63
References
Achilles, C.M., Nye, B.A., Zaharias, J.B., Fulton, B.D., and Cain, C. 1996. Education’s equivalent of medicine’s Framingham heart study. Washington, D.C.: ERIC Clearinghouse.
Bohrnstedt G.W. and Stecher, B.M. (eds.) (2002). What we have learned about class size reduction
in California . Sacramento, Calif.: California Department of Education. Ehrenberg, R.G., Brewer, D.J., Gamoran, A., and Willms, J.D. (2001). Class size and student
achievement. Psychological Science in the Public Interest 2: 1-30. Finn, J., and Achilles, C. M. (1990). Answers and questions about class size: A statewide
experiment. American Educational Research Journal 27: 557-577. Finn, J. (1998). Class Size and students at risk: What is known? What is next? Washington, D.C.:
U.S. Department of Education, Office of Educational Research and Improvement, National Institute on the Education of At-Risk Students.
Hanushek, E.A. (1999). Some findings from an independent investigation of the Tennessee STAR
experiment and from other investigations of class size effects. Educational Evaluation and Policy Analysis 21: 143-164.
Jepsen, C., and Rivkin, S. (2001). What is the tradeoff between smaller classes and teacher quality?
Unpublished manuscript, Public Policy Institute of California. Molnar, A., Smith, P., Zahorik, J., Palmer, A., Halbach, A., and Ehrle, K. (1999). Evaluating the
SAGE program: A pilot program in targeted pupil-teacher reduction in Wisconsin. Educational Evaluation and Policy Analysis 21(2): 165-l78.
Nye, B., Fulton, B.D., Boyd-Zaharias, J., and Cain, V.A. 1995. The lasting benefits study, eighth
grade technical report. Nashville, Tenn.: Center of Excellence for Research in Basic Skills, Tennessee State University.
Nye, B., Hedges, L., and Konstantopoulos, S. (1999). The long-term effects of small classes: A
five-year follow-up of the Tennessee class size experiment. Educational Evaluation and Policy Analysis 21(2): 127-142.
U.S. Department of Education. (2000). Class-Size reduction program: Guidance for fiscal year
2000. Available online at: http://www.ed.gov/offices/OESE/ClassSize/guidance.html.

64 Evaluation of the Federal CSR Program: References
APPENDIX A
SURVEY OF DISTRICT PERSONNEL SURVEY OF SCHOOL PRINCIPALS

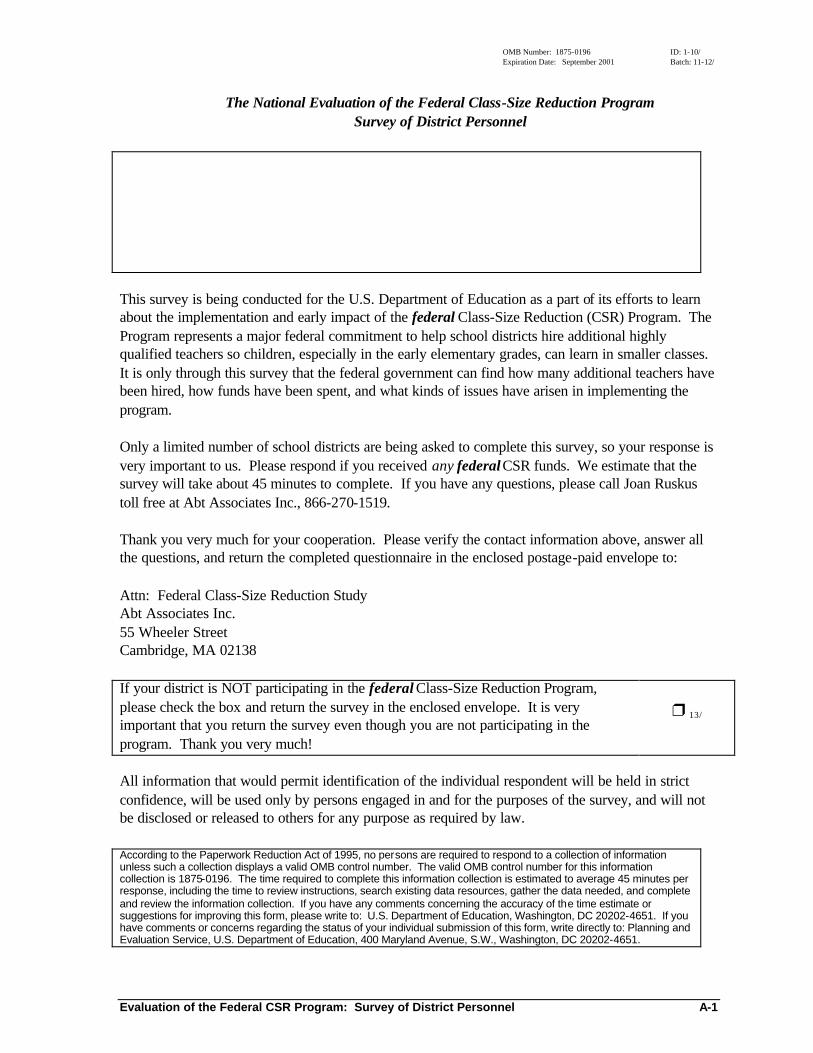
OMB Number: 1875-0196 ID: 1-10/ Expiration Date: September 2001 Batch: 11-12/
Evaluation of the Federal CSR Program: Survey of District Personnel A-1
The National Evaluation of the Federal Class-Size Reduction Program Survey of District Personnel
This survey is being conducted for the U.S. Department of Education as a part of its efforts to learn about the implementation and early impact of the federal Class-Size Reduction (CSR) Program. The Program represents a major federal commitment to help school districts hire additional highly qualified teachers so children, especially in the early elementary grades, can learn in smaller classes. It is only through this survey that the federal government can find how many additional teachers have been hired, how funds have been spent, and what kinds of issues have arisen in implementing the program. Only a limited number of school districts are being asked to complete this survey, so your response is very important to us. Please respond if you received any federal CSR funds. We estimate that the survey will take about 45 minutes to complete. If you have any questions, please call Joan Ruskus toll free at Abt Associates Inc., 866-270-1519. Thank you very much for your cooperation. Please verify the contact information above, answer all the questions, and return the completed questionnaire in the enclosed postage-paid envelope to: Attn: Federal Class-Size Reduction Study Abt Associates Inc. 55 Wheeler Street Cambridge, MA 02138 If your district is NOT participating in the federal Class-Size Reduction Program, please check the box and return the survey in the enclosed envelope. It is very important that you return the survey even though you are not participating in the program. Thank you very much!
r 13/
All information that would permit identification of the individual respondent will be held in strict confidence, will be used only by persons engaged in and for the purposes of the survey, and will not be disclosed or released to others for any purpose as required by law. According to the Paperwork Reduction Act of 1995, no persons are required to respond to a collection of information unless such a collection displays a valid OMB control number. The valid OMB control number for this information collection is 1875-0196. The time required to complete this information collection is estimated to average 45 minutes per response, including the time to review instructions, search existing data resources, gather the data needed, and complete and review the information collection. If you have any comments concerning the accuracy of the time estimate or suggestions for improving this form, please write to: U.S. Department of Education, Washington, DC 20202-4651. If you have comments or concerns regarding the status of your individual submission of this form, write directly to: Planning and Evaluation Service, U.S. Department of Education, 400 Maryland Avenue, S.W., Washington, DC 20202-4651.

A-2 Evaluation of the Federal CSR Program: Survey of District Personnel
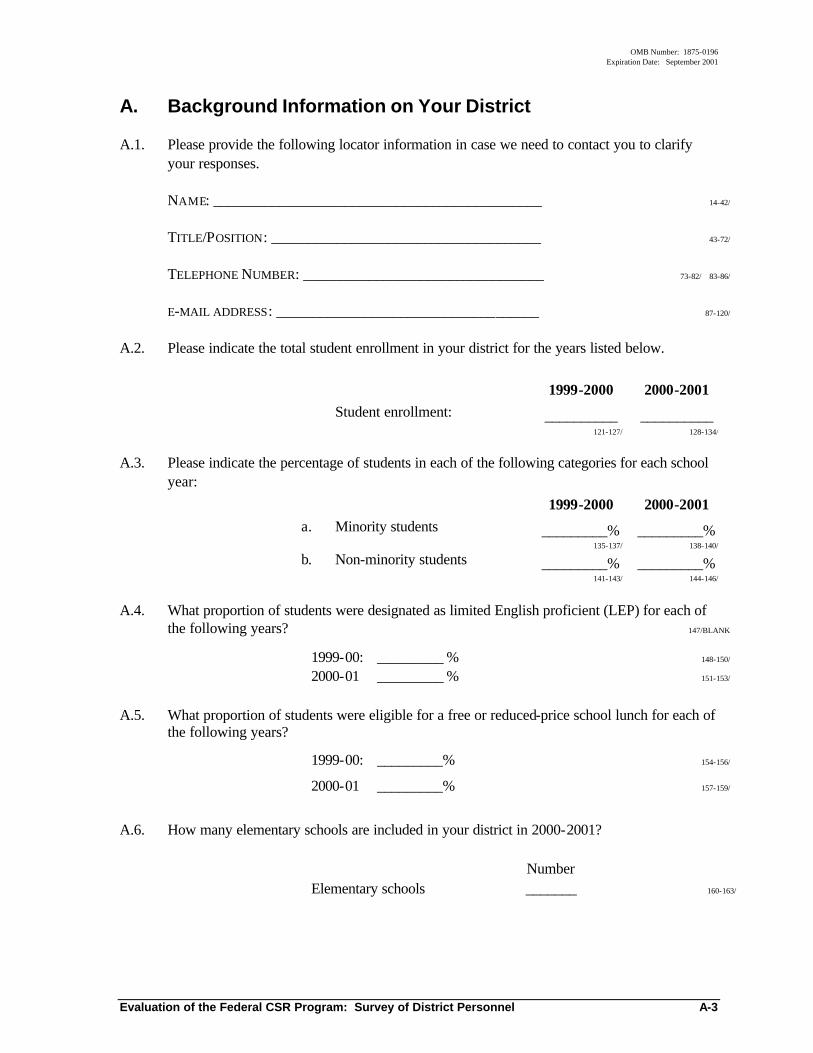
OMB Number: 1875-0196 Expiration Date: September 2001
Evaluation of the Federal CSR Program: Survey of District Personnel A-3
A. Background Information on Your District
A.1. Please provide the following locator information in case we need to contact you to clarify your responses. NAME: _____________________________________________ 14-42/ TITLE/POSITION: _____________________________________ 43-72/
TELEPHONE NUMBER: _________________________________ 73-82/ 83-86/ E-MAIL ADDRESS: ____________________________________ 87-120/
A.2. Please indicate the total student enrollment in your district for the years listed below.
1999-2000 2000-2001 Student enrollment: __________
121-127/
__________ 128-134/
A.3. Please indicate the percentage of students in each of the following categories for each school
year: 1999-2000 2000-2001
a. Minority students _________% 135-137/
_________% 138-140/
b. Non-minority students _________% 141-143/
_________% 144-146/
A.4. What proportion of students were designated as limited English proficient (LEP) for each of
the following years? 147/BLANK
1999-00: _________ % 148-150/ 2000-01 _________ % 151-153/ A.5. What proportion of students were eligible for a free or reduced-price school lunch for each of
the following years? 1999-00: _________% 154-156/
2000-01 _________% 157-159/
A.6. How many elementary schools are included in your district in 2000-2001? Number Elementary schools _______ 160-163/
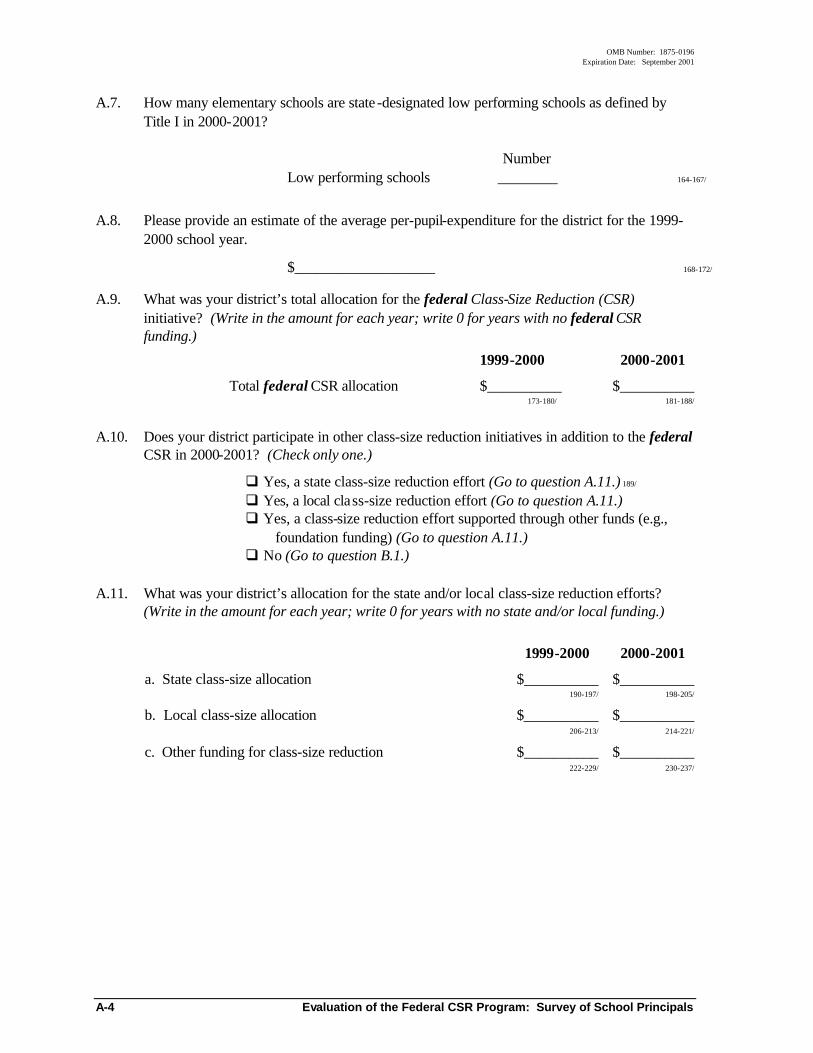
OMB Number: 1875-0196 Expiration Date: September 2001
A-4 Evaluation of the Federal CSR Program: Survey of School Principals
A.7. How many elementary schools are state -designated low performing schools as defined by Title I in 2000-2001?
Number Low performing schools ________ 164-167/
A.8. Please provide an estimate of the average per-pupil-expenditure for the district for the 1999-
2000 school year. $___________________ 168-172/
A.9. What was your district’s total allocation for the federal Class-Size Reduction (CSR)
initiative? (Write in the amount for each year; write 0 for years with no federal CSR funding.)
1999-2000 2000-2001
Total federal CSR allocation $__________ 173-180/
$__________ 181-188/
A.10. Does your district participate in other class-size reduction initiatives in addition to the federal
CSR in 2000-2001? (Check only one.)
q Yes, a state class-size reduction effort (Go to question A.11.) 189/ q Yes, a local class-size reduction effort (Go to question A.11.) q Yes, a class-size reduction effort supported through other funds (e.g.,
foundation funding) (Go to question A.11.) q No (Go to question B.1.)
A.11. What was your district’s allocation for the state and/or local class-size reduction efforts?
(Write in the amount for each year; write 0 for years with no state and/or local funding.)
1999-2000 2000-2001
a. State class-size allocation $__________ 190-197/
$__________ 198-205/
b. Local class-size allocation $__________ 206-213/
$__________ 214-221/
c. Other funding for class-size reduction $__________ 222-229/
$__________ 230-237/
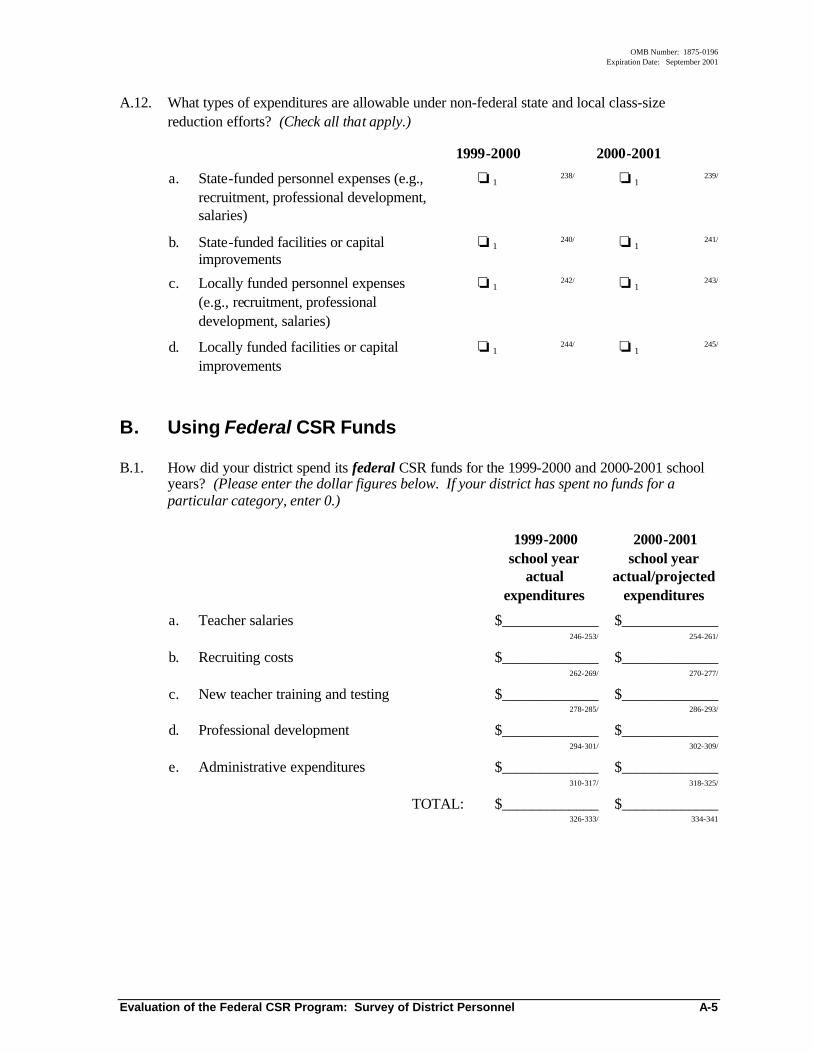
OMB Number: 1875-0196 Expiration Date: September 2001
Evaluation of the Federal CSR Program: Survey of District Personnel A-5
A.12. What types of expenditures are allowable under non-federal state and local class-size reduction efforts? (Check all that apply.)
1999-2000 2000-2001
a. State-funded personnel expenses (e.g., recruitment, professional development, salaries)
o 1 238/ o 1
239/
b. State-funded facilities or capital improvements
o 1 240/ o 1
241/
c. Locally funded personnel expenses (e.g., recruitment, professional development, salaries)
o 1 242/ o 1
243/
d. Locally funded facilities or capital improvements
o 1 244/ o 1
245/
B. Using Federal CSR Funds
B.1. How did your district spend its federal CSR funds for the 1999-2000 and 2000-2001 school years? (Please enter the dollar figures below. If your district has spent no funds for a particular category, enter 0.)
1999-2000
school year actual
expenditures
2000-2001 school year
actual/projected expenditures
a. Teacher salaries $_____________ 246-253/
$_____________ 254-261/
b. Recruiting costs $_____________ 262-269/
$_____________ 270-277/
c. New teacher training and testing $_____________ 278-285/
$_____________ 286-293/
d. Professional development $_____________ 294-301/
$_____________ 302-309/
e. Administrative expenditures $_____________ 310-317/
$_____________ 318-325/
TOTAL: $_____________ 326-333/
$_____________ 334-341
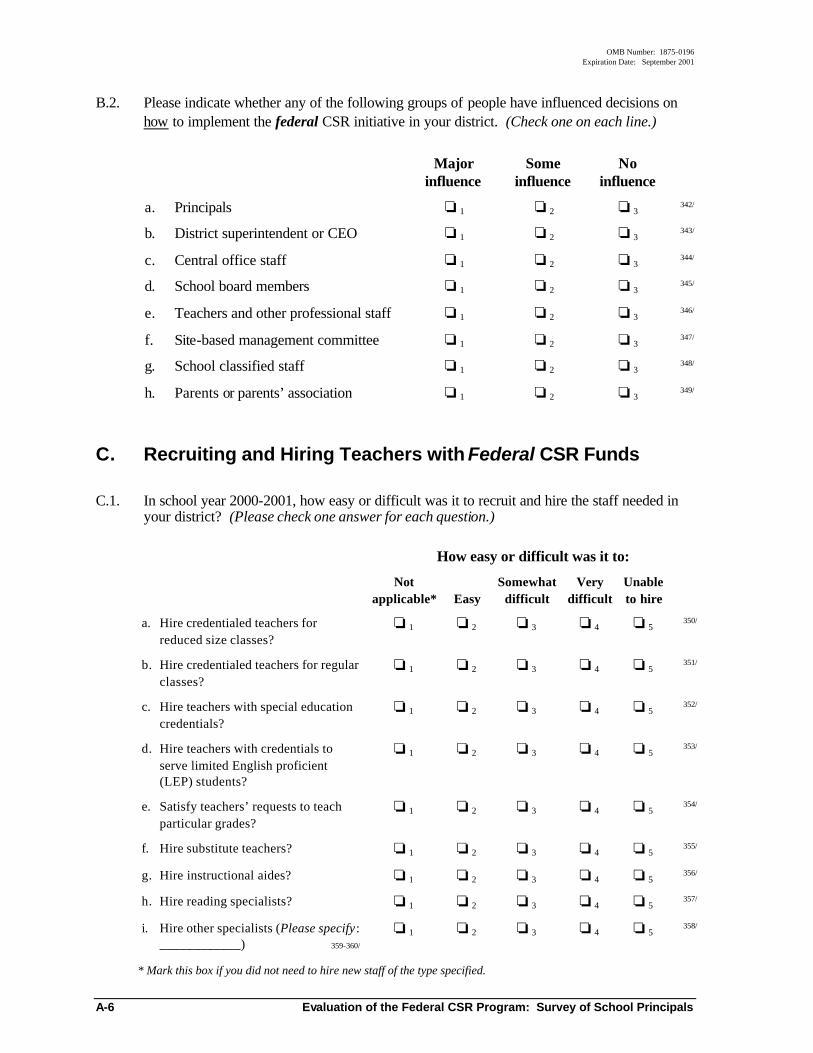
OMB Number: 1875-0196 Expiration Date: September 2001
A-6 Evaluation of the Federal CSR Program: Survey of School Principals
B.2. Please indicate whether any of the following groups of people have influenced decisions on how to implement the federal CSR initiative in your district. (Check one on each line.)
Major influence
Some influence
No influence
a. Principals o 1 o 2 o 3 342/
b. District superintendent or CEO o 1 o 2 o 3 343/
c. Central office staff o 1 o 2 o 3 344/
d. School board members o 1 o 2 o 3 345/
e. Teachers and other professional staff o 1 o 2 o 3 346/
f. Site-based management committee o 1 o 2 o 3 347/
g. School classified staff o 1 o 2 o 3 348/
h. Parents or parents’ association o 1 o 2 o 3 349/
C. Recruiting and Hiring Teachers with Federal CSR Funds
C.1. In school year 2000-2001, how easy or difficult was it to recruit and hire the staff needed in your district? (Please check one answer for each question.)
How easy or difficult was it to:
Not applicable* Easy
Somewhat difficult
Very difficult
Unable to hire
a. Hire credentialed teachers for reduced size classes?
o 1 o 2 o 3 o 4 o 5 350/
b. Hire credentialed teachers for regular classes?
o 1 o 2 o 3 o 4 o 5 351/
c. Hire teachers with special education credentials?
o 1 o 2 o 3 o 4 o 5 352/
d. Hire teachers with credentials to serve limited English proficient (LEP) students?
o 1 o 2 o 3 o 4 o 5 353/
e. Satisfy teachers’ requests to teach particular grades?
o 1 o 2 o 3 o 4 o 5 354/
f. Hire substitute teachers? o 1 o 2 o 3 o 4 o 5 355/
g. Hire instructional aides? o 1 o 2 o 3 o 4 o 5 356/
h. Hire reading specialists? o 1 o 2 o 3 o 4 o 5 357/
i. Hire other specialists (Please specify : ____________) 359-360/
o 1 o 2 o 3 o 4 o 5 358/
* Mark this box if you did not need to hire new staff of the type specified.
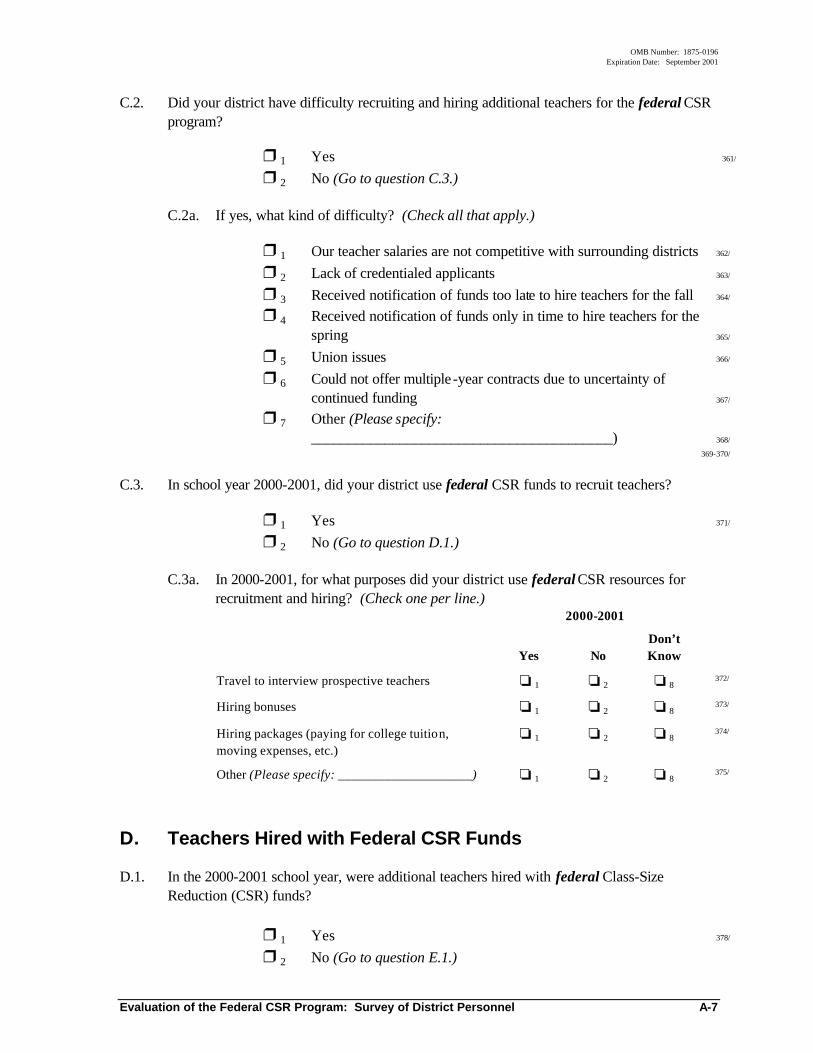
OMB Number: 1875-0196 Expiration Date: September 2001
Evaluation of the Federal CSR Program: Survey of District Personnel A-7
C.2. Did your district have difficulty recruiting and hiring additional teachers for the federal CSR program?
r 1 Yes 361/ r 2 No (Go to question C.3.) C.2a. If yes, what kind of difficulty? (Check all that apply.)
r 1 Our teacher salaries are not competitive with surrounding districts 362/ r 2 Lack of credentialed applicants 363/ r 3 Received notification of funds too late to hire teachers for the fall 364/ r 4 Received notification of funds only in time to hire teachers for the
spring 365/ r 5 Union issues 366/ r 6 Could not offer multiple -year contracts due to uncertainty of
continued funding 367/ r 7 Other (Please specify:
_________________________________________) 368/
369-370/ C.3. In school year 2000-2001, did your district use federal CSR funds to recruit teachers?
r 1 Yes 371/ r 2 No (Go to question D.1.) C.3a. In 2000-2001, for what purposes did your district use federal CSR resources for
recruitment and hiring? (Check one per line.) 2000-2001
Yes No Don’t Know
Travel to interview prospective teachers o 1 o 2 o 8 372/
Hiring bonuses o 1 o 2 o 8 373/
Hiring packages (paying for college tuition, moving expenses, etc.)
o 1 o 2 o 8 374/
Other (Please specify: ____________________) o 1 o 2 o 8 375/
D. Teachers Hired with Federal CSR Funds
D.1. In the 2000-2001 school year, were additional teachers hired with federal Class-Size Reduction (CSR) funds?
r 1 Yes 378/ r 2 No (Go to question E.1.)
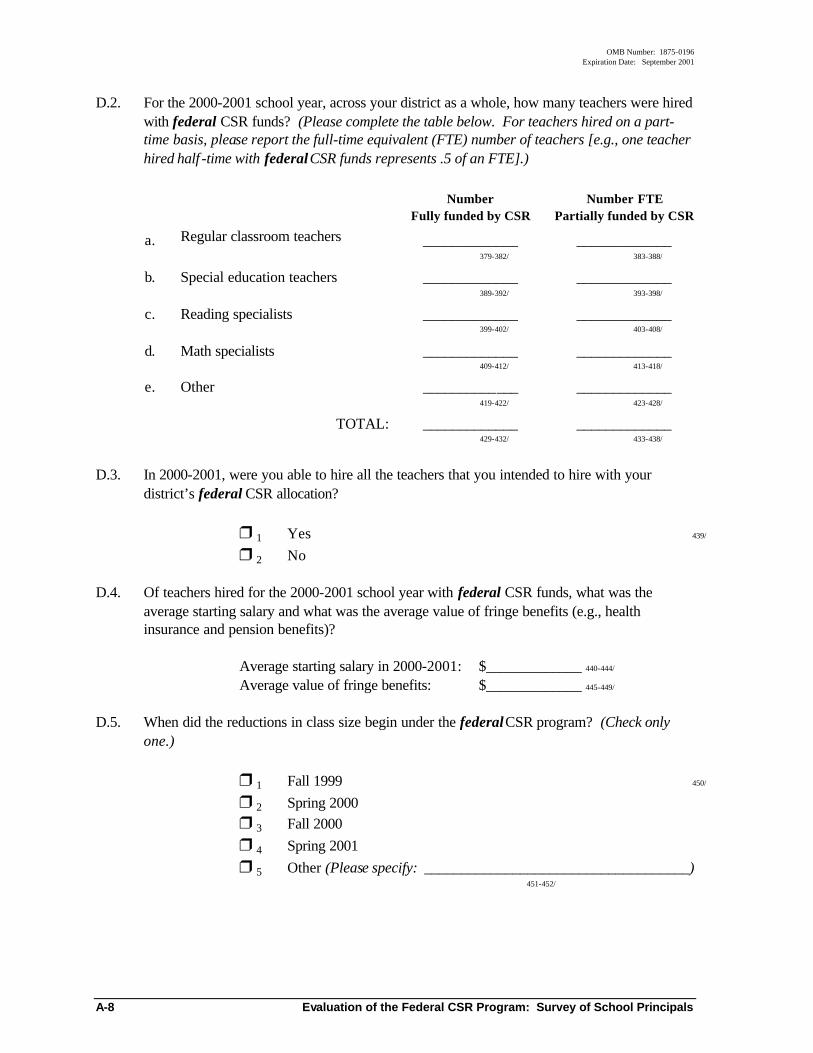
OMB Number: 1875-0196 Expiration Date: September 2001
A-8 Evaluation of the Federal CSR Program: Survey of School Principals
D.2. For the 2000-2001 school year, across your district as a whole, how many teachers were hired with federal CSR funds? (Please complete the table below. For teachers hired on a part-time basis, please report the full-time equivalent (FTE) number of teachers [e.g., one teacher hired half -time with federal CSR funds represents .5 of an FTE].)
Number Fully funded by CSR
Number FTE Partially funded by CSR
a. Regular classroom teachers _____________ 379-382/
_____________ 383-388/
b. Special education teachers _____________ 389-392/
_____________ 393-398/
c. Reading specialists _____________ 399-402/
_____________ 403-408/
d. Math specialists _____________ 409-412/
_____________ 413-418/
e. Other _____________ 419-422/
_____________ 423-428/
TOTAL: _____________ 429-432/
_____________ 433-438/
D.3. In 2000-2001, were you able to hire all the teachers that you intended to hire with your
district’s federal CSR allocation?
r 1 Yes 439/ r 2 No D.4. Of teachers hired for the 2000-2001 school year with federal CSR funds, what was the
average starting salary and what was the average value of fringe benefits (e.g., health insurance and pension benefits)?
Average starting salary in 2000-2001: $_____________ 440-444/ Average value of fringe benefits: $_____________ 445-449/ D.5. When did the reductions in class size begin under the federal CSR program? (Check only
one.) r 1 Fall 1999 450/ r 2 Spring 2000 r 3 Fall 2000 r 4 Spring 2001 r 5 Other (Please specify: ____________________________________) 451-452/
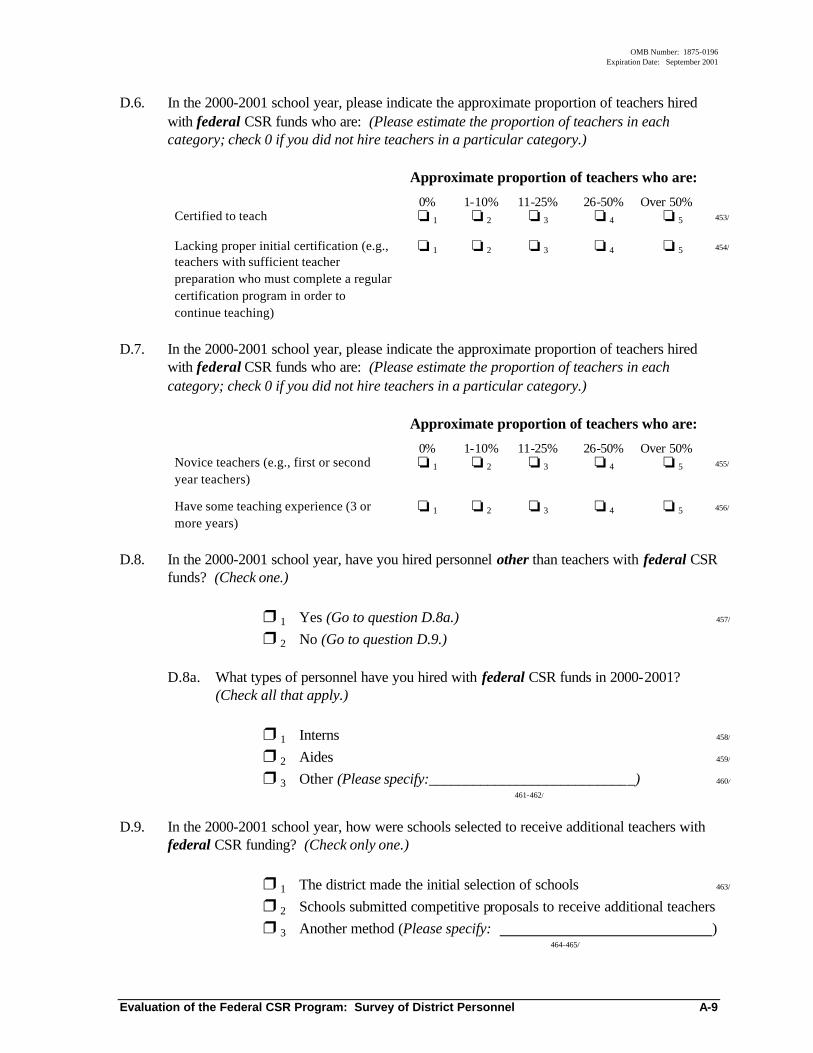
OMB Number: 1875-0196 Expiration Date: September 2001
Evaluation of the Federal CSR Program: Survey of District Personnel A-9
D.6. In the 2000-2001 school year, please indicate the approximate proportion of teachers hired with federal CSR funds who are: (Please estimate the proportion of teachers in each category; check 0 if you did not hire teachers in a particular category.)
Approximate proportion of teachers who are:
0% 1-10% 11-25% 26-50% Over 50% Certified to teach o 1 o 2 o 3 o 4 o 5 453/
Lacking proper initial certification (e.g., teachers with sufficient teacher preparation who must complete a regular certification program in order to continue teaching)
o 1 o 2 o 3 o 4 o 5 454/
D.7. In the 2000-2001 school year, please indicate the approximate proportion of teachers hired
with federal CSR funds who are: (Please estimate the proportion of teachers in each category; check 0 if you did not hire teachers in a particular category.)
Approximate proportion of teachers who are:
0% 1-10% 11-25% 26-50% Over 50% Novice teachers (e.g., first or second year teachers)
o 1 o 2 o 3 o 4 o 5 455/
Have some teaching experience (3 or more years)
o 1 o 2 o 3 o 4 o 5 456/
D.8. In the 2000-2001 school year, have you hired personnel other than teachers with federal CSR
funds? (Check one.) r 1 Yes (Go to question D.8a.) 457/ r 2 No (Go to question D.9.) D.8a. What types of personnel have you hired with federal CSR funds in 2000-2001?
(Check all that apply.) r 1 Interns 458/ r 2 Aides 459/ r 3 Other (Please specify:____________________________) 460/
461-462/ D.9. In the 2000-2001 school year, how were schools selected to receive additional teachers with
federal CSR funding? (Check only one.) r 1 The district made the initial selection of schools 463/ r 2 Schools submitted competitive proposals to receive additional teachers r 3 Another method (Please specify: ) 464-465/
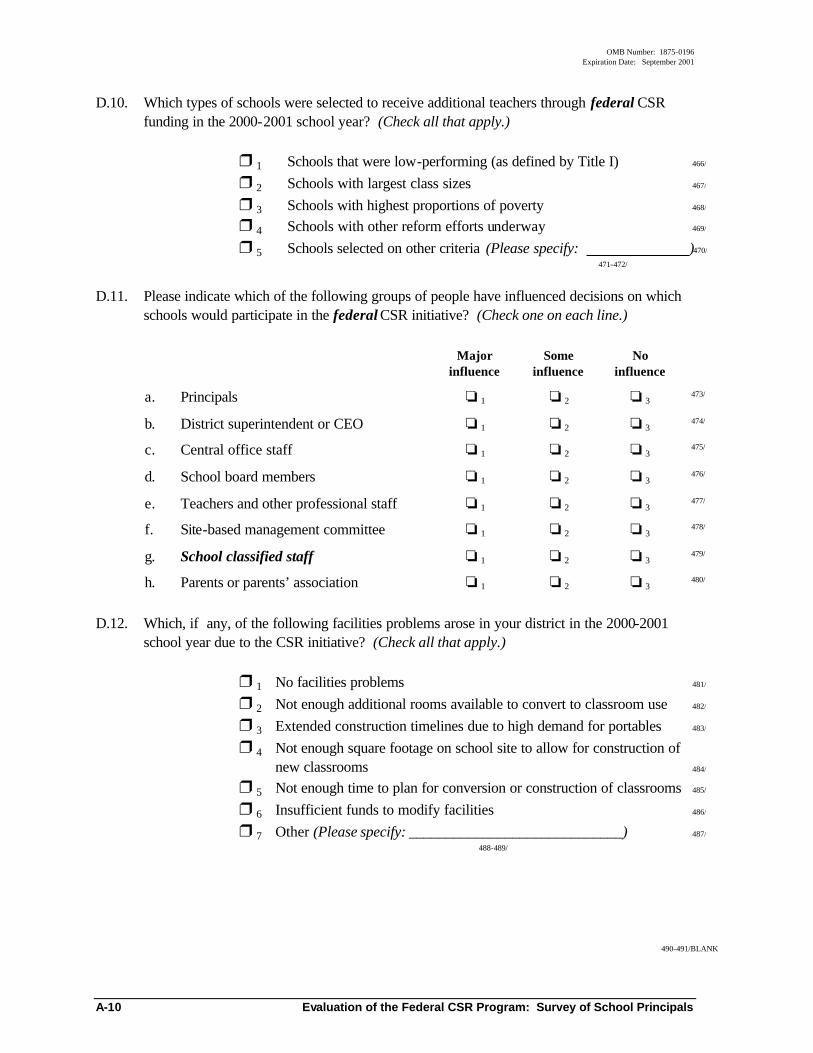
OMB Number: 1875-0196 Expiration Date: September 2001
A-10 Evaluation of the Federal CSR Program: Survey of School Principals
D.10. Which types of schools were selected to receive additional teachers through federal CSR funding in the 2000-2001 school year? (Check all that apply.)
r 1 Schools that were low-performing (as defined by Title I) 466/ r 2 Schools with largest class sizes 467/ r 3 Schools with highest proportions of poverty 468/ r 4 Schools with other reform efforts underway 469/ r 5 Schools selected on other criteria (Please specify: )470/
471-472/ D.11. Please indicate which of the following groups of people have influenced decisions on which
schools would participate in the federal CSR initiative? (Check one on each line.)
Major influence
Some influence
No influence
a. Principals o 1 o 2 o 3 473/
b. District superintendent or CEO o 1 o 2 o 3 474/
c. Central office staff o 1 o 2 o 3 475/
d. School board members o 1 o 2 o 3 476/
e. Teachers and other professional staff o 1 o 2 o 3 477/
f. Site-based management committee o 1 o 2 o 3 478/
g. School classified staff o 1 o 2 o 3 479/
h. Parents or parents’ association o 1 o 2 o 3 480/
D.12. Which, if any, of the following facilities problems arose in your district in the 2000-2001
school year due to the CSR initiative? (Check all that apply.)
r 1 No facilities problems 481/ r 2 Not enough additional rooms available to convert to classroom use 482/ r 3 Extended construction timelines due to high demand for portables 483/ r 4 Not enough square footage on school site to allow for construction of
new classrooms 484/ r 5 Not enough time to plan for conversion or construction of classrooms 485/ r 6 Insufficient funds to modify facilities 486/ r 7 Other (Please specify: _____________________________) 487/
488-489/ 490-491/BLANK
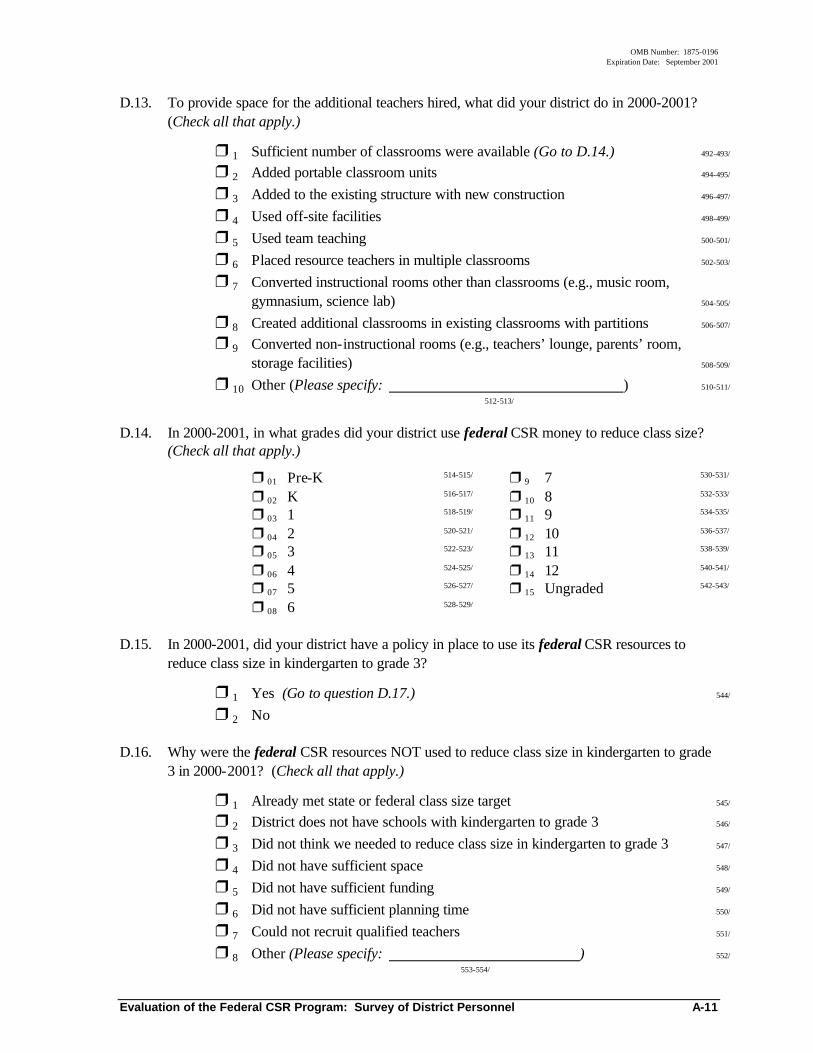
OMB Number: 1875-0196 Expiration Date: September 2001
Evaluation of the Federal CSR Program: Survey of District Personnel A-11
D.13. To provide space for the additional teachers hired, what did your district do in 2000-2001? (Check all that apply.)
r 1 Sufficient number of classrooms were available (Go to D.14.) 492-493/ r 2 Added portable classroom units 494-495/ r 3 Added to the existing structure with new construction 496-497/ r 4 Used off-site facilities 498-499/ r 5 Used team teaching 500-501/ r 6 Placed resource teachers in multiple classrooms 502-503/ r 7 Converted instructional rooms other than classrooms (e.g., music room, gymnasium, science lab) 504-505/ r 8 Created additional classrooms in existing classrooms with partitions 506-507/ r 9 Converted non-instructional rooms (e.g., teachers’ lounge, parents’ room, storage facilities) 508-509/ r 10 Other (Please specify: ) 510-511/
512-513/ D.14. In 2000-2001, in what grades did your district use federal CSR money to reduce class size? (Check all that apply.)
r 01 Pre-K 514-515/ r 9 7 530-531/
r 02 K 516-517/ r 10 8 532-533/
r 03 1 518-519/ r 11 9 534-535/
r 04 2 520-521/ r 12 10 536-537/
r 05 3 522-523/ r 13 11 538-539/
r 06 4 524-525/ r 14 12 540-541/
r 07 5 526-527/ r 15 Ungraded 542-543/
r 08 6 528-529/
D.15. In 2000-2001, did your district have a policy in place to use its federal CSR resources to
reduce class size in kindergarten to grade 3? r 1 Yes (Go to question D.17.) 544/ r 2 No D.16. Why were the federal CSR resources NOT used to reduce class size in kindergarten to grade
3 in 2000-2001? (Check all that apply.) r 1 Already met state or federal class size target 545/ r 2 District does not have schools with kindergarten to grade 3 546/ r 3 Did not think we needed to reduce class size in kindergarten to grade 3 547/ r 4 Did not have sufficient space 548/ r 5 Did not have sufficient funding 549/ r 6 Did not have sufficient planning time 550/ r 7 Could not recruit qualified teachers 551/ r 8 Other (Please specify: ) 552/ 553-554/
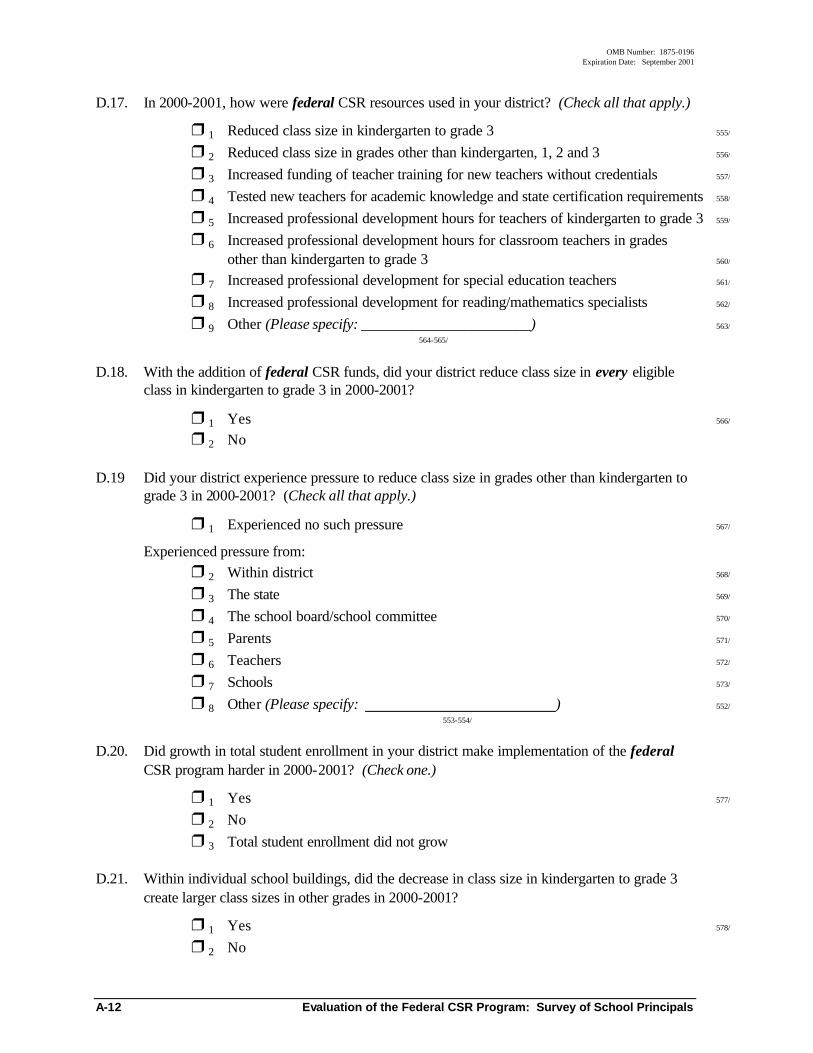
OMB Number: 1875-0196 Expiration Date: September 2001
A-12 Evaluation of the Federal CSR Program: Survey of School Principals
D.17. In 2000-2001, how were federal CSR resources used in your district? (Check all that apply.) r 1 Reduced class size in kindergarten to grade 3 555/ r 2 Reduced class size in grades other than kindergarten, 1, 2 and 3 556/ r 3 Increased funding of teacher training for new teachers without credentials 557/ r 4 Tested new teachers for academic knowledge and state certification requirements 558/ r 5 Increased professional development hours for teachers of kindergarten to grade 3 559/ r 6 Increased professional development hours for classroom teachers in grades other than kindergarten to grade 3 560/ r 7 Increased professional development for special education teachers 561/ r 8 Increased professional development for reading/mathematics specialists 562/ r 9 Other (Please specify: _______________________) 563/
564-565/ D.18. With the addition of federal CSR funds, did your district reduce class size in every eligible
class in kindergarten to grade 3 in 2000-2001? r 1 Yes 566/ r 2 No D.19 Did your district experience pressure to reduce class size in grades other than kindergarten to
grade 3 in 2000-2001? (Check all that apply.) r 1 Experienced no such pressure 567/
Experienced pressure from: r 2 Within district 568/ r 3 The state 569/ r 4 The school board/school committee 570/ r 5 Parents 571/ r 6 Teachers 572/ r 7 Schools 573/ r 8 Other (Please specify: ) 552/ 553-554/
D.20. Did growth in total student enrollment in your district make implementation of the federal
CSR program harder in 2000-2001? (Check one.) r 1 Yes 577/
r 2 No r 3 Total student enrollment did not grow D.21. Within individual school buildings, did the decrease in class size in kindergarten to grade 3
create larger class sizes in other grades in 2000-2001? r 1 Yes 578/ r 2 No
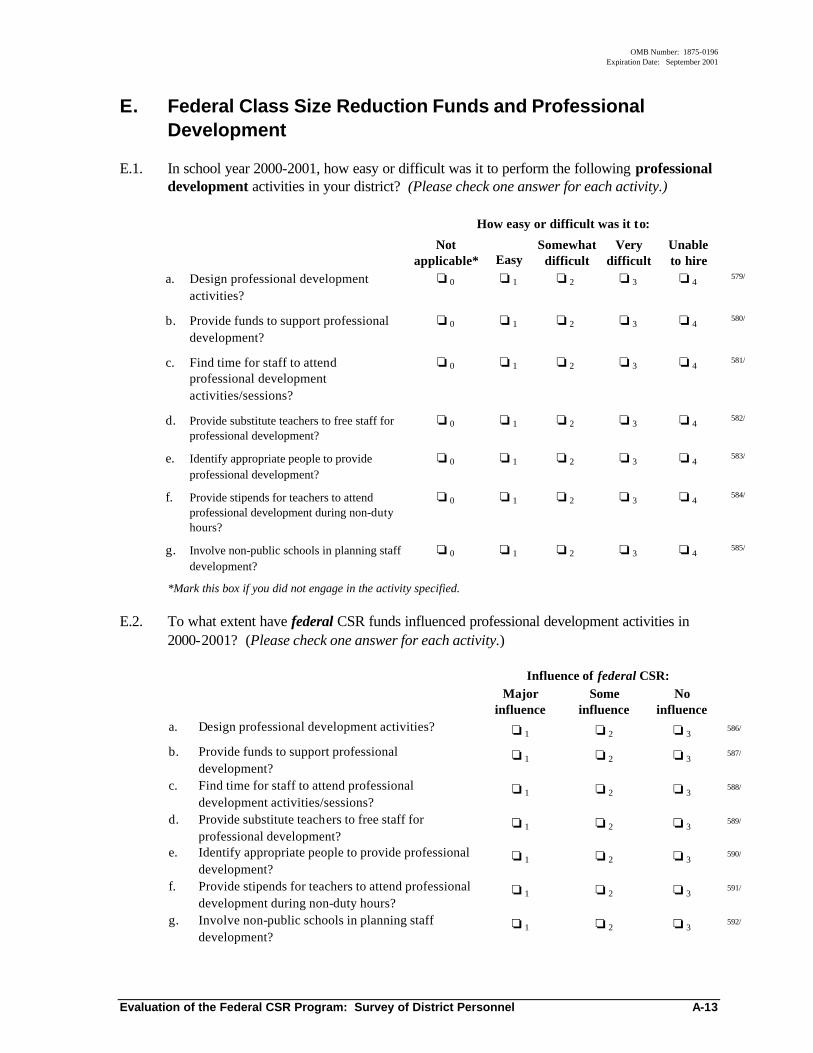
OMB Number: 1875-0196 Expiration Date: September 2001
Evaluation of the Federal CSR Program: Survey of District Personnel A-13
E. Federal Class Size Reduction Funds and Professional Development
E.1. In school year 2000-2001, how easy or difficult was it to perform the following professional development activities in your district? (Please check one answer for each activity.)
How easy or difficult was it to:
Not applicable* Easy
Somewhat difficult
Very difficult
Unable to hire
a. Design professional development activities?
o 0 o 1 o 2 o 3 o 4 579/
b. Provide funds to support professional development?
o 0 o 1 o 2 o 3 o 4 580/
c. Find time for staff to attend professional development activities/sessions?
o 0 o 1 o 2 o 3 o 4 581/
d. Provide substitute teachers to free staff for professional development?
o 0 o 1 o 2 o 3 o 4 582/
e. Identify appropriate people to provide professional development?
o 0 o 1 o 2 o 3 o 4 583/
f. Provide stipends for teachers to attend professional development during non-duty hours?
o 0 o 1 o 2 o 3 o 4 584/
g. Involve non-public schools in planning staff development?
o 0 o 1 o 2 o 3 o 4 585/
*Mark this box if you did not engage in the activity specified. E.2. To what extent have federal CSR funds influenced professional development activities in 2000-2001? (Please check one answer for each activity.)
Influence of federal CSR: Major
influence Some
influence No
influence
a. Design professional development activities? o 1 o 2 o 3 586/
b. Provide funds to support professional development?
o 1 o 2 o 3 587/
c. Find time for staff to attend professional development activities/sessions?
o 1 o 2 o 3 588/
d. Provide substitute teachers to free staff for professional development?
o 1 o 2 o 3 589/
e. Identify appropriate people to provide professional development?
o 1 o 2 o 3 590/
f. Provide stipends for teachers to attend professional development during non-duty hours?
o 1 o 2 o 3 591/
g. Involve non-public schools in planning staff development?
o 1 o 2 o 3 592/
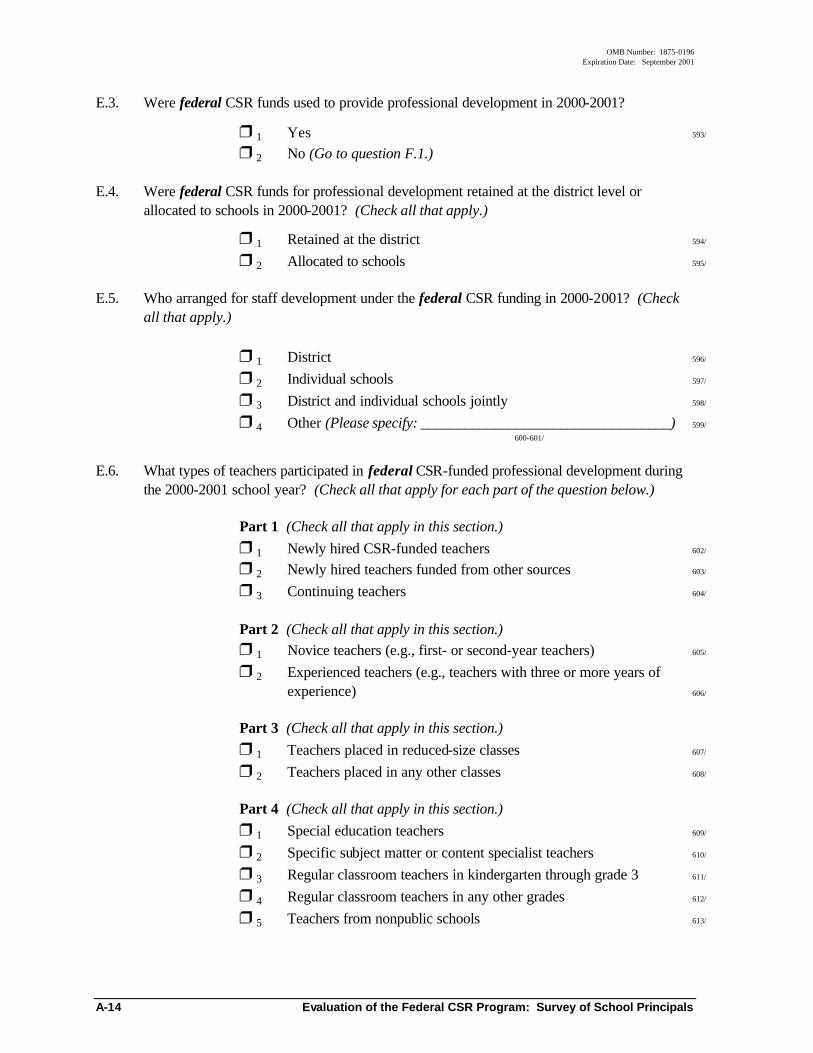
OMB Number: 1875-0196 Expiration Date: September 2001
A-14 Evaluation of the Federal CSR Program: Survey of School Principals
E.3. Were federal CSR funds used to provide professional development in 2000-2001?
r 1 Yes 593/ r 2 No (Go to question F.1.) E.4. Were federal CSR funds for professional development retained at the district level or
allocated to schools in 2000-2001? (Check all that apply.)
r 1 Retained at the district 594/ r 2 Allocated to schools 595/ E.5. Who arranged for staff development under the federal CSR funding in 2000-2001? (Check
all that apply.) r 1 District 596/ r 2 Individual schools 597/ r 3 District and individual schools jointly 598/ r 4 Other (Please specify: __________________________________) 599/
600-601/
E.6. What types of teachers participated in federal CSR-funded professional development during
the 2000-2001 school year? (Check all that apply for each part of the question below.) Part 1 (Check all that apply in this section.) r 1 Newly hired CSR-funded teachers 602/ r 2 Newly hired teachers funded from other sources 603/ r 3 Continuing teachers 604/ Part 2 (Check all that apply in this section.) r 1 Novice teachers (e.g., first- or second-year teachers) 605/ r 2 Experienced teachers (e.g., teachers with three or more years of
experience) 606/ Part 3 (Check all that apply in this section.) r 1 Teachers placed in reduced-size classes 607/ r 2 Teachers placed in any other classes 608/ Part 4 (Check all that apply in this section.) r 1 Special education teachers 609/ r 2 Specific subject matter or content specialist teachers 610/ r 3 Regular classroom teachers in kindergarten through grade 3 611/ r 4 Regular classroom teachers in any other grades 612/ r 5 Teachers from nonpublic schools 613/
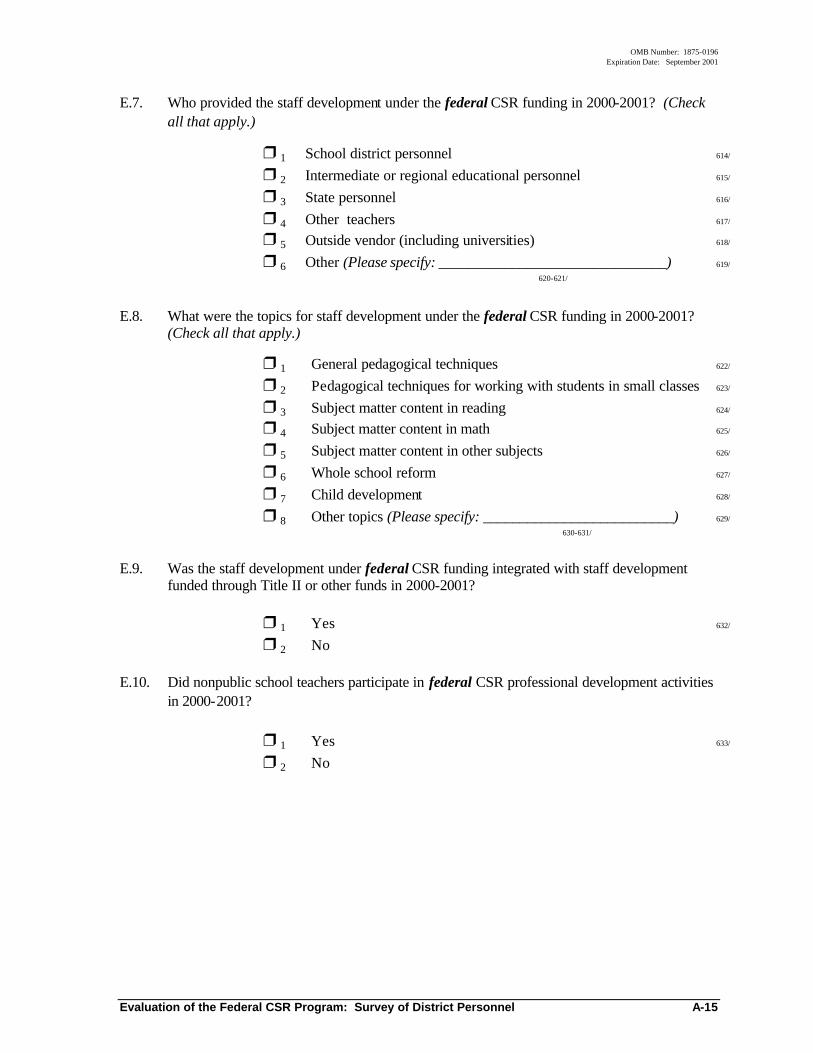
OMB Number: 1875-0196 Expiration Date: September 2001
Evaluation of the Federal CSR Program: Survey of District Personnel A-15
E.7. Who provided the staff development under the federal CSR funding in 2000-2001? (Check all that apply.)
r 1 School district personnel 614/ r 2 Intermediate or regional educational personnel 615/ r 3 State personnel 616/ r 4 Other teachers 617/ r 5 Outside vendor (including universities) 618/ r 6 Other (Please specify: _______________________________) 619/
620-621/ E.8. What were the topics for staff development under the federal CSR funding in 2000-2001?
(Check all that apply.) r 1 General pedagogical techniques 622/ r 2 Pedagogical techniques for working with students in small classes 623/ r 3 Subject matter content in reading 624/ r 4 Subject matter content in math 625/ r 5 Subject matter content in other subjects 626/ r 6 Whole school reform 627/ r 7 Child development 628/ r 8 Other topics (Please specify: __________________________) 629/
630-631/
E.9. Was the staff development under federal CSR funding integrated with staff development funded through Title II or other funds in 2000-2001?
r 1 Yes 632/ r 2 No E.10. Did nonpublic school teachers participate in federal CSR professional development activities
in 2000-2001? r 1 Yes 633/ r 2 No
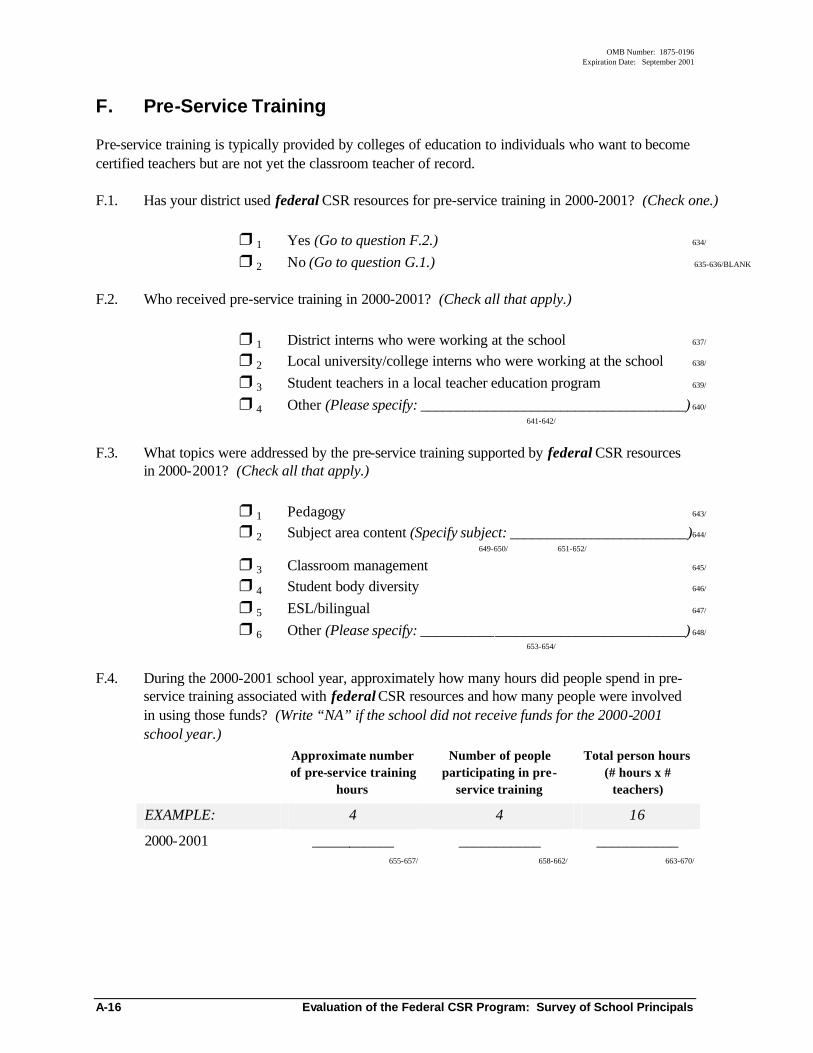
OMB Number: 1875-0196 Expiration Date: September 2001
A-16 Evaluation of the Federal CSR Program: Survey of School Principals
F. Pre-Service Training
Pre-service training is typically provided by colleges of education to individuals who want to become certified teachers but are not yet the classroom teacher of record. F.1. Has your district used federal CSR resources for pre-service training in 2000-2001? (Check one.) r 1 Yes (Go to question F.2.) 634/ r 2 No (Go to question G.1.) 635-636/BLANK F.2. Who received pre-service training in 2000-2001? (Check all that apply.) r 1 District interns who were working at the school 637/ r 2 Local university/college interns who were working at the school 638/ r 3 Student teachers in a local teacher education program 639/ r 4 Other (Please specify: ____________________________________) 640/
641-642/ F.3. What topics were addressed by the pre-service training supported by federal CSR resources
in 2000-2001? (Check all that apply.) r 1 Pedagogy 643/ r 2 Subject area content (Specify subject: ________________________) 644/
649-650/ 651-652/
r 3 Classroom management 645/ r 4 Student body diversity 646/ r 5 ESL/bilingual 647/ r 6 Other (Please specify: ____________________________________) 648/
653-654/ F.4. During the 2000-2001 school year, approximately how many hours did people spend in pre-
service training associated with federal CSR resources and how many people were involved in using those funds? (Write “NA” if the school did not receive funds for the 2000-2001 school year.) Approximate number
of pre-service training hours
Number of people participating in pre-
service training
Total person hours (# hours x #
teachers)
EXAMPLE: 4 4 16
2000-2001 ___________ 655-657/
___________ 658-662/
___________ 663-670/
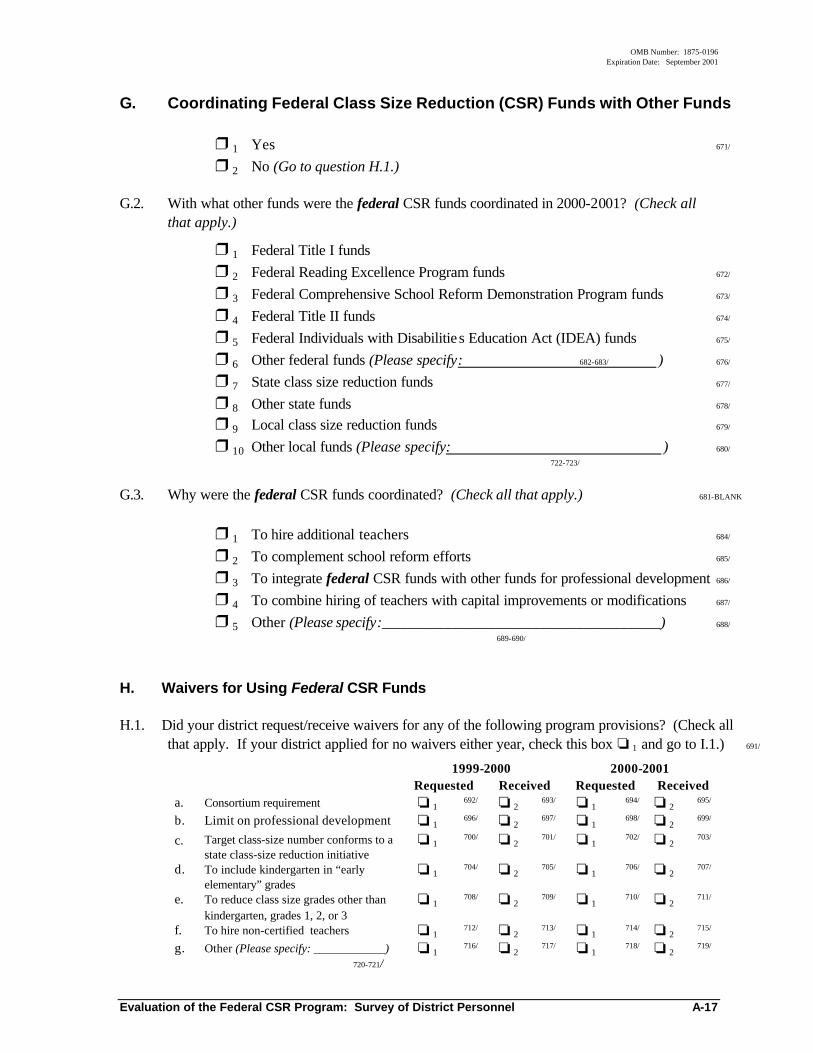
OMB Number: 1875-0196 Expiration Date: September 2001
Evaluation of the Federal CSR Program: Survey of District Personnel A-17
G. Coordinating Federal Class Size Reduction (CSR) Funds with Other Funds
r 1 Yes 671/ r 2 No (Go to question H.1.) G.2. With what other funds were the federal CSR funds coordinated in 2000-2001? (Check all
that apply.) r 1 Federal Title I funds r 2 Federal Reading Excellence Program funds 672/ r 3 Federal Comprehensive School Reform Demonstration Program funds 673/ r 4 Federal Title II funds 674/ r 5 Federal Individuals with Disabilitie s Education Act (IDEA) funds 675/ r 6 Other federal funds (Please specify: 682-683/ ) 676/ r 7 State class size reduction funds 677/ r 8 Other state funds 678/ r 9 Local class size reduction funds 679/ r 10 Other local funds (Please specify: ) 680/ 722-723/
G.3. Why were the federal CSR funds coordinated? (Check all that apply.) 681-BLANK r 1 To hire additional teachers 684/ r 2 To complement school reform efforts 685/ r 3 To integrate federal CSR funds with other funds for professional development 686/ r 4 To combine hiring of teachers with capital improvements or modifications 687/ r 5 Other (Please specify:______________________________________) 688/
689-690/ H. Waivers for Using Federal CSR Funds H.1. Did your district request/receive waivers for any of the following program provisions? (Check all
that apply. If your district applied for no waivers either year, check this box o 1 and go to I.1.) 691/
1999-2000 2000-2001 Requested Received Requested Received a. Consortium requirement o 1 692/ o 2 693/ o 1 694/ o 2
695/
b. Limit on professional development o 1 696/ o 2 697/ o 1 698/ o 2 699/
c. Target class-size number conforms to a state class-size reduction initiative
o 1 700/ o 2 701/ o 1 702/ o 2 703/
d. To include kindergarten in “early elementary” grades
o 1 704/ o 2 705/ o 1 706/ o 2 707/
e. To reduce class size grades other than kindergarten, grades 1, 2, or 3
o 1 708/ o 2 709/ o 1 710/ o 2 711/
f. To hire non-certified teachers o 1 712/ o 2 713/ o 1 714/ o 2 715/
g. Other (Please specify: ____________) 720-721/
o 1 716/ o 2 717/ o 1 718/ o 2 719/
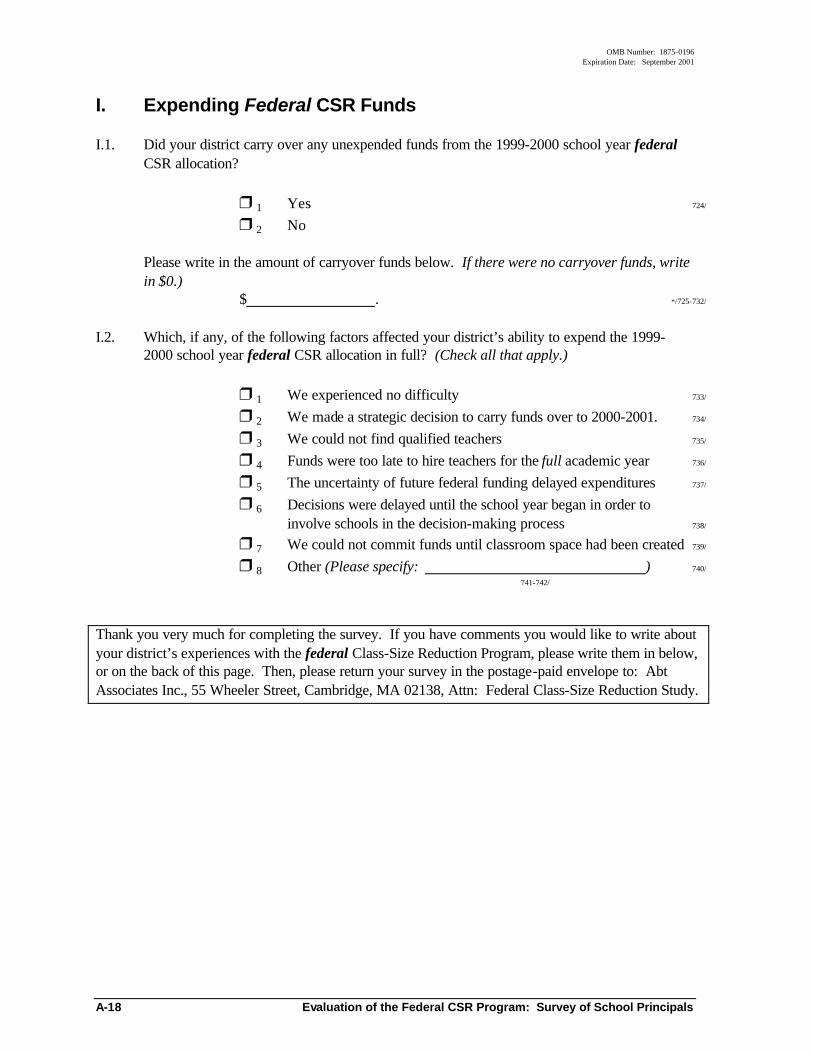
OMB Number: 1875-0196 Expiration Date: September 2001
A-18 Evaluation of the Federal CSR Program: Survey of School Principals
I. Expending Federal CSR Funds
I.1. Did your district carry over any unexpended funds from the 1999-2000 school year federal CSR allocation?
r 1 Yes 724/ r 2 No Please write in the amount of carryover funds below. If there were no carryover funds, write
in $0.) $ . */725-732/ I.2. Which, if any, of the following factors affected your district’s ability to expend the 1999-
2000 school year federal CSR allocation in full? (Check all that apply.) r 1 We experienced no difficulty 733/ r 2 We made a strategic decision to carry funds over to 2000-2001. 734/
r 3 We could not find qualified teachers 735/ r 4 Funds were too late to hire teachers for the full academic year 736/ r 5 The uncertainty of future federal funding delayed expenditures 737/ r 6 Decisions were delayed until the school year began in order to
involve schools in the decision-making process 738/ r 7 We could not commit funds until classroom space had been created 739/ r 8 Other (Please specify: ) 740/
741-742/ Thank you very much for completing the survey. If you have comments you would like to write about your district’s experiences with the federal Class-Size Reduction Program, please write them in below, or on the back of this page. Then, please return your survey in the postage-paid envelope to: Abt Associates Inc., 55 Wheeler Street, Cambridge, MA 02138, Attn: Federal Class-Size Reduction Study.
OMB Number: 1875-0196 Expiration Date: September 2001
Evaluation of the Federal CSR Program: Survey of School Principals A-19
The National Evaluation of the Federal Class-Size Reduction Program Survey of School Principals
This survey is being conducted for the U.S. Department of Education as a part of its efforts to learn about the implementation and early impact of the federal Class-Size Reduction (CSR) Program. The Program represents a major federal commitment to help school districts hire additional highly qualified teachers so children, especially in the early elementary grades, can learn in smaller classes. It is only through this survey that the federal government can find how many additional teachers have been hired, how funds have been spent, and what kinds of issues have arisen in implementing the program. Only a limited number of school principals are being asked to complete this survey, so your response is very important to us. We estimate that the survey will take about 45 minutes to complete. If you have any questions, please call Joan Ruskus toll-free at Abt Associates Inc., 866-270-1519. Thank you very much for your cooperation. Please verify the contact information above, answer all the questions, and return the completed questionnaire in the enclosed postage-paid envelope to: Attn: Federal Class-Size Reduction Study Abt Associates Inc. 55 Wheeler Street Cambridge, MA 02138 If your school did not receive any resources to implement the federal Class-Size Reduction Program for either 1999-2000 or 2000-2001, please check the box and return the survey in the enclosed envelope. It is very important that you return the survey even though you are not participating in the program. Thank you very much!
r 11/
All information that would permit identification of the individual respondent will be held in strict confidence, will be used only by persons engaged in and for the purposes of the survey, and will not be disclosed or released to others for any purpose as required by law. According to the Paperwork Reduction Act of 1995, no persons are required to respond to a collection of information unless such a collection displays a valid OMB control number. The valid OMB control number for this information collection is 1875-0196. The time required to complete this information collection is estimated to average 45 minutes per response, including the time to review instructions, search existing data resources, gather the data needed, and complete and review the information collection. If you have any comments concerning the accuracy of the time estimate or suggestions for improving this form, please write to: U.S. Department of Education, Washington, DC 20202-4651. If you have comments or concerns regarding the status of your individual submission of this form, write directly to: Planning and Evaluation Service, U.S. Department of Education, 400 Maryland Avenue, S.W., Washington, DC 20202-4651.
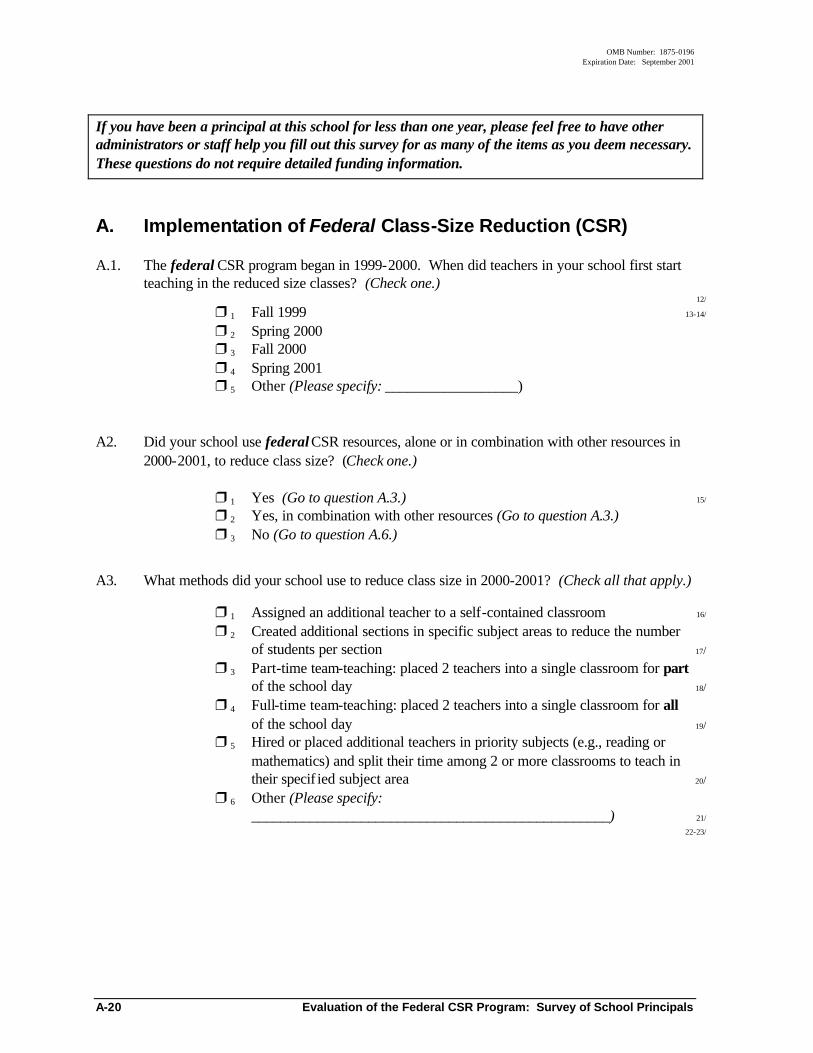
OMB Number: 1875-0196 Expiration Date: September 2001
A-20 Evaluation of the Federal CSR Program: Survey of School Principals
If you have been a principal at this school for less than one year, please feel free to have other administrators or staff help you fill out this survey for as many of the items as you deem necessary. These questions do not require detailed funding information.
A. Implementation of Federal Class-Size Reduction (CSR)
A.1. The federal CSR program began in 1999-2000. When did teachers in your school first start teaching in the reduced size classes? (Check one.)
12/
r 1 Fall 1999 13-14/
r 2 Spring 2000 r 3 Fall 2000 r 4 Spring 2001 r 5 Other (Please specify: __________________) A2. Did your school use federal CSR resources, alone or in combination with other resources in
2000-2001, to reduce class size? (Check one.) r 1 Yes (Go to question A.3.) 15/ r 2 Yes, in combination with other resources (Go to question A.3.) r 3 No (Go to question A.6.) A3. What methods did your school use to reduce class size in 2000-2001? (Check all that apply.) r 1 Assigned an additional teacher to a self-contained classroom 16/ r 2 Created additional sections in specific subject areas to reduce the number of students per section 17/ r 3 Part-time team-teaching: placed 2 teachers into a single classroom for part of the school day 18/ r 4 Full-time team-teaching: placed 2 teachers into a single classroom for all of the school day 19/ r 5 Hired or placed additional teachers in priority subjects (e.g., reading or mathematics) and split their time among 2 or more classrooms to teach in their specif ied subject area 20/ r 6 Other (Please specify: _________________________________________________) 21/
22-23/
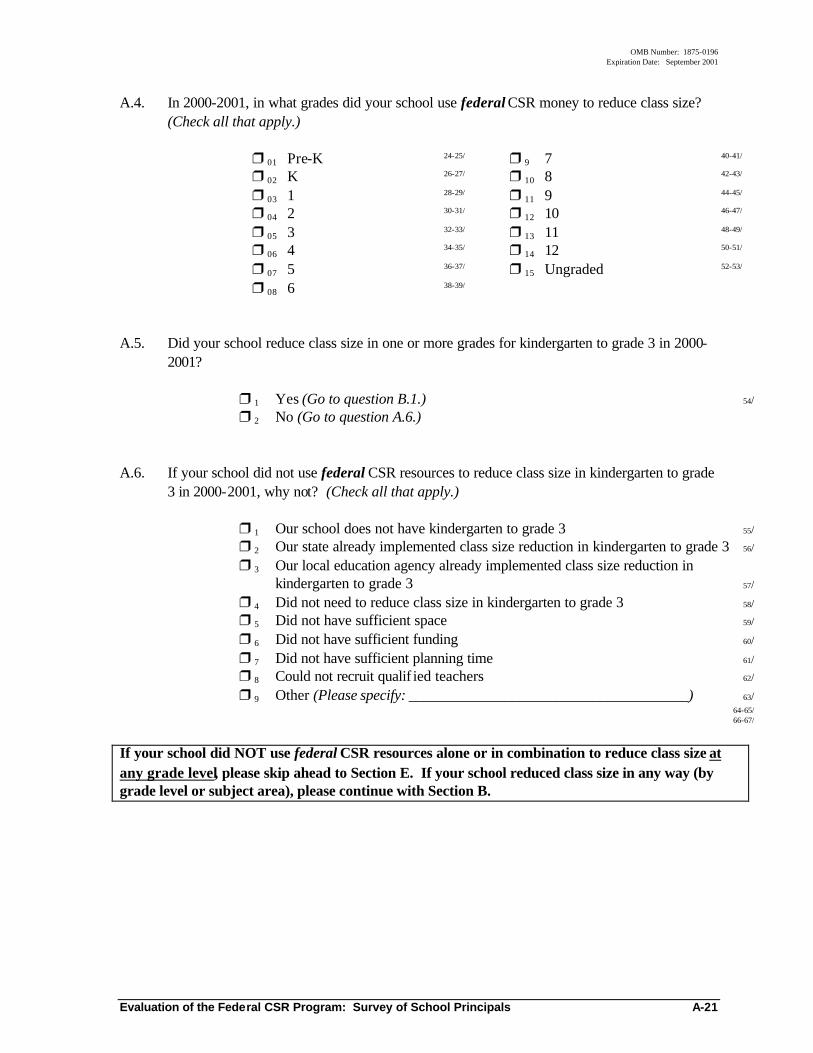
OMB Number: 1875-0196 Expiration Date: September 2001
Evaluation of the Federal CSR Program: Survey of School Principals A-21
A.4. In 2000-2001, in what grades did your school use federal CSR money to reduce class size? (Check all that apply.)
r 01 Pre-K 24-25/ r 9 7 40-41/
r 02 K 26-27/ r 10 8 42-43/
r 03 1 28-29/ r 11 9 44-45/
r 04 2 30-31/ r 12 10 46-47/
r 05 3 32-33/ r 13 11 48-49/
r 06 4 34-35/ r 14 12 50-51/
r 07 5 36-37/ r 15 Ungraded 52-53/
r 08 6 38-39/
A.5. Did your school reduce class size in one or more grades for kindergarten to grade 3 in 2000-
2001? r 1 Yes (Go to question B.1.) 54/ r 2 No (Go to question A.6.) A.6. If your school did not use federal CSR resources to reduce class size in kindergarten to grade
3 in 2000-2001, why not? (Check all that apply.) r 1 Our school does not have kindergarten to grade 3 55/ r 2 Our state already implemented class size reduction in kindergarten to grade 3 56/ r 3 Our local education agency already implemented class size reduction in
kindergarten to grade 3 57/ r 4 Did not need to reduce class size in kindergarten to grade 3 58/ r 5 Did not have sufficient space 59/ r 6 Did not have sufficient funding 60/ r 7 Did not have sufficient planning time 61/ r 8 Could not recruit qualif ied teachers 62/ r 9 Other (Please specify: ______________________________________) 63/ 64-65/ 66-67/ If your school did NOT use federal CSR resources alone or in combination to reduce class size at any grade level, please skip ahead to Section E. If your school reduced class size in any way (by grade level or subject area), please continue with Section B.
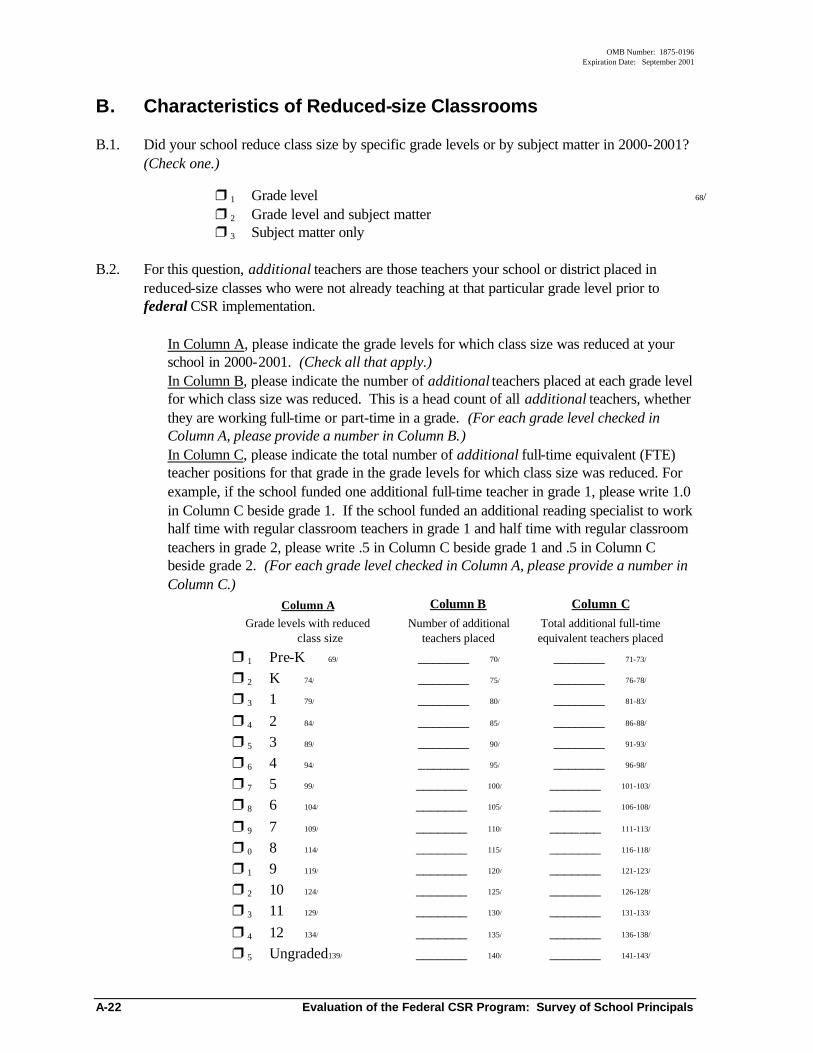
OMB Number: 1875-0196 Expiration Date: September 2001
A-22 Evaluation of the Federal CSR Program: Survey of School Principals
B. Characteristics of Reduced-size Classrooms
B.1. Did your school reduce class size by specific grade levels or by subject matter in 2000-2001? (Check one.)
r 1 Grade level 68/ r 2 Grade level and subject matter r 3 Subject matter only B.2. For this question, additional teachers are those teachers your school or district placed in
reduced-size classes who were not already teaching at that particular grade level prior to federal CSR implementation.
In Column A, please indicate the grade levels for which class size was reduced at your school in 2000-2001. (Check all that apply.) In Column B, please indicate the number of additional teachers placed at each grade level for which class size was reduced. This is a head count of all additional teachers, whether they are working full-time or part-time in a grade. (For each grade level checked in Column A, please provide a number in Column B.) In Column C, please indicate the total number of additional full-time equivalent (FTE) teacher positions for that grade in the grade levels for which class size was reduced. For example, if the school funded one additional full-time teacher in grade 1, please write 1.0 in Column C beside grade 1. If the school funded an additional reading specialist to work half time with regular classroom teachers in grade 1 and half time with regular classroom teachers in grade 2, please write .5 in Column C beside grade 1 and .5 in Column C beside grade 2. (For each grade level checked in Column A, please provide a number in Column C.)
Column A Column B Column C Grade levels with reduced
class size Number of additional
teachers placed Total additional full-time equivalent teachers placed
r 1 Pre-K 69/ r 2 K 74/ r 3 1 79/ r 4 2 84/ r 5 3 89/ r 6 4 94/ r 7 5 99/ r 8 6 104/ r 9 7 109/ r 0 8 114/ r 1 9 119/ r 2 10 124/ r 3 11 129/ r 4 12 134/ r 5 Ungraded 139/
_______ 70/
_______ 75/ _______ 80/ _______ 85/ _______ 90/ _______ 95/ _______ 100/ _______ 105/
_______ 110/ _______ 115/ _______ 120/ _______ 125/ _______ 130/ _______ 135/ _______ 140/
_______ 71-73/
_______ 76-78/ _______ 81-83/ _______ 86-88/ _______ 91-93/ _______ 96-98/
_______ 101-103/ _______ 106-108/
_______ 111-113/ _______ 116-118/ _______ 121-123/ _______ 126-128/ _______ 131-133/ _______ 136-138/ _______ 141-143/
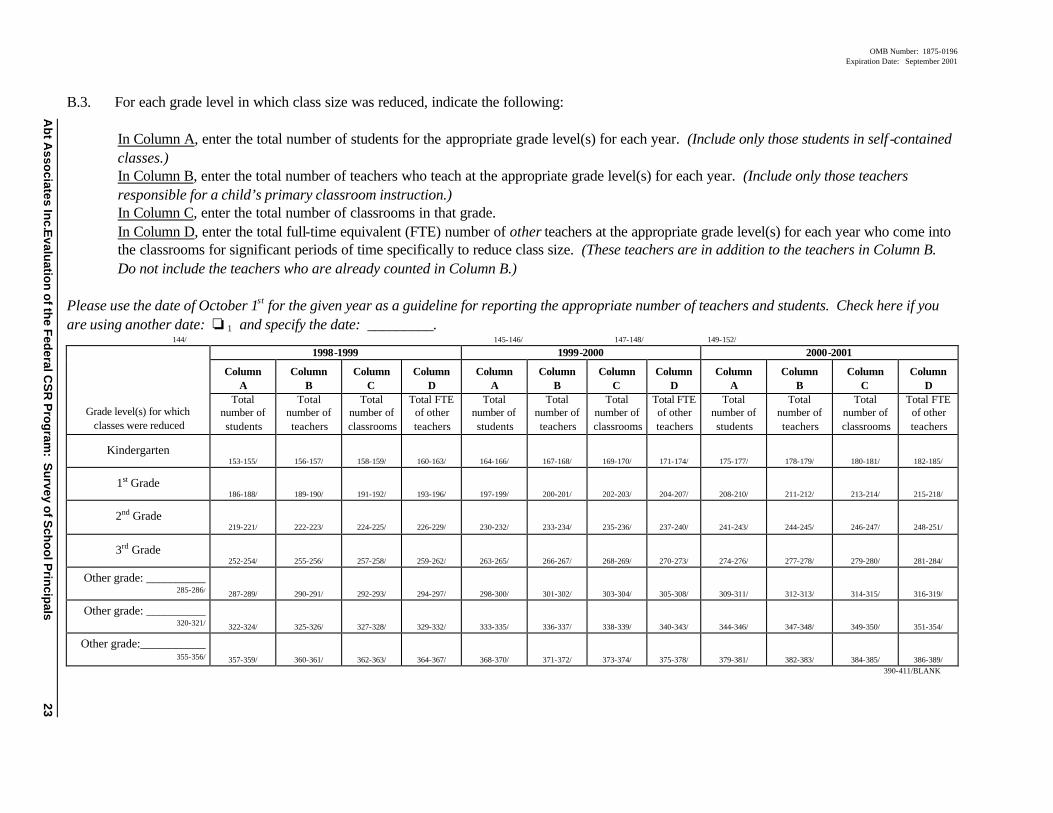
OMB Number: 1875-0196 Expiration Date: September 2001
Ab
t Asso
ciates Inc.E
valuatio
n o
f the F
ederal C
SR
Pro
gram
: Su
rvey of S
cho
ol P
rincip
als
23
B.3. For each grade level in which class size was reduced, indicate the following: In Column A, enter the total number of students for the appropriate grade level(s) for each year. (Include only those students in self -contained classes.) In Column B, enter the total number of teachers who teach at the appropriate grade level(s) for each year. (Include only those teachers responsible for a child’s primary classroom instruction.) In Column C, enter the total number of classrooms in that grade. In Column D, enter the total full-time equivalent (FTE) number of other teachers at the appropriate grade level(s) for each year who come into the classrooms for significant periods of time specifically to reduce class size. (These teachers are in addition to the teachers in Column B. Do not include the teachers who are already counted in Column B.)
Please use the date of October 1st for the given year as a guideline for reporting the appropriate number of teachers and students. Check here if you are using another date: o 1 and specify the date: _________. 144/ 145-146/ 147-148/ 149-152/
1998-1999 1999-2000 2000-2001
Column A
Column B
Column C
Column D
Column A
Column B
Column C
Column D
Column A
Column B
Column C
Column D
Grade level(s) for which classes were reduced
Total number of students
Total number of teachers
Total number of classrooms
Total FTE of other teachers
Total number of students
Total number of teachers
Total number of classrooms
Total FTE of other teachers
Total number of students
Total number of teachers
Total number of classrooms
Total FTE of other teachers
Kindergarten 153-155/ 156-157/ 158-159/ 160-163/ 164-166/ 167-168/ 169-170/ 171-174/ 175-177/ 178-179/ 180-181/ 182-185/
1st Grade 186-188/ 189-190/ 191-192/ 193-196/ 197-199/ 200-201/ 202-203/ 204-207/ 208-210/ 211-212/ 213-214/ 215-218/
2nd Grade 219-221/ 222-223/ 224-225/ 226-229/ 230-232/ 233-234/ 235-236/ 237-240/ 241-243/ 244-245/ 246-247/ 248-251/
3rd Grade 252-254/ 255-256/ 257-258/ 259-262/ 263-265/ 266-267/ 268-269/ 270-273/ 274-276/ 277-278/ 279-280/ 281-284/
Other grade: __________ 285-286/ 287-289/ 290-291/ 292-293/ 294-297/ 298-300/ 301-302/ 303-304/ 305-308/ 309-311/ 312-313/ 314-315/ 316-319/
Other grade: __________ 320-321/ 322-324/ 325-326/ 327-328/ 329-332/ 333-335/ 336-337/ 338-339/ 340-343/ 344-346/ 347-348/ 349-350/ 351-354/
Other grade:___________ 355-356/ 357-359/ 360-361/ 362-363/ 364-367/ 368-370/ 371-372/ 373-374/ 375-378/ 379-381/ 382-383/ 384-385/ 386-389/
390-411/BLANK
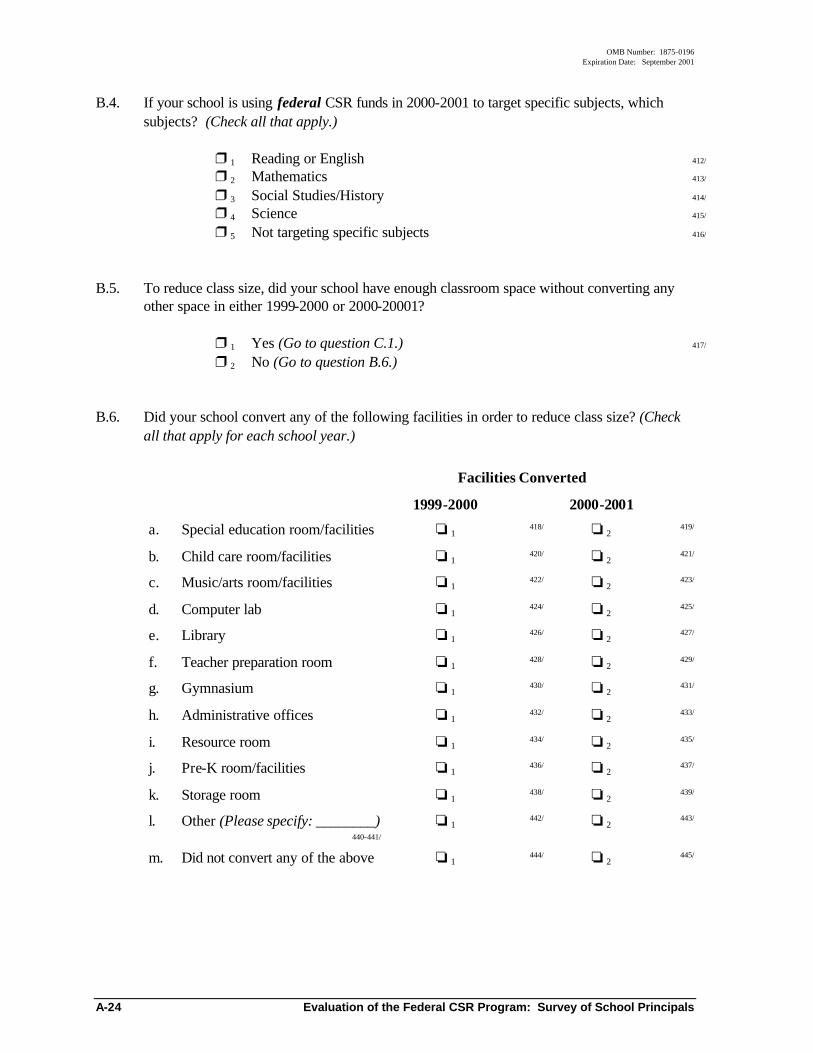
OMB Number: 1875-0196 Expiration Date: September 2001
A-24 Evaluation of the Federal CSR Program: Survey of School Principals
B.4. If your school is using federal CSR funds in 2000-2001 to target specific subjects, which subjects? (Check all that apply.)
r 1 Reading or English 412/ r 2 Mathematics 413/ r 3 Social Studies/History 414/ r 4 Science 415/ r 5 Not targeting specific subjects 416/ B.5. To reduce class size, did your school have enough classroom space without converting any
other space in either 1999-2000 or 2000-20001? r 1 Yes (Go to question C.1.) 417/ r 2 No (Go to question B.6.) B.6. Did your school convert any of the following facilities in order to reduce class size? (Check
all that apply for each school year.)
Facilities Converted
1999-2000 2000-2001
a. Special education room/facilities o 1 418/ o 2
419/
b. Child care room/facilities o 1 420/ o 2
421/
c. Music/arts room/facilities o 1 422/ o 2
423/
d. Computer lab o 1 424/ o 2
425/
e. Library o 1 426/ o 2
427/
f. Teacher preparation room o 1 428/ o 2
429/
g. Gymnasium o 1 430/ o 2
431/
h. Administrative offices o 1 432/ o 2
433/
i. Resource room o 1 434/ o 2
435/
j. Pre-K room/facilities o 1 436/ o 2
437/
k. Storage room o 1 438/ o 2
439/
l. Other (Please specify: ________) 440-441/
o 1 442/ o 2
443/
m. Did not convert any of the above o 1 444/ o 2
445/
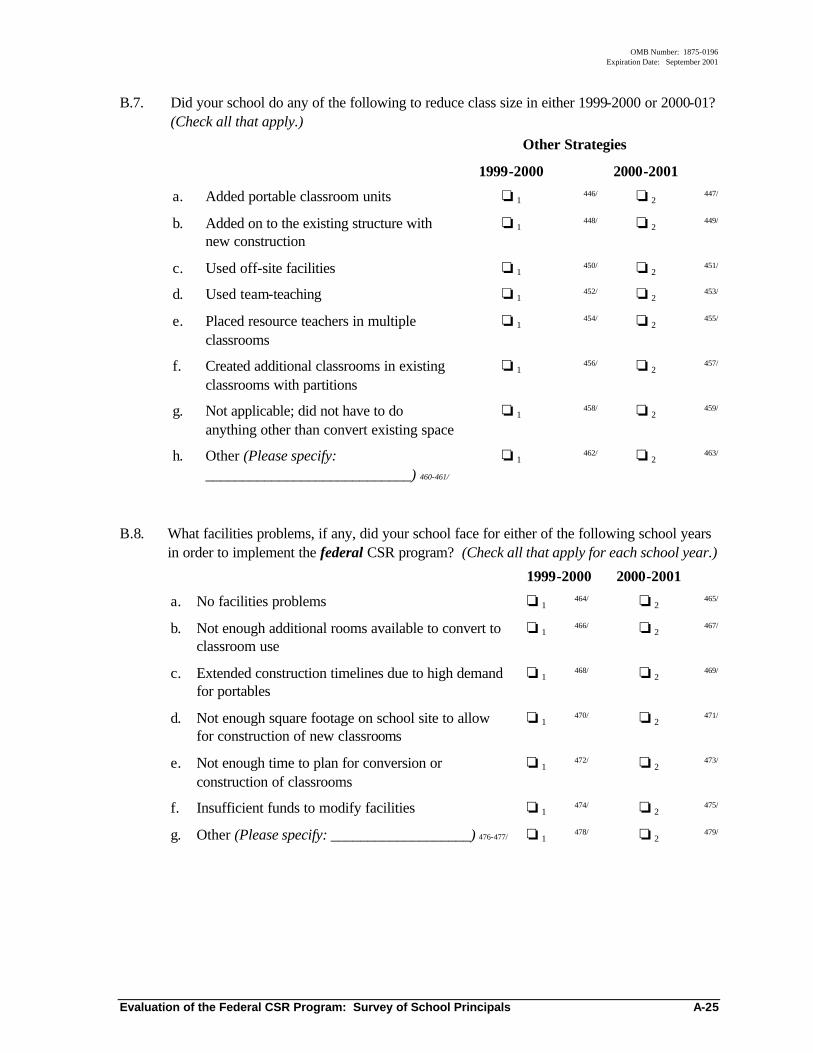
OMB Number: 1875-0196 Expiration Date: September 2001
Evaluation of the Federal CSR Program: Survey of School Principals A-25
B.7. Did your school do any of the following to reduce class size in either 1999-2000 or 2000-01? (Check all that apply.)
Other Strategies
1999-2000 2000-2001
a. Added portable classroom units o 1 446/ o 2
447/
b. Added on to the existing structure with new construction
o 1 448/ o 2
449/
c. Used off-site facilities o 1 450/ o 2
451/
d. Used team-teaching o 1 452/ o 2
453/
e. Placed resource teachers in multiple classrooms
o 1 454/ o 2
455/
f. Created additional classrooms in existing classrooms with partitions
o 1 456/ o 2
457/
g. Not applicable; did not have to do anything other than convert existing space
o 1 458/ o 2
459/
h. Other (Please specify: ____________________________) 460-461/
o 1 462/ o 2
463/
B.8. What facilities problems, if any, did your school face for either of the following school years
in order to implement the federal CSR program? (Check all that apply for each school year.)
1999-2000 2000-2001
a. No facilities problems o 1 464/ o 2
465/
b. Not enough additional rooms available to convert to classroom use
o 1 466/ o 2
467/
c. Extended construction timelines due to high demand for portables
o 1 468/ o 2
469/
d. Not enough square footage on school site to allow for construction of new classrooms
o 1 470/ o 2
471/
e. Not enough time to plan for conversion or construction of classrooms
o 1 472/ o 2
473/
f. Insufficient funds to modify facilities o 1 474/ o 2
475/
g. Other (Please specify: ___________________) 476-477/ o 1 478/ o 2
479/
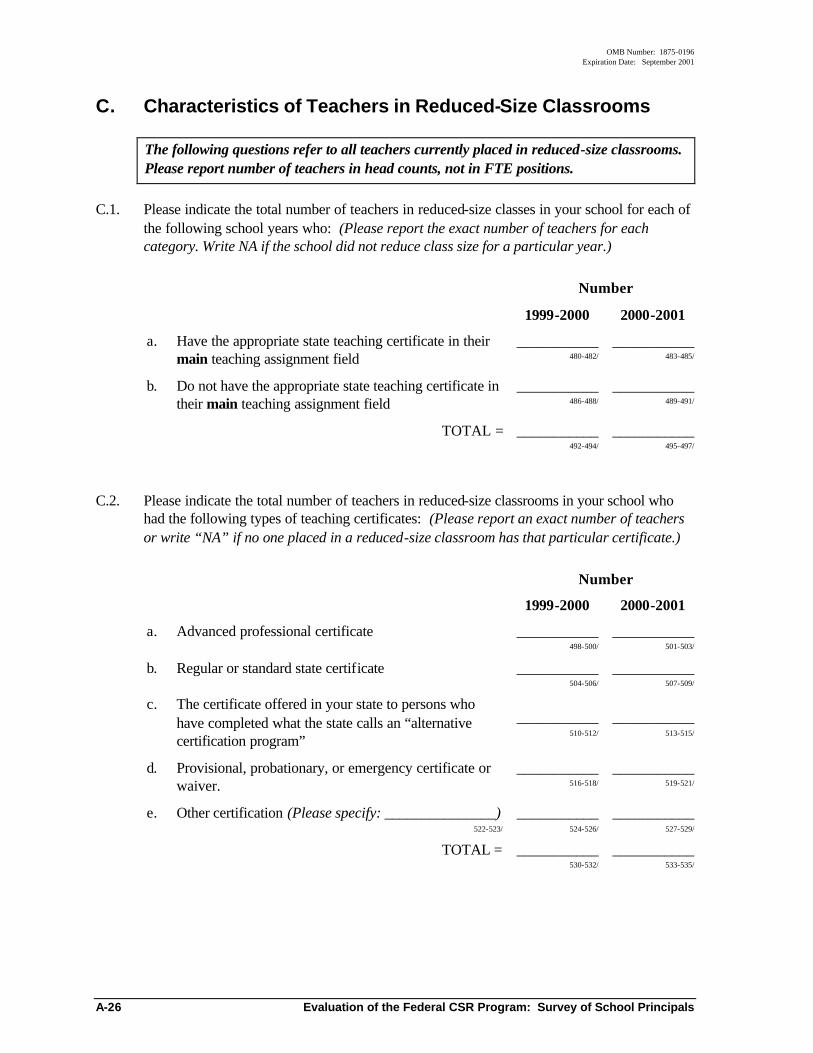
OMB Number: 1875-0196 Expiration Date: September 2001
A-26 Evaluation of the Federal CSR Program: Survey of School Principals
C. Characteristics of Teachers in Reduced-Size Classrooms
The following questions refer to all teachers currently placed in reduced-size classrooms. Please report number of teachers in head counts, not in FTE positions.
C.1. Please indicate the total number of teachers in reduced-size classes in your school for each of
the following school years who: (Please report the exact number of teachers for each category. Write NA if the school did not reduce class size for a particular year.)
Number
1999-2000 2000-2001
a. Have the appropriate state teaching certificate in their main teaching assignment field
___________ 480-482/
___________ 483-485/
b. Do not have the appropriate state teaching certificate in their main teaching assignment field
___________ 486-488/
___________ 489-491/
TOTAL = ___________ 492-494/
___________ 495-497/
C.2. Please indicate the total number of teachers in reduced-size classrooms in your school who
had the following types of teaching certificates: (Please report an exact number of teachers or write “NA” if no one placed in a reduced-size classroom has that particular certificate.)
Number
1999-2000 2000-2001
a. Advanced professional certificate ___________ 498-500/
___________ 501-503/
b. Regular or standard state certificate ___________ 504-506/
___________ 507-509/
c. The certificate offered in your state to persons who have completed what the state calls an “alternative certification program”
___________ 510-512/
___________ 513-515/
d. Provisional, probationary, or emergency certificate or waiver.
___________ 516-518/
___________ 519-521/
e. Other certification (Please specify: _______________) 522-523/
___________ 524-526/
___________ 527-529/
TOTAL = ___________ 530-532/
___________ 533-535/
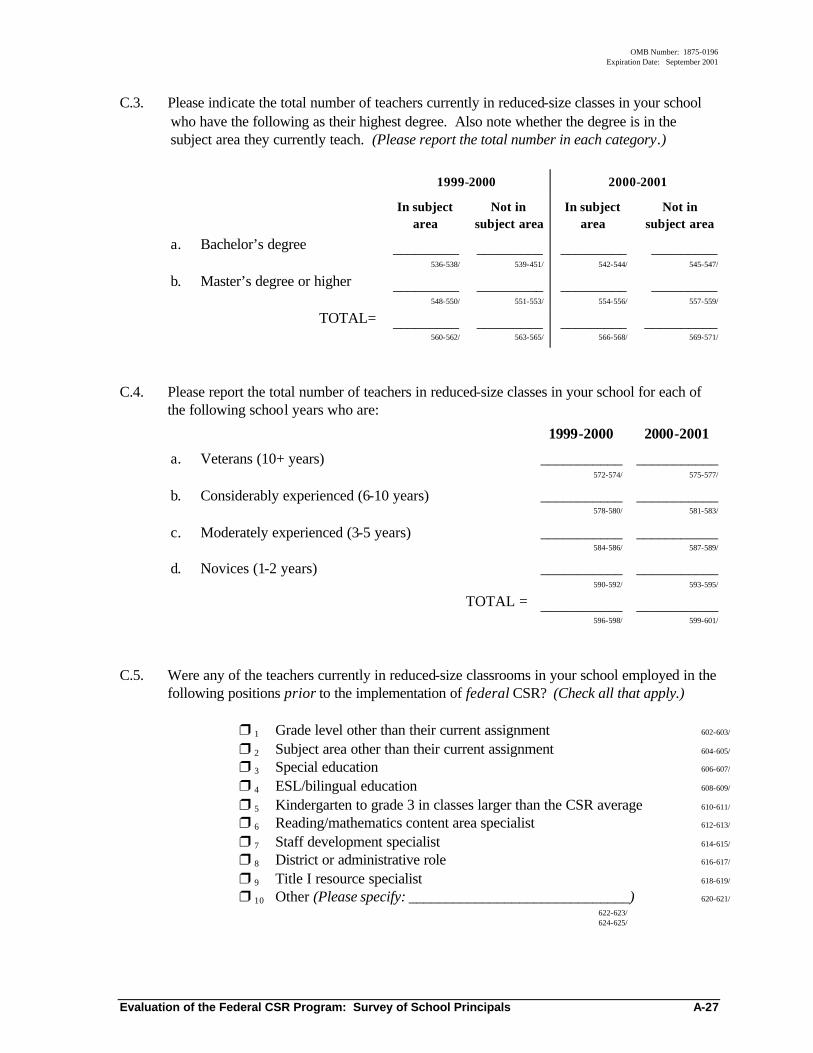
OMB Number: 1875-0196 Expiration Date: September 2001
Evaluation of the Federal CSR Program: Survey of School Principals A-27
C.3. Please indicate the total number of teachers currently in reduced-size classes in your school who have the following as their highest degree. Also note whether the degree is in the subject area they currently teach. (Please report the total number in each category.)
1999-2000 2000-2001
In subject area
Not in subject area
In subject area
Not in subject area
a. Bachelor’s degree _________ 536-538/
_________ 539-451/
_________ 542-544/
_________ 545-547/
b. Master’s degree or higher _________ 548-550/
_________ 551-553/
_________ 554-556/
_________ 557-559/
TOTAL= _________ 560-562/
_________ 563-565/
_________ 566-568/
__________ 569-571/
C.4. Please report the total number of teachers in reduced-size classes in your school for each of the following school years who are:
1999-2000 2000-2001
a. Veterans (10+ years) ___________ 572-574/
___________ 575-577/
b. Considerably experienced (6-10 years) ___________ 578-580/
___________ 581-583/
c. Moderately experienced (3-5 years) ___________ 584-586/
___________ 587-589/
d. Novices (1-2 years) ___________ 590-592/
___________ 593-595/
TOTAL = ___________ 596-598/
___________ 599-601/
C.5. Were any of the teachers currently in reduced-size classrooms in your school employed in the
following positions prior to the implementation of federal CSR? (Check all that apply.)
r 1 Grade level other than their current assignment 602-603/ r 2 Subject area other than their current assignment 604-605/ r 3 Special education 606-607/ r 4 ESL/bilingual education 608-609/ r 5 Kindergarten to grade 3 in classes larger than the CSR average 610-611/ r 6 Reading/mathematics content area specialist 612-613/ r 7 Staff development specialist 614-615/ r 8 District or administrative role 616-617/ r 9 Title I resource specialist 618-619/ r 10 Other (Please specify: ______________________________) 620-621/
622-623/ 624-625/
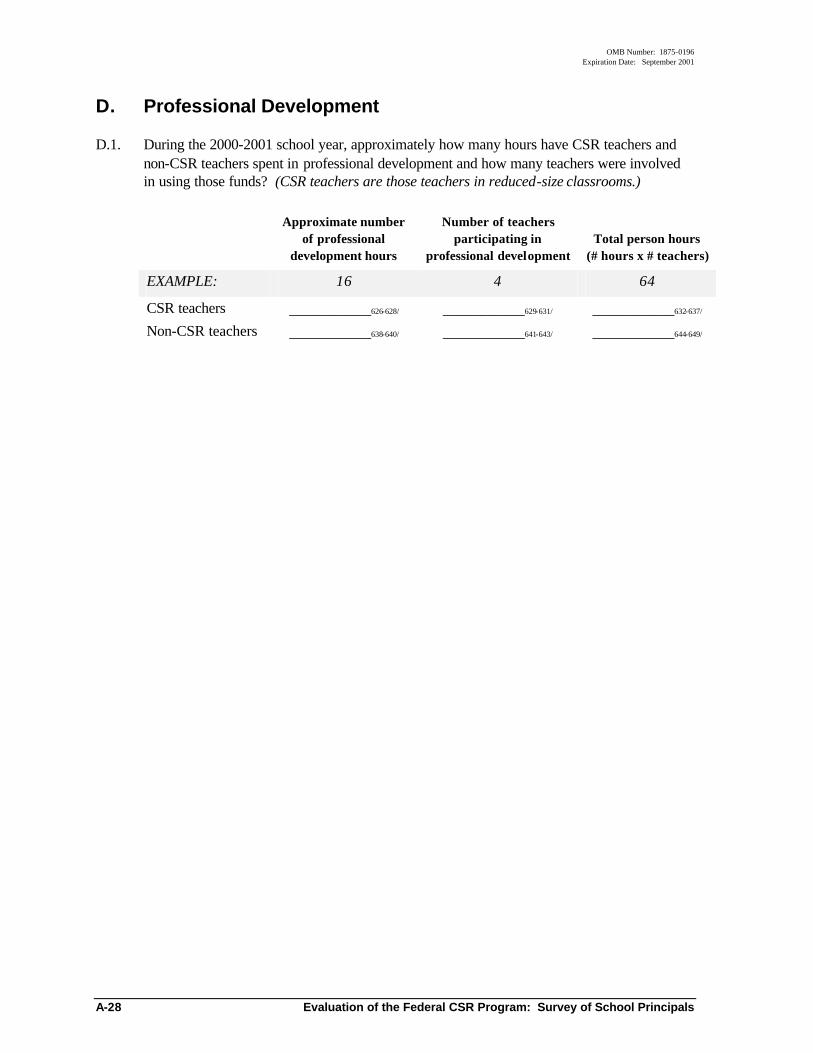
OMB Number: 1875-0196 Expiration Date: September 2001
A-28 Evaluation of the Federal CSR Program: Survey of School Principals
D. Professional Development
D.1. During the 2000-2001 school year, approximately how many hours have CSR teachers and non-CSR teachers spent in professional development and how many teachers were involved in using those funds? (CSR teachers are those teachers in reduced-size classrooms.)
Approximate number
of professional development hours
Number of teachers participating in
professional development Total person hours
(# hours x # teachers)
EXAMPLE: 16 4 64
CSR teachers ___________626-628/ ___________629-631/ ___________632-637/ Non-CSR teachers ___________638-640/ ___________641-643/ ___________644-649/
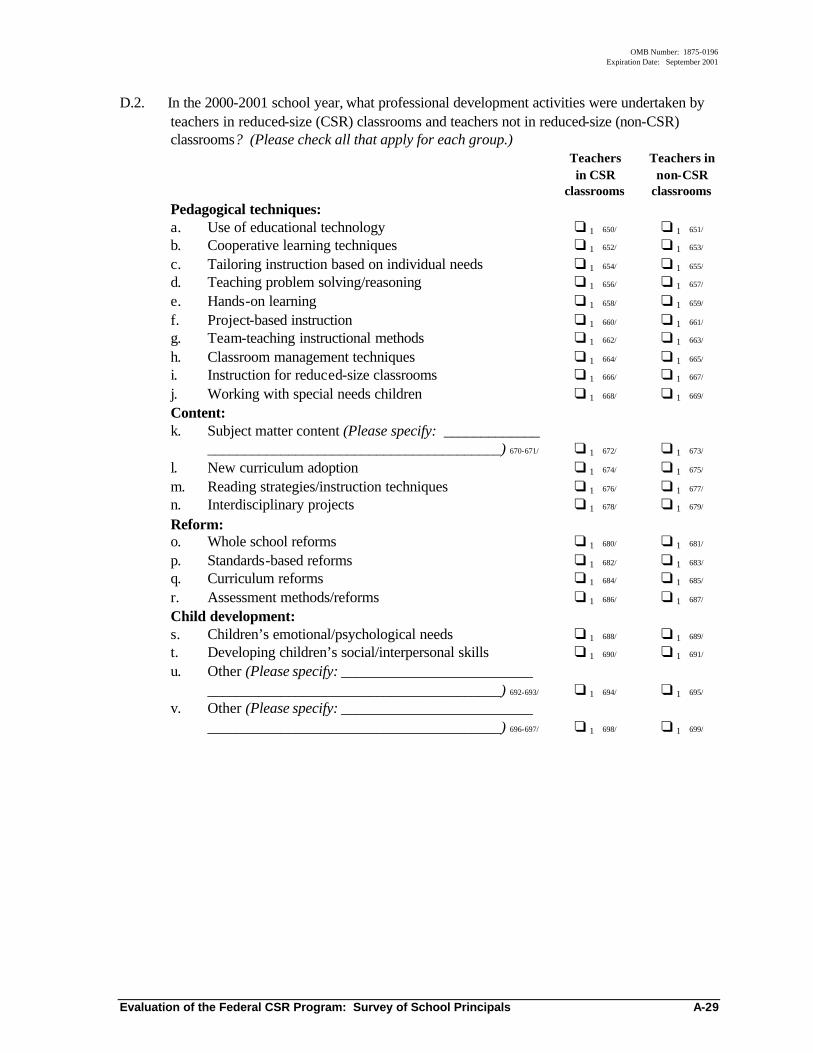
OMB Number: 1875-0196 Expiration Date: September 2001
Evaluation of the Federal CSR Program: Survey of School Principals A-29
D.2. In the 2000-2001 school year, what professional development activities were undertaken by teachers in reduced-size (CSR) classrooms and teachers not in reduced-size (non-CSR) classrooms? (Please check all that apply for each group.) Teachers
in CSR classrooms
Teachers in non-CSR
classrooms Pedagogical techniques: a. Use of educational technology q 1 650/ q 1 651/ b. Cooperative learning techniques q 1 652/ q 1 653/ c. Tailoring instruction based on individual needs q 1 654/ q 1 655/ d. Teaching problem solving/reasoning q 1 656/ q 1 657/ e. Hands-on learning q 1 658/ q 1 659/ f. Project-based instruction q 1 660/ q 1 661/ g. Team-teaching instructional methods q 1 662/ q 1 663/ h. Classroom management techniques q 1 664/ q 1 665/ i. Instruction for reduced-size classrooms q 1 666/ q 1 667/ j. Working with special needs children q 1 668/ q 1 669/ Content: k. Subject matter content (Please specify: _____________
________________________________________) 670-671/
q 1 672/
q 1 673/ l. New curriculum adoption q 1 674/ q 1 675/ m. Reading strategies/instruction techniques q 1 676/ q 1 677/ n. Interdisciplinary projects q 1 678/ q 1 679/ Reform: o. Whole school reforms q 1 680/ q 1 681/ p. Standards-based reforms q 1 682/ q 1 683/ q. Curriculum reforms q 1 684/ q 1 685/ r. Assessment methods/reforms q 1 686/ q 1 687/ Child development: s. Children’s emotional/psychological needs q 1 688/ q 1 689/ t. Developing children’s social/interpersonal skills q 1 690/ q 1 691/ u. Other (Please specify: __________________________
________________________________________) 692-693/
q 1 694/
q 1 695/ v. Other (Please specify: __________________________
________________________________________) 696-697/
q 1 698/
q 1 699/
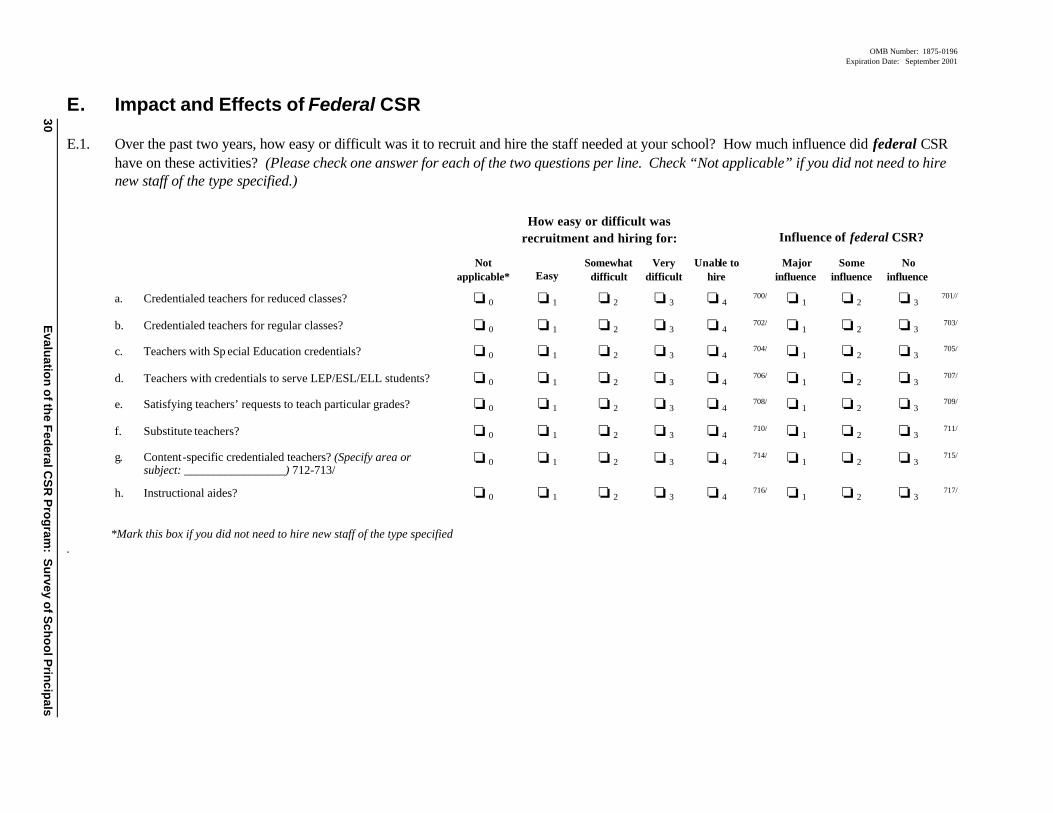
OMB Number: 1875-0196 Expiration Date: September 2001
30
Evalu
ation
of th
e Fed
eral CS
R P
rog
ram: S
urvey o
f Sch
oo
l Prin
cipals
E. Impact and Effects of Federal CSR
E.1. Over the past two years, how easy or difficult was it to recruit and hire the staff needed at your school? How much influence did federal CSR have on these activities? (Please check one answer for each of the two questions per line. Check “Not applicable” if you did not need to hire new staff of the type specified.)
How easy or difficult was recruitment and hiring for: Influence of federal CSR?
Not applicable* Easy
Somewhat difficult
Very difficult
Unable to hire
Major influence
Some influence
No influence
a. Credentialed teachers for reduced classes? o 0 o 1 o 2 o 3 o 4 700/ o 1 o 2 o 3
701//
b. Credentialed teachers for regular classes? o 0 o 1 o 2 o 3 o 4 702/ o 1 o 2 o 3
703/
c. Teachers with Sp ecial Education credentials? o 0 o 1 o 2 o 3 o 4 704/ o 1 o 2 o 3
705/
d. Teachers with credentials to serve LEP/ESL/ELL students? o 0 o 1 o 2 o 3 o 4 706/ o 1 o 2 o 3
707/
e. Satisfying teachers’ requests to teach particular grades? o 0 o 1 o 2 o 3 o 4 708/ o 1 o 2 o 3
709/
f. Substitute teachers? o 0 o 1 o 2 o 3 o 4 710/ o 1 o 2 o 3
711/
g. Content-specific credentialed teachers? (Specify area or subject: _________________) 712-713/
o 0 o 1 o 2 o 3 o 4 714/ o 1 o 2 o 3
715/
h. Instructional aides? o 0 o 1 o 2 o 3 o 4 716/ o 1 o 2 o 3
717/
*Mark this box if you did not need to hire new staff of the type specified .
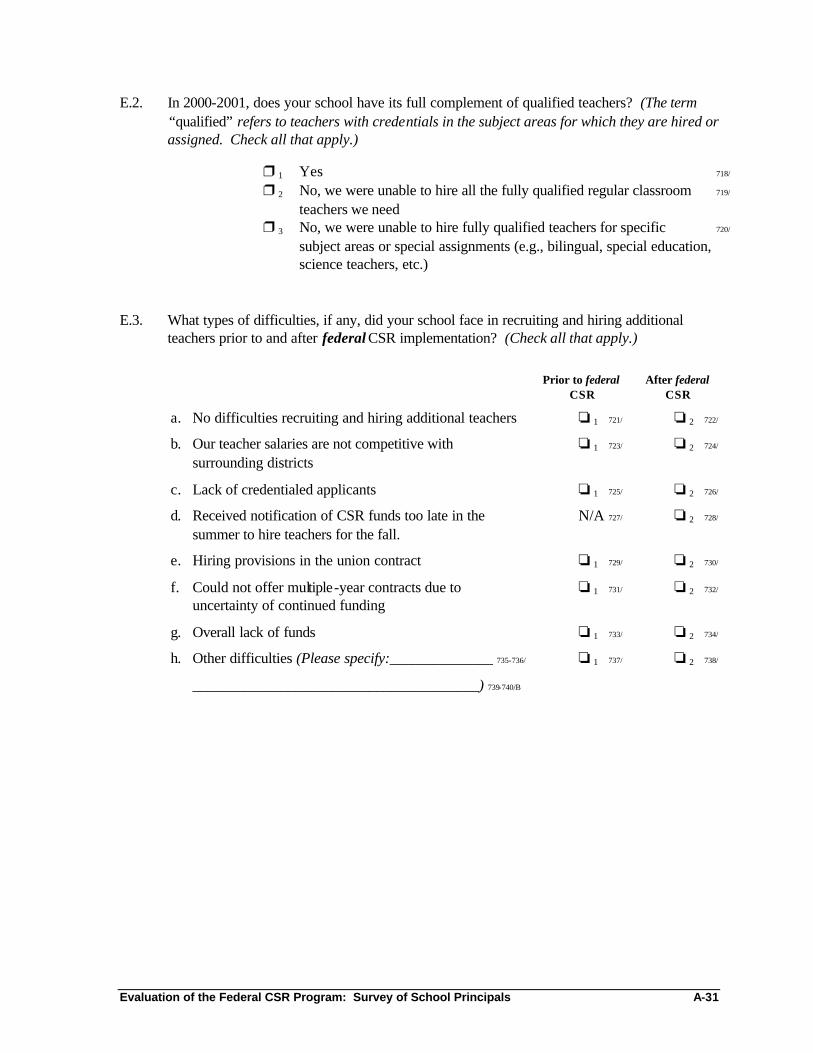
Evaluation of the Federal CSR Program: Survey of School Principals A-31
E.2. In 2000-2001, does your school have its full complement of qualified teachers? (The term “qualified” refers to teachers with credentials in the subject areas for which they are hired or assigned. Check all that apply.)
r 1 Yes 718/ r 2 No, we were unable to hire all the fully qualified regular classroom 719/ teachers we need r 3 No, we were unable to hire fully qualified teachers for specific 720/ subject areas or special assignments (e.g., bilingual, special education, science teachers, etc.) E.3. What types of difficulties, if any, did your school face in recruiting and hiring additional
teachers prior to and after federal CSR implementation? (Check all that apply.)
Prior to federal CSR
After federal CSR
a. No difficulties recruiting and hiring additional teachers o 1 721/ o 2 722/
b. Our teacher salaries are not competitive with surrounding districts
o 1 723/ o 2 724/
c. Lack of credentialed applicants o 1 725/ o 2 726/
d. Received notification of CSR funds too late in the summer to hire teachers for the fall.
N/A 727/ o 2 728/
e. Hiring provisions in the union contract o 1 729/ o 2 730/
f. Could not offer multiple-year contracts due to uncertainty of continued funding
o 1 731/ o 2 732/
g. Overall lack of funds o 1 733/ o 2 734/
h. Other difficulties (Please specify:______________ 735-736/
_______________________________________) 739-740/B
o 1 737/ o 2 738/
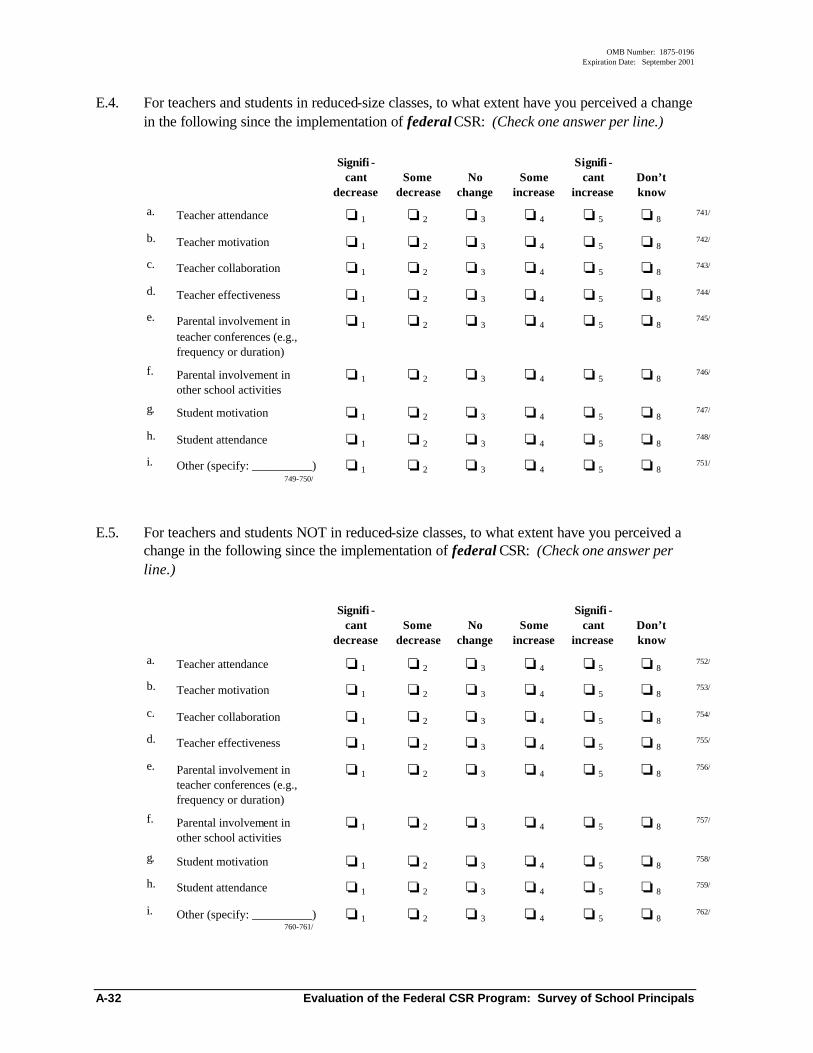
OMB Number: 1875-0196 Expiration Date: September 2001
A-32 Evaluation of the Federal CSR Program: Survey of School Principals
E.4. For teachers and students in reduced-size classes, to what extent have you perceived a change in the following since the implementation of federal CSR: (Check one answer per line.)
Signifi -
cant decrease
Some decrease
No change
Some increase
Signifi - cant
increase Don’t know
a. Teacher attendance o 1 o 2 o 3 o 4 o 5 o 8 741/
b. Teacher motivation o 1 o 2 o 3 o 4 o 5 o 8 742/
c. Teacher collaboration o 1 o 2 o 3 o 4 o 5 o 8 743/
d. Teacher effectiveness o 1 o 2 o 3 o 4 o 5 o 8 744/
e. Parental involvement in teacher conferences (e.g., frequency or duration)
o 1 o 2 o 3 o 4 o 5 o 8 745/
f. Parental involvement in other school activities
o 1 o 2 o 3 o 4 o 5 o 8 746/
g. Student motivation o 1 o 2 o 3 o 4 o 5 o 8 747/
h. Student attendance o 1 o 2 o 3 o 4 o 5 o 8 748/
i. Other (specify: __________) 749-750/
o 1 o 2 o 3 o 4 o 5 o 8 751/
E.5. For teachers and students NOT in reduced-size classes, to what extent have you perceived a
change in the following since the implementation of federal CSR: (Check one answer per line.)
Signifi -
cant decrease
Some decrease
No change
Some increase
Signifi - cant
increase Don’t know
a. Teacher attendance o 1 o 2 o 3 o 4 o 5 o 8 752/
b. Teacher motivation o 1 o 2 o 3 o 4 o 5 o 8 753/
c. Teacher collaboration o 1 o 2 o 3 o 4 o 5 o 8 754/
d. Teacher effectiveness o 1 o 2 o 3 o 4 o 5 o 8 755/
e. Parental involvement in teacher conferences (e.g., frequency or duration)
o 1 o 2 o 3 o 4 o 5 o 8 756/
f. Parental involvement in other school activities
o 1 o 2 o 3 o 4 o 5 o 8 757/
g. Student motivation o 1 o 2 o 3 o 4 o 5 o 8 758/
h. Student attendance o 1 o 2 o 3 o 4 o 5 o 8 759/
i. Other (specify: __________) 760-761/
o 1 o 2 o 3 o 4 o 5 o 8 762/
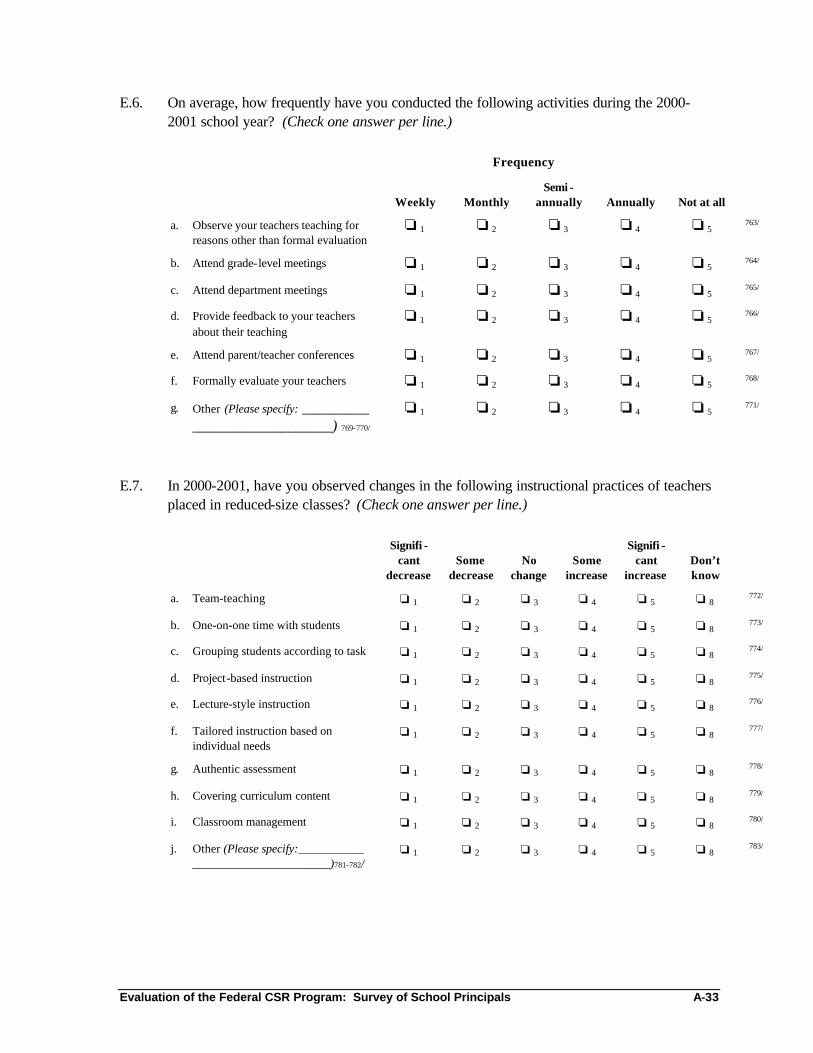
Evaluation of the Federal CSR Program: Survey of School Principals A-33
E.6. On average, how frequently have you conducted the following activities during the 2000-2001 school year? (Check one answer per line.)
Frequency
Weekly Monthly
Semi -annually Annually Not at all
a. Observe your teachers teaching for reasons other than formal evaluation
o 1 o 2 o 3 o 4 o 5 763/
b. Attend grade-level meetings o 1 o 2 o 3 o 4 o 5 764/
c. Attend department meetings o 1 o 2 o 3 o 4 o 5 765/
d. Provide feedback to your teachers about their teaching
o 1 o 2 o 3 o 4 o 5 766/
e. Attend parent/teacher conferences o 1 o 2 o 3 o 4 o 5 767/
f. Formally evaluate your teachers o 1 o 2 o 3 o 4 o 5 768/
g. Other (Please specify: _________ ___________________) 769-770/
o 1 o 2 o 3 o 4 o 5 771/
E.7. In 2000-2001, have you observed changes in the following instructional practices of teachers
placed in reduced-size classes? (Check one answer per line.)
Signifi -cant
decrease Some
decrease No
change Some
increase
Signifi - cant
increase Don’t know
a. Team-teaching o 1 o 2 o 3 o 4 o 5 o 8 772/
b. One-on-one time with students o 1 o 2 o 3 o 4 o 5 o 8 773/
c. Grouping students according to task o 1 o 2 o 3 o 4 o 5 o 8 774/
d. Project-based instruction o 1 o 2 o 3 o 4 o 5 o 8 775/
e. Lecture-style instruction o 1 o 2 o 3 o 4 o 5 o 8 776/
f. Tailored instruction based on individual needs
o 1 o 2 o 3 o 4 o 5 o 8 777/
g. Authentic assessment o 1 o 2 o 3 o 4 o 5 o 8 778/
h. Covering curriculum content o 1 o 2 o 3 o 4 o 5 o 8 779/
i. Classroom management o 1 o 2 o 3 o 4 o 5 o 8 780/
j. Other (Please specify:___________ _______________________)781-782/
o 1 o 2 o 3 o 4 o 5 o 8 783/
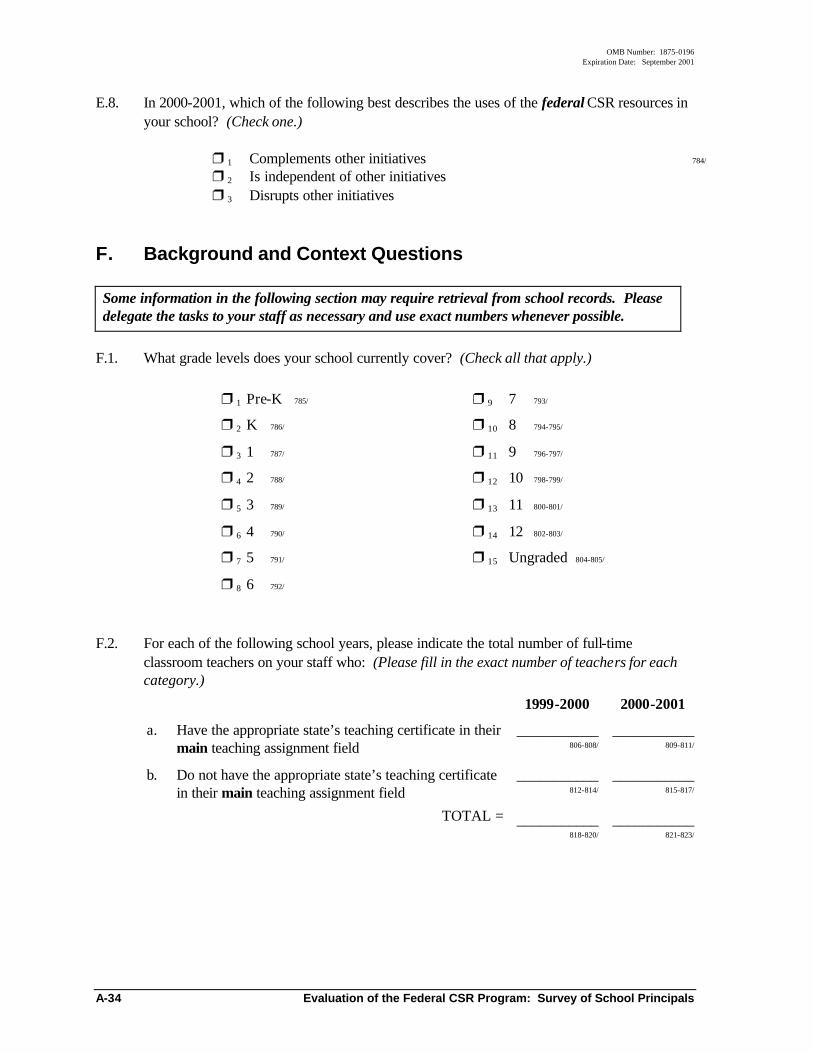
OMB Number: 1875-0196 Expiration Date: September 2001
A-34 Evaluation of the Federal CSR Program: Survey of School Principals
E.8. In 2000-2001, which of the following best describes the uses of the federal CSR resources in your school? (Check one.)
r 1 Complements other initiatives 784/ r 2 Is independent of other initiatives r 3 Disrupts other initiatives
F. Background and Context Questions
Some information in the following section may require retrieval from school records. Please delegate the tasks to your staff as necessary and use exact numbers whenever possible.
F.1. What grade levels does your school currently cover? (Check all that apply.)
r 1 Pre-K 785/
r 2 K 786/
r 3 1 787/
r 4 2 788/
r 5 3 789/
r 6 4 790/
r 7 5 791/
r 8 6 792/
r 9 7 793/
r 10 8 794-795/
r 11 9 796-797/
r 12 10 798-799/
r 13 11 800-801/
r 14 12 802-803/
r 15 Ungraded 804-805/
F.2. For each of the following school years, please indicate the total number of full-time
classroom teachers on your staff who: (Please fill in the exact number of teachers for each category.)
1999-2000 2000-2001
a. Have the appropriate state’s teaching certificate in their main teaching assignment field
___________ 806-808/
___________ 809-811/
b. Do not have the appropriate state’s teaching certificate in their main teaching assignment field
___________ 812-814/
___________ 815-817/
TOTAL = ___________ 818-820/
___________ 821-823/
Evaluation of the Federal CSR Program: Survey of School Principals A-35
F.3. Please indicate the number of teachers in your school who have the following as their highest degree. Also note whether the degree is in the subject area they currently teach. (Please report the total number in each category.)
1999-2000 2000-2001
In subject area
Not in subject area
In subject area
Not in subject area
a. Bachelor’s degree _________ 824-826/
_________ 827-829/
_________ 830-832/
_________ 833-835/
b. Master’s degree or higher _________ 836-838/
_________ 839-841/
_________ 842-844/
_________ 845-847/
TOTAL= _________ 848-850/
_________ 851-853/
_________ 854-856/
_________ 857-859/
F.4. How many teachers on your staff during each of the following school years have the
following types of teaching certificates? (Please report an exact number of teachers or write “NA” if no one in your school has that particular certificate.)
1999-2000 2000-2001
a. Advanced professional certificate ___________ 860-862/
___________ 863-865/
b. Regular or standard state certificate ___________ 866-868/
___________ 869-871/
c. The certificate offered in your state to persons who have completed what the state calls an “alternative certification program”
___________ 872-874/
___________ 875-877/
d. Provisional, probationary, or emergency certificate or waiver.
___________ 878-880/
___________ 881-883/
e. Other certification (Please specify: _______________) 884-885/
___________ 886-888/
___________ 889-891/
TOTAL = ___________ 892-894/
___________ 895-897/
OMB Number: 1875-0196 Expiration Date: September 2001
A-36 Evaluation of the Federal CSR Program: Survey of School Principals
F.5. Please report the number of your instructional staff who have the following levels of teaching experience for each of the following years: 1999-2000 2000-2001
a. Veterans (10+ years) ___________ 898-900/
___________ 901-903/
b. Considerably experienced (6-10 years) ___________ 904-906/
___________ 907-909/
c. Moderately experienced (3-5 years) ___________ 910-912/
___________ 913-915/
d. Novice (1-2 years) ___________ 916-918/
___________ 919-921/
TOTAL = ___________ 922-924/
___________ 925-927/
F.6. What was your school’s total student enrollment for each of the following years?
1999-2000 2000-2001 Total enrollment ___________
928-931/ ___________
932-935/ F.7. Please indicate the percentage of your school’s students in the following categories for each
school year:
1999-2000 2000-2001
a. African-American _________% 936-938/
_________% 939-941/
b. Latino/Hispanic _________% 942-944/
_________% 945-947/
c. Asian/Pacific Islander _________% 948-950/
_________% 951-953/
d. Native American _________% 954-956/
_________% 957-959/
e. White/Caucasian _________% 960-962/
_________% 963-965/
f. Other (Please specify: __________________________ _______________________________________) 966-967/
_________% 968-970/
_________% 971-973/
F.8. What proportion of students in your school were designated as limited-English-proficient
(LEP) for each of the following years? 1999-2000 _________ % 974-976/ 2000-2001 _________ % 977-979/
Evaluation of the Federal CSR Program: Survey of School Principals A-37
F.9. What proportion of students in your school were eligible for a free or reduced-price school lunch for each of the following years?
1999-2000 _________% 980-982/ 2000-2001 _________% 983-985/ F.10. Please indicate school’s attendance rate for each of the following years.
1999-2000 _________% 986-988/ 2000-2001 _________% 989-991/
F.11. If your school was implementing other educational reforms, which of the following types of
reforms were being implemented prior to federal CSR? (Check all that apply.) r 1 Whole school reforms (e.g., Roots and Wings, Accelerated Schools, Annenberg 992/
Schools, etc.) r 2 Standards-based reforms 993/ r 3 Curriculum reforms (e.g., primary literacy, Reading Recovery, Foss Science, comprehensive art education, etc.) 994/ r 4 Assessment reforms (e.g., portfolios, state mandates, etc.) 995/ r 5 Other reform efforts (Please specify: 997-998/ ) 996/ r 6 Other reform efforts (Please specify: 1000-1001/ ) 999/ r 7 None, our school is not participating in other reforms at this time. 1002/ Thank you very much for completing the survey. If you have comments you would like to write about your school’s experiences with the federal Class-Size Reduction Program, please write them below or on the back of this page. Then, please return your survey in the enclosed, stamped envelope to: Attn: Federal Class-Size Reduction Study, Abt Associates Inc., 55 Wheeler Street, Cambridge, MA 02138.