Embed Size (px)
Citation preview
A Diagnostic Measurement Analysis of the Subskill Mastery on the Michigan English Test
Ren Liu
MichiganAssessment.org
SPAAN Research Grant Working Paper2019-01
© 2019 Cambridge Michigan Language Assessment
MichiganAssessment.org2
DCM Analysis of MET | Ren Liu
Table of Contents ABSTRACT ....................................................................................................................................................... 5
INTRODUCTION ............................................................................................................................................... 6
RESEARCH FRAMEWORK – DIAGNOSTIC CLASSIFICATION MODELS ................................................................. 7
DATA ............................................................................................................................................................ 10
THE Q-MATRICES FOR LISTENING AND GRAMMAR/READING SECTIONS ....................................................... 11
MODELING FITTING AND SELECTION ............................................................................................................. 13
LISTENING SECTION ............................................................................................................................................... 13 GRAMMAR/READING SECTION ................................................................................................................................. 16
RQ1: EXAMINING THE RELATIONSHIP BETWEEN SUBSKILLS .......................................................................... 18
LISTENING SECTION ............................................................................................................................................... 18 GRAMMAR/READING SECTION ................................................................................................................................. 21
RQ2: EXAMINING THE RELATIONSHIP BETWEEN THE OVERALL SECTION SCORE AND SUBSKILL MASTERY ..... 24
LISTENING SECTION ............................................................................................................................................... 24 GRAMMAR/READING SECTION ................................................................................................................................. 27
RQ3: EXAMINING THE RELATIONSHIP BETWEEN SUBSKILL MASTERY PATTERN AND THE FIVE CEFR LEVELS .. 28
DISCUSSION .................................................................................................................................................. 32
REFERENCES .................................................................................................................................................. 34
APPENDIX A .................................................................................................................................................. 37
APPENDIX B .................................................................................................................................................. 39
MichiganAssessment.org 3
DCM Analysis of MET | Ren Liu
Index of Tables TABLE 1: THE Q-MATRIX USED IN THE LISTENING SECTION .............................................................................. 8
TABLE 2. ATTRIBUTES IN THE LISTENING SECTION ......................................................................................... 11
TABLE 3. ATTRIBUTES IN THE GRAMMAR/READING SECTION ........................................................................ 12
TABLE 4. THE Q-MATRIX USED IN THE GRAMMAR/READING SECTION .......................................................... 12
TABLE 5. MODEL FIT RESULTS FOR THE LISTENING SECTION .......................................................................... 13
TABLE 6. LIKELIHOOD RATIO TEST RESULTS FOR MODEL COMPARISON IN THE LISTENING SECTION .............. 14
TABLE 7. PARAMETER ESTIMATES UNDER THE A-CDM IN THE LISTENING SECTION ........................................ 15
TABLE 8. MODEL FIT RESULTS FOR THE GRAMMAR/READING SECTION ......................................................... 16
TABLE 9. LIKELIHOOD RATIO TEST RESULTS FOR MODEL COMPARISON IN THE GRAMMAR/READING SECTION
........................................................................................................................................................................... 16
TABLE 10. PARAMETER ESTIMATES UNDER THE A-CDM IN THE GRAMMAR/READING SECTION .................... 17
TABLE 11. NUMBER OF EXAMINEES IN EACH ATTRIBUTE PROFILE IN THE LISTENING SECTION ....................... 19
TABLE 12. 14 PERMISSIBLE AND 18 IMPERMISSIBLE ATTRIBUTE PROFILES UNDER THE HYPOTHESIZED
HIERARCHY IN THE LISTENING SECTION .............................................................................................................. 20
TABLE 13. MODEL COMPARISON FOR ATTRIBUTE HIERARCHY IN THE LISTENING SECTION ............................ 21
TABLE 14. NUMBER OF EXAMINEES IN EACH ATTRIBUTE PROFILE IN THE GRAMMAR/READING SECTION ..... 22
TABLE 15. 11 PERMISSIBLE AND 21 IMPERMISSIBLE ATTRIBUTE PROFILES UNDER THE HYPOTHESIZED
HIERARCHY IN THE GRAMMAR/READING SECTION ............................................................................................. 23
TABLE 16. MODEL COMPARISON FOR ATTRIBUTE HIERARCHY IN THE GRAMMAR/READING SECTION .......... 24
TABLE 17. UNSTANDARDIZED COEFFICIENT ESTIMATES FOR THE MULTIPLE REGRESSION IN THE LISTENING
SECTION ............................................................................................................................................................. 26
TABLE 18. UNSTANDARDIZED COEFFICIENT ESTIMATES FOR THE MULTIPLE REGRESSION IN THE
GRAMMAR/READING SECTION ........................................................................................................................... 28
TABLE 19. PROBABILITY OF SUBSKILL MASTERY FOR EACH CEFR LEVEL IN THE LISTENING SECTION ............... 31
TABLE 20. PROBABILITY OF SUBSKILL MASTERY FOR EACH CEFR LEVEL IN THE GRAMMAR/READING SECTION
........................................................................................................................................................................... 31
MichiganAssessment.org4
DCM Analysis of MET | Ren Liu
Index of Figures FIGURE 1. HYPOTHESIZED ATTRIBUTE HIERARCHY IN THE LISTENING SECTION .............................................. 20
FIGURE 2. HYPOTHESIZED ATTRIBUTE HIERARCHY IN THE GRAMMAR/READING SECTION ............................ 22
FIGURE 3. DISTRIBUTION OF ATTRIBUTE MASTERY PROBABILITIES AND THEIR RELATIONSHIP WITH OVERALL
SCORES IN THE LISTENING SECTION .................................................................................................................... 25
FIGURE 4. DISTRIBUTION OF ATTRIBUTE MASTERY PROBABILITIES AND THEIR RELATIONSHIP WITH OVERALL
SCORES IN THE GRAMMAR/READING SECTION .................................................................................................. 27
FIGURE 5. THE RELATIONSHIP BETWEEN MASTERY PATTERNS AND FIVE CEFR LEVELS IN THE LISTENING
SECTION ............................................................................................................................................................. 29
FIGURE 6. THE RELATIONSHIP BETWEEN MASTERY PATTERNS AND FIVE CEFR LEVELS IN THE
GRAMMAR/READING SECTION ........................................................................................................................... 30
MichiganAssessment.org 5
DCM Analysis of MET | Ren Liu
ABSTRACT
The purpose of this study is to conduct a diagnostic measurement analysis of the item response data
from the listening and grammar/reading sections on the Michigan English Test (MET). Through
subskill identification, model fitting and selection, an appropriate diagnostic classification model was
chosen for answering three research questions regarding, namely, the subskill mastery sequence, the
relationship between subskill mastery and overall scores, and the relationship between subskill mastery
and the Common European Framework of Reference (CEFR) levels.
For the subskill mastery sequence, results show that in the listening section, examinees were expected
to master vocabulary before they could master global/connecting/synthesizing skills, and they were
expected to master global/connecting/synthesizing skills and the skill of making inferences before they
could master the skill of comprehending explicit information. In the grammar/reading section,
examinees were expected to master vocabulary, syntax, and the skill of comprehending explicit
information before mastering the skill of either global/connecting/synthesizing or making inferences.
For the relationship between subskill mastery and overall scores, results show that examinees’ overall
scores in the listening section were more influenced by whether they mastered vocabulary, syntax, and
the skill of comprehending explicit information, and less influenced by the skills of
global/connecting/synthesizing and making inferences. Their overall scores in the grammar/reading
section were more influenced by whether they mastered the skills of comprehending explicit
information and making inferences and less influenced by vocabulary, syntax, or the skill of global/
connecting/ synthesizing.
For the relationship between subskill mastery and the CEFR levels, results show that examinees’
attribute mastery distributions almost perfectly matched the targeted level of the MET (i.e., between
A2 and C1), providing additional validity evidence for the interpretation and use of the MET scores.
All the results could also be used by content experts to understand more about the subskills, and by the
MET item/test development professionals for item revision and/or form assembly.
Keywords: diagnostic classification model, subskill mastery, attribute hierarchy, CEFR levels
MichiganAssessment.org6
DCM Analysis of MET | Ren Liu
INTRODUCTION
Investigating the relationship between examinees’ overall scores and their performance on subskills
are often of interest in educational and psychological tests (e.g., Liu, Qian, Luo, & Woo, 2017;
Sinharay, Puhan, Haberman, & Hambleton, 2018). Usually, examinees’ overall scores can be obtained
through modeling their item responses under the unidimensional item response theory (IRT)
framework. To obtain subskill performance, however, traditional psychometric approaches under
classical test theory and multidimensional IRT frameworks are likely to have issues including poor
reliability for practical test length and insufficient sample size (e.g., Sinharay, 2010). More recently,
diagnostic classification models (DCMs; e.g., Rupp, Templin, & Henson, 2010), a newer class of
psychometric models have shown promise to obtain reliable examinees’ subskill performance with
practical test length and sample size. DCMs are also able to provide classifications for examinees
regarding their mastery or non-mastery status on each subskill. This study aims to utilize DCMs and
explore the relationship between examinees’ overall scores and their subskill mastery on the listening
and grammar/reading sections of the Michigan English Test (MET).
According to the MET test plan, each examinee is given a scaled overall score for each section they
have taken. Based on the overall score, each examinee is classified into one corresponding language
proficiency level in the Common European Framework of Reference (CEFR; Council of Europe,
2001). During the scoring process, the ability that a section measures is regarded as a unidimensional
latent trait. For example, all items in the listening section are designed to measure examinees’ listening
ability. On the other hand, when the items were developed, they were developed to measure smaller
subskills underlying the overarching “listening ability” such as comprehending explicit information or
making inferences. DCMs can be fitted to the item responses and inform us the probability of
mastering each subskill for each examinee, which is not available under traditional psychometric
approaches. The purpose of this study is to fit DCMs to item responses and break down the general
research purpose into three smaller research questions (RQs):
RQ1: What is the statistical relationship between subskills? Specifically, the study explores
whether there is a particular mastery sequence for examinees where they are expected to master some
subskills before others.
MichiganAssessment.org 7
DCM Analysis of MET | Ren Liu
RQ2: What is the statistical relationship between the overall section score and subskill mastery?
Under this question, the study investigates whether mastering some subskills contributes more to the
overall score than others.
RQ3: What is the relationship between subskill mastery patterns and the five CEFR levels (i.e.,
below A2, A2, B1, B2, and C1). Under this question, the study examines 1) the relationship between
different mastery patterns and the five CEFR levels, and 2) the probability of mastering each subskill in
each CEFR level.
RESEARCH FRAMEWORK – DIAGNOSTIC CLASSIFICATION MODELS
DCMs have been alternatively called cognitive diagnosis models (e.g., Templin & Henson, 2006)
but they refer to the same class of multidimensional models expressing the relationship between item
responses and multiple categorical latent traits. In essence, DCMs are a class of probabilistic,
confirmatory, multidimensional latent class models. The latent classes in DCMs are defined a priori
through combinations of 0s and 1s representing mastery/non-mastery of multiple dichotomous
subskills. One benefit of treating subskills as dichotomous instead of continuous variables is that it
allows DCMs to produce higher reliability than multidimensional IRT models under the same test
length (Liu, Qian, Luo, & Woo, 2017; Templin & Bradshaw, 2013). After fitting a DCM to an item
response dataset, we can obtain a dichotomous mastery/non-mastery status and a probability of
mastering each subskill for each examinee. Utilizing this information, we may better understand the
test construct and support its validity.
Before implementing a DCM, we need to (1) specify subskills, and (2) specify which items measure
which subskills. For 𝑘𝑘 = 1,2, … , 𝐾𝐾 subskills (commonly called attributes in DCMs), there are 2!
possible attribute mastery patterns (aka attribute profiles), where each attribute profile can be
represented by a vector 𝜶𝜶" = (𝛼𝛼#, 𝛼𝛼$, … , 𝛼𝛼!). For example, if we assume that there are five subskills
under the overarching listening ability (i.e., K=5), those five attributes form (2% = 32) attribute
profiles. Each attribute takes on a value of 1 or 0 representing mastery and non-mastery on that
attribute, respectively. For example, an examinee will be assigned with 𝜶𝜶" = (1,0,0,1,1) if they have
mastered the first, fourth and fifth attributes, but not the second and the third. The information of
which items measure which attributes are contained in an item-by-attribute incidence matrix called a
MichiganAssessment.org8
DCM Analysis of MET | Ren Liu
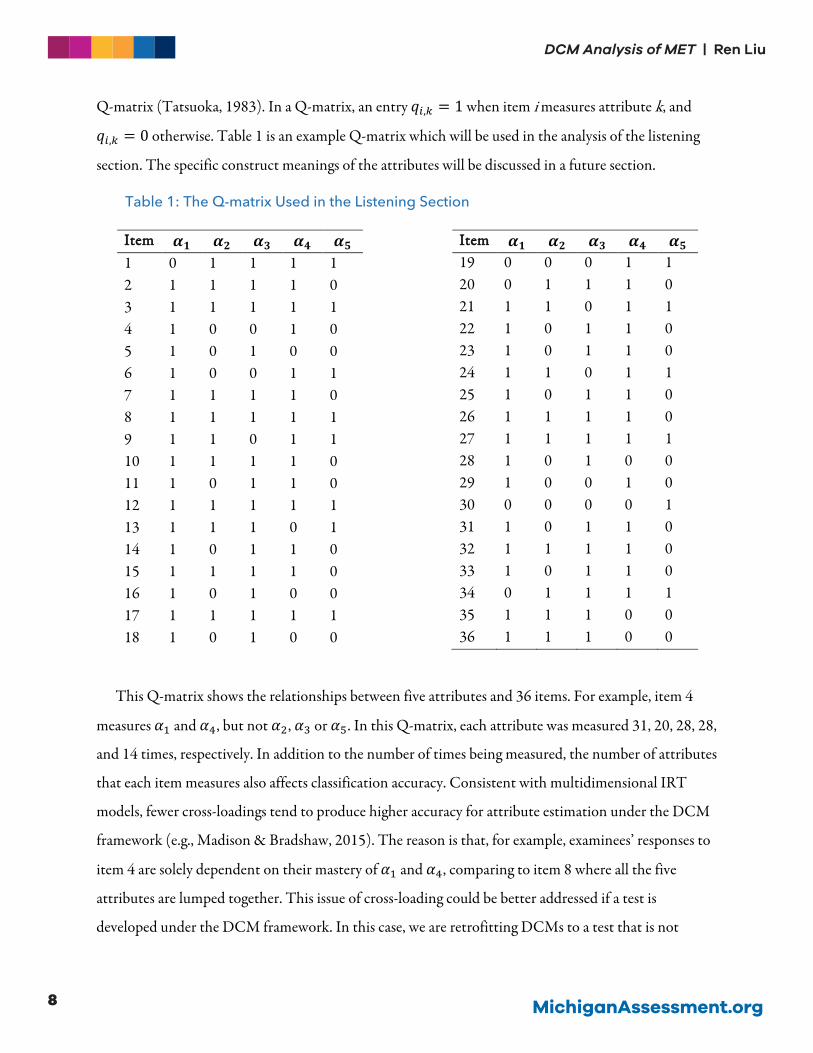
Q-matrix (Tatsuoka, 1983). In a Q-matrix, an entry 𝑞𝑞&,( = 1 when item i measures attribute k, and
𝑞𝑞&,( = 0 otherwise. Table 1 is an example Q-matrix which will be used in the analysis of the listening
section. The specific construct meanings of the attributes will be discussed in a future section.
Table 1: The Q-matrix Used in the Listening Section
IItteemm 𝜶𝜶𝟏𝟏 𝜶𝜶𝟐𝟐 𝜶𝜶𝟑𝟑 𝜶𝜶𝟒𝟒 𝜶𝜶𝟓𝟓 1 0 1 1 1 1 2 1 1 1 1 0 3 1 1 1 1 1 4 1 0 0 1 0 5 1 0 1 0 0 6 1 0 0 1 1 7 1 1 1 1 0 8 1 1 1 1 1 9 1 1 0 1 1 10 1 1 1 1 0 11 1 0 1 1 0 12 1 1 1 1 1 13 1 1 1 0 1 14 1 0 1 1 0 15 1 1 1 1 0 16 1 0 1 0 0 17 1 1 1 1 1 18 1 0 1 0 0
IItteemm 𝜶𝜶𝟏𝟏 𝜶𝜶𝟐𝟐 𝜶𝜶𝟑𝟑 𝜶𝜶𝟒𝟒 𝜶𝜶𝟓𝟓 19 0 0 0 1 1 20 0 1 1 1 0 21 1 1 0 1 1 22 1 0 1 1 0 23 1 0 1 1 0 24 1 1 0 1 1 25 1 0 1 1 0 26 1 1 1 1 0 27 1 1 1 1 1 28 1 0 1 0 0 29 1 0 0 1 0 30 0 0 0 0 1 31 1 0 1 1 0 32 1 1 1 1 0 33 1 0 1 1 0 34 0 1 1 1 1 35 1 1 1 0 0 36 1 1 1 0 0
This Q-matrix shows the relationships between five attributes and 36 items. For example, item 4
measures 𝛼𝛼# and 𝛼𝛼., but not 𝛼𝛼$, 𝛼𝛼/ or 𝛼𝛼%. In this Q-matrix, each attribute was measured 31, 20, 28, 28,
and 14 times, respectively. In addition to the number of times being measured, the number of attributes
that each item measures also affects classification accuracy. Consistent with multidimensional IRT
models, fewer cross-loadings tend to produce higher accuracy for attribute estimation under the DCM
framework (e.g., Madison & Bradshaw, 2015). The reason is that, for example, examinees’ responses to
item 4 are solely dependent on their mastery of 𝛼𝛼# and 𝛼𝛼., comparing to item 8 where all the five
attributes are lumped together. This issue of cross-loading could be better addressed if a test is
developed under the DCM framework. In this case, we are retrofitting DCMs to a test that is not
MichiganAssessment.org 9
DCM Analysis of MET | Ren Liu
developed under the DCM framework, which could produce suboptimal results as discussed in Liu,
Huggins-Manley, and Bulut (2018).
After the Q-matrix is specified, DCMs can be fit to the dataset. DCMs are confirmatory latent class
models with different parameterizations of the measurement component. The general form of a
confirmatory latent class model can be written as:
𝑃𝑃(𝒚𝒚0 = 𝒚𝒚0) = ∑ 𝑣𝑣"1"2# ∏ 𝜋𝜋"&
3!"(1 − 𝜋𝜋"&)#43!"5&2# , (1)
where e denotes examinees, and 𝜋𝜋"& represents the probability of correctly answering item i for
examinees in latent class c, which can be expressed as 𝑃𝑃(𝑦𝑦& = 1|𝜶𝜶"). Up to now, more than 30 DCMs
have been developed based on different theories and for a variety of purposes. The earliest development
of DCM can be traced back to the 1980s when Haertel introduced a restricted latent class model to
classify individuals with respect to their possession of a set of skills or attributes (Haertel, 1989). Later,
Haertel’s model was named the “deterministic inputs, noisy, and gate” (DINA) model in Junker and
Sijtsma (2001) and remained one of the most widely discussed models in the family of DCMs. The
item response function (IRF) of the DINA model can be written as
𝑃𝑃(𝑦𝑦& = 1|𝜶𝜶") = 𝜆𝜆&6 + 𝜆𝜆&#∏ 𝛼𝛼"(7"#!
(2# , (2)
where the probability of correctly answering item i for examinees that are in attribute profile 𝜶𝜶" is a
function of an intercept of item i: 𝜆𝜆&6, and 𝜆𝜆&#, representing the increase in the success probability when
all attributes that are measured by item i are mastered. The DINA model is considered a conjunctive
model where not mastering an attribute cannot be compensated for by mastering another attribute
regarding the probability of correctly answering an item. In contrast to the conjunctive model, Templin
and Henson (2006) proposed a disjunctive model called the deterministic input, noisy ‘or’ gate (DINO;
Templin & Henson, 2006) model. The IRF of the DINO model can be written as
𝑃𝑃(𝑦𝑦& = 1|𝜶𝜶") = 𝜆𝜆&6 + 𝜆𝜆&#[1 − ∏ (1 − 𝛼𝛼"()7"#!(2# ], (3)
where 𝜆𝜆&6 still represents the intercept but 𝜆𝜆&# represents the increase in the success probability
when any of the attributes that are measured by item i are mastered. Besides the DINA and the DINO,
the generalized DINA (G-DINA; de la Torre, 2011) model has become the flagship model over the
years because it is the most general form of DCMs, accommodating many earlier DCMs. The G-DINA
defines the probability of examinees in attribute profile c correctly answering item i as
MichiganAssessment.org10
DCM Analysis of MET | Ren Liu
𝑃𝑃(𝑦𝑦& = 1|𝜶𝜶") = 𝜆𝜆&6 + 𝝀𝝀&8𝐡𝐡(𝜶𝜶" , 𝐪𝐪&), (4)
where 𝜆𝜆&6 is the intercept associated with item i, and 𝝀𝝀&8𝐡𝐡(𝜶𝜶" , 𝐪𝐪&) index all the main effects and
higher-order interaction effects of the 𝑘𝑘 = 1,…𝐾𝐾 attributes associated with item i, which can be
expressed as ∑ 𝜆𝜆&#,((𝛼𝛼",(𝑞𝑞&,()!(2# + ∑ ∑ 𝜆𝜆&$,(,($?𝛼𝛼",(𝛼𝛼",($𝑞𝑞&,(𝑞𝑞&,($@ + ⋯
!($2(9#
!4#(2# . For example, for
item 3 measuring 𝛼𝛼$ and 𝛼𝛼% as shown in Table 1, the G-DINA expresses the probability of examinees
in attribute profile c correctly answering item i as
𝑃𝑃(𝑦𝑦& = 1|𝜶𝜶") = 𝜆𝜆&6 + 𝜆𝜆&#(;%)𝛼𝛼",$ + 𝜆𝜆&#(;&)𝛼𝛼",% + 𝜆𝜆&,$,(;%,;&)𝛼𝛼",$𝛼𝛼",%, (5)
where 𝜆𝜆&6 is the intercept, 𝜆𝜆&#(;%) is the main effect for 𝛼𝛼$, 𝜆𝜆&#(;&) is the main effect for 𝛼𝛼%, and
𝜆𝜆&,$,(;%,;&) is the interaction effect for 𝛼𝛼$ and 𝛼𝛼%. As one can imagine, when an item measures more
attributes, there are more two-way interactions, three-way interactions or higher-order interactions,
resulting in a large number of parameters for that item. To reduce the estimation burdens induced by
the higher-order interactions, the additive CDM (A-CDM; de la Torre, 2011) was proposed as a special
case of the G-DINA. In the A-CDM, all the interaction parameters are fixed to zero and only the
intercept and main effects are freely estimated. The IRF of the A-CDM can be expressed as
𝑃𝑃(𝑦𝑦& = 1|𝜶𝜶") = 𝜆𝜆&6 + ∑ 𝜆𝜆&#,((𝛼𝛼",(𝑞𝑞&,()!(2# , (6)
In practice, one could fit a general DCM (e.g., the G-DINA model) to the data if no prior
hypothesis is made and sample sizes allow. This modeling approach would allow for free estimations of
all parameters associated with any possible relationships between attributes and item responses. If there
are prior hypotheses about the effects of attribute relationship on items, one could fit both the selected
model that reflects those hypotheses and a general DCM to the data. A comparison of fit indices
between the selected and general models would help determine if those hypotheses are supported in
item responses.
DATA
To answer the three research questions, 816 examinees’ responses to 66 operational items on the
MET Form A were used. Among the 66 items, 36 items are in the listening section and 30 items are in
the grammar/reading section. Within each section, the item subskill tags were obtained to construct the
Q-matrix.
MichiganAssessment.org 11
DCM Analysis of MET | Ren Liu
THE Q-MATRICES FOR LISTENING AND GRAMMAR/READING SECTIONS
In the listening section, 28 subskills were listed initially. For example, there were “main idea”,
“synthesis”, and many more. Theoretically, we could construct a 36 (items) by 28 (subskills) Q-matrix
to represent the item-attribute relationship. However, we would not be able to proceed with further
statistical analysis with such Q-matrix for at least three reasons. First, the number of attributes is too
large for the given number of items. It would not be possible to use 816 examinees’ responses on 36
items to estimate 2$= = 268,435,456 attribute profiles. For 36 items, it’s more common to have no
more than six attributes. Second, some attributes are not distinguishable from each other. For example,
the subskill “synthesis” is measured by most items, which means that it will cover items most other
subskills measure. All the items that measure “main idea”, except for item “TLD15_0136”, all also
measure “synthesis”. This means that the two attributes are not distinguishable. Third, some attributes
are not measured enough number of times. A rule of thumb is that each attribute needs to be measured
at least four or five times to achieve satisfactory classification accuracy. However, there was only one
item measuring “Purpose”, two items measuring “Prosody” and “Identify Speaker's Attitude”, and etc.
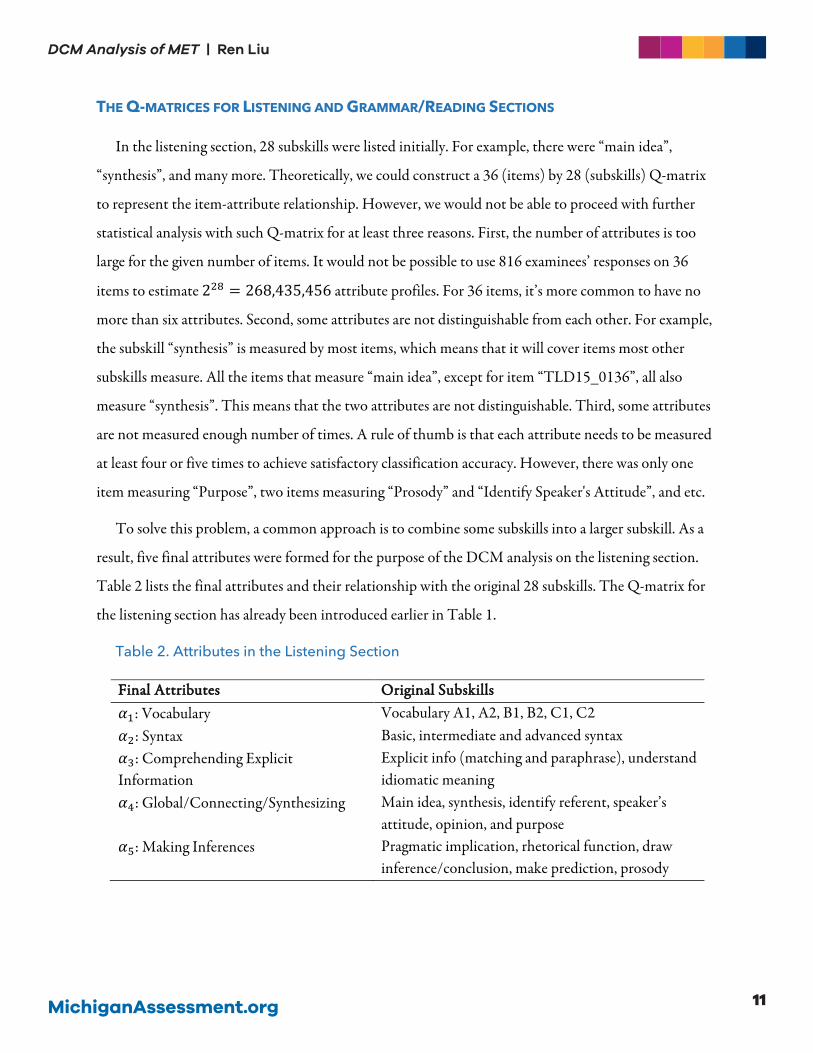
To solve this problem, a common approach is to combine some subskills into a larger subskill. As a
result, five final attributes were formed for the purpose of the DCM analysis on the listening section.
Table 2 lists the final attributes and their relationship with the original 28 subskills. The Q-matrix for
the listening section has already been introduced earlier in Table 1.
Table 2. Attributes in the Listening Section
FFiinnaall AAttttrriibbuutteess OOrriiggiinnaall SSuubbsskkiillllss 𝛼𝛼#: Vocabulary Vocabulary A1, A2, B1, B2, C1, C2 𝛼𝛼$: Syntax Basic, intermediate and advanced syntax 𝛼𝛼/: Comprehending Explicit Information
Explicit info (matching and paraphrase), understand idiomatic meaning
𝛼𝛼.: Global/Connecting/Synthesizing Main idea, synthesis, identify referent, speaker’s attitude, opinion, and purpose
𝛼𝛼%: Making Inferences Pragmatic implication, rhetorical function, draw inference/conclusion, make prediction, prosody
MichiganAssessment.org12
DCM Analysis of MET | Ren Liu
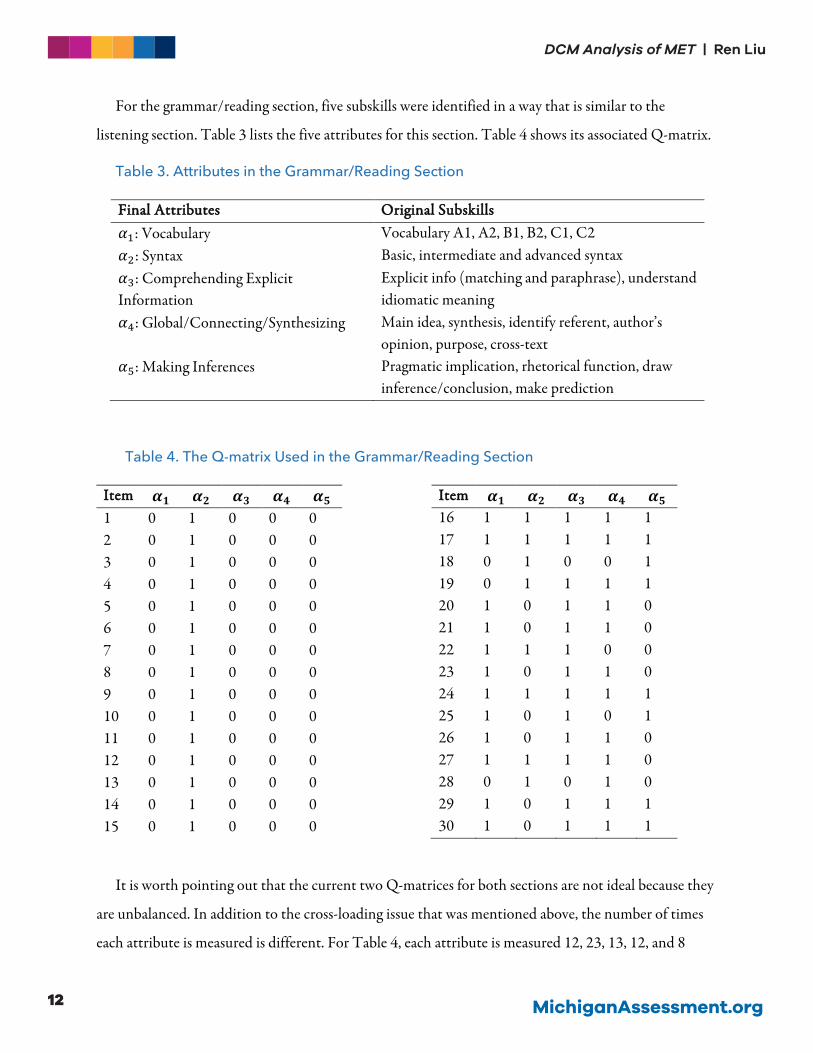
For the grammar/reading section, five subskills were identified in a way that is similar to the
listening section. Table 3 lists the five attributes for this section. Table 4 shows its associated Q-matrix.
Table 3. Attributes in the Grammar/Reading Section
FFiinnaall AAttttrriibbuutteess OOrriiggiinnaall SSuubbsskkiillllss 𝛼𝛼#: Vocabulary Vocabulary A1, A2, B1, B2, C1, C2 𝛼𝛼$: Syntax Basic, intermediate and advanced syntax 𝛼𝛼/: Comprehending Explicit Information
Explicit info (matching and paraphrase), understand idiomatic meaning
𝛼𝛼.: Global/Connecting/Synthesizing Main idea, synthesis, identify referent, author’s opinion, purpose, cross-text
𝛼𝛼%: Making Inferences Pragmatic implication, rhetorical function, draw inference/conclusion, make prediction
Table 4. The Q-matrix Used in the Grammar/Reading Section
IItteemm 𝜶𝜶𝟏𝟏 𝜶𝜶𝟐𝟐 𝜶𝜶𝟑𝟑 𝜶𝜶𝟒𝟒 𝜶𝜶𝟓𝟓 1 0 1 0 0 0 2 0 1 0 0 0 3 0 1 0 0 0 4 0 1 0 0 0 5 0 1 0 0 0 6 0 1 0 0 0 7 0 1 0 0 0 8 0 1 0 0 0 9 0 1 0 0 0 10 0 1 0 0 0 11 0 1 0 0 0 12 0 1 0 0 0 13 0 1 0 0 0 14 0 1 0 0 0 15 0 1 0 0 0
IItteemm 𝜶𝜶𝟏𝟏 𝜶𝜶𝟐𝟐 𝜶𝜶𝟑𝟑 𝜶𝜶𝟒𝟒 𝜶𝜶𝟓𝟓 16 1 1 1 1 1 17 1 1 1 1 1 18 0 1 0 0 1 19 0 1 1 1 1 20 1 0 1 1 0 21 1 0 1 1 0 22 1 1 1 0 0 23 1 0 1 1 0 24 1 1 1 1 1 25 1 0 1 0 1 26 1 0 1 1 0 27 1 1 1 1 0 28 0 1 0 1 0 29 1 0 1 1 1 30 1 0 1 1 1
It is worth pointing out that the current two Q-matrices for both sections are not ideal because they
are unbalanced. In addition to the cross-loading issue that was mentioned above, the number of times
each attribute is measured is different. For Table 4, each attribute is measured 12, 23, 13, 12, and 8
MichiganAssessment.org 13
DCM Analysis of MET | Ren Liu
times, respectively. In an ideal world, a more balanced Q-matrix could be identified by content experts
when the item was developed under a DCM framework. In this paper, we will continue the analysis
with the current Q-matrices and discuss more about the Q-matrix refinement in the future research
section.
MODELING FITTING AND SELECTION
For each section, four aforementioned models were fitted to the dataset: the DINA model, the
DINO model, the A-CDM, and the G-DINA, each representing a theory about the effect of the
attributes on items. A monotonicity constraint was added for each model to avoid that mastering more
attribute decreases the probability of correctly answering an item. Under the G-DINA framework, this
was achieved through constraining all the main effects and interaction effects to be non-negative. The
other three models were similarly constrained because they are special cases of the G-DINA.
When fitting the model, R (R Core Team, 2018) and the “GDINA” R package (Ma & de la Torre,
2019) were used. First, the marginal maximum likelihood method with the Expectation-Maximization
algorithm was used to estimate the item parameters. Then, the estimated item parameters were used
with the Maximum a Posteriori (MAP) method to obtain examinee parameters (i.e., examinees’
attribute profiles).
After the parameter estimates were obtained, the performance of the four models were compared
according to both absolute and relative fit indices. The following absolute fit indices were computed:
the M2 statistic (Hansen, Cai, Monroe, & Li, 2016), the standardized root mean square root of squared
residuals (SRMSR; Maydeu-Olivares & Joe, 2014), and the root mean square error of approximation
(RMSEA; von Davier, 2005). The following relative fit indices were computed: the Akaike Information
Criterion (AIC; Akaike, 1987), Bayesian Information Criterion (BIC; Schwarz, 1978), and the
Consistent AIC (CAIC; Bozdogan, 1987). Smaller values on those indices indicate better fit.
Listening Section
Table 5. Model Fit Results for the Listening Section
MMooddeell MM22 SSRRMMSSRR RRMMSSEEAA AAIICC BBIICC CCAAIICC DINA 843.43, df=563, p<.01 .06 .02 31228.49 31713.05 31816.05 DINO 831.06, df=563, p<.01 .06 .02 31259.53 31744.09 31847.09

MichiganAssessment.org14
DCM Analysis of MET | Ren Liu
A-CDM 574.17, df=478, p<.01 .04 .02 30546.10 31430.53 31618.53 G-DINA 200.90, df=165, p<.01 .03 .02 30823.29 33180.20 33681.20
Table 5 lists the results for aforementioned model fit indices when each model was fitted to the item
responses in the listening section. The absolute fit indices showed good fit for all four models where the
SRMSR were all smaller than .06, and RMSEA smaller than .05. Based on relative fit indices, the A-
CDM showed the best fit among all four models.
Recall that the G-DINA is the most saturated model where all other three models are special cases of
the G-DINA. Likelihood ratio tests were conducted to investigate whether each of the simpler models
fit significantly differently from the saturated model. Results of those tests are shown in Table 6. Table
6 also lists the number of total parameters (i.e., both structural parameters and item parameters) and
the number of item parameters. Results show that the G-DINA fit significantly better than the DINA
and the DINO model, but not significantly better than the A-CDM. Recall that the G-DINA differs
from the A-CDM because the former includes both the main effects and interaction effects, but the
latter only includes the main effects and fixes interaction effects to be zero. The classification agreement
between the A-CDM and the G-DINA showed that only 15 of 816 examinees (1.8%) were classified
with different attribute profiles. Given that the A-CDM was 50% smaller than the G-DINA and did
not show significant difference from the G-DINA, the A-CDM was selected for further analysis. Table
7 lists the parameter estimates for the items in the listening section under the A-CDM.
Table 6. Likelihood Ratio Test Results for Model Comparison in the Listening Section
MMooddeell ##11 ##22 𝑮𝑮𝟐𝟐 ddff pp--vvaalluuee DINA 103 72 1201.21 398 <.01 DINO 103 72 1232.25 398 <.01 A-CDM 188 157 348.82 313 .08 G-DINA 501 470
Note: “#1” indicates the total number of estimated parameters, “#2” indicates the number of estimated
item parameters.

MichiganAssessment.org 15
DCM Analysis of MET | Ren Liu
Table 7. Parameter Estimates Under the A-CDM in the Listening Section
IItteemm 𝝀𝝀𝒊𝒊𝒊𝒊 𝝀𝝀𝒊𝒊𝒊𝒊,𝒊𝒊 𝝀𝝀𝒊𝒊𝒊𝒊,𝟐𝟐 𝝀𝝀𝒊𝒊𝒊𝒊,𝟑𝟑 𝝀𝝀𝒊𝒊𝒊𝒊,𝟒𝟒 𝝀𝝀𝒊𝒊𝒊𝒊,𝟓𝟓 1 .674 .046 .008 .247 2 .550 .241 .047 .030 .121 3 .359 .264 .119 .203 .033 4 .322 .436 .241 5 .233 .572 .155 6 .410 .345 .166 .059 7 .229 .124 .214 .137 .224 8 .123 .331 .217 .238 .082 9 .158 .075 .139 .475 10 .200 .220 .196 .132 .143 11 .315 .054 .263 .056 12 .115 .070 .137 .140 .512 13 .062 .301 .183 .356 14 .120 .126 .485 .140 15 .299 .446 .237 .014 16 .469 .406 .100 17 .338 .344 .169 .104 18 .284 .340 .301 19 .275 .344 .147 20 .258 .085 .241 .333 21 .377 .298 .223 .006 .069 22 .296 .302 .314 .063 23 .302 .295 .299 24 .253 .081 .060 .231 25 .330 .003 .112 .159 26 .425 .235 .094 .066 .140 27 .651 .117 .035 .152 .022 28 .354 .334 .262 29 .438 .110 .291 30 .407 .411 31 .243 .104 .453 32 .207 .048 .058 .477 .070 33 .322 .213 .154 .217 34 .020 .239 .367 .189 35 .201 .059 .244 .240 36 .176 .276 .311 .168
MichiganAssessment.org16
DCM Analysis of MET | Ren Liu
Grammar/Reading Section
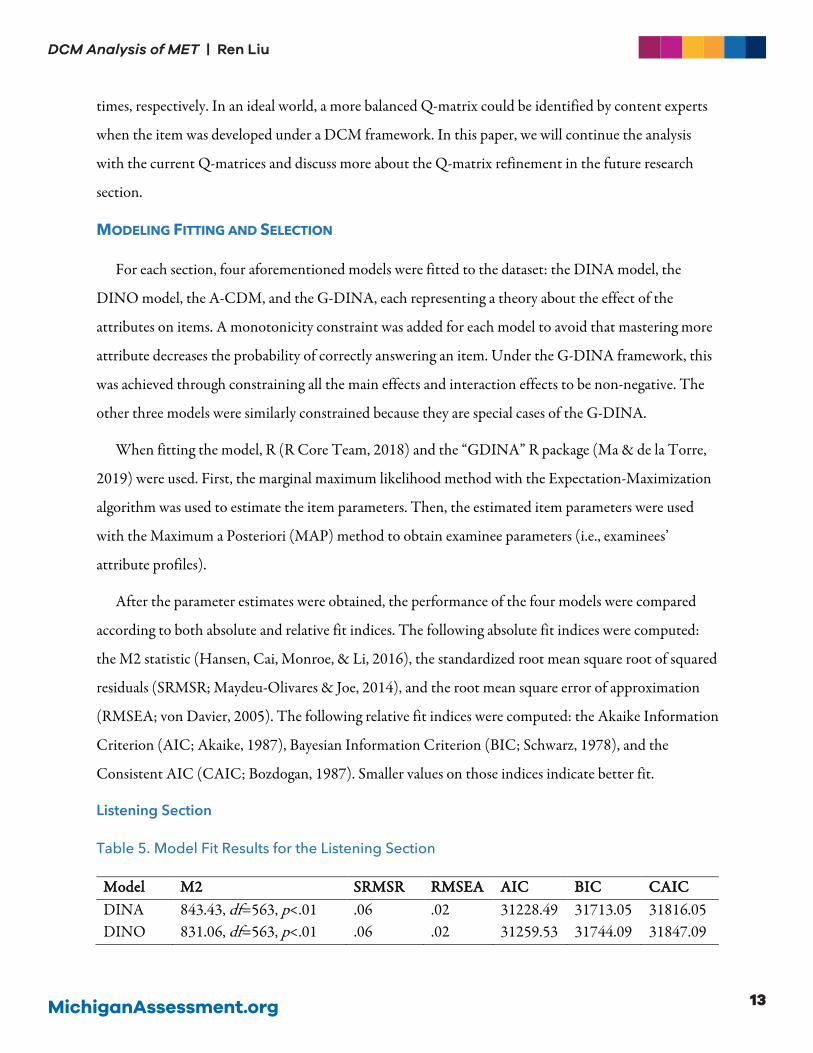
Similar to the listening section, four DCMs were fit to the dataset. Table 8 lists the model fit results.
Based on absolute fit indices, all four models fit well to the dataset. Based on relative fit indices, the A-
CDM fit the best. Table 9 displays the likelihood ratio test results, which show that the A-CDM did
not fit significantly differently from the G-DINA with only 50% of the number of parameters.
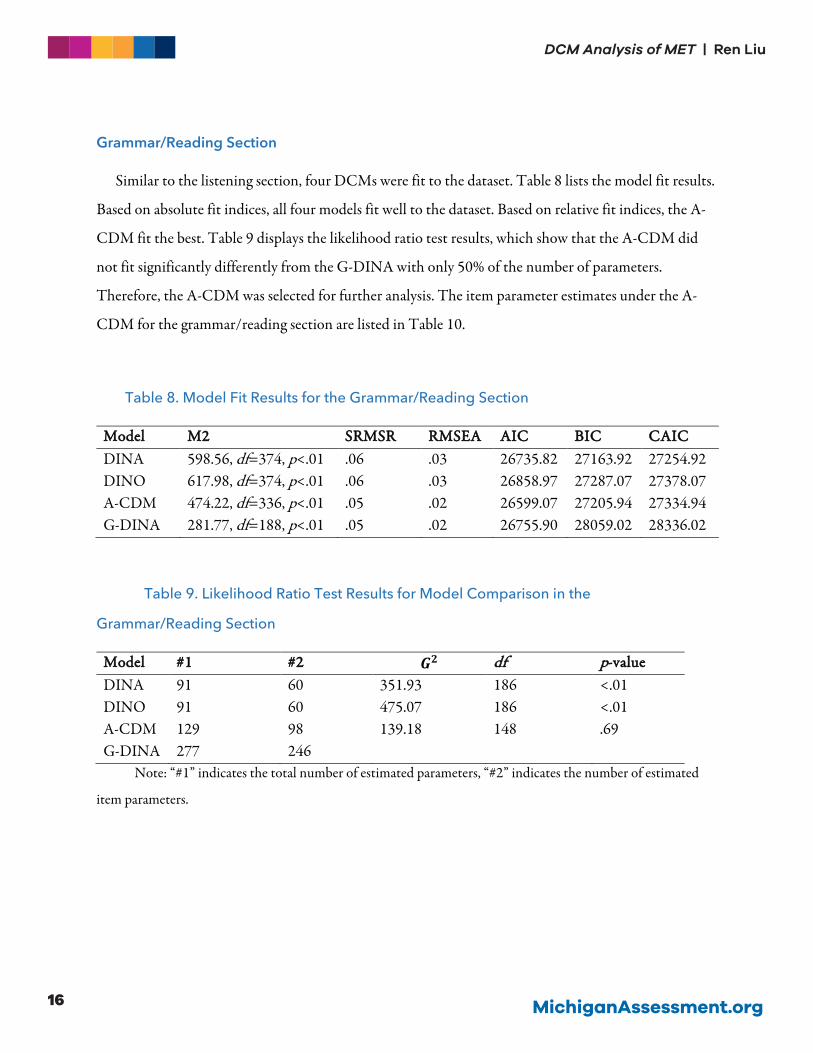
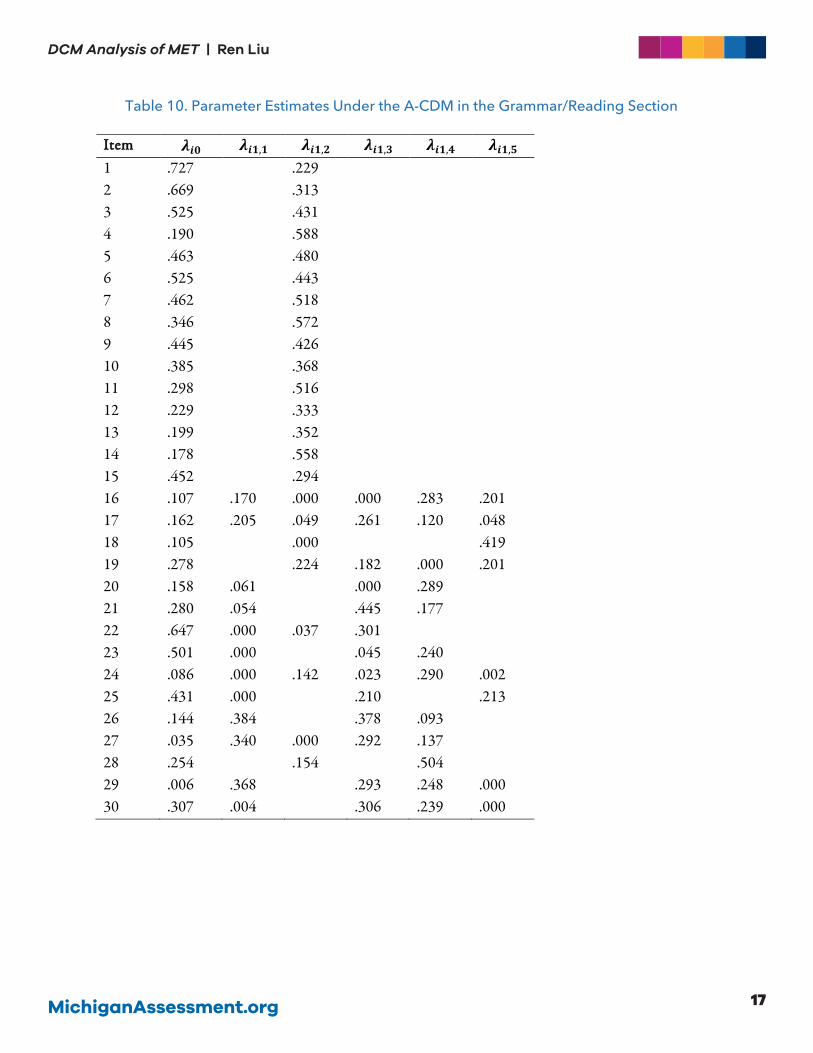
Therefore, the A-CDM was selected for further analysis. The item parameter estimates under the A-
CDM for the grammar/reading section are listed in Table 10.
Table 8. Model Fit Results for the Grammar/Reading Section
MMooddeell MM22 SSRRMMSSRR RRMMSSEEAA AAIICC BBIICC CCAAIICC DINA 598.56, df=374, p<.01 .06 .03 26735.82 27163.92 27254.92 DINO 617.98, df=374, p<.01 .06 .03 26858.97 27287.07 27378.07 A-CDM 474.22, df=336, p<.01 .05 .02 26599.07 27205.94 27334.94 G-DINA 281.77, df=188, p<.01 .05 .02 26755.90 28059.02 28336.02
Table 9. Likelihood Ratio Test Results for Model Comparison in the
Grammar/Reading Section
MMooddeell ##11 ##22 𝑮𝑮𝟐𝟐 ddff pp--vvaalluuee DINA 91 60 351.93 186 <.01 DINO 91 60 475.07 186 <.01 A-CDM 129 98 139.18 148 .69 G-DINA 277 246
Note: “#1” indicates the total number of estimated parameters, “#2” indicates the number of estimated
item parameters.
MichiganAssessment.org 17
DCM Analysis of MET | Ren Liu
Table 10. Parameter Estimates Under the A-CDM in the Grammar/Reading Section
IItteemm 𝝀𝝀𝒊𝒊𝒊𝒊 𝝀𝝀𝒊𝒊𝒊𝒊,𝒊𝒊 𝝀𝝀𝒊𝒊𝒊𝒊,𝟐𝟐 𝝀𝝀𝒊𝒊𝒊𝒊,𝟑𝟑 𝝀𝝀𝒊𝒊𝒊𝒊,𝟒𝟒 𝝀𝝀𝒊𝒊𝒊𝒊,𝟓𝟓 1 .727 .229 2 .669 .313 3 .525 .431 4 .190 .588 5 .463 .480 6 .525 .443 7 .462 .518 8 .346 .572 9 .445 .426 10 .385 .368 11 .298 .516 12 .229 .333 13 .199 .352 14 .178 .558 15 .452 .294 16 .107 .170 .000 .000 .283 .201 17 .162 .205 .049 .261 .120 .048 18 .105 .000 .419 19 .278 .224 .182 .000 .201 20 .158 .061 .000 .289 21 .280 .054 .445 .177 22 .647 .000 .037 .301 23 .501 .000 .045 .240 24 .086 .000 .142 .023 .290 .002 25 .431 .000 .210 .213 26 .144 .384 .378 .093 27 .035 .340 .000 .292 .137 28 .254 .154 .504 29 .006 .368 .293 .248 .000 30 .307 .004 .306 .239 .000
MichiganAssessment.org18
DCM Analysis of MET | Ren Liu
RQ1: EXAMINING THE RELATIONSHIP BETWEEN SUBSKILLS
The iterative cycle between item/test development and scoring makes it possible for us to obtain
meaning information from examinees’ item responses and use that back to support item/test
development. The purpose of this section is to use the parameter estimates from the previous model
fitting and explore whether they could show some mastery sequence of attributes. This does not suggest
that the sequence uncovered in the dataset may be universally true outside of this dataset. The purpose
of this section is simply to provide the information that was found in the dataset for further research in
the specific test constructs.
Based on Leighton et al. (2004) and Templin and Bradshaw (2014), four steps are involved in order
to examine whether there is a particular sequence of subskill mastery. First, we use the parameter
estimates to compute the number of examinees in each attribute profile. Next, we can hypothesize that
the profiles with few examinees may be less possible mastery patterns. Then, we can develop the
attribute structure/hierarchy that reflects the possible and impossible attribute patterns. Finally, we
conduct likelihood ratio test between the model without the attribute structure and the model with the
attribute structure. If the two models do not fit significantly differently, we can use it as evidence to
support the hypothesized attribute structure.
Before moving on, let us use a simple example to illustrate the four-step analysis. Suppose we have
1,000 examinees’ responses to items measuring two attributes: 𝛼𝛼# and 𝛼𝛼$, there will be four possible
attribute profiles: (0,0), (1,0), (0,1), and (1,1). After examinees’ responses are scored, we find that there
are 300, 300, 10, and 390 examinees in (0,0), (1,0), (0,1), and (1,1), respectively. In this example, there
are few examinees that are assigned with (0,1) comparing to other profiles. This means that it is very
unlikely for examinees to master 𝛼𝛼$ without 𝛼𝛼#. Therefore, we could hypothesize that there may be a
mastering sequence of mastering 𝛼𝛼# first before mastering 𝛼𝛼$. In the example, we could fit a model
constraining the probability of (0,1) to be zero and compare the model fit with a model without such
constraint. If the unconstrained model does not fit significantly better than the constrained model, we
may have evidence to support the mastering sequence. Such information could feed back to help us
learn more about the theory of the constructs and/or item/test development.
Listening Section
MichiganAssessment.org 19
DCM Analysis of MET | Ren Liu
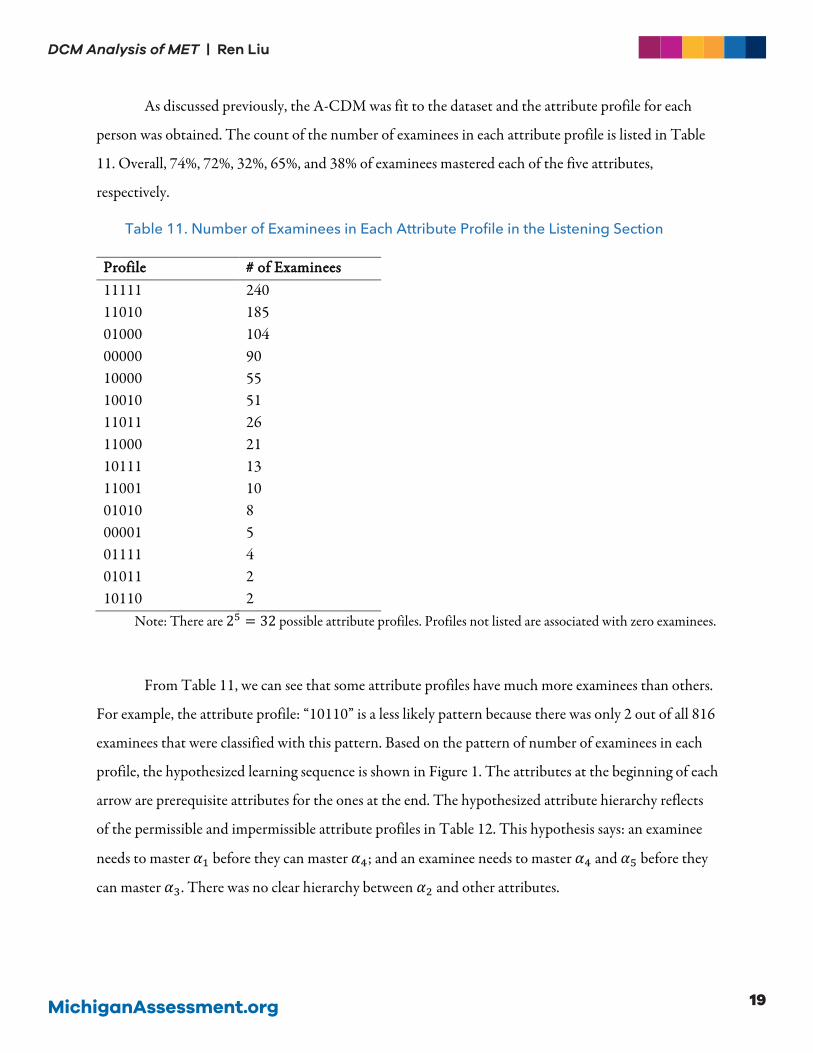
As discussed previously, the A-CDM was fit to the dataset and the attribute profile for each
person was obtained. The count of the number of examinees in each attribute profile is listed in Table
11. Overall, 74%, 72%, 32%, 65%, and 38% of examinees mastered each of the five attributes,
respectively.
Table 11. Number of Examinees in Each Attribute Profile in the Listening Section
PPrrooffiillee ## ooff EExxaammiinneeeess 11111 240 11010 185 01000 104 00000 90 10000 55 10010 51 11011 26 11000 21 10111 13 11001 10 01010 8 00001 5 01111 4 01011 2 10110 2
Note: There are 2! = 32 possible attribute profiles. Profiles not listed are associated with zero examinees.
From Table 11, we can see that some attribute profiles have much more examinees than others.
For example, the attribute profile: “10110” is a less likely pattern because there was only 2 out of all 816
examinees that were classified with this pattern. Based on the pattern of number of examinees in each
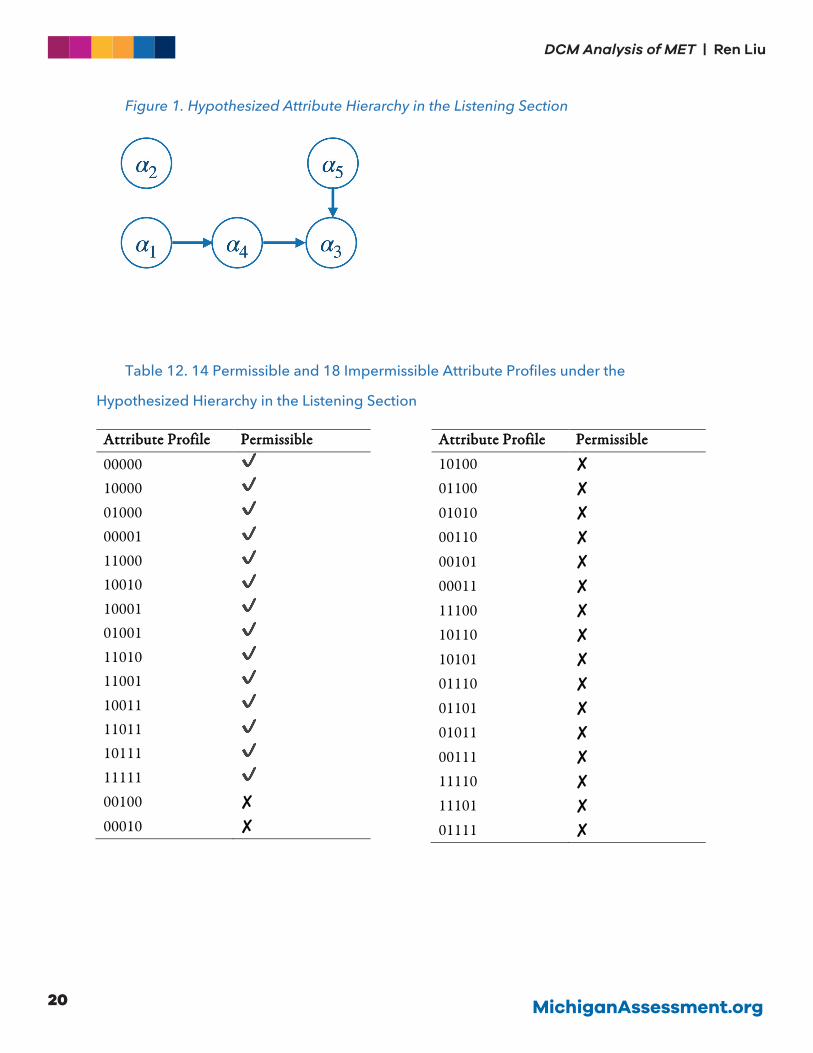
profile, the hypothesized learning sequence is shown in Figure 1. The attributes at the beginning of each
arrow are prerequisite attributes for the ones at the end. The hypothesized attribute hierarchy reflects
of the permissible and impermissible attribute profiles in Table 12. This hypothesis says: an examinee
needs to master 𝛼𝛼# before they can master 𝛼𝛼.; and an examinee needs to master 𝛼𝛼. and 𝛼𝛼% before they
can master 𝛼𝛼/. There was no clear hierarchy between 𝛼𝛼$ and other attributes.
MichiganAssessment.org20
DCM Analysis of MET | Ren Liu
Figure 1. Hypothesized Attribute Hierarchy in the Listening Section
Table 12. 14 Permissible and 18 Impermissible Attribute Profiles under the
Hypothesized Hierarchy in the Listening Section
AAttttrriibbuuttee PPrrooffiillee PPeerrmmiissssiibbllee
000001000001000000011100010010100010100111010110011001111011101111111100100 ✘00010 ✘
AAttttrriibbuuttee PPrrooffiillee PPeerrmmiissssiibbllee
10100 ✘01100 ✘01010 ✘00110 ✘00101 ✘00011 ✘11100 ✘10110 ✘10101 ✘01110 ✘01101 ✘01011 ✘00111 ✘11110 ✘11101 ✘01111 ✘
MichiganAssessment.org 21
DCM Analysis of MET | Ren Liu
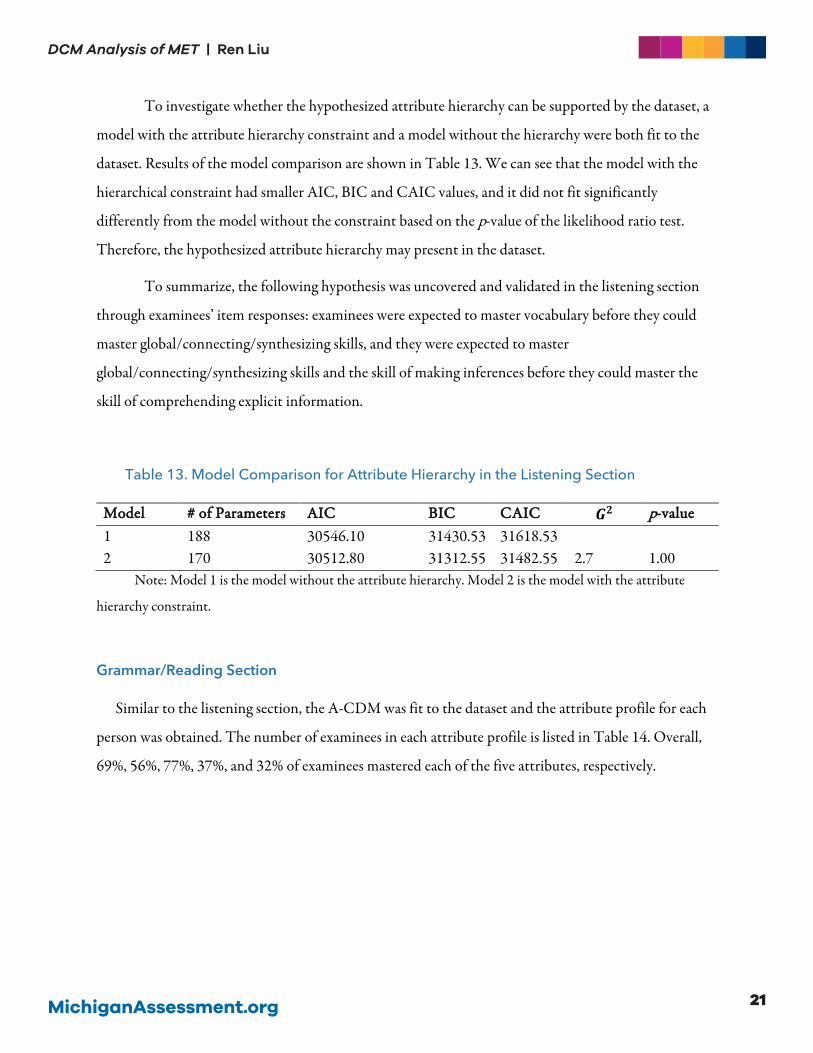
To investigate whether the hypothesized attribute hierarchy can be supported by the dataset, a
model with the attribute hierarchy constraint and a model without the hierarchy were both fit to the
dataset. Results of the model comparison are shown in Table 13. We can see that the model with the
hierarchical constraint had smaller AIC, BIC and CAIC values, and it did not fit significantly
differently from the model without the constraint based on the p-value of the likelihood ratio test.
Therefore, the hypothesized attribute hierarchy may present in the dataset.
To summarize, the following hypothesis was uncovered and validated in the listening section
through examinees’ item responses: examinees were expected to master vocabulary before they could
master global/connecting/synthesizing skills, and they were expected to master
global/connecting/synthesizing skills and the skill of making inferences before they could master the
skill of comprehending explicit information.
Table 13. Model Comparison for Attribute Hierarchy in the Listening Section
MMooddeell ## ooff PPaarraammeetteerrss AAIICC BBIICC CCAAIICC 𝑮𝑮𝟐𝟐 pp--vvaalluuee 1 188 30546.10 31430.53 31618.53 2 170 30512.80 31312.55 31482.55 2.7 1.00
Note: Model 1 is the model without the attribute hierarchy. Model 2 is the model with the attribute
hierarchy constraint.
Grammar/Reading Section
Similar to the listening section, the A-CDM was fit to the dataset and the attribute profile for each
person was obtained. The number of examinees in each attribute profile is listed in Table 14. Overall,
69%, 56%, 77%, 37%, and 32% of examinees mastered each of the five attributes, respectively.

MichiganAssessment.org22
DCM Analysis of MET | Ren Liu
Table 14. Number of Examinees in Each Attribute Profile in the Grammar/Reading
Section
PPrrooffiillee ## ooff EExxaammiinneeeess 11111 235 11100 177 10000 139 00100 117 10100 44 01110 39 00000 31 01000 9 00111 7 01111 6 00101 5 11000 3 00001 2 10001 1 10110 1
Note: There are 2! = 32 possible attribute profiles. Profiles not listed are associated with zero examinees.
Based on the pattern, the hypothesized attribute hierarchy is shown in Figure 2. Figure 2
suggests that examinees need to master 𝛼𝛼#, 𝛼𝛼$ and 𝛼𝛼/ before mastering either 𝛼𝛼. or 𝛼𝛼%. Table 15 lists
the permissible and impermissible attribute profiles under this hypothesis.
Figure 2. Hypothesized Attribute Hierarchy in the Grammar/Reading Section
MichiganAssessment.org 23
DCM Analysis of MET | Ren Liu
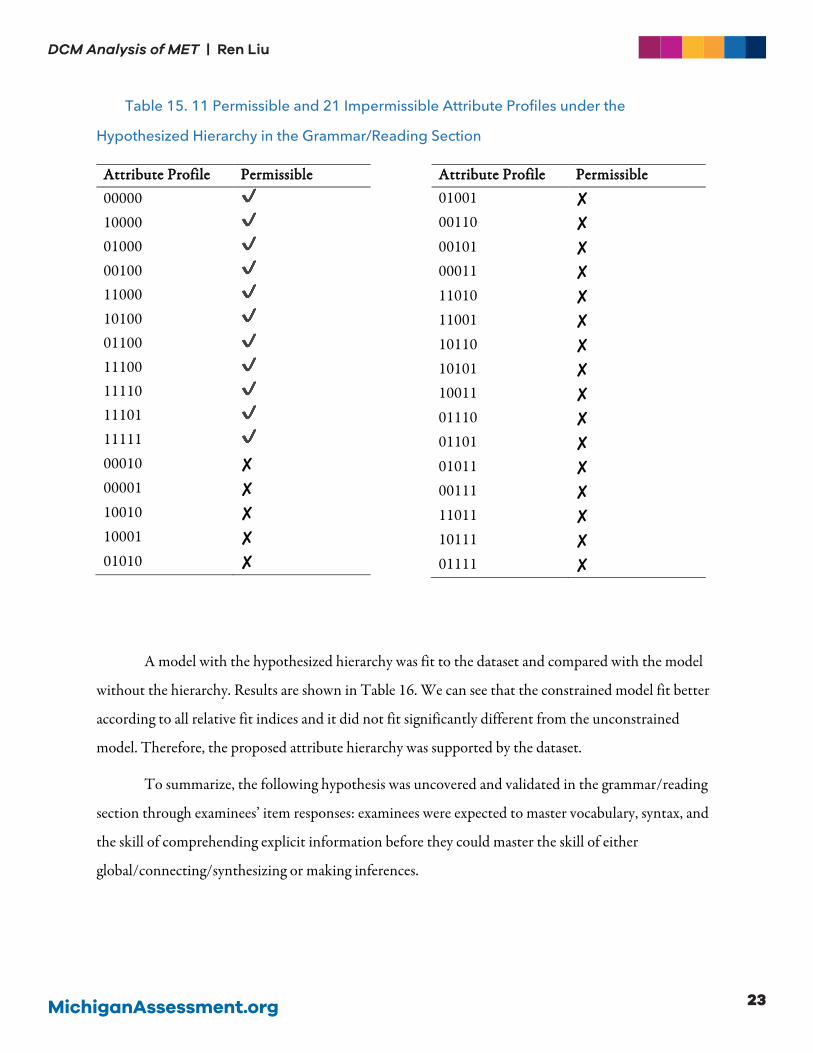
Table 15. 11 Permissible and 21 Impermissible Attribute Profiles under the
Hypothesized Hierarchy in the Grammar/Reading Section
AAttttrriibbuuttee PPrrooffiillee PPeerrmmiissssiibbllee 000001000001000001001100010100011001110011110111011111100010 ✘00001 ✘10010 ✘10001 ✘01010 ✘
AAttttrriibbuuttee PPrrooffiillee PPeerrmmiissssiibbllee 01001 ✘00110 ✘00101 ✘00011 ✘11010 ✘11001 ✘10110 ✘10101 ✘10011 ✘01110 ✘01101 ✘01011 ✘00111 ✘11011 ✘10111 ✘01111 ✘
A model with the hypothesized hierarchy was fit to the dataset and compared with the model
without the hierarchy. Results are shown in Table 16. We can see that the constrained model fit better
according to all relative fit indices and it did not fit significantly different from the unconstrained
model. Therefore, the proposed attribute hierarchy was supported by the dataset.
To summarize, the following hypothesis was uncovered and validated in the grammar/reading
section through examinees’ item responses: examinees were expected to master vocabulary, syntax, and
the skill of comprehending explicit information before they could master the skill of either
global/connecting/synthesizing or making inferences.

MichiganAssessment.org24
DCM Analysis of MET | Ren Liu
Table 16. Model Comparison for Attribute Hierarchy in the Grammar/Reading Section
MMooddeell ## ooff PPaarraammeetteerrss AAIICC BBIICC CCAAIICC 𝑮𝑮𝟐𝟐 pp--vvaalluuee 1 129 26599.07 27205.94 27334.94 2 108 26367.22 26583.22 27091.30 26.15 .20
Note: Model 1 is the model without the attribute hierarchy. Model 2 is the model with the attribute
hierarchy constraint.
RQ2: EXAMINING THE RELATIONSHIP BETWEEN THE OVERALL SECTION SCORE AND SUBSKILL
MASTERY
Different attribute mastery patterns are expected to associate with different average overall scores.
The purpose of this section is to investigate the relationship between examinees’ overall section score
and attribute mastery. Specifically, the following three-part analysis were performed: 1) examining the
bivariate correlation between the marginal probability of mastery on each subskill and the overall score;
2) using a multiple regression model to examine the association between subskill mastery and overall
scores; and 3) examining the average overall scores for each attribute profile to see whether some
attribute profiles were associated with higher overall scores than others.
Listening Section
As mentioned previously, in addition to the categorical attribute profiles that each examinee was
assigned to, they also got a probability of mastery on each attribute. Statistically speaking, those who
have a probability of 0.5 and above are classified as a master, and below 0.5 a non-master. The
distribution of the mastery probability on each attribute and their bivariate correlations with the overall
scores are shown in Figure 3.
MichiganAssessment.org 25
DCM Analysis of MET | Ren Liu
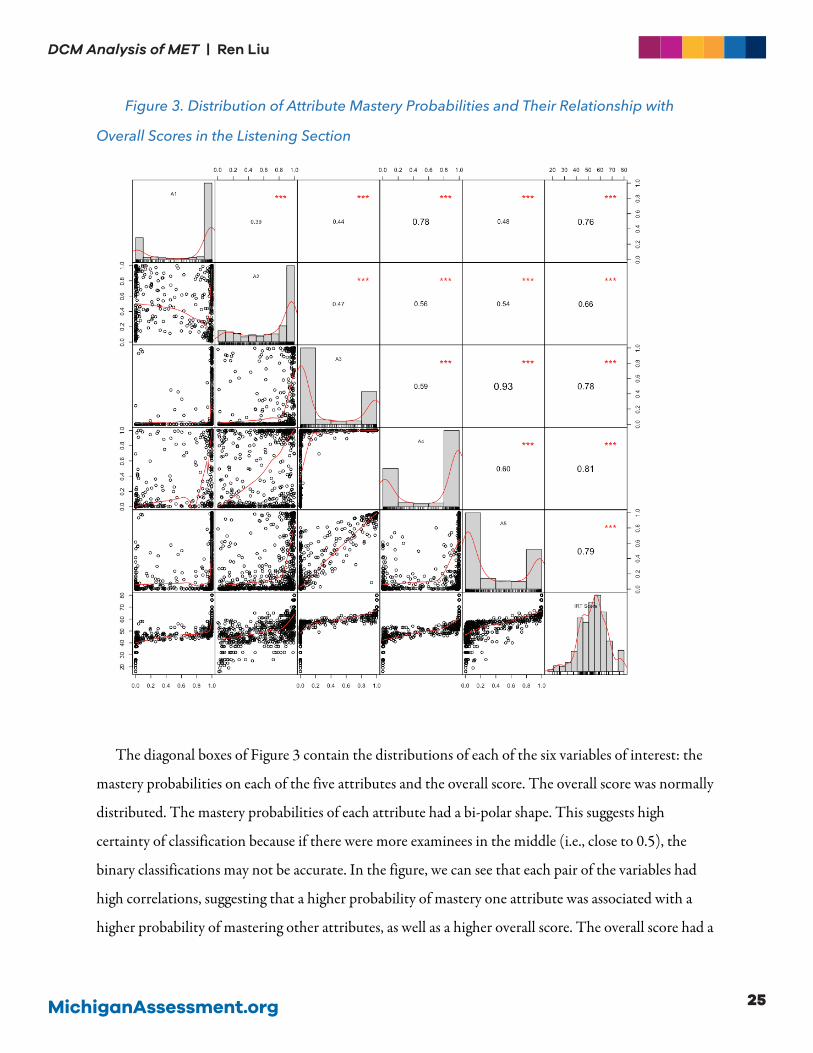
Figure 3. Distribution of Attribute Mastery Probabilities and Their Relationship with
Overall Scores in the Listening Section
The diagonal boxes of Figure 3 contain the distributions of each of the six variables of interest: the
mastery probabilities on each of the five attributes and the overall score. The overall score was normally
distributed. The mastery probabilities of each attribute had a bi-polar shape. This suggests high
certainty of classification because if there were more examinees in the middle (i.e., close to 0.5), the
binary classifications may not be accurate. In the figure, we can see that each pair of the variables had
high correlations, suggesting that a higher probability of mastery one attribute was associated with a
higher probability of mastering other attributes, as well as a higher overall score. The overall score had a
MichiganAssessment.org26
DCM Analysis of MET | Ren Liu
correlation between 0.66 and 0.81 with each attribute, while 𝛼𝛼$: “Syntax” had the lowest correlation
and 𝛼𝛼.: “Global/ Connecting/ Synthesizing” had the highest correlation.
To further examine the five attributes together, a multiple regression was performed, and results are
shown in Table 17. The unstandardized coefficients are listed here because the probabilities of mastery
of all five attributes are already on the same scale (i.e., [0,1]). Therefore, the coefficients are directly
comparable, and their interpretations are meaningful with respect to the overall scores.
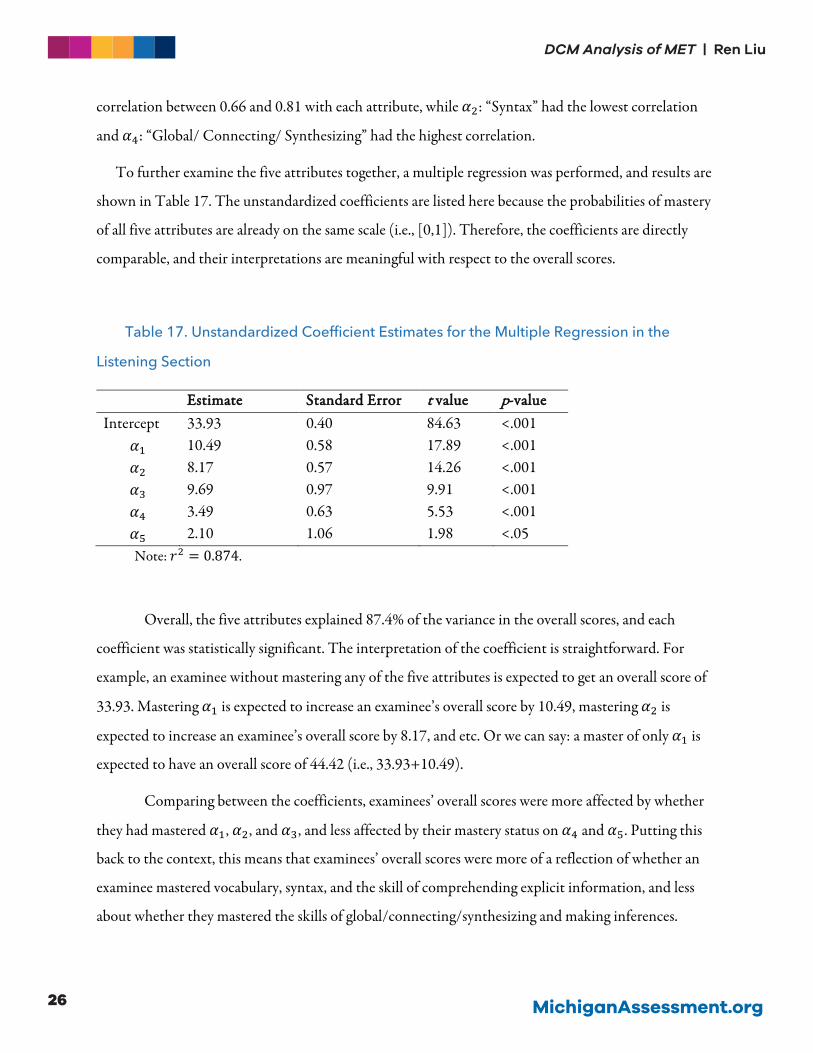
Table 17. Unstandardized Coefficient Estimates for the Multiple Regression in the
Listening Section
EEssttiimmaattee SSttaannddaarrdd EErrrroorr tt vvaalluuee pp--vvaalluuee Intercept 33.93 0.40 84.63 <.001
𝛼𝛼# 10.49 0.58 17.89 <.001 𝛼𝛼$ 8.17 0.57 14.26 <.001 𝛼𝛼/ 9.69 0.97 9.91 <.001 𝛼𝛼. 3.49 0.63 5.53 <.001 𝛼𝛼% 2.10 1.06 1.98 <.05 Note: 𝑟𝑟" = 0.874.
Overall, the five attributes explained 87.4% of the variance in the overall scores, and each
coefficient was statistically significant. The interpretation of the coefficient is straightforward. For
example, an examinee without mastering any of the five attributes is expected to get an overall score of
33.93. Mastering 𝛼𝛼# is expected to increase an examinee’s overall score by 10.49, mastering 𝛼𝛼$ is
expected to increase an examinee’s overall score by 8.17, and etc. Or we can say: a master of only 𝛼𝛼# is
expected to have an overall score of 44.42 (i.e., 33.93+10.49).
Comparing between the coefficients, examinees’ overall scores were more affected by whether
they had mastered 𝛼𝛼#, 𝛼𝛼$, and 𝛼𝛼/, and less affected by their mastery status on 𝛼𝛼. and 𝛼𝛼%. Putting this
back to the context, this means that examinees’ overall scores were more of a reflection of whether an
examinee mastered vocabulary, syntax, and the skill of comprehending explicit information, and less
about whether they mastered the skills of global/connecting/synthesizing and making inferences.
MichiganAssessment.org 27
DCM Analysis of MET | Ren Liu
Grammar/Reading Section
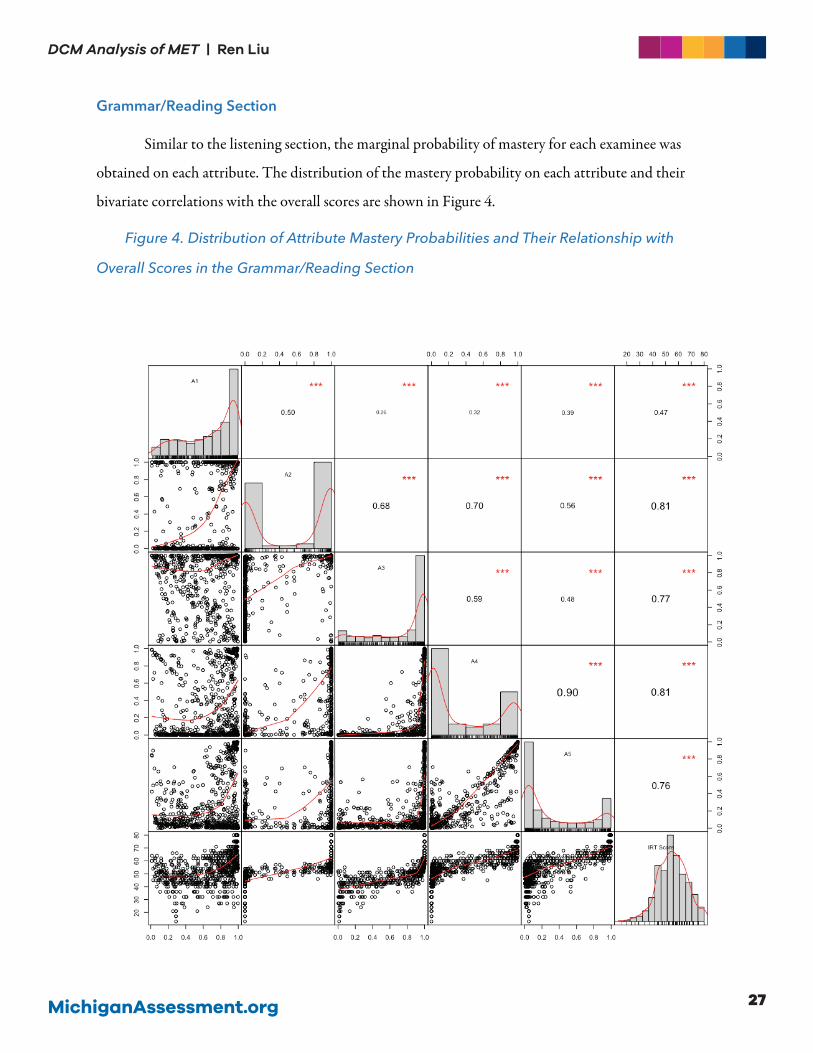
Similar to the listening section, the marginal probability of mastery for each examinee was
obtained on each attribute. The distribution of the mastery probability on each attribute and their
bivariate correlations with the overall scores are shown in Figure 4.
Figure 4. Distribution of Attribute Mastery Probabilities and Their Relationship with
Overall Scores in the Grammar/Reading Section
MichiganAssessment.org28
DCM Analysis of MET | Ren Liu
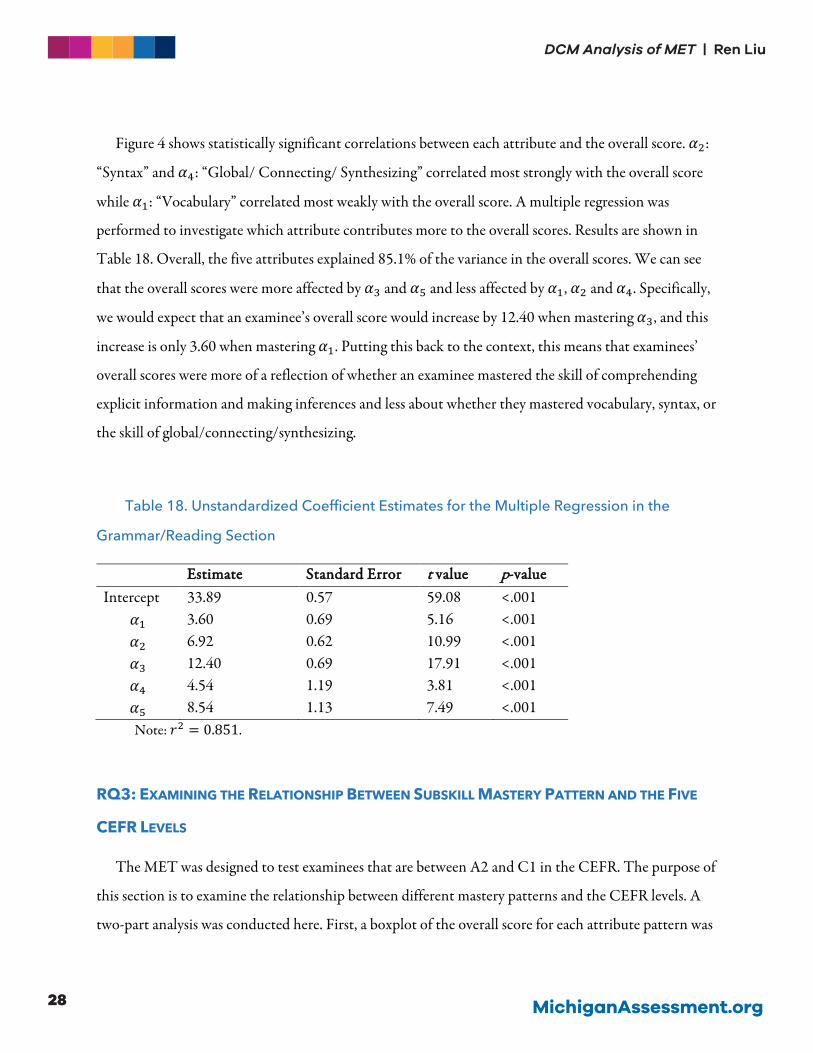
Figure 4 shows statistically significant correlations between each attribute and the overall score. 𝛼𝛼$:
“Syntax” and 𝛼𝛼.: “Global/ Connecting/ Synthesizing” correlated most strongly with the overall score
while 𝛼𝛼#: “Vocabulary” correlated most weakly with the overall score. A multiple regression was
performed to investigate which attribute contributes more to the overall scores. Results are shown in
Table 18. Overall, the five attributes explained 85.1% of the variance in the overall scores. We can see
that the overall scores were more affected by 𝛼𝛼/ and 𝛼𝛼% and less affected by 𝛼𝛼#, 𝛼𝛼$ and 𝛼𝛼.. Specifically,
we would expect that an examinee’s overall score would increase by 12.40 when mastering 𝛼𝛼/, and this
increase is only 3.60 when mastering 𝛼𝛼#. Putting this back to the context, this means that examinees’
overall scores were more of a reflection of whether an examinee mastered the skill of comprehending
explicit information and making inferences and less about whether they mastered vocabulary, syntax, or
the skill of global/connecting/synthesizing.
Table 18. Unstandardized Coefficient Estimates for the Multiple Regression in the
Grammar/Reading Section
EEssttiimmaattee SSttaannddaarrdd EErrrroorr tt vvaalluuee pp--vvaalluuee Intercept 33.89 0.57 59.08 <.001
𝛼𝛼# 3.60 0.69 5.16 <.001 𝛼𝛼$ 6.92 0.62 10.99 <.001 𝛼𝛼/ 12.40 0.69 17.91 <.001 𝛼𝛼. 4.54 1.19 3.81 <.001 𝛼𝛼% 8.54 1.13 7.49 <.001 Note: 𝑟𝑟" = 0.851.
RQ3: EXAMINING THE RELATIONSHIP BETWEEN SUBSKILL MASTERY PATTERN AND THE FIVE
CEFR LEVELS
The MET was designed to test examinees that are between A2 and C1 in the CEFR. The purpose of
this section is to examine the relationship between different mastery patterns and the CEFR levels. A
two-part analysis was conducted here. First, a boxplot of the overall score for each attribute pattern was
MichiganAssessment.org 29
DCM Analysis of MET | Ren Liu
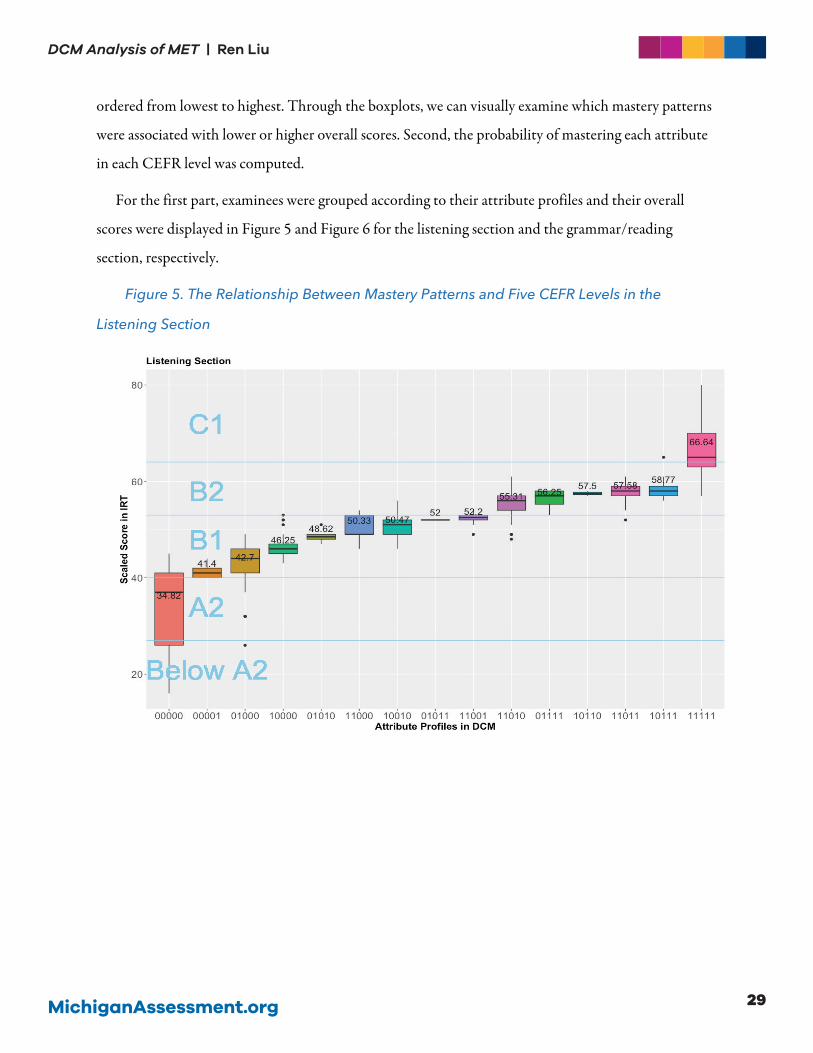
ordered from lowest to highest. Through the boxplots, we can visually examine which mastery patterns
were associated with lower or higher overall scores. Second, the probability of mastering each attribute
in each CEFR level was computed.
For the first part, examinees were grouped according to their attribute profiles and their overall
scores were displayed in Figure 5 and Figure 6 for the listening section and the grammar/reading
section, respectively.
Figure 5. The Relationship Between Mastery Patterns and Five CEFR Levels in the
Listening Section

MichiganAssessment.org30
DCM Analysis of MET | Ren Liu
Figure 6. The Relationship Between Mastery Patterns and Five CEFR Levels in the
Grammar/Reading Section
The general trend in both sections is that examinees had higher overall scores when they mastered
more attributes (i.e., more “1”s in their attribute profiles). Examinees that did not master any attribute
were mostly classified into the A2 level. Examinees that mastered one or two attributes were mostly
classified into the B1 level. Examinees that mastered three or four attributes were mostly classified into
the B2 level. Examinees that mastered all attributes were mostly classified into the C1 level. This
distribution strongly supports the targeted level of the MET: between A2 and C1.
One could also look into specific attribute patterns. For example, in both the listening and the
grammar/reading sections, only mastering 𝛼𝛼%: the skill of making inferences was associated with the
lowest overall scores compared with mastering other attributes.
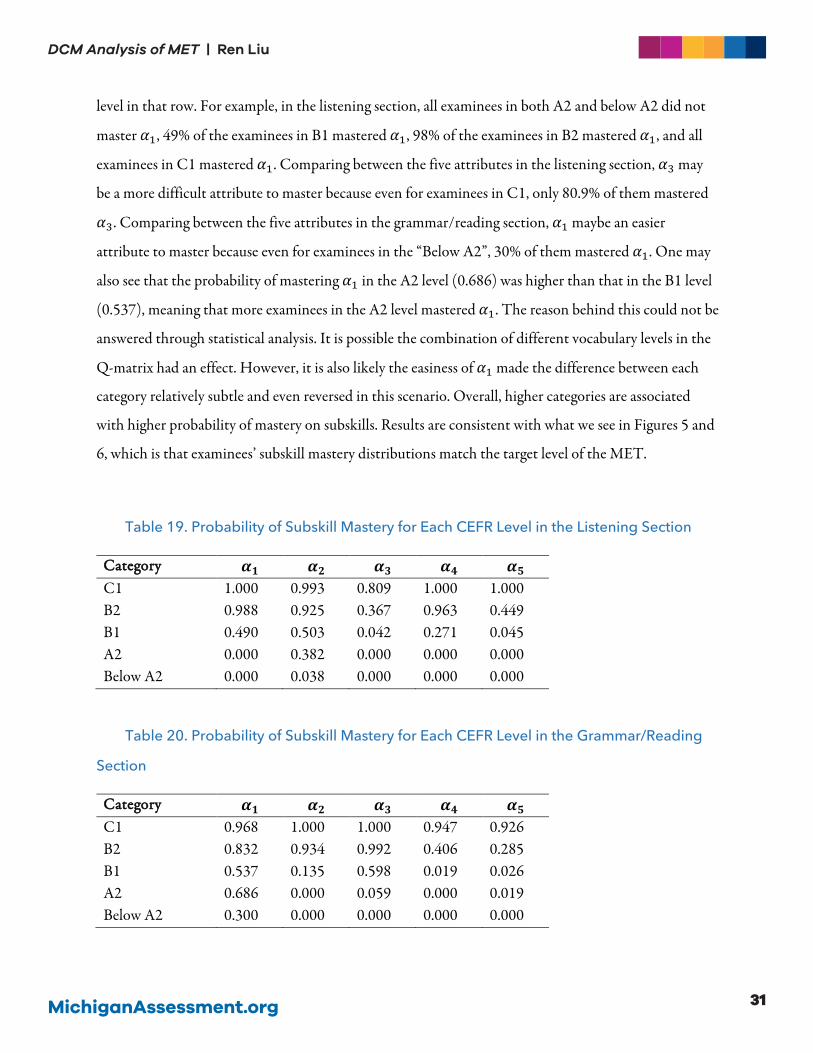
The second part of the analysis is to investigate the corresponding mastery probability for each
CEFR level. Results are shown in Table 19 and Table 20 for the two sections. The values in both tables
represent the proportion of examinees that are masters of the attribute in that column and the CEFR
MichiganAssessment.org 31
DCM Analysis of MET | Ren Liu
level in that row. For example, in the listening section, all examinees in both A2 and below A2 did not
master 𝛼𝛼#, 49% of the examinees in B1 mastered 𝛼𝛼#, 98% of the examinees in B2 mastered 𝛼𝛼#, and all
examinees in C1 mastered 𝛼𝛼#. Comparing between the five attributes in the listening section, 𝛼𝛼/ may
be a more difficult attribute to master because even for examinees in C1, only 80.9% of them mastered
𝛼𝛼/. Comparing between the five attributes in the grammar/reading section, 𝛼𝛼# maybe an easier
attribute to master because even for examinees in the “Below A2”, 30% of them mastered 𝛼𝛼#. One may
also see that the probability of mastering 𝛼𝛼# in the A2 level (0.686) was higher than that in the B1 level
(0.537), meaning that more examinees in the A2 level mastered 𝛼𝛼#. The reason behind this could not be
answered through statistical analysis. It is possible the combination of different vocabulary levels in the
Q-matrix had an effect. However, it is also likely the easiness of 𝛼𝛼# made the difference between each
category relatively subtle and even reversed in this scenario. Overall, higher categories are associated
with higher probability of mastery on subskills. Results are consistent with what we see in Figures 5 and
6, which is that examinees’ subskill mastery distributions match the target level of the MET.
Table 19. Probability of Subskill Mastery for Each CEFR Level in the Listening Section
CCaatteeggoorryy 𝜶𝜶𝟏𝟏 𝜶𝜶𝟐𝟐 𝜶𝜶𝟑𝟑 𝜶𝜶𝟒𝟒 𝜶𝜶𝟓𝟓 C1 1.000 0.993 0.809 1.000 1.000 B2 0.988 0.925 0.367 0.963 0.449 B1 0.490 0.503 0.042 0.271 0.045 A2 0.000 0.382 0.000 0.000 0.000 Below A2 0.000 0.038 0.000 0.000 0.000
Table 20. Probability of Subskill Mastery for Each CEFR Level in the Grammar/Reading
Section
CCaatteeggoorryy 𝜶𝜶𝟏𝟏 𝜶𝜶𝟐𝟐 𝜶𝜶𝟑𝟑 𝜶𝜶𝟒𝟒 𝜶𝜶𝟓𝟓 C1 0.968 1.000 1.000 0.947 0.926 B2 0.832 0.934 0.992 0.406 0.285 B1 0.537 0.135 0.598 0.019 0.026 A2 0.686 0.000 0.059 0.000 0.019 Below A2 0.300 0.000 0.000 0.000 0.000
MichiganAssessment.org32
DCM Analysis of MET | Ren Liu
DISCUSSION
This study investigated three research questions regarding subskill mastery on the listening and
grammar/reading sections on the MET using the DCM framework. The first research question is to
investigate whether there may exist a mastery sequence between subskills. Results show that in the
listening section, vocabulary may be a prerequisite for global/connecting/synthesizing skills, and
global/connecting/synthesizing skills and the skill of making inferences may be prerequisites for the
skill of comprehending explicit information. In the reading section, vocabulary, syntax, and the skill of
comprehending explicit may be prerequisites for the skills of global/connecting/synthesizing or making
inferences. The second research question is to investigate the contribution of mastering each attribute
to the overall scores, and results show that vocabulary, syntax, and the skill of comprehending explicit
information contributed more to the overall scores than the skills of global/ connecting/ synthesizing
and making inferences in the listening section. The skills of comprehending explicit information and
making inferences contributed more to the overall scores than vocabulary, syntax, and the skill of
global/ connecting/ synthesizing in the grammar/reading section. The third question is to investigate
the relationship between the subskill mastery patterns and the CEFR levels. Results fully support the
targeted level of the MET (i.e., between A2 and C1). When addressing each research question,
examples of interpreting the values in the findings were given, but researchers and test developers could
further interpret and use the results for learning more about the construct and/or item/test
development.
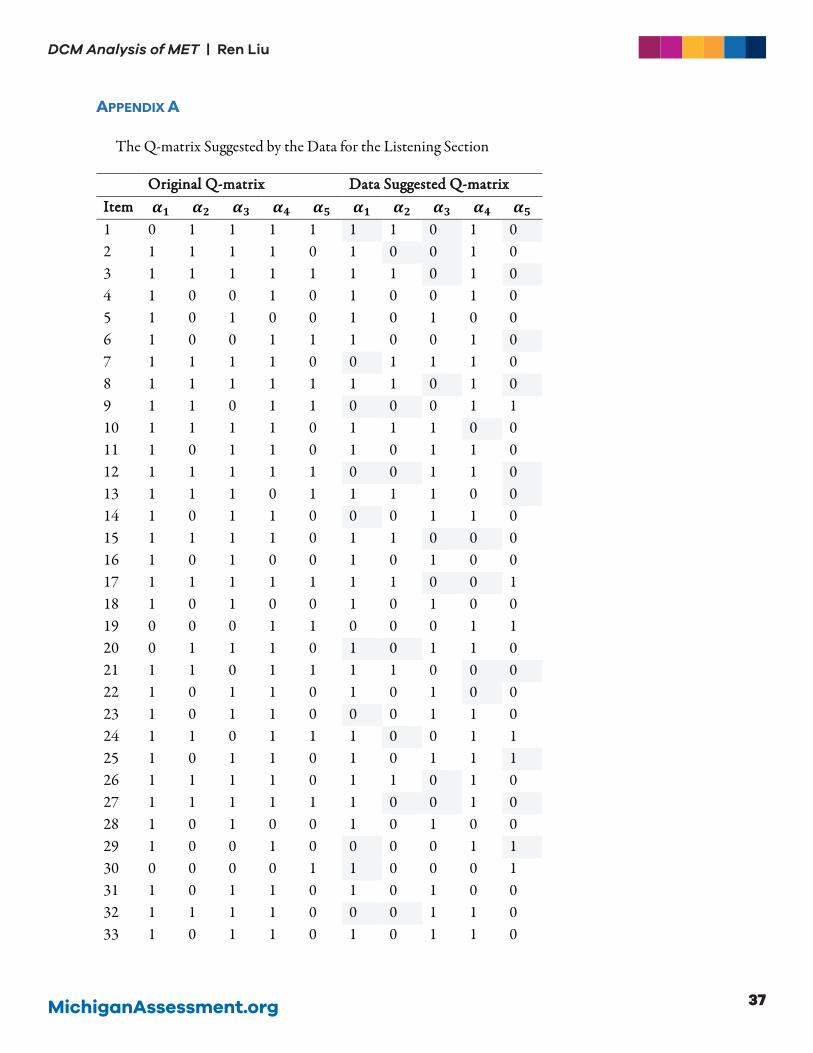
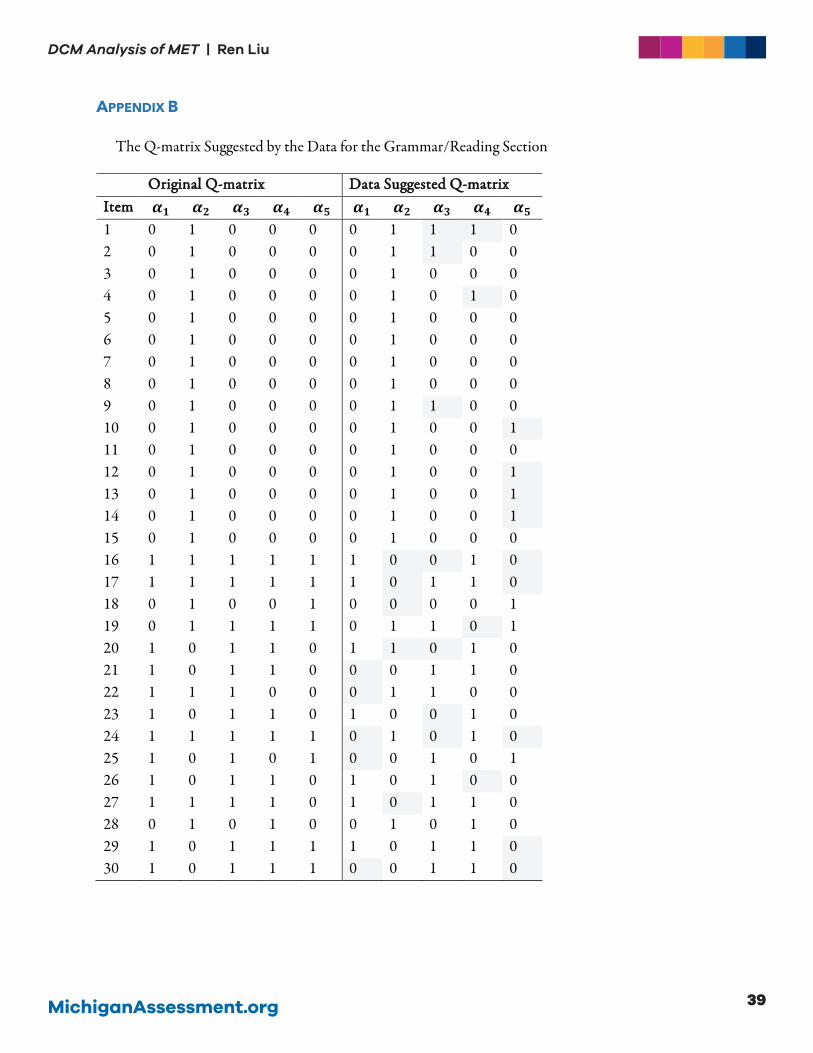
This study has at least two limitations that could be addressed in future research. First, as mentioned
previously, the Q-matrices are not ideal because they are not balanced. Some attributes are measured
much more times than others. In an ideal world, we would want to fit DCMs to item responses from
tests that are developed under a DCM framework. On the other hand, item responses could be used to
suggest a Q-matrix that best describes the data. As a foundation for future research in this line, data-
suggested Q-matrices for the listening section and the grammar/reading sections are listed in the
Appendices A and B, using the approach developed in de la Torre and Chiu (2016). In the appendices,
one could see that the majority of the revisions that the data suggested were from “1” to “0”. In other
words, the data suggested that some items do not measure some attributes as originally designed.
However, it is critical to point out that the data-suggested Q-matrix is not the “true” Q-matrix or the
MichiganAssessment.org 33
DCM Analysis of MET | Ren Liu
“best” Q-matrix. Often times entries in the data-suggested Q-matrix do not make sense from a content
perspective. One should always design a Q-matrix based on construct theory and only use the data-
suggested Q-matrix as a reference.
Second, the attribute hierarchies formed in the analysis of RQ1 could gain additional support
through further discussions with content experts. Different attribute hierarchies could be formed, and
the general rule is that when the attributes are more structured, we gain a more linear sequence between
the skills, but the model may be more likely to fit worse. When the attributes are less structured, for
example, with no structure, there will be no sequence, but the model would fit to the best it can be. The
attribute hierarchy formed in this study was a result of a balance between the model fit and useful
sequence, but it would not be helpful if the hierarchy does not make sense content-wise. In the future, it
would be more helpful to involve content experts in the process of forming attribute hierarchies.
DCMs classify examinees according to their mastery/non-mastery status on the subskills. This study
uses DCMs to provide information on the subskills, which provides additional validity evidence,
supplies information for item/test development, and hopefully promotes future research involving
subskills on the MET.
MichiganAssessment.org34
DCM Analysis of MET | Ren Liu
REFERENCES
Akaike, H. (1987). Factor analysis and AIC. Psychometrika, 52, 317–332.
Bozdogan, H. (1987). Model selection and Akaike's information criterion (AIC): The general
theory and its analytical extensions. Psychometrika, 52(3), 345-370.
Council of Europe (2001). Common European Framework of Reference for Languages: Learning,
Teaching, Assessment. Cambridge: Cambridge University Press.
de la Torre, J. (2011). The generalized DINA model framework. Psychometrika, 76, 179-199.
de la Torre, J. & Chiu, C-Y. (2016). A General Method of Empirical Q-matrix Validation.
Psychometrika, 81, 253-273.
Haertel, E. H. (1989). Using restricted latent class models to map the skill structure of achievement
items. Journal of Educational Measurement, 301-321.
Hansen, M., Cai, L., Monroe, S., & Li, Z. (2016). Limited-information goodness-of-fit testing of
diagnostic classification item response models. British Journal of Mathematical and Statistical
Psychology. 69, 225–252.
Junker, B. W., & Sijtsma, K. (2001). Cognitive assessment models with few assumptions, and
connections with nonparametric item response theory. Applied Psychological Measurement, 25(3),
258-272.
Leighton, J. P., Gierl, M. J., & Hunka, S. M. (2004). The attribute hierarchy method for cognitive
assessment: a variation on Tatsuoka's rule‐space approach. Journal of Educational Measurement, 41(3),
205-237.
Liu, R., Huggins-Manley, A. C., & Bulut, O. (2018). Retrofitting diagnostic classification models to
responses from IRT-based assessment forms. Educational and Psychological Measurement, 78(3), 357-
383. doi: 10.1177/0013164416685599
Liu, R., Qian, H., Luo, X., & Woo, A. (2017). Relative Diagnostic Profile: A Subscore Reporting
Framework. Educational and Psychological Measurement, 0013164417740170.
MichiganAssessment.org 35
DCM Analysis of MET | Ren Liu
Ma, W. & de la Torre, J. (2019). GDINA: The generalized DINA model framework, R package
version 2.5. Retrieved from http://CRAN.R-project.org/package=GDINA.
Madison, M. J., & Bradshaw, L. P. (2015). The effects of Q-matrix design on classification accuracy
in the log-linear cognitive diagnosis model. Educational and Psychological Measurement, 75(3), 491-
511.
Maydeu-Olivares, A., & Joe, H. (2014). Assessing approximate fit in categorical data analysis.
Multivariate Behavioral Research, 49, 305-328.
R Core Team (2018). R (Version 3.5) [Computer Software]. Vienna, Austria: R Foundation for
Statistical Computing.
Rupp, A. A., Templin, J., & Henson, R. A. (2010). Diagnostic measurement: Theory, methods, and
applications. New York: Guilford Press.
Schwarz, G. (1978). Estimating the dimension of a model. The Annals of Statistics, 6, 461–464.
Sinharay, S. (2010). How often do subscores have added value? Results from operational and
simulated data. Journal of Educational Measurement, 47(2), 150-174.
Sinharay, S., Puhan, G., Haberman, S. J., & Hambleton, R. K. (2018). Subscores: When to
Communicate Them, What Are Their Alternatives, and Some Recommendations. In Score Reporting
Research and Applications (pp. 35-49). Routledge.
Tatsuoka, K. K. (1983). Rule space: An approach for dealing with misconceptions based on item
response theory. Journal of Educational Measurement, 20(4), 345-354.
Templin, J., & Bradshaw, L. (2013). Measuring the reliability of diagnostic classification model
examinee estimates. Journal of Classification, 30, 251-275.
Templin, J., & Bradshaw, L. (2014). Hierarchical diagnostic classification models: A family of
models for estimating and testing attribute hierarchies. Psychometrika, 79(2), 317-339.
Templin, J., & Henson, R. (2006). Measurement of psychological disorders using cognitive diagnosis
models. Psychological Methods, 11(3), 287.
MichiganAssessment.org36
DCM Analysis of MET | Ren Liu
von Davier, M. (2005). A general diagnostic model applied to language testing data. ETS Research
Report Series, 2005(2). Princeton, NJ: Educational Testing Service.
MichiganAssessment.org 37
DCM Analysis of MET | Ren Liu
APPENDIX A
The Q-matrix Suggested by the Data for the Listening Section
OOrriiggiinnaall QQ--mmaattrriixx DDaattaa SSuuggggeesstteedd QQ--mmaattrriixx IItteemm 𝜶𝜶𝟏𝟏 𝜶𝜶𝟐𝟐 𝜶𝜶𝟑𝟑 𝜶𝜶𝟒𝟒 𝜶𝜶𝟓𝟓 𝜶𝜶𝟏𝟏 𝜶𝜶𝟐𝟐 𝜶𝜶𝟑𝟑 𝜶𝜶𝟒𝟒 𝜶𝜶𝟓𝟓 1 0 1 1 1 1 1 1 0 1 0 2 1 1 1 1 0 1 0 0 1 0 3 1 1 1 1 1 1 1 0 1 0 4 1 0 0 1 0 1 0 0 1 0 5 1 0 1 0 0 1 0 1 0 0 6 1 0 0 1 1 1 0 0 1 0 7 1 1 1 1 0 0 1 1 1 0 8 1 1 1 1 1 1 1 0 1 0 9 1 1 0 1 1 0 0 0 1 1 10 1 1 1 1 0 1 1 1 0 0 11 1 0 1 1 0 1 0 1 1 0 12 1 1 1 1 1 0 0 1 1 0 13 1 1 1 0 1 1 1 1 0 0 14 1 0 1 1 0 0 0 1 1 0 15 1 1 1 1 0 1 1 0 0 0 16 1 0 1 0 0 1 0 1 0 0 17 1 1 1 1 1 1 1 0 0 1 18 1 0 1 0 0 1 0 1 0 0 19 0 0 0 1 1 0 0 0 1 1 20 0 1 1 1 0 1 0 1 1 0 21 1 1 0 1 1 1 1 0 0 0 22 1 0 1 1 0 1 0 1 0 0 23 1 0 1 1 0 0 0 1 1 0 24 1 1 0 1 1 1 0 0 1 1 25 1 0 1 1 0 1 0 1 1 1 26 1 1 1 1 0 1 1 0 1 0 27 1 1 1 1 1 1 0 0 1 0 28 1 0 1 0 0 1 0 1 0 0 29 1 0 0 1 0 0 0 0 1 1 30 0 0 0 0 1 1 0 0 0 1 31 1 0 1 1 0 1 0 1 0 0 32 1 1 1 1 0 0 0 1 1 0 33 1 0 1 1 0 1 0 1 1 0

MichiganAssessment.org38
DCM Analysis of MET | Ren Liu
OOrriiggiinnaall QQ--mmaattrriixx DDaattaa SSuuggggeesstteedd QQ--mmaattrriixx IItteemm 𝜶𝜶𝟏𝟏 𝜶𝜶𝟐𝟐 𝜶𝜶𝟑𝟑 𝜶𝜶𝟒𝟒 𝜶𝜶𝟓𝟓 𝜶𝜶𝟏𝟏 𝜶𝜶𝟐𝟐 𝜶𝜶𝟑𝟑 𝜶𝜶𝟒𝟒 𝜶𝜶𝟓𝟓 34 0 1 1 1 1 0 1 1 1 0 35 1 1 1 0 0 0 1 1 0 0 36 1 1 1 0 0 1 1 1 0 0
MichiganAssessment.org 39
DCM Analysis of MET | Ren Liu
APPENDIX B
The Q-matrix Suggested by the Data for the Grammar/Reading Section
OOrriiggiinnaall QQ--mmaattrriixx DDaattaa SSuuggggeesstteedd QQ--mmaattrriixx IItteemm 𝜶𝜶𝟏𝟏 𝜶𝜶𝟐𝟐 𝜶𝜶𝟑𝟑 𝜶𝜶𝟒𝟒 𝜶𝜶𝟓𝟓 𝜶𝜶𝟏𝟏 𝜶𝜶𝟐𝟐 𝜶𝜶𝟑𝟑 𝜶𝜶𝟒𝟒 𝜶𝜶𝟓𝟓 1 0 1 0 0 0 0 1 1 1 0 2 0 1 0 0 0 0 1 1 0 0 3 0 1 0 0 0 0 1 0 0 0 4 0 1 0 0 0 0 1 0 1 0 5 0 1 0 0 0 0 1 0 0 0 6 0 1 0 0 0 0 1 0 0 0 7 0 1 0 0 0 0 1 0 0 0 8 0 1 0 0 0 0 1 0 0 0 9 0 1 0 0 0 0 1 1 0 0 10 0 1 0 0 0 0 1 0 0 1 11 0 1 0 0 0 0 1 0 0 0 12 0 1 0 0 0 0 1 0 0 1 13 0 1 0 0 0 0 1 0 0 1 14 0 1 0 0 0 0 1 0 0 1 15 0 1 0 0 0 0 1 0 0 0 16 1 1 1 1 1 1 0 0 1 0 17 1 1 1 1 1 1 0 1 1 0 18 0 1 0 0 1 0 0 0 0 1 19 0 1 1 1 1 0 1 1 0 1 20 1 0 1 1 0 1 1 0 1 0 21 1 0 1 1 0 0 0 1 1 0 22 1 1 1 0 0 0 1 1 0 0 23 1 0 1 1 0 1 0 0 1 0 24 1 1 1 1 1 0 1 0 1 0 25 1 0 1 0 1 0 0 1 0 1 26 1 0 1 1 0 1 0 1 0 0 27 1 1 1 1 0 1 0 1 1 0 28 0 1 0 1 0 0 1 0 1 0 29 1 0 1 1 1 1 0 1 1 0 30 1 0 1 1 1 0 0 1 1 0