Embed Size (px)
Citation preview

A Distributed Admission Control Model forClass-based IP Networks
Maria Solange Pires Ferreira Rito Lima
A thesis submitted to the University of Minho in the subject of Informatics,
Computer Communications, for the degree of Doctor of Philosophy, under
scientific supervision of Prof. Vasco Luís Barbosa de Freitas and Prof. Paulo
Manuel Martins de Carvalho.
University of Minho
School of Engineering
Department of Informatics
September, 2005

ii

Acknowledgments
To Professor Vasco Freitas for supervising this work and for his thoughtful advice and guidance
along many years, since my graduation at the University of Minho.
To Professor Paulo Carvalho, my co-supervisor, for his continuous encouragement, countless
scientific discussions and helpful “English lessons”. I would also like to thank him for assisting
my work and reviewing this dissertation so thoroughly.
To my colleagues within the Computer Communications Group for their friendship and moti-
vation. In particular, to Professor Alexandre Santos for his suggestions and incentive, to Pedro
Nuno for the many talks and laughs, to Oscar for his good will and effective assistance in my
teaching duties.
To all my friends for many cheerful and enjoyable moments during this work-intensive period.
To Paulo for his unconditional presence and support along these years.
To my parents for all the affection and valuable help, in particular with Inês and Pedro Jorge.
To Jorge for his everyday understanding, support, encouragement and love.
To Inês and Pedro Jorge for coloring my days with their enthusiasm, love and smiles.
Thank you for supporting me in achieving this goal.
iii

iv

Abstract
Providing Quality of Service (QoS) in the Internet is a complex and multilevel problem involvingheterogeneous media, protocols and technologies. Achieving a seamless and ubiquitous QoSsolution is even a more intricate issue attending to the plethora of service providers with theirown business, management and technological strategies. In this scenario, strong efforts havebeen made to adapt and improve the TCP/IP stack with enhanced service models and protocolsto sustain the integration of applications and services with distinct QoS requirements. From anetwork level perspective, and following this evolution, the IP service model tends to rely onclass-based paradigms such as the Differentiated Services.
Considering that overprovisioning of network resources by itself is not always an attain-able and everlasting solution, to allow efficient management of each class resources and fulfillService Level Specification (SLS) commitments, Admission Control (AC) mechanisms are rec-ommended to keep classes under controlled load and assure the required QoS levels. However,the complexity introduced in the network control plane should be kept as low as possible.
Despite the intense research in the field, handling AC in multiservice class-based networks isstill an open issue. This has motivated the challenge of achieving a simple, flexible and efficientAC proposal able to control QoS and SLSs both intra and interdomain. In this way, this thesisproposes a distributed and lightweight AC model based on per-class edge-to-edge monitoringfeedback for controlling the quality of multiple services in class-based IP networks. Resorting toQoS and SLSs on-line monitoring performed at egress nodes, relevant service metrics are pro-vided to ingress nodes, which make implicit or explicit AC decisions based on service-dependentrules. These rules, controlling both QoS parameters and SLSs utilization, consider controlledoverprovisioning levels to simplify AC while improving service guarantees. The intradomainand end-to-end operation of the AC model, including the main high-level entities involved, areformalized resorting to an expressive and intuitive notation.
A prototype of the AC model has been developed and tested using a simulation platform(NS-2). The devised test scenarios aim at assessing, in a first instance, the effectiveness ofthe monitoring process in capturing each class QoS behavior and then, at providing a proof-of-concept of the AC criteria in satisfying multiple QoS and SLSs commitments. The results,evincing the relevance and applicability of the defined AC rules, show that the proposed solutionprovides a good compromise between simplicity, service level guarantees and network resourceusage, even for service classes with strict QoS requirements.
v

vi

ResumoO suporte de qualidade de serviço (QoS) na Internet é um problema complexo e multifacetadoenvolvendo um conjunto heterogéneo de media, protocolos e tecnologias. Obter uma solução deQoS uniforme e abrangente é ainda mais difícil atendendo ao grande número de fornecedores deserviço com estratégias de negócio, gestão e tecnologias distintas. Neste cenário, tem sido feitoum grande esforço em adaptar e melhorar a pilha TCP/IP com modelos de serviço e protocolosmais apropriados para sustentar a integração de aplicações e serviços com requisitos de QoS dis-tintos. Ao nível de rede, e seguindo esta evolução, o modelo de serviço em que o IP assenta tendepara um paradigma baseado em classes, de que é exemplo o modelo de Serviços Diferenciados.
Considerando que o sobre-aprovisionamento de recursos de rede, por si só, nem sempre éuma solução sustentável e permanente, para permitir uma gestão eficiente dos recursos e assegu-rar o cumprimento dos níveis de serviço especificados (SLS), o controlo de admissão (AC) as-sume um papel relevante na manutenção das classes de serviço sob carga controlada e na garantiada QoS pretendida. No entanto, a complexidade inserida na rede deve ser a menor possível.
Apesar da intensa investigação na área, a abordagem ao AC em redes multi-serviço é aindauma questão em aberto, o que motivou o desafio da obtenção de um modelo de AC simples,flexível e eficiente, capaz de controlar a QoS e os SLSs intra e inter-domínio. Deste modo,esta tese propõe um modelo de AC distribuído e de sobrecarga reduzida, baseado em monitor-ização por classe entre nós fronteira, para controlar a qualidade de múltiplos serviços em redesIP baseadas em classes. Recorrendo à monitorização on-line de QoS e SLSs realizada em nósde saída do domínio, são disponibilizadas métricas de serviço adequadas aos nós de entrada domesmo, que tomam decisões de AC implícitas ou explícitas com base em regras específicas porserviço. Estas regras controlam os parâmetros de QoS e a utilização dos SLSs, considerandoníveis de sobre-aprovisionamento auto-contidos de modo a simplificar o AC e a aumentar asgarantias de cada serviço. A operação do modelo intra-domínio e fim-a-fim, incluindo as princi-pais entidades envolvidas, são formalizadas usando uma notação expressiva e intuitiva.
Um protótipo do modelo de AC foi desenvolvido e testado utilizando o simulador NS-2. Oscenários de teste idealizados visam avaliar a eficácia do processo de monitorização na detecçãodo comportamento de QoS de cada classe e fornecer uma prova de conceito da capacidade doscritérios de AC em cumprir múltiplos compromissos de QoS e SLSs. Os resultados obtidos,evidenciando a relevância e aplicabilidade das regras de AC definidas, mostram que a soluçãoproposta estabelece um bom compromisso entre simplicidade, níveis de garantia de serviço eutilização dos recursos de rede, mesmo para classes de serviço com requisitos de QoS estritos.
vii

viii

Contents
Acknowledgments iii
Abstract v
Resumo vii
Contents ix
List of Figures xv
List of Tables xix
List of Acronyms xxi
1 Introduction 1
1.1 Motivation and objectives . . . . . . . . . . . . . . . . . . . . . . . . . . . . . . 2
1.2 Research methodology . . . . . . . . . . . . . . . . . . . . . . . . . . . . . . . 6
1.3 Summary of main contributions . . . . . . . . . . . . . . . . . . . . . . . . . . 7
1.4 Dissertation layout . . . . . . . . . . . . . . . . . . . . . . . . . . . . . . . . . 8
2 Multiservice Class-based IP Networks 11
2.1 The Differentiated Services model . . . . . . . . . . . . . . . . . . . . . . . . . 12
2.1.1 Model components and operation . . . . . . . . . . . . . . . . . . . . . 13
ix
CONTENTS
2.1.2 Building services in Diffserv . . . . . . . . . . . . . . . . . . . . . . . 17
2.2 Defining and negotiating SLA/SLSs . . . . . . . . . . . . . . . . . . . . . . . . 20
2.2.1 Business models . . . . . . . . . . . . . . . . . . . . . . . . . . . . . . 24
2.2.2 Additional SLS deployment issues - SLS control and auditing . . . . . . 24
2.3 CoS traffic characterization . . . . . . . . . . . . . . . . . . . . . . . . . . . . 26
2.4 Summary . . . . . . . . . . . . . . . . . . . . . . . . . . . . . . . . . . . . . . 28
3 Admission Control in CoS IP Networks 29
3.1 Identifying relevant characteristics of AC approaches . . . . . . . . . . . . . . . 30
3.1.1 The AC decision criteria . . . . . . . . . . . . . . . . . . . . . . . . . . 32
3.2 AC approaches: a service-oriented overview . . . . . . . . . . . . . . . . . . . . 33
3.3 Detailing existing AC approaches . . . . . . . . . . . . . . . . . . . . . . . . . 34
3.3.1 Intserv/RSVP signaling and aggregating reservations . . . . . . . . . . . 34
3.3.2 Intserv/Diffserv integrated solutions . . . . . . . . . . . . . . . . . . . . 35
3.3.3 Dynamic Packet State and the SCORE architecture . . . . . . . . . . . . 37
3.3.4 Centralized approaches based on Bandwidth Brokers . . . . . . . . . . . 38
3.3.5 Measurement-based AC approaches . . . . . . . . . . . . . . . . . . . . 41
3.3.6 AC proposals to control elastic traffic . . . . . . . . . . . . . . . . . . . 46
3.3.7 QoS related projects: the AC perspective . . . . . . . . . . . . . . . . . 48
3.4 Comparing the main characteristics of AC approaches . . . . . . . . . . . . . . . 49
3.5 Motivation for a new AC proposal . . . . . . . . . . . . . . . . . . . . . . . . . 49
3.6 Summary . . . . . . . . . . . . . . . . . . . . . . . . . . . . . . . . . . . . . . 51
4 Monitoring QoS and SLSs 53
4.1 Identifying relevant monitoring systems characteristics . . . . . . . . . . . . . . 54
4.2 The problematic of QoS monitoring . . . . . . . . . . . . . . . . . . . . . . . . 56
4.2.1 Definition of metrics . . . . . . . . . . . . . . . . . . . . . . . . . . . . 56
x
CONTENTS
4.2.2 Measurement methodologies . . . . . . . . . . . . . . . . . . . . . . . . 63
4.2.3 Timing issues . . . . . . . . . . . . . . . . . . . . . . . . . . . . . . . 67
4.3 Multiclass and multipurpose active monitoring . . . . . . . . . . . . . . . . . . . 67
4.3.1 Probing patterns . . . . . . . . . . . . . . . . . . . . . . . . . . . . . . 68
4.4 Scalability considerations . . . . . . . . . . . . . . . . . . . . . . . . . . . . . 71
4.5 Summary . . . . . . . . . . . . . . . . . . . . . . . . . . . . . . . . . . . . . . 73
5 Proposed Admission Control Model 75
5.1 Initial strategic considerations . . . . . . . . . . . . . . . . . . . . . . . . . . . 76
5.1.1 The model underlying idea . . . . . . . . . . . . . . . . . . . . . . . . . 76
5.1.2 Initial assumptions . . . . . . . . . . . . . . . . . . . . . . . . . . . . . 78
5.2 Model architecture . . . . . . . . . . . . . . . . . . . . . . . . . . . . . . . . . 80
5.2.1 Involved research topics . . . . . . . . . . . . . . . . . . . . . . . . . . 80
5.3 Generic model operation . . . . . . . . . . . . . . . . . . . . . . . . . . . . . . 81
5.3.1 Intradomain operation . . . . . . . . . . . . . . . . . . . . . . . . . . . 81
5.3.2 End-to-end operation . . . . . . . . . . . . . . . . . . . . . . . . . . . 84
5.4 Specifying the AC model components . . . . . . . . . . . . . . . . . . . . . . . 85
5.4.1 Service classes specification . . . . . . . . . . . . . . . . . . . . . . . . 86
5.4.2 Upstream SLSs specification . . . . . . . . . . . . . . . . . . . . . . . . 87
5.4.3 Downstream SLSs specification . . . . . . . . . . . . . . . . . . . . . . 90
5.4.4 Flow specification . . . . . . . . . . . . . . . . . . . . . . . . . . . . . 90
5.4.5 Monitoring and controlling per-class QoS metrics . . . . . . . . . . . . . 91
5.5 Specifying the AC criteria . . . . . . . . . . . . . . . . . . . . . . . . . . . . . 92
5.5.1 Rate-based SLS control rules . . . . . . . . . . . . . . . . . . . . . . . . 92
5.5.2 QoS parameters control rules . . . . . . . . . . . . . . . . . . . . . . . . 94
5.5.3 End-to-end AC rules . . . . . . . . . . . . . . . . . . . . . . . . . . . . 95
5.5.4 Additional remarks on the AC criteria . . . . . . . . . . . . . . . . . . . 97
xi
CONTENTS
5.6 State information and signaling . . . . . . . . . . . . . . . . . . . . . . . . . . 98
5.6.1 State information . . . . . . . . . . . . . . . . . . . . . . . . . . . . . . 99
5.6.2 AC and monitoring signaling . . . . . . . . . . . . . . . . . . . . . . . 101
5.7 Model strengths . . . . . . . . . . . . . . . . . . . . . . . . . . . . . . . . . . 103
5.7.1 Model major key points . . . . . . . . . . . . . . . . . . . . . . . . . . 103
5.7.2 Fulfillment of initial goals . . . . . . . . . . . . . . . . . . . . . . . . . 104
5.7.3 Comparison with other measurement-based AC approaches . . . . . . . 105
5.8 Major hurdles and solutions . . . . . . . . . . . . . . . . . . . . . . . . . . . . . 107
5.8.1 Handling concurrency . . . . . . . . . . . . . . . . . . . . . . . . . . . 109
5.9 Summary . . . . . . . . . . . . . . . . . . . . . . . . . . . . . . . . . . . . . . 115
6 AC Model Implementation Issues 117
6.1 Definition of service classes . . . . . . . . . . . . . . . . . . . . . . . . . . . . 117
6.2 AC criteria parameterization . . . . . . . . . . . . . . . . . . . . . . . . . . . . 119
6.3 Monitoring decisions . . . . . . . . . . . . . . . . . . . . . . . . . . . . . . . . 121
6.4 Implementing the AC model in a simulation platform . . . . . . . . . . . . . . . 123
6.4.1 Modeling approaches . . . . . . . . . . . . . . . . . . . . . . . . . . . . 123
6.4.2 Choosing the simulation platform . . . . . . . . . . . . . . . . . . . . . 124
6.5 Simulation model . . . . . . . . . . . . . . . . . . . . . . . . . . . . . . . . . . 125
6.5.1 Simulation model internal structure . . . . . . . . . . . . . . . . . . . . 126
6.5.2 Simulation topology . . . . . . . . . . . . . . . . . . . . . . . . . . . . 128
6.5.3 Source models . . . . . . . . . . . . . . . . . . . . . . . . . . . . . . . 130
6.5.4 Service and AC Configuration . . . . . . . . . . . . . . . . . . . . . . . 131
6.6 Model validation . . . . . . . . . . . . . . . . . . . . . . . . . . . . . . . . . . 132
6.7 Additional issues on model implementation . . . . . . . . . . . . . . . . . . . . 133
6.8 Summary . . . . . . . . . . . . . . . . . . . . . . . . . . . . . . . . . . . . . . 133
xii

CONTENTS
7 Test Scenarios and Results 135
7.1 Main objectives of the tests . . . . . . . . . . . . . . . . . . . . . . . . . . . . . 136
7.2 Evaluation of the active measurement methodology . . . . . . . . . . . . . . . . 137
7.2.1 Test scenarios taxonomy . . . . . . . . . . . . . . . . . . . . . . . . . . 138
7.2.2 Tuning multipurpose probing patterns . . . . . . . . . . . . . . . . . . . 139
7.2.3 Evaluation of the estimation mechanism . . . . . . . . . . . . . . . . . . 148
7.3 Evaluation of the AC criteria . . . . . . . . . . . . . . . . . . . . . . . . . . . . 149
7.3.1 Test scenarios taxonomy . . . . . . . . . . . . . . . . . . . . . . . . . . 150
7.3.2 Test1 - Generic model operation . . . . . . . . . . . . . . . . . . . . . . 152
7.3.3 Test2 - Redefining the implicit AC criterion . . . . . . . . . . . . . . . . 158
7.3.4 Test3 - Impact of cross traffic . . . . . . . . . . . . . . . . . . . . . . . 160
7.3.5 Test4 - Redefining safety margins and thresholds . . . . . . . . . . . . . 166
7.3.6 Test5 - Impact of traffic characteristics . . . . . . . . . . . . . . . . . . . 171
7.3.7 Test6 - Impact of the measurement time interval . . . . . . . . . . . . . 177
7.4 Comparison with other AC approaches . . . . . . . . . . . . . . . . . . . . . . . 182
7.5 Scalability issues . . . . . . . . . . . . . . . . . . . . . . . . . . . . . . . . . . 183
7.6 Summary . . . . . . . . . . . . . . . . . . . . . . . . . . . . . . . . . . . . . . 184
8 Conclusions 185
8.1 Summary . . . . . . . . . . . . . . . . . . . . . . . . . . . . . . . . . . . . . . 185
8.2 Reviewing objectives and results . . . . . . . . . . . . . . . . . . . . . . . . . . 186
8.3 Main contributions . . . . . . . . . . . . . . . . . . . . . . . . . . . . . . . . . 195
8.4 Topics of future work . . . . . . . . . . . . . . . . . . . . . . . . . . . . . . . . 199
8.5 Final considerations . . . . . . . . . . . . . . . . . . . . . . . . . . . . . . . . . 203
A Summary of the Proposed Notation 205
B AC Algorithms 209
xiii

CONTENTS
C Performance Discussion of MBAC Algorithms 219
D Monitoring Applications and Tools 223
Bibliography 225
xiv

List of Figures
1.1 Model areas . . . . . . . . . . . . . . . . . . . . . . . . . . . . . . . . . . . . . 5
2.1 Edge node components . . . . . . . . . . . . . . . . . . . . . . . . . . . . . . . 15
2.2 Core node components . . . . . . . . . . . . . . . . . . . . . . . . . . . . . . . 16
2.3 Network operating planes . . . . . . . . . . . . . . . . . . . . . . . . . . . . . . 21
2.4 Diffserv service hierarchy . . . . . . . . . . . . . . . . . . . . . . . . . . . . . . 23
2.5 SLS traffic conditioning at domain entrance . . . . . . . . . . . . . . . . . . . . 25
2.6 SLS auditing . . . . . . . . . . . . . . . . . . . . . . . . . . . . . . . . . . . . 25
3.1 Intserv/Diffserv integrated solution . . . . . . . . . . . . . . . . . . . . . . . . . 36
3.2 SCORE/DPS AC approach . . . . . . . . . . . . . . . . . . . . . . . . . . . . . 38
3.3 Centralized AC using BBs . . . . . . . . . . . . . . . . . . . . . . . . . . . . . 40
3.4 Passive and active multiclass monitoring . . . . . . . . . . . . . . . . . . . . . . 42
3.5 Traffic Envelopes AC approach . . . . . . . . . . . . . . . . . . . . . . . . . . . 43
3.6 EMBAC approach . . . . . . . . . . . . . . . . . . . . . . . . . . . . . . . . . . 45
3.7 Comparison of AC approaches . . . . . . . . . . . . . . . . . . . . . . . . . . . 50
4.1 Example of a monitoring system . . . . . . . . . . . . . . . . . . . . . . . . . . 55
4.2 Delay related metrics for IPPM and ITU . . . . . . . . . . . . . . . . . . . . . . 60
4.3 Path capacity and path available bandwidth . . . . . . . . . . . . . . . . . . . . 62
4.4 Edge-to-edge multiclass active monitoring . . . . . . . . . . . . . . . . . . . . . 63
xv
LIST OF FIGURES
4.5 Time window mechanism . . . . . . . . . . . . . . . . . . . . . . . . . . . . . . 66
4.6 Proposed probing scheme . . . . . . . . . . . . . . . . . . . . . . . . . . . . . 70
5.1 Flow AC and SLS AC . . . . . . . . . . . . . . . . . . . . . . . . . . . . . . . . 78
5.2 AC model architecture . . . . . . . . . . . . . . . . . . . . . . . . . . . . . . . 80
5.3 Location of tasks in a multiclass domain . . . . . . . . . . . . . . . . . . . . . . 82
5.4 AC criterion . . . . . . . . . . . . . . . . . . . . . . . . . . . . . . . . . . . . 83
5.5 End-to-end AC operation . . . . . . . . . . . . . . . . . . . . . . . . . . . . . . 85
5.6 Domain main elements and notation . . . . . . . . . . . . . . . . . . . . . . . . 87
5.7 Explicit AC criteria summary . . . . . . . . . . . . . . . . . . . . . . . . . . . . 98
5.8 Rate-oriented credit system . . . . . . . . . . . . . . . . . . . . . . . . . . . . 112
6.1 Simulation model diagram . . . . . . . . . . . . . . . . . . . . . . . . . . . . . 127
6.2 Simulation topology . . . . . . . . . . . . . . . . . . . . . . . . . . . . . . . . . 129
7.1 Comparison of class and probing measurements (Test1 @ 2pps) . . . . . . . . . 140
7.2 Comparison of class and probing measurements (Test1 @ 192pps) . . . . . . . . 140
7.3 Comparison of class and probing measurements for SC1 (Test1 @ 2 and 24pps) . 141
7.4 Comparison of class and probing measurements for SC2 (Test1 @ 2pps) . . . . 142
7.5 Comparison of class and probing measurements for SC2 and SC3 (Test2 @ 2pps) 143
7.6 Dispersion of (a,a’) IPTD for SC3 - green and interleaved @ 24pps; (b,b’) IPLR
for SC3 - red and interleaved @ 24pps; (c,c’) IPLR for SC2 - green and inter-
leaved @ 192pps; (d,d’) ipdv for SC2 - interleaved @ 24 and 192pps . . . . . . . 144
7.7 (a) Correlation between class and probing estimates for different probing streams;
(b) IPLR error estimation . . . . . . . . . . . . . . . . . . . . . . . . . . . . . . 146
7.8 Comparison of estimation mechanisms: (a) resetting T; (b) without resetting T
on flow admittance . . . . . . . . . . . . . . . . . . . . . . . . . . . . . . . . . 148
7.9 Class mean IPTD, ipdv and IPLR . . . . . . . . . . . . . . . . . . . . . . . . . 153
7.10 Utilization and number of active flows . . . . . . . . . . . . . . . . . . . . . . . 153
xvi

LIST OF FIGURES
7.11 Results in�����
: (a) (b) IPTD and ipdv for SC1; (c) IPTD for SC2. Results at
packet level: (d) IPTD for SC2 ; (e) IPTD histogram for SC2; (f) IPLR evolution
for all classes . . . . . . . . . . . . . . . . . . . . . . . . . . . . . . . . . . . . 154
7.12 Rate estimate evolution and AC decision for SC1, SC2 and SC3 . . . . . . . . . 157
7.13 PQ effect on SC1 IPTD . . . . . . . . . . . . . . . . . . . . . . . . . . . . . . 158
7.14 SC3 behavior with SLS rate control active: (a) active flows evolution; (b) achieved
utilization (CT-I2=SC2 ; Fint1) . . . . . . . . . . . . . . . . . . . . . . . . . . . 159
7.15 Concurrent vs. cross traffic for SCi . . . . . . . . . . . . . . . . . . . . . . . . 160
7.16 Utilization for: 10% of SC2 cross traffic (left); 20% of green SC2 cross traffic
(right) . . . . . . . . . . . . . . . . . . . . . . . . . . . . . . . . . . . . . . . . 162
7.17 Class mean IPTD and IPLR for 10% of SC2 cross traffic (above); 20% of green
SC2 cross traffic (below) . . . . . . . . . . . . . . . . . . . . . . . . . . . . . . 162
7.18 Detailed analysis of IPTD for 10% of SC2 cross traffic (left); 20% of green SC2
cross traffic (right) . . . . . . . . . . . . . . . . . . . . . . . . . . . . . . . . . 163
7.19 Class Mean IPTD and IPLR for 2.5% of SC1 cross traffic (above); detailed anal-
ysis of IPTD and ipdv (below) . . . . . . . . . . . . . . . . . . . . . . . . . . . 165
7.20 Rate estimation evolution and AC decision for SC1 at ��� with ���� ������������(left)
and ����� �� ���������(right) . . . . . . . . . . . . . . . . . . . . . . . . . . . . . . . 165
7.21 Influence of varying the safety margins on the blocking probabilities, average
number of active flows, mean utilization and IPTD . . . . . . . . . . . . . . . . 167
7.22 Influence of varying the QoS thresholds on the blocking probabilities, average
number of active flows and mean utilization ( � ��� of SC2 cross traffic) . . . . . . 169
7.23 Test4.1: Class mean IPTD and IPLR for � ��� of SC2 cross traffic . . . . . . . . 170
7.24 Test4.2 vs Test4.3: IPTD and IPLR behavior for 10% of SC2 cross traffic (Fint1) 171
7.25 IPLR behavior (CT-I2 = "!$#"%&%&'(�) � ) . . . . . . . . . . . . . . . . . . . . . . . 175
7.26 Rate estimations for SC1 and CT-I2 (CT-I2 = "!$#"%&%�'(�) � ) . . . . . . . . . . . 176
7.27 Utilization for distinct �*��� �� : (left) ( 0.75; 0.90; 1.0); (right) (0.55; 0.75; 0.8) . . . 176
7.28 Influence of���+�
on the number of active flows and utilization . . . . . . . . . . . 177
xvii

LIST OF FIGURES
7.29 Influence of�����
on the rate and AC behavior for SC1 and SC2, and on the evo-
lution of active flows . . . . . . . . . . . . . . . . . . . . . . . . . . . . . . . . 178
7.30 QoS results for���+� �-,.��/
adjusting 01 ��� �� (above); not adjusting 01 ��� �� (below) . 180
7.31 Active flows for����� ��,���/
adjusting 01 �2� �� (left); not adjusting 01 ��� �� (right) . . 181
xviii

List of Tables
2.1 Service Level Agreement (SLA) template. . . . . . . . . . . . . . . . . . . . . . 22
2.2 ITU upper bounds on QoS parameters . . . . . . . . . . . . . . . . . . . . . . . 23
4.1 Quality, performance and reliability metrics . . . . . . . . . . . . . . . . . . . . 57
5.1 Common 35463 ��� 798 elements . . . . . . . . . . . . . . . . . . . . . . . . . . . . . 88
5.2 AC criteria summary . . . . . . . . . . . . . . . . . . . . . . . . . . . . . . . . 97
5.3 State information at edge nodes . . . . . . . . . . . . . . . . . . . . . . . . . . . 99
6.1 Definition of service classes . . . . . . . . . . . . . . . . . . . . . . . . . . . . 119
6.2 AC criteria parameters . . . . . . . . . . . . . . . . . . . . . . . . . . . . . . . 120
6.3 Controlled QoS and SLS parameters and corresponding metrics . . . . . . . . . 122
6.4 Network topology configuration . . . . . . . . . . . . . . . . . . . . . . . . . . 129
6.5 Traffic sources configuration . . . . . . . . . . . . . . . . . . . . . . . . . . . . 130
6.6 Service parameter configuration . . . . . . . . . . . . . . . . . . . . . . . . . . 131
7.1 SLS and QoS control . . . . . . . . . . . . . . . . . . . . . . . . . . . . . . . . 136
7.2 Test scenarios taxonomy - monitoring evaluation . . . . . . . . . . . . . . . . . 138
7.3 Test scenarios taxonomy - AC evaluation . . . . . . . . . . . . . . . . . . . . . . 150
7.4 Test results and statistics at packet level . . . . . . . . . . . . . . . . . . . . . . 156
7.5 Percentage of cross traffic . . . . . . . . . . . . . . . . . . . . . . . . . . . . . . 161
7.6 AC results for distinct source models . . . . . . . . . . . . . . . . . . . . . . . . 173
xix

LIST OF TABLES
7.7 AC results on fairness . . . . . . . . . . . . . . . . . . . . . . . . . . . . . . . . 175
7.8 Issues on the AC model scalability . . . . . . . . . . . . . . . . . . . . . . . . . 183
A.1 Model notation summary . . . . . . . . . . . . . . . . . . . . . . . . . . . . . . 207
A.2 Model notation summary (cont.) . . . . . . . . . . . . . . . . . . . . . . . . . . 208
xx

List of Acronyms
AC Admission Control
ACK Acknowledgment
AF Assured Forwarding
AFx Assured Forwarding Group
API Application Programming Interface
AQM Active Queue Management
AR Assured Rate
ARM Active Resource Management
B2Bp Back-to-back probing
BA Behavior Aggregate
BB Bandwidth Broker
BGP Border Gateway Protocol
BGRP Border Gateway Reservation Protocol
bps bits per second
BTC Bulk Transfer Capacity
CAC Connection Admission Control
CAIDA Cooperative Association for Internet Data Analysis
CBQ Class-Based Queuing
CBR Constant Bit Rate
xxi
LIST OF ACRONYMS
CDMA Code Division Multiple Access
CJVC Core-Jitter Virtual Clock
CLI Command Line Interpreter
COPS Common Open Policy Service
COPS-PR COPS Usage for Policy Provisioning
CoS Class of Service
DF Default Forwarding
DPS Dynamic Packet State
DS Differentiated Services
Diffserv Differentiated Services
DSCP Diffserv Code Point
ECN Explicit Congestion Notification
EF Expedited Forwarding
EMBAC Endpoint Measurement-based Admission Control
EPFL Ecole Polytechnique Fédérale de Lausanne
EXPOO Exponential On-Off Source
FIFO First In First Out
FTP File Transfer Protocol
GMPLS Generalized Multiprotocol Label Switching
GPS Global Positioning System
GRED Generalized Random Early Detection
H Hurst parameter
ICMP Internet Control Message Protocol
IETF Internet Engineering Task Force
Intserv Integrated Services
IP Internet Protocol
xxii
LIST OF ACRONYMS
IPDV IP Packet Delay Variation
IPER IP Packet Error Ratio
IPLR IP Packet Loss Ratio
IPOT IP Packet Octet-based Throughput
IPPM IP Performance Metrics
IPPT IP Packet Throughput
IPTD IP Packet Transfer Delay
IS Integrated Services
ISP Internet Service Provider
ITU International Telecommunications Union
ITU-T ITU - Telecommunication Standardization Sector
LRD Long Range Dependence
LSP Label Switching Path
MA Moving Average
MBAC Measurement-based Admission Control
MF Multi-Field
MIB Management Information Base
MP Measurement Point
MPLS Multiprotocol Label Switching
MTU Maximum Transfer Unit
NED Network Description Language
NIMI National Internet Measurement Infrastructure
NREN National Research and Education Network
NS Network Simulator
NSIS Next Steps in Signaling
NTP Network Time Protocol
xxiii
LIST OF ACRONYMS
OMNeT Objective Modular Network Testbed
OSPF Open Shortest Path First
OWAMP One-Way Active Measurement Protocol
OWD One-Way Delay
OWLP One-Way Loss Pattern
OWPL One-Way Packet Loss
PAR Pareto On-Off Source
PDB Per-Domain Behavior
PDP Policy Decision Point
PDR Per-Domain Reservation
PEP Policy Enforcement Point
PHB Per-Hop Behavior
PHR Per-Hop Reservation
pkt IP packet
PIA Percent IP Service Availability
PIB Policy Information Base
PIU Percent IP Service Unavailability
POI Poisson Source
pps packets per second
PPTD Packet Pair/Train Dispersion
PQ Priority Queuing
PQ-WRR Priority Queuing Weighted Round Robin
QoS Quality of Service
RFC Request for Comments
RED Random Early Detection
RIO Random Early Detection with In and Out
xxiv
LIST OF ACRONYMS
RIO-C Random Early Detection with In and Out - Coupled
RIO-DC Random Early Detection with In and Out - Decoupled
RMD Resource Management for Diffserv
RIPE-NCC Reseaux IP Europeenne Network Co-ordination Centre
RST Reset
RSVP Resource ReSerVation Protocol
RTCP Real-Time Control Protocol
RTP Real-Time Transport Protocol
RTT Round Trip Time
SAA Service Assurance Agent
SC Service Class
SIBBS Simple Interdomain Bandwidth Broker Specification
SICAP Shared-segment Interdomain Control Aggregation Protocol
SLA Service Level Agreement
SLoPS Self Loading of Periodic Streams
SLS Service Level Specification
SMT Software Management Tool
SNMP Simple Network Management Protocol
SPR Spurious IP Packet Ratio
srTCM single rate Three Color Marker
TB Token Bucket
TC Traffic Conditioning
TCA Traffic Conditioning Agreement
TCP Transmission Control Protocol
TCS Traffic Conditioning Specification
TOPP Trains of Packet Pairs
xxv

LIST OF ACRONYMS
ToS Type of Service
trTCM two rate Three Color Marker
TSWTCM Time Sliding Window Three Color Marker
TTM Test Traffic Measurements
TW Time Window
UDP User Datagram Protocol
VC Virtual Clock
VINT Virtual InterNetwok Testbed
VoIP Voice over IP
VPS Variable Packet Size
VTRS Virtual Time Reference System
VW Virtual Wire
WFQ Weighted Fair Queuing
WG Working Group
WRED Weighted Random Early Detection
WRR Weighted Round Robin
WWW World Wide Web
XML Extensible Markup Language
xxvi
Chapter 1
Introduction
Communication networks have been following a clear trend toward the integration of current and
emerging applications and services with distinct Quality of Service (QoS) requirements. This in-
tegration process, ranging from personal to local and wide area environments, constitutes a major
challenge as it spans protocol stacks orthogonally, imposing new demands from application to
physical layers. From the network perspective, the Internet Protocol (IP), due to its well-known
characteristics (e.g., simplicity, robustness, maturity), worldwide use and current advances, has
been recognized as the level at which network convergence tends to occur. However, it is also
well-known that the default best-effort service upon which the Internet is based neither offers
QoS guarantees nor consistent solutions to differentiate traffic, becoming insufficient to accom-
modate the heterogeneity of Internet traffic. Service providers also face an increasing concern
and pressure regarding the provision of QoS in their infrastructures, motivated not only by user
demands but also by improving services’ quality and diversity in a competitive and cost-effective
manner. The ability to differentiate traffic will allow introducing QoS-oriented business relation-
ships and pricing models, supported by the establishment of Service Level Agreements (SLAs)
and corresponding Service Level Specifications (SLSs). In addition, defining standard SLA/SLSs
is a key aspect for interdomain and end-to-end QoS delivery [1, 2].
Supporting the coexistence of heterogeneous applications and services in the Internet has
been fostering the evolution of the underlying protocol stack. The research community has been
making strong efforts to endow the TCP/IP stack with new service models, enhanced protocols
and mechanisms to allow such integration. The QoS quest will not certainly be based on a single
and general-purpose solution due to the diversity of technologies, administrative policies and
strategies in the field [3]. Each solution requires the assessment of aspects such as its cost of in-
1
CHAPTER 1. INTRODUCTION
tegration into (or migration of) the existing network infrastructure, the QoS guarantees provided
or the scalability of the solution. Class of Service (CoS) networks, where flows with similar
characteristics and service requirements are aggregated in the same class, are a step forward in
pursuing scalable QoS solutions. In this context, the Differentiated Services (Diffserv) model
[4, 5] has deserved special attention both from the scientific community and industry due to the
acceptable trade-off between complexity and QoS guarantee levels, and to the ability to coexist
with traditional best-effort IP networks.
Introducing specific QoS control mechanisms into IP networks is, however, a controversial
issue. Actually, overprovisioning of communication resources is a common way to provide QoS
in network backbones, avoiding or reducing network control complexity. Although for some
service providers overprovisioning might be an attainable solution, it should not be assumed
as a generic and permanent answer [6, 7]. In fact, apart from not being widely available, the
huge growth of users and applications’ demands requires additional service and traffic control
mechanisms in order to guarantee that QoS commitments are honored. Despite this need, a
major objective to keep in mind, and likely a key aspect for their deployment in real networks, is
to maintain the network control plane complexity as low as possible.
1.1 Motivation and objectives
As mentioned above, the support of multiconstrained applications in the Internet launches new
demands and challenges on the provision and management of network services and underlying
resources. Service-oriented traffic control mechanisms, operating with minimum impact on net-
work performance, assume a crucial role as regards controlling services quality and network re-
sources transparent and efficiently. Within traffic control mechanisms, Admission Control (AC)
is recommended for keeping service classes under controlled load and assuring the required QoS
levels [3, 8, 9]. In fact, controlling the admission of flows entering the network and sharing a
service class aims at avoiding overutilization of existing resources, satisfying the requirements
of new incoming traffic flows without compromising the QoS of already active flows and, gener-
ically, preventing instability and congestion assuring QoS and SLSs fulfillment.
In general, the QoS guarantees and predictability required by a service class determines the
control complexity inherent to an AC strategy. To obtain a good compromise between service
guarantees, complexity and efficient resource utilization is, in fact, a major challenge. This
challenge is increased when considering the end-to-end QoS delivery as multiple heterogeneous
2
1.1. MOTIVATION AND OBJECTIVES
domains may be involved and the negotiated SLSs’ between them need to be fulfilled.
Although AC has been extensively studied in the literature, few studies deal with the simul-
taneous management of domain QoS levels and interdomain SLSs, falling short in establishing
and formalizing concrete and flexible AC equations to be applied to multiservice networks. As
detailed later in Chapter 3, common AC approaches do not contemplate or balance as a whole
aspects such as: (i) the trade-off between service assurance level and network control complex-
ity; (ii) the flexible support of distinct service types; (iii) the simultaneous control of QoS levels
and existing SLSs; (iv) the AC operation both intradomain and end-to-end. Attending to these
aspects, handling AC in multiservice class-based networks is still an open research topic and it
is within this context that the motivation for the present work lays on. Hence,
the main objective of this work is to devise an encompassing, flexible and lightweight
AC model able to control QoS and SLSs in multiclass and multidomain environments.
In this way, the AC model should contemplate: (i) the control of distinct network services and
assurance levels, supporting applications with different QoS requirements and traffic profiles; (ii)
the intradomain and end-to-end operation, controlling both the QoS levels in a domain and the
share of existing SLS between domains, to fulfill the applications’ end-to-end QoS requirements.
Apart from covering multiservice and multidomain operation, the simplicity, flexibility, easy
deployment and integration in the Internet are considered relevant goals in the model design.
The aim is to accomplish AC without adding significant complexity to the network control plane,
requiring reduced state information and minor changes to the network. This will also contribute
for the efficiency and scalability of the solution. The flexibility of the proposal regards its ability
to accommodate the evolution of services, applications and technologies easily. All these goals
are relevant when deploying the model in large scale across multiple administrative domains
relying, eventually, on distinct QoS solutions.
Considering the above reasoning, a new AC model is proposed for controlling services quality
in multiclass IP networks. An important underlying idea driving the model operation is to take
advantage of the consensual need for on-line service monitoring and for traffic control at network
domain boundaries, using the resulting monitoring information to perform distributed AC. In
more detail, the proposed AC model follows a distributed architecture where AC decisions are
driven by feedback from systematic edge-to-edge measurements of relevant QoS parameters
for each service type and SLSs utilization. While ingress nodes perform implicit or explicit
3

CHAPTER 1. INTRODUCTION
AC1 resorting to service-dependent rules for QoS and SLS control, egress nodes collect service
metrics providing them as inputs for AC. To improve the trade-off between complexity and QoS
assurance, the AC criteria comprise service-dependent degrees of overprovisioning in order to
simplify AC while improving QoS guarantees. The end-to-end operation is viewed as a repetitive
process of AC at each domain ingress nodes and cumulative computation of the service metrics
available at each domain.
The proposed AC model being distributed, service-oriented, based on per-class on-line mon-
itoring and involving only edge nodes should be able to abstract network core complexity and
heterogeneity, to sense each service classes’ dynamics and to perform AC with reduced state
information, latency and overhead. These characteristics are expected to contribute to pursue the
goals outlined above. However, a fundamental question raising from the model properties is the
following:
Will service-dependent AC rules driven by edge-to-edge on-line monitoring be able
to control distinct QoS guarantees and SLSs commitments properly?
Thus, after defining the AC model conceptually, to provide a proof-of-concept of the proposed
solution, illustrating its self-adaptive ability in controlling QoS and SLSs in a multiclass domain,
is another major objective to fulfill. In this way,
this work also intends to explore the challenges of implementing the proposed AC
model, assessing its effectiveness and efficiency in satisfying each service class QoS
levels and existing SLSs commitments.
Attending to the properties of the AC model outlined above, four main areas have been identified
as relevant to devise a realistic and consistent AC solution. These interrelated areas, according
to Figure 1.1 [10], are as follows: (i) service definition, which involves the definition of pa-
rameters and semantics of SLSs and of basic services adapted to different application types; (ii)
on-line monitoring, which keeps track of QoS and SLS status in the domain; (iii) AC decision
criteria, which involves the establishment of service-dependent AC equations; (iv) CoS traffic
characterization, which provides the knowledge of the statistical properties of the traffic classes
in the domain as a result of aggregation. The present study covers recent research on these areas,
1Within AC context, the term explicit is commonly used to express the existence of signaling between theapplication and the network. When this signaling is not present, AC is based on an implicit detection of flows.
4

1.1. MOTIVATION AND OBJECTIVES
Model
On-line Monitoring
ACAC Decision
Service Definition
Rules
Security Issues
Policy Based Management
CharacterizationCoS Traffic
Figure 1.1: Model areas
contributing with new insights for managing intra and interdomain services quality and AC op-
eration. The use of policy-based network management and security considerations were left for
further study.
In order to pursue the main objectives stated above, and considering the interrelated areas
identified, a more detailed view over the problem to solve has led to the following objectives:
(i) contextualize and clarify the underlying concepts of class-based IP networks - within CoS
paradigm, the Diffserv model is considered a reference model, justifying the review of the
main principles and components behind this model;
(ii) identify and structure the main issues and tasks subjacent to the definition and building of
network services both intra and interdomain - in this context, the important role of estab-
lishing and standardizing SLA/SLS for domain QoS provisioning, interdomain negotiation
and end-to-end QoS delivery is an important topic to consider;
(iii) survey existing AC proposals, covering their main characteristics, advantages and limita-
tions - this analysis is of paramount importance as it grounds the motivation for the present
research study, pointing out the main strategic directions to achieve a new AC model with
the defined properties;
(iv) identify and study the main issues and recent developments related to the problematic of
QoS monitoring - this includes the identification of relevant metrics of network perfor-
mance, adequate measurement methodologies and timing issues. Special attention will be
5

CHAPTER 1. INTRODUCTION
given to QoS monitoring solutions to be deployed in multiservice CoS networks. This ob-
jective also involves evaluating the adequacy and effectiveness of multiclass measurement
methodologies in capturing each class QoS behavior;
(v) understand and characterize statistically the properties of Internet traffic under the CoS
paradigm - this characterization, both at individual and aggregated level, intends to provide
important inputs for service provisioning and for establishing and parameterizing service-
dependent AC equations;
(vi) conceive and specify a new AC model for the control of QoS and SLSs in multiservice CoS
networks - this includes defining the model’s architecture, specifying its entities, formaliz-
ing service-dependent AC criteria and describing the model’s operation both intradomain
and end-to-end;
(vii) implement a simulation prototype of the proposed AC model covering a single multiclass
domain - the configuration of this prototype should take as inputs the research outcome
deriving from the fulfillment of the objectives defined above;
(viii) provide a proof-of-concept of the proposed AC model - this involves testing and evaluating
the performance of the AC model, assessing its ability to self-adapt to network dynamics
and to assure QoS and SLS commitments in a multiclass domain efficiently;
(ix) perform an analysis of the proposed AC model - this analysis should point out the main
strengths and limitations of the present work, prompting future research steps and oppor-
tunities.
1.2 Research methodology
The research methodology to pursue the main objective of this work comprises several steps
somehow evinced by the list of objectives defined above. Firstly, considering the main research
areas subjacent to the proposed AC model, relevant literature covering the major developments
in each of these areas is surveyed. This bibliographic search and review allows a comprehen-
sive analysis of the current state-of-the-art in those areas, grounding the conceptual and practical
decisions made. This review is organized to provide the readers with the necessary theoretical
concepts and background for a self-contained understanding of this work. Secondly, a new AC
model is devised and its main entities and rules specified. In order to provide a proof-of-concept
6

1.3. SUMMARY OF MAIN CONTRIBUTIONS
of the new proposal, the AC model is implemented and evaluated resorting to a simulation envi-
ronment. In the context of computer communications research, when an experimental validation
using real networks is premature or unfeasible, simulation modeling is commonly used. In fact,
the flexibility of a simulation environment in setting up a wide range of distinct test scenar-
ios and accommodating model improvements easily, makes it very appealing as a validation
methodology that should precede the deployment and ultimate validation in real environments.
The simulation model has itself to undergo a validation process for verifying its consistency and
correct behavior.
1.3 Summary of main contributions
Although a full discussion on this thesis is included in the concluding chapter, this section pro-
vides a brief overview of its main contributions. Taking into account the initial objectives defined
above, these contributions are summarized as follows:
: definition of a new encompassing and lightweight AC model for controlling QoS and SLSs
in multiservice IP networks based on the CoS paradigm [11, 12, 13, 10, 14]. In this context,
other contributions include:
– definition of service-dependent AC criteria based on complementary rules - QoS con-
trol rule, SLS rate control rule and end-to-end control rule - parameterized according
to each service type characteristics;
– introduction of an intuitive and expressive notation based on set theory in order to
specify the main network domain entities, the service-dependent AC criteria and the
model operation both intra and interdomain [11];
– development of a simulation prototype comprising a multiclass domain controlled by
the proposed AC model, configured considering and interrelating realistic inputs and
guidelines from the related research areas;
– a proof-of-concept regarding the model’s ability to perform an effective and efficient
distributed control of QoS and SLSs using edge-to-edge on-line monitoring feedback;
– several proposals for handling concurrent AC in order to tackle eventual over or false
acceptance deriving from distributed and concurrent AC decisions [15];
7

CHAPTER 1. INTRODUCTION
: introduction of the concept of multipurpose active monitoring and development of a new
multipurpose colored probing scheme [16, 17];
: proposal of an integrated SLA/SLS template and additional insights on scalable SLS moni-
toring and auditing tasks [11, 14]. Ongoing work on SLSs topic respects to SLS processing
and validation [18];
: definition of a traffic classification criterion and first results on CoS traffic characterization
[19], following the work initially carried out in [20];
: comprehensive survey of conceptual and practical issues on major areas supporting the
proposed AC model, covering (i) multiservice CoS networks and service definition; (ii) AC
in multiservice networks; (iii) QoS and SLS monitoring; (iv) CoS traffic characterization.
1.4 Dissertation layout
This dissertation is structured in eight chapters reflecting the research work carried out facing the
objectives outlined in Section 1.1.
In the present Chapter 1 - Introduction - a first positioning of the reader in the area of research
is provided, highlighting current trends and evolution. Then, the motivation for this thesis is
justified and the main objectives of the work are defined. The main contributions to the research
field are also summarized. The dissertation layout is included here in order to provide a global
view of the full document, regarding its contents and organization.
In Chapter 2- Multiservice Class-based IP Networks - the motivation for adopting multiser-
vice networks based on CoS paradigm is introduced, centering the discussion on IP networks. In
this context, the Diffserv model is taken as reference being its architecture, principles and main
components summarized. Then, the debate is focused on how to define and build distinct ser-
vice classes, highlighting the relevance of specifying service level agreements both from an intra
and interdomain perspective. A template for SLA/SLSs is proposed and additional deployment
issues regarding SLSs control are discussed. The motivation for studying traffic characteristics
within CoS networks is presented.
In Chapter 3 - Admission Control in CoS IP Networks - after exploring the need for AC in
multiservice networks, a detailed study covering current AC approaches is carried out, giving
special emphasis to proposals for class-based IP networks. For the most prominent proposals,
8

1.4. DISSERTATION LAYOUT
their AC architectural principles, characteristics and operation mode are surveyed, and their main
virtues and limitations identified. This analysis, involving a careful assessment of the trade-off
between QoS guarantees and complexity, has grounded the motivation for devising a new AC
model for multiservice class-based IP networks.
In Chapter 4 - Monitoring QoS and SLSs - the problematic of QoS and SLSs monitoring in
multiservice networks is covered. This study is entirely justified by the inherent on-line monitor-
ing approach upon which the proposed AC model is based. The main characteristics of monitor-
ing systems are identified and the definition of concrete metrics and measurement methodologies
for QoS and SLS monitoring are presented. Particular relevance is given to active measurement
methodologies, debating their ability to fulfill edge-to-edge on-line QoS monitoring efficiently.
In this context, the concept of multipurpose probing is introduced and a new probing scheme is
presented.
In Chapter 5 - Proposed Admission Control Model - a novel service-oriented distributed AC
model for controlling QoS and SLSs in multiclass and multidomain environments is proposed.
After highlighting its major goals and assumptions, the model architecture is presented focusing
on the main conceptual areas and components this model comprises and interrelates. An intuitive
and expressive notation is also introduced to sustain a clear definition of relevant multiservice
domain entities and to specify the AC decision equations and model operation. An introspective
analysis of the AC model is performed, identifying its conceptual merits and hurdles, pointing
out possible ways to overcome the latter. In particular, the problematic of concurrent AC is
debated.
In Chapter 6 - AC Model Implementation Issues - the main aspects concerning the imple-
mentation of the proposed AC model are identified and discussed. Aspects such as defining the
characteristics of the service classes and corresponding control policies, the AC criteria configu-
ration, the QoS and SLS parameters to monitor and the measurement methodologies to apply are
covered, taking into account an analysis of current work and guidelines on these topics. Issues
regarding the implementation and validation of a simulation prototype comprising the proposed
AC model, using the Network Simulator (NS-2), are also discussed in this chapter.
In Chapter 7 - Test Scenarios and Results - several test scenarios are introduced in order to
evaluate the monitoring strategy and the proposed AC model. In more detail, the suitability and
effectiveness of multiclass and multipurpose QoS monitoring are assessed and the performance
of the implicit and explicit AC criteria in granting QoS and SLSs commitments is evaluated.
The obtained results include, whenever appropriate, an analysis of the AC model performance at
9

CHAPTER 1. INTRODUCTION
class and packet level.
In Chapter 8 - Conclusions - an overview of the present research work is presented, conclud-
ing on to what extent the objectives defined initially have been accomplished. This chapter also
presents the main contributions of this thesis, providing future research directions based on a
critical analysis of the work carried out.
10
Chapter 2
Multiservice Class-based IP Networks
The support of multiple applications and services with distinct QoS requirements constitutes
a challenge spanning different communication levels, ranging from low-level technologies to
application level protocols. Facing this challenge, the research community and, in particular,
the IETF have put forward several proposals to enhance the TCP/IP stack to provide adequate
QoS levels in the Internet1. Important examples of these proposals include Integrated Services
(Intserv) [23], Differentiated Services (Diffserv) [4, 5, 24], QoS-based Routing [25, 26], Mul-
tiprotocol Label Switching (MPLS) [27], Traffic Engineering (TE) [21] and specific protocols
such as Resource ReSerVation Protocol (RSVP) [28] and Real-time Transport Protocol (RTP)
[29]. These solutions are not mutually exclusive, i.e., they can be adopted complementary to en-
hance networks’ QoS functionality [30, 31, 32, 33]. At lower level, QoS-oriented technologies
such as IEEE 802.1Q/D/p [34, 35] and Asynchronous Transfer Mode (ATM) [36, 37] can also
be adopted complementary.
As mentioned in Chapter 1, the end-to-end QoS panacea will not be based on a one-size-
fits-all solution attending to the diversity of business goals and technologies available. When
assessing each solution’s feasibility, the network integration or migration costs, the provided
1The designation “Quality of Service” (QoS) can be contextualized at multiple protocol layers. From a network-oriented perspective, QoS expresses the performance and guarantee levels to be provided by the network to satisfythe requirements of applications and services. In this way, these requirements, expressing user-oriented QoS param-eters (objective or subjective), need to be mapped into quantifiable network performance parameters (objective) suchas delay, jitter, loss and bandwidth. To measure and quantify these parameters both ITU-T and IETF have defineda set of concrete metrics (see Chapter 4), which specify the parameters in terms of standard units of measurement[21, 22].
In the present work, following common relaxed terminology, “QoS parameters”, “QoS metrics” and “SLS met-rics” are generically adopted in the context of network services’ performance.
11
CHAPTER 2. MULTISERVICE CLASS-BASED IP NETWORKS
QoS levels and scalability, i.e., the ability of being deployed and used in a large scale, need to
be considered. Due to the good compromise established among these aspects, multiservice net-
works following a CoS paradigm have gained increased support from the scientific community,
service providers and industry, in disregard of networks following a flow-based paradigm. In
fact, aggregating traffic flows into a limited number of service classes according to their QoS
requirements is simpler to manage and more scalable than handling a large number of individual
flows. For the reasons pointed out, the AC model proposed in this work is essentially oriented
to multiservice class-based IP networks, where the Diffserv architecture is taken as a reference
model. Nevertheless, the proposed AC model can be applied to other CoS architectures than
Diffserv.
In this chapter, the essential principles and components of Diffserv model are briefly pre-
sented. Then, the problematic of defining service classes and corresponding QoS characteristics
is debated, with particular emphasis on specifying SLAs/SLSs. Handling SLSs is a key aspect
for establishing the services to be supported at each network domain, for facilitating interdomain
negotiation and for deploying of end-to-end services. This chapter ends with a discussion on the
relevance of knowing the statistical properties of network traffic from a service class perspective.
2.1 The Differentiated Services model
The Diffserv model aims at providing the support for scalable service differentiation in the In-
ternet, overcoming the large-scale implementation and deployment difficulties inherent to flow-
based QoS models such as Intserv [38, 30]. The main principles behind the Diffserv model are
handling network traffic aggregates, establishing traffic priority schemes in network nodes and
bringing the traffic control complexity to network edges, keeping the network core simple for fast
packet forwarding. In this model, traffic belonging to different flows is grouped or aggregated
into a small number of classes of service according to their QoS requirements. To each class
will correspond a set of rules and mechanisms that will determine the network service quality
to be provided. Network traffic is classified and then marked accordingly using a specific field
of the IP header - the DS-field [24], which corresponds to the fields Type of Service (ToS) in
IPv4 and Traffic Class in IPv6. This identifier determines the treatment, called Per-Hop Behav-
ior (PHB) [4], a packet will receive in each network node. Extending this concept, a Per-Domain
Behavior (PDB) [39] is the treatment given to a set of packets with the same mark (traffic aggre-
gate) along a Diffserv domain.
12

2.1. THE DIFFERENTIATED SERVICES MODEL
The establishment of a Service Level Agreement (SLA) between the customer and the service
provider allows to specify the required service level and the traffic conditioning rules to apply
at network boundaries, i.e., the Service Level Specification (SLS) and its corresponding Traffic
Conditioning Specification (TCS) [4, 5]2. The support of services spanning multiple domains
involves the existence of SLAs between peering domains.
Although the definition of a traffic differentiation scheme based on IP header marking is not
a new concept [40], the Diffserv model has gone further in defining a set of network key compo-
nents such as traffic classification and conditioning functions and PHBs [4], to build a coherent
service differentiation architecture, bringing a new stamina for using IP type of service marks.
Intentionally, in many aspects, Diffserv provides recommendations to support service differen-
tiation disregarding implementation details. More recently, concrete and practical configuration
guidelines for Diffserv service classes have been proposed in [41, 9]. The definition of standard
SLSs, discussed later in Section 2.2, are also considered an important step for consistent QoS
delivery intradomain and end-to-end.
2.1.1 Model components and operation
To support a scalable service differentiation in a domain, the Diffserv model resorts to traffic
classification and traffic conditioning functions strategically located and to adequate queuing
mechanisms so that the expected PHBs are obtained. In order to impose a specific and distinct
treatment on each service class traffic aggregate, a multiple queuing system comprising, for in-
stance, a QoS-aware scheduling mechanism and active queue management techniques is usually
adopted.
The traffic classification process consists of identifying and selecting packets according to a
given set of rules. These rules can be established either based on IP packet header and payload
information - Multi-Field (MF) classification, such as the source and destination IP addresses,
source and destination ports, protocol, etc., or based on the DS-field - Behavior Aggregate (BA)
classification. While the former is likely to occur at network entrance (end-systems, leaf routers
or first ingress router) and is usually needed to perform the initial DS-field marking, i.e., to set the
Diffserv Codepoint (DSCP), the latter is applied at domain core nodes and other edge/boundary
nodes to packets already marked. In summary, while MF classification is usually applied to in-
dividual flows, BA classification is applied to individual or traffic aggregates already marked. In
2In [5], the designations SLS and TCS were proposed instead of SLA and TCA (Traffic Conditioning Agree-ment), as these last ones include several aspects not covered in Diffserv such as pricing.
13
CHAPTER 2. MULTISERVICE CLASS-BASED IP NETWORKS
multidomain operation, the DSCP may need to change along the packet’s route, for instance, due
to service mapping required at domains’ boundaries. This may involve a simple BA classification
and DSCP update or a new MF classification according to internal policies in the new domain.
Traffic classification criteria issues are further detailed in Section 2.1.1.
The traffic conditioning (TC) process involves several functions to ensure that traffic enter-
ing or leaving a Diffserv domain is in compliance with the traffic profile defined or negotiated
within the SLS. In particular, TC entities such as markers, meters, droppers or shapers are used
to enforce TC rules so that the traffic profile is in conformity. The classifying rules and TC
rules are defined in the TCS section included in the SLS. According to [4], (i) a marker sets or
updates the DS-field to a particular DSCP; (ii) a meter measures the temporal properties of a
classified traffic stream, verifying traffic conformance, identifying packets in-profile or out-of-
profile and triggering marker, shaper or dropper actions accordingly; (iii) a shaper regulates a
traffic stream and may delay packets in order to adjust its temporal characteristics to a defined
profile; (iv) a dropper performs the discarding of packets to prevent out-of-profile traffic from
entering a network. The action on non-conforming traffic is strongly dependent on the service
type, for instance, out-of-profile packets can be either instantaneously dropped or remarked with
a high drop precedence to increment their dropping probability inside the class or remarked to
suffer a service class downgrade. In practice, although these basic TC functions are conceptually
distinct, from an implementation perspective, they are usually grouped to perform, for instance,
policing at domain network entrance and shaping at network exit. Examples of commonly used
policers/markers are the single rate Three Color Marker (srTCM), two rate Three Color Marker
(trTCM) and Time Sliding Window Three Color Marker (TSWTCM) [42, 43, 44], while common
shapers are the Token Bucket (TB) and the Leaky Bucket [45]. The description and enforcement
of the SLS traffic profile resorting to a TB policer is also common.
In order to be a scalable architecture, Diffserv demanding functions such as MF classifica-
tion and traffic conditioning are performed at the network edge, leaving the network core simple.
Core routers have essentially to deal with BA classification, queuing and forwarding packets ac-
cording to the corresponding PHB. As described above, BA classification is substantially simpler
than MF classification as it works on traffic aggregates using a single header field. Generically,
queuing consists of packet buffering, discarding and scheduling. Thus, resorting to appropriate
buffer allocation, buffer management and scheduling mechanisms, PHBs can be implemented
as required. In order to implement distinct CoS, traffic is usually divided into separate queues
and handled by a service discipline which dispatches traffic according to its QoS constraints. In
opposition to First In First Out (FIFO), which in itself is not oriented to traffic differentiation,
14
2.1. THE DIFFERENTIATED SERVICES MODEL
examples of CoS-oriented queuing systems are Priority Queuing (PQ), Class-based Queuing
(CBQ), Weighted Fair Queuing (WFQ) , Weighted Round Robin (WRR) or hybrid systems such
as Priority Queuing Weighted Round Robin (PQ-WRR)3. Multiconstrained QoS scheduling ap-
proaches dealing with bandwidth, delay and loss differentiation may also be in place [47, 48, 49].
In addition, Active Queue Management (AQM) mechanisms are used to prevent queue conges-
tion by discarding packets according to a particular criterion, combining usually queue thresholds
with packet drop probabilities. They aim to avoid congestion and the undesirable effects of drop-
ping packets of the queue tail in case of queue congestion [50]. Initially proposed by Floyd and
Jacobson [51], Random Early Detection (RED) algorithm is a reference in this context. Several
RED variants have been proposed and adopted by the research community and, in particular,
RED extensions to a multilevel RED are suitable to deal with multiple drop precedences in a
single service class. A comparative study of RED variants including Weighted RED (WRED),
Generalized RED (GRED), Random Early Detection In and Out - Coupled (RIO-C) and RIO
-Decoupled (RIO-DC) is presented in [52].
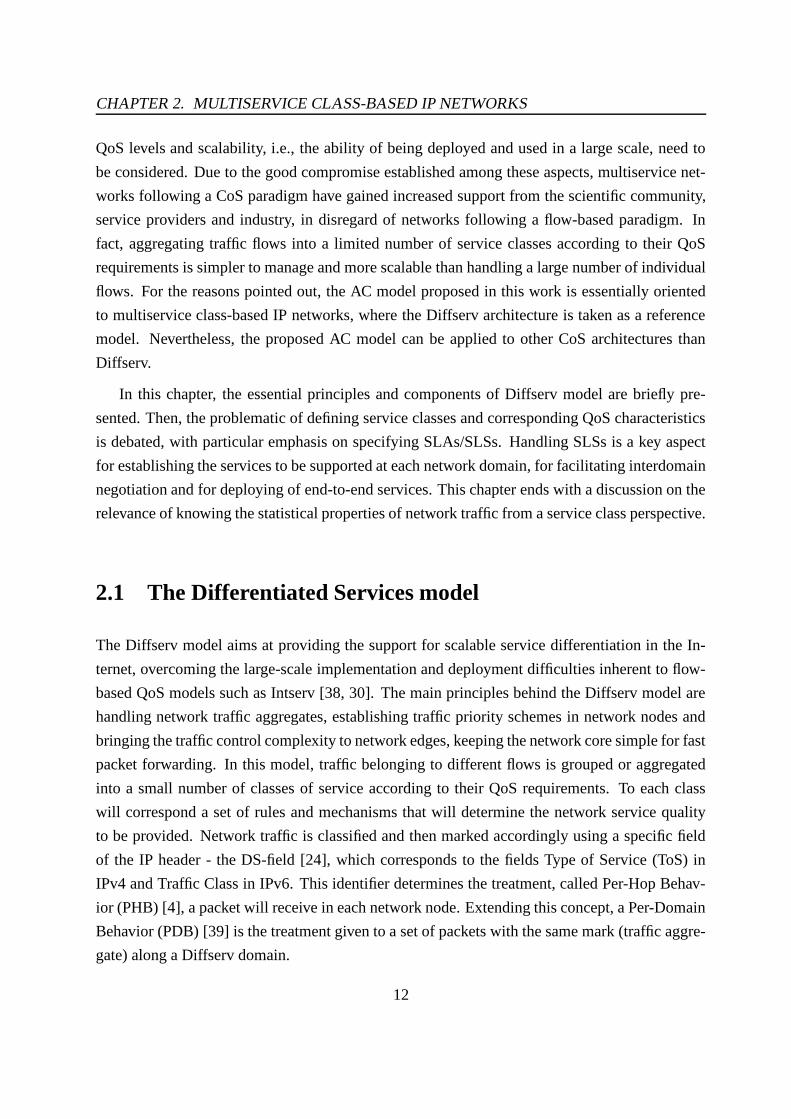
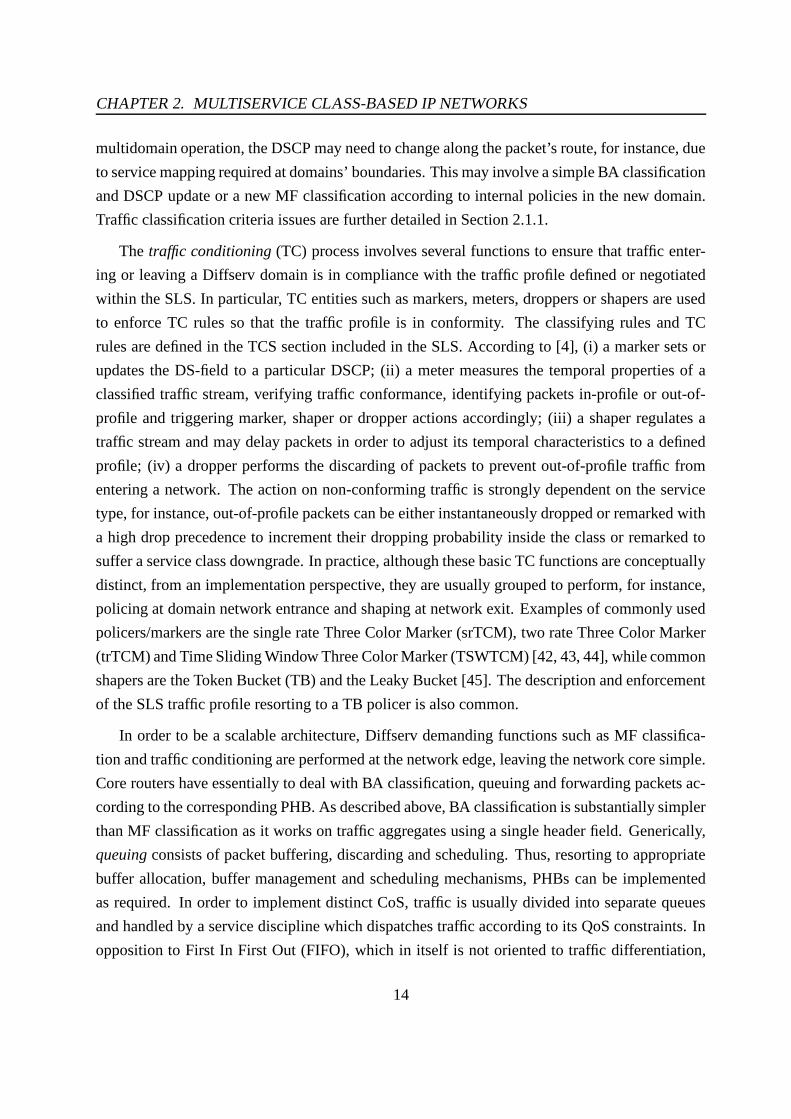
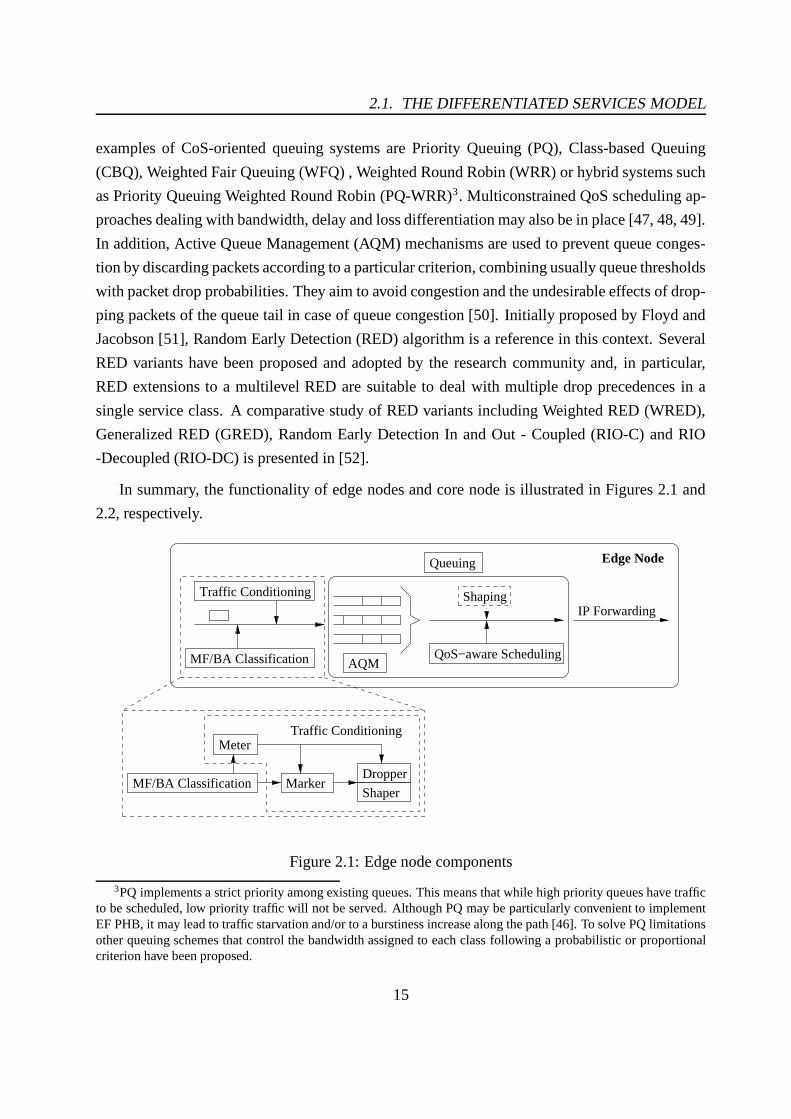
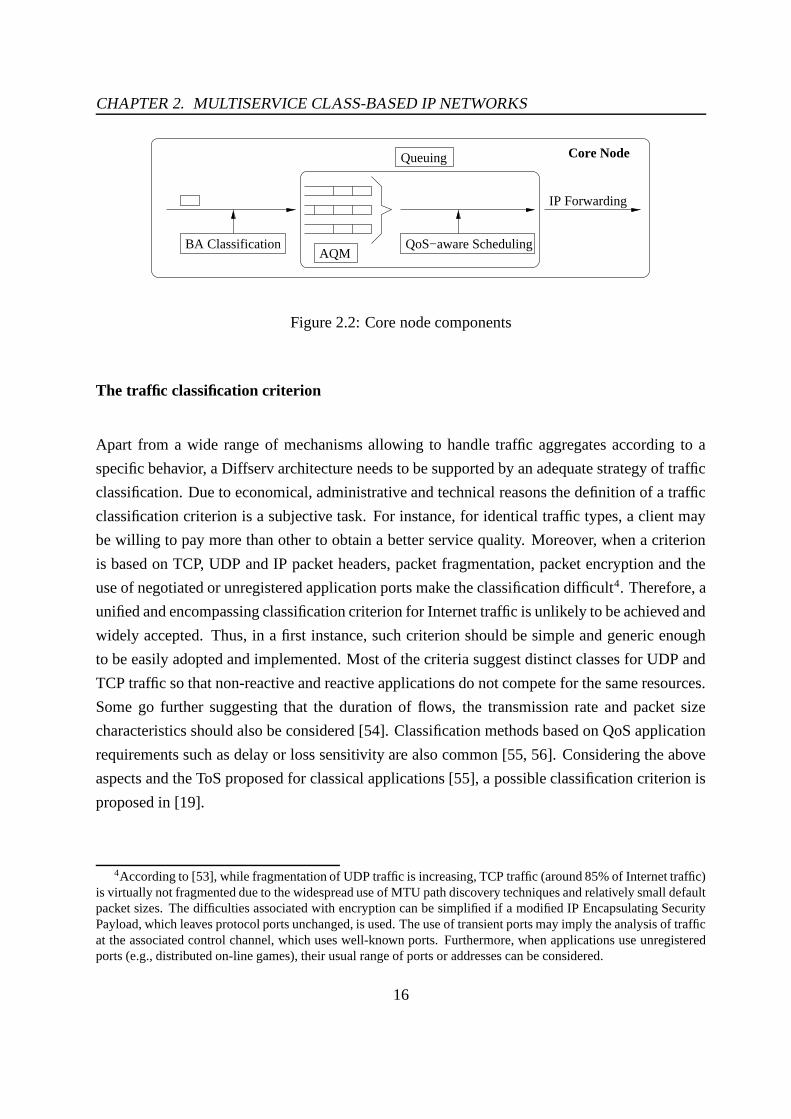
In summary, the functionality of edge nodes and core node is illustrated in Figures 2.1 and
2.2, respectively.
AQMQoS−aware Scheduling
Queuing
Meter
MarkerDropper
Shaper
IP Forwarding
Edge Node
MF/BA Classification
Shaping
Traffic Conditioning
MF/BA Classification
Traffic Conditioning
Figure 2.1: Edge node components
3PQ implements a strict priority among existing queues. This means that while high priority queues have trafficto be scheduled, low priority traffic will not be served. Although PQ may be particularly convenient to implementEF PHB, it may lead to traffic starvation and/or to a burstiness increase along the path [46]. To solve PQ limitationsother queuing schemes that control the bandwidth assigned to each class following a probabilistic or proportionalcriterion have been proposed.
15
CHAPTER 2. MULTISERVICE CLASS-BASED IP NETWORKS
BA ClassificationAQM
QoS−aware Scheduling
Queuing
IP Forwarding
Core Node
Figure 2.2: Core node components
The traffic classification criterion
Apart from a wide range of mechanisms allowing to handle traffic aggregates according to a
specific behavior, a Diffserv architecture needs to be supported by an adequate strategy of traffic
classification. Due to economical, administrative and technical reasons the definition of a traffic
classification criterion is a subjective task. For instance, for identical traffic types, a client may
be willing to pay more than other to obtain a better service quality. Moreover, when a criterion
is based on TCP, UDP and IP packet headers, packet fragmentation, packet encryption and the
use of negotiated or unregistered application ports make the classification difficult4. Therefore, a
unified and encompassing classification criterion for Internet traffic is unlikely to be achieved and
widely accepted. Thus, in a first instance, such criterion should be simple and generic enough
to be easily adopted and implemented. Most of the criteria suggest distinct classes for UDP and
TCP traffic so that non-reactive and reactive applications do not compete for the same resources.
Some go further suggesting that the duration of flows, the transmission rate and packet size
characteristics should also be considered [54]. Classification methods based on QoS application
requirements such as delay or loss sensitivity are also common [55, 56]. Considering the above
aspects and the ToS proposed for classical applications [55], a possible classification criterion is
proposed in [19].
4According to [53], while fragmentation of UDP traffic is increasing, TCP traffic (around 85% of Internet traffic)is virtually not fragmented due to the widespread use of MTU path discovery techniques and relatively small defaultpacket sizes. The difficulties associated with encryption can be simplified if a modified IP Encapsulating SecurityPayload, which leaves protocol ports unchanged, is used. The use of transient ports may imply the analysis of trafficat the associated control channel, which uses well-known ports. Furthermore, when applications use unregisteredports (e.g., distributed on-line games), their usual range of ports or addresses can be considered.
16
2.1. THE DIFFERENTIATED SERVICES MODEL
2.1.2 Building services in Diffserv
In Diffserv networks, services are provided using traffic classification and traffic conditioning
functions at network boundaries coupled with the concatenation of PHBs along the transit path
[4]. While the term per-hop behavior is used to describe a behavior in a single node, the concept
describing the behavior experienced by a particular set of packets, i.e., a traffic aggregate, across
a Diffserv domain has been defined by the IETF as a per-domain behavior [39]. These concepts
are introduced and detailed next.
Per-Hop Behaviors
According to [4], a PHB is a description of the externally observable forwarding behavior (e.g.,
loss, delay, jitter) of a Diffserv node applied to a particular traffic aggregate. A PHB determines
how node resources are allocated to traffic aggregates, being the basis to construct differentiated
services. The IETF has proposed the Expedited Forwarding PHB (EF PHB) and the Assured
Forwarding PHB Group (AF PHB), besides the Default Forwarding (DF) PHB, in which the
best-effort service behavior is mapped.
The EF PHB [57, 58] can be used to build services requiring low loss, low delay, low jitter and
assured bandwidth. To obtain this behavior, the queues encountered by EF packets are expected
to be short or almost empty. Hence, the service rate of EF packets on a given output interface
needs to exceed their arrival rate at that interface over long and short time intervals, independently
of the remaining non-EF traffic load. Giving the high priority treatment EF traffic receives and
the high QoS guarantees provided, the access to service classes based on EF PHB has to be
tightly controlled with severe treatment on out-of-profile traffic, e.g., dropping it. The EF PHB
has been initially defined in [59], where an high-level description of EF PHB was provided.
More recently, [57] goes further on EF behavior formalization, defining two types of equations,
the “aggregate behavior” equations describing the properties of the service delivered to the EF
aggregate by the node, and the “packet-identity-aware” equations that bound individual packet
delay knowing the operating conditions of the node. Due to its service characteristics, EF PHB is
oriented to support applications and services highly QoS demanding, e.g., requiring a dedicated
point-to-point connection or virtual leased line. The viability of deploying these services in the
Internet is, however, a controversial topic [60, 61].
The AF PHB [62] group consists of four classes (AF1x to AF4x) representing four assurance
levels of packet forwarding. There are three drop precedence levels per AF class which will help
17

CHAPTER 2. MULTISERVICE CLASS-BASED IP NETWORKS
to determine the candidate packets to be dropped in case of queue congestion. In each AF class,
packets may be marked as having low, medium and high drop precedence as a result of a three
color marker policing action5. Thus, for instance, AF11 packets are more likely to be forwarded
than AF12 packets, which in turn are more likely to be forwarded than AF13 packets. For this
reason, these packets are usually referred as green, yellow and red packets reflecting a decreasing
likelihood of reaching the network boundary. A possible treatment on AF out-of-profile traffic
can be marking these packets with high drop precedence. Regarding the four independent AF
classes, although no delay and jitter bounds are provided, a minimum bandwidth is assured to
each class. The assurance of AF traffic forwarding depends directly on the amount of resources
(buffer space and bandwidth) allocated to the AF class the packet belongs to, the node or class
congestion level and the packet drop probability. This PHB group can be used to build services
oriented to applications with different tolerance levels to delay and loss, requiring a better service
than BE.
As mentioned above, PHBs are achieved by means of appropriate buffer allocation, manage-
ment and packet scheduling mechanisms. However, PHBs have been defined regarding an ex-
pected behavior relevant to define service provisioning policies, without imposing intentionally
a particular mechanisms’ implementation. As stated in [4], a variety of implementation mecha-
nisms may be suitable for implementing a particular PHB group. In [63], the implementation of
EF and AF PHB is analyzed in two different Diffserv platforms: one developed at ICA/EPFL for
Linux OS and the other based on Cisco Systems routers. For each platform, the several Diffserv
components are tested and evaluated, and the computational efforts Diffserv puts on routers is
measured in terms of CPU utilization. Examples of other works implementing and evaluating
standard PHBs are [52, 46].
Per-Domain Behaviors
The former IETF Diffserv Working Group (WG) has been sometimes criticized as being good
on defining per-node QoS behaviors, but poor on defining how to deploy services in a broad
sense. According to [8], while Diffserv mechanisms have been standardized as PHBs, there is
still much to be learned about the deployment of that or other QoS mechanisms for end-to-end
QoS. In fact, while standard PHBs help fostering service building consistency at a node level,
5Although three drop precedences are foreseen, an AF policing/marking scheme may consider less drop prece-dences. This depends on the type of policer in use and on its configuration. However, within each AF class, aDiffserv node must accept all three drop precedence codepoints and they must yield at least two different levels ofloss probability.
18

2.1. THE DIFFERENTIATED SERVICES MODEL
the efforts to standardize concrete behaviors and services at a domain level were less successful.
In this context, the IETF only provides informational directions on how to define and specify a
forwarding behavior at domain level [39].
According to [39], the term per-domain behavior has been adopted to describe the behavior
experienced by a particular set of packets with a given DSCP (or set of DSCPs) as they traverse
a Diffserv domain from edge-to-edge. A PDB is defined as a technical building block includ-
ing classifiers, traffic conditioners, specific PHBs and particular configurations with a resulting
set of specific observable attributes. A PDB is characterized by specific metrics that quantify
the treatment that a traffic aggregate will receive at domain level, i.e., a PDB has measurable,
quantifiable attributes reflecting the packets’ behavior as they enter and cross the domain. The
measurable parameters of a PDB should be suitable for use within SLSs.
The lower effort (LE) PDB [64] has been defined within the IETF with the objective to
accommodate traffic requiring very low forwarding priority treatment. This “non-critical traffic”
is due to consume network resources only when no other traffic is present. In opposition to
traffic belonging to other classes, LE traffic can stand resource starvation, i.e., all other traffic
may have strict priority over it. The PHB used by an LE aggregate inside a DS domain should
be configured so that its packets are forwarded into the node output link when the link would
otherwise be idle; conceptually, this is the behavior of a weighted round-robin scheduler with
a weight of zero [64]. In practice, LE PDB should be used by service providers to isolate or
schedule certain types of low priority traffic and users to off-peak time periods, taking advantage
of spare resources. This PDB can be viewed as a traffic management facility within a Diffserv
domain, instead of a regular customer service to be subscribed. Examples of its use include
support for peer-to-peer file sharing, bulk e-mail or traffic resulting from WWW search engines
when gathering information.
Apart from LE PDB, Diffserv WG has not concluded the specification of Virtual Wire (VW)
PDB and Assured Rate (AR) PDB, providing instead high-level rules to build them [39]. The
VW PDB is expected to be build using EF PHB, offering a low delay, low jitter, low loss and
guaranteed peak rate edge-to-edge behavior. Such behavior should be indistinguishable from a
dedicated circuit. The AR PDB is expected to be build upon AF PHB group, providing a suitable
means for carrying traffic aggregates requiring rate assurance but not delay and jitter bounds.
19

CHAPTER 2. MULTISERVICE CLASS-BASED IP NETWORKS
Additional issues to support services
Apart from the Diffserv model components described in [4], building consistent services at a do-
main or end-to-end level involves several other tasks at distinct network operating planes. Most
of the components described so far fall within the data plane, where the basic mechanisms han-
dling data packets allow to enforce both a given PHB and PDB. However, several additional tasks
within the control plane and management plane assume a preponderant role in the deployment of
services, namely, SLS negotiation, QoS and SLS monitoring, service-oriented AC, routing and,
generically, traffic engineering (TE)6.
In the context of this thesis, and according to the main objectives drawn in Section 1.1, the
emphasis will be given on SLS definition, negotiation and control, detailed in the next section,
and on AC using QoS and SLS monitoring, detailed in Chapters 3 and 4, respectively. Figure
2.3 illustrates the described tasks within the corresponding network operating planes, taking into
account characteristics of the AC model proposed in Chapter 5 and inputs from [61, 65, 54].
2.2 Defining and negotiating SLA/SLSs
A Service Level Agreement (SLA) is defined as a contract between a customer and a service
provider or between service providers, specifying administrative and technical service informa-
tion. The technical part of an SLA, called Service Level Specification (SLS), defines the expected
service level, QoS related parameters and traffic control issues. The definition of a standard set
of SLS parameters and semantics, apart from being a key aspect for QoS provisioning, is crucial
for ensuring end-to-end QoS delivery and for simplifying interdomain negotiations [1, 2]. More-
over, the definition and negotiation of SLSs provide valuable inputs for AC, in special, when
admission spans multiple domains.
6The concept of TE is defined as the application of technology and scientific principles to the measurement,characterization, modeling and control of Internet traffic [32, 21]. TE, closely related to performance evaluation andoptimization of operational IP networks, aims at achieving optimal network resource utilization, facilitating reliablenetwork operations while satisfying users demands. This latter aspect is particularly important as optimizing wrongperformance measures may achieve certain local objectives, but may have disastrous consequences on the emergentproperties of the network and thereby on the QoS perceived by end-users of network services [21]. Therefore,applying traffic engineering concepts iteratively to operational networks may help understanding network behaviorthrough objective measurement and analysis, contributing to enhance QoS levels provided.
TE encompasses a set of tasks both related to capacity management and traffic management [21]. While capacitymanagement includes tasks such as capacity planning, routing control and resource management (e.g., link band-width, buffer space and computational resources), traffic management includes per-node traffic control functions(e.g., traffic conditioning, active queue management, scheduling) and other traffic control functions such as AC.
20

2.2. DEFINING AND NEGOTIATING SLA/SLSs
SLS Negotiation
Network Planning
SLS Util. Control SC QoS Control
Classification
Traffic Conditioning IP ForwardingQueuing
Data Plane
Enforcement Enforcement
Per−Domain Behavior Per−Hop Behavior
Routing Admission Control
QoS and SLS Monitoring
Service Classes (SC) Planning
(Configuration and Provisioning)
Management Plane
Control Plane
Off−line TE
OtherDynamic TE
Figure 2.3: Network operating planes
Several working groups are committed to SLS definition [65, 66, 67, 68, 69, 70] and man-
agement [65, 66, 71, 72, 73, 74, 2, 75, 76]. Taking these inputs into account, a possible SLA
template including relevant parameters and their typical contents is defined in Table 2.1. A more
detailed description of the SLS template fields including a XML specification and validation is
presented in [18].
Although a large combination of quality, performance and reliability parameters is possible
(see Section 4.2.1), service providers are expected to offer a limited number of services. To
instantiate the SLS template into quantitative and/or qualitative standard services adapted to dif-
ferent application types is, in fact, a major objective. In more detail, a quantitative description
of the expected QoS of an SLS traffic stream expresses performance parameters (at least one of
them) in numeric values. Common parameters, as described in Section 4.2.1, are one-way-delay,
interpacket delay variation, packet loss ratio and throughput, measured in a defined time interval
(measurement period). For delay related parameters, an optional quantile may be used to reflect
an empirical gauge for the parameter [67]. A qualitative description does not quantify perfor-
mance presenting instead the expected performance e.g., delay and loss parameters, in terms
21
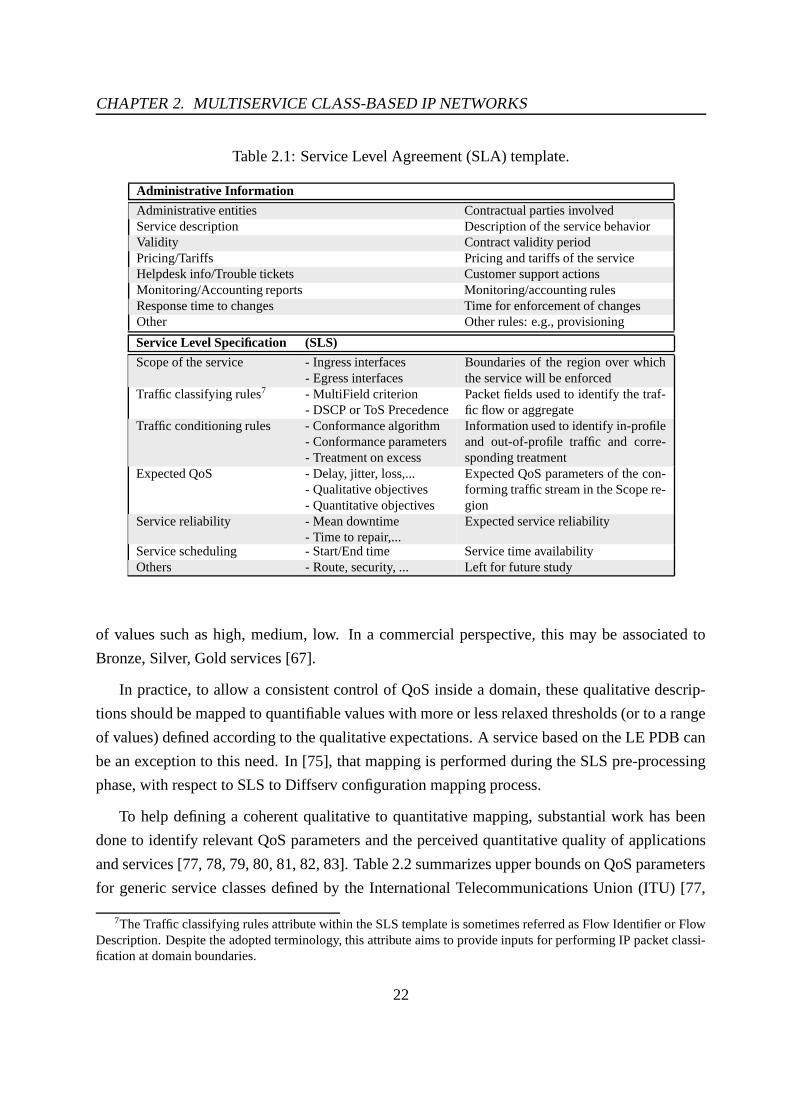
CHAPTER 2. MULTISERVICE CLASS-BASED IP NETWORKS
Table 2.1: Service Level Agreement (SLA) template.
Administrative Information
Administrative entities Contractual parties involvedService description Description of the service behaviorValidity Contract validity periodPricing/Tariffs Pricing and tariffs of the serviceHelpdesk info/Trouble tickets Customer support actionsMonitoring/Accounting reports Monitoring/accounting rulesResponse time to changes Time for enforcement of changesOther Other rules: e.g., provisioning
Service Level Specification (SLS)
Scope of the service - Ingress interfaces- Egress interfaces
Boundaries of the region over whichthe service will be enforced
Traffic classifying rules7 - MultiField criterion- DSCP or ToS Precedence
Packet fields used to identify the traf-fic flow or aggregate
Traffic conditioning rules - Conformance algorithm- Conformance parameters- Treatment on excess
Information used to identify in-profileand out-of-profile traffic and corre-sponding treatment
Expected QoS - Delay, jitter, loss,...- Qualitative objectives- Quantitative objectives
Expected QoS parameters of the con-forming traffic stream in the Scope re-gion
Service reliability - Mean downtime- Time to repair,...
Expected service reliability
Service scheduling - Start/End time Service time availabilityOthers - Route, security, ... Left for future study
of values such as high, medium, low. In a commercial perspective, this may be associated to
Bronze, Silver, Gold services [67].
In practice, to allow a consistent control of QoS inside a domain, these qualitative descrip-
tions should be mapped to quantifiable values with more or less relaxed thresholds (or to a range
of values) defined according to the qualitative expectations. A service based on the LE PDB can
be an exception to this need. In [75], that mapping is performed during the SLS pre-processing
phase, with respect to SLS to Diffserv configuration mapping process.
To help defining a coherent qualitative to quantitative mapping, substantial work has been
done to identify relevant QoS parameters and the perceived quantitative quality of applications
and services [77, 78, 79, 80, 81, 82, 83]. Table 2.2 summarizes upper bounds on QoS parameters
for generic service classes defined by the International Telecommunications Union (ITU) [77,
7The Traffic classifying rules attribute within the SLS template is sometimes referred as Flow Identifier or FlowDescription. Despite the adopted terminology, this attribute aims to provide inputs for performing IP packet classi-fication at domain boundaries.
22
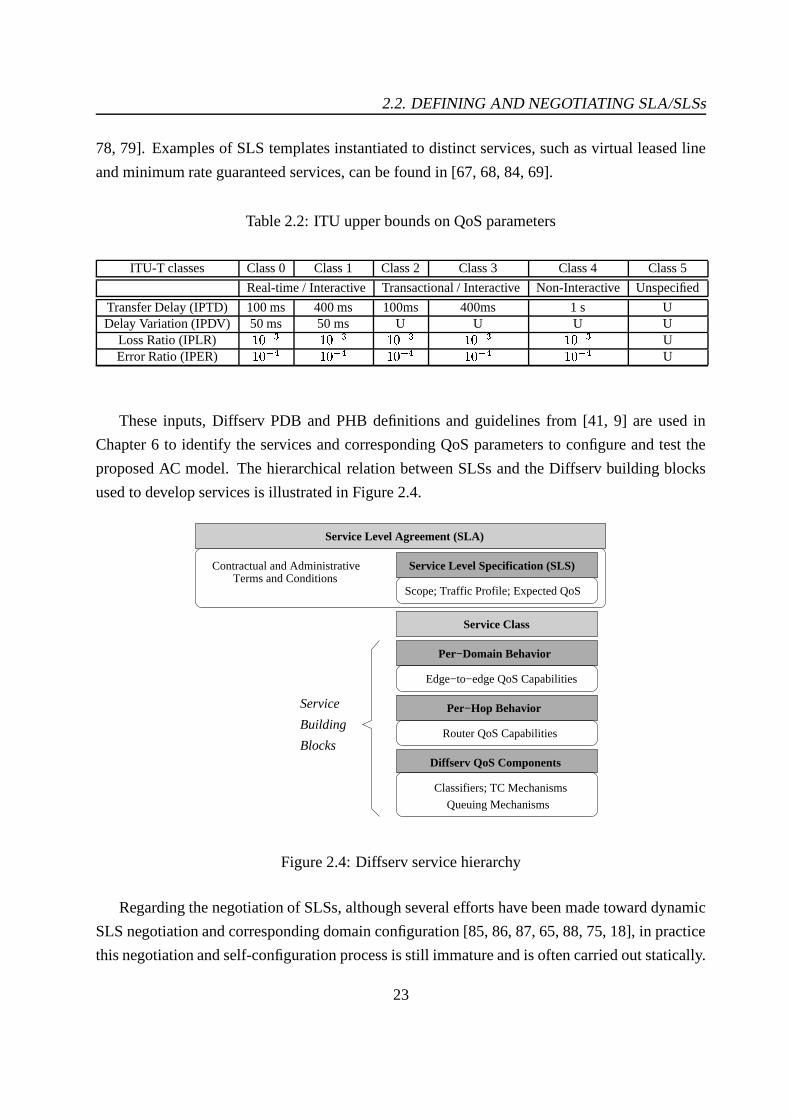
2.2. DEFINING AND NEGOTIATING SLA/SLSs
78, 79]. Examples of SLS templates instantiated to distinct services, such as virtual leased line
and minimum rate guaranteed services, can be found in [67, 68, 84, 69].
Table 2.2: ITU upper bounds on QoS parameters
ITU-T classes Class 0 Class 1 Class 2 Class 3 Class 4 Class 5
Real-time / Interactive Transactional / Interactive Non-Interactive Unspecified
Transfer Delay (IPTD) 100 ms 400 ms 100ms 400ms 1 s UDelay Variation (IPDV) 50 ms 50 ms U U U U
Loss Ratio (IPLR) ;=<?>.@ ;=<A>�@ ;=<?>.@ ;=<?>.@ ;B<A>.@ UError Ratio (IPER) ;=<?>�C ;=<A>.C ;=<?>�C ;=<?>�C ;B<A>�C U
These inputs, Diffserv PDB and PHB definitions and guidelines from [41, 9] are used in
Chapter 6 to identify the services and corresponding QoS parameters to configure and test the
proposed AC model. The hierarchical relation between SLSs and the Diffserv building blocks
used to develop services is illustrated in Figure 2.4.
Service
Building
Blocks
Contractual and Administrative
Scope; Traffic Profile; Expected QoS
Service Level Agreement (SLA)
Service Level Specification (SLS)Terms and Conditions
Service Class
Edge−to−edge QoS Capabilities
Per−Domain Behavior
Per−Hop Behavior
Router QoS Capabilities
Classifiers; TC Mechanisms
Queuing Mechanisms
Diffserv QoS Components
Figure 2.4: Diffserv service hierarchy
Regarding the negotiation of SLSs, although several efforts have been made toward dynamic
SLS negotiation and corresponding domain configuration [85, 86, 87, 65, 88, 75, 18], in practice
this negotiation and self-configuration process is still immature and is often carried out statically.
23

CHAPTER 2. MULTISERVICE CLASS-BASED IP NETWORKS
2.2.1 Business models
The need for establishing business relationships and agreements (SLA/SLS) between ISPs re-
garding interdomain and end-to-end QoS delivery is emphasized in [1, 89, 90]. In particular,
these works characterize possible business relationships and the financial settlements in the cur-
rent Internet considering a three-tier Internet model of ISPs (regional, national, international and
large national transit ISPs). Two organizational models for the support of interoperator IP-based
services [91] - the Source-based approach and the Cascade approach - have been described and
their advantages and disadvantages presented. In the cascade approach, each ISP only establishes
SLSs with adjacent ISPs, i.e., ISPs with Border Gateway Protocol (BGP) peering relationships.
Thus, the cascade model results in a recursive approach to the end-to-end agreements based on
the concatenation of SLSs established between adjacent domains. In the source-based approach,
the originating domain/ISP establishes SLSs with adjacent and non-adjacent domains in order to
reach a set of destinations with a particular QoS. This involves having an up-to-date view of the
Internet topology, i.e., the knowledge of all domains and their interconnections. Although the
cascade model has less control of the optimal path, it is more in-line with the coupled Internet
structure, being more manageable and scalable. Thus, it is expected to be preferred by most ISPs.
In both cases, interdomain routing is SLS constrained, i.e., SLSs between domains must be in
place and taken into account.
2.2.2 Additional SLS deployment issues - SLS control and auditing
For a service provider, SLSs incoming traffic aggregates are conditioned, in a first instance,
at domain ingress nodes [14]. This consists of SLSs traffic profile conditioning based on the
negotiated TC parameters, TC algorithm and out-of-profile traffic treatment (see Figure 2.5).
For SLS auditing purposes, SLS monitoring and SLS conformance verification tasks are required
(see Figure 2.6).
Service class generic information, including the service parameters to control and the moni-
toring rules, and eventually specific service information (customer dependent) are used for SLS
monitoring and conformance verification. This verification should report whether the negoti-
ated service is being provided or not, allowing to trigger reconfiguration and tuning actions. An
important aspect to consider is the space and time granularities in which monitoring is accom-
plished. Although SLSs off-line monitoring is a common approach, several studies highlight that
it should be performed on-line [74, 92]. In some cases, customers may even have on-line access
24

2.2. DEFINING AND NEGOTIATING SLA/SLSs
to verify the QoS levels being provided. As an example, this facility is provided by RIPE-NCC
Test Traffic Measurements (TTM) infrastructure to the involved parties [92].
Service Instance (SLS)
TC Algorithm
Traffic ProfileTC Parameters
TC Excess Treatment
Conformant TrafficStream
Traffic Stream
Conformance
Verificationand
Adjustment
Figure 2.5: SLS traffic conditioning at domain entrance
Monitoring Module ResultsConformance
Verification
Module
ConformanceVerification
Interface
Visualization
Reports
Reconfiguration
Adaptation
Customer Dependent
Service Instance
Information
(SLS)
SLS Conformance VerificationSLS Monitoring
Service Class
Generic Information
Service Parameters
Monitoring Rules
and Metrics
Figure 2.6: SLS auditing
In the AC model proposed in this work, SLS monitoring will be carried out resorting to a
QoS monitoring module which has an ingress-egress view of the service QoS, therefore, it is
particularly suited to SLS auditing. As detailed later in Chapter 5, the QoS control of accepted
SLSs for a service class is embedded within the service class QoS control, performed at egress
nodes. This means that, to simplify the monitoring process and improve scalability, the specific
or customer dependent information should be minimized. Thus, in the proposed model, only the
SLS utilization control is customer dependent, being the QoS control performed in a per-class
basis and not in a per-SLS basis.
25
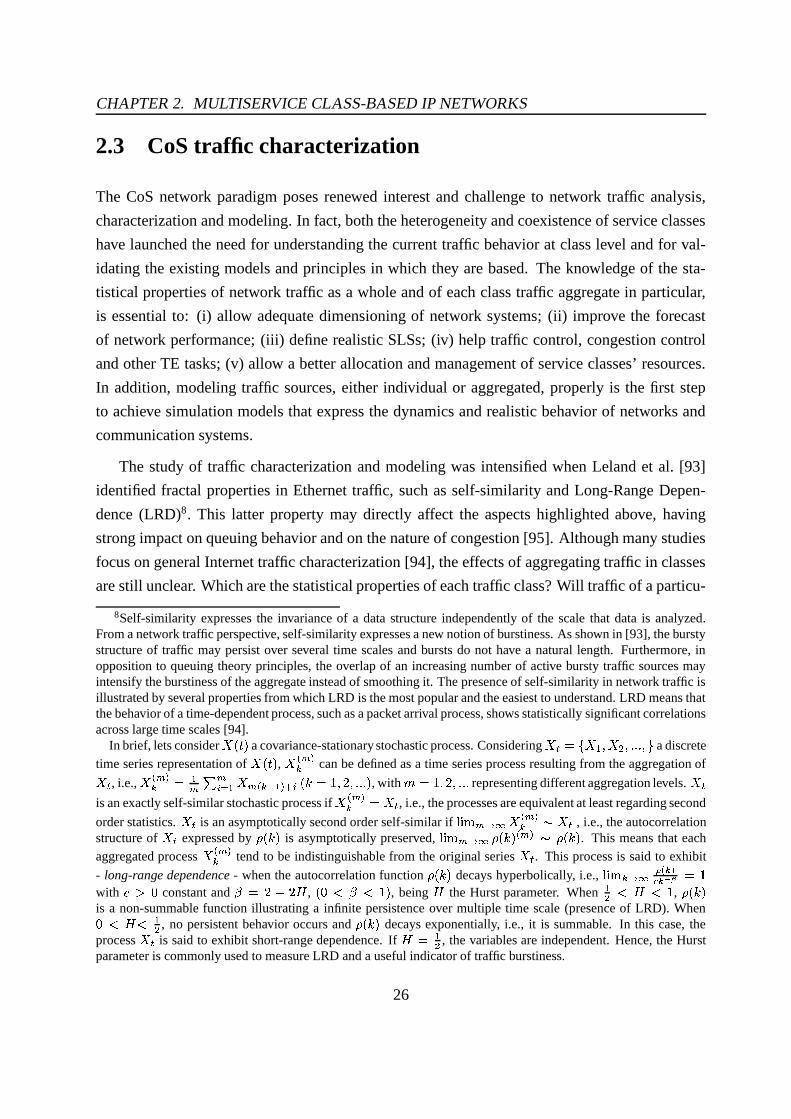
CHAPTER 2. MULTISERVICE CLASS-BASED IP NETWORKS
2.3 CoS traffic characterization
The CoS network paradigm poses renewed interest and challenge to network traffic analysis,
characterization and modeling. In fact, both the heterogeneity and coexistence of service classes
have launched the need for understanding the current traffic behavior at class level and for val-
idating the existing models and principles in which they are based. The knowledge of the sta-
tistical properties of network traffic as a whole and of each class traffic aggregate in particular,
is essential to: (i) allow adequate dimensioning of network systems; (ii) improve the forecast
of network performance; (iii) define realistic SLSs; (iv) help traffic control, congestion control
and other TE tasks; (v) allow a better allocation and management of service classes’ resources.
In addition, modeling traffic sources, either individual or aggregated, properly is the first step
to achieve simulation models that express the dynamics and realistic behavior of networks and
communication systems.
The study of traffic characterization and modeling was intensified when Leland et al. [93]
identified fractal properties in Ethernet traffic, such as self-similarity and Long-Range Depen-
dence (LRD)8. This latter property may directly affect the aspects highlighted above, having
strong impact on queuing behavior and on the nature of congestion [95]. Although many studies
focus on general Internet traffic characterization [94], the effects of aggregating traffic in classes
are still unclear. Which are the statistical properties of each traffic class? Will traffic of a particu-
8Self-similarity expresses the invariance of a data structure independently of the scale that data is analyzed.From a network traffic perspective, self-similarity expresses a new notion of burstiness. As shown in [93], the burstystructure of traffic may persist over several time scales and bursts do not have a natural length. Furthermore, inopposition to queuing theory principles, the overlap of an increasing number of active bursty traffic sources mayintensify the burstiness of the aggregate instead of smoothing it. The presence of self-similarity in network traffic isillustrated by several properties from which LRD is the most popular and the easiest to understand. LRD means thatthe behavior of a time-dependent process, such as a packet arrival process, shows statistically significant correlationsacross large time scales [94].
In brief, lets consider DFEHGJI a covariance-stationary stochastic process. Considering DLKNMPO=DRQTSUDWVXS+YZY�YZS�[ a discretetime series representation of DFEHGJI , D]\�^`_a can be defined as a time series process resulting from the aggregation ofDWK , i.e., Db\Z^c_a M Q^
d ^e�f Q D ^�\ a > Q _hg e E2ijM$;XSlkAS+YZYZY I , with mnMP;oSpk?S+YZY�Y representing different aggregation levels. DqKis an exactly self-similar stochastic process if DF\Z^c_a MrDWK , i.e., the processes are equivalent at least regarding second
order statistics. DWK is an asymptotically second order self-similar if s�tZu ^`v6w D]\�^`_a x DWK , i.e., the autocorrelationstructure of DjK expressed by y�E2i?I is asymptotically preserved, sZt�u ^zv{w y�E2i?I \�^`_ x y�E2i?I . This means that eachaggregated process D]\�^`_a tend to be indistinguishable from the original series DqK . This process is said to exhibit
- long-range dependence - when the autocorrelation function y.E�i?I decays hyperbolically, i.e., s�tZu a v{w | \ a _} aB~�� M�;with ����< constant and �PM�k���kX� , EH<�������;TI , being � the Hurst parameter. When QV ������; , y�E2i�Iis a non-summable function illustrating a infinite persistence over multiple time scale (presence of LRD). When<����b� QV , no persistent behavior occurs and y�E2i?I decays exponentially, i.e., it is summable. In this case, theprocess DjK is said to exhibit short-range dependence. If ��M QV , the variables are independent. Hence, the Hurstparameter is commonly used to measure LRD and a useful indicator of traffic burstiness.
26
2.3. CoS TRAFFIC CHARACTERIZATION
lar service class be responsible for the behavior expressed in [93]? How does aggregation affect
burstiness at network nodes and links?
In the context of this thesis, the relevance and major objective of traffic characterization is to
understand the statistical properties of Internet traffic under the new perspective of aggregation
in classes. As far as AC is concerned, the decision algorithms should consider the QoS to be
provided to admitted flows without disregarding the impact a new flow will have, i.e., predicting,
whenever possible, the new QoS that would result from accepting additional traffic. In fact,
the lack of understanding of the traffic characteristics is an important obstacle to achieve an
accurate QoS prediction. When more detailed forecasts of network traffic are available, the QoS
prediction can be sharpened and network utilization improved [96]. The work in [96] explores the
impact of knowing the traffic characteristics over distinct time scales on AC policies efficiency,
measured in terms of network utilization9. Although a complete traffic characterization including
multiple time scales would allow the use of ideal AC policies, the computational complexity of
implementing such policies may be prohibitive. Usually, the traffic characteristics are reasonably
known for one well-studied time scale upon which the AC policy is based.
Knowing the characteristics of traffic aggregates is also relevant in order to establish and
parameterize the service-dependent AC equations properly. As an example, AC thresholds and
safety margins may need to take into account the impact of LRD on the class queuing behavior,
to avoid unexpected QoS degradation. Thus, considering the work in [20] as a first step in
this research area, in [19] a possible traffic classification criteria is proposed and the statistical
properties of each defined class are evaluated using fractal theory.
Apart from studying the behavior of traffic aggregates, other relevant aspects to characterize
are: (i) the expected traffic volume per-class, which is relevant to resource usage forecast and
provisioning; (ii) the characteristics of individual flows within a class requiring an AC decision.
This involves defining the flows’ arrival and holding time distributions and the traffic source
9The authors discuss the relevance of considering various properties of traffic in the design of AC policiesin addition to the peak rate, such as information about the mean rate and the variance in the most relevant timescale. Ideally, characterizing traffic in more than one time scale should be considered in the design of efficientAC policies. The multiple time scales of interest may span several orders of magnitude. In particular, consider-ing 1s as the most relevant time scale, the authors identify the time scale near to 15s also relevant and 360s asthe time scale over which knowing traffic properties does not improve efficiency significantly. In the context ofmeasurement-based AC a time scale analysis of several algorithms is provided in [97, 98] and the relevance of hownew flows’ arrival and departure are treated and the equations sensitivity to traffic fluctuations, controlled by themeasurement time interval is discussed in [99] (see Appendix C). In [97], after identifying the critical time scaleas ���� M���X� _ �5�2 T¡ _ ¢j£.¤¦¥oG¨§¨ T©�ªo« ¬§®©�i?¯N§¨°²± _ T© _ ³´£.m´µ¶±B¤T�5�2 T¡�· , the authors consider that fast time scale fluctu-ations (aggregate traffic fluctuations shorter than ���� ) have to be absorbed by overbooking and that slow time scalefluctuations can be tracked by AC adjusting the number of flows through the flow arrivals and departures.
27

CHAPTER 2. MULTISERVICE CLASS-BASED IP NETWORKS
model regulating the generation of packets within a flow. Regarding this latter aspect, there
are well-accepted approaches for modeling applications’ behavior [100, 101], and the relation
between LRD of a traffic aggregate and the properties of its individual flows is identified in
[102]. According to [102], the use of the Hurst parameter ( ¸ ) to measure the burstiness of the
aggregate traffic and LRD is particularly attractive giving that the parameter ¸º¹ �'¼» ¸ » �A½ ,denoting LRD, and the parameter ¾¿¹�� » ¾ »
À ½ , characterizing the tail of the distribution
of individual flows, are related by ¸ � ¹JÁ�Â�¾Ã½=Ä À . These insights will be considered in the
parameterization of the simulation scenario of a multiclass domain, defined in Chapter 6.
2.4 Summary
In this chapter, the motivation for using class-based QoS solutions has been explained and the
main principles behind CoS networks introduced. Although supporting the heterogeneity of
requirements of present and emerging services may rely on multiple technological solutions,
the discussion has focused on IP layer proposals, as IP is pointed out as the layer at which
convergence is likely to occur. Taking Diffserv as a reference model within the CoS network
paradigm, its architecture, principles and main components have been reviewed. This debate has
also focused on how to build service classes, identifying the main tasks within the data, control
and management network operating planes. The relevance of specifying standard SLA/SLSs has
been discussed as a key step toward the deployment of services both from a domain and end-
to-end perspectives. Finally, the importance of considering CoS traffic characterization has been
debated. The following chapter will concentrate on AC approaches for multiservice class-based
IP networks.
28
Chapter 3
Admission Control in CoS IP Networks
Either in flow-based or class-based QoS architectures, controlling the admission of traffic enter-
ing the network allows to: (i) avoid overutilization of existing network resources; (ii) avoid new
flows from impairing flows already accepted; (iii) fulfill service level agreements; (iv) prevent
instability, congestion and assure QoS. Despite its need [3, 8, 9], the complexity introduced by
AC has to be carefully assessed as Internet traffic is highly dynamic and not every application
has strict QoS requirements. Thus, the control complexity inherent to an AC process has to be
balanced with the assurance level required. As discussed in Chapter 1, overprovisioning can
be useful to improve this trade-off, however, a consistent QoS solution cannot just be based on
overprovisioning and further control has to be in place to honor QoS requirements in the network.
In multiservice networks, AC assumes a more challengeable role as service classes have
distinct characteristics and require different QoS assurance levels. Therefore, the discussion
provided in this chapter surveying current AC research activity will follow, whenever possi-
ble, a service-oriented perspective. In particular, studies regarding AC in multiservice networks
deserve special attention. Most of the AC proposals tackle the problematic of per-flow admis-
sion, connoting it with the admission of a new application, independently of which layers of the
TCP/IP protocol stack need to be considered. Some authors classify AC taking into account the
semantics involved in the process, for instance, whether it involves connection or session level
semantics. In this work, the general case of flow admission is followed as it does not impair that
other high-level AC heuristics are in place.
In this chapter, relevant high-level characteristics of current AC approaches are identified in
29

CHAPTER 3. ADMISSION CONTROL IN CoS IP NETWORKS
order to allow a comparative study of those approaches. Then, the debate on AC proceeds from
a service perspective, drawing considerations on the AC decision criteria. Next, the studied AC
approaches are detailed and assessed based on their characteristics. This analysis, identifying
the main virtues and limitations of those approaches, grounds the motivation for the new AC
proposal presented in this work.
3.1 Identifying relevant characteristics of AC approaches
Classifying AC approaches can be a difficult and subjective task due to the multiple variables
involved, not necessarily disjoint. Despite that, identifying relevant aspects that help on charac-
terizing and distinguishing AC approaches will allow a more consistent debate on related work.
Important high-level characteristics of existing AC approaches are the following:
: the underlying network paradigm - this aspect is related to the network model or architec-
ture in which AC operates. AC approaches span from single service (best-effort) to mul-
tiservice architectures, following either a flow or class-based paradigm. Even considering
the existence of multiple services, some approaches are targeted for a specific service or
set of services. Their scope as regards contemplating an intradomain, interdomain and/or
end-to-end solution also varies;
: the type of service to control - this aspect is closely related to the guarantee levels to be
provided. The terminology to distinguish the services types and underlying guarantees are
varied. Common and similar terminology includes deterministic vs. statistical, guaranteed
vs. predictive, guaranteed vs. controlled load, quantitative vs. qualitative or hard vs. soft
real-time. The type of service is tied up with the applications’ characteristics, whether they
are rigid or adaptive, have quantitative or qualitative QoS targets;
: the signaling support involved - this topic can be viewed in two distinct ways. On the one
hand, it is closely related to the type of applications and their ability to explicitly inform
the network of their needs, commonly expressed in terms of a traffic profile and/or QoS
requirements, using soft or hard state signaling for that purpose. When the AC decision
is made without this information, usually using the initial packets of a flow instead, it is
called implicit admission and no signaling is involved. On the other hand, signaling may
also occur at high-level, for instance between specific nodes in distinct network domains
30

3.1. IDENTIFYING RELEVANT CHARACTERISTICS OF AC APPROACHES
or directly between end-systems. The nodes involved in the signaling process are closely
related to the following topic;
: the location of the AC decision - this aspect is related to the centralized or distributed na-
ture of the AC approach. This aspect can be further detailed depending on which nodes
(e.g., all nodes, specific nodes, edge-nodes, end-systems) are involved and how they par-
ticipate in the AC process. For instance, a node can make an AC decision or only gather
information for some other entity to use. The amount and type (per-flow or per-class) of
state information kept in those nodes and the need for coordination among them are also
important factors to consider;
: the characteristics of the admission decision criteria - these can be determined by (i) the
nature of the algorithm, i.e., whether it is parameter-based, measurement-based or hybrid;
(ii) the information used for AC, which can be based on keeping track of resources’ usage
(usually bandwidth) or on congestion indicators (e.g., explicit congestion marks); (iii) the
concrete AC equations, which can be based on more or less intricate theoretical concepts
involving distinct control parameters, whose tuning will, in turn, influence the conserva-
tiveness of AC. Independently of the characteristics highlighted above, as any AC approach
is sustained by an AC criterion, this topic is further detailed in the following section before
presenting the most relevant AC approaches.
Having discussed these points, the overall performance of an AC approach can be characterized
through several related aspects, namely:
: the ability to fulfill the QoS commitments;
: the efficiency of resources’ utilization for the service levels provided;
: the intrinsic overhead of the AC approach (e.g., involved state information and computa-
tional efforts);
: the overhead introduced in the network data and control planes (e.g., intrusion of probing
traffic, signaling, state information, new requirements on nodes), influencing scalability;
: the latency regarding the time it takes to make an AC decision.
The easy of migration and implementation in real environments is another key point as it brings
a practical perspective and the real usefulness of the AC approach.
31
CHAPTER 3. ADMISSION CONTROL IN CoS IP NETWORKS
3.1.1 The AC decision criteria
Establishing an admission criterion consists of defining the rules by which flows are accepted
or rejected. In any AC approach the admission criterion plays a crucial role as regards service
guarantees and network efficiency. Usually AC criteria are parameter-based, measurement-based
or follow an hybrid scheme combining both.
Parameter-based AC algorithms take into account the network resources already in use (re-
served) by accepted flows and the resources the new flow will consume, according to its explicit
traffic descriptor. These descriptors allow establishing upper bounds on the traffic generated by
a source. When AC takes uniquely this information, QoS conformance can be easily achieved,
leading to acceptable network utilization when the flows are smooth, however, utilization is low
for bursty traffic. Thus, parameter-based AC algorithms tend to be conservative and oriented for
flows requiring a guaranteed service.
Measurement-based AC algorithms take into account measures reflecting the impact of ex-
isting flows on the network load and/or QoS before deciding about a new admission. Essentially,
they rely on measurements either at each node or end-to-end, without requiring to maintain
state information about reservations in the core. While rate-based AC rules are the most com-
mon, estimates of delay, loss or Explicit Congestion Notification (ECN) marks are also used1.
Measurement-based algorithms are less conservative, taking advantage of statistical multiplexing
of traffic to increase network utilization, at an eventual cost in QoS degradation. In this way, they
are more suitable for flows requiring a predictive service.
Examples of parameter-based, and measurement-based algorithms are defined and compared
in [105, 99, 106, 107, 108, 109, 110, 54]. In Appendix C, a high-level performance discussion
of existing algorithms is provided as well as some research directions for their improving.
1Most of AC algorithms only control the available bandwidth or capacity, comparing it with the requested flowrate. Although being simple for a single link or node-by-node AC, controlling it along the full path is not straight-forward. Methodologies and tools for estimating the available path capacity and available bandwidth are detailedin [81, 103]. The accuracy and on-line utilization of these tools are discussed in [104].
Making AC decisions based on thresholds for the other mentioned QoS parameters is also considered. In thiscase, a new flow is accepted or rejected after checking the controlled parameter against a pre-defined limit. Tuningthese limits, making them useful indicators of the overall QoS status is a fundamental aspect. The major difficultieswith the estimation of QoS parameters is that specific fields may need to be included in network packets, such astimestamps, flow ID, sequence numbers. Additional counters and per flow evaluation at edges may also be needed.
32

3.2. AC APPROACHES: A SERVICE-ORIENTED OVERVIEW
3.2 AC approaches: a service-oriented overview
When defining an AC strategy a trade-off between the service assurance level and network con-
trol complexity needs to be established. Depending on the QoS guarantees and predictability
required, more or less complex AC strategies can be used, with strict or relaxed control of net-
work resources and QoS parameters. The type and number of network nodes (e.g., edge, core,
central entities) involved directly or controlled by the AC process can also vary, affecting the
solution’s complexity.
A lesson learned from the AC model used in Intserv [23, 111] is that keeping resource reser-
vations per-flow in all network nodes, although allowing strict QoS guarantees, is not a scalable
solution. Aggregating these reservations [112] reduces the problem but does not solve it. Inte-
grated solutions combining Intserv with Diffserv potentialities have also been proposed [38, 30].
Associated with CoS architectures, such as Diffserv, several AC approaches have been de-
fined with the common aim of avoiding per-flow state information in the core nodes for the sake
of scalability. Some proposals suggest the use of central entities for AC and resource manage-
ment, called bandwidth brokers (BBs) [113, 114, 115, 116, 85, 117, 118]. However, the well-
known problems of centralization have led to several decentralized AC approaches. Generically,
either using centralized or decentralized AC, the level of guarantee to be provided determines the
complexity of the underlying traffic control strategy.
To provide guaranteed or quantitative service guarantees (e.g., for hard real-time traffic)
current AC proposals need to control the state and the load of traffic aggregates in the core
nodes [113, 119, 116, 120], or even perform AC in these nodes [119, 120]. These solutions tend
to require significant network state information and, in many cases, changes in all network nodes.
Furthermore, as they are closely tied to network topology and routes, their complexity increases
with network dynamics.
Providing predictive or qualitative service guarantees (e.g., for soft real-time traffic) leads to
reduced control information and overhead, but eventually to QoS degradation. Obtaining a good
compromise between efficient resources’ utilization and QoS guarantees is a major challenge.
In this context, measurement-based AC (MBAC) solutions have deserved special attention. Ini-
tially performed in all network nodes [121, 98, 97, 99], more recent studies suggest that AC
decisions should only be made at the edges (end-systems or edge routers), using either passive or
active measurement strategies of network load and/or QoS parameters [122, 123, 124, 125, 126,
127, 106]. Despite not requiring changes in the network, active end-to-end MBAC (EMBAC)
33
CHAPTER 3. ADMISSION CONTROL IN CoS IP NETWORKS
increases the initial latency and network load as probing traffic is carried out on a per-application
basis. The use of routing protocols to propagate QoS measures to edge nodes is also a possible
solution [108, 128].
The need to control elastic traffic for more efficient network utilization has also been dis-
cussed and implicit AC strategies, i.e., without requiring explicit signaling between the appli-
cation and the network, have been defined [129, 130, 131, 132]. Conversely, AC approaches
for real-time applications commonly assume the use of signaling between the application and
the network where, upon a traffic profile and QoS objectives description, an explicit accep-
tance/rejection message is obtained.
A more complete survey comparing the main features and limitations of current AC strategies
is provided in the next section.
3.3 Detailing existing AC approaches
3.3.1 Intserv/RSVP signaling and aggregating reservations
Although being usually associated with the Intserv model, a brief reference to Resource ReSer-
Vation Protocol (RSVP) [28] is provided here as it is commonly suggested as a possible signaling
protocol to support explicit AC in class-based networks2.
RSVP is a soft-state signaling protocol that allows applications to express their resource re-
quirements to the network. Upon receiving a request, the network elements return an explicit
accepting or rejecting indication depending on the available resources. Essentially, this signaling
process involves exchanging RSVP PATH and RSVP RESV messages to place the request and
perform the reservation, respectively, when the AC decision process succeeds. Although inde-
pendent from the Intserv architecture [23], RSVP is there pointed out as a convenient explicit
setup mechanism to signal per-flow resource requirements in order to sustain a node-by-node
AC and resource reservation process aiming at a guaranteed end-to-end QoS delivery [111].
The impairments of deploying Intserv/RSVP in large scale [38, 30] have motivated the ag-
gregation of individual flow requests [112]. This aggregation process aims at reducing scalability
2Recently, a comparison of existing QoS signaling protocols has been carried out in [133, 134] and the frameworkNext Steps in Signaling (NSIS) has been proposed [135]. This framework contemplates a wider variety of possiblesignaling scenarios, being more versatile and flexible than RSVP.
34
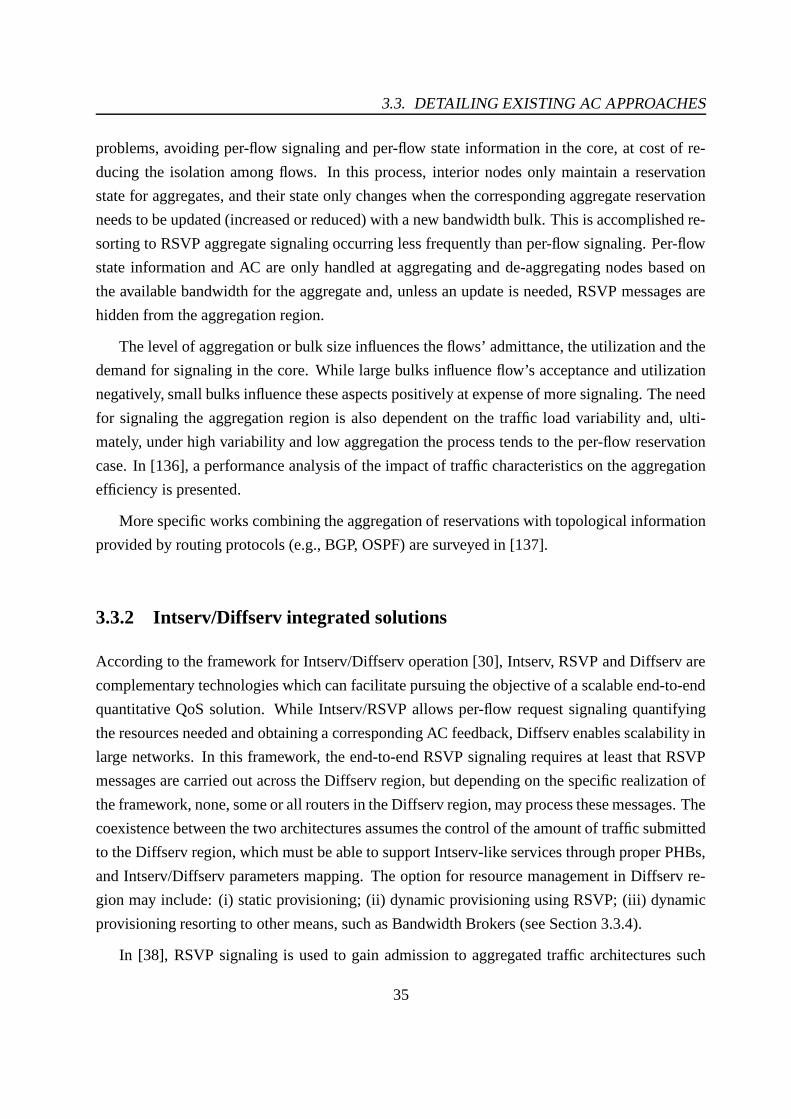
3.3. DETAILING EXISTING AC APPROACHES
problems, avoiding per-flow signaling and per-flow state information in the core, at cost of re-
ducing the isolation among flows. In this process, interior nodes only maintain a reservation
state for aggregates, and their state only changes when the corresponding aggregate reservation
needs to be updated (increased or reduced) with a new bandwidth bulk. This is accomplished re-
sorting to RSVP aggregate signaling occurring less frequently than per-flow signaling. Per-flow
state information and AC are only handled at aggregating and de-aggregating nodes based on
the available bandwidth for the aggregate and, unless an update is needed, RSVP messages are
hidden from the aggregation region.
The level of aggregation or bulk size influences the flows’ admittance, the utilization and the
demand for signaling in the core. While large bulks influence flow’s acceptance and utilization
negatively, small bulks influence these aspects positively at expense of more signaling. The need
for signaling the aggregation region is also dependent on the traffic load variability and, ulti-
mately, under high variability and low aggregation the process tends to the per-flow reservation
case. In [136], a performance analysis of the impact of traffic characteristics on the aggregation
efficiency is presented.
More specific works combining the aggregation of reservations with topological information
provided by routing protocols (e.g., BGP, OSPF) are surveyed in [137].
3.3.2 Intserv/Diffserv integrated solutions
According to the framework for Intserv/Diffserv operation [30], Intserv, RSVP and Diffserv are
complementary technologies which can facilitate pursuing the objective of a scalable end-to-end
quantitative QoS solution. While Intserv/RSVP allows per-flow request signaling quantifying
the resources needed and obtaining a corresponding AC feedback, Diffserv enables scalability in
large networks. In this framework, the end-to-end RSVP signaling requires at least that RSVP
messages are carried out across the Diffserv region, but depending on the specific realization of
the framework, none, some or all routers in the Diffserv region, may process these messages. The
coexistence between the two architectures assumes the control of the amount of traffic submitted
to the Diffserv region, which must be able to support Intserv-like services through proper PHBs,
and Intserv/Diffserv parameters mapping. The option for resource management in Diffserv re-
gion may include: (i) static provisioning; (ii) dynamic provisioning using RSVP; (iii) dynamic
provisioning resorting to other means, such as Bandwidth Brokers (see Section 3.3.4).
In [38], RSVP signaling is used to gain admission to aggregated traffic architectures such
35
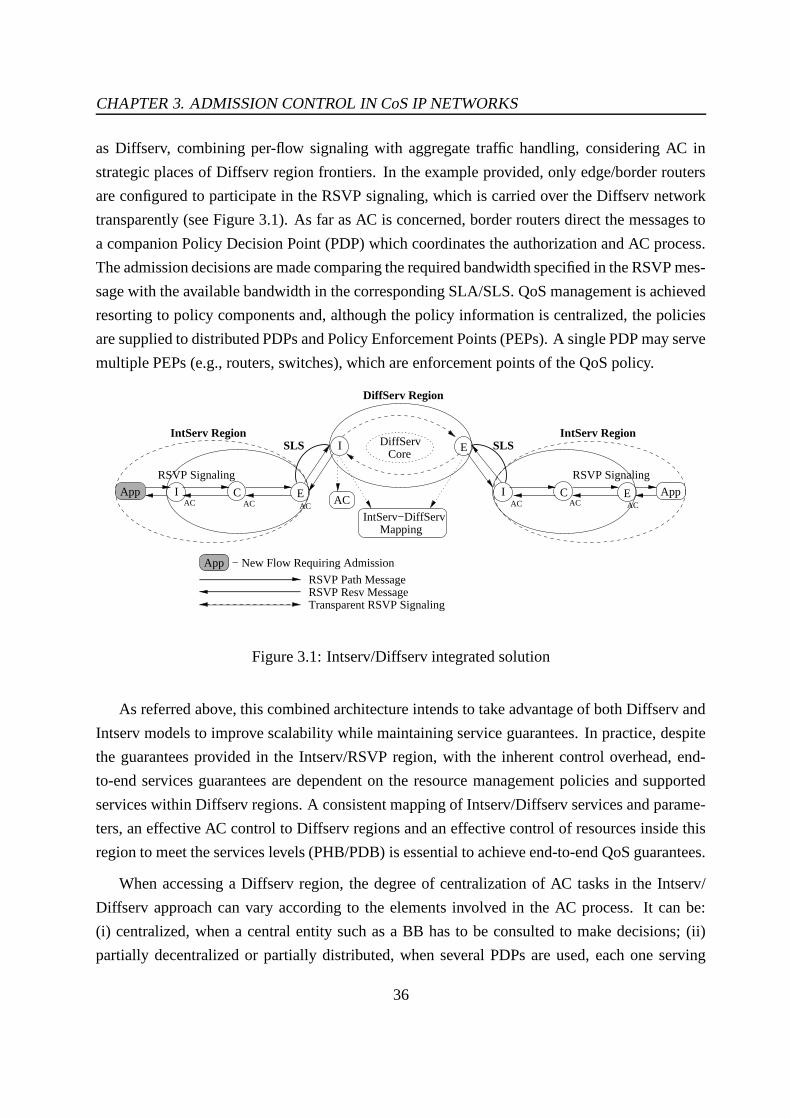
CHAPTER 3. ADMISSION CONTROL IN CoS IP NETWORKS
as Diffserv, combining per-flow signaling with aggregate traffic handling, considering AC in
strategic places of Diffserv region frontiers. In the example provided, only edge/border routers
are configured to participate in the RSVP signaling, which is carried over the Diffserv network
transparently (see Figure 3.1). As far as AC is concerned, border routers direct the messages to
a companion Policy Decision Point (PDP) which coordinates the authorization and AC process.
The admission decisions are made comparing the required bandwidth specified in the RSVP mes-
sage with the available bandwidth in the corresponding SLA/SLS. QoS management is achieved
resorting to policy components and, although the policy information is centralized, the policies
are supplied to distributed PDPs and Policy Enforcement Points (PEPs). A single PDP may serve
multiple PEPs (e.g., routers, switches), which are enforcement points of the QoS policy.
App
I E
EC C
IntServ−DiffServMapping
ACApp
App − New Flow Requiring Admission
II E
IntServ Region
DiffServ Region
IntServ RegionSLS SLS
CoreDiffServ
RSVP Path MessageRSVP Resv Message
RSVP Signaling RSVP Signaling
Transparent RSVP Signaling
ACAC AC AC AC AC
Figure 3.1: Intserv/Diffserv integrated solution
As referred above, this combined architecture intends to take advantage of both Diffserv and
Intserv models to improve scalability while maintaining service guarantees. In practice, despite
the guarantees provided in the Intserv/RSVP region, with the inherent control overhead, end-
to-end services guarantees are dependent on the resource management policies and supported
services within Diffserv regions. A consistent mapping of Intserv/Diffserv services and parame-
ters, an effective AC control to Diffserv regions and an effective control of resources inside this
region to meet the services levels (PHB/PDB) is essential to achieve end-to-end QoS guarantees.
When accessing a Diffserv region, the degree of centralization of AC tasks in the Intserv/
Diffserv approach can vary according to the elements involved in the AC process. It can be:
(i) centralized, when a central entity such as a BB has to be consulted to make decisions; (ii)
partially decentralized or partially distributed, when several PDPs are used, each one serving
36

3.3. DETAILING EXISTING AC APPROACHES
multiple PEPs in the domain or (iii) totally distributed, when the AC decision is made at each
Diffserv region edge router resorting to its own companion PDP, or PEP [138]. The advantages
and disadvantages of a centralized approach to AC are discussed in Section 3.3.4.
3.3.3 Dynamic Packet State and the SCORE architecture
The service architecture proposed in [120] aims at offering per-flow delay and bandwidth guaran-
tees similar to the Intserv guaranteed service [23], but in a more scalable way. This architecture
called Scalable Core (SCORE) is based on: (i) bringing per-flow management to edge nodes;
(ii) a stateless core, i.e., a core where no per-flow information is maintained; (iii) a dynamic
packet state (DPS) technique, which uses specific fields of the IP packet header to embed per-
flow state3. Core nodes process each packet based on its state, update it and, eventually, update
their own state before forwarding the packet.
DPS technique is the key concept of the SCORE architecture as it allows to coordinate
routers’ actions and implement distributed algorithms. In fact, the packet state inserted at ingress
nodes and removed at egress nodes is used by each core node to perform scheduling, which is
based on the concept of packet eligible time and deadline4, and to support per-hop AC, which is
based on an estimate of the upper bound for the aggregate reserved rate, the link capacity and the
new flow’s reserved rate5.
Detailing the AC process, it involves essentially two distinct phases. Firstly, there is an per-
flow RSVP signaling phase between the sender and the ingress node and between the egress
node and the receiver (RSVP PATH and RESV messages), passing transparently through the
SCORE domain. Secondly, upon receiving the RSVP RESV message, the ingress node triggers
a specific signaling message inside the core along the path toward the egress node which allows
to perform local per-hop AC, to account for the number of hops and to compute a label between
ingress and egress nodes so that all packets of the flow are sent along the same path. When the
egress node is reached, the ingress node is notified to make the final AC decision, informing the
3Because of (i) and (ii) aspects, the authors consider the architecture SCORE somehow similar to Diffserv.Moreover they consider that, if PHB and DPS information could be conjugated in packet headers, the flexibility andcapabilities of Diffserv will increase significantly.
4A variant of Jitter-VC scheduling algorithm called Core-Jitter-VC (CJVC) is proposed to provide the sameguarantees of Jitter-VC without requiring per-flow state in the core, using the scheduling parameters encoded in thepacket header [120].
5Per-hop AC is performed at a setup phase using specific signaling. In particular, DPS supports AC in the senseit allows the estimation of each node aggregate reservation rate using a variable - virtual length - evaluated andinserted by the ingress node in the packet header upon each packet departure.
37
CHAPTER 3. ADMISSION CONTROL IN CoS IP NETWORKS
sender subsequently. In this architecture, per-flow reservation state is only maintained at edges
nodes and released according RSVP teardown messages. Figure 3.2 illustrates the behavior of
SCORE/DPS approach.
I EApp App
DPSDPS
C C
DPS
C
DPSDPS
RSVP RSVP
SCORE Network
Internal Signaling
AC ACACAC AC
AC
DataPer−flowState Information
Per−flowState Information
Figure 3.2: SCORE/DPS AC approach
Despite avoiding per-flow state in the core and providing a guaranteed service, this architec-
ture requires that all routers in the flow’s path participate in the AC process, implement the same
scheduling mechanism and update packet headers. In particular, the proposal for packet state
insertion in packet headers may reveal itself incompatible with existing protocols and mecha-
nisms such as Diffserv marking, headers compression and encryption. Although presented as an
end-to-end solution, the operation crossing multiple domains is not covered in [120].
Within the Diffserv context, the framework Resource Management for Diffserv (RMD) pro-
posed in [119], although having a broader scope than SCORE, also involves two distinct sig-
naling protocols: one acting on a per-hop basis called Per-Hop Reservation (PHR) and other
acting only at edge nodes called Per-Domain Reservation (PDR). At the edge nodes information
is maintained per-flow. In addition to its involvement in edge-to-edge AC, PDR is also used to
establish a bridge between the application’s signaling and PHR. In the PHR context, the infor-
mation state at each node is PHB-based instead of flow-based, and AC can use either explicit
reservations or measurements of traffic aggregates.
3.3.4 Centralized approaches based on Bandwidth Brokers
One of the first approaches to perform resource management and AC in a Diffserv domain sug-
gests the use of a central entity called Bandwidth Broker (BB) [118]. Above all, this entity aims
at allocating and controlling the bandwidth shares in the domain. A BB is viewed as a central
38
3.3. DETAILING EXISTING AC APPROACHES
agent which can be configured with organizational policies, keep track of domain resources and
decide upon new flow requests based on the established policies and current resource alloca-
tion. According to the decisions, which may involve message exchange between BBs in adjacent
domains, the configuration of relevant network nodes may take place.
The principle behind BB architecture is to introduce in a Diffserv domain several service
management tasks required to provide a consistent QoS, without complicating the control plane
inside the network. This is achieved by centralizing information concerning network resources
and their usage, domain topology, service policies, negotiated SLSs, which is required to perform
control tasks such as AC, removing these tasks and the corresponding state information from the
network core.
As far as AC is concerned, at an intradomain level, when a new flow requires admission,
a signaling message is sent to the BB specifying the flow profile and QoS requirements asking
for an AC decision6. The BB, after authenticating and authorizing the request, makes a deci-
sion considering the domain service policies, the corresponding SLS usage and the available
resources along the path. If the destination is outside the domain, the AC decision may involve
interdomain signaling with downstream BBs, extending the AC process and resource reserva-
tion end-to-end7. According to the resulting AC decision, each BB updates its state information
databases and configures the involved edge nodes consistently (for classification and TC) using,
for instance, command line interface (CLI) commands, Simple Network Management Proto-
col (SNMP) [139, 140] or Common Open Policy Service (COPS) [141, 138]. For scalability
reasons, the AC requests to BBs, the reservations and the interdomain communication should
consider flow aggregation.
Figure 3.3 illustrates the operation described above. A more detailed description of the BB
functionality and operation is available in [118]. In the context of Internet-2 Qbone architec-
ture [85, 114, 117], an in-depth discussion of BB requirements, architecture and signaling is
also provided. A protocol for inter bandwidth broker communication called Simple Interdomain
Bandwidth Broker Specification (SIBBS) was also proposed [86, 142].
6The signaling message sent to the BB, e.g., using RSVP, can be sent either by the application or by the ingressrouter when a new flow request arrives.
7Initial studies advocate an incremental deployment of BB architectures where, in a first stage, the managementof SLSs is static and flow admission does not cover interdomain communication. In a second stage, SLSs manage-ment is dynamic, concerning their establishment and eventual renegotiation, and the admission control is viewed asan informed admission giving that interdomain communication and end-to-end availability verification take place[85]. Apart from the scenario described above other possible end-to-end scenarios include the setting up of coretunnels as a vehicle for aggregating reservations and reducing signaling between BBs of intermediate domains [86].Flow reservations, SLSs and tunnels are unidirectional.
39
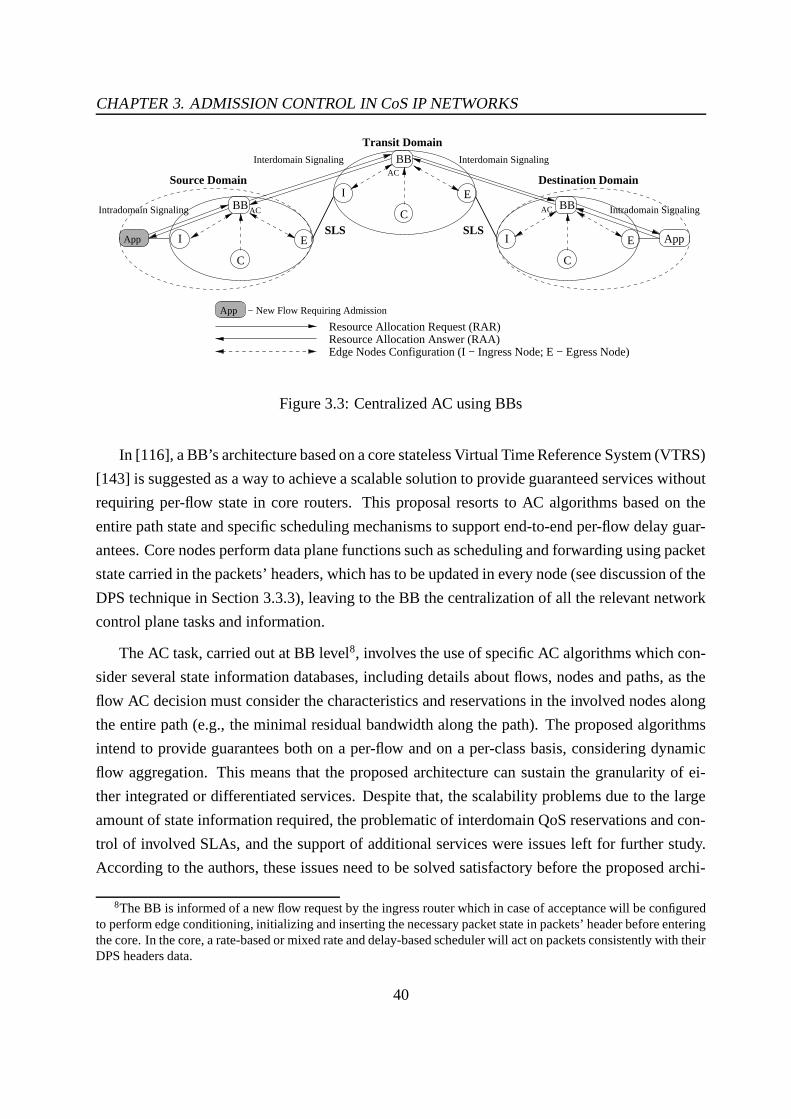
CHAPTER 3. ADMISSION CONTROL IN CoS IP NETWORKS
I E
C
BB
I E
C
BB
AppI E
C
BB
Resource Allocation Request (RAR)Resource Allocation Answer (RAA)Edge Nodes Configuration (I − Ingress Node; E − Egress Node)
App − New Flow Requiring Admission
App
Source Domain Destination Domain
SLS SLS
Transit Domain
Intradomain Signaling
Interdomain Signaling Interdomain Signaling
Intradomain SignalingAC
AC
AC
Figure 3.3: Centralized AC using BBs
In [116], a BB’s architecture based on a core stateless Virtual Time Reference System (VTRS)
[143] is suggested as a way to achieve a scalable solution to provide guaranteed services without
requiring per-flow state in core routers. This proposal resorts to AC algorithms based on the
entire path state and specific scheduling mechanisms to support end-to-end per-flow delay guar-
antees. Core nodes perform data plane functions such as scheduling and forwarding using packet
state carried in the packets’ headers, which has to be updated in every node (see discussion of the
DPS technique in Section 3.3.3), leaving to the BB the centralization of all the relevant network
control plane tasks and information.
The AC task, carried out at BB level8, involves the use of specific AC algorithms which con-
sider several state information databases, including details about flows, nodes and paths, as the
flow AC decision must consider the characteristics and reservations in the involved nodes along
the entire path (e.g., the minimal residual bandwidth along the path). The proposed algorithms
intend to provide guarantees both on a per-flow and on a per-class basis, considering dynamic
flow aggregation. This means that the proposed architecture can sustain the granularity of ei-
ther integrated or differentiated services. Despite that, the scalability problems due to the large
amount of state information required, the problematic of interdomain QoS reservations and con-
trol of involved SLAs, and the support of additional services were issues left for further study.
According to the authors, these issues need to be solved satisfactory before the proposed archi-
8The BB is informed of a new flow request by the ingress router which in case of acceptance will be configuredto perform edge conditioning, initializing and inserting the necessary packet state in packets’ header before enteringthe core. In the core, a rate-based or mixed rate and delay-based scheduler will act on packets consistently with theirDPS headers data.
40

3.3. DETAILING EXISTING AC APPROACHES
tecture can be deployed. The requirement of implementing the DPS technique in all routers in
the flow’s path is an additional impairment to its deployment.
For Diffserv environments, a BB approach based on an Active Resource Management (ARM)
mechanism that reallocates dynamically bandwidth among clients has been proposed in [144].
The main advantage of centralized AC approaches is that centralizing state information and
control tasks allows a global vision of the domain’s QoS and operation, relieving the control plane
inside the network. This centralization process also facilitates creating and changing service
policies and control mechanisms such as AC algorithms. The cost of centralized approaches is
however high. BBs need to store and manage large amounts of information, which in large and
highly dynamic networks with many signaling messages and information state updates needing to
be processed in real-time is even hard or prohibitive. The congestion and functional dependence
on a single entity is another well-known problem of centralization.
To improve reliability and scalability in large network domains, several approaches consider
the use of a distributed or hierarchical architecture involving multiple BBs in the domain instead
of a single centralized BB [113, 145, 116, 118]. A single BB strategy is considered more suitable
to small and less dynamic environments involving long lived flows. In the case of large and more
dynamic domains, the use of multiple BBs improves reliability, BB congestion avoidance and
scalability, at an eventual cost in coordination among BBs and in resources’ fragmentation.
3.3.5 Measurement-based AC approaches
AC approaches based on network measurements performed node-by-node, edge-to-edge or end-
to-end have erupted within the context of providing predictive service guarantees. They intend
to solve or reduce the disadvantages of the described AC approaches, in particular, regarding
the state information and control overhead, at an eventual cost of QoS degradation. Measuring
network utilization and congestion can be expressed by the estimation and control of parameters
such as bandwidth, delay, loss or ECN marks, during a given measurement period.
A generic example of edge-to-edge passive and active measurements performed in a multi-
class network domain is provided in Figure 3.4.
41
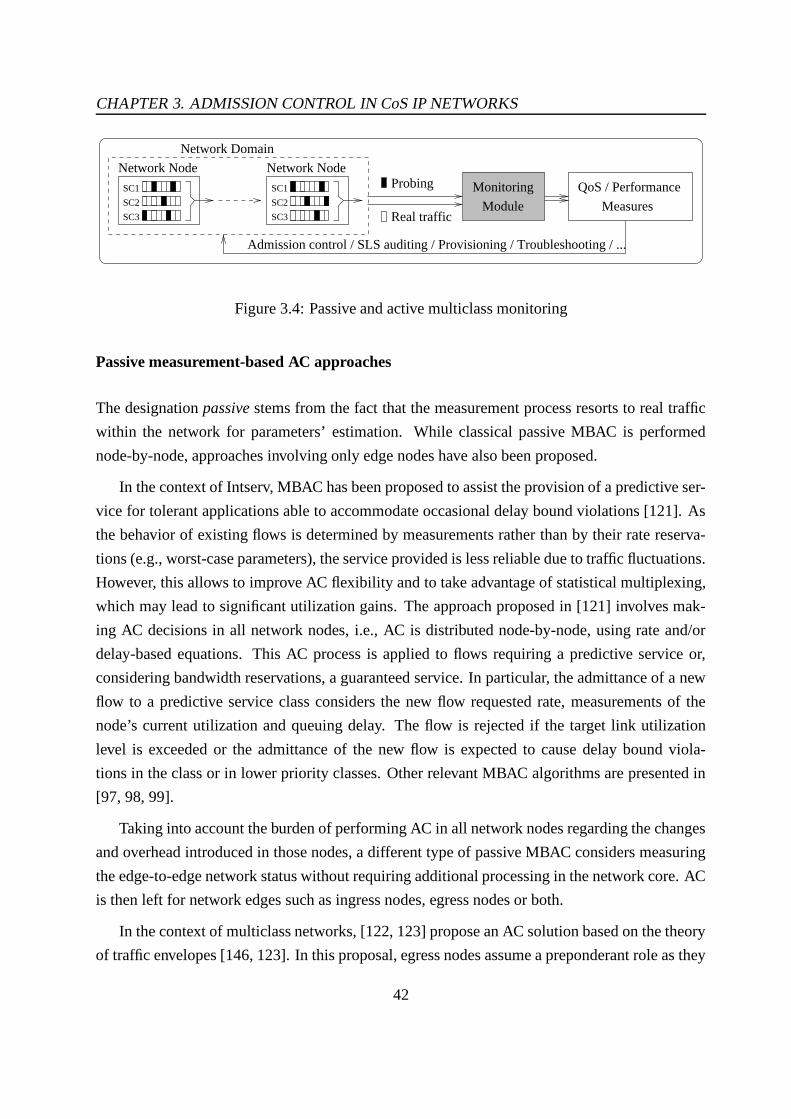
CHAPTER 3. ADMISSION CONTROL IN CoS IP NETWORKS
Real traffic
Probing Network Node
SC1
SC2
SC3
SC1
SC2
SC3
Network Node
Monitoring
Module
Admission control / SLS auditing / Provisioning / Troubleshooting / ...
QoS / Performance
Measures
Network Domain
Figure 3.4: Passive and active multiclass monitoring
Passive measurement-based AC approaches
The designation passive stems from the fact that the measurement process resorts to real traffic
within the network for parameters’ estimation. While classical passive MBAC is performed
node-by-node, approaches involving only edge nodes have also been proposed.
In the context of Intserv, MBAC has been proposed to assist the provision of a predictive ser-
vice for tolerant applications able to accommodate occasional delay bound violations [121]. As
the behavior of existing flows is determined by measurements rather than by their rate reserva-
tions (e.g., worst-case parameters), the service provided is less reliable due to traffic fluctuations.
However, this allows to improve AC flexibility and to take advantage of statistical multiplexing,
which may lead to significant utilization gains. The approach proposed in [121] involves mak-
ing AC decisions in all network nodes, i.e., AC is distributed node-by-node, using rate and/or
delay-based equations. This AC process is applied to flows requiring a predictive service or,
considering bandwidth reservations, a guaranteed service. In particular, the admittance of a new
flow to a predictive service class considers the new flow requested rate, measurements of the
node’s current utilization and queuing delay. The flow is rejected if the target link utilization
level is exceeded or the admittance of the new flow is expected to cause delay bound viola-
tions in the class or in lower priority classes. Other relevant MBAC algorithms are presented in
[97, 98, 99].
Taking into account the burden of performing AC in all network nodes regarding the changes
and overhead introduced in those nodes, a different type of passive MBAC considers measuring
the edge-to-edge network status without requiring additional processing in the network core. AC
is then left for network edges such as ingress nodes, egress nodes or both.
In the context of multiclass networks, [122, 123] propose an AC solution based on the theory
of traffic envelopes [146, 123]. In this proposal, egress nodes assume a preponderant role as they
42
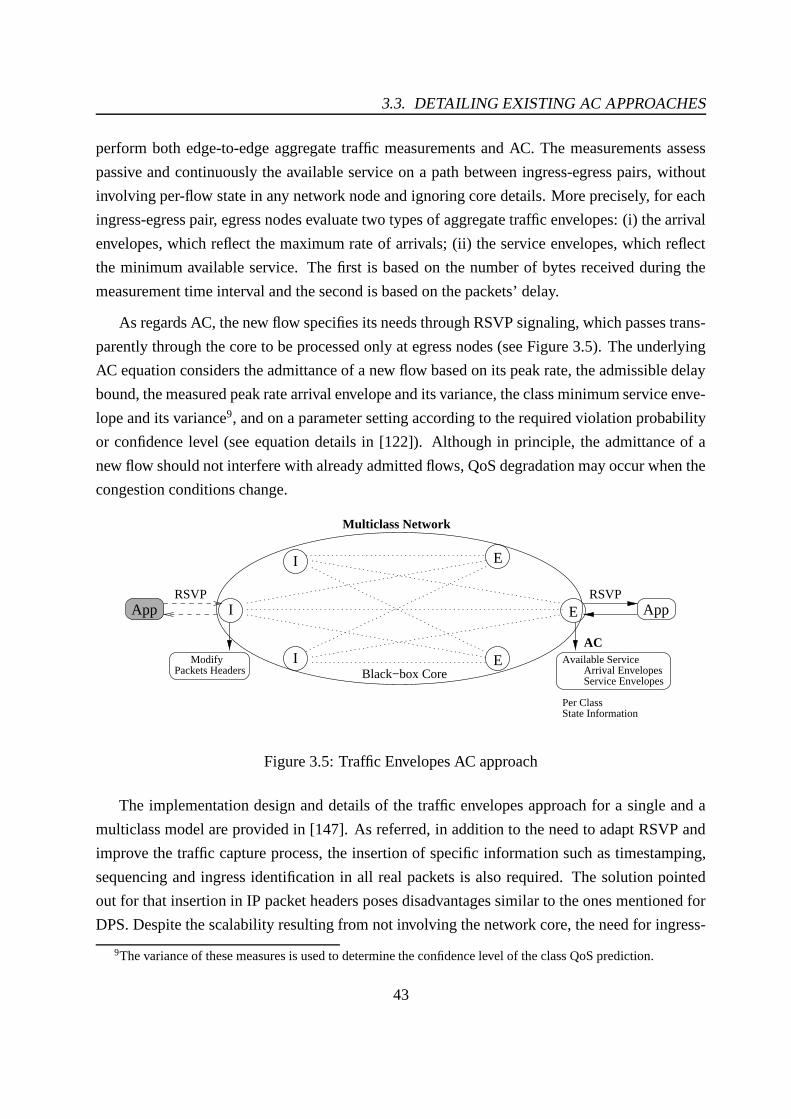
3.3. DETAILING EXISTING AC APPROACHES
perform both edge-to-edge aggregate traffic measurements and AC. The measurements assess
passive and continuously the available service on a path between ingress-egress pairs, without
involving per-flow state in any network node and ignoring core details. More precisely, for each
ingress-egress pair, egress nodes evaluate two types of aggregate traffic envelopes: (i) the arrival
envelopes, which reflect the maximum rate of arrivals; (ii) the service envelopes, which reflect
the minimum available service. The first is based on the number of bytes received during the
measurement time interval and the second is based on the packets’ delay.
As regards AC, the new flow specifies its needs through RSVP signaling, which passes trans-
parently through the core to be processed only at egress nodes (see Figure 3.5). The underlying
AC equation considers the admittance of a new flow based on its peak rate, the admissible delay
bound, the measured peak rate arrival envelope and its variance, the class minimum service enve-
lope and its variance9, and on a parameter setting according to the required violation probability
or confidence level (see equation details in [122]). Although in principle, the admittance of a
new flow should not interfere with already admitted flows, QoS degradation may occur when the
congestion conditions change.
I EApp App
I
I E
E
Available ServiceArrival EnvelopesService Envelopes
RSVPRSVP
AC
Per ClassState Information
Packets HeadersModify
Multiclass Network
Black−box Core
Figure 3.5: Traffic Envelopes AC approach
The implementation design and details of the traffic envelopes approach for a single and a
multiclass model are provided in [147]. As referred, in addition to the need to adapt RSVP and
improve the traffic capture process, the insertion of specific information such as timestamping,
sequencing and ingress identification in all real packets is also required. The solution pointed
out for that insertion in IP packet headers poses disadvantages similar to the ones mentioned for
DPS. Despite the scalability resulting from not involving the network core, the need for ingress-
9The variance of these measures is used to determine the confidence level of the class QoS prediction.
43
CHAPTER 3. ADMISSION CONTROL IN CoS IP NETWORKS
egress continuous measurements makes the solution more oriented to a single domain than to
end-to-end. Moreover, the problematic of controlling SLSs is neither covered in this approach
nor in the passive and active AC proposals discussed below.
In [148], measurements of the quality experienced by on-going Voice over IP (VoIP) ses-
sions are used to perform AC both at ingress and egress IP telephony gateways of a best-effort
IP network. In particular, loss and delay statistics computed at egress are shared between peer
gateways and used in the setup phase for AC. The corresponding AC equation resorts to aggre-
gate measures that are compared to pre-defined thresholds to decide if a new VoIP call can be
accepted. To support this passive approach, it is also necessary to insert additional fields such as
call identifiers, sequence numbers and timestamps in the existing VoIP packets and to be able to
identify peer gateways.
For Diffserv networks, a set of dynamic provisioning algorithms for edge nodes based on
utility functions and measures of traffic load in the network core is proposed in [88].
Active measurement-based AC approaches
In opposition to passive measurement, the designation active measurement is adopted when spe-
cific traffic, called probing traffic, is injected into the network for measurement purposes. As
regards AC, this technique intends to overcome the overhead associated with signaling and AC
processing in network nodes, leaving uniquely to endpoints (end-systems or edge routers) the
responsibility of inferring the network congestion status between them and of deciding on flow
admission. This inference process resorts to per-flow probing traffic to obtain measures of delay,
jitter, loss or ECN marks reflecting the congestion along the corresponding path, assessing simul-
taneously the path ability to support the new flow. AC approaches based on this technique are
commonly called Endpoint Admission Control, Probe-based Admission Control or End-to-end
Measurement-based Admission Control (EMBAC) [127, 124, 125, 126, 131, 137].
Generically, in EMBAC, the admission of a new flow is preceded by a probing phase where a
stream of probing packets with similar characteristics to the flow to be admitted is sent from the
sender endpoint to the receiver endpoint. After this phase, the receiver endpoint reports to the
sender the measured congestion level suffered by probes so that it can decide on the correspond-
ing flow admission. Alternatively, the receiver endpoint may decide itself based on the specified
flow admittance limits, informing the sender accordingly. The sender endpoint upon receiving
AC feedback either enters in a data phase, where flow packets are sent, or aborts the sending
44
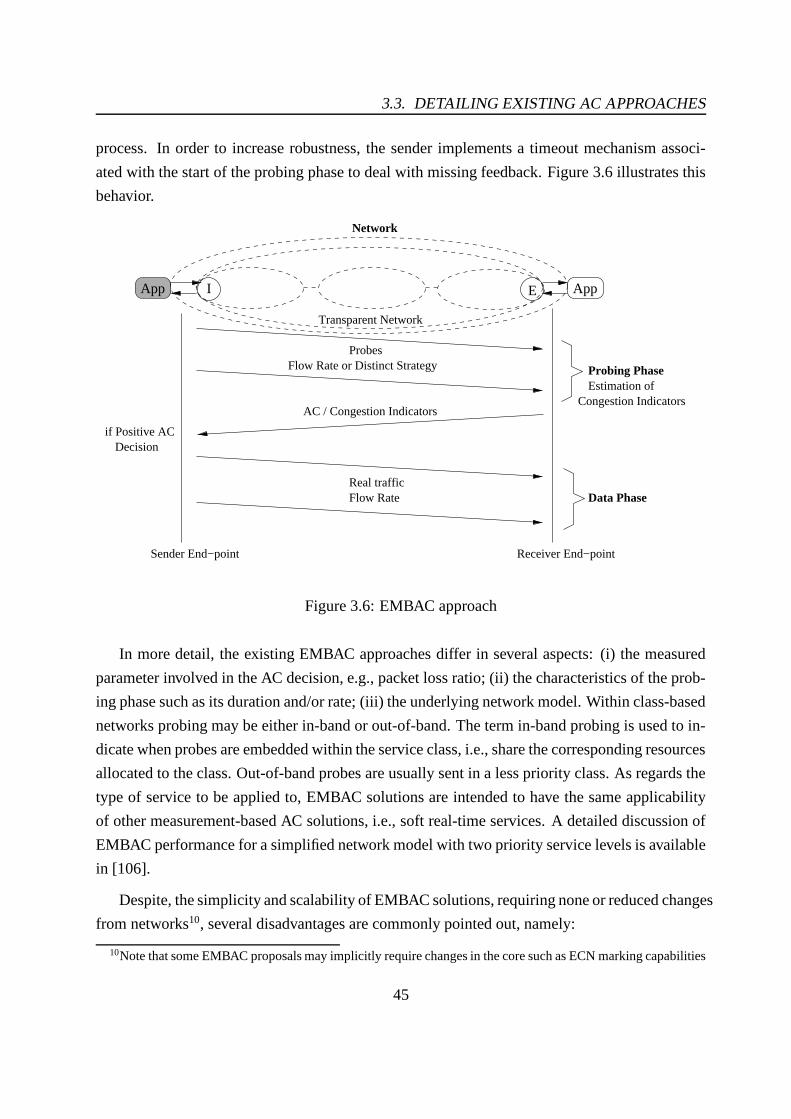
3.3. DETAILING EXISTING AC APPROACHES
process. In order to increase robustness, the sender implements a timeout mechanism associ-
ated with the start of the probing phase to deal with missing feedback. Figure 3.6 illustrates this
behavior.
App I E App
Sender End−point Receiver End−point
AC / Congestion Indicators
if Positive ACDecision
Flow Rate or Distinct StrategyProbes
Flow RateReal traffic
Data Phase
Probing PhaseEstimation of
Congestion Indicators
Transparent Network
Network
Figure 3.6: EMBAC approach
In more detail, the existing EMBAC approaches differ in several aspects: (i) the measured
parameter involved in the AC decision, e.g., packet loss ratio; (ii) the characteristics of the prob-
ing phase such as its duration and/or rate; (iii) the underlying network model. Within class-based
networks probing may be either in-band or out-of-band. The term in-band probing is used to in-
dicate when probes are embedded within the service class, i.e., share the corresponding resources
allocated to the class. Out-of-band probes are usually sent in a less priority class. As regards the
type of service to be applied to, EMBAC solutions are intended to have the same applicability
of other measurement-based AC solutions, i.e., soft real-time services. A detailed discussion of
EMBAC performance for a simplified network model with two priority service levels is available
in [106].
Despite, the simplicity and scalability of EMBAC solutions, requiring none or reduced changes
from networks10, several disadvantages are commonly pointed out, namely:
10Note that some EMBAC proposals may implicitly require changes in the core such as ECN marking capabilities
45
CHAPTER 3. ADMISSION CONTROL IN CoS IP NETWORKS
: their significant initial latency or setup delay, usually in the order of seconds which may
limit its attractiveness for certain applications;
: the overhead of per-flow probing traffic. Although the probing phase allows to assess
beforehand the effect the new flow will have on the network performance, it will contribute
to the overall network load, which may lead to QoS degradation depending on the weight
and overlapping degree of the current probing phases;
: the inherent problems caused by probes stealing bandwidth from established flows and
denial of service situations when simultaneous probing attempts congest the network and
none is accepted although resources are available [106, 61]11;
: the use of a single probing sampling during a reduced period of time to infer congestion
makes the measurements very dependent on the network congestion felt at the moment.
This probing time may also impair the estimation of low loss ratios [106];
: this technique is more suitable to be used by trustable sources and, similarly to MBAC, it
tends to favor less demanding QoS flows or flows crossing a shorter path [106, 99].
3.3.6 AC proposals to control elastic traffic
Although performing AC for real-time traffic is generically consensual, the need to control the
admission of elastic TCP traffic is more arguable, dividing opinions. While some argue that once
TCP is adaptive controlling the number of flows sharing the available bandwidth is unneces-
sary, others are in favor saying that controlling the overload is required in order to preserve an
acceptable throughput per active flow, and thus, the QoS offered to users [129, 130, 131, 132].
Actually, network overload leads to packet loss and retransmission, to a bandwidth share de-
crease among flows, which may result in the interruption of some flows due to users’ impatience
or triggered by TCP or higher layer protocols. Both the packet retransmission process and the
or the ability to change specific probing fields. When the endpoints are edge routers, the implementation of that ACstrategy in these nodes is also needed.
11According to [106], when multiple flows enter the probing phase at once and no one succeeds, the system entersinto a thrashing regime, i.e., the cumulative level of probe traffic impairs new admissions even when the networkcould afford to support part of them. To reduce this problem, the authors suggest using a slow start probing andearly rejection mechanisms. Stealing is another problem pointed out in [106], which may occur as consequenceof the scheduling mechanism behavior. In multiclass networks stealing may also occur when borrowing betweenclasses is allowed, and a probing phase in a low load high priority class leads to flow acceptance which may causedegradation to the existing flows in less priority classes using borrowed bandwidth [137].
46
3.3. DETAILING EXISTING AC APPROACHES
reattempts of initiating aborted flows affect negatively network stability and efficiency, leading
eventually to congestion collapse [129, 132]. In fact, a minimum TCP bandwidth is required to
achieve a minimal session level user utility [130] and the use of AC will assure that, avoiding
wasting network resources on retransmissions and incomplete transfers [129].
Due to the large number of TCP flow arrivals and their eventual small duration, controlling
individual flows using explicit signaling and reservations is impracticable, therefore, in general, a
measurement-based AC approach for elastic traffic is proposed to assure that the solution is able
to react and scale properly. Without per-flow signaling, the detection and acceptance/rejection of
a new flow is made implicitly. Common implicit AC criteria [130, 131, 132] use the estimation of
current load, available bandwidth or packet loss probability, comparing the obtained estimation
with a pre-defined threshold, which may depend on an upper limit of admitted flows. These
estimates can relate to a link or path, however, path estimations are preferable when considering
AC only performed at ingress nodes. In this context, several proposals for path estimations are
summarized in [132].
Within implicit AC the simple discard of initial flow packets is usually enough to inform the
source of a rejection decision, otherwise those packets will proceed. In more detail, possible
solutions to support detection and corresponding AC decision are:
: to detect packets initializing the TCP connection (TCP SYN and/or SYN ACK); drop these
packets or send an RST to the sender or to the involved parties, in case of rejection [130];
: to maintain a list of accepted and active flows based on the corresponding flow identifiers.
Each incoming packet is forwarded if its identifier is in the list of flows, otherwise, being a
packet of a new flow, it is forwarded (and its flow identifier inserted in the list) or dropped
depending on the acceptance decision [132].
While the former solution is easy to implement, the latter may be more flexible but critical for
high-speed interfaces due to its potential overhead.
As a final remark, the implicit AC concept can be applied to other traffic than TCP, for
instance, to UDP traffic from real-time applications that do not send explicit signaling to the
network (see further discussion in Section 5.3.1).
47

CHAPTER 3. ADMISSION CONTROL IN CoS IP NETWORKS
3.3.7 QoS related projects: the AC perspective
The problematic of supporting QoS in multiservice IP networks has been topic of research within
several projects [149, 150, 151, 152, 153, 154]. In general terms, these projects propose encom-
passing QoS architectures covering multiple aspects related to traffic control, resource manage-
ment and other relevant issues for QoS deployment. Part of these projects’ deliverables are
mainly focused on defining the architecture components and their interaction from a high ab-
straction level, leaving open the adoption of multiple solutions to deal with concrete tasks such
as AC. For instance, AC directives range from centralized to distributed models based on either
parameter-based or measurement-based AC criteria.
In brief, the AC proposal for intradomain and end-to-end operation within Internet2 project
[154] falls within the BB centralized approach presented in Section 3.3.4. Both Tequila [61, 2]
and Aquila [155, 54] projects consider centralized and distributed entities. While AC decision
entities are distributed, a central entity controls their operation in a larger temporal scale than
per-flow AC.
Tequila architecture covers the most relevant aspects of QoS management, including SLSs
management and AC, however, the AC approach is described at very high level, not detailing and
formalizing concrete AC equations to be applied in order to obtain an integrated and end-to-end
QoS solution [2, 84, 61].
More recently, in the Mescal project, a follow up of Tequila outcome, the AC approach is
further detailed [156, 157]. AC is performed at ingress nodes based on algorithms that consider
the available bandwidth on those nodes, as reflecting the minimum available bandwidth in any
of the possible paths. The control of SLSs is not covered and the multidomain approach is based
on the control of the peak rate at the ingress nodes. Thus, concerning AC, simple assumptions
are made and a single node/link evaluation is provided. Conversely, in Mescal deliverables,
especially in [65] an in-depth analysis and proposals for the problematic of SLS management
both intra and interdomain is provided.
As regards AC, Aquila goes further on detailing distinct AC equations to be applied for each
of the supported traffic classes [54]. Aquila’s QoS architecture considers AC at ingress nodes,
and eventually at egress nodes, and includes five classes. Apart from best-effort, in the remaining
classes AC is explicit and supported by parameter-based equations that consider existing reser-
vations and the link capacity allocated for each class. In Aquila testbed, the AC evaluation con-
siders the access link capacity, without covering SLS control [54]. Although Aquila approach is
48

3.4. COMPARING THE MAIN CHARACTERISTICS OF AC APPROACHES
oriented to per-flow treatment, per-flow reservations are aggregated. The interdomain operation
is sustained by the Border Gateway Reservation Protocol (BGRP)12 [160].
The AC proposal presented in this thesis falls within the QoS-II project [153].
3.4 Comparing the main characteristics of AC approaches
Considering the high-level characteristics of AC approaches identified in Section 3.1 and the
detailed discussion provided in Section 3.3, Table 3.7 summarizes the most relevant aspects of
the studied approaches in order to allow an easier comparison between them.
3.5 Motivation for a new AC proposal
Conceptually, the present discussion surveying the characteristics of current AC approaches
clearly illustrates the compromise between the level of QoS guarantees and the complexity in-
troduced in the network control plane. In fact, the stricter the QoS guarantees are, the tighter the
control of network resources usage needs to be. A broad view over the AC approaches evolution
exhibits a tendency in adopting solutions based on measurements of network usage and perfor-
mance rather than solutions bringing too much state information about reserved resources into
the network. Therefore, the move is toward simpler and more implementable solutions at cost of
eventually relaxing the service levels guarantees.
In multiservice environments, where different QoS levels need to be provided, all the high-
lighted aspects make difficult to achieve an encompassing AC approach that is simultaneously
simple and easy to deploy. When considering its operation across multiple domains, where dis-
tinct QoS solutions are likely to be in place and existing SLSs’ need to be fulfilled, the challenge
is even higher.
Despite the wide range of AC approaches proposed in the literature, from which the most
representative have been discussed above, few studies deal with the management of multiple in-
12In [158], the BGRP aggregation process efficiency is compared to an alternative approach called Shared-segment Interdomain Control Aggregation Protocol (SICAP) [159]. In this approach, over-reservation is consideredin the process of releasing aggregated resources. This means that resources are not completely released when a flowresource release message occurs. Instead, considering the initial reservation, fewer resources are released and thecreated over-reservation allows decreasing signaling overhead.
49

CH
APT
ER
3.AD
MISSIO
NC
ON
TR
OL
INC
oSIP
NE
TW
OR
KS
Envelopes
At endpointsPer flow in probing phaseNo state in the network
Between endpointsTransparent to network
ImplicitFlow detection
Active Mon.EMBAC
Service guaranteesTight resources control
Easy deploymentLow complexity
ProprietaryDifficult to deploy Changes in all nodes Packets updatingRoute enforcement
widely
Eventual QoS degradationDifficult to deploy widely
Fairness
Difficulties in high−speed interfacesHeavy flow tables (if used)
Easy deploymentScalability
At all nodes
RSVP/AggRSVP
Net. Paradigm / Service Type
Guaranteed or Predictive
Guaranteed Service
Guaranteed or PredictiveDiffserv or proprietary
Best−effort
Predictive
CoS − ProprietaryAdjustable to Diffserv
Predictive
CoS − Proprietary or DiffservPredictive
Best−effort
with dist. or cent. control
Distributed
Distributed
CentralizedDistributed BBs
Distributed
Distributed
Distributed
Per flow or aggregateDistributed
Explicit
Explicit
Per flow at edgesPer aggregate in core
Explicit − two distinct phasesEnd−systems − Edges Internal signaling
At BBs
Per flow at edges for TC
Topology, SLSs, policiesPer flow or aggregate
Net. resources usage ExplicitEnd−systems/ingress and BB
At all nodesUsually per aggregate
Explicit
ExplicitAt egress nodesPer class and Ingress−Egress pair
End−systems − Egress
Flow profile
Flow profile
Flow profile
of aggreg. reserved bw
Flow profile
Estimated upper−bound
Available resources SLS status
Flow profile
Flow profile
Service envelopesArrival envelopes
Available resources (bw)
Available resources Reserved or Measured
Reserved or Measured
Available resources (bw)Rate and/or delay
Measured
Measured service
Congestion indicatorsMeasured
Thresholds
Current loadAvailable bandwidthCongestion indicators
Measured
Passive Mon.MBAC
Passive Mon.
Elastic traffic
BB
Intserv/Diffserv
SCORE/DPS
Main AdvantagesAC criteriaState InformationArchitectureAC Approach
Main Disadvantages
(IS/DS)
Reserved or Measured(MBAC)
Best−effort
dependent on DS control strategy,
Edge and core simplifiedService guaranteesGlobal network vision
SLSs managementSignaling overhead (intra and interdomain)
Single point of failure and congestionLarge amount of info. to manage
Distributed BBs: resources fragmentation BBs coordenation
Latency and Scalability
Service guarantees
Scalable core . Low state information at core
Involves only edge nodes
Service guarantees Measurement overhead
Best−effort
IS region dimension and control, RSVP request type
AC in all nodes
DS − AC at boundaries
AC in all nodes
AC at egress
AC in all nodes
AC at endpoints
DistributedAC at boundaries
Eventual per−flow tables
At ingress nodes
No state in the network
AC in AggRSVP nodes
Intserv Inserv
Guaranteed or PredictiveIntserv/Diffserv
Intserv−like
CoS or Best−effort
CoS −
Mapping functions needed
Dependence on a single entity
Control overhead State information
Difficult to deploy widely Signaling
Initial latencyPer flow probing intrusionStealing and thrashing regimesQoS estimation based on one sampleQoS instability and Fairness
Signaling
Embedded in packets
Changes in all packets
Difficult to deploy end−to−endnumber of I− E combinations
AggRSVP−Aggregated state information
IS − At all nodes
Measures for AC
DS − At edges / BB / PDPPer flow or aggregate
IS − AC all nodes/Agg.
Adjustable to Diffserv Proprietary (IS−like)
Tradeoff service guarantees vs. scalability
Flexibility to improve control rules
Better resources usageLess conservative
Take advantage of stat. multiplexingFlexibility to adjust to traffic fluctuations
Black−box core
Low state informationEnd−to−end operation
Low state information
Scalability problems
Figure3.7:
Com
parisonof
AC
approaches
50

3.6. SUMMARY
tradomain QoS levels and interdomain SLSs simultaneously [38, 85], lacking in formalizing a
generic model with concrete and flexible AC equations to be deployed in CoS networks. How-
ever, studying the characteristics, virtues and weaknesses of current AC approaches provides
valuable knowledge to ground and devise enhanced AC proposals.
In this context, the new AC model described in detail in Chapter 5 brings new insights to
perform an encompassing and lightweight AC in multiservice class-based environments. The
proposed AC model aims to: (i) support multiple services with distinct assurance levels; (ii)
control the QoS levels inside each domain and the existing SLSs between domains; (iii) operate
intra and interdomain providing an unified end-to-end solution; (iv) be simple, flexible, efficient,
scalable and easy to deploy in real environments.
Facing the debate on related work, several aspects were identified as relevant for pursuing
these objectives namely, distributing control between edge nodes, relieving network core from
control tasks, reducing state information and control overhead, sensing and adapting to network
dynamics through measurements, supporting AC irrespectively of applications’ ability to explicit
requirements and signaling the network. In addition, although not covered in the studied AC
approaches, a certain degree of overprovisioning should be considered to achieve a simple and
manageable multiservice AC solution. This degree, which should be service-dependent, aims at
simplifying the AC process while providing the required service level guarantees.
Following these characteristics, the AC model is fully defined and specified in Chapter 5,
where concrete per-class AC equations are proposed to cover the model operation both intra and
interdomain. The comparison of the proposed monitoring-based approach with other MBAC and
EMBAC solutions is left for Section 5.7.
3.6 Summary
In this chapter, the need to perform AC in multiservice IP networks has been justified and the
main AC approaches surveyed. This survey starts with an identification of the multiple high-level
aspects that distinguish existing AC approaches. Then, after a brief service-oriented overview,
a detailed description of the main proposals in the field has been presented. Although this dis-
cussion has covered the AC perspective in IP networks following distinct QoS paradigms, the
emphasis has been given to approaches proposed for class-based IP networks. Identifying their
main virtues and limitations, and assessing the existing trade-off between complexity and as-
51

CHAPTER 3. ADMISSION CONTROL IN CoS IP NETWORKS
surance has sustained the motivation for proposing a new encompassing and lightweight AC
approach for multiservice class-based IP networks. The defined AC criteria comprise comple-
mentary rules for QoS and SLS control, which are driven by feedback resulting from systematic
on-line monitoring. Thus, the problematic of QoS and SLS monitoring will be discussed in the
next chapter before detailing the proposed AC model, which will occur in Chapter 5.
52

Chapter 4
Monitoring QoS and SLSs
Monitoring today’s IP networks assumes a crescent and crucial role both for service providers
and customers as it provides valuable inputs for service provisioning, management and auditing
tasks. This role is further stressed in multiservice network environments where distinct QoS
profiles and service specifications need to be fulfilled. Currently, it is commonly accepted that
systematic network monitoring has to be carried out as it allows to: (i) keep track of the ongoing
QoS and network performance levels; (ii) verify SLSs compliance; (iii) provide feedback to
traffic control mechanisms; (iv) trigger network recovery procedures and, generically, (v) support
traffic engineering decisions. Network operators, service providers and customers want to have a
well-defined and objective view of network services’ performance. While network operators and
service providers aim at efficient resource utilization, high performance and competitiveness,
customers want to get the level of service they expect and pay for. In this way, the research
community and industry has made strong efforts to define relevant network performance metrics
and in developing measurement methodologies, measurement tools and monitoring systems for
their estimation and control.
The monitoring process should provide measures reflecting the real status of the network
without introducing significant overhead or interfering with operational network traffic. To
achieve this, measurements have to be accurate, fast and carried out on a regular basis, while
minimizing intrusion. In multiclass networks, where each traffic aggregate receives a distinct
treatment, QoS evaluation needs to be carried out in a per-class basis so that each class measur-
ing requirements and behavior are met and sensed properly. In the context of the present work,
this evaluation has to be performed on-line so that AC decisions are made in useful time based
53
CHAPTER 4. MONITORING QoS AND SLSs
on the current view of the network.
This chapter discusses the problematic of QoS monitoring, emphasizing the use of on-line
monitoring in multiclass networks. Starting with a debate on different monitoring approaches,
the focus is given on identifying relevant QoS metrics and efficient monitoring strategies for
their estimation, mainly from an edge-to-edge perspective. This analysis constitutes a funda-
mental background to define the characteristics of the monitoring process that will provide the
feedback to support the AC model operation. The remaining of the chapter focuses on scalability
considerations about monitoring systems.
4.1 Identifying relevant monitoring systems characteristics
Monitoring systems play a key role in the support of traffic engineering and service manage-
ment of IP networks [161, 162, 22]. These systems may provide monitoring information to assist
service and network operational tasks and decisions in different time scales. The temporal res-
olution of network events may vary from coarse time periods, for instance, when planning the
advisable network capacity, to fine time intervals when events occur at packet level. Depending
on the time granularity involved in these events, monitoring can be carried out off-line or on-line,
i.e., based on a pos-processing or real-time data analysis. Off-line monitoring is more oriented
to guide long-term decisions and provide a broad view of the network operation, accounting and
diagnostic. On-line monitoring is specially oriented to provide feedback to short or medium term
network management and traffic control mechanisms, i.e., the monitoring outcome is required
to drive reactive mechanisms so that traffic control decisions can be made without being decou-
pled from the current network status. Currently, with the need of QoS and SLS control, on-line
monitoring is also required to provide up-to-date information of network services’ performance.
Furthermore, SLS auditing, formerly taken as an off-line task, assumes a crescent relevance as an
on-line task [74, 92], as customers are increasingly demanding in assessing the provided service
levels on a near real-time basis.
As regards the metrics’ computation overhead, off-line monitoring may require huge amounts
of storage resources but it is a fairly straightforward process. Computing metrics on-line can be
a difficult task, specially in high-speed networks due to high traffic volumes and very low packet
processing time. Ideally, the measurement process should not interfere or should have marginal
impact on the normal network behavior.
54
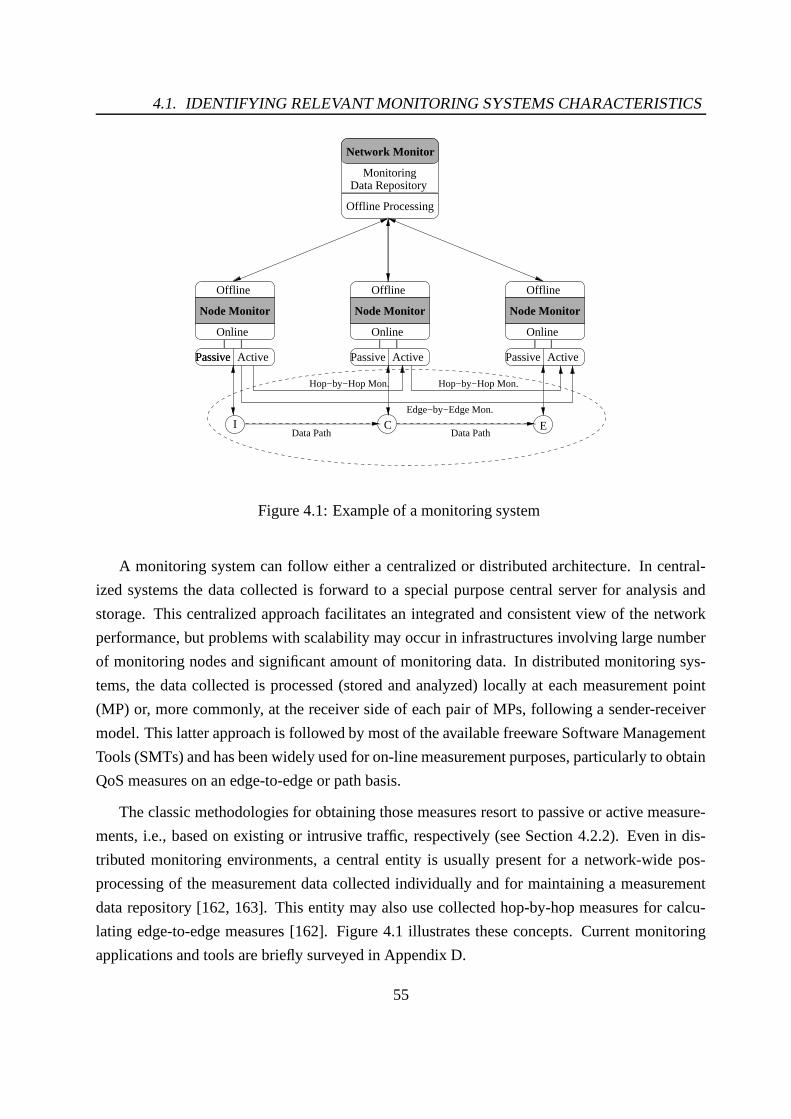
4.1. IDENTIFYING RELEVANT MONITORING SYSTEMS CHARACTERISTICS
Network Monitor
MonitoringData Repository
Offline Processing
C EIData Path Data Path
Hop−by−Hop Mon. Hop−by−Hop Mon.
Edge−by−Edge Mon.
Node Monitor
Online
Offline
Passive Active
Node Monitor
Online
Offline
Node Monitor
Online
Offline
Passive Passive PassiveActive Active
Figure 4.1: Example of a monitoring system
A monitoring system can follow either a centralized or distributed architecture. In central-
ized systems the data collected is forward to a special purpose central server for analysis and
storage. This centralized approach facilitates an integrated and consistent view of the network
performance, but problems with scalability may occur in infrastructures involving large number
of monitoring nodes and significant amount of monitoring data. In distributed monitoring sys-
tems, the data collected is processed (stored and analyzed) locally at each measurement point
(MP) or, more commonly, at the receiver side of each pair of MPs, following a sender-receiver
model. This latter approach is followed by most of the available freeware Software Management
Tools (SMTs) and has been widely used for on-line measurement purposes, particularly to obtain
QoS measures on an edge-to-edge or path basis.
The classic methodologies for obtaining those measures resort to passive or active measure-
ments, i.e., based on existing or intrusive traffic, respectively (see Section 4.2.2). Even in dis-
tributed monitoring environments, a central entity is usually present for a network-wide pos-
processing of the measurement data collected individually and for maintaining a measurement
data repository [162, 163]. This entity may also use collected hop-by-hop measures for calcu-
lating edge-to-edge measures [162]. Figure 4.1 illustrates these concepts. Current monitoring
applications and tools are briefly surveyed in Appendix D.
55
CHAPTER 4. MONITORING QoS AND SLSs
Besides the temporal and architectural aspects discussed above, other relevant characteristics
of today’s monitoring system have also been identified in [81]. For instance, a measurement
infrastructure should be: (i) flexible in order to accommodate an evolving environment, such
as new service demands; (ii) secure, contemplating authentication and authorization issues; (iii)
capable of providing trustable and exchangeable measurement results, in special, to support mea-
surements across multidomain environments1; (iv) independent of the operating system; (v) able
to support active and passive measurements with low overhead; (vi) capable of supporting test
facilities for end-users and network managers.
4.2 The problematic of QoS monitoring
Despite the generic characteristics of a monitoring system discussed above, there is a clear need
to obtain an unified and accurate view of the Internet quality, performance and reliability through
a set of concrete and well-defined metrics. Thus, in practice, the problematic of monitoring
involves the definition of adequate metrics, measurement methodologies and timing decisions.
The following sections will focus on the main concerns and recent developments regarding these
aspects.
4.2.1 Definition of metrics
The definition of metrics requires identifying relevant parameters and statistics for different as-
pects of network behavior. Both International Telecommunications Union - Telecommunication
Standardization Sector (ITU-T) work on QoS in IP networks and the IP Performance Metrics
(IPPM) WG within IETF have devoted substantial efforts to this topic [165, 22, 166]. IPPM
aims at developing a set of standard metrics providing unbiased quantitative measures of qual-
ity, performance and reliability of operational Internet services, proposing also measurement
methodologies for the defined metrics [22, 167, 168, 169, 170, 171, 172, 173]. Examples of
operational environments and projects using IPPM outcome are RIPE-NCC TTM [92] and Sur-
veyor [174, 175]. Although adopting different terminology, ITU-T work is fairly consistent in
1The requirements of a One-Way Active Measurement Protocol (OWAMP) to support interoperability betweenmeasurements of one-way performance metrics are identified in [164]. Such protocol should provide the ability tomeasure, record and distribute results of measurements of one-way singleton metrics (see Section 4.2.1) allowing tocreate an interoperable measurement environment independent of devices’ vendors and OWAMP implementations.
56
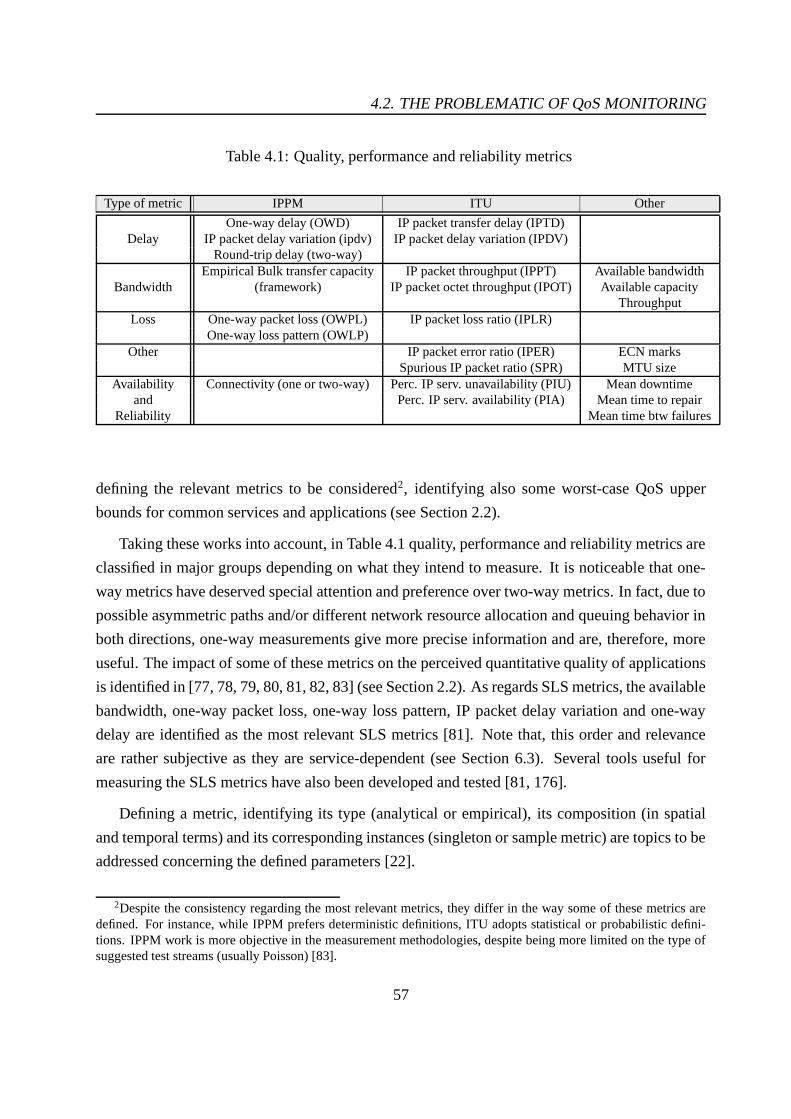
4.2. THE PROBLEMATIC OF QoS MONITORING
Table 4.1: Quality, performance and reliability metrics
Type of metric IPPM ITU Other
One-way delay (OWD) IP packet transfer delay (IPTD)Delay IP packet delay variation (ipdv) IP packet delay variation (IPDV)
Round-trip delay (two-way)Empirical Bulk transfer capacity IP packet throughput (IPPT) Available bandwidth
Bandwidth (framework) IP packet octet throughput (IPOT) Available capacityThroughput
Loss One-way packet loss (OWPL) IP packet loss ratio (IPLR)One-way loss pattern (OWLP)
Other IP packet error ratio (IPER) ECN marksSpurious IP packet ratio (SPR) MTU size
Availability Connectivity (one or two-way) Perc. IP serv. unavailability (PIU) Mean downtimeand Perc. IP serv. availability (PIA) Mean time to repair
Reliability Mean time btw failures
defining the relevant metrics to be considered2, identifying also some worst-case QoS upper
bounds for common services and applications (see Section 2.2).
Taking these works into account, in Table 4.1 quality, performance and reliability metrics are
classified in major groups depending on what they intend to measure. It is noticeable that one-
way metrics have deserved special attention and preference over two-way metrics. In fact, due to
possible asymmetric paths and/or different network resource allocation and queuing behavior in
both directions, one-way measurements give more precise information and are, therefore, more
useful. The impact of some of these metrics on the perceived quantitative quality of applications
is identified in [77, 78, 79, 80, 81, 82, 83] (see Section 2.2). As regards SLS metrics, the available
bandwidth, one-way packet loss, one-way loss pattern, IP packet delay variation and one-way
delay are identified as the most relevant SLS metrics [81]. Note that, this order and relevance
are rather subjective as they are service-dependent (see Section 6.3). Several tools useful for
measuring the SLS metrics have also been developed and tested [81, 176].
Defining a metric, identifying its type (analytical or empirical), its composition (in spatial
and temporal terms) and its corresponding instances (singleton or sample metric) are topics to be
addressed concerning the defined parameters [22].
2Despite the consistency regarding the most relevant metrics, they differ in the way some of these metrics aredefined. For instance, while IPPM prefers deterministic definitions, ITU adopts statistical or probabilistic defini-tions. IPPM work is more objective in the measurement methodologies, despite being more limited on the type ofsuggested test streams (usually Poisson) [83].
57
CHAPTER 4. MONITORING QoS AND SLSs
Formal definition of metrics
The formal definition of the QoS metrics related to the current work is briefly presented in this
section, debating the different perspective ITU-T and IETF IPPM may have on them. The defi-
nition of other less commonly used metrics is available in [165, 166, 177, 69].
According to [22], the metrics are usually defined as:
: singleton metrics - atomic or single instance metrics;
: sample metrics - derived from singleton metrics by taking a given number of distinct in-
stances, e.g., to verify metrics variations and consistencies;
: statistical metrics - derived from a given sample metric by computing statistics of the
obtained values. For instance, mean, median, maximum, minimum, percentile and inverse
percentile are possible statistics to be applied to a particular sample.
For many Internet metrics, the value of the metric depends on the type of IP packets used to make
the measurement3. Due to this property, IPPM has introduced the notation packet of type P [22],
which is used to define generic Type-P-* metrics and the corresponding measurement method-
ologies. In some contexts, P is explicitly or partially defined and, when performing real mea-
surements, these Type-P definitions need to be clearly specified. Without introducing a generic
notation, the need to include information about the packet type(s) within the populations of in-
terest when defining and evaluating performance parameters is also pointed out in [165].
A) Delay related metrics
: One-way Delay (OWD) - According to [167], the Type-P-One-way-Delay from a source
to a destination is defined as the time elapsed since the first bit of a Type-P packet leaves
the source until the last bit of that packet is received by the destination. Thus, intuitively,
it is the time required by a packet to be transmitted and fully received by the destination.
This definition considers the time needed by the first bit of the packet to go from source to
destination and the time needed to transmit all the bits of the packet. The first part includes
the propagation time of a link [22], which depends mainly on the physical distance, the
number and type of active/passive equipment crossed along the path and the instantaneous
3Examples of information identifying the type of packets can be the protocol number, UDP/TCP port numbers,size and precedence/ToS.
58
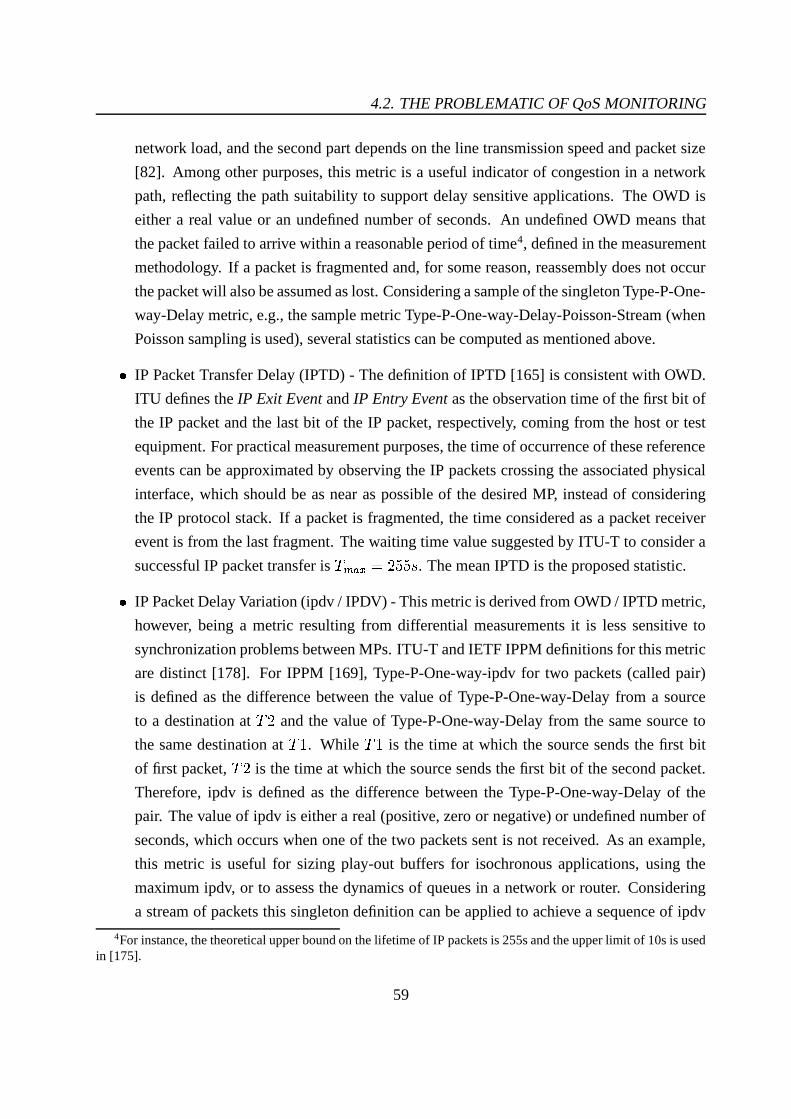
4.2. THE PROBLEMATIC OF QoS MONITORING
network load, and the second part depends on the line transmission speed and packet size
[82]. Among other purposes, this metric is a useful indicator of congestion in a network
path, reflecting the path suitability to support delay sensitive applications. The OWD is
either a real value or an undefined number of seconds. An undefined OWD means that
the packet failed to arrive within a reasonable period of time4, defined in the measurement
methodology. If a packet is fragmented and, for some reason, reassembly does not occur
the packet will also be assumed as lost. Considering a sample of the singleton Type-P-One-
way-Delay metric, e.g., the sample metric Type-P-One-way-Delay-Poisson-Stream (when
Poisson sampling is used), several statistics can be computed as mentioned above.
: IP Packet Transfer Delay (IPTD) - The definition of IPTD [165] is consistent with OWD.
ITU defines the IP Exit Event and IP Entry Event as the observation time of the first bit of
the IP packet and the last bit of the IP packet, respectively, coming from the host or test
equipment. For practical measurement purposes, the time of occurrence of these reference
events can be approximated by observing the IP packets crossing the associated physical
interface, which should be as near as possible of the desired MP, instead of considering
the IP protocol stack. If a packet is fragmented, the time considered as a packet receiver
event is from the last fragment. The waiting time value suggested by ITU-T to consider a
successful IP packet transfer is ÅcÆ�Ç�È � À ����/. The mean IPTD is the proposed statistic.
: IP Packet Delay Variation (ipdv / IPDV) - This metric is derived from OWD / IPTD metric,
however, being a metric resulting from differential measurements it is less sensitive to
synchronization problems between MPs. ITU-T and IETF IPPM definitions for this metric
are distinct [178]. For IPPM [169], Type-P-One-way-ipdv for two packets (called pair)
is defined as the difference between the value of Type-P-One-way-Delay from a source
to a destination at Å À and the value of Type-P-One-way-Delay from the same source to
the same destination at Å"� . While Å"� is the time at which the source sends the first bit
of first packet, Å À is the time at which the source sends the first bit of the second packet.
Therefore, ipdv is defined as the difference between the Type-P-One-way-Delay of the
pair. The value of ipdv is either a real (positive, zero or negative) or undefined number of
seconds, which occurs when one of the two packets sent is not received. As an example,
this metric is useful for sizing play-out buffers for isochronous applications, using the
maximum ipdv, or to assess the dynamics of queues in a network or router. Considering
a stream of packets this singleton definition can be applied to achieve a sequence of ipdv
4For instance, the theoretical upper bound on the lifetime of IP packets is 255s and the upper limit of 10s is usedin [175].
59
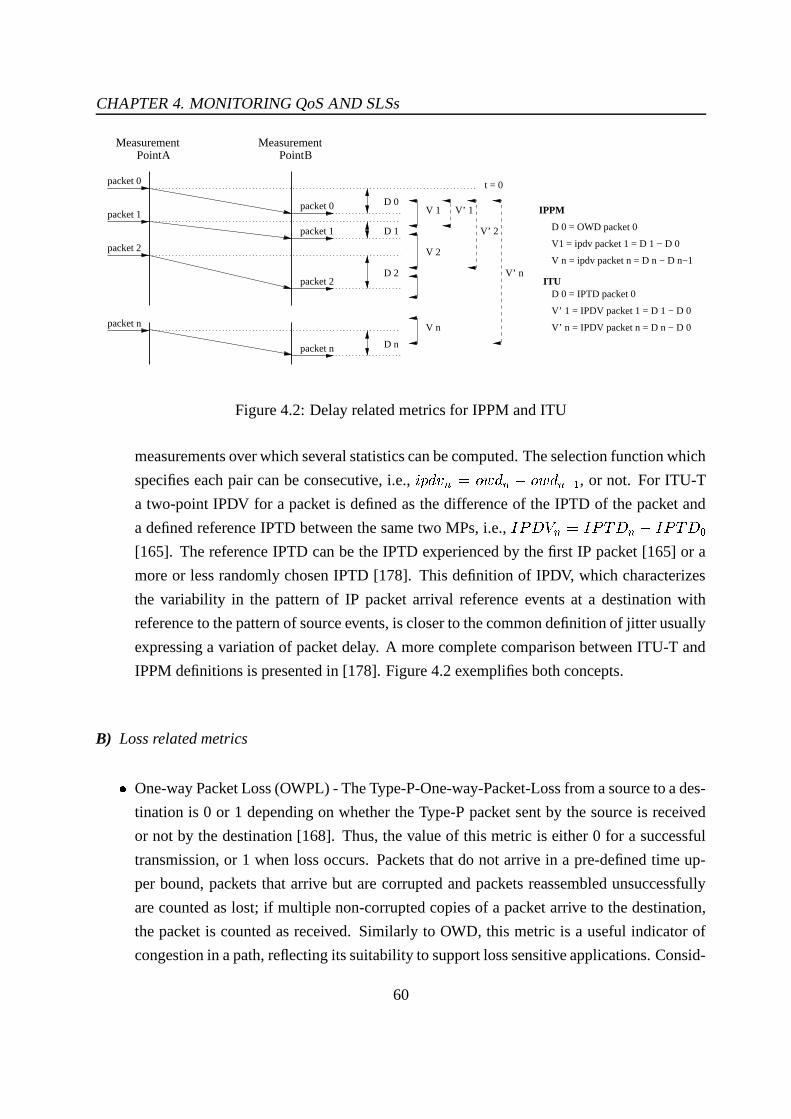
CHAPTER 4. MONITORING QoS AND SLSs
MeasurementPoint
MeasurementPoint A
packet 0
packet 1
packet 2
packet n
packet 0
packet 1
packet 2
packet n
B
t = 0
D 0
D 1
D 2
D n
V 1
V 2
V n
V’ 1
V’ 2
V’ n
IPPM
ITU
V1 = ipdv packet 1 = D 1 − D 0
V’ 1 = IPDV packet 1 = D 1 − D 0
V n = ipdv packet n = D n − D n−1
V’ n = IPDV packet n = D n − D 0
D 0 = OWD packet 0
D 0 = IPTD packet 0
Figure 4.2: Delay related metrics for IPPM and ITU
measurements over which several statistics can be computed. The selection function which
specifies each pair can be consecutive, i.e., É2ÊÌË�Í.Î �ÐÏ?Ñ Ë�Î& Ï�Ñ Ë�Î�ÒÌ� , or not. For ITU-T
a two-point IPDV for a packet is defined as the difference of the IPTD of the packet and
a defined reference IPTD between the same two MPs, i.e., ��#"ÓrÔÕÎ � ��#�ÅLÓ�Î�ÂÖ��#´ÅLÓb×[165]. The reference IPTD can be the IPTD experienced by the first IP packet [165] or a
more or less randomly chosen IPTD [178]. This definition of IPDV, which characterizes
the variability in the pattern of IP packet arrival reference events at a destination with
reference to the pattern of source events, is closer to the common definition of jitter usually
expressing a variation of packet delay. A more complete comparison between ITU-T and
IPPM definitions is presented in [178]. Figure 4.2 exemplifies both concepts.
B) Loss related metrics
: One-way Packet Loss (OWPL) - The Type-P-One-way-Packet-Loss from a source to a des-
tination is 0 or 1 depending on whether the Type-P packet sent by the source is received
or not by the destination [168]. Thus, the value of this metric is either 0 for a successful
transmission, or 1 when loss occurs. Packets that do not arrive in a pre-defined time up-
per bound, packets that arrive but are corrupted and packets reassembled unsuccessfully
are counted as lost; if multiple non-corrupted copies of a packet arrive to the destination,
the packet is counted as received. Similarly to OWD, this metric is a useful indicator of
congestion in a path, reflecting its suitability to support loss sensitive applications. Consid-
60

4.2. THE PROBLEMATIC OF QoS MONITORING
ering the sample metric obtained from the singleton Type-P-One-way-Packet-Loss metric,
statistics such as the average of packet loss in the stream can be computed.
: IP Packet Loss Ratio (IPLR) - According to [165], IPLR is the ratio of the total lost IP
packet outcome to the total transmitted IP packets in a population of interest. Conversely
to IPPM definition, packets that arrive corrupted are considered in a distinct metric, the IP
Packet Error Ratio. This may be useful for voice applications as they are able to distinguish
those packets [83].
: One-way Loss Pattern (OWLP) - Derived from OWPL, two sample metrics aiming at cap-
turing the loss patterns suffered by packet streams are defined in [170] - loss distance and
loss period. The loss pattern or loss distribution can be particularly relevant to the perfor-
mance of some real-time applications, involving voice and video, and non-real-time ap-
plications using an adaptive protocol such as TCP. Considering that the sequence number
of the test packets increases monotonically by one, the Type-P-One-Way-Loss-Distance-
Stream metric is defined as a sample of <loss distance, loss> pairs, where loss follows
the Type-P-One-way-Loss-Stream, and loss distance is 0 when loss is 0; otherwise, it is
the difference between the sequence number of the lost packet and the sequence number
of the packet that was previously lost. The Type-P-One-way-Loss-Period-Stream metric is
defined as a sample of <loss period, loss> pairs, where loss period is 0 when loss is 0 or n
if the loss is 1. The value n, initially set to 0, is increased by one each time loss is 1 except
for consecutive occurrences of 1; thus, the value of n indicates the loss period to which the
packet belongs.
C) Bandwidth related metrics
The terms bandwidth or throughput quantify the amount of data that a network link or network
path can transfer per unit of time (data rate), usually in bits per second [179]. In this context,
several bandwidth related metrics were defined, being the Empirical Bulk Transfer Capacity
(BTC), the capacity and the available bandwidth the most common. The first one is usually
only defined for an end-to-end path, being specific for congestion-aware transport protocols; the
last two can be defined for both individual links (per-hop) and data paths (end-to-end), and do
not depend on a specific transport protocol. The bandwidth estimation concept is understood
as being generic, involving the estimation of BTC, capacity and available bandwidth. A more
complete discussion on these metrics, on the most prevalent measurements methodologies for
their estimation and on the existing measurement tools is presented in [179].
61

CHAPTER 4. MONITORING QoS AND SLSs
: Empirical Bulk Transfer Capacity (BTC) - According to [173], BTC is a measure of the
network ability to transfer significant quantities of data with a single congestion-aware
transport connection such as TCP. Intuitively, it corresponds to the expected long-term av-
erage data rate, in bps, of a single TCP connection over the path. The diversity of transport
algorithms makes difficult the standardization of BTC metrics, however, the specific defi-
nition of BTC that must be reported by a BTC tool is ØÙÅLÚ � Ë�Û � ÛÒ /AÜÞÝ � Ä ÜAß ÛÞÊ /AÜ Ë�Ò � Épà Ü ,where Ë�Û � Û�Ò /AÜÞÝ � only represents data bits and retransmitted data is counted only once
[173]. A theoretical model for determining BTC or goodput of one TCP connection is
proposed in [180] and an implementation of this model can be found in [81]. In practice,
BTC is the maximum throughput obtainable by a single TCP connection [179]. Aggregate
TCP throughput is the sum of the throughputs of N parallel TCP connections [177].
: Capacity - According to [179], the capacity of a link depends on the underlying transmis-
sion technology and propagation medium whereas the capacity of a hop, which is lower,
is defined as the maximum possible IP layer transfer rate at that hop. When considering
a path, the capacity is the maximum possible throughput that a path can provide to a flow
and, therefore, the upper bound of the available bandwidth in the path. This metric is
relevant to debug, calibrate and manage a network path [177].
: Available bandwidth - The available bandwidth of a link is typically a time-varying met-
ric that relates to the unused or spare capacity of the link during a certain time period.
The available bandwidth of a path is the maximum possible throughput to saturate a path,
considering the current load. This metric is useful for predicting end-to-end performance
[177]. Figure 4.3 [177] illustrates the path capacity and path available bandwidth concepts.
Ci = capacity of link i ; (i=1...N) = min (Ci) = C1C
Path Capacity (C)
Ai = available bandwidth of link i; (i=1...N)Ai = Ci (1−Ui); Ui = utilization of link i in time interval T
A = min (Ai) = A3
Path Available Bandwidth (A)C1 A1
C2 A2
C3 A3
Figure 4.3: Path capacity and path available bandwidth
: The work reported in [165] envisages two types of throughput parameters: IP Packet
Throughput (IPPT), defined as the total number of successful IP packet transfer outcomes
62
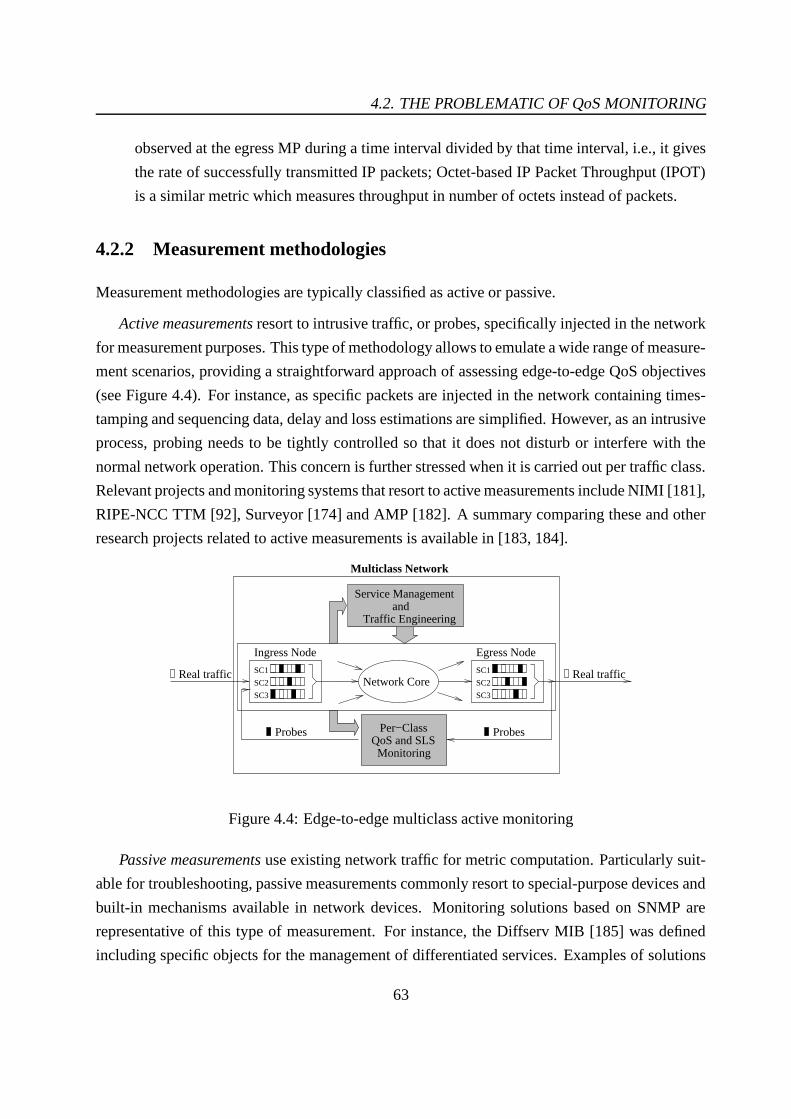
4.2. THE PROBLEMATIC OF QoS MONITORING
observed at the egress MP during a time interval divided by that time interval, i.e., it gives
the rate of successfully transmitted IP packets; Octet-based IP Packet Throughput (IPOT)
is a similar metric which measures throughput in number of octets instead of packets.
4.2.2 Measurement methodologies
Measurement methodologies are typically classified as active or passive.
Active measurements resort to intrusive traffic, or probes, specifically injected in the network
for measurement purposes. This type of methodology allows to emulate a wide range of measure-
ment scenarios, providing a straightforward approach of assessing edge-to-edge QoS objectives
(see Figure 4.4). For instance, as specific packets are injected in the network containing times-
tamping and sequencing data, delay and loss estimations are simplified. However, as an intrusive
process, probing needs to be tightly controlled so that it does not disturb or interfere with the
normal network operation. This concern is further stressed when it is carried out per traffic class.
Relevant projects and monitoring systems that resort to active measurements include NIMI [181],
RIPE-NCC TTM [92], Surveyor [174] and AMP [182]. A summary comparing these and other
research projects related to active measurements is available in [183, 184].
SC1
SC2
SC3
Egress Node
Network CoreReal traffic Real traffic
MonitoringQoS and SLS
Per−ClassProbes Probes
SC1
SC2
SC3
Ingress Node
andTraffic Engineering
Service Management
Multiclass Network
Figure 4.4: Edge-to-edge multiclass active monitoring
Passive measurements use existing network traffic for metric computation. Particularly suit-
able for troubleshooting, passive measurements commonly resort to special-purpose devices and
built-in mechanisms available in network devices. Monitoring solutions based on SNMP are
representative of this type of measurement. For instance, the Diffserv MIB [185] was defined
including specific objects for the management of differentiated services. Examples of solutions
63

CHAPTER 4. MONITORING QoS AND SLSs
oriented to passive measurements are Cisco’s NetFlow [186], tcpdump, Ethereal, NeTraMet,
CoralReef [176], and DAG-card based systems [187]. In high-speed networks, passive mea-
surements are a particular challenge, specially when all packets have to be accounted for, as the
amount of data gathered tend to be substantial and the packet processing time very small. To
deal with this, sampling techniques, more powerful hardware and new packet buffering tech-
niques may be required [188, 189].
Although passive techniques are usually used to monitor the performance of single nodes,
they can also be applied to edge-to-edge measurements, for instance, combining hop-by-hop
metrics along the network path. This allows reducing the network interference and amount of
synthetic traffic5, at expense of increasing processing and synchronization needs. According
to [162], the accuracy tests when measuring one-way delay and loss through active edge-to-edge
and hop-by-hop aggregation produced similar results. While this latter approach is claimed to
be more scalable (if assessed in terms of intrusive traffic load), the heterogeneity of network
nodes and the need for metrics portability may impair deploying large-scale passive monitoring
solutions. Moreover, obtaining edge-to-edge estimates combining link-by-link measures is not
an efficient and easy solution [190].
An alternative edge-to-edge approach still within the scope of passive measurements relies
on the analysis of information of real application flows (e.g., using TCP ACK or RTCP data).
This approach is also referred as passive probing [191].
To take advantage of the positive aspects of both methodologies, many authors propose the
use of integrated measurement environments, where passive and active measurements are com-
bined to achieve more scalable monitoring systems [162, 192, 163, 193, 188]. Due to their
characteristics, both methodologies are important for QoS monitoring and SLS auditing. The
metrics propagated by routing protocols can also provide useful QoS information about links
and paths to the edges.
Apart from direct measurements using probing traffic and aggregated measurements, other
methodologies identified in [22] include the projection of a metric from lower-level measure-
ments and the estimation of a metric at time�+�
from related metrics at time�Uá
. Additionally,
[22] identifies important properties for a measurement methodology, such as repeatability - the
methodology for the metric should be repeatable resulting in consistent measurements; conti-
nuity - small variations in conditions should result in small variations in measurement results;
5Actually, gathering and transport passive measurement data may also interfere with the normal network opera-tion. To reduce this overhead, event notification and statistics summaries may be used.
64

4.2. THE PROBLEMATIC OF QoS MONITORING
conservativeness - the act of measuring should not modify the value of the metric and certainty
- the measurements should be made using as few unconfirmed assumptions as possible. Uncer-
tainty and errors (e.g., from clock synchronization) should also be quantified, minimized and
documented.
ITU-T guidelines on measurement documentation include a clear identification of: network
sections under measurement; measuring time and samples length; exact measuring traffic charac-
teristics; type of measurement (in-band/out-of-band, active/passive) and measured data summary
(means, worst-cases and/or empirical quantiles).
Parameter estimation mechanisms
Apart from the measurement methodology itself, there are several measurement mechanisms that
can be used for parameter estimation [105, 107]. In particular, Time-Window, Point Sample and
Exponential Averaging mechanisms are commonly an option due to their simplicity. In brief,
Time-window (TW) computes an average for the parameter under control for every sampling pe-
riod 3 . After a window consisting of Å samples 3 , the highest average is taken as the estimation
for the next Å window. At any time, the estimate is immediately increased when a measured
sample is higher than the current estimation or a new flow is admitted. In the latter case, the
estimate is increased by the corresponding flow’s parameter value according to the parameter’s
semantics. For instance, when estimating network load, the advertised flow rate is added. At this
point, the window Å can be restarted so that a full new window is used to capture the new flow
impact. This avoids a too optimistic AC view of the network whenever the new flow traffic is not
immediately sensed by the measurements. Figure 4.5 illustrates the operation of TW, restarting
and without restarting Å . Point Sample (PS) simply takes a sample of the parameter in each
sampling period 3 as the average [105]. Exponential Averaging (EA) takes a sample of the pa-
rameter in each sampling period 3 , however, the average Í�â is computed as a function of previous
measurements Í and the current one Í�ã , i.e., Í â � ¹��äÂ�åc½�Í&ænåÕÍ?ã . The parameter å determines
the weight the new measurement has on the estimated average. Similarly to the time-window
mechanism, when a new flow is admitted, the estimate is artificially increased [121].
Tuning these mechanisms configuration, i.e., finding appropriate values for 3 and Å is ob-
viously a key point as regards the realism of the estimation. While 3 controls the measurement
sensitivity, Å controls the mechanism adaptability. A lower value of 3 leads to a higher sampling
frequency. This means that the mechanism is more reactive to bursts, leading to high measures,
ending up in a more conservative AC. In opposition, the larger 3 , the smoother the estimation
65
CHAPTER 4. MONITORING QoS AND SLSs
S S S S S ST
T
higherestimation
new flowarrival
estimationupdate
Time
S S S S S ST T
higherestimation
estimationupdate
new flowarrival
restarting Twithout
T
new estimation
S S S S S S ST
Loa
d
restarting T
S S S S S S S
Loa
d
TimeS S
Figure 4.5: Time window mechanism
process reacts to flow traffic variability. In this case, the number of accepted flows tends to in-
crease. The value of Å rules the window size. An higher Å leads to less frequent estimate updates
and more stability due to the memory effect of past estimates. This reduces the capacity of the
method to react, leading to a more conservative estimation approach. The window size Å also
needs to be balanced with the flow arrival rate and flow duration. While the former impacts on
how the time window is reinitialized, the latter may lead to overestimates in case of short-lived
flows. According to [121], the most visible effect on parameter estimation, and indirectly in AC,
results from tuning Å . This variable provides the most pronounced effect on the experienced
delay and link utilization.
In the context of AC, the measurement mechanisms described above are usually applied to
single node measurements. In this work, the same concepts are applied to edge-to-edge measure-
ments as discussed in Section 6.3.
66
4.3. MULTICLASS AND MULTIPURPOSE ACTIVE MONITORING
4.2.3 Timing issues
Focusing on an on-line monitoring process, the timing issues involved can be twofold. At a
higher level, timing decisions are related to the periodicity of measurements. Depending on
the measured parameters’ purpose, timing decisions can vary significantly. For instance, while
for AC a time scale ranging from seconds to minutes is appropriate [54, 194, 157], for active
queue management or packet scheduling mechanisms the operating time scale varies from pi-
coseconds to milliseconds [21]. Apart from being constrained by the temporal resolution of
the network control task, choosing a time scale should consider that a small time granularity
increases the metric computation and dissemination overhead, leading eventually to excessive
reaction to short-time traffic fluctuations, whereas a sparse granularity may lead to measures
reflecting out-of-date network state information.
At a lower level, timing decisions may require a solution to minimize or solve the problem
of accurate clock synchronization between MPs in different systems. This need is notorious
when measuring absolute time differences such as one-way delay [195], or when aggregating
hop-by-hop measurements. Usually, the choice of a synchronization solution should be made es-
tablishing a trade-off between accuracy, complexity and cost involved. Common solutions resort
to Network Time Protocol (NTP) or specific Global Positioning System (GPS) equipment strate-
gically located in the network. More recently, the clock associated with Code Division Multiple
Access (CDMA) mobile telephone network has been used as a highly accurate, synchronized
distributed clock source [196].
The impact of higher level timing decisions on the AC model evaluation results is discussed
in Chapter 7.
4.3 Multiclass and multipurpose active monitoring
For the reasons pointed above, active measurement techniques are particularly suitable for edge-
to-edge on-line QoS monitoring purposes, providing that the levels of intrusion are kept tightly
controlled.
Multiclass networks pose additional challenges to on-line active monitoring. As each traffic
aggregate receives a distinct treatment from either a node [62, 59] or domain perspective [39],
probing needs to be carried out in a per-class basis (in-band) so that it can be adjusted to each
class measuring requirements and the class behavior is correctly sensed (see Figure 4.4). Being
67

CHAPTER 4. MONITORING QoS AND SLSs
an intrusive process, probing in high priority classes may take over resources required by real
traffic not only in those classes but also in low priority ones. Therefore, special concern is needed
when defining the probing pattern characteristics [190].
Particularly in multiclass environments, an efficient on-line active monitoring should be an
accurate, fast, continuous, low-overhead and low-interfering process. While accurate and fast
measurements allow a correct assessment of the current network state providing up-to-date in-
formation, systematic measurements allow to auto-correct the measures and capture each traffic
class dynamics. As regards the overhead and interference introduced, the probing process should
avoid degrading the class’s QoS, e.g., decreasing the classes’ throughput or causing persistent
loss or delay.
Although active monitoring has been matter of interest in many research projects [174, 181,
197, 92, 163, 191, 162], extending it to multiclass networks [198, 162, 163, 191, 199, 200]
is crucial and a topic requiring further study. As mentioned, in multiclass networks efficient
strategies of in-band probing are fundamental in order to sense each class’s performance without
causing noticeable side effects on the class real traffic. To reduce intrusion and minimize probing
impact, a single probing pattern should be able to capture simultaneously multiple QoS metrics
of a class. To characterize this ability, the concept of multipurpose active monitoring is here
introduced. Investigating multipurpose probing patterns is also an objective of this work.
In this context, relevant questions to be answered are: How to extend the monitoring process
to a multiclass network environment, capturing each class QoS behavior and dynamics with
minimal overhead? Can a probing pattern capture more than one metric accurately, according to
the service class measuring requirements? Is there a trade-off among the simultaneous estimation
of multiple QoS metrics? Finding answers for these questions is addressed in Section 7.2.2.
4.3.1 Probing patterns
The type of probing patterns used for metric estimation varies according to the metrics to be com-
puted and the periodicity required for their evaluation. This variability involves changing both
the time and space characteristics of the probing pattern. For instance, for measuring delay and
loss related parameters continuously, simple and very low rate probing patterns have been in use
in real and experimental network environments (e.g., 2 pps [92] or 4 pps [175][174]). For band-
width estimation, several techniques such as Variable Packet Size (VPS), Packet Pair/Train Dis-
persion (PPTD), Self Loading Periodic Streams (SLoPS) and Trains of Packet Pairs (TOPP) have
68

4.3. MULTICLASS AND MULTIPURPOSE ACTIVE MONITORING
been proposed [201, 103, 179]. Common measurement tools based on these techniques [176,
202, 81, 203] use a high volume of packets (e.g., 100-5000 pkts) or probing rate and require a
significant amount of time to obtain a singleton measure (e.g., 40-100 RTTs) [204]. This slow
process impairs its use for continuous estimates due to the underlying overhead, being more
appropriate for sparse measurements.
For continuous measurements, common methods for collecting sample metrics use either pe-
riodic or random sampling6. In periodic sampling measurements are made evenly spaced in time.
Although being attractive for its simplicity, its eventual drawback is a possible synchronization
with a periodic behavior either of the metric itself or induced by a network component. More-
over, periodic network perturbations resulting from probing itself can drive the network into a
synchronization state, which may end up affecting the measure leading to biased metrics. In
random sampling, such as Poisson or geometric sampling, the samples are taken at independent,
randomly generated time intervals according to a statistical distribution. This avoids possible
synchronization effects, yielding to unbiased samples [22]. The Poisson distribution, which leads
to unpredictable sampling, is commonly used and recommended [22]. Despite having higher pre-
dictability, the uniform distribution is also used to bound the interval between samples, speeding
up the convergence of the estimation resulting from sampling.
Initial results on per-class active monitoring [17], extended in Section 7.2, suggest that com-
monly accepted and used probing patterns may fail to capture simultaneously common per-
formance metrics (see definitions in Table 6.3) in terms of shape and/or scale. Thus, in ad-
dition to periodic ( ÚÙØ 1èç ), Poisson ( #Ù%"� ç ) probing streams and On-Off exponential streams
( �!$#"%&% ç ), a new Back-to-Back On-Off probing source ( Ø À Ø ç ) with a deterministic On pe-
riod and an Off period either deterministic or regulated by an Exponential, Pareto or Uniform
distribution has also been developed and tested. The behavior of this Ø À ØRé probing source is
controlled by three parameters: (i) duration of the On period, where probes are sent at constant
rate; (ii) duration of the Off period, which may be deterministic or random; (iii) the probing rate,
determining the number of packets generated within the On period. The configuration of these
parameters determines the number of probing samples per second and how close back-to-back
probes are in time during each sample. Figure 4.6 illustrates the behavior of this new probing
source.
6These sampling approaches, when applied to active measurements, correspond to sending probe packets atconstant or random rate. However, recall that due to interference of other traffic, the sending probing pattern is notlikely to be maintained when the samples are collected.
69

CHAPTER 4. MONITORING QoS AND SLSs
4pps : rate = 3200bps
2 samples per sec (On/Off = 250ms)2pps : rate = 1600bps
4 samples per sec (On/Off = 125ms)
8pps : rate = 6400bps
4pps : rate = 3200bps
1 sample per sec (On/Off = 500ms)
4pps : rate = 3200bps
2pps : rate = 1600bps
(packet size = 100bytes)
2pps : rate = 1600bps
4pps : rate = 3200bps3pps : rate = 2400bps
1 sample per sec (On = 250 / Off = 750ms)
8pps : rate = 6400bps
4pps : rate = 3200bps4 samples per sec (On/ Random Off = 125ms)
2pps : rate = 1600bps
4pps : rate = 3200bps3pps : rate = 2400bps
− Low drop precedence probes
− High drop precedence probes
1 sample per sec (On = 250 / Off = 750ms)
Interleaved Colored (B2Bp) Probing Patterns
Back−to−back (B2Bp) Probing Patterns
Figure 4.6: Proposed probing scheme
70

4.4. SCALABILITY CONSIDERATIONS
The resulting back-to-back probing streams aim at increasing probing sensitivity to queue
variations by reducing the interpacket time between consecutive probes, while remaining simple
and light. Once again, as probing needs to be carried out on a systematic way, overhead has to
be tightly controlled to keep it deployable in real networks.
Moreover, a new approach of coloring probes, i.e., exploring the effect of marking probes
with different drop precedences, using single color or interleaved color schemes, has also been
explored (see Figure 4.6). This approach aims at exploring AQM actions in case of queue con-
gestion and the different probabilities of packets reaching the network boundary. This may be
particularly useful to sense packet loss in the network domain. For this purpose, a new po-
licer/marker able to mark packets with an interleaved color scheme has also been developed.
While single color mark schemes, i.e., schemes that send all probes as green or red packets, can
be easily obtained resorting to the configuration parameters of existing policers/markers, to ob-
tain an interleaved color scheme, where packets are marked red and green in a controlled way,
has required the development of a new policer/marker.
The study of probing pattern characteristics and its accuracy for multiple metrics estimation
in a multiclass test platform is further developed in Section 7.2.
4.4 Scalability considerations
A monitoring system where systematic measurements among a large number of measuring nodes
are required may suffer scalability limitations, specially when active measurements take place.
In fact, in a mesh measurement topology, the amount of data sent over the network, processed
and stored increases quadratically to the number ê of MPs, i.e., %�¹Uêë'X½ . This further stresses
the need for efficient and light probing patterns justifying research on enhancing probing ability
to be multipurpose [16].
Defining the borderline where scalability problems start to occur can be hard. As an example,
RIPE TTM [92, 190] currently supports up to 200 test-boxes (MP); MPLS networks can support
up to 40000 Label Switching Paths (LSPs) (200 nodes fully meshed), without problems [205]. In
addition, to reduce the number of combinations and consequently the eventual scalability prob-
lems, peering groups of MP [190] or hierarchical regions [205] can be defined. These approaches
are somehow followed in a measuring architecture that combines per-domain edge-to-edge per-
formance measures to obtain a measure of end-to-end performance, as the one proposed in the
present work. In [192] appropriate use of topology-based steering approaches and combined pas-
71
CHAPTER 4. MONITORING QoS AND SLSs
sive and active measurement methodologies are pointed to reduce the complexity of measuring
the connections between edge nodes from %�¹Jê ' ½ to %�¹ ßJÏAì ¹Uêí½B½ .In multiclass IP networks, where the amount of measurement data increases with the number
of service classes and interfaces being monitored, building scalable monitoring systems is even
more relevant. Research on this topic points out some principles to be followed, such as: the
monitoring process granularity should be at aggregate level (PHB or path) and not at microflow
level; the measures transmission overhead should be minimized using event notification and
statistics summarization; the amount of synthetic or intrusive traffic should be reduced. More-
over, establishing a trade-off between the amount of synthetic traffic and sampling frequency,
and combining hop-by-hop measurements when there is a large number of edge-to-edge com-
binations to monitor may contribute to increase scalability [162]7. Finally, as stated in Section
4.2.2, to achieve more scalable monitoring systems active and passive measurements methodolo-
gies are usually combined [162, 192, 163, 193, 188].
Regarding the proposed AC model, two main aspects have been considered in order to im-
prove QoS and SLS monitoring scalability. On the one side, measuring edge-to-edge services’
performance is carried out at aggregate level (per-class). This means that QoS control is only
performed at class level instead of SLS or flow level. This simplification stems from the fact that
a service class comprises and bounds multiple SLSs and multiple flows on an edge-to-edge basis.
At SLS level, the traffic load is the only parameter measured locally at ingress or egress nodes. In
this way, SLS monitoring overhead is reduced (see also comments in Sections 2.2.2 and 5.1.1).
On the other side, the use of multipurpose active monitoring brings potential advantages toward
scalability.
As regards monitoring flexibility and portability, from an “operational perspective”, the main
modules of the proposed AC model - the monitoring module and the AC module (see Section
6.5) - although interrelated are independent. Thus, the monitoring process and its implementation
details are hidden from the AC module and can be changed without compromising AC as long
as edge-to-edge QoS measures for each class are provided. This allows to accommodate easily
new developments in the research area of network QoS monitoring and new requirements of the
network services being monitored.
7Although this approach increases processing efforts, the reduction on synthetic traffic and the improvement inscalability result from the fact that a hop measurement is potentially a constituent of several edge-to-edge paths.
72

4.5. SUMMARY
4.5 Summary
In this chapter, the problematic of QoS and SLS monitoring has been discussed in order to sus-
tain an important component of the proposed AC model. Starting by a high-level presentation of
relevant characteristics of monitoring systems, the main research outcome regarding the defini-
tion of concrete metrics and measurement methodologies for QoS and SLS monitoring has been
highlighted. The emphasis of the discussion has been given to the need for on-line monitoring in
multiclass IP networks, as a way to provide up-to-date feedback to active network management
and traffic control mechanisms, in particular to AC.
The suitability of active measurement methodologies for edge-to-edge on-line QoS monitor-
ing purposes has motivated a more detailed discussion on this topic. In this context, the concept
of multipurpose probing pattern has been introduced, with the objective of characterizing the
ability of a single probing stream in capturing multiple QoS metrics of a service class simul-
taneously. This allows minimizing intrusive traffic and its impact on the class’s real traffic. In
addition, existing probing patterns have been discussed and a new colored probing pattern aim-
ing at a better multipurpose QoS estimation has been proposed. Finally, the eventual scalability
problems of an edge-to-edge monitoring process have been discussed and some principles for
improving monitoring scalability have been pointed out.
73

CHAPTER 4. MONITORING QoS AND SLSs
74

Chapter 5
Proposed Admission Control Model
Defining an AC strategy for multiservice class-based networks constitutes a challenge as service
classes have distinct characteristics and require different QoS assurance levels. As the service
predictability required is closely related to the complexity and overhead of the AC strategy,
finding a simple service-oriented AC model able to provide multiple QoS guarantees assumes
a relevant role in controlling network resources and service levels efficiently.
Despite the existing proposals for AC discussed in Section 3.3, achieving an encompassing,
yet feasible and lightweight AC model for CoS networks, able to control QoS and SLSs both
intra and interdomain, is still an open issue. This is behind the motivation for the present work,
as explained in Sections 1.1 and 3.5.
This chapter is entirely devoted to the presentation and specification of a new distributed
AC model for multiservice class-based IP networks. This service-oriented model is proposed as
a further step to pursue the objective outlined above. In this way, the main goals, underlying
ideas and initial assumptions of the proposed AC model are firstly discussed. Then, the model
architecture and generic operation are described. In order to provide a more detailed description
of the model, the main entities of a network domain concerning multiservice AC, SLS and QoS
management are formalized using an intuitive and expressive notation. This notation supports
the intra and interdomain AC criteria specification. Finally, the key points and major hurdles of
the model are analyzed and debated, emphasizing the problematic of handling concurrent AC.
75

CHAPTER 5. PROPOSED ADMISSION CONTROL MODEL
5.1 Initial strategic considerations
To design an encompassing and lightweight AC model for CoS networks several initial aspects
were identified as having major relevance. These aspects are as follows:
(i) the model should be multiservice - it should be able to control distinct network services and
assurance levels, handling applications and services with different QoS requirements and
traffic profiles;
(ii) the model should be multidomain - it should be able to operate both intradomain and end-
to-end, controlling both the QoS levels in a domain and the share of existing SLS between
domains. Although, in a first instance, intradomain AC is the major concern, covering the
interdomain operation is also relevant in order to fulfill the applications’ end-to-end QoS
requirements;
(iii) the underlying AC strategy should be efficient, scalable and flexible - AC should be accom-
plished without adding significant overhead and complexity to the network control plane,
contributing for an efficient management of network services and improving its ability to
scale. The flexibility of the AC proposal as regards accommodating technological, service
and application evolution goals should also be considered;
(iv) the model should be feasible - the model design should not be decoupled from its capacity to
be deployed in real environments, i.e., it should be driven by simplicity, easy deployment
and integration in the Internet, introducing minor changes to the CoS network operation.
The above design goals are particularly relevant when considering the deployment of the model
in a large scale, across multiple administrative domains relying, eventually, on distinct solutions
regarding service offering and provisioning.
5.1.1 The model underlying idea
Having in mind the strategic points mentioned above and the debate on current AC approaches
presented in Section 3.2, the inherent simplicity, flexibility and adaptability of a distributed AC
solution based on network monitoring assumes a clear advantage over other approaches. This
advantage is further stressed when monitoring is carried out from an edge-to-edge perspective,
76
5.1. INITIAL STRATEGIC CONSIDERATIONS
as internal network control, topology and technologies are hidden from AC. Although such ap-
proach allows high abstraction of the network core complexity and heterogeneity, network traffic
dynamics and QoS can yet be sensed and updated continuously through proper service metrics.
However, as explained in Section 3.3.5, common EMBAC models have known disadvantages
stemming from the introduction of per-application intrusive traffic and AC initial latency. More-
over, other edge-to-edge and end-to-end measurement-based AC approaches do not cover the
control of SLSs. Overcoming these disadvantages will contribute to enhance the performance
and functionality of AC.
In this context, an underlying idea of the proposed AC model is to take advantage of the need
for on-line QoS and SLS monitoring in today’s CoS networks and use the resulting monitoring
information to perform distributed AC. This monitoring process carried out on a per-class and
edge-to-edge basis allows a systematic view of each service class load, QoS levels and SLSs
utilization in each domain, while facilitating SLSs auditing tasks. Performing AC at edge nodes
using this feedback simplifies the network control plane, allows to make decisions on new flows’
admittance with minimum latency and, generically, allows to manage QoS and SLSs. In this
model, a domain is viewed as comprising distinct service classes encompassing accepted SLSs
and flows with similar QoS needs (see Figure 5.1). Thus, from a QoS control perspective, con-
trolling the QoS levels of service classes implicitly controls the QoS commitments of accepted
SLSs. In this way, controlling SLSs is reduced to SLS utilization control. These aspects are fun-
damental to alleviate the amount of state information and control overhead, increasing the model
scalability. When spanning multiple domains, collecting and accumulating the QoS measures
available at each domain edge nodes will allow to compute the expected end-to-end QoS.
Another important underlying idea toward model simplicity and flexibility is to consider a
certain degree of overprovisioning which, in practice, is often used and recommended [6, 206].
This is a relevant aspect to achieve a simple and manageable multiservice AC solution as it allows
relaxing the AC process, while widening the range of service types covered by a monitoring-
based AC solution. Introducing overprovisioning levels within the AC rules should consider the
service guarantees to be provided, i.e., its definition should be service-dependent1.
A discussion of the key points and major hurdles of the proposed AC strategy will be revisited
in Sections 5.7 and 5.8, after the AC model description.
1The use of AC approaches for multiservice networks based on measurements has been later stressed in [207],where measurement-based AC is recommended both for real-time and elastic traffic. The advantage of using per-class overprovisioning ratios has also been recently stressed in [6].
77

CHAPTER 5. PROPOSED ADMISSION CONTROL MODEL
AC perspectives
According to [10], two AC perspectives can be considered when an SLS is taken as reference:
(i) flow AC ensures that the admitted flows from a customer are within the capacity of the con-
tracted SLSs;
(ii) SLS AC ensures that the accepted SLSs for a service type can be honored through proper
service configuration and provisioning (see Figure 5.1).
Service m
Provider
Cus
tom
er C
1
Service 1
Provisioning
Configuration and
Flow 1
Flow i
Flow 1SLS C1
Cus
tom
er C
n
SLS CnFlow j . . .
Flow Admission Control SLS Admission Control
Figure 5.1: Flow AC and SLS AC
Although these are distinct AC perspectives, they follow similar principles. Whereas flow
AC is based on the traffic profile and QoS objectives of a flow, SLS AC is based on the aggregate
traffic profile and QoS objectives of the SLS. In fact, the semantics of the process is somehow
equivalent, changing the time and space characteristics upon which the decision is made 2. There-
fore, the proposed model, defined and explored here for flow AC, is likely to be easily extended
to SLS AC . However, dynamic SLS AC was left for future work (see Section 8.4).
5.1.2 Initial assumptions
This section reports a set of initial AC assumptions in order to clarify the forthcoming description
of the AC model architecture. These are as follows:
2SLS AC involves a different AC decision timeliness, changes the type and amount of network state informationto handle and involves (re)configuration tasks within domains.
78
5.1. INITIAL STRATEGIC CONSIDERATIONS
(i) the admission control is carried out at flow level implicitly or explicitly depending on the
type of applications. For applications involving multiple flows (e.g., composite applica-
tions such as videoconferencing) the overall admittance can be made following an appli-
cation dependent criterion. As mentioned in Chapter 3, covering the general case of flow
admission does not impair that other high-level AC heuristics may, in future, be in place;
(ii) the process of negotiation, acceptance and mapping of SLSs to the corresponding service
classes has already occurred at the time that flow AC takes place. This implies a process
of SLS validation and eventual qualitative to quantitative service requirements mapping
[75, 18]. This means that an existing or new service class has to be found to encompass and
bound the QoS parameters defined in each accepted SLS. The service class configuration
and provisioning is also assumed to have been carried out throughout the domain following
a static or dynamic approach;
(iii) the SLSs’ parameters define the service to be provided in one direction, i.e., the context of
an SLSs is unidirectional. However, note that bidirectional services/SLAs may be defined
through two unidirectional SLS instances [69]3. Similarly to SLSs, flow AC is handled
unidirectionally;
(iv) in a first instance, flow AC occurs at ingress nodes. These nodes are able to identify the
egress node that will be used by flows crossing the domain. Cases where this is not pos-
sible, e.g., whether topological information is not available or flows’ destinations are not
specified (e.g., multicast traffic), are discussed in Sections 5.6 and 5.8;
(v) although SLSs include the definition of a time scheduling period in which the service is due
to be provided, flow AC decisions report to a present time period and the flow’s duration
respects the corresponding SLS time scheduling.
During this chapter and in Section 8.4 some of these assumptions are revisited.
3An SLA may include multiple SLSs, however, an SLS is usually related to a service class usage in one direction.In the context of AC, as the relevant part of an SLA is the SLS, from now on only the term SLS is used. Similarlyto [5, 65], the administrative aspects of an SLA, e.g., pricing issues, are outside the scope of this work.
79

CHAPTER 5. PROPOSED ADMISSION CONTROL MODEL
5.2 Model architecture
5.2.1 Involved research topics
In the AC model, admission decisions are made taking into account both the levels of QoS
being offered for each service type and the corresponding SLSs utilization. Therefore, AC is
performed resorting to QoS and SLS control equations, specifically defined according to each
service characteristics. In this context, the model architecture strongly lays on research topics
such as service definition, QoS/SLS monitoring and CoS traffic characterization to sustain the
definition and operation of the AC decision criteria. Their interrelation is shown in Figure 5.2.
SLSs Id
StatisticalProperties
Agg
rega
te
Tra
ffic
Indi
vidu
al
Flow
s
QoS Param.
SLSs
Flow
s
QoS Measures
SLSs Utilization Measures
SLS/Flow AC
SLS/Flow Traffic Profile
AC Decision
Traffic Data
Traffic Properties
On−line
Off−line
AC rulesQ
oS C
ontr
ol
Controlled QoS Parameters
QoS Objectives
Traffic Characterization
SCi
SCi
ServiceDefinition
SCi
SLS
Con
trol
Safety Margins
Thresholds
AC Criteria
SCi
Monitoring
QoS
Met
rics
SLSs
Util
izat
ion
Traffic Collection
Figure 5.2: AC model architecture
Service definition, whose concept has been introduced in Section 2.2, formalized in Section
5.4 and instantiated in Section 6.1, involves the definition of basic services oriented to different
application requirements, the definition of the relevant QoS parameters to control within each ser-
vice type and the definition of SLSs’ syntax and semantics. The traffic flows requiring admission
can either belong to an SLS or not, as discussed in Section 5.5. Through systematic edge-to-edge
measures of the identified QoS parameters and SLSs utilization, on-line monitoring keeps track
of QoS and SLS status in the domain through well-defined metrics, providing feedback to drive
80
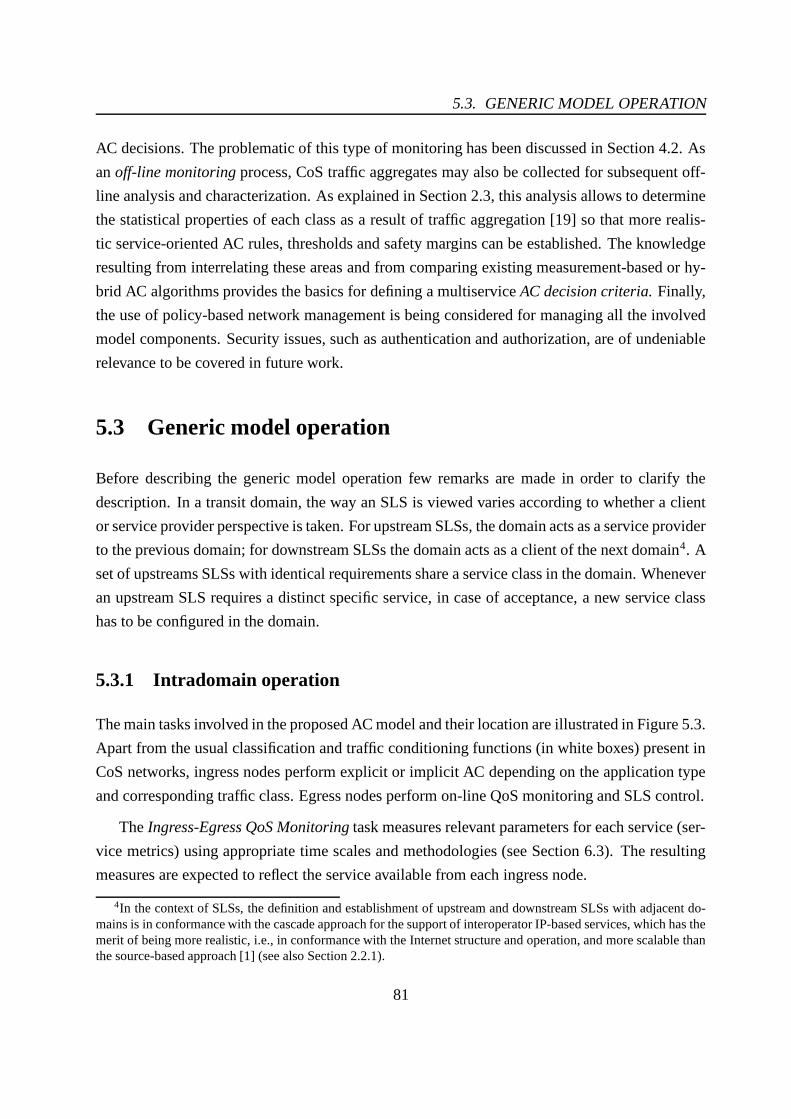
5.3. GENERIC MODEL OPERATION
AC decisions. The problematic of this type of monitoring has been discussed in Section 4.2. As
an off-line monitoring process, CoS traffic aggregates may also be collected for subsequent off-
line analysis and characterization. As explained in Section 2.3, this analysis allows to determine
the statistical properties of each class as a result of traffic aggregation [19] so that more realis-
tic service-oriented AC rules, thresholds and safety margins can be established. The knowledge
resulting from interrelating these areas and from comparing existing measurement-based or hy-
brid AC algorithms provides the basics for defining a multiservice AC decision criteria. Finally,
the use of policy-based network management is being considered for managing all the involved
model components. Security issues, such as authentication and authorization, are of undeniable
relevance to be covered in future work.
5.3 Generic model operation
Before describing the generic model operation few remarks are made in order to clarify the
description. In a transit domain, the way an SLS is viewed varies according to whether a client
or service provider perspective is taken. For upstream SLSs, the domain acts as a service provider
to the previous domain; for downstream SLSs the domain acts as a client of the next domain4. A
set of upstreams SLSs with identical requirements share a service class in the domain. Whenever
an upstream SLS requires a distinct specific service, in case of acceptance, a new service class
has to be configured in the domain.
5.3.1 Intradomain operation
The main tasks involved in the proposed AC model and their location are illustrated in Figure 5.3.
Apart from the usual classification and traffic conditioning functions (in white boxes) present in
CoS networks, ingress nodes perform explicit or implicit AC depending on the application type
and corresponding traffic class. Egress nodes perform on-line QoS monitoring and SLS control.
The Ingress-Egress QoS Monitoring task measures relevant parameters for each service (ser-
vice metrics) using appropriate time scales and methodologies (see Section 6.3). The resulting
measures are expected to reflect the service available from each ingress node.
4In the context of SLSs, the definition and establishment of upstream and downstream SLSs with adjacent do-mains is in conformance with the cascade approach for the support of interoperator IP-based services, which has themerit of being more realistic, i.e., in conformance with the Internet structure and operation, and more scalable thanthe source-based approach [1] (see also Section 2.2.1).
81

CHAPTER 5. PROPOSED ADMISSION CONTROL MODEL
I
I
I − EService Matrix
Flow T.C.
ControlAdmission
I E
I − EService Matrix
Classifier
SLS T.C.
AdmissionControl
T.C.
SLS Control
I − EQoS Monitoring
Classifier
Admission
SLS Control
I − EQoS Monitoring
E
QoS monitoring statisticsSLS utilization and parameters
App Request
Classifier
SLSE
QoS monitoring statisticsSLS utilization and parameters
ControlAdmission
SLS T.C.
T.C.
Figure 5.3: Location of tasks in a multiclass domain
The SLS Control task monitors the usage of downstream SLSs at each egress, to ensure that
traffic to other domains does not exceed the negotiated profiles and packet drop will not occur
due to a simple and indiscriminate TC process.
QoS monitoring statistics, SLS utilization and, eventually, other SLS parameters are then
sent to the corresponding ingress routers to update an ingress-egress service matrix used for
distributed AC and active service management. This notification may be carried out periodically,
when a metric value or its variation exceeds a limit, or the SLS utilization exceeds a safety
threshold. Although AC is considered to be carried out at network entrance, it is possible to
decouple it between ingress and egress nodes, as debated in Section 5.6.1.
Explicit and Implicit AC
As the proposed model aims to be multiservice, explicit and implicit AC can be in place depend-
ing on the application or service characteristics. Explicit flow AC is oriented to applications able
to signal the network with their traffic profile and QoS objectives. In this case, the AC decision
requires two initial verifications (see Figure 5.4):
(i) SLS Utilization Control checks if the downstream SLS can accommodate the traffic profile of
the new flow. Verifying if the upstream SLS can accommodate the new flow profile is op-
tional. As the adjacent upstream domain is assumed to have controlled the corresponding
downstream SLS traffic load, the current domain can control the upstream SLS aggregate
using a simple TC mechanism (SLS TC);
(ii) QoS Control checks if, for the corresponding egress node and service, the domain QoS status
82
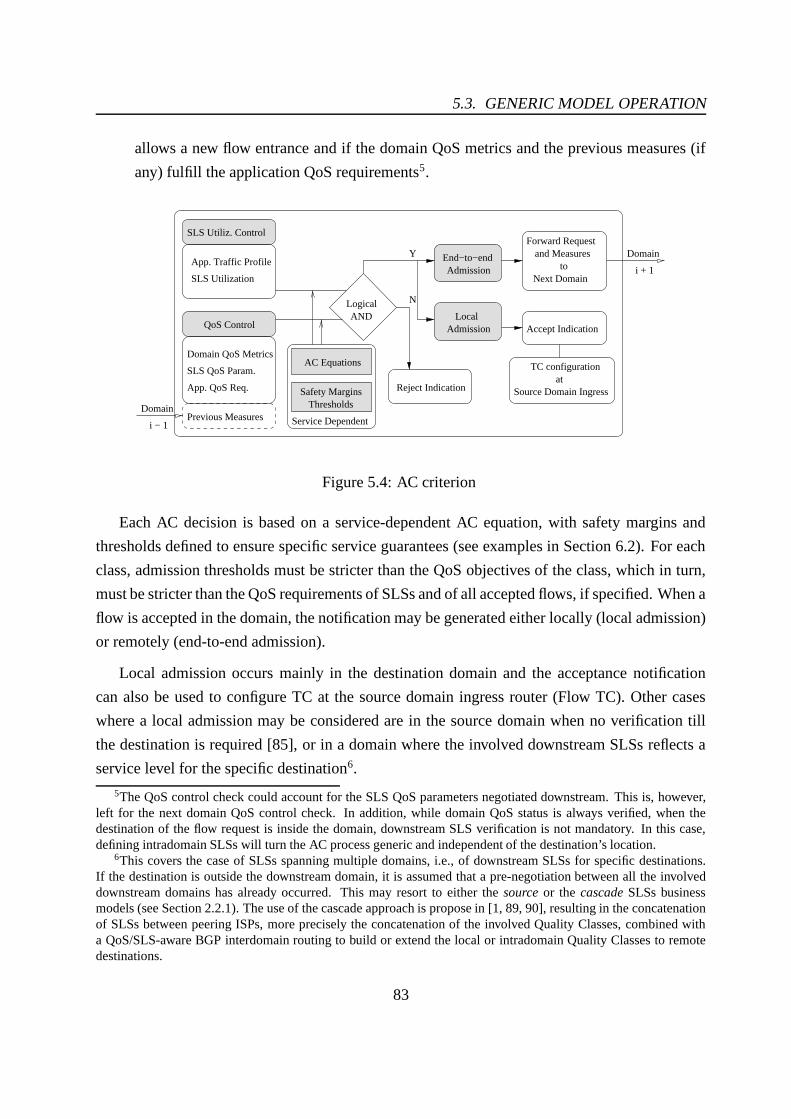
5.3. GENERIC MODEL OPERATION
allows a new flow entrance and if the domain QoS metrics and the previous measures (if
any) fulfill the application QoS requirements5.
App. Traffic Profile
SLS Utiliz. Control
Reject Indication
AdmissionEnd−to−end
Forward Request
Next Domain
and Measuresto
TC configurationat
Accept Indication
Source Domain Ingress
QoS Control
Previous Measures
N
Y Domain
Domain
ANDLogical
SLS Utilization
LocalAdmission
App. QoS Req.
SLS QoS Param.
Domain QoS Metrics
i + 1
i − 1 Service Dependent
Safety Margins
Thresholds
AC Equations
Figure 5.4: AC criterion
Each AC decision is based on a service-dependent AC equation, with safety margins and
thresholds defined to ensure specific service guarantees (see examples in Section 6.2). For each
class, admission thresholds must be stricter than the QoS objectives of the class, which in turn,
must be stricter than the QoS requirements of SLSs and of all accepted flows, if specified. When a
flow is accepted in the domain, the notification may be generated either locally (local admission)
or remotely (end-to-end admission).
Local admission occurs mainly in the destination domain and the acceptance notification
can also be used to configure TC at the source domain ingress router (Flow TC). Other cases
where a local admission may be considered are in the source domain when no verification till
the destination is required [85], or in a domain where the involved downstream SLSs reflects a
service level for the specific destination6.
5The QoS control check could account for the SLS QoS parameters negotiated downstream. This is, however,left for the next domain QoS control check. In addition, while domain QoS status is always verified, when thedestination of the flow request is inside the domain, downstream SLS verification is not mandatory. In this case,defining intradomain SLSs will turn the AC process generic and independent of the destination’s location.
6This covers the case of SLSs spanning multiple domains, i.e., of downstream SLSs for specific destinations.If the destination is outside the downstream domain, it is assumed that a pre-negotiation between all the involveddownstream domains has already occurred. This may resort to either the source or the cascade SLSs businessmodels (see Section 2.2.1). The use of the cascade approach is propose in [1, 89, 90], resulting in the concatenationof SLSs between peering ISPs, more precisely the concatenation of the involved Quality Classes, combined witha QoS/SLS-aware BGP interdomain routing to build or extend the local or intradomain Quality Classes to remotedestinations.
83
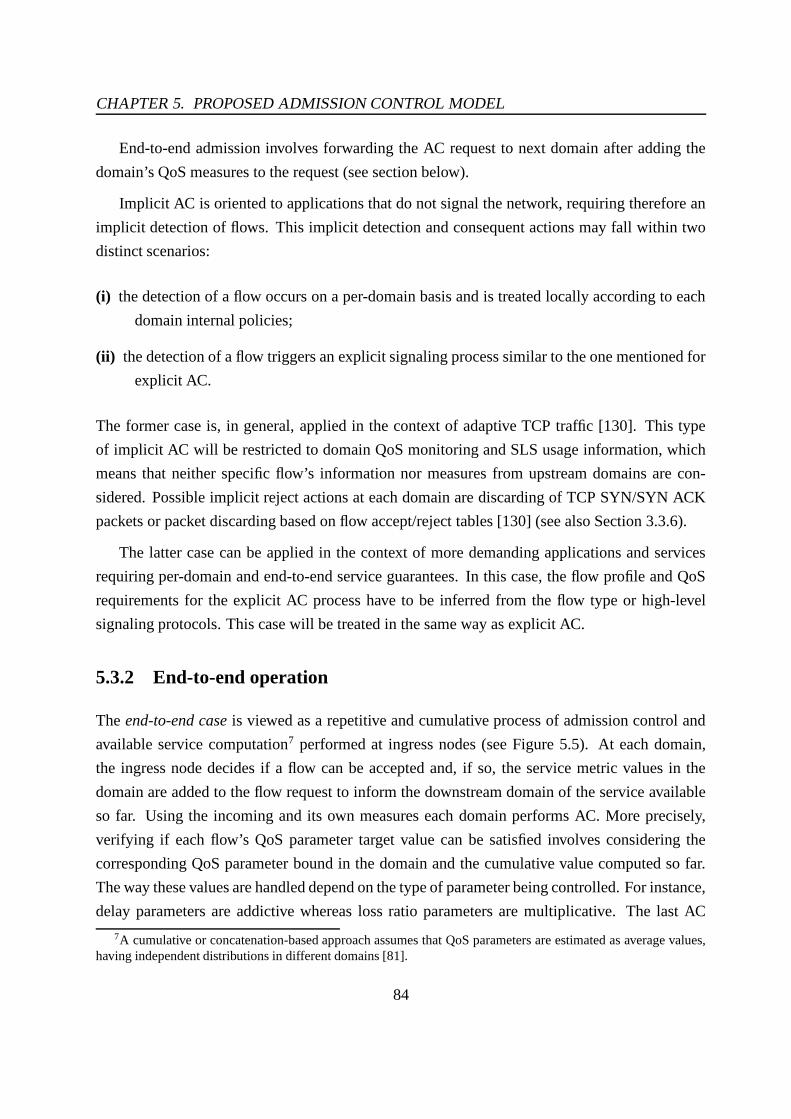
CHAPTER 5. PROPOSED ADMISSION CONTROL MODEL
End-to-end admission involves forwarding the AC request to next domain after adding the
domain’s QoS measures to the request (see section below).
Implicit AC is oriented to applications that do not signal the network, requiring therefore an
implicit detection of flows. This implicit detection and consequent actions may fall within two
distinct scenarios:
(i) the detection of a flow occurs on a per-domain basis and is treated locally according to each
domain internal policies;
(ii) the detection of a flow triggers an explicit signaling process similar to the one mentioned for
explicit AC.
The former case is, in general, applied in the context of adaptive TCP traffic [130]. This type
of implicit AC will be restricted to domain QoS monitoring and SLS usage information, which
means that neither specific flow’s information nor measures from upstream domains are con-
sidered. Possible implicit reject actions at each domain are discarding of TCP SYN/SYN ACK
packets or packet discarding based on flow accept/reject tables [130] (see also Section 3.3.6).
The latter case can be applied in the context of more demanding applications and services
requiring per-domain and end-to-end service guarantees. In this case, the flow profile and QoS
requirements for the explicit AC process have to be inferred from the flow type or high-level
signaling protocols. This case will be treated in the same way as explicit AC.
5.3.2 End-to-end operation
The end-to-end case is viewed as a repetitive and cumulative process of admission control and
available service computation7 performed at ingress nodes (see Figure 5.5). At each domain,
the ingress node decides if a flow can be accepted and, if so, the service metric values in the
domain are added to the flow request to inform the downstream domain of the service available
so far. Using the incoming and its own measures each domain performs AC. More precisely,
verifying if each flow’s QoS parameter target value can be satisfied involves considering the
corresponding QoS parameter bound in the domain and the cumulative value computed so far.
The way these values are handled depend on the type of parameter being controlled. For instance,
delay parameters are addictive whereas loss ratio parameters are multiplicative. The last AC
7A cumulative or concatenation-based approach assumes that QoS parameters are estimated as average values,having independent distributions in different domains [81].
84

5.4. SPECIFYING THE AC MODEL COMPONENTS
AC DecisionYes
AC DecisionNo
AC DecisionYes
AC DecisionNo
AC DecisionYes
AC DecisionYes
Setup
Reject
SLS
AC DecisionNo
NoAC Decision
Accept
Setup
EIApp EI EI AppSLS
Accept
Oth
er tr
ansi
t dom
ains
TC
Figure 5.5: End-to-end AC operation
decision is made by the receiver in its own domain, which is viewed as a local admission. When a
rejection occurs, the source is notified directly from the rejection point. This end-to-end solution
leads to a generic and fluid AC model, which can be applied to source, destination and transit
domains.
5.4 Specifying the AC model components
In order to specify the AC model and to provide a clear and detailed description of its opera-
tion in a multiclass and multidomain environment, the main network domain entities concerning
multiservice AC, SLS and QoS management need to be formalized [11].
Taking into account the overview of the AC model operation described above, the main com-
ponents of a network domain comprising multiple ingress and egress routers are specified re-
garding the provision of multiple services to customers (individuals or other domains). In such
domain, the following entities are considered:
(i) service classes;
(ii) upstream SLSs;
(iii) downstream SLSs;
(iv) traffic flows.
Network resources are implicitly covered and controlled by edge-to-edge monitoring.
85

CHAPTER 5. PROPOSED ADMISSION CONTROL MODEL
In this way, in the next sections, an intuitive and expressive notation is introduced to for-
malize these entities and to support the intra and interdomain AC criteria specification. When
possible, the entities under specification use indexes based on the corresponding service class
and involved ingress and egress nodes. As the AC model is class-based and operates edge-to-
edge, this approach enriches the notation semantically, while keeping it intuitive. Appendix A
provides a summary of the specified entities and their corresponding notation.
5.4.1 Service classes specification
Considering a multiclass domain Ó]È comprising ê ingress nodes and î egress nodes, lets
define ��ïÕð � ñ �?��òT� ' ò �2�H� òT�Þójô and &ïõð � ñ ´��òT ' ò �H�H� ò¦ RöFô as the set of ingress and egress
nodes, respectively8. For this domain, the set of supported service classes is represented as
35ÚÙïÕð �÷ñ 35ÚL��òq35Ú ' ò �2�H� òW35ÚWø{ô . From a service management and provisioning point-of-view,
the definition of a service class QoS levels includes identifying a set of QoS parameters under
control and corresponding safety margins. Each parameter target value affected by this safety
margin, will allow to establish a threshold for the parameter inside the domain. These QoS
thresholds are used for triggering traffic control mechanisms such as AC, reducing the chance of
QoS violation in the service class. Thus, for each class 35Ú �Rù 3{Ú ïõð , the set of QoS parame-
ters under control is defined as # (�)�ú �ûñ ¹J# ��� ��òB� ��� �=½Xò �2�H� òA¹U# �2� ç òT� �2� ç ½�ô where each # �2� é ù # (�)�ú is
the class parameter target value and�» � �2� éëüý� is the parameter safety margin. Then, each
parameter threshold is given by Å �2� é � � ��� éA# ��� é . The cardinality of this set depends on the QoS
constraints of the class9.
The service classes to be supported in domain ÓFÈ are closely related to the service levels
negotiated with both upstream and downstream customers. In this context, for a class 35Ú � , the
set of SLSs accepted in ÓbÈ coming from any upstream domain Ó ÒÈ is defined as 35463 ï�þð(�)�ú �ñ 35463 ��� 7 8ÿ �oÎ ù ��ï ð ô and, in the same way, the set of SLSs negotiated with any downstream do-
main Ó È is defined as 354 3 ï �ð(�)�ú � ñ 35463{��� � ÿ jÆ ù Ùï ð ô . Therefore, ÓbÈ is a service provider for
Ó ÒÈ and a customer of Ó È . Note that, 3{463 ��� 798 identifies a specific SLS accepted for 35Ú � with up-
stream domain Ó ÒÈ , connecting ÓbÈ through �oÎ , and 35463 ��� � identifies a specific SLS negotiated
for 35Ú � with downstream domain Ó È , accessible from ÓbÈ through qÆ (see Figure 5.6)10.
The case of flows entering Ó]È without pre-negotiated SLSs (usually dial-up users) is also
covered, and the notation�ù 354 3 is introduced for this purpose. The global rate share of these
8To simplify the notation, and without losing generality, each ingress or egress interface is treated as a virtuallydistinct ingress ��� or egress node � ^ . Therefore, ��� and ��� include all ingress and egress interfaces to other
86
5.4. SPECIFYING THE AC MODEL COMPONENTS
i,I1SLS
i,InSLS
i,INSLS
I1
NI
In
E1
ME
mE
SLSi,E+
1
SLSi,E+
m
SLSi,EM
+
IDx EDxDx Dx
SC xD
iSC
−SLS SLS
+
SCiSCi
− x
+D
xD
ownt
ream
Dom
ains
......
......
Ups
trea
m D
omai
ns D
xMulticlass Domain D
Figure 5.6: Domain main elements and notation
users is controlled by1 �� (���(��� 798
. Therefore,1 �� (���(��� 798
is a rate-based parameter defined to limit traffic
not sustained by a specific SLS, i.e., for flows � á��ù 354 3 �2� 7J8 . This allows a better control of
the rate share in ÓbÈ and 3{4635��� �� utilization, while avoiding possible denial of service to flows
� áLù 354 3 �2� 7 8 .When ÓbÈ acts as the source or destination domain, i.e., the end-systems are inside Ó�È , inter-
nal 3{463 ��� 798 and 35463 �2� �� may also be defined in order to allow a generic AC criteria specification
(see Section 5.5). However, this is not mandatory for the AC model operation.
5.4.2 Upstream SLSs specification
As stated in Section 2.2, the definition of SLSs, apart from being a key aspect for QoS provision-
ing, provides a valuable input for AC, in special, when admission spans multiple-domains. From
an AC perspective, following the SLS template proposed in that section, an upstream SLS for
domains. An alternative notation identifying a specific interface i in a network node would be � ��� a or � ^ � a .9Note that all ( ����S�� ^ ) pairs within ¢�� share the same ������ objectives. Defining QoS objectives per ( ����S�� ^ )can be easily accommodated turning ������ into a ³��! matrix.
10In this specification, it is assumed that a specific upstream SLS has defined just one possible point of connectionbetween domains ¢´>� and ¢ � , which is � � . When the scope of the SLS (see Section 5.4.2) defines more than onepossible ingress interface, for instance (N:M), the SLS can be decomposed into N (1:M) SLSs, maintaining theabove notation. Similarly, for a specific downstream SLS, a single � ^ between domains ¢ � and ¢ g� is considered.When � � provides access to more than one domain ¢">� (or individual customer), i.e., more than one upstream SLSfor the same class may exist through � � , one per client, an additional index would be required in order to identifyeach upstream SLS unambiguously (for instance ¯Ì¬c¯ e � "$#�� % ). The same would apply for � ^ and correspondingdownstream SLS notation. At this point, it is assumed that ¢&� negotiates just one ¯¬õ¯ ge � ')( with downstreamdomain ¢ g� for the service class ¯+* e . The same occurs between ¢´>� and ¢�� regarding ¯Ì¬õ¯ e � " # .
87

CHAPTER 5. PROPOSED ADMISSION CONTROL MODEL
Table 5.1: Common 3{463 ��� 7 8 elements
Item Notation Example1) Scope ¯Ì¬õ¯ e � " #-, ¯Ì�+ /.�± E0�1��S���2HI2) Service ID ¯Ì¬õ¯ e � " #-, ¯+* e43 ¢L¯+*5�3) Traffic Profile ¯Ì¬õ¯ e � " #-, � ¤¦¥7686.§¨�1�ä¦ 96.§¨�H± �;: E=< e � " # Slµ e � " # I4) Expected QoS ¯¬õ¯ e � " #-, �?>�.�±T�¶G9±A@�B5 �¯ ��� � ¢ e � " # SU§C.�@X� e � " # SD���5¬E< e � " #5) Validity ¯Ì¬õ¯ e � " #-, ¯Ì±B¤T�A¯Ì��F�±G@ H G e � " # � IXSJG e � " # � J9K
service class 35Ú � , i.e., 35463 ��� 798 , should include elements such as those illustrated in Table 5.111.
In more detail:
1. 35463 ��� 7 8ML 3?N Ï Ê Ü is specified as a pair ¹J�oÎ�ò¦ PO¨½ where the ingress node �²Î is the access
point of the upstream domain Ó ÒÈ to Ó�È and ORQ ï ð represents all possible egress nodes
jÆ providing access from ÓbÈ to Ó È for this 35463 . At this point, the scope of 3{463 �2� 7J8 islimited to a single domain Ó]È , which is responsible for identifying SO according to the
possible destination domains Ó È defined in the 354 3 ��� 798 ;2. 35463 ��� 7 8TL 35Ú �VU classifies and identifies the service type to be provided by ÓFÈ to pack-
ets belonging to 35463 ��� 7 8 . The DSCP is a possible 3{Ú �VU in Diffserv domains. Whenever
a domain uses proprietary service identifiers, appropriate mapping is needed at domain
boundaries;
3. 35463 ��� 7 8WL ÅYX�Û[Z!ZõÉ�No#PX Ï ZõÉ ßJÜ specifies the traffic aggregate characteristics of 3{463 ��� 7 8 , al-
lowing to identify in or out-of-profile traffic. A policing algorithm is usually used to set
the traffic profile and conditioning rules, which may include remarking or discarding traf-
fic non-conforming with the defined 3{463 ��� 798 . For instance, when using a token bucket,
the SLS traffic profile can be specified as ÅèØ�¹ 1 O�2� 7 8 ò]\ ��� 798 ½ with mean rate1 O�2� 7 8 and burst
size \ �2� 7 8 . Considering1 ��� 7 8
as the aggregate rate established for 3{463 ��� 7 8 in the scope re-
gion (peak or mean),1 ��� 7 8
can be expressed either as a global value or as a vector of rates^1 �2� 7 8 �»1 �2�`_�7 8 � +acb ò �H�2� ò 1 �2�`_�7 8 � ��dbfe depending on the scope of the SLS, i.e., taking all
jÆ ù â . Handling a vector of rates may be particularly useful for transit domains which
11Two types of upstream ¯Ì¬c¯ e � "$# can be identified: (i) an individual ¯Ì¬õ¯ e � "g# negotiated with a client/domainaccording to its specific needs; (ii) a collective ¯Ì¬õ¯ e � "$# shared among several individual clients with similar con-tracts. Although these contracts are assumed individually, ¢ � controls collective ¯¬õ¯ e � "g# as a whole, receiving atreatment similar to the other type of ¯Ì¬õ¯ e � "g# . A collective SLS might consist of clients having low-rate accesscontracts reaching ¢ � through, for instance, a virtual private or access network where each client subscribed rate isenforced.
88
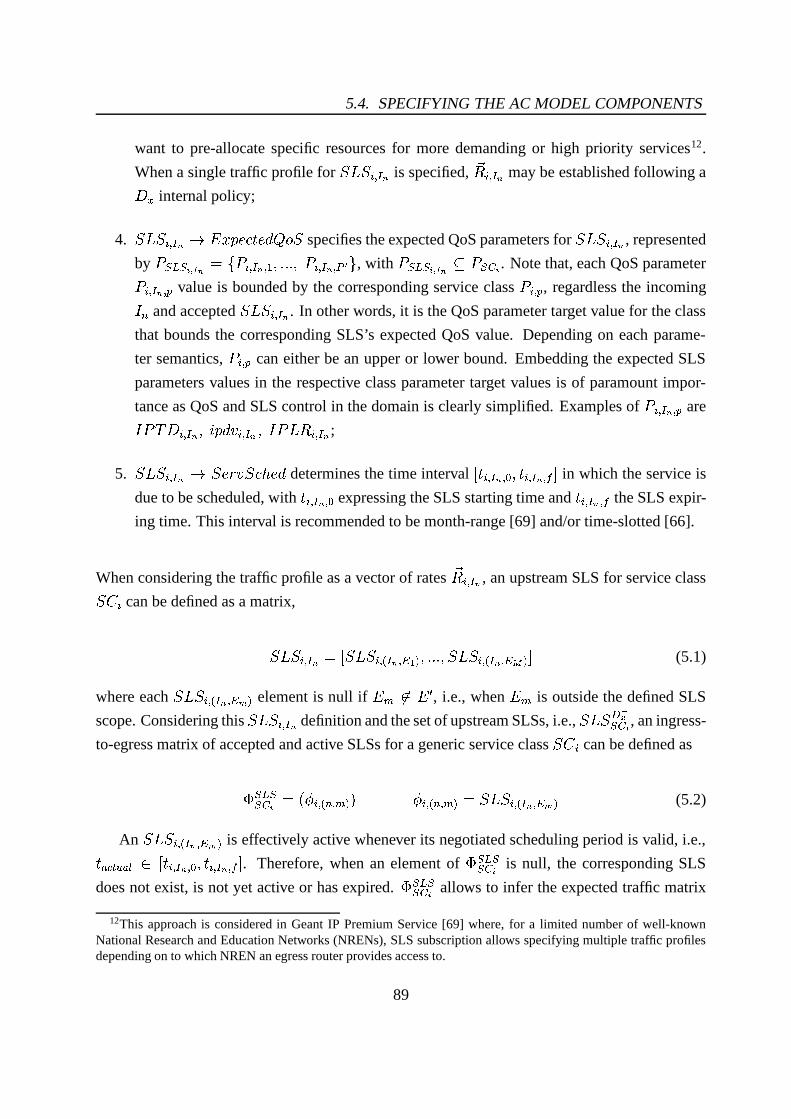
5.4. SPECIFYING THE AC MODEL COMPONENTS
want to pre-allocate specific resources for more demanding or high priority services12.
When a single traffic profile for 3{463 ��� 798 is specified,^1 ��� 798
may be established following a
Ó�È internal policy;
4. 35463 ��� 7 8PL ih�Ê Ü N � Ü Ëkj Ï 3 specifies the expected QoS parameters for 35463 ��� 7 8 , represented
by # (l�.( úVm n 8 � ñ # ��� 7 8 � �¦ò �2�H� ò{# ��� 7 8 � ç O ô , with # (���( úom n 8 Q # (�)�ú . Note that, each QoS parameter
# ��� 798A� é value is bounded by the corresponding service class # ��� é , regardless the incoming
�XΠand accepted 35463 ��� 798 . In other words, it is the QoS parameter target value for the class
that bounds the corresponding SLS’s expected QoS value. Depending on each parame-
ter semantics, # ��� é can either be an upper or lower bound. Embedding the expected SLS
parameters values in the respective class parameter target values is of paramount impor-
tance as QoS and SLS control in the domain is clearly simplified. Examples of # ��� 7 8 � é are
��#´ÅèÓ ��� 7 8 ò�É2ÊË�Í ��� 7 8 ò*��#"4 1 ��� 7 8 ;5. 35463 ��� 798 L 3 Ü X�Í�3�N�p Ü Ë determines the time interval q ����� 798�� ײò �¶��� 798Þ� r�s in which the service is
due to be scheduled, with�+��� 798A� × expressing the SLS starting time and
�+��� 798?� rthe SLS expir-
ing time. This interval is recommended to be month-range [69] and/or time-slotted [66].
When considering the traffic profile as a vector of rates^1 ��� 7 8
, an upstream SLS for service class
35Ú � can be defined as a matrix,
35463 ��� 7 8 � q 35463 ���`_�7 8 � +atb ò �H�H� ò�35463 ���`_Z7 8 � vuwb s (5.1)
where each 3{463 �2�`_�7 8 � ��xb element is null if qÆ �ù �â , i.e., when qÆ is outside the defined SLS
scope. Considering this 35463 �2� 7 8 definition and the set of upstream SLSs, i.e., 35463 ï�þð(�)�ú , an ingress-
to-egress matrix of accepted and active SLSs for a generic service class 3{Ú � can be defined as
y (���((�)�ú � ¹�z ���`_ Î � Æ b ½ z ���`_ Î � Æ b � 35463 ���`_Z7 8 � ��!b (5.2)
An 35463 ���`_�7 8 � ��db is effectively active whenever its negotiated scheduling period is valid, i.e.,� Ç�{9ãV|XÇ�} ù q �¶��� 7 8 � ×Þò �¶��� 7 8 � r�s . Therefore, when an element ofy (���((�)�ú is null, the corresponding SLS
does not exist, is not yet active or has expired.y (���((�)�ú allows to infer the expected traffic matrix
12This approach is considered in Geant IP Premium Service [69] where, for a limited number of well-knownNational Research and Education Networks (NRENs), SLS subscription allows specifying multiple traffic profilesdepending on to which NREN an egress router provides access to.
89
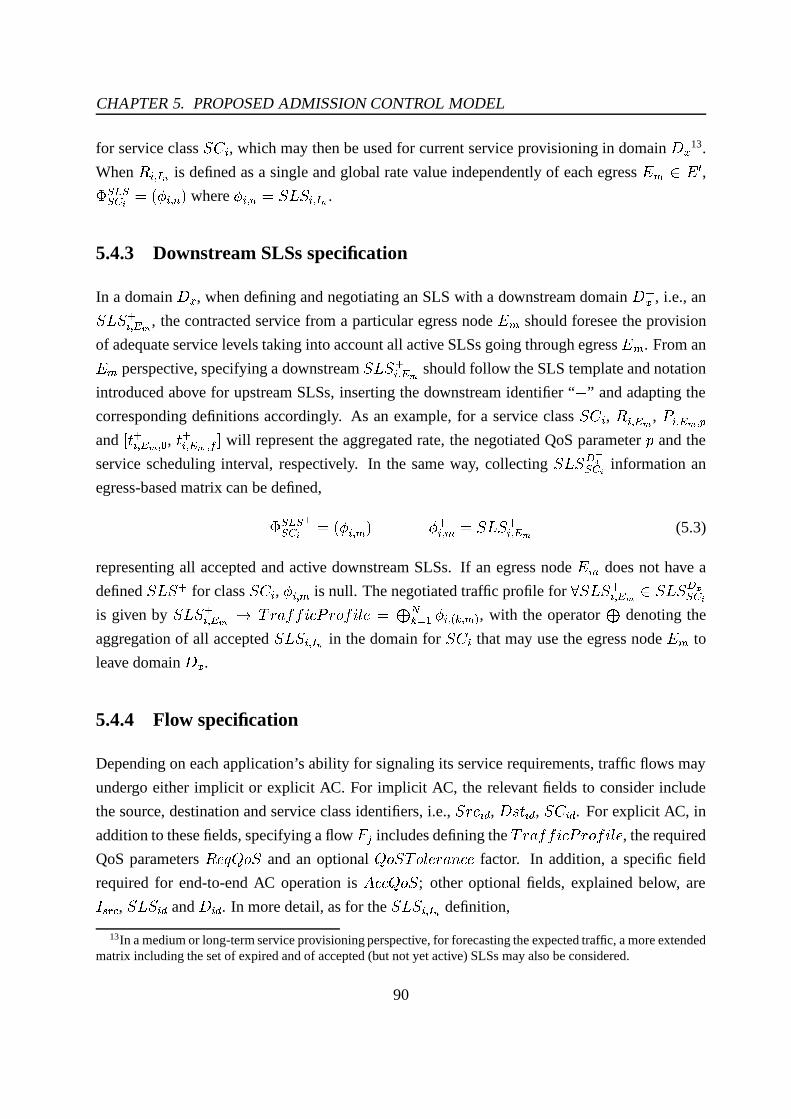
CHAPTER 5. PROPOSED ADMISSION CONTROL MODEL
for service class 35Ú � , which may then be used for current service provisioning in domain Ó�È 13.
When1 ��� 798
is defined as a single and global rate value independently of each egress èÆ ù â ,y (���((�)�ú � ¹�z �2� Î�½ where z ��� Î � 35463 ��� 798 .
5.4.3 Downstream SLSs specification
In a domain ÓbÈ , when defining and negotiating an SLS with a downstream domain Ó È , i.e., an
35463 ��� �� , the contracted service from a particular egress node LÆ should foresee the provision
of adequate service levels taking into account all active SLSs going through egress äÆ . From an
jÆ perspective, specifying a downstream 35463 ��� � should follow the SLS template and notation
introduced above for upstream SLSs, inserting the downstream identifier “ æ ” and adapting the
corresponding definitions accordingly. As an example, for a service class 35Ú � , 1 ��� � , # ��� � � éand q � ��� ��� × , � ��� � � r s will represent the aggregated rate, the negotiated QoS parameter Ê and the
service scheduling interval, respectively. In the same way, collecting 35463 ï �ð(�)�ú information an
egress-based matrix can be defined,
y (���( �(�)�ú � ¹Dzõ��� Æ ½ zõ��� Æ � 35463{��� �� (5.3)
representing all accepted and active downstream SLSs. If an egress node äÆ does not have a
defined 354 3 for class 35Ú � , zõ�2� Æ is null. The negotiated traffic profile for ~`3{4636��� � ù 35463 ï �ð(�)�úis given by 35463 ��� � L Å�X.Û[Z!ZÕÉ/NX#iX Ï ZÕÉ ß9Üí��� ó�]� � z ���`_ � � Æ b , with the operator
�denoting the
aggregation of all accepted 35463 ��� 798 in the domain for 3{Ú � that may use the egress node RÆ to
leave domain ÓbÈ .
5.4.4 Flow specification
Depending on each application’s ability for signaling its service requirements, traffic flows may
undergo either implicit or explicit AC. For implicit AC, the relevant fields to consider include
the source, destination and service class identifiers, i.e., 3?X�N �VU , Ó / �¶�VU , 3{Ú �VU . For explicit AC, in
addition to these fields, specifying a flow � á includes defining the ÅYX�Û[Z!ZõÉ�No#PX Ï ZõÉ ßJÜ , the required
QoS parameters1 Ü�� j Ï 3 and an optional j Ï 3ÃÅ Ï�ß9Ü X.Û Ý N Ü factor. In addition, a specific field
required for end-to-end AC operation is ��N�N�j Ï 3 ; other optional fields, explained below, are
���t��{ , 35463 �VU and Ó �VU . In more detail, as for the 35463 ��� 7 8 definition,
13In a medium or long-term service provisioning perspective, for forecasting the expected traffic, a more extendedmatrix including the set of expired and of accepted (but not yet active) SLSs may also be considered.
90

5.4. SPECIFYING THE AC MODEL COMPONENTS
1. � á L Å�X.Û[Z!ZõÉ�No#PX Ï ZõÉ ß9Ü , identifying the flow’s traffic profile, can be described by a token
bucket ÅLØr¹tX Oá ò]\ á ½ . The flow mean or peak rate X á is taken according to the service type;
2. � á L 1 Ü�� j Ï 3 , identifying the flow’s QoS requirements (if any), can be defined asso-
ciating a tolerance to each flow’s parameter, i.e., defining a set of parameters #��9� �ñ ¹J# á+� �TòBå á+� �+½�ò �2�H� ò�¹U# á+� ç O O òBå á+� ç O O ½�ô , with #;�9� Q # (l�.( úVm n 8 Q # (�)�ú . This subset inclusion also
means that, each # á+� é value must be bounded by the corresponding # �2� 7J8Þ� é value (if appli-
cable, i.e. if � á�ù 3{463 ��� 798 ) which, in turn, must be bounded by the corresponding class
target value # ��� é . The tolerance to # á+� é degradation, expressed by å á+� é , may be considered
by the AC criteria;
3. � á L ��N�N�j Ï 3 is used to accumulate QoS metric values in a multidomain end-to-end AC
operation (see Section 5.5.3);
4. � á L ���c�/{ is an optional field which allows to identify the source domain ingress node
���c��{ . This is the only ingress node that may need to be self-identified when receiving AC
response notification messages for per-flow TC configuration purposes. SLS and domain
identifiers, � á L 3{463 �VU and � á L Ó �VU , are also optional fields useful to handle interdo-
main authentication and authorization issues.
5.4.5 Monitoring and controlling per-class QoS metrics
As mentioned, the proposed service control model resorts to on-line measurements to obtain a
systematic view of the network service levels and resource occupation. Thus, for service class
35Ú � and ingress node �²Î , a dynamic ingress-egress service matrix used to control QoS levels and
support AC decisions is defined as
���� ((�)�ú � ¹t� ���`_ Î � Æ b ½ (5.4)
Note that at each �oÎ , for each 35Ú � , this matrix has a single line ( �i�´à¼½ , i.e., É andÝ
are
constants and à varies identifying the egress node èÆ , corresponding to the measurements be-
tween the involved ¹J�²Î�ò¦ jÆj½ pairs. Service data in the matrix� �� ((�)�ú is provided by egress nodes
which send monitoring updates at each measurement time interval���B�
. This data includes the
class’s QoS parameters measured from an ¹9�ÞÎ�òT qÆ�½ perspective, i.e., � ���`_ Î � Æ b L #Õé � 0# ���`_Z7 8 � ��!b®� é .Using this measured data and corresponding class thresholds, a QoS status indicator defined as
91

CHAPTER 5. PROPOSED ADMISSION CONTROL MODEL
� �2�`_ Î � Æ b�L �èÚ _ 3 � Û �1� /7� ã ú is computed and then used by AC for determining if incoming traffic
from �XÎ to qÆ can be accepted in�b���
(see QoS control rule in Section 5.5.2).
The measured traffic load of 3{463 ��� 7 8 and 354 35��� �� (aggregate SLS utilization) measured at
�oÎ and qÆ , respectively, might be included in the corresponding matricesy (���((�)�ú and
y (l�.( �(�)�ú or, al-
ternatively, stored with other QoS monitoring data in� �� ((�)�ú . This latter option is considered more
appropriate taking into account the short-term updating nature of this monitoring matrix, making
it more suitable to maintain traffic load measures obtained at each�b�=�
. When the measures are
not egress dependent, e.g., a single value 01 ��� 7 8 is measured, � �2� Î is used denoting that à assumes
a “don’t care” status, avoiding redundant data in� �� ((�)�ú . Examples of relevant edge-to-edge QoS
parameters to be measured and the respective equations are defined in Table 6.3.
5.5 Specifying the AC criteria
The definition of an AC criterion involves establishing the rules which determine the acceptance
or rejection of flows. In the proposed model, the service-dependent AC criteria are generically
measurement-based controlling both the QoS levels in the domain and the utilization of existing
SLSs (see Figure 5.4), which leads to the specification of two types of rules: (i) rate-based SLS
control rules; (ii) QoS parameters control rules. The specification of these rules follows the
notation introduced in Section 5.4.
5.5.1 Rate-based SLS control rules
For each ingress node �²Î ù ��ï ð and each egress node qÆ ù &ï ð one or more SLSs can be in
place. However, as mentioned earlier, for a specific service class 35Ú � within Ó�È , a single SLS
is negotiated with an upstream Ó ÒÈ or downstream Ó È domain. As each 35463 ��� 798 and 35463 ��� ��have specified a negotiated rate,
1 ��� 798and
1 ��� �� respectively, a rate-based Measure-Sum (MS)
algorithm can be applied to control SLSs utilization at each network edge node14. This algorithm
14Following the discussion on measurement-based algorithms performance (see Appendix C) and taking intoconsideration the trade-off between the results obtained by the Measure Sum (MS) algorithm in [99, 105, 208] andits semantics, easy to understand and apply, the MS algorithm is used to control the SLSs utilization at networkedges. To enforce achieving a pre-defined QoS target performance in a CoS domain, this rule is complemented by ameasurement-based QoS control rule, triggered by thresholds to the QoS controlled parameters of each service class(see Section 5.5.2). The evaluation of the AC criteria performed in Section 7.3 extends the performance results ofthe MS algorithm to an edge-to-edge multiservice test scenario, involving flows with distinct traffic characteristicsand descriptors.
92

5.5. SPECIFYING THE AC CRITERIA
takes both rate estimates and the flow traffic description to verify if a new flow can be admitted,
i.e., if it fits within the corresponding SLS.
Explicit AC
At each ingress node �²Î , verifying if a new flow � á�ù 35463 ��� 7 8 can be admitted involves testing
if the 354 3 ��� 7 8 can accommodate the new flow traffic profile, i.e.,
01 ���`_�7 8 � ��b æ�X á ü�� ��� 798 1 ��� 798 (5.5)
In Eq. (5.5), 01 �2�`_�798A� ��b is the current measured load or estimated rate of flows using 35463 ��� 798 ; X á is
the rate specified by the new flow � á ; � ��� 798 (with�» � ��� 798 ü�� ) is a safety margin or utilization
target defined for the negotiated rate1 ��� 7 8
for 35463 �2� 7 8 15. When1 ��� 7 8
is viewed as a vector
depending on a subset of egress nodes in the domain ¹U �â Q ïÕð ½ , the following rule is applied,
01 ���`_Z7 8 � ��!b æ�X á ü�� ���`_Z7 8 � ��!b 1 ���`_Z7 8 � ��!b (5.6)
When the destination of flow � á is outside ÓbÈ , verifying if the new flow can be admitted also
involves testing if the downstream 3{4636��� �� can accommodate the new flow traffic profile, i.e.,
01 ���`_4�=� � b æ�X á ü ��2� �� 1 ��� �� (5.7)
In Eq. (5.7), 01 ���`_4�=� � b is the current measured load or estimated rate of flows using 35463���� � ,
considering all ingress-to- RÆ estimated rates of flows going through LÆ , i.e.,
01 ���`_4�=� Æ b �ó��A� � 0X
���`_�7c�¦� ��db(5.8)
X á is the rate specified by the new flow � á ; ���� � (with�» ����� � ü � ) is the safety margin
for the rate1 ��� � defined for 3{463 ��� � . Recall that this safety margin determines the degree
of overprovisioning for the corresponding 35Ú � . The value of � ��� �� may result from high-level
domain policies defined at service class level, instead of being defined at SLS level.
When Ó�È is a transit domain, verifying if the upstream 35463 ��� 798 can accommodate the new
flow profile (Eq. (5.5)) is optional. In fact, assuming that the upstream domain Ó ÒÈ controls
15In the MS equations presented in this section, � e � � is said to represent a safety margin or utilization targetdefined for the rate parameter < e � � . More precisely, � e � � < e � � represents a target rate which includes a safety margingiven by EJ;��W� e � � I . � e � � represents then the utilization target and implicitly a safety margin. To simplify the notationand the description, � e � � is generically referred as a safety margin.
93

CHAPTER 5. PROPOSED ADMISSION CONTROL MODEL
the corresponding downstream SLS traffic load through a process equivalent to the one ruled by
Eq. (5.7), domain ÓbÈ can control 3{463 ��� 798 using a simple TC mechanism based on the negotiated
traffic profile specification for the aggregate. In optimal conditions,1 ��� �� would be dimensioned
in order to absorb all accepted1 ���`_Z7J8A� � b
without problem. This would also make Eq. (5.7)
optional. However, one must consider that: (i) not all flows are supported by an SLS; (ii) when
statistical multiplexing is considered, the dimensioning of1 ��� �� can be below
d ó�]� � 1 ���`_Z7 � � ��db .Moreover,
1 ���`_�7 8 � ��dbmay not be known in advance. For source and destination domains, unless
internal 35463 ��� 7 8 and 3{463 ��� �� are defined, Eqs. (5.5) and (5.7) may not apply either. In particular
for transit domains, when Eq. (5.5) determines a positive AC decision and Eq. (5.7) refuses the
flow, 354 3 ��� 798 commitments have been violated.
The rate control rules for the admission of flows not sustained by an SLS, i.e., � á��ù 3{463 ��� 7 8 ,resort to Eq. (5.7) and the measured rate 01 �� (���(��� 798
. This is controlled by an expression similar to
Eq. (5.5), i.e.,
01W�� (���(���`_Z7 8 � ��b æ�X á ü�������� 798 1W�� (���(��� 798(5.9)
Once again, when the rate1 �� (���(��� 7 8
is specified depending on each RÆ , a rule similar to Eq.(5.6)
is applied.
Implicit AC
The equations defined above, which take into account both the rate estimates and the flow traffic
profile, can be easily applied to implicit AC scenarios. For a service class 35Ú � under implicit AC,
as flows are unable to describe X á , the SLS control equations defined above become similar to the
QoS control equation (Eq. (5.10)), considering # ��� é as a rate-based parameter. Therefore, traffic
flows are accepted or rejected implicitly according to the value of the variable �äÚ _ 3 � Û �1� /�� ã úcomputed once in
���+�. Additionally, a variable �èË�à _ � ß9Ï�Ñä/�� ã ú may constrain the number of
flows which can be implicitly accepted in���=�
.
5.5.2 QoS parameters control rules
When controlling the QoS levels in a domain, the QoS parameters and corresponding thresholds
can vary depending on each service class 35Ú � commitments, the statistical properties of the
traffic and the safety margins.
At each ingress node �oÎ , the �äÚ _ 3 � Û �1� /�� ã ú variable, used to control the admission of new
flows in the monitoring interval���+�
, is updated after checking the controlled parameters # ��� é of
94

5.5. SPECIFYING THE AC CRITERIA
35Ú � against the corresponding pre-defined threshold Å �2� é , i.e.,
~ùU# ��� é�òT� ��� éA½ ù # (�)�ú � 0# �2� éÙü�Å ��� é (5.10)
where 0# ��� é represents the measured value of # ��� é for���¶�
and Å ��� é , as explained in Section 5.4.1,
reflects a safety margin � ��� é to the QoS parameter target value, i.e.,
Å ��� é � � ��� éA# ��� é (5.11)
Eq. (5.10)16 is not flow dependent, i.e., it is checked once during���=�
to determine the vari-
able �äÚ _ 3 � Û �1� /7� ã ú , for each ¹9�²Î�ò¦ jÆj½ pair. The �äÚ _ 3 � Û �1� /7� ã ú - accept - indicates that the
measured QoS levels for 35Ú � are in conformance with the QoS objectives and, therefore, new
flows can be accepted. The �äÚ _ 3 � Û �1� /�� ã ú - reject - indicates that no more flows should be
accepted until the class recovers and restores the QoS target values. This will only be checked at���¶� � 17.
In practice, the QoS control rules are applied on an ingress-egress basis using monitoring
data stored in the QoS matrix�P�� ((�)�ú available at each �²Î . Other possible scenarios for handling
monitoring data are presented in Section 5.6.1.
5.5.3 End-to-end AC rules
Assuming a consistent mapping between the service classes in domains Ó ÒÈ , Ó�È and Ó È , when
AC is taken from an end-to-end perspective making an AC decision at ingress node �?Î of domain
Ó�È involves considering the following rule:
~c# á+� é ù #;�9� � ¹�¡�¢+£�¹U# Ç�{t{ þá+� é ò¦# �2� éA½B½5¡�¢¥¤R¹¨å á+� éÞ# á+� é?½ (5.12)
where each flow requested QoS parameter # á+� é , allowing a tolerance factor å á+� é , is checked against
the cumulative value computed for the parameter when crossing previous domains, # Ç�{c{ þá+� é , af-
fected by the corresponding target value of # �2� é 18 within domain ÓbÈ .16While for most of the relevant QoS parameters a flow is accepted when Eq. 5.10 is satisfied, the ¦ operator can
be different if the controlled parameter is, for instance, the available bandwidth.17When the metric update scheme is also triggered by an excessive variation of metric value, more than one QoS
Control check may occur during § G e .18Note that �� e � ¨ could also be used in the cumulative process of metric computation instead of � e � ¨ . This option
would lead to less stable AC decisions and end-to-end available service computation. Despite being more con-
95

CHAPTER 5. PROPOSED ADMISSION CONTROL MODEL
Depending on each parameter semantics, ¡�¢d£ and ¡�¢v¤ may express different operations, i.e., ¡�¢d£ ùñ Û�Ë�Ë ÿ / � \ ÿ à�Û)h ÿ àrÉ Ý ÿ à � ß ÿ Z �Hé�©D{ ô and ¡�¢v¤ ù ñ ü ÿ»ÿdª�ÿ e ÿ � ô . If the flow can be ac-
cepted in ÓbÈ , the new available service computation to be included in the flow request is given
by
# Ç�{t{á�� é � ¡�¢E£�¹J# Ç�{t{ þá+� é ò¦# ��� éA½ (5.13)
To clarify the use of Eq. (5.12) and Eq. (5.13), lets consider the following examples, where the
type of the QoS parameter under control varies:
1. # á+� é is a delay parameter - a positive AC decision occurs when Û�Ë�ËÕ¹U# Ç�{t{ þá�� é ò¦# �2� éA½Wü�å á+� éÞ# á+� é .When å á+� é is defined as a percentage of QoS degradation (tolerance) then the right side of
this equation becomes ¹+� æÖå á+� éA½+# á+� é ;
2. # á+� é is a loss ratio parameter - considering� ü�# á+� é.ò¦# ��� é"ü¿� , the computation of Eq. (5.12)
and AC requires a specific multiplicative function, i.e., ¡�¢d£ � Z �2é9©D{ . Knowing that a
sequence of individual nodes with loss ratio � Ý Ë�4 Ï�/?/ has a total loss ratio given by
Å Ï � Û ß 4 Ï�/�/è� �W¬«�¹+�WÂ�� Ý Ë�4 Ï�/?/ ½ , the cumulative computation of Å Ï � Û ß 4 Ï�/�/ in domain
Ó�È is given by19
# Ç�{t{á+� é � �q ¹B¹+�qÂ�# Ç�{c{ þá+� é ½²¹��jÂÖ# ��� éA½B½ (5.14)
For very low values of # Ç�{c{ þá+� é and # ��� é , Eq. (5.14) may be simplified, i.e., # Ç�{t{á�� é® # Ç�{t{ þá+� é æ# ��� é and the multiplicative function ( ¡�¢x£ � Z �2é9©�{ ) can be changed to an additive function
( ¡l¢+£ � Û�Ë�Ë );
3. # á+� é is a rate parameter - for rate-based parameters, taking the minimum rate ( ¡l¢!£ � àrÉ Ý )
is common, and Eq. (5.13) can be used to carry the minimum available rate for 35Ú � across
all the involved domains up to the destination.
servative, taking � e � ¨ , i.e., the class parameter target value, allows more robust, stable and reliable AC decisions.Once again, it should be noticed that a cumulative process for end-to-end QoS computation is consistent with thecascade approach pointed out in the SLSs business model definitions provided in Section 2.2. The cumulative QoScomputation explored here at flow level can be extended to SLS level.
19Assuming that ;�¯��° }¨} ~± � ¨ represents the traffic entering domain ¢ � and � e � ¨ is the target loss ratio in ¢ � , the
traffic leaving ¢ � is given by EJ;Õ�P�²° }¨} ~± � ¨ I+E9;c�P� e � ¨ I . So the cumulative computation of loss ratio after crossing ¢ �is ;z��E9;z����° }¨} ~± � ¨ I�E9;z��� e � ¨oI .
96

5.5. SPECIFYING THE AC CRITERIA
5.5.4 Additional remarks on the AC criteria
Apart from syntax differences between rate-based SLS rules (Eqs. (5.5) , (5.7) and (5.9)) and
QoS control rule (Eq. (5.10)), they also target different contexts. While the former are checked
for the admittance of each new flow, Eq. (5.10) is not flow dependent, i.e., it is checked once
during���¶�
to determine the value of �äÚ _ 3 � Û �1� /7� ã ú .While for a service class 3{Ú � with explicit AC, if � á is accepted at �oÎ , the rate estimated
variables can be updated in�b���
according to X á information20, for a service class with implicit
AC, if a � á is accepted at �oÎ , as X á is unknown, only the number of flows that can be accepted
in�����
( �äË�à _ � ß9Ï�Ñä/7� ã ú ) needs to be decremented by one (when applicable). In this context,
Eqs.(5.5) , (5.7) and (5.9) only need to be computed once in���B�
. This means that these equations
follow indeed the syntax and semantics of the QoS control rules, and may also determine the
value of �èÚ _ 3 � Û �1� /7� ã ú . In this way, classes using implicit AC only deal with the variables
�äÚ _ 3 � Û �1� /7� ã ú and �èË�à _ � ß9Ï?Ñ´/7� ã ú . For service classes based on PHBs such as Lower Effort
(LE) [64], where no SLSs rate and QoS target values are expected to be defined, SLS and QoS
control may not apply.
Table 5.2: AC criteria summary
AC � ± Rate Control QoS Control E2E ControlExplicit ³ä¯¬õ¯ e � " # Eq. (5.5) and Eq. (5.7) Eq. (5.12)´³´¯Ì¬õ¯ e � " # Eq. (5.9) and Eq. (5.7) �;* _ ¯NG9¥²G¨£�·Aµ K �Implicit ³ä¯¬õ¯ e � " # � * _ ¯NG9¥²G¨£�·Gµ K � and/or ��@om _ �5�H T¡�·Gµ K � (given by Eq. (5.10)) n.a.´³´¯Ì¬õ¯ e � " # � * _ ¯NG9¥²G¨£�·Gµ K � and/or ��@om _ �5�H T¡�·Gµ K �
Table 5.2 summarizes the AC equations which support the AC decisions made in a domain
Ó�È . As mentioned in Section 5.5.1, some of the rate equations are optional or do not apply, and
in most of the cases, controlling rate can be reduced to1 �2� �� control (Eq. (5.7)). Figure 5.7
illustrates the AC criteria summary for the explicit AC case. An algorithmic description of the
explicit or implicit AC decision process is provided in Appendix B.
20During § G e , only the rate-based measures �<&¶· ��¸l�e � " # , �< e � "$# and �< ge � ')( can change as they are updated at each � �according to ¤ ± of a new admitted flow (if using explicit AC). Update rate estimations leads to a more conservativeAC as the rates of new flows are considered in the traffic load estimation but the compensation effect of flowsterminating during the same § G e is not taken into account. Keeping the rate estimation unchanged during § G eexplores this compensation effect but may increase overacceptance levels. The impact of both situations in theperformance of the AC criteria will be explored in Chapter 7.
97
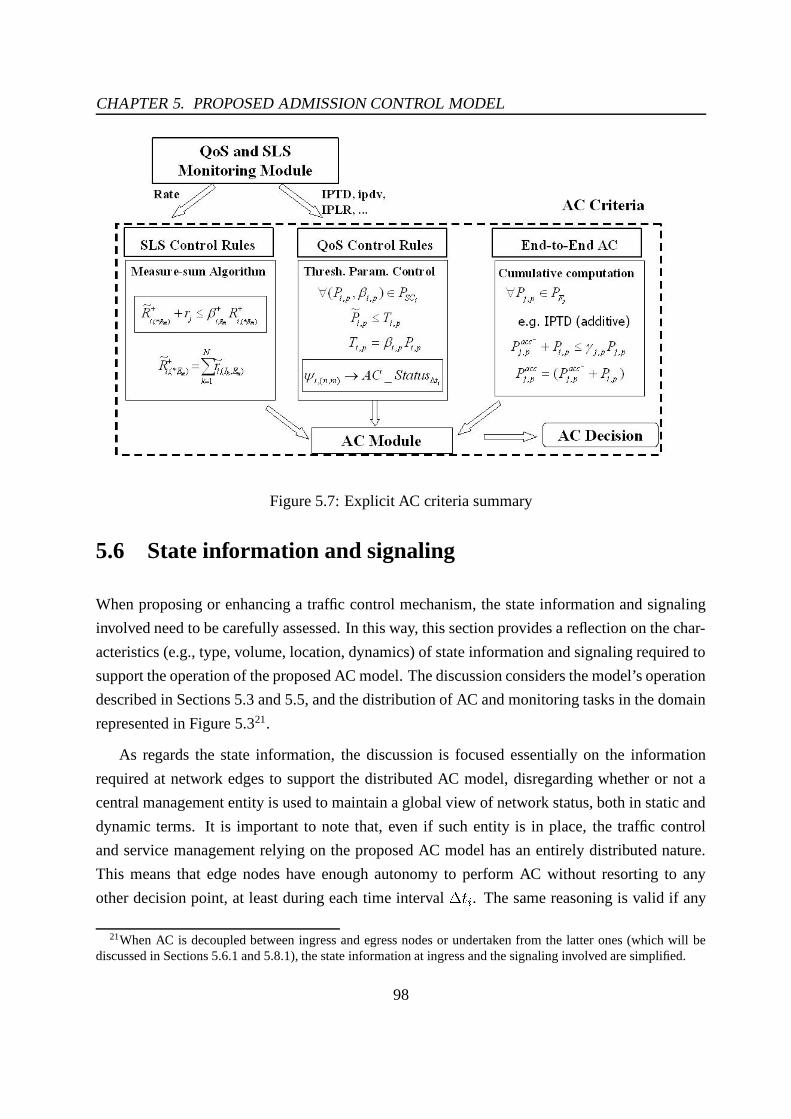
CHAPTER 5. PROPOSED ADMISSION CONTROL MODEL
Figure 5.7: Explicit AC criteria summary
5.6 State information and signaling
When proposing or enhancing a traffic control mechanism, the state information and signaling
involved need to be carefully assessed. In this way, this section provides a reflection on the char-
acteristics (e.g., type, volume, location, dynamics) of state information and signaling required to
support the operation of the proposed AC model. The discussion considers the model’s operation
described in Sections 5.3 and 5.5, and the distribution of AC and monitoring tasks in the domain
represented in Figure 5.321.
As regards the state information, the discussion is focused essentially on the information
required at network edges to support the distributed AC model, disregarding whether or not a
central management entity is used to maintain a global view of network status, both in static and
dynamic terms. It is important to note that, even if such entity is in place, the traffic control
and service management relying on the proposed AC model has an entirely distributed nature.
This means that edge nodes have enough autonomy to perform AC without resorting to any
other decision point, at least during each time interval���=�
. The same reasoning is valid if any
21When AC is decoupled between ingress and egress nodes or undertaken from the latter ones (which will bediscussed in Sections 5.6.1 and 5.8.1), the state information at ingress and the signaling involved are simplified.
98

5.6. STATE INFORMATION AND SIGNALING
form of centralized policy-based management is in use. The following debate also abstracts
implementation details such as the concrete data structures in which the state information is
stored, despite sometimes referring to them as a matrix or a vector.
5.6.1 State information
Table 5.3 provides an encompassing view of the state information required, illustrating its lo-
cation and update regularity (semi-static, dynamic). The volume of data involved is determined
by the number of edge nodes, service classes, controlled parameters and negotiated SLSs, being
reflected by the corresponding indexes according to the notation defined in Section 5.4. In this
table, in each service matrix, the index in bold represents the variable index. As an example, for
a 35Ú � , � ���`_ Î � ¹ºb and � ���`_4»�� Æ b represents a single line matrix at �²Î and a single column matrix at
jÆ , respectively.
Table 5.3: State information at edge nodes
Semi-static DynamicService Class ( ¯+* e ) Negot. SLSs ( ¼ ��¸l���� � and ¼ ��¸l��½��� � ) QoS and SLS Monit. ( ¾5¿vÀ ������ )
Ingress QoS parameters ������ ¯¬õ¯ e � " # : Á e � � or Á e � \ ���  _ �< e � " # : à e � � or à e � \ �7�  _�1� and thresholds �� e � ¨ : à e � \ ���  _¯Ì¬õ¯ ge � ')( : Á ge �  �< ge � ')( : à e � \ ���  _Egress QoS metrics � ��� � ¯Ì¬õ¯ ge � ')( : Á ge � ^ �< ge � ')( : à e � ^� ^ �� e � ¨ : à e � \ÅÄ � ^`_
The state information maintained at ingress nodes aims at supporting AC decisions accord-
ing to the defined QoS and SLS control equations. Moreover, although not being specific for
AC, ingress nodes may also require domain topological and routing information to determine the
egress node that will be used, for instance, when accessing the downstream domain. The state in-
formation held at egress nodes is essentially related to monitoring domain QoS and downstream
SLSs’ utilization. Part of this data or the corresponding AC status indication ( �èÚ _ 3 � Û �1� /�� ã ú )may then be sent to ingress nodes. When upstream SLSs require monitoring specificities de-
pending on egress nodes, these nodes may also include the relevant 3{463 ��� 798 data to satisfy those
specificities. In addition to the state information included in Table 5.3 and topological data, other
relevant data to maintain on a service class basis is the policies to be applied in the domain as
regards, for instance, resource allocation and usage (e.g., bandwidth sharing, authorization and
authentication information).
99
CHAPTER 5. PROPOSED ADMISSION CONTROL MODEL
The state information illustrated in Table 5.3 can be considerably reduced giving that:
: from the semi-static information about negotiated 354 3 ��� 7 8 and 3{463 ��� �� , only the relevant
fields for AC and monitoring need to be considered at ingress and egress nodes, respec-
tively. As far as AC is concerned, in addition to information for classification and service
scope assessment, the defined rates1 ��� 7 8
and1 ��� � are the most relevant variables to be
maintained and controlled at ingress nodes. As mentioned before, the negotiated QoS
parameters are bounded and controlled at service class level;
: 35463 ��� �� and 01 ��� �� data at ingress nodes (presented in dark gray in the table) could be
avoided if AC is decoupled between �²Î and qÆ , regarding rate-based SLS control rules. In
fact, as 3{463 ��� 7 8 is related to �²Î and 3{4635��� �� to jÆ , Eq. (5.5) could be evaluated at �ÞÎ and
Eq. (5.7) evaluated at RÆ . Being conceptually correct, this decoupling process reduces
the state information required at ingress nodes and simplifies the control of concurrent AC
(see Section 5.8.1);
: 0# ��� é monitoring data (presented in light gray in the table), provided by egress to ingress
nodes, is used to assess the domain’s QoS status in�b�+�
( � �2�`_ Î � Æ b L �èÚ _ 3 � Û �1� /�� ã ú )based on QoS control rules (Eq. 5.10). To avoid a full dissemination of QoS mea-
sures and to decrease the amount of state at ingress nodes, egress nodes could compute
� ���`_ Î � Æ b L �äÚ _ 3 � Û �1� /�� ã ú passing it to the corresponding ingress �ÞÎ . This means that
each �oÎ would perform AC without knowing the concrete metric values. This solution
avoids the replication of monitoring data, however, when QoS measures are also available
at �oÎ handling bidirectional AC is simplified (see details in Section 8.4) . In the limit, QoS
control rules and accumulated QoS verification (Eq. 5.10 and Eq. 5.12) could also be trans-
ferred to qÆ . This would avoid both metric dissemination from LÆ to �oÎ and topological
information at �oÎ for jÆ identification22. However, this solution requires that each flow
conveys an identifier of the involved �ÞÎ so that each qÆ is able to check the corresponding
� ���`_ Î � Æ b L �äÚ _ 3 � Û �1� /7� ã ú . These two approaches for QoS control at egress nodes involve
bringing the service class QoS controlling information, i.e, ¹J# ��� é�òT� ��� éA½ ù # (�)�ú , into each
jÆ .
Having discussed these topics, the decision of decoupling AC decisions between �?Î and qÆshould also consider the additional computational burden of performing AC at äÆ , as new flows’
22In addition, when the flow destination is not completely specified, it may be difficult to determine at � � which� ^ will be used.
100

5.6. STATE INFORMATION AND SIGNALING
identification and AC processing are required in addition to monitoring. Maintaining AC at
�oÎ and monitoring at qÆ is a solution that allows to balance the computational overhead of
monitoring and AC tasks. Thus, in the ongoing study, AC is performed at �?Î and monitoring
at qÆ . Studying the impact of the remaining pointed solutions on AC model performance was
left for further study. Finally, it is important to note that, the control rules defined in the AC
criteria can be applied irrespectively of the degree of AC decoupling between edge nodes. This
means that they can be applied at ingress or egress nodes according to the location of the state
information, stressing the AC model flexibility.
5.6.2 AC and monitoring signaling
Signaling is here discussed at two levels. At one level, intrinsic to explicit AC, signaling is
used by applications to express flows’ traffic profile and QoS requirements. The AC model
takes advantage of this signaling process to propagate cumulative QoS indication across multi-
ple domains. Recall that the AC model does not intend to use this signaling process to allocate
resources or maintain per-flow state information, instead, it allows each domain to decide upon
flow admittance and, simultaneously, conveying the expectable QoS along the path toward desti-
nation. For this purpose, signaling must include:
: a service request primitive able to specify traffic profile and QoS requirements, and to
gather cumulative QoS information;
: a service response primitive reporting service acceptance or rejection notification.
Considering an optional refreshing primitive for evaluating the previously assessed and accepted
QoS conditions, keeping also track of the edge nodes in the path would allow to detect major
routing changes, i.e., changes in the traversed domains and QoS deviations23.
Proposing or developing a specific signaling protocol is outside the scope of this work and
somehow unnecessary. Existing signaling protocols can be used or adapted. For instance, RSVP
23There is no guarantee that the path used for the flow data remains the same used for the flow request. In par-ticular for intradomain route changes, this may not be problematic providing that the new path maintains the sameQoS characteristics. In fact, the new metrics will reflect the load changes and AC at edges will act accordingly. In-terdomain path changes, involving other crossed domains, are a particular challenge as the new route may representa clear change in the end-to-end available service. The problem is simplified as no per-flow state is kept, thus lessstate information updates are needed, and interdomain routes tend to be more stable, but degradation may still occur.
To cope with these possible causes of QoS degradation, notification/feedback mechanisms to allow fast re-establishing or renegotiating of services/SLSs under the new conditions may be required. These topics are discussedin Section 8.4 as future work.
101
CHAPTER 5. PROPOSED ADMISSION CONTROL MODEL
supports detailed flow specification, allows registering the QoS along the path and the path itself
and, as a soft-state protocol, has a built-in refreshing mechanism. Nevertheless, in the context
of the present work, RSVP messages only need to be processed at ingress nodes, and effective
resource reservations, per-node and per-flow state information or symmetric response paths are
dispensable.
This reasoning is sustained by the principle that the AC model is integrally based on on-line
monitoring and service-oriented state information, where SLSs traffic profiles are the granular-
ity of “reservations” within each domain. To follow these directions, when a domain Ó�È de-
cides upon a new flow request positively, the rate of the incoming flow should be immediately
accounted for the corresponding SLSs rate measurements until it can be sensed in following
measurements intervals (����� � �`Æ`Æ`Æ ). Counting on the new flow before end-to-end admission is
completed avoids symmetric paths for effective reservations but may lead to rate overestimation
in Ó�È . In fact, when a downstream domain Ó È rejects the flow, the updates on rate measures
in upstream domains become incorrect. However, the self-corrective nature of systematic mon-
itoring will adjust those measures accordingly. This “pre-reservation” principle is in-line with
the model underlying idea of resorting to overprovisioning to relax AC and increase resilience to
QoS degradation.
A sender-initiated approach where the signaling messages do not need to follow the entire
path to destination and keep track of the way back is, in this way, more suitable than a receiver-
oriented approach such as RSVP. More recently, the functionality and versatility of signaling
protocols within NSIS framework [135], in special, the sender-initiated path-coupled case where
signaling messages are routed and processed only at specific nodes in the data path may be
particularly suitable to support the AC model operation.
At other level, in the context of network monitoring, signaling is required to disseminate
edge-to-edge QoS measures and the SLSs occupancy in the domain. In this work, the metrics
are evaluated and propagated periodically each time interval���B�
. Metrics’ dissemination may
also be triggered when a QoS metric, its variation or the SLS utilization exceed a threshold.
This signaling process should include mechanisms to increase the monitoring resilience to lost
monitoring updates, similarly to routing protocols. As regards implementation, the signaling
process itself may rely on capabilities of existing protocols, such as ICMP, to propagate QoS
monitoring information from egress to ingress nodes. The use of alternative ways of metrics
computation and dissemination, including the use of multicast IP to achieve a more efficient
distribution, is left for future work (see Section 8.4).
102

5.7. MODEL STRENGTHS
5.7 Model strengths
Having detailed the proposed AC model along this chapter, this section highlights the most im-
portant features of the model, reflecting also the fulfillment of the initial goals. Conceptually,
some of the features represent an added value facing other current AC proposals.
5.7.1 Model major key points
In summary, the major key points identified are as follows:
(i) only edge nodes are involved, i.e., the network core is kept unchanged and treated as a black
box. This provides a convenient level of abstraction and independence from network core
complexity and heterogeneity;
(ii) the state information is service and ( �ÞÎ�ò¦ jÆ ) based which, apart from leading to reduced state
information, is particularly suitable for SLS auditing. Per-flow state information is only
kept at the source domain ingress router for TC (when applicable), while other downstream
domains may maintain TC based on the SLS aggregated traffic profile, as usual;
(iii) the control of the SLSs negotiated QoS parameters is embedded in the QoS control of the
corresponding service classes, reducing the amount of SLSs dynamic state information and
control overhead. This important inclusion rule also applies to the control of the flows’
expected QoS;
(iv) the signaling process for intra and interdomain operation is simple, horizontal and fluid.
The flow AC request is used both for per-domain AC and for end-to-end available service
computation along the data path, and no soft/hard state behavior and symmetric routing
paths are imposed;
(v) the systematic use of on-line monitoring for traffic load and QoS metrics’ estimation in a
per-class basis, while allowing an adaptive service management, avoids per-application in-
trusive traffic to obtain measures and reduces AC latency as measures are available on-line.
Furthermore, systematic measurements have an intrinsic auto-corrective nature, allowing
to detect short or long-term traffic fluctuations depending on the measurement time unit
or interval, and implicitly take into account the effect of cross-traffic and other internally
generated traffic (e.g., routing, management, multicast traffic);
103

CHAPTER 5. PROPOSED ADMISSION CONTROL MODEL
(vi) different service types, QoS parameters and SLSs can be controlled simultaneously in a dis-
tributed and simple fashion. Note that, usually, controlling QoS and SLSs is only covered
in centralized and “heavier” AC approaches;
(vii) the AC model provides enough flexibility to accommodate technological, service and ap-
plication evolution. Important aspects contributing for the model’s flexibility are: (i) the
service-dependent nature of AC rules and adjustable parameterization; (ii) the ability to be
decoupled between ingress and egress nodes; (iii) the conceptual modular independence
between AC and monitoring tasks, which increases their ability to integrate new develop-
ments and improvements.
5.7.2 Fulfillment of initial goals
Having in mind the initial goals identified in Section 5.1 as regards achieving an encompassing
and lightweight service-dependent AC strategy, the proposed AC model fulfills those goals as
the following characteristics are verified:
: multiservice - depending on the characteristics of each service class, AC decisions are
made implicitly or explicitly resorting to a service-oriented AC criteria which involve AC
equations, safety margins, QoS parameters and thresholds adjusted to each class charac-
teristics. The measurement methodologies and time granularity used in the measurement
process can also be service-oriented and defined to achieve different accuracy levels. The
AC model allows to define more or less relaxed AC criteria and safety margins depending
on the service level guarantee to be provided and on the intrinsic traffic characteristics of
each service class. All these configurable aspects of the AC criteria also increase its ability
to accommodate new service classes defined according to the requirements of emergent
applications and services;
: multidomain - the AC model can be deployed in a single domain as well as it may span
multiple domains involving, eventually, distinct strategies and technologies in the provi-
sion of services with differentiated QoS. Moreover, the simple and systematic interdomain
approach proposed, illustrated in Figures 5.4 and 5.5, does not impair the model to be ad-
justed to specific service policies and other particularities of each domain, increasing its
flexibility both intradomain and end-to-end;
: low overhead of the control strategy - the AC model, relying on edge-to-edge on-line QoS
104

5.7. MODEL STRENGTHS
monitoring, avoids extra control mechanisms in the network core and simplifies the net-
work control plane. In fact, AC and monitoring are the only new tasks accomplished at
edge nodes. Note that, controlling SLSs at service class level also simplifies the under-
lying control task. Apart from the required QoS and SLS monitoring state information
maintained at network boundaries, which is also relevant to assist other network control
and management tasks than AC, the amount of additional state information is minimized
as no individual or aggregated flow state is kept in the core and edge nodes. Despite han-
dling individual flows, edge nodes only keep aggregated information at service/SLS level.
Moreover, the model does not imply the use of specific intra and interdomain signaling,
e.g., in the explicit AC case, the flow AC request may be used for end-to-end signaling. As
there is no per-flow state information maintained about individual reservations, the usual
signaling refreshment/teardown process is avoided. All these aspects contribute positively
for reducing the overhead of the control strategy and for increasing the model ability to
scale;
: easy of integration and deployment - the AC model does not require particular changes to
each domain underlying a service class model. For instance, in Diffserv domains, both
PHBs and PDBs can follow IETF recommendations and be deployed as recommended.
The required changes are at the service control level performed at edge nodes regarding
AC and monitoring tasks. As mentioned, the network core is kept unchanged and, as it
is viewed as a black box, different internal strategies and mechanisms for service imple-
mentation and generic network operation can be accommodated. In this way, from the
end-to-end perspective, the model does not force the involved domain to adopt an uni-
form technological solution. This flexibility along with the above properties facilitate the
integration and deployment of the model in IP networks;
: efficiency - although assessing the efficiency of the model is matter of study in Chapter
7, it will be shown that the proposed AC solution provides a good compromise between
an efficient use of network resources and the service levels provided, even for demanding
traffic classes.
5.7.3 Comparison with other measurement-based AC approaches
Although measurement or monitoring-based AC is not a new concept, the way: (i) AC criteria
and monitoring information are proposed and articulated for controlling QoS and SLSs; (ii) it is
105
CHAPTER 5. PROPOSED ADMISSION CONTROL MODEL
extended to multiservice environments; (iii) end-to-end AC and available service computation is
accomplished, are novel contributions. A comparative study of the conceptual model with other
measurement-based AC approaches is justified to further highlight its characteristics.
As debated in Section 3.3.5, classical MBAC solutions perform flow AC in all the nodes
along the path and focus mainly on assessing accurate estimates of each node or class load and
on defining efficient AC decision algorithms. Thus, a solution to perform flow AC intradomain
and end-to-end using this approach will involve AC, state information and changes in all network
nodes, which need to implement, preferably, an uniform or consistent AC criteria. In practice,
this is difficult to achieve and fails several of the initial defined goals. Moreover, the predictability
and service guarantees achieved [106] are not adequate to support service classes requiring strict
guarantees.
Although MBAC/EMBAC approaches do not offer deterministic guarantees, the proposed
model design, while being measurement-based, has been oriented to CoS domains where differ-
ent service level guarantees need to be fulfilled. As mentioned, through systematic control of
each service class QoS parameters upper bounds and SLSs utilization levels, and through prop-
erly defined safety margins reflecting controlled levels of overprovisioning, the aim is to apply
the simplicity and flexibility aspects of measurement-based solutions to the control of multiple
service classes, assuring, if possible, QoS requirements of more demanding services.
EMBAC solutions are more closely related to the proposed model design as they only involve
edge nodes or end-systems and have an edge-to-edge or end-to-end nature. In active EMBAC
strategies, the end-to-end approach is even simpler giving that interdomain communication is not
needed, the control tasks at edge routers are reduced or inexistent and no particular changes in
the network are required. Despite the simplicity of the process, probing traffic is injected in the
network in a per-application basis and the initial latency of the probing process can be significant.
In addition, stealing and thrashing regimes may occur [106].
As mentioned before, in the proposed model, the probing traffic associated with active mea-
surement methodologies (when used) is injected in a per-class basis, which reduces overhead
and allows a tighter control of intrusive traffic. The initial latency is also reduced as the metrics
computed for AC are available for on-line decisions since the beginning of the corresponding���¶�. Moreover, the stability, predictability and security of the provided services are improved
as the AC decision process is left for each domain according to the monitoring QoS levels and
SLSs commitments. The reliability of the AC decision and of the information about the expected
QoS conveyed up to the destination is also improved as QoS parameter thresholds are properly
106
5.8. MAJOR HURDLES AND SOLUTIONS
controlled in each domain, instead of resulting from an instantaneous and less predictable view
of the network status. In addition, and particularly in CoS networks, when the probing process
and the AC decision are left to end-systems, other control mechanisms need to be implemented to
rule the amount of probing traffic injected in the network simultaneously and to control sources
not well-behaved24.
Although both the present AC proposal and other EMBAC approaches target the problem of
flow AC and end-to-end operation, comparing them just based on these aspects is rather limited.
In fact, the proposed model controls relevant management aspects of multiservice networks in
a per-domain basis, such as domain QoS levels, SLSs usage and auditing. The same consider-
ations can be drawn when comparing the AC model with the edge-to-edge AC proposal based
on aggregate traffic envelopes [122, 123]. Although both solutions assess the available service
edge-to-edge to make an AC decision, [122, 123] involve a proprietary monitoring approach
[147], do not address SLS control and do not provide a feasible and scalable end-to-end AC. The
main advantages and limitations of other AC solutions have been pointed out in Section 3.4.
5.8 Major hurdles and solutions
A distributed edge-to-edge AC model based on monitoring, although having the advantages ex-
pressed in the previous section, poses several hurdles that need to be faced.
First of all, as an edge-to-edge approach, the AC model overhead is closely related to the
number of ingress and egress nodes, i.e., the cardinality of �Ìï ð and &ï ð . This overhead is mainly
due to handling per-service ingress-to-egress monitoring and related state information (see a
more detailed discussion in Section 4.4). For improving monitoring scalability, SLS QoS control
is embedded in the service class control and efficient multipurpose probing patterns are under re-
search. In addition, when considering the end-to-end operation, splitting or bringing monitoring
and AC granularity to the domain level reduces the problem dimension in the same way as, for
instance, OSPF routing and MPLS consider areas or regions to reduce complexity and increase
their ability to scale.
24As mentioned in Section 3.3.5, when several sources send probing traffic simultaneously, problems caused byprobes stealing bandwidth from established flows and denial of service situations (trashing regime) may occur. InCoS networks, especially when probing is carried out in-band, excessive probing may cause degradation of eachclass real traffic performance and interference/stealing between classes. Sources that send excessive probing trafficor make positive AC decisions even when the metrics point out in opposite direction are examples of sources notwell-behaved.
107
CHAPTER 5. PROPOSED ADMISSION CONTROL MODEL
Edge-to-edge monitoring also launches additional challenges to parameter estimation and
control. For instance, controlling the available bandwidth or capacity in a single link or node-
by-node is a fairly simple process, however, controlling it edge-to-edge is not straightforward as
the available bandwidth, capacity or network bottlenecks vary dynamically over time25. When
the network core is hidden from measurements, identifying a specific congestion node or link
responsible for degrading QoS metrics is also difficult to achieve. For controlling the network
core performance, internal strategies, for instance, based on SNMP or on QoS-aware routing
techniques, should be implemented to complement the edge-to-edge control. Although the AC
model is independent of those strategies, the more efficient they are, the better the edge-to-edge
QoS is.
Secondly, when AC is carried out at ingress nodes based on the flow’s specified destination,
topological and routing information for egress identification is needed. Moreover, when flows
are not completely specified, for instance, the end-system destination is unknown (e.g., multicast
traffic), qÆ selection poses additional challenges. The simplest solution to avoid the dependence
on topology-aware routing protocols and to deal with flow’s incomplete information is to perform
AC at egress nodes, which can be easily attained in the proposed model. Within a domain, the
presence of multiple active routes and load balancing between a ( �?Î�ò¦ jÆj½ pair does not pose
particular difficulties to the AC model;
Thirdly, distributed AC may involve multiple ingress routers making concurrent AC deci-
sions. Therefore, dealing with concurrency is a key aspect as otherwise over or false acceptance
may occur. This problem can be reduced resorting to the definition of per-service safety margins
to absorb load fluctuations, complemented by more elaborated solutions to limit simultaneous
AC decisions. Due to the relevance of this topic, Section 5.8.1 is entirely centered on the prob-
lematic of handling concurrent AC.
An additional aspect of concern is how to foresee the impact a new flow acceptance will
have on the existing network resources and current QoS measurements. In order to keep the AC
model simple, the impact of new flows is accommodated within the rate-based control rules by
defining overprovisioning levels, and also by defining and tuning proper safety margins for the
QoS parameters under control.
As regards the model implementation, several aspects of the monitoring process and of the
AC criteria may affect the effectiveness and efficiency of the proposed solution. Both the peri-
25A discussion on methodologies and tools for estimating the path capacity and available bandwidth is providedin [179, 103, 81] and Section 4.3.1.
108

5.8. MAJOR HURDLES AND SOLUTIONS
odicity of measurements and corresponding updates assume particular relevance. Besides their
impact on monitoring overhead due to intrusion, state information and metrics computation ef-
fort, they determine the validity of information used in AC. According to [99], the length of the
measurement intervals and the way new flows are treated affect significantly the performance of
MBAC algorithms (see details in Appendix C). A discussion on possible solutions for measures
update has been carried out in Sections 5.6.2 and 8.4. The impact of the measurement time in-
terval is evaluated in Section 7.3.7. As regards the AC criteria, assessing the adequacy of AC
equations and tuning the corresponding thresholds and safety margins for each service type ac-
cording to the service level guarantees to provide are important aspects to test. The tuning and
performance evaluation of the monitoring process and the AC criteria are covered in Chapter 7.
Other aspects to study related to AC being monitoring-based include: (i) parameter mapping
- dealing with qualitative parameters (of service classes, SLSs or traffic flows) and mapping
those parameters into quantitative parameters for service class control [75, 18]; SLS metrics
also need to be mapped into perceptible parameters both at network and at application levels
[81, 65]; (ii) load forecasting - monitoring-based AC approaches also make difficult the forecast
of future network loads and the processing of AC requests referring to a future time scheduling.
When the estimation of future loads is required, the state information of accepted SLSs for the
corresponding time period and historical data is the only information available to sustain an AC
decision; (iii) fairness of the AC decision - facing the usual tendency of MBAC algorithms in
favoring small flows or flows that traverse small paths [209], defining a fairness criterion and
evaluate and enhance AC policies to fulfill the established criterion are relevant topics to study.
A preliminary study on the fairness of the proposed AC model is provided in Section 7.3.6.
Broader topics left for future research (see discussion in Section 8.4) include handling: (i)
policy-based management and security issues; (ii) dynamic negotiation of SLSs and SLS AC;
(iii) bi-directional AC; (iv) multicast and composite applications; (v) route change; (vi) multipath
options at domains boundaries; (vii) mobility.
5.8.1 Handling concurrency
A distributed AC model may involve multiple ingress routers making concurrent AC decisions.
Therefore, dealing with concurrency is a key aspect to avoid over or false acceptance. In fact,
within a measurement time interval�b���
, each ingress node �²Î makes AC decisions based on
measures estimated for the interval, without knowing the contribution of other ingress nodes to
109

CHAPTER 5. PROPOSED ADMISSION CONTROL MODEL
the metrics variation until����� � , i.e., when the next measuring update takes place26.
The presence of concurrency affects both the measured utilization of the rate related variables
(e.g., 01 ��� �� ) shared among ingress nodes and the QoS measures. Note that, although these QoS
measures reflect the available service between each ¹9�AÎ�ò¦ jÆ�½ pair, the links in the corresponding
path may carry traffic resulting from a different pair of nodes. Therefore, the acceptance deci-
sions at any other ingress node �ÞÎ O �� �XÎ may affect the measured QoS for a specific ¹J�ÞÎ�ò¦ jÆ�½pair. The problem of mis-acceptance within each service class can be reduced resorting to larger
safety margins (e.g., ����� �� , � ��� é ) to absorb the effect of traffic load fluctuations resulting both
from the inherent statistical properties of traffic and from concurrent AC. Here, to reduce or
solve the negative effects of concurrent AC might have on service offering, more elaborated, not
mutually exclusive, solutions are explored and debated such as:
(i) the definition of a concurrency index based on the number of concurrent ingress nodes, af-
fecting explicitly the rate control rules;
(ii) a token-based system to rule and limit the number of simultaneous AC decisions;
(iii) a rate-based credit system to control each �ÞÎ admission capacity.
The following topics explore these scenarios regarding the control of 354 3��2� �� utilization [15].
Initial AC scenario
In the case of explicit AC, it is considered that satisfying the inequality 01 ���`_4�=� � b æ�X á ü�� ��� �� 1 ��� ��determines a positive AC decision. When a new flow acceptance occurs, 01 ���`_4�=� � b can be updated
by considering X á at the corresponding �oÎ , assuring that �oÎ does not accept more traffic than
the estimated available rate for 354636��� � during�����
. However, assuming that other concurrent
ingress nodes are in place, the total new load is temporarily unknown and the available rate at
35463 ��� �� may be exceeded.
Concurrency index
Considering � the set of concurrent ingress nodes sharing a common 35463 ��� �� , the estimation of
35463{��� �� available rate for�b�¶�
can be protected by a concurrency index È ��� �� , which depends on
26In order to maintain simplicity, reduce overhead and latency associated with the exchange of control informa-tion, during § G e each � � only knows the initial measures provided by each � ^ for that time interval and its owncontribution for the rate metric variation.
110

5.8. MAJOR HURDLES AND SOLUTIONS
the cardinality of Ç� , i.e.,ÿ Ç� ÿ . In this way, explicit flow AC is ruled by
X á ü � ��� � 1 ��� �  01 ���`_4�=� ��dbÈ ��� � (5.15)
where � �2� �� 1 ��� ��  01 ���`_4�=� ��!b represents the estimated available rate of 35463 ��� �� to be shared
among all concurrent ingress nodes. In the case of implicit AC, a similar use of È ��� �� can be
applied.
Token-based system
Other possible solution to control the number of concurrent ingress nodes performing AC deci-
sions may follow a token-based system, where the level of concurrency allowed is determined
by the number of tokens available. In this system, only ingress nodes holding a token can accept
new flows in���¶�
. At the limit, when a single token is available in the system, no concurrency is
allowed. Nevertheless, if during�b�+�
the tokens pass through several ingress nodes, the 35463 ��� �utilization can change without common knowledge of all concurrent nodes ( � ). Consequently,
overacceptance may still occur. To cope with this, tokens can be used to carry 35463W�2� �� updates.
If the token assignment remains unchanged during���=�
, this time interval needs to be carefully
defined as it influences directly the domain QoS stability and load balancing, and the AC latency
at ingress nodes without tokens.
Apart from the conceptual simplicity of a token-based model to control concurrency, this
method reduces the problem but does not solve it completely. Additionally, the signaling required
for token exchange among ingress nodes and the time required for �AÎ to get a token, which
depends on the number of available tokens and the number of concurrent nodesÿ Ç� ÿ , may be
prohibitive.
Rate-based credit system
To reduce the underlying drawbacks of a token-based system, the strategic view an egress node
may have of the aggregate measured rate 0X ���`_�7 8 � ��db can be used to implement a rate-based credit
system to control the bandwidth usage of ingress nodes and, implicitly, concurrency.
Following the defined AC model strategy, in the proposed rate-based credit system, the mon-
itoring information obtained at egress node LÆ is used to control the amount of credits assigned
to �oÎ , from an ¹9�²Î�ò¦ jÆ�½ and service class 35Ú � perspective. Each egress RÆ manages a pool of
111

CHAPTER 5. PROPOSED ADMISSION CONTROL MODEL
unused credits in order to distribute spare resources (bandwidth) dynamically as a complement
to a static credit assignment initially defined, considering the ingress nodes grouped into distinct
topological areas. The amount of available credits to be shared by ingress nodes which want to
reach a specific egress qÆ , therefore controlled by this one, should consider: (i) the network
topology, the underlying bottleneck capacity27 and core multiplexing effects; (ii) the bandwidth
sharing policies among classes [54]; (iii) the accepted 35463 ��� 7 8 and the corresponding expected
traffic matrixy (���((�) � ; (iv) the 35463 �2� �� negotiated rate or the capacity allocated at LÆ for 3{Ú � ; (v)
a safety margin of unused credits at each �ÞÎ to assure that �oÎ has a controlled autonomy to make
acceptance decisions during���+�
.
At each���¶�
, ingress nodes may receive new credits using the QoS metric dissemination
process. When an egress node LÆ provides new measures to an ingress node �ÞÎ , it can distribute
new credits too, i.e., no specific or additional control messages are needed (see Figure 5.8). This
strategy avoids several drawbacks of the solution proposed in [54], such as horizontal sharing of
credits, use of specific signaling between ingress nodes and holding to many unused resources at
each �oÎ .
Em
2I1I
3I
nI
N’I
I’N’
∆ t i
∆ t i
In
Flow Fj
Flow Fj
∆ t i+1Status for Flow Fj
∆ t i
I2
I1
∆ t i
Flow Fj
C 1
C 2
C 3
C n
C N’
QoS / Load
...
...
QoS / Load
QoS / Load
QoS / Load
QoS / Load
QoS / Load
QoS / Load
Node Metrics
AC on
Metrics
Metrics
Metrics
Metrics
AC on
AC on
credits
AC off
Credits
Credits
Credits
Credits
Figure 5.8: Rate-oriented credit system
27Network bottleneck can be hard to define as it changes dynamically. Different pairs of E=� � SD� ^ I may share andbe limited in rate by a known bottleneck link; however, a new bottleneck may occur in a different place dependingon traffic load and E=� � S�� ^ I pairs involved. This concept is not new and is usually expressed by metrics such asavailable capacity and available bandwidth. For an initial credit assignment, the available capacity should determinethe bottleneck link between E=����SD� ^ I .
112

5.8. MAJOR HURDLES AND SOLUTIONS
Algorithm 1: Measurement-based Credit Management/* Available Rate Credits at � � for ¯+* e at the end of § G e */<?*?°�É1° eÅÊe � \ "g#7� ' ( _ MË<5* e � \ " # � ')( _ � �¤ e � \ " # � ')( _/* Updating credits for § G e g Q */
/* if <?*?°�É1° eÌÊe � \ "$#�� ' ( _ ��� e � Í8� : credits under limit, new credits are distributed *//* if <?*?°�É1° eÌÊe � \ " # � ')( _ ��� e � Í8� : credits over limit, excess credits return to the pool *//* if <?* °�É1° eÌÊe � \ " # � ')( _ ��< : <?* e � \ " # � ')( _ underestimated, new credits are distributed */<?* ��ÎÐÏe � \ "g#7� ' ( _ M�� e � Í8� ��<?*?°�É1° eÅÊe � \ "$#�� ' ( _**¤¦±A@��5 ¦ ¦� e � ')(�MÑ**¤¦±A@��5 ¦ ¦� e � ')(���<?* ��ÎÐÏe � \ " # � ')( _<?* e � \ "g#7� ' ( _ MË<5* e � \ "$#�� ' ( _)Ò <?* ��ÎÐÏe � \ " # � ')( _Notation:<?* e � \ "g#7� ' ( _ : rate credits available at ��� for ¯+* e ; � ^ maintains this information to determine <?* ��ÎÐÏe � \ " # � ')( _<?*?°�É1° eÅÊe � \ " # � '�( _ : remaining credits at ��� according to the estimated rate usage �¤ e � \ " # � ')( _<?* ��ÎÐÏe � \ "g#7� ' ( _ : credits update for § G e g Q� e � Í8� : safety margin of unused credits at ingress nodes for ¯+* e . It is service-dependent and defined in bps**¤¦±A@��5 ¦ ¦� e � ')( : pool of credits at � ^ for ¯+* e , shared among Ó�-ÔÕ��� concurrent nodes
The management of credits can be either measurement-based or explicit, with credits being
captured and released according to 3{463 ��� 7 8 acceptance and termination. A possible measurement-
based approach for managing the distribution of rate credits is detailed in Algorithm 1.
In an explicit approach, two scenarios can be devised:
: each ingress node �²Î informs explicitly the egress node RÆ of the amount of credits cap-
tured or released, keeping the credits captive during the service scheduling period defined
in their 3{463 ��� 7 8 ;: each egress qÆ uses the measured rate 0X �2�`_�7 8 � ��db to determine when �oÎ needs additional
credits, waiting for an explicit teardown before releasing credits previously assigned. This
avoids removing temporarily unused credits of SLSs still active, assuring that new incom-
ing flows � áäù 354 3 �2� 7J8 have credits available.
At domain egress nodes, the amount of available credits in the pool may change for different
reasons:
: credits are increased when: (i) the negotiated rate1 ��� �� and/or the links’ capacity are up-
graded; (ii) an 35463 ��� 7 8 having qÆ within its scope expires (explicit case, with �ÞÎ returning
credits back); (iii) the egress RÆ senses a rate utilization decrease at �²Î , recovering excess
credits (measurement-based case);
113

CHAPTER 5. PROPOSED ADMISSION CONTROL MODEL
: the amount of available credits is decreased in favor of one �AÎ when: (i) �oÎ is running out
of credits, i.e., its previous credit assignment is reaching an usage limit; this can be sensed
by egress qÆ when measuring the rate 0X ���`_Z798?� � b or (ii) an explicit request occurs from �ÞÎ 28.
Decoupling AC decisions
Controlling1 �2� � utilization during
�����and, consequently, concurrency on 354 36��� � can be
simplified if the AC module and corresponding tasks are divided between ingress and egress
nodes. Instead of controlling the rates1 �2� 7J8
,1W�� (���(��� 7 8
and1 ��� �� at �XΠ, the control of
1 ��� �� can be
passed to qÆ . For example, a flow request � á"ù 354 3 �2� 7 8 crossing the domain Ó]È is accepted at
�oÎ if Eqs. (5.5) and (5.10) are satisfied. When arriving at egress èÆ , � á is accepted and may be
forward to the next domain if Eq. (5.7) is satisfied. When it is rejected at èÆ , a reject notification
due to1 ��� �� underestimation or by an incorrectly defined statistical multiplexing factor may be
reported29. This corresponds to a case of violating 354 3 ��� 7 8 commitments.
Decoupling AC between �²Î and jÆ nodes, apart from being conceptually correct as 3{463 ��� 7 8is related to �²Î and 3{463 ��� �� to jÆ , brings other clear advantage. In fact, the overacceptance or
concurrency control of1 ��� � during
�����becomes straightforward. Since each egress node èÆ
can have a global view of all new flow requests trying to use 354 3 ��� � , for all �oΠ, it can update
the previous 01 ��� � estimation in�����
accordingly. This means that, when RÆ accepts a new flow
it can update 01 ��� � to 01 ��� � ÂÖX á , maintaining an updated view of global 35463 ��� � occupancy.
In this way, overacceptance as regards1 ��� �� cannot occur.
As discussed in Section 5.6.1, the decision of decoupling AC decisions between �?Î and qÆ ,
apart from the concurrency debate, should consider the computational overhead balance between
¹J�XÎ�òT qÆ�½ QoS monitoring and AC tasks, and the required state information at edge nodes.
When egress nodes perform AC regarding 35463 ��� � , the credit strategy may still be useful to
control each �²Î rate share, SLS AC, traffic entering �²Î not involving an 35463{��� � and, indirectly,
the QoS levels in the involved paths.
28Specific requests of credits from ��� to � ^ during §6G e can also be considered, however, it changes the initialconcept and assumption of viewing § G e as a black box, reflecting a measurement steady state.
29Note that when a flow is rejected at � ^ , �< e � "$# remains overestimated till § G e g Q , as its rate ¤ ± is incorrectlyaccounted for.
114

5.9. SUMMARY
5.9 Summary
In this chapter, a service-oriented distributed AC model for managing QoS and SLSs in multiclass
and multidomain environments has been proposed and specified. Initially, the model’s major
goals and assumptions have been highlighted before presenting the model’s architecture and
interrelated areas. As explained, explicit or implicit AC decisions are made based on feedback
from edge-to-edge on-line measurements of service-specific QoS parameters and SLS utilization.
This allows a dynamic control of services and resources, while abstracting from network inherent
complexity and heterogeneity.
Resorting to an intuitive and expressive notation, multiservice domain entities such as ser-
vice classes, upstream and downstream SLSs, and traffic flows have been specified in order to
formalize service-dependent AC rules. These rules allow a flexible and self-adaptive control of
QoS levels and SLS usage both intra and interdomain.
The major conceptual virtues and difficulties inherent to the proposed AC model have been
identified and debated, pointing out ways of overcoming those difficulties. Still in a conceptual
context, the present proposal has been compared with related work in the field. The problematic
of handling multiple AC requests simultaneously due to the distributed nature of the AC model
has been debated and some approaches for controlling concurrency suggested.
115

CHAPTER 5. PROPOSED ADMISSION CONTROL MODEL
116

Chapter 6
AC Model Implementation Issues
This chapter details issues regarding the AC model implementation considering the architecture
presented in Section 5.2. This involves the definition of a limited set of service classes with
distinct QoS requirements and the configuration of corresponding traffic handling policies. For
each service class, the AC criterion is defined and parameterized according to the SLSs and QoS
parameters to be controlled, the safety margins and thresholds to use. The monitoring imple-
mentation decisions involve defining appropriate metrics for the QoS parameters under control,
measurement methodologies and measurement time intervals. As far as active measurements are
concerned, the probing sources are defined and adjusted to the characteristics of each service
class.
After describing the topics above, the motivation for using a simulation environment to test
the AC model is presented. When detailing the simulation prototype, aspects such as the simu-
lation topology and internal structure, the adopted source models, the concrete service and AC
configuration are presented and discussed. Finally, additional issues regarding the implementa-
tion and validation of the simulation prototype are also presented.
6.1 Definition of service classes
The definition of the service classes to be supported in a multiclass network domain is closely re-
lated to the applications and services to be handled and the traffic classification strategy adopted.
Despite the subjective aspects a classification strategy might have, above all, it should be defined
according to the traffic characteristics and QoS requirements of those applications and services.
The relevance of having a consistent view of services has motivated efforts to establish guide-
117
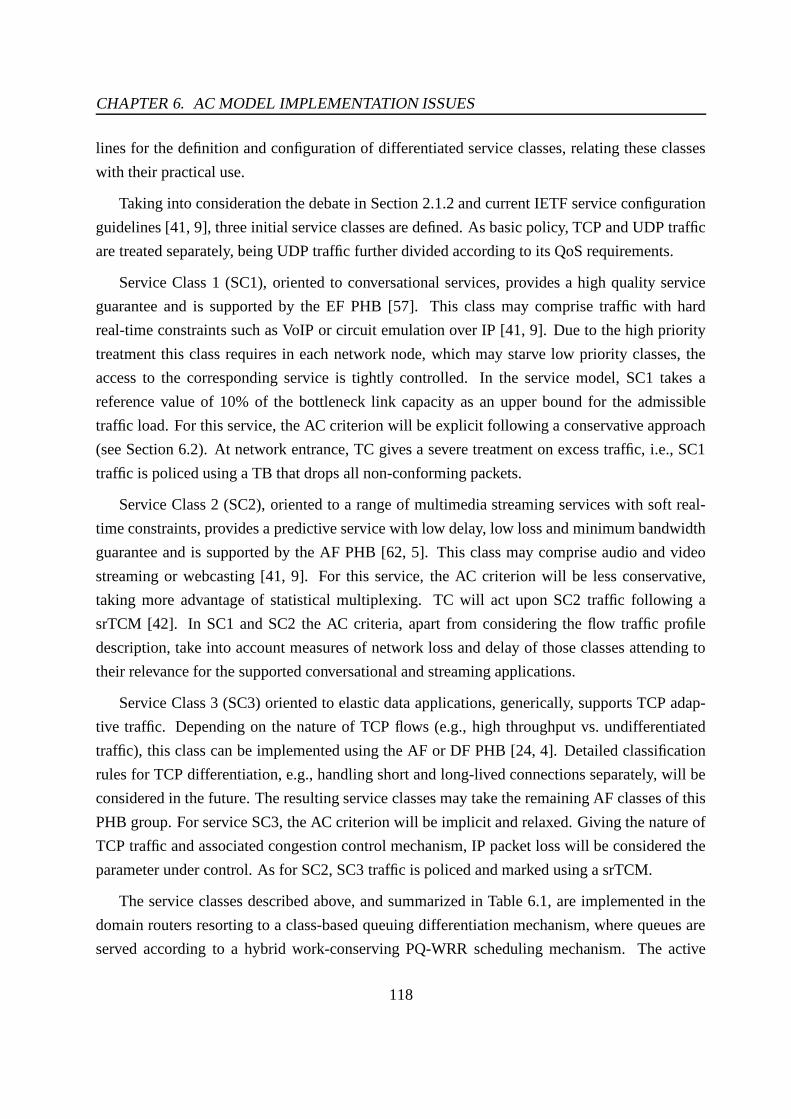
CHAPTER 6. AC MODEL IMPLEMENTATION ISSUES
lines for the definition and configuration of differentiated service classes, relating these classes
with their practical use.
Taking into consideration the debate in Section 2.1.2 and current IETF service configuration
guidelines [41, 9], three initial service classes are defined. As basic policy, TCP and UDP traffic
are treated separately, being UDP traffic further divided according to its QoS requirements.
Service Class 1 (SC1), oriented to conversational services, provides a high quality service
guarantee and is supported by the EF PHB [57]. This class may comprise traffic with hard
real-time constraints such as VoIP or circuit emulation over IP [41, 9]. Due to the high priority
treatment this class requires in each network node, which may starve low priority classes, the
access to the corresponding service is tightly controlled. In the service model, SC1 takes a
reference value of 10% of the bottleneck link capacity as an upper bound for the admissible
traffic load. For this service, the AC criterion will be explicit following a conservative approach
(see Section 6.2). At network entrance, TC gives a severe treatment on excess traffic, i.e., SC1
traffic is policed using a TB that drops all non-conforming packets.
Service Class 2 (SC2), oriented to a range of multimedia streaming services with soft real-
time constraints, provides a predictive service with low delay, low loss and minimum bandwidth
guarantee and is supported by the AF PHB [62, 5]. This class may comprise audio and video
streaming or webcasting [41, 9]. For this service, the AC criterion will be less conservative,
taking more advantage of statistical multiplexing. TC will act upon SC2 traffic following a
srTCM [42]. In SC1 and SC2 the AC criteria, apart from considering the flow traffic profile
description, take into account measures of network loss and delay of those classes attending to
their relevance for the supported conversational and streaming applications.
Service Class 3 (SC3) oriented to elastic data applications, generically, supports TCP adap-
tive traffic. Depending on the nature of TCP flows (e.g., high throughput vs. undifferentiated
traffic), this class can be implemented using the AF or DF PHB [24, 4]. Detailed classification
rules for TCP differentiation, e.g., handling short and long-lived connections separately, will be
considered in the future. The resulting service classes may take the remaining AF classes of this
PHB group. For service SC3, the AC criterion will be implicit and relaxed. Giving the nature of
TCP traffic and associated congestion control mechanism, IP packet loss will be considered the
parameter under control. As for SC2, SC3 traffic is policed and marked using a srTCM.
The service classes described above, and summarized in Table 6.1, are implemented in the
domain routers resorting to a class-based queuing differentiation mechanism, where queues are
served according to a hybrid work-conserving PQ-WRR scheduling mechanism. The active
118
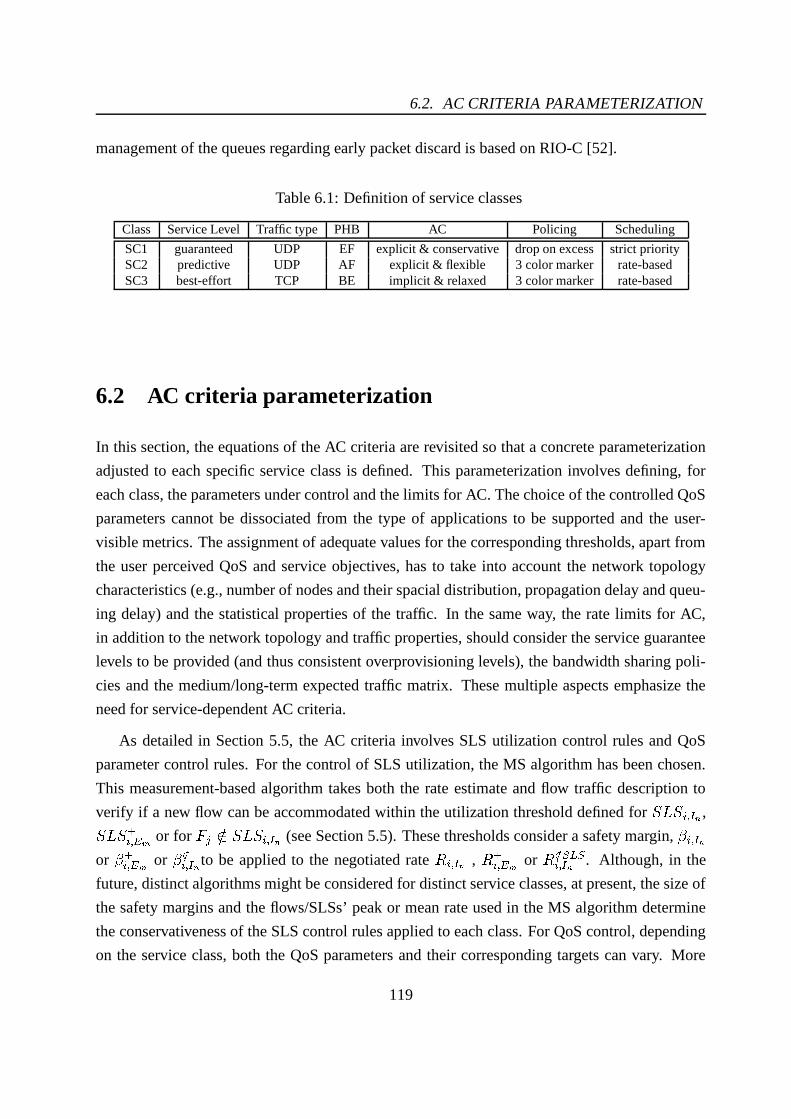
6.2. AC CRITERIA PARAMETERIZATION
management of the queues regarding early packet discard is based on RIO-C [52].
Table 6.1: Definition of service classes
Class Service Level Traffic type PHB AC Policing Scheduling
SC1 guaranteed UDP EF explicit & conservative drop on excess strict prioritySC2 predictive UDP AF explicit & flexible 3 color marker rate-basedSC3 best-effort TCP BE implicit & relaxed 3 color marker rate-based
6.2 AC criteria parameterization
In this section, the equations of the AC criteria are revisited so that a concrete parameterization
adjusted to each specific service class is defined. This parameterization involves defining, for
each class, the parameters under control and the limits for AC. The choice of the controlled QoS
parameters cannot be dissociated from the type of applications to be supported and the user-
visible metrics. The assignment of adequate values for the corresponding thresholds, apart from
the user perceived QoS and service objectives, has to take into account the network topology
characteristics (e.g., number of nodes and their spacial distribution, propagation delay and queu-
ing delay) and the statistical properties of the traffic. In the same way, the rate limits for AC,
in addition to the network topology and traffic properties, should consider the service guarantee
levels to be provided (and thus consistent overprovisioning levels), the bandwidth sharing poli-
cies and the medium/long-term expected traffic matrix. These multiple aspects emphasize the
need for service-dependent AC criteria.
As detailed in Section 5.5, the AC criteria involves SLS utilization control rules and QoS
parameter control rules. For the control of SLS utilization, the MS algorithm has been chosen.
This measurement-based algorithm takes both the rate estimate and flow traffic description to
verify if a new flow can be accommodated within the utilization threshold defined for 35463 ��� 798 ,35463 ��� � or for � á Äù 35463 ��� 798 (see Section 5.5). These thresholds consider a safety margin, � ��� 798or � ��� �� or � ����� 7 8 to be applied to the negotiated rate
1 ��� 798,1 ��� �� or
1 �� (���(��� 7 8. Although, in the
future, distinct algorithms might be considered for distinct service classes, at present, the size of
the safety margins and the flows/SLSs’ peak or mean rate used in the MS algorithm determine
the conservativeness of the SLS control rules applied to each class. For QoS control, depending
on the service class, both the QoS parameters and their corresponding targets can vary. More
119
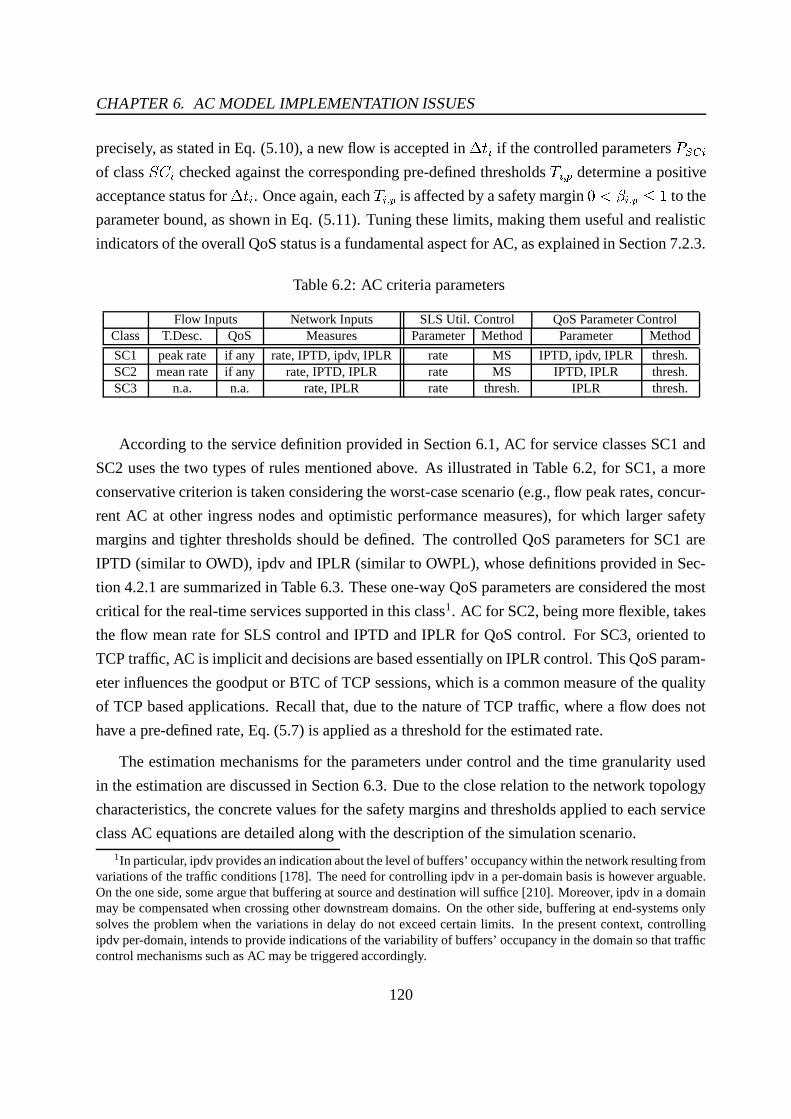
CHAPTER 6. AC MODEL IMPLEMENTATION ISSUES
precisely, as stated in Eq. (5.10), a new flow is accepted in���B�
if the controlled parameters # (�) �of class 35Ú � checked against the corresponding pre-defined thresholds Å ��� é determine a positive
acceptance status for�����
. Once again, each Å ��� é is affected by a safety margin�» �
��� éÙü � to the
parameter bound, as shown in Eq. (5.11). Tuning these limits, making them useful and realistic
indicators of the overall QoS status is a fundamental aspect for AC, as explained in Section 7.2.3.
Table 6.2: AC criteria parameters
Flow Inputs Network Inputs SLS Util. Control QoS Parameter ControlClass T.Desc. QoS Measures Parameter Method Parameter Method
SC1 peak rate if any rate, IPTD, ipdv, IPLR rate MS IPTD, ipdv, IPLR thresh.SC2 mean rate if any rate, IPTD, IPLR rate MS IPTD, IPLR thresh.SC3 n.a. n.a. rate, IPLR rate thresh. IPLR thresh.
According to the service definition provided in Section 6.1, AC for service classes SC1 and
SC2 uses the two types of rules mentioned above. As illustrated in Table 6.2, for SC1, a more
conservative criterion is taken considering the worst-case scenario (e.g., flow peak rates, concur-
rent AC at other ingress nodes and optimistic performance measures), for which larger safety
margins and tighter thresholds should be defined. The controlled QoS parameters for SC1 are
IPTD (similar to OWD), ipdv and IPLR (similar to OWPL), whose definitions provided in Sec-
tion 4.2.1 are summarized in Table 6.3. These one-way QoS parameters are considered the most
critical for the real-time services supported in this class1. AC for SC2, being more flexible, takes
the flow mean rate for SLS control and IPTD and IPLR for QoS control. For SC3, oriented to
TCP traffic, AC is implicit and decisions are based essentially on IPLR control. This QoS param-
eter influences the goodput or BTC of TCP sessions, which is a common measure of the quality
of TCP based applications. Recall that, due to the nature of TCP traffic, where a flow does not
have a pre-defined rate, Eq. (5.7) is applied as a threshold for the estimated rate.
The estimation mechanisms for the parameters under control and the time granularity used
in the estimation are discussed in Section 6.3. Due to the close relation to the network topology
characteristics, the concrete values for the safety margins and thresholds applied to each service
class AC equations are detailed along with the description of the simulation scenario.1In particular, ipdv provides an indication about the level of buffers’ occupancy within the network resulting from
variations of the traffic conditions [178]. The need for controlling ipdv in a per-domain basis is however arguable.On the one side, some argue that buffering at source and destination will suffice [210]. Moreover, ipdv in a domainmay be compensated when crossing other downstream domains. On the other side, buffering at end-systems onlysolves the problem when the variations in delay do not exceed certain limits. In the present context, controllingipdv per-domain, intends to provide indications of the variability of buffers’ occupancy in the domain so that trafficcontrol mechanisms such as AC may be triggered accordingly.
120

6.3. MONITORING DECISIONS
6.3 Monitoring decisions
Although being decoupled from the AC process itself, monitoring is a critical component of the
model as it is used for active QoS and SLS control. For active control, monitoring has to be
on-line [190, 74] in order to provide feedback reflecting the current network conditions so that
proper control decisions can be made in useful time.
In this study, the objective of on-line monitoring is twofold. First, it provides inputs for the
AC decision module and corresponding MBAC algorithms, which apart from flow traffic profile
and/or QoS requirements information, require a realistic view of the service classes’ status and
performance. Therefore, several parameters need to be defined and estimated in order to drive
AC decisions. Second, it allows SLS and QoS auditing in the domain [14].
The on-line monitoring implementation options are discussed below, regarding the definition
of controlled QoS and SLS metrics, measurement methodologies and estimation methods to be
applied.
Controlled QoS and SLS metrics
In the previous section, several edge-to-edge QoS and SLS parameters have been identified to
be controlled at each egress monitoring module. Considering [22, 167, 169, 168, 165] inputs,
the corresponding metrics are defined in Table 6.3 for a measurement time interval���B�
. The
mean value of each metric in���+�
, measured for an ingress-egress ¹9�ÞÎ�ò¦ jÆj½ pair and service class
35Ú � , is controlled by the AC module as described in Sections 5.4.5 and 5.5. The estimation of
35463{��� � usage is not ingress dependent, therefore it is not controlled necessarily on an ingress-
egress basis.
Measurement methodology
For each class, the metrics in Table 6.3 are estimated and controlled resorting to passive and
active measurements. Comparing the outcome of both approaches allows to assess and tune the
probing process, as discussed in Section 7.2.2. In more detail, passive measurements consist
of evaluating the QoS metrics for each measurement interval���B�
, using the traffic aggregate
comprising active flows within service class 35Ú � . A similar evaluation is performed for active
measurements, but in this case, only the probing traffic embedded in each service class is con-
sidered. For active measurements, the type of packets used to evaluate the metrics (packet of
121

CHAPTER 6. AC MODEL IMPLEMENTATION ISSUES
Table 6.3: Controlled QoS and SLS parameters and corresponding metrics
Rate ParametersRate ¤ (bps) ¤ e � µ K �M�E d µl§®GJ· _¤¦±T�¶� e Itµ K �Uª�§ G eUtilization × × e � µ K �ÌM�¤ e � µ K �Uª9*Delay Parameters (s)IP Transfer Delay ( ��� � ¢ ) ��� � ¢ e � ¨ a K M�Gt'�(d� ¨ a K �&Gt" # � ¨ a KMean IPTD ( ��� � ¢ ) ��� � ¢ e � µ K �MëE d ��� � ¢ e � ¨ a K ª d .�iÞGJ· _ ¤¦±B��� e Icµ K �Maximum IPTD ( ��� � ¢ ^ ° � ) ��� � ¢ ^ ° �e � µ K � M�mè¥�>�E0��� � ¢ e � ¨ a K9I µ Ko�Minimum IPTD ( ��� � ¢ ^ e � ) ��� � ¢ ^ e �e � µ Ko� M�mL§®©E=��� � ¢ e � ¨ a K¨I µ Ko�Inst. Packet Delay Var.2 ( §4.�@o� ) §4.�@X� e � V ¨ a K MT��� � ¢ e � ¨ a K ����� � ¢ e � ¨ a K > QMean ipdv ( §4.�@o� ) §4.�@o� e � µ Ko� M�E dÙØ §4.�@o� e � V ¨ a K Ø ª d ..iAGJ· _ ¤T±T�¶� e Itµ K �Signed mean ipdv ( §4.�@o� % ) §4.�@X� % e � µ Ko� M�E d §4.�@X� e � V ¨ a K ª d ..iÞGJ· _ ¤¦±T�¶� e Itµ K �Maximum ipdv ( §4.�@X� ^ ° � ) §4.�@X� ^ ° �e � µ Ko� M�mä¥�>�Eh§4.�@o� e � V ¨ a K Icµ K �Minimum ipdv ( §4.�@o� ^ e � ) §4.�@X� ^ e �e � µ K � M�mè§�©EH§4.�@o� e � V ¨ a K Itµ K �Loss parametersIP Loss Ratio (
� TG9¥Þ�����5¬E< ) ���5¬x< e � K À K MrG9 TG _.�iÞGJ· _ �H �·=G e ªTG9 TG _.�iÞGJ· _ ·B±=©�G eIP Loss Ratio in §6G e ( ���5¬E< ) ���5¬E< e � µ K �ÌM$E d ..iÞGJ· _ �2 �·+G e ª d .�iÞGJ· _ ·B±=©�G e Itµ K �
type P) are, in most cases, UDP packets of 100 bytes, and the Type-P probing stream follows
distinct patterns (e.g., Ú"Ø 1äç , #Ù%"� ç , �!$#Ù%Ù% ç , Ø À Ø ç ) as discussed in Section 4.3.1. Section
7.2.2 explores the adequacy of different probing solutions for the simultaneous estimation of the
considered metrics, and includes tests with TCP probing ( �´ÅL# ç ) and distinct packet sizes.
Parameter estimation mechanisms
According to Section 4.2.2, apart from the measurement methodology itself, the value of each
metric to be used in�����
can be evaluated resorting to distinct estimation methods such as Time-
Window, Point Sample and Exponential Averaging. These methods are here applied to edge-to-
edge measurements.
For SLS utilization control, the traffic load of the SLS is the parameter to be estimated. The
estimated value 01 ��� �� , which corresponds to the current aggregate rate of the SLS, is obtained
resorting to the three estimation mechanisms mentioned above in order to assess which of them
reflects the real network load more closely (see Section 7.2.3). In order to obtain a statistically
meaningful number of samples, following [105, 121] guidelines, the relation between the win-
2Two variants of mean ipdv have been considered: (i) signed §4.�@X� % ; (ii) module §4.�@o� . The former captures theincreasing or decreasing tendency of ipdv in § G e , however, it loses the real amplitude of ipdv variations as positiveand negative ipdv values smooth or cancel each other. The latter captures the mean amplitude of ipdv variationsduring § G e . §4.�@o� ^ e � and §4.�@o� ^ ° � complement the information provided by mean statistics. Establishing alarmsbased on pre-defined variations on the metrics’ values may be explored in the future.
122
6.4. IMPLEMENTING THE AC MODEL IN A SIMULATION PLATFORM
dow size Å and the sampling period 3 should be ÅjÄ�3 ª � � with 3 e � ��� 4 Ä�Ú , for a packet size
of 4 bits transmitted at rate Ú .
For QoS control, the point sample method is used. However, as in [211], for each sampling
period 3 (equivalent to���+�
), independently of which estimation method is in use, the metric
takes an average instead of an instantaneous value. For the passive measurement methodology,
this corresponds to consider all packets in a class3. As regards the active measurement method-
ology, only the probing packets are used. Additionally, as the estimates are edge-to-edge, the
dimensioning of 3 considers the one-way delay and not the packet transmission time.
6.4 Implementing the AC model in a simulation platform
6.4.1 Modeling approaches
The study of computer networks may follow several modeling techniques depending on aspects
such as the nature of the problem to be solved or the ease of access to the systems to be studied.
When an experimental study is not feasible either because the involved systems are still under
development, their cost is prohibitive or setting up a real testing environment is not possible,
analytical and/or simulation modeling is commonly used [212, 213].
Analytical models are a powerful and precise tool to evaluate, for instance, the behavior,
conformance and performance of network systems and protocols. However, when the systems
are too complex, involving a large number of variables, the analysis usually leads to models that
are analytically intractable unless substantial simplifying approximations are made. Examples
of common assumptions are: (i) the system under study has infinite buffering capacity; (ii) the
traffic sources generate independent and identically distributed streams; (iii) no other network
traffic is in transit, i.e., the system is isolated; (iv) the network infrastructure is error free; or
(v) the network does not implement any traffic control actions. However, in practice, network
nodes have limited buffering capacity, today’s network traffic is likely to be highly correlated
and undergo some form of conditioning control, and retransmissions are likely to occur due to
lost or corrupted packets. Therefore, assumptions such as the ones mentioned above may limit
considerably the scope of the results, leading sometimes to analytical models that do not reflect
or are far from the reality.
3This may be too demanding, especially in high-speed networks due to large traffic volume and reduced packetprocessing time. In the present context, the aim is to tune the probing process.
123
CHAPTER 6. AC MODEL IMPLEMENTATION ISSUES
Alternatively, computer simulations constitute a very useful and flexible modeling tool. In
fact, the main advantages of using simulation models lay on the following: (i) simulation models
are simpler to devise and handle than analytical models; (ii) multiple test configurations can be
easily tested by changing or updating the simulation scenario; (iii) when compared to analytical
modeling, simulation allows an easier evaluation of a system dynamics and behavior. The use
of simulation is therefore very appealing as it opens a wide range of different test scenarios
without adding too much complexity to the study. A problem usually pointed out to simulation
approaches is that for some statistics or rare events the simulation needs to run over very long
periods, which may make it impracticable. The use of hybrid models is sometimes adopted [214].
In this study, apart from the flexibility it provides, simulation is justified by the scope and
complex nature of the problem to solve. In fact, although initially a single domain simulation
model is under consideration, there are multiple variables and test scenarios involved. In addi-
tion, testing a full implementation of the AC model prototype in real networks would be difficult
to accomplish mainly due to administrative impairments and limitations in performing test mea-
surements in operational network equipment.
6.4.2 Choosing the simulation platform
Giving that a full discussion of simulation languages and tools falls outside the scope of this
thesis, the debate will concentrate briefly on two major open-source simulation packages, partic-
ularly oriented to study multiple aspects of computer networks and related protocols. These sim-
ulation packages provide a comprehensive support for simulation modeling as they fully include
basic event-driven simulation facilities, an extensive set of reusable networking components, and
support for high-level simulation programming, debugging and animation.
The Objective Modular Network Testbed in C++ (OMNeT++) [215] is a event-driven simula-
tion environment that provides a generic, modular, component-based architecture for modeling.
Components or modules are programmed in C++, then assembled into larger components and
models using a high-level network description language (NED). Due to its modular and open ar-
chitecture, the simulation kernel and models can be embedded into user applications easily. OM-
NeT++ is open-source, provides extensive graphical user interface support and includes many
protocols of the TCP/IP stack, IPv6, MPLS, and frameworks for mobile and ad-hoc network
simulations.
The Network Simulator (NS-2) [216] developed within the VINT Project [217, 218] is a
124
6.5. SIMULATION MODEL
widely used open-source simulation platform. NS-2 is an object-oriented event-driven simulator
with the core written in C++ and an OTcl interpreter as a front-end [219]. The C++ programming
level is suitable for detailed protocol implementation, where the running time of handling packet
headers and performing protocol functionality is rather relevant. At OTcl programming level,
the code can be changed more easily but runs slower than C++. Therefore, it is suitable for
high-level modeling of network aspects that involve varying parameters and configurations in
order to explore a large number of simulation scenarios. Currently, from many contributions
worldwide, NS-2 covers a wide range of networking modules providing a comprehensive support
of the TCP/IP protocol stack, including several transport and routing protocols both for unicast
and multicast environments. NS-2 also supports mobile IPv4 and IPv6, ad-hoc and satellite
networking.
Although OMNeT++ has been appointed as a better structured simulation platform, allowing
a modular and hierarchical design supported by an enhanced interactive graphical environment
[220], NS-2 includes more specific communications protocol facilities. In particular, the module
comprising the main components for implementing Diffserv networks4 has been a key factor for
choosing NS-2 for the present work.
6.5 Simulation model
To test the proposed AC model in a multiclass domain, a simulation prototype was devised and
set up based on the NS-2 platform [216]. The design of this simulation prototype cannot be
decoupled from the main objectives of the experiments which are mainly: (i) the assessment and
tuning of the monitoring process as a whole, with emphasis on the active measurement method-
ology; (ii) the evaluation of the AC criteria ability to meet service commitments efficiently.
In this context, the simulation model internal structure, the adopted topology, the traffic
source models adjusted to each service class characteristics and the configuration of the AC
model are described next. The parameterization provided in this description is generically used
throughout the experiments included in Chapter 7. According to the particularities of each test
scenario, a different parameterization for the tested variables is sometimes explored and detailed
in the corresponding test scenario taxonomy.
4The Diffserv model, developed initially by a team from Nortel Networks, was included in NS-2.1b8 version.
125
CHAPTER 6. AC MODEL IMPLEMENTATION ISSUES
6.5.1 Simulation model internal structure
The concretization of the simulation prototype involves identifying the functional modules to
implement and the relevant characteristics of each one influencing on the AC model behavior. In
addition, the inputs or configurable aspects of each module and corresponding outputs also need
to be carefully established in order to pursue the main objectives of the tests. In other words, the
resulting simulation model should be versatile enough, allowing to access both the monitoring
process and the AC criteria efficiency under a wide range of test scenarios.
Concretely, after setting up of the network topology (see Section 6.5.2) and resorting to the
Differentiated Services Module embedded in NS-2, the developed simulation model implements
three functional interrelated modules - Automatic Source Generation Module, AC Decision Mod-
ule, and QoS and SLS Monitoring Module. Considering an ¹J�ÞÎ�ò¦ jÆ�½ pair, Figure 6.1 presents
a simplified diagram of the simulation model architecture, including the relation between these
modules and main underlying functions and variables. The two modules represented in gray are
recursive being responsible for the dynamic behavior of traffic source generation and monitoring.
A brief description of each module is provided next.
: Automatic Source Generation Module - This recursive module is responsible for the auto-
matic start up and tear down of traffic sources for each service class (flow initiation and
departure), simulating the normal network traffic dynamics. It allows a per-class distinct
parameterization of the traffic sources characteristics, as regards the source model distri-
bution and related parameters, the flow arrival process and the flow holding time process.
For each class, the acceptance and start of each new flow is conditioned by the status
of the AC decision variables (QoS-Accept-Status ( �äÚ _ 3 � Û �1� /l� ã ú ), SLS-Accept-Status,
#Adm-Flows ( �äË�à _ � ß9Ï�Ñä/7� ã ú )) defined and updated by the AC decision and monitoring
modules. When accepted, for explicit AC, the new flow rate can be used to update the
SLS-Accept-Status at the corresponding ingress node; for implicit AC, the #Adm-Flows
can be updated. The output variables related to this module provide information about the
number of active flows, the number of accepted/rejected flows on a continuous basis and
per time interval. Probing sources are also defined per-class but statically activated at the
beginning of the simulation.
: AC Decision Module - This module, enclosing the QoS control module and the SLS uti-
lization control module, is responsible for implementing the AC decision rules defined in
126
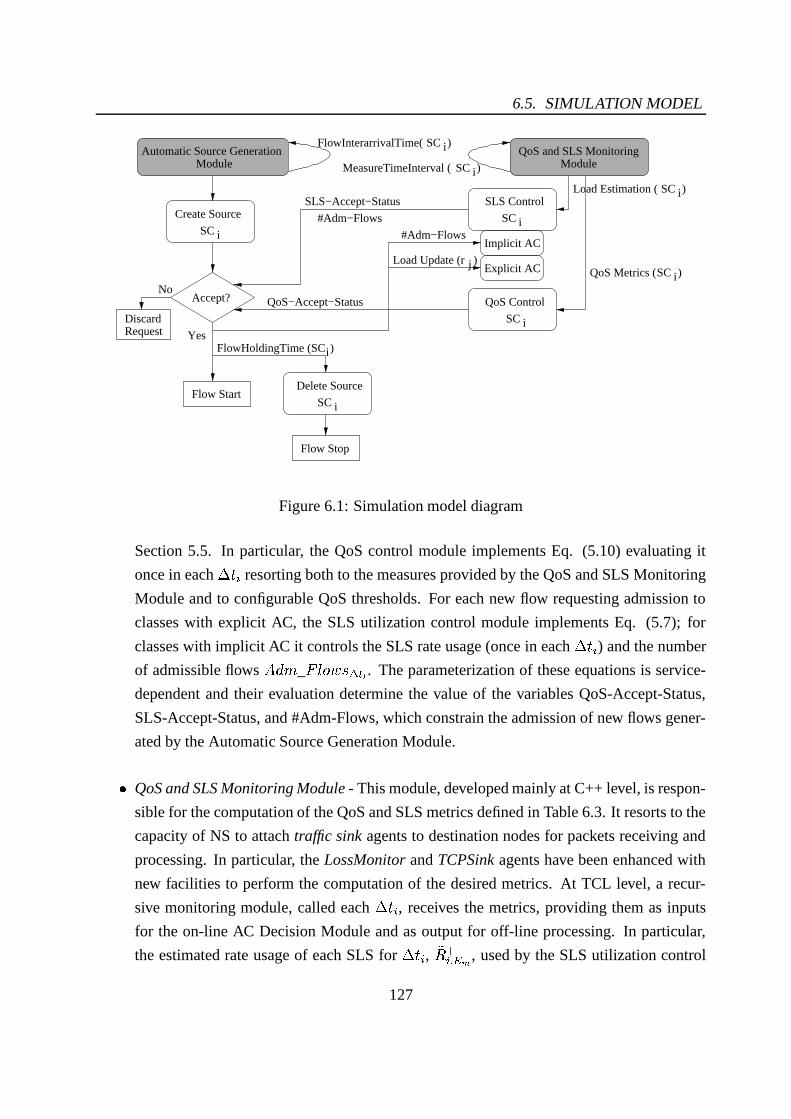
6.5. SIMULATION MODEL
Accept?
SC iQoS Metrics ( )
SC i)Load Estimation (
FlowHoldingTime (SCi)
Flow Start
Flow Stop
SC i
SC i
SC i
SC i
jLoad Update (r )
Implicit AC
Explicit AC
Automatic Source GenerationModule
SC iFlowInterarrivalTime( )
SC iMeasureTimeInterval ( )
Yes
NoQoS−Accept−Status
#Adm−Flows
SLS−Accept−Status
QoS and SLS Monitoring Module
DiscardRequest
Delete Source
Create Source
QoS Control
SLS Control
#Adm−Flows
Figure 6.1: Simulation model diagram
Section 5.5. In particular, the QoS control module implements Eq. (5.10) evaluating it
once in each�����
resorting both to the measures provided by the QoS and SLS Monitoring
Module and to configurable QoS thresholds. For each new flow requesting admission to
classes with explicit AC, the SLS utilization control module implements Eq. (5.7); for
classes with implicit AC it controls the SLS rate usage (once in each���=�
) and the number
of admissible flows �äË�à _ � ß9Ï�Ñä/�� ã ú . The parameterization of these equations is service-
dependent and their evaluation determine the value of the variables QoS-Accept-Status,
SLS-Accept-Status, and #Adm-Flows, which constrain the admission of new flows gener-
ated by the Automatic Source Generation Module.
: QoS and SLS Monitoring Module - This module, developed mainly at C++ level, is respon-
sible for the computation of the QoS and SLS metrics defined in Table 6.3. It resorts to the
capacity of NS to attach traffic sink agents to destination nodes for packets receiving and
processing. In particular, the LossMonitor and TCPSink agents have been enhanced with
new facilities to perform the computation of the desired metrics. At TCL level, a recur-
sive monitoring module, called each���+�
, receives the metrics, providing them as inputs
for the on-line AC Decision Module and as output for off-line processing. In particular,
the estimated rate usage of each SLS for���+�
, 01 ��� �� , used by the SLS utilization control
127
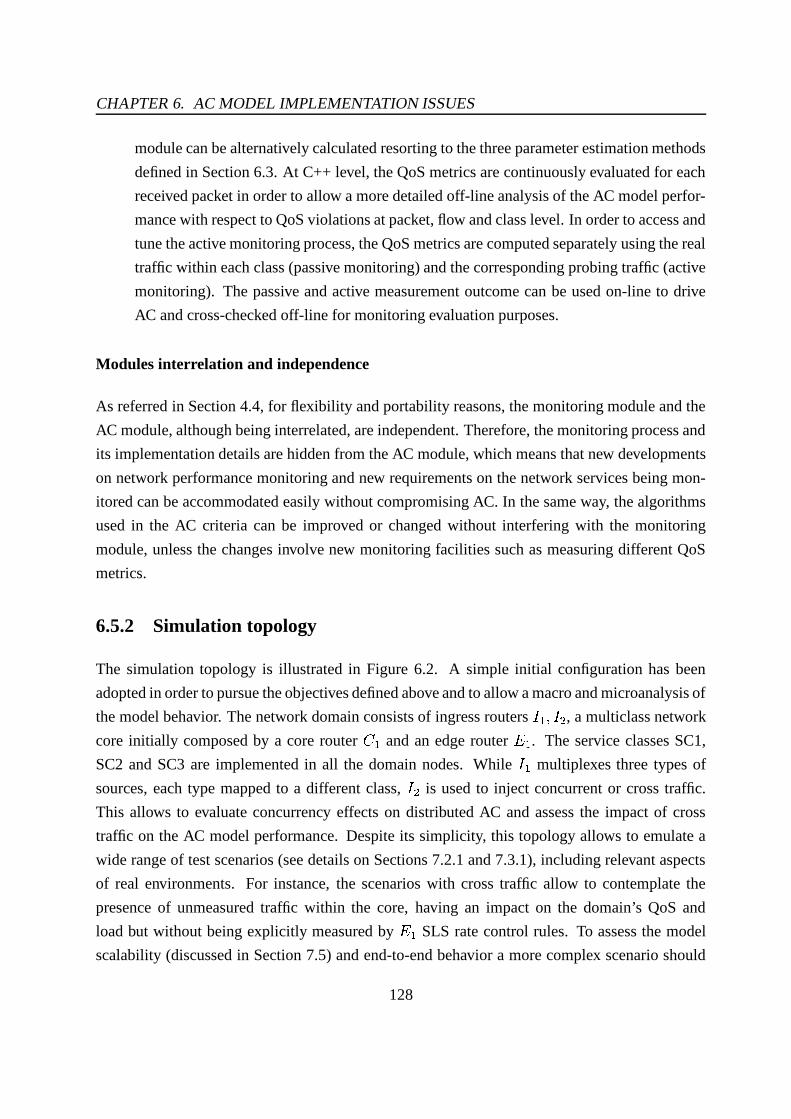
CHAPTER 6. AC MODEL IMPLEMENTATION ISSUES
module can be alternatively calculated resorting to the three parameter estimation methods
defined in Section 6.3. At C++ level, the QoS metrics are continuously evaluated for each
received packet in order to allow a more detailed off-line analysis of the AC model perfor-
mance with respect to QoS violations at packet, flow and class level. In order to access and
tune the active monitoring process, the QoS metrics are computed separately using the real
traffic within each class (passive monitoring) and the corresponding probing traffic (active
monitoring). The passive and active measurement outcome can be used on-line to drive
AC and cross-checked off-line for monitoring evaluation purposes.
Modules interrelation and independence
As referred in Section 4.4, for flexibility and portability reasons, the monitoring module and the
AC module, although being interrelated, are independent. Therefore, the monitoring process and
its implementation details are hidden from the AC module, which means that new developments
on network performance monitoring and new requirements on the network services being mon-
itored can be accommodated easily without compromising AC. In the same way, the algorithms
used in the AC criteria can be improved or changed without interfering with the monitoring
module, unless the changes involve new monitoring facilities such as measuring different QoS
metrics.
6.5.2 Simulation topology
The simulation topology is illustrated in Figure 6.2. A simple initial configuration has been
adopted in order to pursue the objectives defined above and to allow a macro and microanalysis of
the model behavior. The network domain consists of ingress routers ���¦òT� ' , a multiclass network
core initially composed by a core router Úä� and an edge router ´� . The service classes SC1,
SC2 and SC3 are implemented in all the domain nodes. While ��� multiplexes three types of
sources, each type mapped to a different class, � ' is used to inject concurrent or cross traffic.
This allows to evaluate concurrency effects on distributed AC and assess the impact of cross
traffic on the AC model performance. Despite its simplicity, this topology allows to emulate a
wide range of test scenarios (see details on Sections 7.2.1 and 7.3.1), including relevant aspects
of real environments. For instance, the scenarios with cross traffic allow to contemplate the
presence of unmeasured traffic within the core, having an impact on the domain’s QoS and
load but without being explicitly measured by "� SLS rate control rules. To assess the model
scalability (discussed in Section 7.5) and end-to-end behavior a more complex scenario should
128
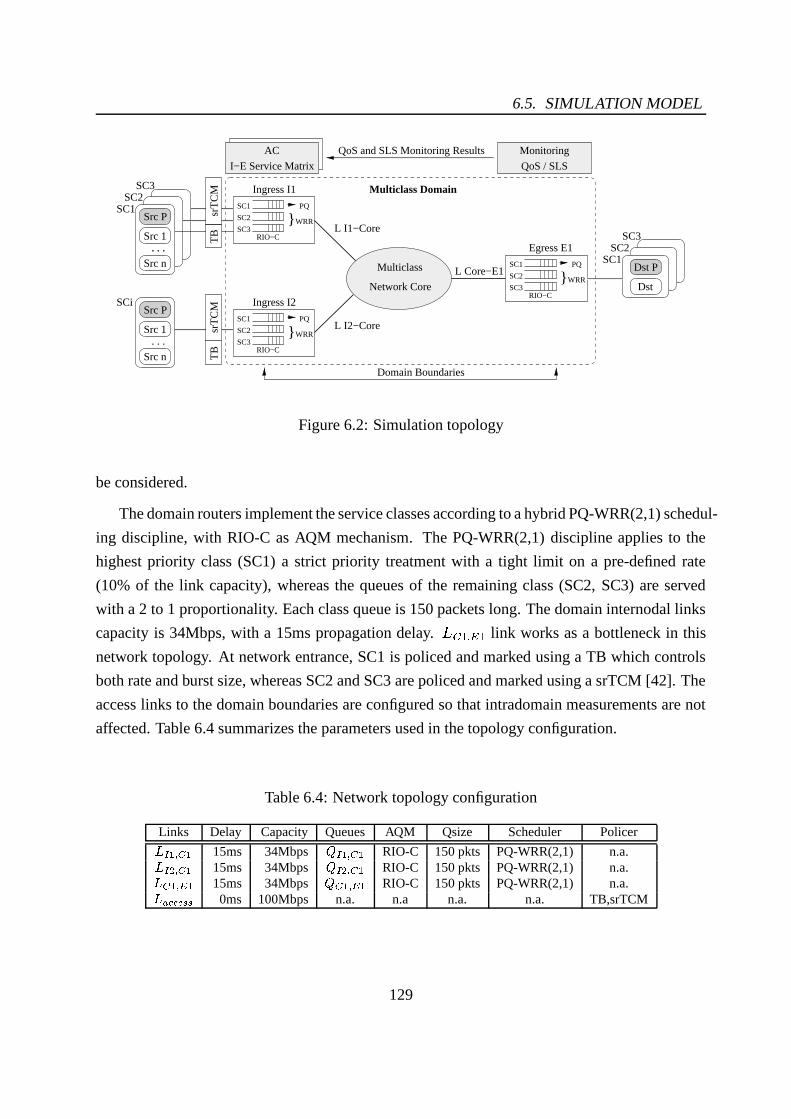
6.5. SIMULATION MODEL
I−E Service Matrix
AC
}SC1
SC2
SC3
PQ
WRR
RIO−C
Ingress I2
}SC1
SC2
SC3
PQ
WRR
RIO−C
Egress E1
}SC1
SC2
SC3
PQ
WRR
RIO−C
Ingress I1
Dst P
Dst
SC1SC2
SC3
Src 1
Src n
Src 1
Src n
TB
TB L I1−Core
L I2−Core
L Core−E1
Monitoring
QoS / SLS
. . .
SCi
. . . . . . . . .
SC1
SC3SC2
QoS and SLS Monitoring Results
Multiclass Domain
Domain Boundaries
Src P
Src Psr
TC
Msr
TC
M
Network Core
Multiclass
Figure 6.2: Simulation topology
be considered.
The domain routers implement the service classes according to a hybrid PQ-WRR(2,1) schedul-
ing discipline, with RIO-C as AQM mechanism. The PQ-WRR(2,1) discipline applies to the
highest priority class (SC1) a strict priority treatment with a tight limit on a pre-defined rate
(10% of the link capacity), whereas the queues of the remaining class (SC2, SC3) are served
with a 2 to 1 proportionality. Each class queue is 150 packets long. The domain internodal links
capacity is 34Mbps, with a 15ms propagation delay. 4 ) � � � link works as a bottleneck in this
network topology. At network entrance, SC1 is policed and marked using a TB which controls
both rate and burst size, whereas SC2 and SC3 are policed and marked using a srTCM [42]. The
access links to the domain boundaries are configured so that intradomain measurements are not
affected. Table 6.4 summarizes the parameters used in the topology configuration.
Table 6.4: Network topology configuration
Links Delay Capacity Queues AQM Qsize Scheduler Policer¬ " Q � � Q 15ms 34Mbps B " Q � � Q RIO-C 150 pkts PQ-WRR(2,1) n.a.¬ " V � � Q 15ms 34Mbps B " V � � Q RIO-C 150 pkts PQ-WRR(2,1) n.a.¬x� Q � ' Q 15ms 34Mbps B�� Q � ' Q RIO-C 150 pkts PQ-WRR(2,1) n.a.¬ ° }¨} Ît%t% 0ms 100Mbps n.a. n.a n.a. n.a. TB,srTCM
129

CHAPTER 6. AC MODEL IMPLEMENTATION ISSUES
6.5.3 Source models
Generically, three source models have been considered: Constant Bit Rate ( Ú"Ø 1 ) sources, Expo-
nential on-off ( �!$#Ù%Ù% ) and Pareto on-off ( #i� 1 ) sources. �!$#Ù%Ù% sources have exponential
distributed sojourn on-off times, where during the on period packets are generated at fixed rate
X kbps. #P� 1 sources follow the same behavior but now ruled by a Pareto distribution with a
shape factor ¾ . #i� 1 sources with � » ¾ »À
under aggregation will allow to generate traf-
fic exhibiting long-range dependence. SC1, SC2 and SC3 traffic is generated resorting to the
source models specified and parameterized according to Table 6.5. While SC1 comprises UDP
traffic sources with low rates (r) and small packet sizes (l) reflecting voice-like traffic, SC2 also
comprises UDP traffic with higher rates and larger packet sizes as generated by other real-time
applications with higher variability. SC3 comprises long-lived high throughput TCP traffic, from
FTP protocol. Some tests consider other TCP (Telnet) and UDP traffic in this class too. The flow
interarrival and holding times are exponentially distributed. In [13], a distinct parameterization
of traffic sources was considered for the defined service classes.
Table 6.5: Traffic sources configuration
Class Protocol Src Type Src Param.: r(kbps);l(bytes);on/off(ms) Inter. Time Hold. Time
SC1 UDP * : <5��� Q (r=23, l=120) 0.3-2s 90sUDP �5Di��Ú?Ú ��� Q (r=64, l=120, on=0.96,off=1.69) 0.3-2s 90sUDP �5��< ��� Q (r=64, l=120, on=0.96,off=1.69, Û =1.5) 0.3-2s 90s
SC2 UDP * : <5��� V (r=128, l=512) 0.5-2s 120sUDP �5Di��Ú?Ú ��� V (r=256, l=512, on=off=500) 0.5-2s 120sUDP �5��<5��� V (r=256, l=512, on=off=500, Û =1.5) 0.5-2s 120s
SC3 TCP FTP App. (r=unspecified, l=512) 0.5-2s 180sTCP TELNET App. (r=unspecified, l=512) 0.5-2s 180s
SC3 UDP * : <5��� @ (r=256, l=512) 0.5-2s 180sUDP �5Di��Ú?Ú ��� @ (r=512, l=512, on=off=500) 0.5-2s 180sUDP �5��<5��� @ (r=512, l=512, on=off=500, Û =1.5) 0.5-2s 180s
Probing UDP * : < Ü (r=1.6-variable, l=100) 1 src sim. dur.UDP ��Ú5�1Ü (r=1.6-variable, l=100, Poisson) 1 src sim. dur.UDP �5DÝ��Ú?Ú�Ü (r=1.6-variable, l=100, on/off=exp.) 1 src sim. dur.UDP
: k : Ü (r=1.6-variable, l=100, on=det./off=unif.) 1 src sim. dur.TCP � � � Ü (r=variable, l=100) 1 src sim. dur.
As regards probing, as mentioned in Section 4.3.1, five types of probing sources were consid-
ered: periodic ( Ú"Ø 1èç ); Poisson ( #"%Ù� ç ); exponential on-off ( "!$#"%&% ç ); back-to-back hybrid
on-off ( Ø À Ø ç ) and a TCP-based source ( ��ÅL# ç ). For each ¹9�²Î�ò¦ jÆj½ pair, a single probing source
is embedded in each service class, i.e., an in-band probing source type is defined to measure the
130
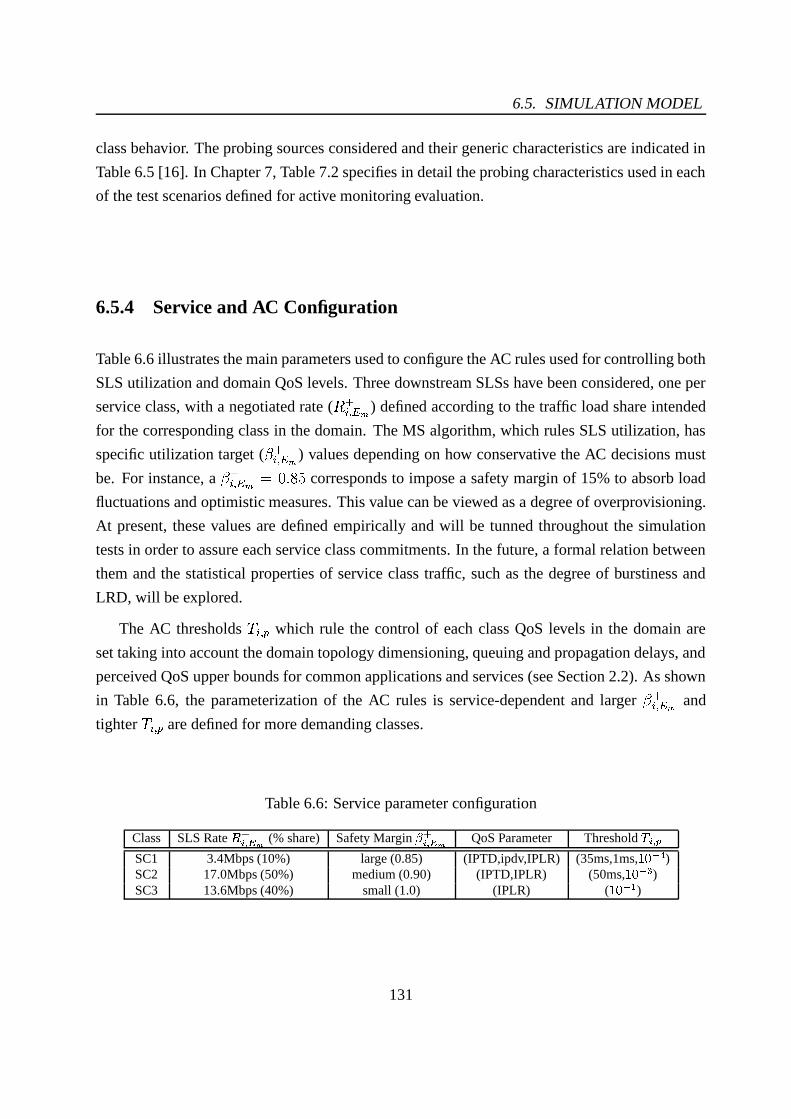
6.5. SIMULATION MODEL
class behavior. The probing sources considered and their generic characteristics are indicated in
Table 6.5 [16]. In Chapter 7, Table 7.2 specifies in detail the probing characteristics used in each
of the test scenarios defined for active monitoring evaluation.
6.5.4 Service and AC Configuration
Table 6.6 illustrates the main parameters used to configure the AC rules used for controlling both
SLS utilization and domain QoS levels. Three downstream SLSs have been considered, one per
service class, with a negotiated rate (1 ��� � ) defined according to the traffic load share intended
for the corresponding class in the domain. The MS algorithm, which rules SLS utilization, has
specific utilization target ( ����� �� ) values depending on how conservative the AC decisions must
be. For instance, a � �2� ��n� ���Z���corresponds to impose a safety margin of 15% to absorb load
fluctuations and optimistic measures. This value can be viewed as a degree of overprovisioning.
At present, these values are defined empirically and will be tunned throughout the simulation
tests in order to assure each service class commitments. In the future, a formal relation between
them and the statistical properties of service class traffic, such as the degree of burstiness and
LRD, will be explored.
The AC thresholds Å ��� é which rule the control of each class QoS levels in the domain are
set taking into account the domain topology dimensioning, queuing and propagation delays, and
perceived QoS upper bounds for common applications and services (see Section 2.2). As shown
in Table 6.6, the parameterization of the AC rules is service-dependent and larger � ��� � and
tighter Å ��� é are defined for more demanding classes.
Table 6.6: Service parameter configuration
Class SLS Rate < ge � '�( (% share) Safety Margin � ge � ')( QoS Parameter Threshold� e � ¨
SC1 3.4Mbps (10%) large (0.85) (IPTD,ipdv,IPLR) (35ms,1ms, ;=<.>�C )SC2 17.0Mbps (50%) medium (0.90) (IPTD,IPLR) (50ms, ;B<�>.@ )SC3 13.6Mbps (40%) small (1.0) (IPLR) ( ;=<�> Q )
131

CHAPTER 6. AC MODEL IMPLEMENTATION ISSUES
6.6 Model validation
The validation of the simulation model, as a multistage process, has required running a large
number of simulations for verifying the consistency and correct behavior of the implemented
model. The validation process was accomplished through detailed observation, analysis and
cross-checking of specific output data and traces collected from the following sources:
: trace and monitor NS facilities [219]- the two primary types of monitoring objects sup-
ported by NS - traces and monitors - were configured in order to trace the progression
of packets belonging to each flow, class and ingress node (traces) and record counts of
relevant quantities such as bytes, packets and loss associated with all traffic or per-flow
(monitors). In particular, flow monitors were configured to gather per-flow statistics help-
ing the validation of the Automatic Traffic Source Generation module;
: placement of debugging checkpoints in critical parts of the developed code - resorting to
runtime data, the value of state variables, the interaction among modules, intermediate/final
results and strategic counters were verified;
: output files from the TCL code and C++ code - the relevant output data from the distinct
modules was stored in files to be processed and analyzed off-line;
: graphical results - the graphical representation and consequent analysis of the simulation
results allowed a first and rapid identification of a specific behavior or value deserving a
more detailed verification and/or explanation.
This integrated and incremental analysis of the simulation results allowed the verification of the
implemented model regarding:
: the simulation topology and parameterization;
: the correct initiation and departure of traffic flows for each class and their corresponding
profile;
: the obtained measures at packet level, flow level and class level both continuously and per
measurement time interval�b���
;
: the AC status variables and AC decisions facing the involved parameters;
132

6.7. ADDITIONAL ISSUES ON MODEL IMPLEMENTATION
: the correct behavior of each module individually and of the simulation dynamics as a
whole.
6.7 Additional issues on model implementation
Apart from the developed simulation model involving the described main functional modules,
new functions have been added to NS-2 libraries in order to support the specificities needed for
the defined set of tests. In some cases, the facilities of existing functions have been extended and,
when necessary, new functions have been created. In more detail,
: to support the dynamic generation and simultaneous treatment of several TCP flows, the
TCP implementation (TCP-Tahoe) has been modified in order to distinguish between dis-
tinct TCP flows and corresponding acknowledgment;
: to support the QoS and SLS Monitoring module, the LossMonitor agent has been improved
for contemplating the computation of the required metrics;
: to support the set of tests related to the evaluation of the active monitoring process, new
probing source models ( #"%Ù�Té and Ø À Ø�é ) and policers/markers for interleaved coloring of
probes have been developed.
Finally, several scripts were written to assist the off-line treatment and analysis of the simula-
tions’ output files. Other tools used to complement this off-line analysis were gnumeric [221]
and gnuplot [222].
6.8 Summary
In this chapter, the main aspects concerning the implementation of the AC model have been
identified and discussed. These aspects, aiming at developing a prototype to evaluate both the
monitoring and AC criteria performance, have included the definition of: (i) the characteristics
of the service classes and controlling policies; (ii) the AC criteria parameterization involving
service-dependent safety margins and thresholds; (iii) the QoS and SLS parameters to monitor
and the measurement methodologies. To sustain these definitions and the corresponding choice
133

CHAPTER 6. AC MODEL IMPLEMENTATION ISSUES
of policies and parameters, an analysis of current work and guidelines on these topics has been
carried out, not only in this chapter but also throughout Chapters 2, 3 and 4.
Resorting to the NS-2 simulation platform, a multiservice network simulation prototype em-
bedding the proposed AC model has been developed and configured accordingly. The main
aspects regarding the implementation and validation of the simulation prototype have also been
discussed.
134
Chapter 7
Test Scenarios and Results
Generically, an AC proposal needs to be sustained by a set of well-defined and target tests allow-
ing to: (i) evaluate the performance of the proposed solution; (ii) identify and handle unexpected
or critical aspects of the model behavior; (iii) identify the limitations and aspects that need fur-
ther study. In special, evaluating the performance of the solution should be carried out both at
macro level, e.g., studying the domain and classes’ behavior, and at micro level, e.g., covering
packet analysis and tuning of algorithms and corresponding parameters.
In the context of the present work, these tests intend to provide a proof-of-concept of the
proposed AC model as regards its self-adaptive ability to control QoS and SLSs in multiclass IP
networks, assessing the AC criteria effectiveness in satisfying service commitments and the net-
work utilization levels achieved. In addition, attending to the discussion on multiclass QoS mon-
itoring challenges provided in Section 4.3 and on existing measurement methodologies, several
tests are planned to evaluate the adequacy of active measurements for edge-to-edge multipurpose
QoS estimation1.
Thus, in this chapter, after detailing the objectives of the tests, multiple testing scenarios are
devised in order to evaluate both the active measurement methodology and the proposed AC
criteria. The debate focuses mainly on the evaluation results of these two related components
of the AC model, covering also relevant issues regarding the deployment of the model in a large
scale.
1Although the proposed AC model is not tied to a particular measurement methodology (providing that thenecessary metrics are evaluated and made available regularly to drive AC decisions), several advantages have beenpointed out concerning the use of active measurements for edge-to-edge QoS monitoring (see Section 4.2.2).
135

CHAPTER 7. TEST SCENARIOS AND RESULTS
Table 7.1: SLS and QoS control
SLS Control Rule (Eq.(5.7))Class Monitoring Inputs Flow Inputs SLS Rate Safety Margin�< ge � \ �1� '�( _ ¤ ± < ge � ')( (share %) � ge � ')(SC1 Traffic load peak rate 3.4Mbps (10%) 0.85SC2 Traffic load mean rate 17.0Mbps (50%) 0.902
SC3 Traffic load n.a. 13.6Mbps (40%) 1.0
QoS Control Rule (Eq.(5.10))Class Monitoring Inputs �� e � ¨ Flow Inputs QoS Param. Thresh.
� e � ¨SC1 IPTD, ipdv, IPLR if available Þ�ߦm´·�à+;+m´·�à+;B<?>.CSC2 IPTD, IPLR if available ßX<�m´·�àU©ÌY ¥.YCà+;B<?>.@SC3 IPLR n.a. ©ÌY ¥.YÅàU©ÌY ¥.YCà+;=<?> Q
7.1 Main objectives of the tests
The main objectives of testing the proposed AC model in a multiclass domain are twofold. In
a first stage, the aim is to assess the active measurement methodology, including the multipur-
pose probing process and the parameters’ estimation mechanisms. Both the characteristics of
probing patterns and the probing ability to capture each class behavior are studied aiming at a
multipurpose QoS estimation [16]. In addition, a comparison of the estimation mechanisms Å�á ,
�èÍ ì _ #Ù3 and Ý� is carried out in order to evaluate which one provides the most realistic esti-
mate of each class and SLS load [12]. In a second stage, the proposed AC criteria are evaluated
as regards their ability to assure that each service class QoS commitments are not violated, while
assessing both SLSs and global network utilization [11]. This evaluation is carried out using
distinct test scenarios, varying the parameters in the AC rules and the traffic conditions.
In order to pursue these objectives, the simulation prototype described in Section 6.5 is used
throughout the experiments taking into account the implementation decisions and parameters
defined along Chapter 6. In particular, the service-dependent AC rules parameterization is sum-
marized in Table 7.1.
As initial configuration three downstream SLSs, one per service class, are considered. The
choice of SLS rate shares (1 úom â � ), safety margins ( � ��� � ) and QoS parameters thresholds ( Å �2� é )
are defined in the right hand side of Table 7.1. As shown, larger � �2� �� and tighter Å ��� é are defined
for more demanding classes3. In more detail, according to Eq. 5.7 and Eq. 5.10, SC1 traffic is
2The tests presented in Section 7.2 use a threshold of 0.95.3The safety margin � ge � ')( can be viewed and used in two distinct ways: (i) as a safety margin in the utilization of
136

7.2. EVALUATION OF THE ACTIVE MEASUREMENT METHODOLOGY
blocked when the sum of the rate estimate 01 ���`_V�=� � b and the flow’s peak rate X á is above 85% of the
rate share defined in 35463 ��� � , i.e.,1 ��� � , or any of the controlled QoS parameters 0# ��� é exceeds
its pre-defined threshold Å ��� é . For SC2, a safety margin of 10% , which corresponds to a � ��� ��of 90% is defined and the flow’s mean rate is now used. SC3 does not include any safety margin
and the controlled parameter is IPLR. For SC3, the maximum number of active flows in a given
time interval, i.e., �äË�à _ Z ß9Ï�Ñä/�� ã ú , is set to one hundred flows (see details in Section 7.3.3). As
said before, the AC thresholds Å �2� é are set taking into account the domain topology and perceived
QoS upper bounds for common applications and services. This initial configuration may lead to
eventual QoS degradation or service violation that, from a test perspective, constitutes a useful
scenario to verify the model’s behavior and the ability of probing to detect it.
The results presented in the following sections were obtained running a large number of
simulations of about ten minutes each, after discarding an initial convergence period. Simulations
up to forty minutes were also carried out in order to verify the consistency of the behavior under
evaluation.
7.2 Evaluation of the active measurement methodology
Ideally, probing should be able to reflect both the shape and the scale of the relevant metrics
identified for each class so that its behavior is correctly captured with reduced intrusion. If this
is accomplished, probing can provide valuable inputs both for SLS auditing in the domain and
for active network control tasks, such as AC.
The main objective of these tests is to determine and tune adequate multipurpose probing
patterns for the defined service classes. To pursue this objective and assess the suitability and
effectiveness of multipurpose in-band probing patterns in measuring the QoS parameters defined
in Table 7.14, several alternative probing schemes varying space and time properties of probing
patterns are explored. These include the probing distribution, rate, drop precedence (color) and
< ge � ')( (downstream overprovisioning level), defined to absorb traffic fluctuations resulting from natural and/or in-duced properties of traffic (e.g., presence of concurrency), avoiding overutilization and, consequently, indiscriminatepacket discard at � ^ ; (ii) as a degree of overprovisioning that is necessary to keep inside the domain (internal over-provisioning level), for ¯+* e utilization. Exploring � ge � '�( in the latter context is facilitated by the relation between
the global ¯Ì¬c¯ ge � ')( share, i.e., when considering all ¯E* e , and the domain bottleneck link. In practice, this relationcan be provided by the expected traffic matrix ¼ ��¸l�e � \ ��� ^`_ , topological information and internal services policies.
4Note that, the probing rate cannot be directly compared to the class rate. For bandwidth estimation, specificprobing techniques need to be used [201, 103].
137
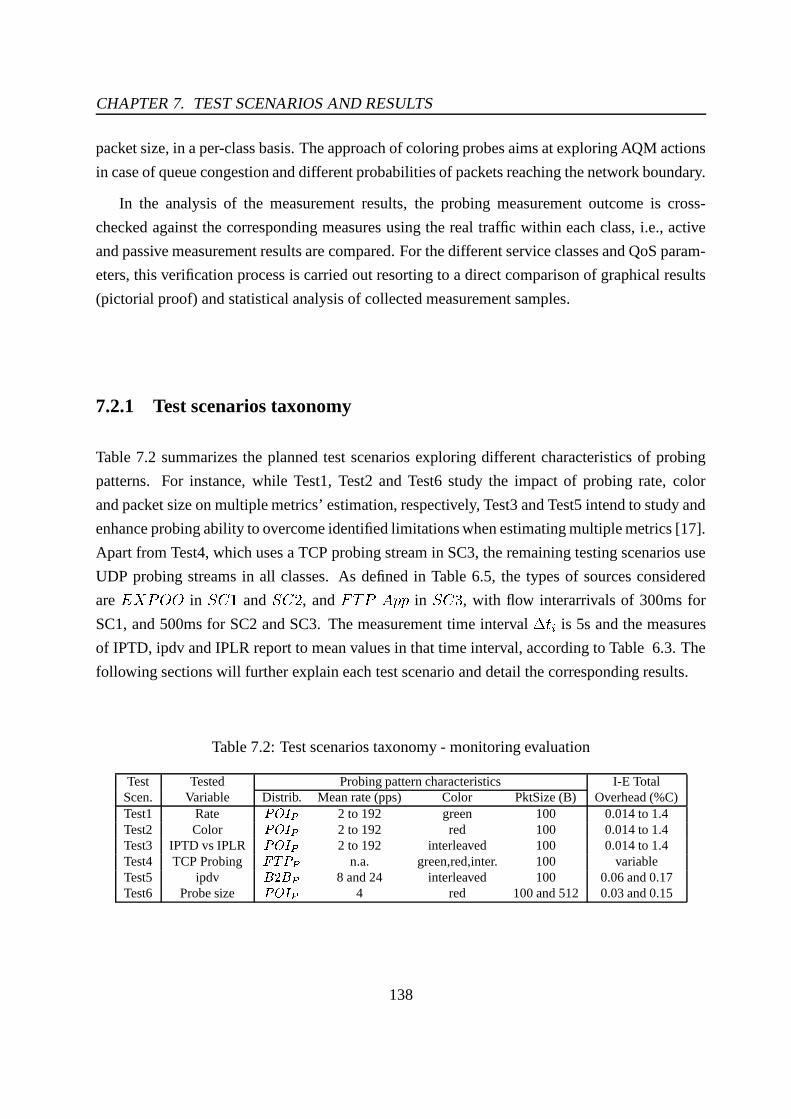
CHAPTER 7. TEST SCENARIOS AND RESULTS
packet size, in a per-class basis. The approach of coloring probes aims at exploring AQM actions
in case of queue congestion and different probabilities of packets reaching the network boundary.
In the analysis of the measurement results, the probing measurement outcome is cross-
checked against the corresponding measures using the real traffic within each class, i.e., active
and passive measurement results are compared. For the different service classes and QoS param-
eters, this verification process is carried out resorting to a direct comparison of graphical results
(pictorial proof) and statistical analysis of collected measurement samples.
7.2.1 Test scenarios taxonomy
Table 7.2 summarizes the planned test scenarios exploring different characteristics of probing
patterns. For instance, while Test1, Test2 and Test6 study the impact of probing rate, color
and packet size on multiple metrics’ estimation, respectively, Test3 and Test5 intend to study and
enhance probing ability to overcome identified limitations when estimating multiple metrics [17].
Apart from Test4, which uses a TCP probing stream in SC3, the remaining testing scenarios use
UDP probing streams in all classes. As defined in Table 6.5, the types of sources considered
are "!ë#Ù%Ù% in 35Ú]� and 35Ú À , and �´ÅL#ã� Ê�Ê in 35Ú"Á , with flow interarrivals of 300ms for
SC1, and 500ms for SC2 and SC3. The measurement time interval���=�
is 5s and the measures
of IPTD, ipdv and IPLR report to mean values in that time interval, according to Table 6.3. The
following sections will further explain each test scenario and detail the corresponding results.
Table 7.2: Test scenarios taxonomy - monitoring evaluation
Test Tested Probing pattern characteristics I-E TotalScen. Variable Distrib. Mean rate (pps) Color PktSize (B) Overhead (%C)Test1 Rate ��Ú5� Ü 2 to 192 green 100 0.014 to 1.4Test2 Color ��Ú5� Ü 2 to 192 red 100 0.014 to 1.4Test3 IPTD vs IPLR ��Ú5� Ü 2 to 192 interleaved 100 0.014 to 1.4Test4 TCP Probing � � � Ü n.a. green,red,inter. 100 variableTest5 ipdv
: k : Ü 8 and 24 interleaved 100 0.06 and 0.17Test6 Probe size ��Ú5��Ü 4 red 100 and 512 0.03 and 0.15
138
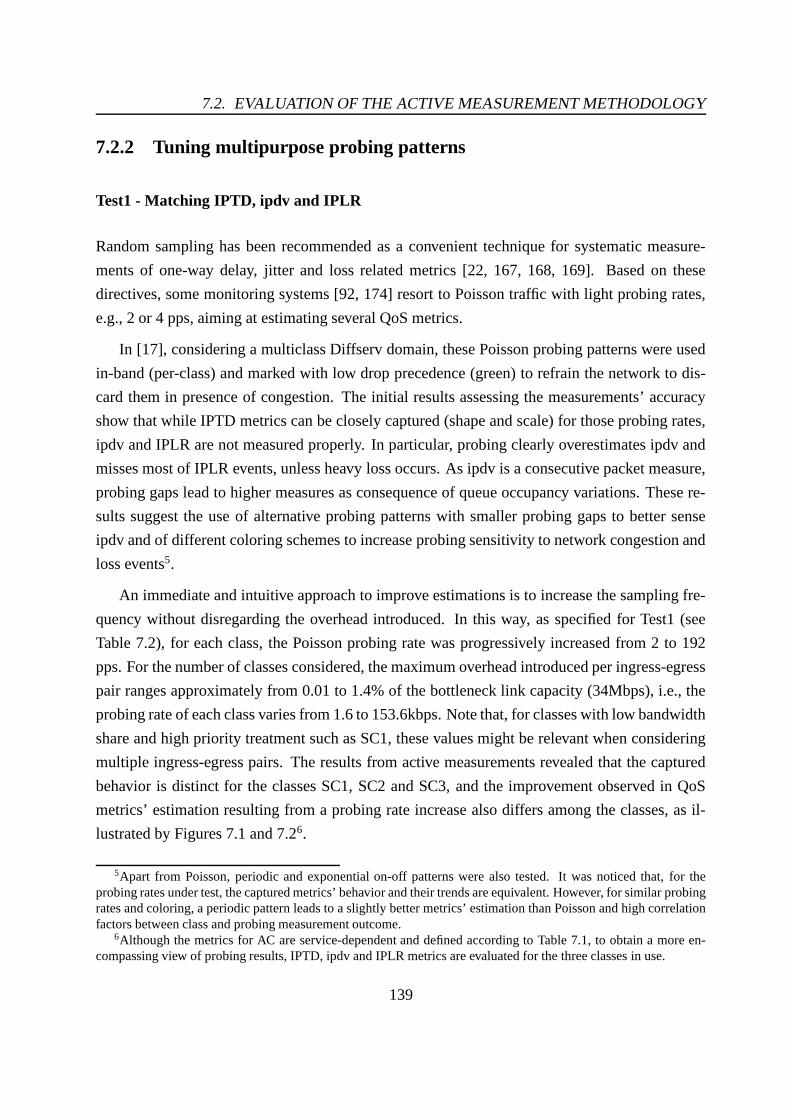
7.2. EVALUATION OF THE ACTIVE MEASUREMENT METHODOLOGY
7.2.2 Tuning multipurpose probing patterns
Test1 - Matching IPTD, ipdv and IPLR
Random sampling has been recommended as a convenient technique for systematic measure-
ments of one-way delay, jitter and loss related metrics [22, 167, 168, 169]. Based on these
directives, some monitoring systems [92, 174] resort to Poisson traffic with light probing rates,
e.g., 2 or 4 pps, aiming at estimating several QoS metrics.
In [17], considering a multiclass Diffserv domain, these Poisson probing patterns were used
in-band (per-class) and marked with low drop precedence (green) to refrain the network to dis-
card them in presence of congestion. The initial results assessing the measurements’ accuracy
show that while IPTD metrics can be closely captured (shape and scale) for those probing rates,
ipdv and IPLR are not measured properly. In particular, probing clearly overestimates ipdv and
misses most of IPLR events, unless heavy loss occurs. As ipdv is a consecutive packet measure,
probing gaps lead to higher measures as consequence of queue occupancy variations. These re-
sults suggest the use of alternative probing patterns with smaller probing gaps to better sense
ipdv and of different coloring schemes to increase probing sensitivity to network congestion and
loss events5.
An immediate and intuitive approach to improve estimations is to increase the sampling fre-
quency without disregarding the overhead introduced. In this way, as specified for Test1 (see
Table 7.2), for each class, the Poisson probing rate was progressively increased from 2 to 192
pps. For the number of classes considered, the maximum overhead introduced per ingress-egress
pair ranges approximately from 0.01 to 1.4% of the bottleneck link capacity (34Mbps), i.e., the
probing rate of each class varies from 1.6 to 153.6kbps. Note that, for classes with low bandwidth
share and high priority treatment such as SC1, these values might be relevant when considering
multiple ingress-egress pairs. The results from active measurements revealed that the captured
behavior is distinct for the classes SC1, SC2 and SC3, and the improvement observed in QoS
metrics’ estimation resulting from a probing rate increase also differs among the classes, as il-
lustrated by Figures 7.1 and 7.26.
5Apart from Poisson, periodic and exponential on-off patterns were also tested. It was noticed that, for theprobing rates under test, the captured metrics’ behavior and their trends are equivalent. However, for similar probingrates and coloring, a periodic pattern leads to a slightly better metrics’ estimation than Poisson and high correlationfactors between class and probing measurement outcome.
6Although the metrics for AC are service-dependent and defined according to Table 7.1, to obtain a more en-compassing view of probing results, IPTD, ipdv and IPLR metrics are evaluated for the three classes in use.
139
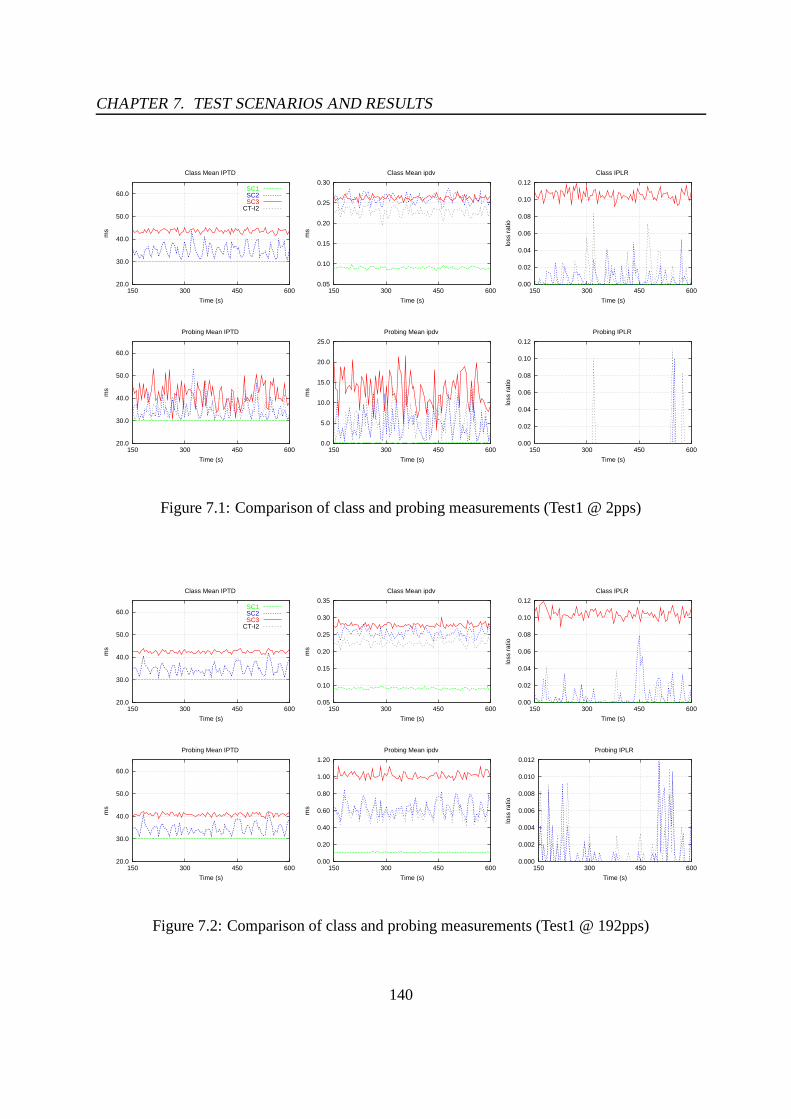
CHAPTER 7. TEST SCENARIOS AND RESULTS
20.0
30.0
40.0
50.0
60.0
150 300 450 600
ms
Time (s)
Class Mean IPTD
SC1SC2SC3
CT-I2
0.05
0.10
0.15
0.20
0.25
0.30
150 300 450 600
ms
Time (s)
Class Mean ipdv
0.00
0.02
0.04
0.06
0.08
0.10
0.12
150 300 450 600
loss
rat
io
Time (s)
Class IPLR
20.0
30.0
40.0
50.0
60.0
150 300 450 600
ms
Time (s)
Probing Mean IPTD
0.0
5.0
10.0
15.0
20.0
25.0
150 300 450 600
ms
Time (s)
Probing Mean ipdv
0.00
0.02
0.04
0.06
0.08
0.10
0.12
150 300 450 600
loss
rat
io
Time (s)
Probing IPLR
Figure 7.1: Comparison of class and probing measurements (Test1 @ 2pps)
20.0
30.0
40.0
50.0
60.0
150 300 450 600
ms
Time (s)
Class Mean IPTD
SC1SC2SC3
CT-I2
0.05
0.10
0.15
0.20
0.25
0.30
0.35
150 300 450 600
ms
Time (s)
Class Mean ipdv
0.00
0.02
0.04
0.06
0.08
0.10
0.12
150 300 450 600
loss
rat
io
Time (s)
Class IPLR
20.0
30.0
40.0
50.0
60.0
150 300 450 600
ms
Time (s)
Probing Mean IPTD
0.00
0.20
0.40
0.60
0.80
1.00
1.20
150 300 450 600
ms
Time (s)
Probing Mean ipdv
0.000
0.002
0.004
0.006
0.008
0.010
0.012
150 300 450 600
loss
rat
io
Time (s)
Probing IPLR
Figure 7.2: Comparison of class and probing measurements (Test1 @ 192pps)
140
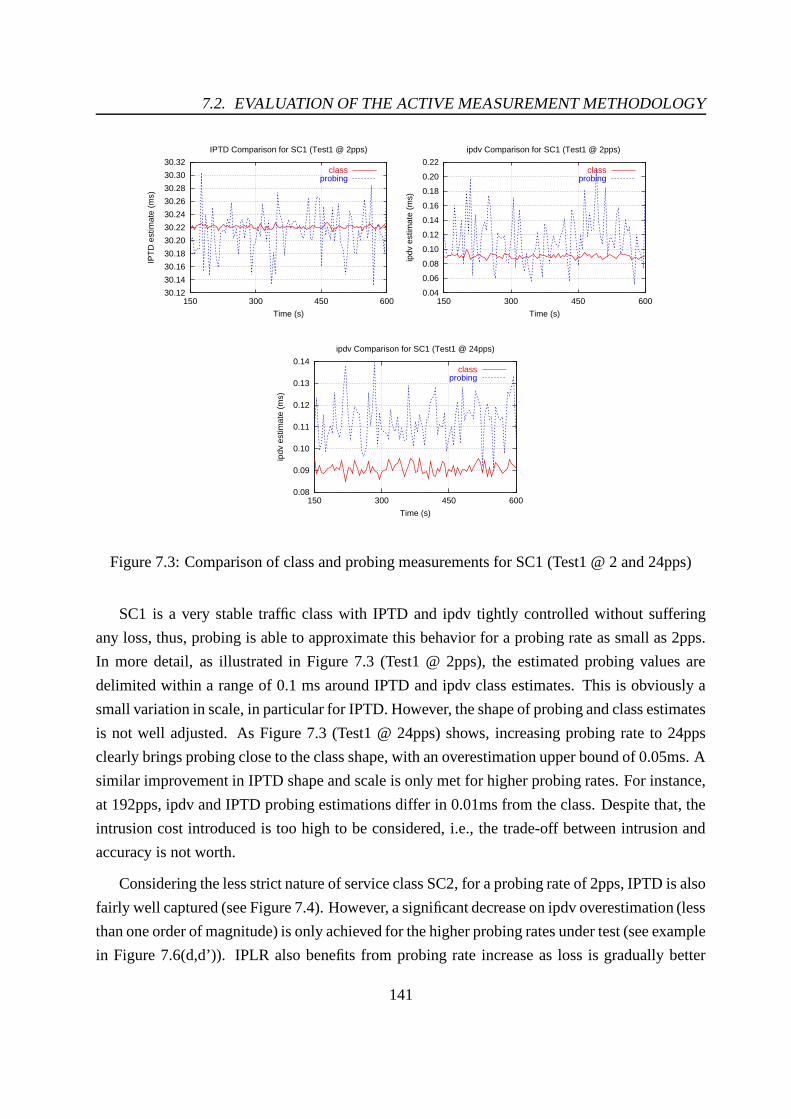
7.2. EVALUATION OF THE ACTIVE MEASUREMENT METHODOLOGY
30.12
30.14
30.16
30.18
30.20
30.22
30.24
30.26
30.28
30.30
30.32
150 300 450 600
IPT
D e
stim
ate
(ms)
Time (s)
IPTD Comparison for SC1 (Test1 @ 2pps)
classprobing
0.04
0.06
0.08
0.10
0.12
0.14
0.16
0.18
0.20
0.22
150 300 450 600
ipdv
est
imat
e (m
s)
Time (s)
ipdv Comparison for SC1 (Test1 @ 2pps)
classprobing
0.08
0.09
0.10
0.11
0.12
0.13
0.14
150 300 450 600
ipdv
est
imat
e (m
s)
Time (s)
ipdv Comparison for SC1 (Test1 @ 24pps)
classprobing
Figure 7.3: Comparison of class and probing measurements for SC1 (Test1 @ 2 and 24pps)
SC1 is a very stable traffic class with IPTD and ipdv tightly controlled without suffering
any loss, thus, probing is able to approximate this behavior for a probing rate as small as 2pps.
In more detail, as illustrated in Figure 7.3 (Test1 @ 2pps), the estimated probing values are
delimited within a range of 0.1 ms around IPTD and ipdv class estimates. This is obviously a
small variation in scale, in particular for IPTD. However, the shape of probing and class estimates
is not well adjusted. As Figure 7.3 (Test1 @ 24pps) shows, increasing probing rate to 24pps
clearly brings probing close to the class shape, with an overestimation upper bound of 0.05ms. A
similar improvement in IPTD shape and scale is only met for higher probing rates. For instance,
at 192pps, ipdv and IPTD probing estimations differ in 0.01ms from the class. Despite that, the
intrusion cost introduced is too high to be considered, i.e., the trade-off between intrusion and
accuracy is not worth.
Considering the less strict nature of service class SC2, for a probing rate of 2pps, IPTD is also
fairly well captured (see Figure 7.4). However, a significant decrease on ipdv overestimation (less
than one order of magnitude) is only achieved for the higher probing rates under test (see example
in Figure 7.6(d,d’)). IPLR also benefits from probing rate increase as loss is gradually better
141

CHAPTER 7. TEST SCENARIOS AND RESULTS
30.0
35.0
40.0
45.0
50.0
55.0
150 300 450 600
IPT
D e
stim
ate
(ms)
Time (s)
IPTD Comparison for SC2 (Test1 @ 2pps)
classprobing
Figure 7.4: Comparison of class and probing measurements for SC2 (Test1 @ 2pps)
detected, although a deficit on IPLR scale estimation of approximately one order of magnitude
is still present.
For the lower probing rates, the behavior of SC3 is clearly the worst captured as regards the
three metrics under control. While IPTD and ipdv benefit from a probing rate increase, IPLR
events are completely missed even at 192pps.
In summary, Test1 allows to conclude that increasing probing rate, per se, is not enough to
overcome QoS metric estimation mismatches. Despite the tendency to improve IPTD and ipdv
accuracy, the overhead introduced and the failure of IPLR estimation suggest exploring other
probing characteristics as either alternative or complementary approaches.
Test2 and Test3 - Exploring probe coloring
Probe coloring is proposed and studied here as a method of improving IPLR estimation. For the
conditions stated in Test2, when changing the drop precedence of probing packets from low to
high, i.e., coloring probes from green to red, a significant improvement in IPLR sensitivity was
noticed even for a probing rate of 2pps. This improvement is reflected in a better detection of
class loss events, however, IPLR scale is clearly overestimated and IPTD slightly underestimated
(see Figure 7.5). This behavior is justified by the AQM action on probes’ precedence. In fact,
when queue congestion increases, red probes are the first to be dropped and the previously high-
delayed green probes are now mostly discarded. As a consequence, on average, IPTD estimation
is slightly degraded, while loss detection is improved. The scale magnifying error in IPLR esti-
mation is justified by the huge difference between the total number of probes and class packets
in�����
. Increasing the rate of red probes revealed fruitful for SC3 IPLR scale accuracy, but for
142

7.2. EVALUATION OF THE ACTIVE MEASUREMENT METHODOLOGY
30.0
32.0
34.0
36.0
38.0
40.0
42.0
44.0
150 300 450 600
IPT
D e
stim
ate
(ms)
Time (s)
IPTD Comparison for SC2 (Test2 @ 2pps)
classprobing
0.0
0.10
0.20
0.30
0.40
0.50
0.60
0.70
150 300 450 600
IPLR
est
imat
e
Time (s)
IPLR Comparison for SC2 (Test2 @ 2pps)
classprobing
0.0
0.10
0.20
0.30
0.40
0.50
0.60
150 300 450 600
IPLR
est
imat
e
Time (s)
IPLR Comparison for SC3 (Test2 @ 2pps)
classprobing
Figure 7.5: Comparison of class and probing measurements for SC2 and SC3 (Test2 @ 2pps)
SC2 the previous scale problems remain evident without noticeable improvement. This is due to
the different nature of loss in SC2 (more sparse) and SC3 (more regular), and the volume of red
packets in those classes. The side effects on IPTD estimation are not completely removed either,
when higher rates of red probes are used.
In order to improve the compromise between IPLR and IPTD estimation and to adjust IPLR
scale, probing patterns with an interleaved coloring scheme are tested, i.e., green and red pack-
ets are sent alternately according to a pre-defined distribution (see Test3 details). Comparing to
Test1 outcome, a interleaved probing pattern of 2pps brings significant improvement on IPLR
estimation for all traffic classes. Moreover, the degradation of IPTD estimation and IPLR over-
estimation noticed in Test2 is now much less pronounced. These positive results are further
enhanced for higher probing rates where the accuracy of all metrics is increased, as exemplified
in Figure 7.6 (a,a’) and (b,b’) for a probing rate of 24pps. Despite that, for SC2, IPLR still
remains overestimated (see Figure 7.6(c,c’)). As in Test1, ipdv estimates converge for probing
rates above 96pps (see example in Figure 7.6(d,d’) for 192pps). Generically, SC3 is the class
that strongly benefits from interleaved probing, reaching a good compromise in the metrics’
143

CHAPTER 7. TEST SCENARIOS AND RESULTS
30.0
34.0
38.0
42.0
46.0
30.0 34.0 38.0 42.0 46.0
Pro
be e
stim
ate
(ms)
Class estimate (ms)
(a) IPTD Dispersion for SC3 (Test1 @ 24pps)
0.0
10.0
20.0
30.0
40.0
0.0 10.0 20.0 30.0 40.0
Pro
be e
stim
ate
(%)
Class estimate (%)
(b) IPLR Dispersion for SC3 (Test2 @ 24pps)
30.0
34.0
38.0
42.0
46.0
30.0 34.0 38.0 42.0 46.0
Pro
be e
stim
ate
(ms)
Class estimate (ms)
(a’) IPTD Dispersion for SC3 (Test3 @ 24pps)
0.0
10.0
20.0
30.0
40.0
0.0 10.0 20.0 30.0 40.0
Pro
be e
stim
ate
(%)
Class estimate (%)
(b’) IPLR Dispersion for SC3 (Test3 @ 24pps)
0.0
10.0
20.0
30.0
40.0
0.0 10.0 20.0 30.0 40.0
Pro
be e
stim
ate
(%)
Class estimate (%)
(c) IPLR Dispersion for SC2 (Test1 @ 192pps)
0.0
1.5
3.0
4.5
6.0
0.0 0.1 0.3 0.4 0.6
Pro
be e
stim
ate
(ms)
Class estimate (ms)
(d) ipdv Dispersion for SC2 (Test3 @ 24pps)
0.0
10.0
20.0
30.0
40.0
0.0 10.0 20.0 30.0 40.0
Pro
be e
stim
ate
(%)
Class estimate (%)
(c’) IPLR Dispersion for SC2 (Test3 @ 192pps)
0.0
1.5
3.0
4.5
6.0
0.0 0.1 0.3 0.4 0.6
Pro
be e
stim
ate
(ms)
Class estimate (ms)
(d’) ipdv Dispersion for SC2 (Test3 @ 192pps)
Figure 7.6: Dispersion of (a,a’) IPTD for SC3 - green and interleaved @ 24pps; (b,b’) IPLR forSC3 - red and interleaved @ 24pps; (c,c’) IPLR for SC2 - green and interleaved @ 192pps; (d,d’)ipdv for SC2 - interleaved @ 24 and 192pps 144

7.2. EVALUATION OF THE ACTIVE MEASUREMENT METHODOLOGY
estimation for a probing rate of 24pps.
Test2 and Test3 allow to conclude that coloring probes can be particularly useful to provide
both an indication of network congestion (through loss detection) and feedback to traffic control
mechanisms, for very low probing rates. For SLS auditing and traffic control mechanisms re-
quiring accurate quantitative inputs, higher colored probing rates are needed. SC2 IPLR scale is
however difficult to meet, not benefiting significantly from that rate increase.
Test4 - TCP probing
As SC3 is oriented to TCP traffic, Test3 has been extended so that an FTP probing source is now
considered in this class (Test4), approximating the probing to the class traffic characteristics. The
results show that the color of this type of probing stream is even more relevant than of UDP prob-
ing (Test1,Test2,Test3). The color is relevant both for the estimate accuracy and for the probing
overhead. Once again, green FTP probes are not able to detect loss in SC3 and the probing rate
may reach a worrying 2Mbps rate, i.e., 15% of the class bandwidth share. This may occur when
the probing source does not experience any loss and keeps taking over bandwidth of other TCP
flows that either adapt or terminate. Red FTP probes are far less bandwidth demanding (30kbps)
with the cost of emphasizing the problems identified in Test2. As for Test3, an interleaved color
FTP probing pattern leads to a better compromise between overhead (0.4%) and accuracy.
Test5 - Improving ipdv estimation
Generically, it was found that ipdv is a rather sensitive metric to network load and its variability.
The results illustrated in Test1 and Test3 show that ipdv scale for the classes SC2 and SC3 is
difficult to obtain regardless of the test probing rate considered. While small ipdv variations are
magnified by probing, ipdv mismatch under the different probing rates suggests that queuing
delay oscillations persist across multiple time scales. For moderate loads, ipdv is more closely
measured as the queues remain in a reasonable steady state [17].
As decreasing the interpacket gaps through a probing rate increase did not successfully solve
ipdv scale estimation, a new probing pattern was considered which on average tries to keep
regular and light the mean probing rate while reducing interpacket gaps. The new probing pattern
Ø À Ø ç (see Section 4.3.1) acts as a back-to-back on-off source, where the number of packets
inside the on period and the on/off sojourn times are configurable. The rate and duration of the
145

CHAPTER 7. TEST SCENARIOS AND RESULTS
on period determines the amount and how close the probes are in the sample event; the off period
can be either deterministic or random. The use of a non-deterministic off period avoids possible
network synchronization effects [22].
Test5 considers interleaved Ø À Ø ç probing sources generating 8 and 24pps, respectively, with
on and off periods of 125ms, i.e., corresponding to four back-to-back bursts. It was noticed that,
when compared to #"%Ù� ç with similar rates, interleaved Ø À Ø ç probing streams lead to better es-
timates of ipdv scale, also with better results on IPTD and IPLR. This improvement is notorious
in the experiment with probing at 24pps as shown in Figure 7.7(a), where the correlation coeffi-
cient between class and probing outcome is evaluated for all QoS metrics and all test scenarios
previously considered.
Further tests exploring Ø À Ø ç functionality to improve multipurpose estimation are left for
future study.
0
0.2
0.4
0.6
0.8
1
POI-green POI-red POI-inter B2B-inter
Cor
rela
tion
Coe
ffici
ent
Type of Probing Stream (24pps)
Class vs. Probing Correlation for SC2
IPLRIPTD|ipdv|ipdv
(a)
0
5
10
15
20
25
30
0 0.2 0.4 0.6 0.8 1
Occ
uren
cies
(%
)
IPLR estimation error
Probing Error for SC3
512 bytes100 bytes
(b)
Figure 7.7: (a) Correlation between class and probing estimates for different probing streams;(b) IPLR error estimation
Test6 - Exploring probing packet size
Intuitively, small size probing packets do not necessarily experience loss when large packets do.
In fact, near queue overflow, a small packet is more likely to be enqueued than a larger one. So,
apparently, probing packet size should be similar to the mean packet size of the class it intends
to measure.
146

7.2. EVALUATION OF THE ACTIVE MEASUREMENT METHODOLOGY
The present test scenario aims at exploring if the size of probing packets influences IPLR
estimation. For the test conditions in [17], Figure 7.7(b) shows the absolute IPLR estimation
error ( ä 7 ç ��å � � � ÿ ��#Ù4 1 ��©UÇ�}� ÂÖ��#Ù4 1 ©��Jã � Æ�Ç+ão© U� ÿ) obtained for SC3 when an equivalent number of
red probing packets of 100 and 512 bytes (the same as in the class) is considered. As the results
show, the histograms for both packet sizes are mostly overlapped suggesting minor differences in
the observed error. Although there is not evident impact of probing packet size on IPLR results,
a mixed combination of probing packet sizes is sometimes used [174].
Additional considerations
Depending on the overall purpose of QoS metrics and traffic control mechanisms which may
react based on them, increasing the time interval���
in which measurements are carried out may
overcome excessive sensitivity to fluctuations and mis-scaling of metrics’ behavior. A wider�b�
is likely to allow more stable measurements facing traffic variability and more probing packets
are taken into account in a single measure. However, according to [199], to reach accurate
measurements the number of probes considered is more relevant than extending the measurement
interval and when the number of probes is increased accuracy is achieved earlier. Exploring the
impact of���
on multipurpose measures’ accuracy was left for further study. Nevertheless, as
regards the edge-to-edge monitoring-based AC mechanism in use, obtaining measurement inputs
each 5s revealed to be a good compromise for having an updated vision of network dynamics in
order to guide AC decisions efficiently.
In the context of active measurement, although the use of Poisson probing in real environ-
ments is recommended [22] (see also Section 4.3.1), it may constrain the�b�
in use. In fact, for
small���
values and low probing rates (e.g.,�b� � ��/
; 2 pps), there might be intervals where no
probe packets are generated due to the unbounded nature of exponential interarrivals [22]. The
use of a probing on-off source (such as Ø À Ø ç ) with a deterministic on period and a bounded
random off period will allow to take advantage of pre-defined probing bursts while preventing
possible synchronization effects.
Finally, a remark is made regarding distinct test scenarios oriented exclusively to UDP traffic.
The evaluation of the active measurement methodology considering three classes of UDP traffic,
i.e., SC3 carrying out UDP traffic instead of TCP, and SC1 used as concurrent class instead
of SC2 is presented in [17]. The tests results, although not covering a wide range of probing
rates and schemes, show similar trends as regards the considered IPTD, ipdv and IPLR metrics
147
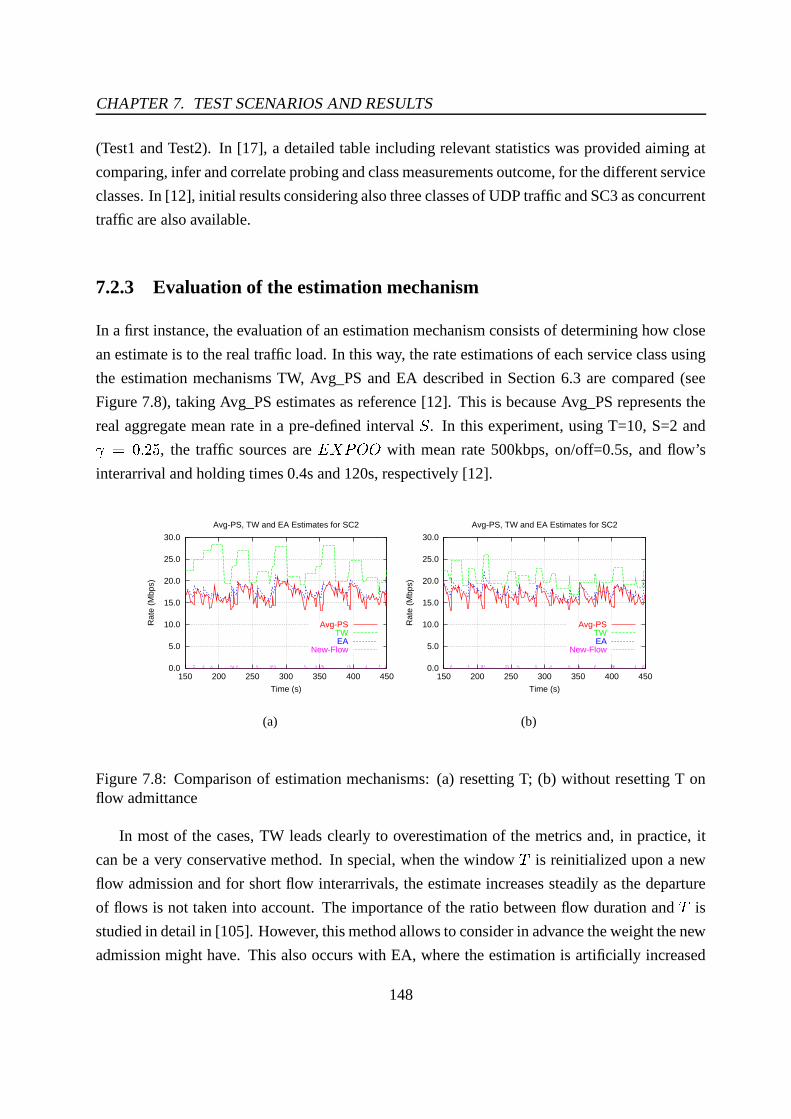
CHAPTER 7. TEST SCENARIOS AND RESULTS
(Test1 and Test2). In [17], a detailed table including relevant statistics was provided aiming at
comparing, infer and correlate probing and class measurements outcome, for the different service
classes. In [12], initial results considering also three classes of UDP traffic and SC3 as concurrent
traffic are also available.
7.2.3 Evaluation of the estimation mechanism
In a first instance, the evaluation of an estimation mechanism consists of determining how close
an estimate is to the real traffic load. In this way, the rate estimations of each service class using
the estimation mechanisms TW, Avg_PS and EA described in Section 6.3 are compared (see
Figure 7.8), taking Avg_PS estimates as reference [12]. This is because Avg_PS represents the
real aggregate mean rate in a pre-defined interval 3 . In this experiment, using T=10, S=2 and
å � ��� À �, the traffic sources are "!ë#Ù%Ù% with mean rate 500kbps, on/off=0.5s, and flow’s
interarrival and holding times 0.4s and 120s, respectively [12].
0.0
5.0
10.0
15.0
20.0
25.0
30.0
150 200 250 300 350 400 450
Rat
e (M
bps)
Time (s)
Avg-PS, TW and EA Estimates for SC2
Avg-PSTWEA
New-Flow
(a)
0.0
5.0
10.0
15.0
20.0
25.0
30.0
150 200 250 300 350 400 450
Rat
e (M
bps)
Time (s)
Avg-PS, TW and EA Estimates for SC2
Avg-PSTWEA
New-Flow
(b)
Figure 7.8: Comparison of estimation mechanisms: (a) resetting T; (b) without resetting T onflow admittance
In most of the cases, TW leads clearly to overestimation of the metrics and, in practice, it
can be a very conservative method. In special, when the window Å is reinitialized upon a new
flow admission and for short flow interarrivals, the estimate increases steadily as the departure
of flows is not taken into account. The importance of the ratio between flow duration and Å is
studied in detail in [105]. However, this method allows to consider in advance the weight the new
admission might have. This also occurs with EA, where the estimation is artificially increased
148

7.3. EVALUATION OF THE AC CRITERIA
when a new flow is admitted. This estimation method is controlled by the parameter å . As shown
in Figure 7.8, using å �-��� À �a close match is achieved.
As far as AC is concerned, there are other aspects to consider: (i) the estimate is due to be
used during a measurement time interval; (ii) the estimate needs to reflect, and somehow foresee,
the network behavior trends. Initial tests on AC criteria presented in [12] show that Avg_PS
allows to achieve high network utilization without service violations, for CBR traffic. However,
for EXP and PAR traffic, all services have suffered degradation. EXP/PAR traffic fluctuations
and a particularly low estimate lead to overacceptance. When this happens, in the following
estimation period, the AC rate and QoS control rules will refrain new flows from entering the
network, however, degradation may still occur during the lifetime of existing flows. This effect
can be reduced when using TW and EA as the flow rate is accounted for in advance. In fact, an
immediate increase of the estimate, reflecting the impact that the new flow rate will have, allows a
more adaptive and conservative AC. This has motivated the implementation of an hybrid Avg_PS
(Avg_PS_Alt) mechanism that adjusts, in each �ÞÎ , the rate estimate according to the flow rate of
new accepted flows (in the same �²Î ). This mechanism will be used throughout the following
experiments.
7.3 Evaluation of the AC criteria
This section intends to provide a proof-of-concept of the proposed AC model regarding its abil-
ity to self-adapt and control QoS and SLS parameters in multiclass IP networks, assessing its
effectiveness in satisfying service commitments while achieving high network utilization. In this
evaluation, a single multiservice domain ruled by AC Eqs. (5.7) and (5.10) is considered. Fo-
cusing initially on the intradomain operation circumscribes the subject under study, allowing a
clearer identification and understanding of the most influent variables, and an in-depth perfor-
mance analysis of the AC criteria in controlling the QoS levels in the domain and the utilization
of existing SLSs. A multidomain performance analysis, including the end-to-end AC rule (5.12),
is left for future study.
Generically, the performance analysis of the AC criteria will consist of assessing each class
QoS behavior, reflected by the values obtained for the controlled QoS parameters, and of evalu-
ating and verifying each class and SLS rate shares. This involves:
(i) verifying if QoS parameters are in conformance with the established QoS levels;
149

CHAPTER 7. TEST SCENARIOS AND RESULTS
(ii) quantifying QoS violations, at class and packet level;
(iii) evaluating each class blocking probabilities;
(iv) measuring the utilization level of each class individually and of the network domain globally,
verifying the conformance of each SLS rate share (1 ��� �� ).
This evaluation process, involving a simultaneous and progressive tuning of the variables influ-
encing the model behavior, takes into consideration the distinct test conditions described in the
following section.
7.3.1 Test scenarios taxonomy
Table 7.3 summarizes the planned test scenarios exploring different aspects which may influence
the performance of the AC model. Similarly to the evaluation of the active monitoring process,
for each test scenario, aspects of the model such as the type of concurrent or cross traffic (referred
as CT-I2), the type of traffic sources considered in each class and other relevant information
evaluated in each test, are included in Table 7.3.
Table 7.3: Test scenarios taxonomy - AC evaluation
Test Tested AC model configuration OtherScen. Variable * � ���²k Source models (SC1,SC2,SC3) InformationTest1 Generic operation All �5Di��Ú?Ú ��� QDæ ��� V Sp� � �¥��� @ QoS/Share/UtilizationTest2 Implicit AC All �5Di��Ú?Ú ��� QDæ ��� V SU� � �ª � ±T�h©�±BGc��� @ � * _ ¯NG9¥²G¨£�·�µç �Test3 Cross traffic All �5DÝ��Ú?Ú ��� QDæ ��� V Sp� � �¥��� @ Relevance QoS RuleTest4 � ge � ' ( /
� e � ¨ ¯+*5k �5Di��Ú?Ú ��� QDæ ��� V Sp� � �¥��� @ Load/MetricsTest5 Traffic charact. ¯+*�;TªX¯+*5k * : <{ª]�5�;< ��� Qcæ ��� V Sp� � �è��� @ Rate/Fint/Fhold/FairnessTest6 § G e ¯+*5k �5Di��Ú?Ú ��� QDæ ��� V Sp� � �¥��� @ Load/Fint/Fhold/ é e � ')(
In more detail, Test1 and Test2 are devoted to an initial assessment and tuning of the explicit
and implicit AC criteria. In these tests, the concurrent traffic of each service class, injected into
ingress � ' , contends with ��� traffic, and the aggregate is considered for load estimation at egress
ä� . QoS parameter estimation at �� follows an ¹J�oÎ�ò¦ ä�=½ perspective. Test3 considers that the
traffic injected into ingress � ' is cross traffic, i.e., it will use the domain resources and share
the bottleneck link without being considered in the estimation of SLS utilization performed at
egress ´� . Hence, ´� is not aware of cross-traffic apart from the impact it may have on QoS
150
7.3. EVALUATION OF THE AC CRITERIA
estimation. This aspect is of major relevance as, due to the internal traffic dynamics and topol-
ogy characteristics, a given amount of traffic may constitute an additional load just in parts of an
edge-to-edge path. Therefore, Test3 will allow to test the impact of cross traffic on the AC model
performance and reevaluate the initial model parameterization. Tuning safety margins and ex-
ploring new thresholds, identifying the most relevant QoS parameters under control, are aspects
explored in Test4. Test5 is devoted to study the effects that traffic characteristics, resulting from
different source models, flow interarrival and holding times, have in the AC criteria performance.
The influence of the measurement time interval���=�
is studied in Test6. For each test scenario,
the column % � p Ü Xä� Ý Z Ï X�à�Û � É Ï�Ý highlights several aspects that are subject of discussion in the
corresponding section.
The service-dependent AC rules are parameterized as specified in Table 7.1. By default, the
values of ����� � and Å �2� é in Table 7.1 are applied, with exception of Test4 where several values
of those variables are tested. SC1, SC2 and SC3 traffic is generated resorting to the source
models specified and parameterized according to Table 6.5. Although Table 6.5 includes flow
interarrival times ranging from 300ms to 2s, most of the presented results correspond to tests
performed either under high demanding conditions, with a flow interarrival of 300ms for SC1 and
500ms for SC2 and SC3 (referred as Fint1), or moderate conditions where the previous values are
doubled (referred as Fint2)7. The measurement time interval���+�
is set to��/
, with exception of
Test6 where�b�¶� �¿�vê Á �¥ê5,���/ are used. Once again, the QoS and utilization measures report to
mean values in�����
. For explicit AC, the Avg_PS_Alt mechanism is used to estimate the average
rate within a measurement time interval ( 3 � ���+�), considering rate adjustments carried out at
each �oÎ .As a final remark, for each ¹J�²Î�ò¦ qÆW½ pair, a single probing source is embedded in each service
class for active measurement purposes. However, while the active monitoring process is being
tuned, the estimation of relevant parameters for the AC criteria is based on passive measurements.
This avoids misleading the AC model evaluation with eventual inaccurate estimates.
The following sections will concentrate on the results obtained for each of these test sce-
narios. Despite the sequence of the test scenarios presented in Table 7.3, situations such as the
initial study of the AC criteria operation and performance involved the simultaneous evaluation
of distinct variables.
7Note that, as shown in Test1 (see Section 7.3.2), the values of Fint1 and Fint2 induce a network load that allowstriggering the AC criteria. Apart from Test1 and Test2 where both situations are deeply evaluated, unless otherwisestated, the remaining tests use Fint2. Similarly, unless otherwise is stated, SC3 consists of traffic from FTP sources.
151
CHAPTER 7. TEST SCENARIOS AND RESULTS
7.3.2 Test1 - Generic model operation
In this test scenario, the generic model operation is assessed in terms of its capability of assuring
each service class QoS commitments and, simultaneously, verifying the utilization levels ob-
tained per class and globally. Considering the network topology illustrated in Figure 6.2, traffic
flows belonging to service classes SC1, SC2 and SC3 are generated dynamically, undergoing AC
at domain entrance8. Whereas SC1, SC2 and SC3 flows arrive and leave the domain through ���and ´� , respectively, concurrent flows (CT-I2) arrive and leave through � ' and ä� , respectively.
The potential overacceptance problem deriving from concurrency and traffic fluctuations is, at
this point, reduced through the definition of safety margins.
Generically, for the defined test conditions, the results of Test1 show that the self-adaptive
behavior inherent to on-line monitoring combined with the established AC rules is effective in
controlling each class QoS and SLS commitments. More specifically, when concurrent traffic
(CT-I2) is either SC1 or SC2, as illustrated in Figure 7.99, the obtained IPTD, ipdv and IPLR of
the service classes SC1, SC2 and SC3, exhibit a very stable behavior regarding the pre-defined
QoS levels, in special, for delay related parameters. Although IPLR is more difficult to keep
tightly controlled, its deviations stay well-bounded. Note that, these results are particularly en-
couraging attending to the high overall network utilization obtained (see Figure 7.10), consid-
ering the bottleneck of 34Mbps. This figure also illustrates that the share configured for each
class is well accomplished, with SC2 and CT-I2 obtaining a similar behavior and share and with
SC3 exceeding its share slightly. This occurs due to the adaptive nature of traffic within SC3,
the more relaxed implicit AC criterion (discussed in Test2, Section 7.3.3) and the work conserv-
ing nature of the scheduling algorithm in use, which allows SC3 to take advantage of unused
resources. When the concurrent traffic belongs to SC3, the total utilization reaches its maximum
level ( ë � �.��� ) with a noticeable increase of IPTD in SC3, which may reach 80ms. Despite that,
SC3 IPLR is kept within the same range of variation exhibited in Figure 7.9 and the remaining
classes maintain a similar behavior as before.
8A set of initial tests performed without including the AC proposal, i.e., where all generated flows are accepted,have resulted in a obvious degradation of the QoS behavior of all service classes and a full utilization of the availablebandwidth. Considering concurrent traffic from SC2, �5Di��Ú?Ú source models and Fint1, the IPTD and IPLRbehavior for all service classes are as follows: (i) SC1, having its maximum rate controlled by the PQ scheduler,exhibits the worst behavior ( ��� � ¢ =82ms, ��� � ¢ ^ ° � =346ms,
� TG9¥Þ�����5¬E< =0.68); (ii) SC2 traffic obtains valuesaround ��� � ¢ =52ms, ��� � ¢ ^ ° � =93ms,
� TG9¥Þ�k���5¬E< =0.69; (iii) SC3 traffic due to its adaptive nature achievesthe best results ( ��� � ¢ =46ms, ��� � ¢ ^ ° � =99ms,
� TG9¥Þ�7���5¬E< =0.20). Generically, without AC, the obtained QoSvalues are far away from the defined service thresholds. When the PQ EF rate is enlarged (for SC1), the QoSdegradation of the remaining service classes, and particularly of SC2, is even worst.
9All figures included in Test1 report to experiments carried out with CT-I2=SC2 and Fint1.
152
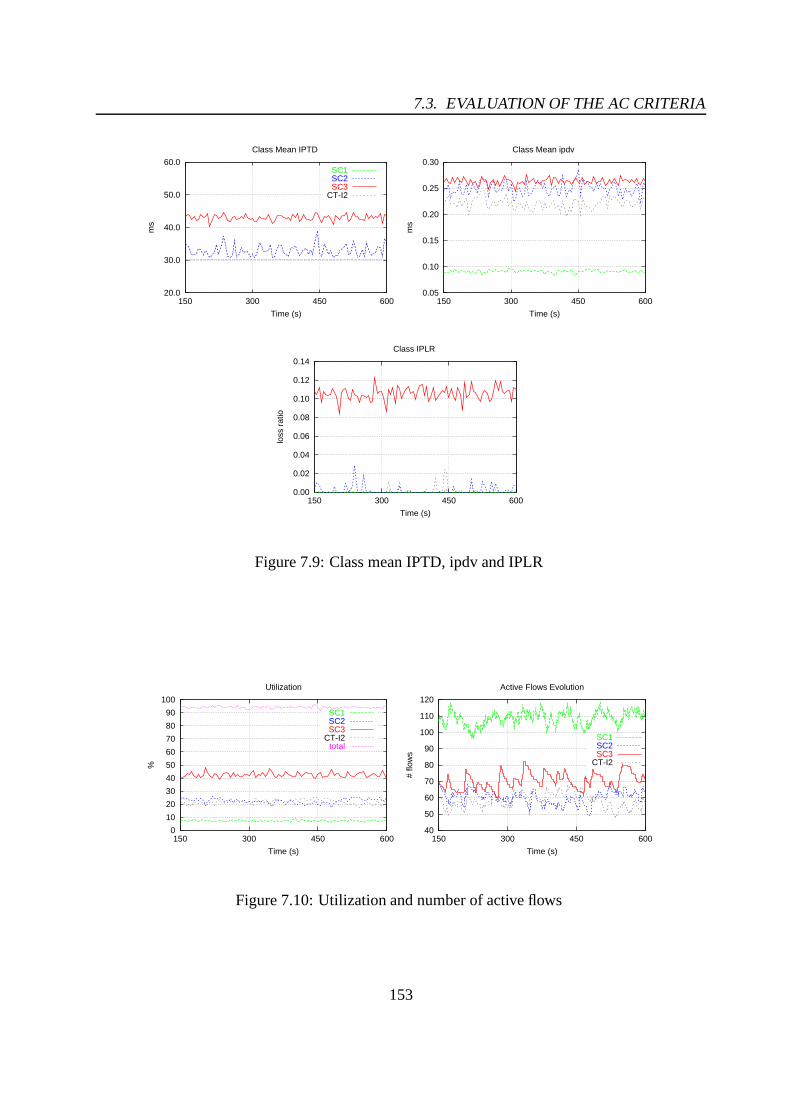
7.3. EVALUATION OF THE AC CRITERIA
20.0
30.0
40.0
50.0
60.0
150 300 450 600
ms
Time (s)
Class Mean IPTD
SC1SC2SC3
CT-I2
0.05
0.10
0.15
0.20
0.25
0.30
150 300 450 600
ms
Time (s)
Class Mean ipdv
0.00
0.02
0.04
0.06
0.08
0.10
0.12
0.14
150 300 450 600
loss
rat
io
Time (s)
Class IPLR
Figure 7.9: Class mean IPTD, ipdv and IPLR
0
10
20
30
40
50
60
70
80
90
100
150 300 450 600
%
Time (s)
Utilization
SC1SC2SC3
CT-I2total
40
50
60
70
80
90
100
110
120
150 300 450 600
# flo
ws
Time (s)
Active Flows Evolution
SC1SC2SC3
CT-I2
Figure 7.10: Utilization and number of active flows
153

CHAPTER 7. TEST SCENARIOS AND RESULTS
26.0
28.0
30.0
32.0
34.0
36.0
150 300 450 600
ms
Time (s)
IPTD Behavior for SC1 (per time interval)
MeanMaxMin
Thres
(a)
-0.6
-0.4
-0.2
0.0
0.2
0.4
0.6
0.8
1.0
150 300 450 600
ms
Time (s)
ipdv Behavior for SC1 (per time interval)
MeanMaxMin
ThresMean-sign
(b)
10.0
20.0
30.0
40.0
50.0
60.0
70.0
80.0
150 300 450 600
ms
Time (s)
IPTD Behavior for SC2 (per time interval)
MeanMaxMin
Thres
(c)
10.0
20.0
30.0
40.0
50.0
60.0
70.0
80.0
150 300 450 600
ms
Time (s)
IPTD Behavior for SC2 (packet analysis)
(d)
0.1
1
10
100
30 35 40 45 50 55 60 65 70 75 80
% O
ccur
renc
ies
(log1
0)
IPTD (ms)
IPTD histogram for SC2 (packet analysis)
(e)
0.000
0.001
0.010
0.100
1.000
150 300 450 600
loss
rat
io (
log1
0)
Time (s)
IPLR Behavior (packet analysis)
SC1SC2SC3
CT-I2
(f)
Figure 7.11: Results in�����
: (a) (b) IPTD and ipdv for SC1; (c) IPTD for SC2. Results at packetlevel: (d) IPTD for SC2 ; (e) IPTD histogram for SC2; (f) IPLR evolution for all classes
154
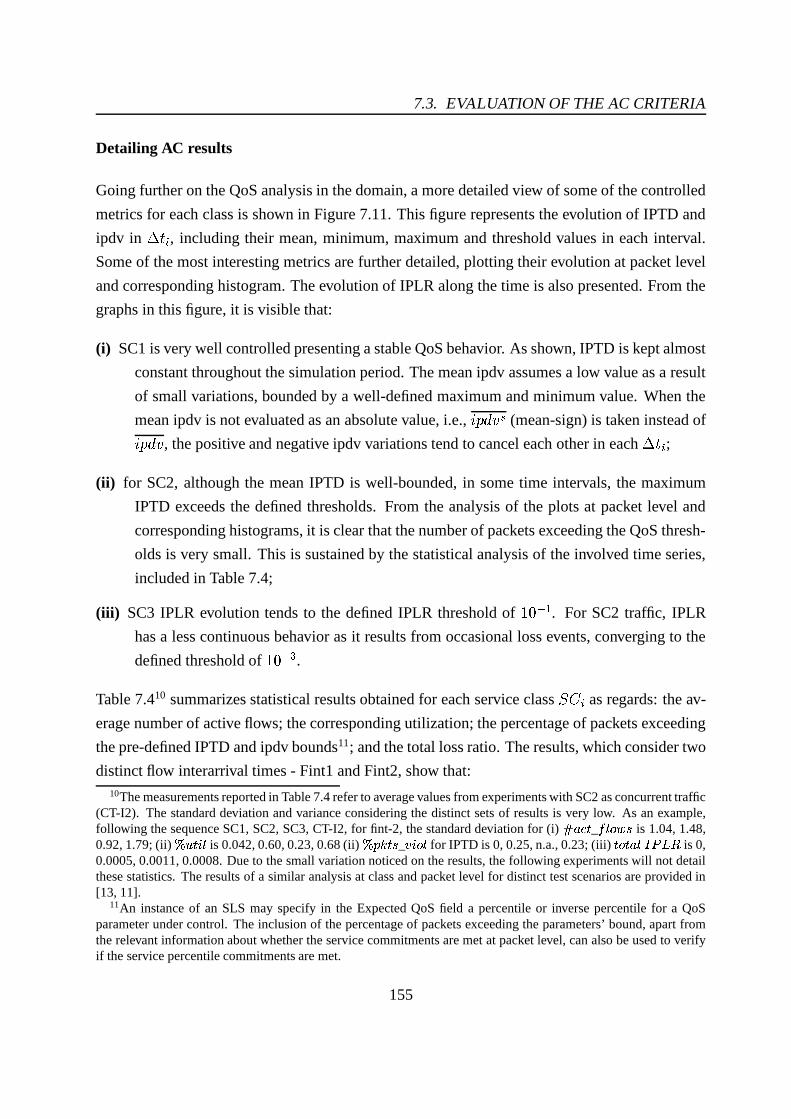
7.3. EVALUATION OF THE AC CRITERIA
Detailing AC results
Going further on the QoS analysis in the domain, a more detailed view of some of the controlled
metrics for each class is shown in Figure 7.11. This figure represents the evolution of IPTD and
ipdv in���¶�
, including their mean, minimum, maximum and threshold values in each interval.
Some of the most interesting metrics are further detailed, plotting their evolution at packet level
and corresponding histogram. The evolution of IPLR along the time is also presented. From the
graphs in this figure, it is visible that:
(i) SC1 is very well controlled presenting a stable QoS behavior. As shown, IPTD is kept almost
constant throughout the simulation period. The mean ipdv assumes a low value as a result
of small variations, bounded by a well-defined maximum and minimum value. When the
mean ipdv is not evaluated as an absolute value, i.e., É2ÊÌË�Í � (mean-sign) is taken instead of
ÉHÊË�Í , the positive and negative ipdv variations tend to cancel each other in each���T�
;
(ii) for SC2, although the mean IPTD is well-bounded, in some time intervals, the maximum
IPTD exceeds the defined thresholds. From the analysis of the plots at packet level and
corresponding histograms, it is clear that the number of packets exceeding the QoS thresh-
olds is very small. This is sustained by the statistical analysis of the involved time series,
included in Table 7.4;
(iii) SC3 IPLR evolution tends to the defined IPLR threshold of � � ÒÌ� . For SC2 traffic, IPLR
has a less continuous behavior as it results from occasional loss events, converging to the
defined threshold of � � Ò[ì .Table 7.410 summarizes statistical results obtained for each service class 35Ú � as regards: the av-
erage number of active flows; the corresponding utilization; the percentage of packets exceeding
the pre-defined IPTD and ipdv bounds11; and the total loss ratio. The results, which consider two
distinct flow interarrival times - Fint1 and Fint2, show that:10The measurements reported in Table 7.4 refer to average values from experiments with SC2 as concurrent traffic
(CT-I2). The standard deviation and variance considering the distinct sets of results is very low. As an example,following the sequence SC1, SC2, SC3, CT-I2, for fint-2, the standard deviation for (i) í ¥²��G _ 6��H T¡�· is 1.04, 1.48,0.92, 1.79; (ii) î6£�G¨§¨� is 0.042, 0.60, 0.23, 0.68 (ii) î�..iÞGJ· _ �²§¨ ¦� for IPTD is 0, 0.25, n.a., 0.23; (iii) G9 TG9¥Þ�����5¬E< is 0,0.0005, 0.0011, 0.0008. Due to the small variation noticed on the results, the following experiments will not detailthese statistics. The results of a similar analysis at class and packet level for distinct test scenarios are provided in[13, 11].
11An instance of an SLS may specify in the Expected QoS field a percentile or inverse percentile for a QoSparameter under control. The inclusion of the percentage of packets exceeding the parameters’ bound, apart fromthe relevant information about whether the service commitments are met at packet level, can also be used to verifyif the service percentile commitments are met.
155

CHAPTER 7. TEST SCENARIOS AND RESULTS
Table 7.4: Test results and statistics at packet level
Service #act_flows (avg) %util. (avg) %pkts_viol:(IPTD;ipdv) Total IPLRClass Fint2 Fint1 Fint2 Fint1 Fint2 Fint1 Fint2 Fint1SC1 105.7 107.5 7.2 7.4 (0.0;0.0) (0.007;0.0005) 0.0 0.00009SC2 57.0 59.5 21.6 22.9 (1.62; n.a.) (2.95; n.a.) 0.0011 0.0027SC3 65.9 70.2 43.4 42.9 (n.a.; n.a.) (n.a.; n.a.) 0.102 0.106
CT-I2 59.6 58.6 22.6 22.3 (1.55; n.a.) (2.82; n.a.) 0.0018 0.0022
: in both cases, the global utilization is kept high, and each class rate share is well accom-
plished. Note that, considering the safety margins and the SLSs rate share defined in Ta-
ble 7.1, the utilization target for SC1, SC2 and SC3 is 8.5%, 45% (SC2+CT-I2) and 40%,
respectively. As explained later, the rate control is disabled for SC3. For SC1, considering
the obtained results with CT-I2 from SC1 type, the achieved share is slightly increased to
ë 8%;
: the percentage of QoS violations at packet level is very small, in special for SC112, and
the total IPLR is within the pre-defined thresholds. Note that, a QoS threshold violation
does not necessarily imply a service QoS violation, as the defined concept of threshold
comprises a safety margin to the QoS parameter target value (see Eq. 5.11).
AC rules effectiveness
When examining in detail which AC rules determine the generic behavior of the model discussed
above, the following is identified:
(i) SC1 flows are controlled essentially by the SLS rate control rule (Eq. 5.7) as a result of a
stable QoS behavior associated with this high priority class;
(ii) AC for SC2 flows is triggered by SLS and/or QoS control rules (Eq. 5.7 and Eq. 5.10);
(iii) SC3 flows are mostly controlled by the QoS control rule (in fact, as explained in Test2
discussion on Section 7.3.3, the rate control rule is disabled);
12This is also true when the concurrent traffic is from SC1. For instance, for Fint2, there are no QoS violations atpacket level in class SC1. Graphically, the results are similar to those in Figure 7.9.
156

7.3. EVALUATION OF THE AC CRITERIA
(iv) according to the results, IPLR violations assume a predominant role in setting the variable
�èÚ _/ � Û �1� /7� ã ú to a rejection mode in the QoS control rule.
Although the AC rules are effective in blocking new flows when QoS degradation or an ex-
cessive rate is sensed, the effect of previously accepted flows may persist over more than one
measurement time interval, depending on these flows’ characteristics and duration. Nonetheless,
the system tends to recover fast. The eventual overacceptance is mainly caused by traffic fluc-
tuations reflecting a low activity period of the admitted flows. In fact, low estimation in�b�B� ÒÌ�
may lead to false acceptance during���+�
. This effect, likely to be stressed by concurrency and
traffic characteristics13, is particularly evident when observing the behavior of the SLS rate con-
trol rule for SC2 and the resulting AC decision, as shown in Figure 7.12. To minimize this, more
conservative estimates, larger safety margins and/or specific approaches to control concurrency,
as discussed in Section 5.8.1, may be required.
0.0
0.5
1.0
1.5
2.0
2.5
3.0
3.5
150 300 450 600
Rat
e (M
bps)
and
AC
Dec
isio
n
Time (s)
Rate Behavior and AC Decision for SC1
TargetEstimate
TotalDecision
0.0
2.0
4.0
6.0
8.0
10.0
12.0
14.0
16.0
18.0
150 300 450 600
Rat
e (M
bps)
and
AC
Dec
isio
n
Time (s)
Rate Behavior and AC Decision for SC2
TargetEstimate
TotalDecision
0.0
2.0
4.0
6.0
8.0
10.0
12.0
14.0
16.0
18.0
150 300 450 600
Rat
e (M
bps)
and
AC
Dec
isio
n
Time (s)
Rate Behavior and AC Decision for SC3
TargetEstimate
TotalDecision
Figure 7.12: Rate estimate evolution and AC decision for SC1, SC2 and SC3
13The described effect is more visible when the involved flows are more demanding in terms of rate and duration(see Test5 discussion in Section 7.3.6 and [13]).
157
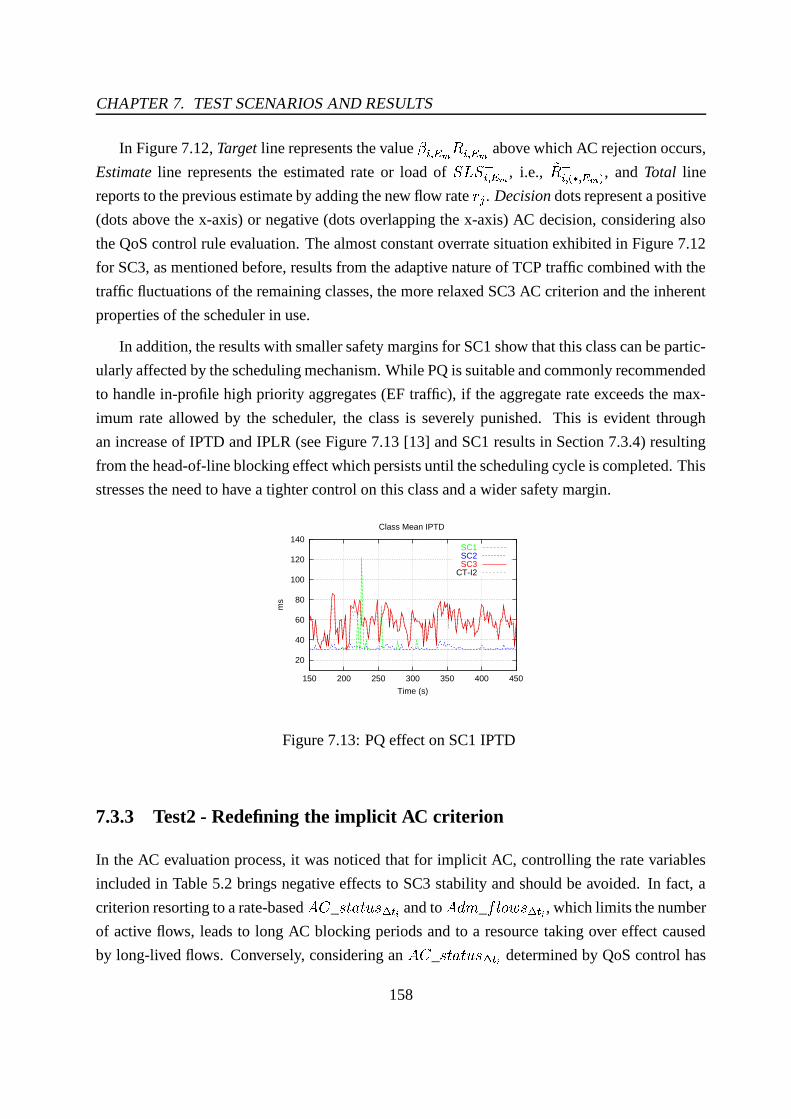
CHAPTER 7. TEST SCENARIOS AND RESULTS
In Figure 7.12, Target line represents the value ���� � 1 ��� � above which AC rejection occurs,
Estimate line represents the estimated rate or load of 354 3 ��� � , i.e., 01 �2�`_V�=� ��ïb , and Total line
reports to the previous estimate by adding the new flow rate X á . Decision dots represent a positive
(dots above the x-axis) or negative (dots overlapping the x-axis) AC decision, considering also
the QoS control rule evaluation. The almost constant overrate situation exhibited in Figure 7.12
for SC3, as mentioned before, results from the adaptive nature of TCP traffic combined with the
traffic fluctuations of the remaining classes, the more relaxed SC3 AC criterion and the inherent
properties of the scheduler in use.
In addition, the results with smaller safety margins for SC1 show that this class can be partic-
ularly affected by the scheduling mechanism. While PQ is suitable and commonly recommended
to handle in-profile high priority aggregates (EF traffic), if the aggregate rate exceeds the max-
imum rate allowed by the scheduler, the class is severely punished. This is evident through
an increase of IPTD and IPLR (see Figure 7.13 [13] and SC1 results in Section 7.3.4) resulting
from the head-of-line blocking effect which persists until the scheduling cycle is completed. This
stresses the need to have a tighter control on this class and a wider safety margin.
20
40
60
80
100
120
140
150 200 250 300 350 400 450
ms
Time (s)
Class Mean IPTD
SC1SC2SC3
CT-I2
Figure 7.13: PQ effect on SC1 IPTD
7.3.3 Test2 - Redefining the implicit AC criterion
In the AC evaluation process, it was noticed that for implicit AC, controlling the rate variables
included in Table 5.2 brings negative effects to SC3 stability and should be avoided. In fact, a
criterion resorting to a rate-based �äÚ _/ � Û �1� /�� ã ú and to �äË�à _ Z ßJÏ?Ñ´/�� ã ú , which limits the number
of active flows, leads to long AC blocking periods and to a resource taking over effect caused
by long-lived flows. Conversely, considering an �äÚ _/ � Û �1� /l� ã ú determined by QoS control has
158

7.3. EVALUATION OF THE AC CRITERIA
proved to be mandatory in order to keep a “lively” number of active flows (see Figure 7.10(b)),
while satisfying the classes’ QoS requirements. In more detail, the experiments carried out to
assess the impact of these variables on the implicit AC criteria effectiveness show that:
(i) when the rate control determines the �äÚ _/ � Û �1� /l� ã ú admittance value, this AC rule is clearly
dominant, causing long rejection periods cyclically. In these periods, whose length de-
pends on �èË�à _ Z ß9Ï�Ñä/7� ã ú , ���¶� , and on the flow interarrival and holding time distributions,
long-lived TCP flows progressively take over spare resources freed by departing flows.
As a consequence, the rate estimate remains high and �èÚ _/ � Û �1� /�� ã ú is kept in rejection
mode until few flows are left. When this stage is reached, the �äÚ _/ � Û �1� /l� ã ú enters in an
acceptance mode and a new cycle begins (see Figure 7.14);
0
20
40
60
80
100
120
150 300 450 600
# flo
ws
Time (s)
Active Flows Evolution
SC1SC2SC3
CT-I2
0
10
20
30
40
50
60
70
80
90
100
150 300 450 600
%
Time (s)
Utilization (per time interval)
SC1SC2SC3
CT-I2total
Figure 7.14: SC3 behavior with SLS rate control active: (a) active flows evolution; (b) achievedutilization (CT-I2=SC2 ; Fint1)
(ii) considering �äÚ _/ � Û �1� /7� ã ú only determined by the QoS control rule has proved to be effec-
tive in maintaining the QoS parameter IPLR bounded. However, as in (i), SC3 may exceed
slightly its defined rate share, taking advantage of SC1/SC2 unused bandwidth resources
(e.g., due to their traffic fluctuations or safety margins), increasing the global utilization
achieved by the system without an evident QoS degradation of SC1 and SC2;
(iii) controlling �èË�à _ Z ß9Ï�Ñä/7� ã ú may also be relevant to assure that the accepted flows receive
an adequate service, therefore, this variable should be dimensioned considering the class
share and, on average, an acceptable throughput for the admitted flows14. Controlling SC314Choosing the value of one hundred for ��@om _ 6��H T¡�· µ Ko� has proved not to be restrictive for flow admission in
SC3 (as exhibited in Figure 7.10(b)), allowing the QoS control rule to be applied according to the defined IPLRthreshold. For low rate interactive TCP traffic (e.g., Telnet using tcplib-telnet.cc default parameterization) the num-ber of �;@Xm _ 6��H T¡*·Gµ K � needs to be increased or disabled to make the QoS control rule effective.
159

CHAPTER 7. TEST SCENARIOS AND RESULTS
based on a new AC rule that compares the throughput achieved by a probing TCP stream
with a reference target value may be an alternative approach for implicit AC that will be
explored in future.
The configuration of the implicit AC criteria in the experiments defined in Table 7.3, including
Test1, has already followed the findings and suggestions expressed above.
7.3.4 Test3 - Impact of cross traffic
In this set of experiments, the traffic injected at � ' traverses the multiclass domain in the same
way as traffic injected at ��� but, conversely to this one, it is not considered at egress � . In
this way, � ' traffic is seen as cross traffic in the link 4 ) �¶Ò � having an impact on domain’s QoS
and load, without being explicitly measured at Ù� . This means that ´� does not consider that
traffic when performing load estimations (more precisely, the estimation of 35463 ��� a utilization
( 01 ��� �� )), but it senses its potential negative impact on ¹9�.� � ´�B½ QoS measurements (see Figure
7.15).
I1
I2
Sn
...
S1
S1’
Sn’...
C1 E1 Sn
...
S1
S1’
Sn’
...
I1
I2
Sn
...
S1
S1’
Sn’
...
C1 E1
Sn
...
S1
Concurrent Traffic Cross TrafficSLS+i,E1
SLS+i,E1
Utilization
Utilization
Figure 7.15: Concurrent vs. cross traffic for SCi
Test3 experiments allow to: (i) separate the dimensioning of1 ��� +a and the rate-based con-
trol rule from the bottleneck link capacity; (ii) further assess the effectiveness and relevance of
the QoS control rule; (iii) redefine safety margins and thresholds and, above all; (iv) evaluate
the AC criteria in scenarios likely to occur in real network environments. The impact that the
unmeasured cross traffic has on the AC criteria effectiveness is evaluated analyzing the behavior
and performance achieved by the service classes in the path ¹J��� � ä�B½ . At � ' , cross traffic from the
three defined classes is considered separately, using an "!ë#Ù%Ù% source with an on/off period of
250/250 ms. Table 7.5 illustrates the percentage of cross traffic submitted to the network in terms
of per class and global share. This latter percentage indicator is used throughout the experiments.
160

7.3. EVALUATION OF THE AC CRITERIA
Table 7.5: Percentage of cross traffic
CT-I2 % Class Share % Global ShareSC1 25% 50% 2.5% 5%SC2 20% 40% 10% 20%SC3 25% 50% 10% 20%
The obtained results vary substantially according to the service class considered as cross-
traffic. The more interesting and meaningful results are obtained when SC2 cross traffic is con-
sidered, hence, it is covered first.
SC2 cross traffic
In the presence of cross traffic from SC2, the main rule determining the AC decisions in this class
is the QoS control rule, with an �äÚ _/ � Û �1� /7� ã ú � X Ü]ð�Ü N � activated by IPLR violations. This rule
by itself maintains the QoS levels, in particular IPLR, controlled with a behavior similar to the
one showed in Figure 7.9. The SLS rate control rule and the corresponding safety margins are
now less relevant and restrictive. In fact, maintaining their values, a rate limit to ��� traffic is more
unlikely to occur due to the tight IPLR threshold and the influence of cross traffic on the loss at
ÚL� and, consequently, on the measured IPLR for the pair ¹J����òT ´�B½ .For the default QoS thresholds, the global utilization of SC2 ( �.� + CrossTraffic) decreases
comparing to the concurrent case, with the amount of traffic accepted at ��� being adjusted ac-
cording to the amount of cross traffic. For instance, to maintain the QoS compromise at the same
levels when the volume of cross traffic is increased from 10% to 20% , i.e., up to 40% of the SC2
class share, AC decreases the number of accepted flows at ��� approximately to half of its initial
value. Consequently, the utilization drops from 44% (concurrent case) to 36% and 32% respec-
tively. This interesting effect can be explained attending to the distinct traffic characteristics of
concurrent and cross traffic. In fact, concurrent traffic results from the aggregation of multiple
flows, and cross traffic is induced resorting to a single high rate bursty flow. As a consequence,
its effect on Ú]� queue occupancy increases loss events triggering the QoS control rule more fre-
quently. Figures 7.10 and 7.16 allow to compare the utilization and burstiness of SC2 and CT-I2
traffic for the three referred conditions.
161
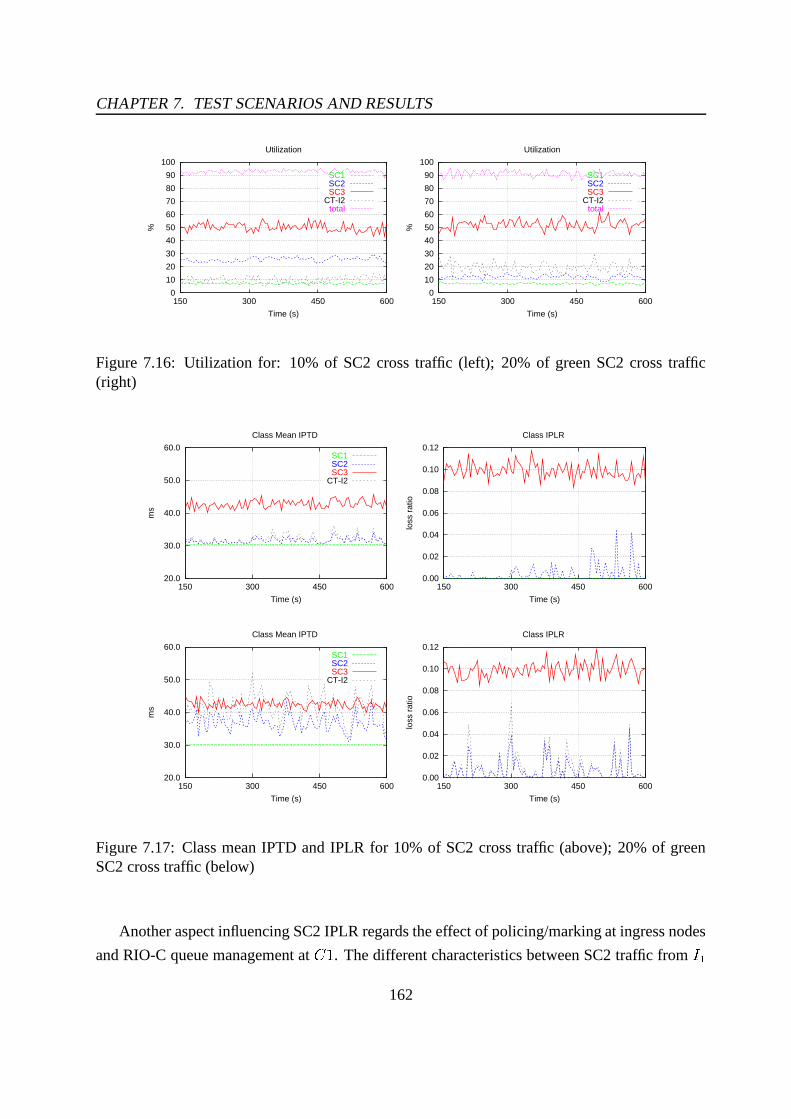
CHAPTER 7. TEST SCENARIOS AND RESULTS
0
10
20
30
40
50
60
70
80
90
100
150 300 450 600
%
Time (s)
Utilization
SC1SC2SC3
CT-I2total
0
10
20
30
40
50
60
70
80
90
100
150 300 450 600
%
Time (s)
Utilization
SC1SC2SC3
CT-I2total
Figure 7.16: Utilization for: 10% of SC2 cross traffic (left); 20% of green SC2 cross traffic(right)
20.0
30.0
40.0
50.0
60.0
150 300 450 600
ms
Time (s)
Class Mean IPTD
SC1SC2SC3
CT-I2
0.00
0.02
0.04
0.06
0.08
0.10
0.12
150 300 450 600
loss
rat
io
Time (s)
Class IPLR
20.0
30.0
40.0
50.0
60.0
150 300 450 600
ms
Time (s)
Class Mean IPTD
SC1SC2SC3
CT-I2
0.00
0.02
0.04
0.06
0.08
0.10
0.12
150 300 450 600
loss
rat
io
Time (s)
Class IPLR
Figure 7.17: Class mean IPTD and IPLR for 10% of SC2 cross traffic (above); 20% of greenSC2 cross traffic (below)
Another aspect influencing SC2 IPLR regards the effect of policing/marking at ingress nodes
and RIO-C queue management at Ú]� . The different characteristics between SC2 traffic from ���162
7.3. EVALUATION OF THE AC CRITERIA
and SC2 cross traffic from � ' result in distinct packet marking and, consequently, distinct packet
discarding at Ú]� . In particular, while for 10% of cross traffic RIO-C impact on loss affects
SC2 traffic coming from ��� , for 20% of cross traffic that impact falls essentially on cross traffic
due to the large number of colored (yellow and red) packets. When cross traffic is forced to
green marking at � ' , IPLR behaves similarly for SC2 and CT-I2. Figure 7.17 shows both test
conditions. From that figure, it is also notorious that IPTD increases for 20% of cross traffic.
IPTD behavior for both conditions (10% and 20%) is detailed in Figure 7.18. The packet level
analysis reveals that� ÊEñ � _ Í�É Ï�ß Û � É Ï?Ýz/ on IPTD is 0.05 and 12.8, respectively, and Å Ï � Û ß ��#Ù4 1
is 0.005 and 0.008.
10.0
15.0
20.0
25.0
30.0
35.0
40.0
45.0
50.0
55.0
150 300 450 600
ms
Time (s)
IPTD Behavior for SC2 (per time interval)
MeanMaxMin
Thres10.0
20.0
30.0
40.0
50.0
60.0
70.0
80.0
150 300 450 600
ms
Time (s)
IPTD Behavior for SC2 (per time interval)
MeanMaxMin
Thres
Figure 7.18: Detailed analysis of IPTD for 10% of SC2 cross traffic (left); 20% of green SC2cross traffic (right)
SC1 and SC3 maintain a similar behavior to the one exhibited in Test1. As usual, the service
class SC3 takes over unused bandwidth resources increasing its utilization slightly. This behavior
can be observed in Figure 7.16.
SC1 cross traffic
In the experiments with cross traffic from class SC1, the results show that the QoS of this class
is significantly affected by cross traffic and, under the default safety margins and thresholds, nu-
merous QoS violations in IPTD, ipdv and IPLR become evident and difficult to control despite
the rejection indication provided by the QoS control rule. This is due to high traffic fluctuations
and to the nature of the scheduling mechanism, which has defined a Max-EF-Rate for PQ treat-
ment. In the presence of an excessive rate at Ú´� , unmeasured and uncontrolled by "� , several
blocking events may occur at the scheduler affecting SC1 traffic.
163

CHAPTER 7. TEST SCENARIOS AND RESULTS
As shown in Figure 7.19, for 2.5% of SC1 cross traffic (i.e., 25% of the class share), this leads
to several episodes of QoS threshold degradation, particularly for IPLR15. The QoS control rule,
detecting these violations, sets �èÚ _ 3 � Û �1� /�� ã ú to rejection mode. However, the effect of flows
already accepted within the previous acceptance period (bounded by the rate control rule with
���� ���� �������), along with the cross traffic load, leads to QoS degradation that may span more
than one�����
. Consequently, defining larger safety margins becomes essential to accommodate
and reduce the effects of unmeasured cross traffic. These safety margins will essentially limit
��� traffic through the rate control rule, and should be defined in order to guarantee that ��� traffic
in addition to the amount of cross traffic (and corresponding high fluctuations) do not exceed
the class share and the corresponding Max-EF-Rate value. As an example, for 2.5% of SC1
cross traffic, � ��� �÷� �����allows an SC1 behavior similar to the one achieved in Test1 with
� ��� �� � �������(without loss). Figure 7.20 compares the rate behavior of SC1 and the acceptance
decisions at ��� , for ���� ��¿���������and ���� �� �����Z�.�
. As shown, ����� ��-�÷�����.�leads to a more
stable AC behavior; the global SC1 utilization decreases from 8.5% to 6.8% (this value should
increase for less bursty CT-I2). In both conditions, the remaining classes SC2 and SC3, maintain
the expected behavior with a slight QoS improvement for SC2.
From the above tests with SC1 cross traffic, it is clear that the conservativeness and degree of
overprovisioning of SC1 are fundamental. According to [6], a simple ISPs design rule for tight
delay, jitter and loss control is provisioning twice the capacity of the expected aggregate peak
load. Additional tests on SC1 performance are advisable, mainly considering distinct scheduling
mechanisms and large-scale environments. This is also stressed by the findings in [46].
SC3 cross traffic
When cross traffic is from class SC3, the model behaves similarly to the concurrent traffic case. In
fact, as AC for this class is not based on the rate control rule, the presence of cross and concurrent
traffic is only reflected in the measured QoS. This means that SC3 IPLR is kept controlled by
the QoS control rule, preserving the QoS behavior. The same occurs for the remaining service
classes.
15The packet level analysis reveals that the î�.�iÞG _ �o§¨ ¦�2¥oG¨§¨ T©�· for IPTD is 3.3, for ipdv is 0.36 and� TG9¥Þ�����5¬x<
is 0.012 (two orders of magnitude above the defined IPLR threshold). Although not visible in the figure, SC1 meanipdv ranges from 0.10 to 0.30ms.
164

7.3. EVALUATION OF THE AC CRITERIA
20.0
30.0
40.0
50.0
60.0
150 300 450 600
ms
Time (s)
Class Mean IPTD
SC1SC2SC3
CT-I2
0.00
0.02
0.04
0.06
0.08
0.10
0.12
150 300 450 600
loss
rat
io
Time (s)
Class IPLR
40.0
60.0
80.0
100.0
120.0
140.0
160.0
180.0
200.0
150 300 450 600
ms
Time (s)
IPTD Behavior for SC1 (per time interval)
MeanMaxMin
Thres
-150.0
-100.0
-50.0
0.0
50.0
100.0
150.0
200.0
150 300 450 600
ms
Time (s)
ipdv Behavior for SC1 (per time interval)
MeanMaxMin
ThresMean-sign
Figure 7.19: Class Mean IPTD and IPLR for 2.5% of SC1 cross traffic (above); detailed analysisof IPTD and ipdv (below)
0.0
0.5
1.0
1.5
2.0
2.5
3.0
150 300 450 600
Rat
e (M
bps)
and
AC
Dec
isio
n
Time (s)
Rate Behavior and AC Decision for SC1
TargetEstimate
TotalDecision
0.0
0.5
1.0
1.5
2.0
150 300 450 600
Rat
e (M
bps)
and
AC
Dec
isio
n
Time (s)
Rate Behavior and AC Decision for SC1
TargetEstimate
TotalDecision
Figure 7.20: Rate estimation evolution and AC decision for SC1 at ��� with � ��� ��� ���Z���(left)
and ���� � �������.�(right)
165
CHAPTER 7. TEST SCENARIOS AND RESULTS
Test3 concluding remarks
From these set of experiments, the relevance of the defined AC rules becomes evident in assuring
service commitments in the domain. While the rate control rule assumes a preponderant role
for service classes SC1 and SC2 to control the traffic load and indirectly QoS, particularly in
situations involving concurrent traffic, the QoS control rule is decisive to assure the domain
QoS levels in presence of unmeasured cross traffic16. In real environments, where the two type
of situations are likely to occur simultaneously, the two AC rules will complement each other to
increase the domain capabilities to guarantee service commitments. Although being encouraging
on this aspect, the obtained results might be even more satisfactory when considering that a
significant amount of the involved cross traffic will be sensed and controlled by other egress
nodes.
From the above reasoning, it is important to remark that, knowing which AC rule is more
influent on the AC decision process can also bring relevant information and directions for im-
proving service configuration and provisioning both intra and interdomain.
7.3.5 Test4 - Redefining safety margins and thresholds
New safety margins
The results of Test1 and Test3 suggest that achieving a service level without QoS threshold
violations requires more conservative estimates or larger safety margins ( � �2� �� ). In Test4, this
latter option is explored by establishing new safety margins aiming at a service provision without
QoS violations. Additionally, varying the safety margins allows to induce and test different load
conditions. In particular, assessing the AC performance under low to moderate loads is also
important as it represents a realistic operating scenario, for instance, for many ISP network cores
[6, 41].
Under these test conditions, the emphasis of the analysis is given to the behavior of the service
classes, essentially SC1 and SC2, disregarding the values achieved for the global utilization. In
fact, as explained before, due to the adaptive nature of SC3 traffic and to the work-conserving
nature of the scheduling process, SC3 might use available resources and, therefore, the global
utilization tends to remain at the same level.
16Once again, IPLR metric is the most relevant in setting �;* _ ·=G9¥oG¨£�·]µ K � to rejection mode.
166

7.3. EVALUATION OF THE AC CRITERIA
In this way, for test conditions similar to Test1 and using SC2 as concurrent traffic (CT-I2),
Test4 extends the results obtained initially for each service class 3{Ú � , presented in Table 7.4,
exploring how the blocking probabilities, the average number of active flows and the utilization
evolve with the variation of the safety margins.
0
20
40
60
80
100
0.95/1.0 0.85/0.9 0.75/0.8 0.65/0.7
Blo
ckin
g P
roba
bilit
y (%
)
Safety Margins for SC1/SC2
Safety Margin vs.Blocking Probability
SC1SC2SC3
CT-I2
0
20
40
60
80
100
120
0.95/1.0 0.85/0.9 0.75/0.8 0.65/0.7#a
ct_f
low
s (a
vg)
Safety Margins for SC1/SC2
Safety Margin vs. Number of Active Flows
SC1SC2SC3
CT-I2
0
20
40
60
80
100
0.95/1.0 0.85/0.9 0.75/0.8 0.65/0.7
Util
izat
ion
(%)
Safety Margins for SC1/SC2
Safety Margin vs. Utilization
SC1SC2SC3
CT-I2
0
20
40
60
80
100
0.95/1.0 0.85/0.9 0.75/0.8 0.65/0.7
IPT
D (
ms)
Safety Margins for SC1/SC2
Safety Margin vs.IPTD
SC1-MaxMean
SC2-MaxMean
SC3-MaxMean
Figure 7.21: Influence of varying the safety margins on the blocking probabilities, average num-ber of active flows, mean utilization and IPTD
Figure 7.21 shows four different sets of safety margins reflecting from less to more conser-
vative AC scenarios. Once again, no safety margin was defined for SC3 as the rate control rule is
disabled. The results in Figure 7.21 show an evident relation between the variables under anal-
ysis. Under more conservative conditions, the blocking probability increases for SC1 and SC2,
and consequently, there is a consistent decrease in the number of active flows. In the same way,
the utilization levels follow a descending trend. More precisely, SC1 illustrates an almost exact
proportionality of 30% among the three variables studied when the safety margins vary from
0.95 to 0.65. SC2 also exhibits a clear proportionality among those variables but with a slight
variation of 5% between the blocking probability and the other two variables. Reporting again to
Figure 7.21, a clear inverted behavior is exhibited for SC3 resulting from the reasons explained
167
CHAPTER 7. TEST SCENARIOS AND RESULTS
above. In practical terms, the global utilization varies from 95.8% to 92.9%, which means that
under the defined safety margins, the AC criteria, despite being more conservative on SC1 and
SC2, achieves high network utilization. As regards IPTD, Figure 7.21 also illustrates that while
SC1 and SC3 maintain a similar behavior on IPTD (mean and maximum) for all test conditions,
SC2 tends to converge to SC1 behavior when the utilization decreases.
A packet level analysis similar to the one provided in Table 7.4 reveals that the percentage
of packet violations for the established QoS thresholds decreases progressively. For SC1, no
QoS violations were noticed for safety margins below 0.95. However, for more demanding
traffic sources, a larger safety margin may need to be configured, as stressed in [13][11]17. For
SC2, the� ÊEñ � / _ Í�É Ï�ß Û � É Ï?Ýz/ of IPTD and Å Ï � Û ß ��#"4 1 decrease from 5.62% to 1.62% and from
0.0046 to 0.0011, respectively, when the corresponding safety margin goes from 1.0 to 0.9.
For the remaining safety margins considered, no QoS violations occur. For all test situations,
Å Ï � Û ß ��#Ù4 1 for SC3 remains very stable around � � ÒÌ� , varying from 0.105 to 0.099.
New thresholds
A different set of experiments performed in Test4 aims at testing the AC model performance
when distinct QoS thresholds are established. In particular, these new thresholds are defined in
order to assess the adaptability of the model to other QoS constraints than IPLR. In this context,
more relaxed IPLR and/or tighter IPTD thresholds are used. As SC1 behavior is mainly influ-
enced by rate control, these experiments focus essentially on SC2 and SC3, with either concurrent
or cross traffic (referred as 10% of SC2 cross traffic). Within the presented results, the emphasis
is given to scenarios with similar characteristics to Test3 (cross-traffic) and CT-I2=SC2, as they
are more challengeable for the AC evaluation with respect to the QoS levels achieved by each
class. For SC3, tighter IPLR thresholds were also tested. In this context, the new test conditions
are as follows:
Test4.1 - Thresholds: IPLR=0.05 for SC2 and SC3; IPTD = 50ms for SC2;
Test4.2 - Thresholds: No IPLR constraints in SC2 and SC3; IPTD = 50ms for SC2;
Test4.3 - Thresholds: No IPLR constraints in SC2 and SC3; IPTD = 35ms for SC2.
17As an example, in [13], using �5Di��Ú?Ú�S&¤WM$k�<X<²i?µ$.�·XSN T©�ª¦ 9686ÙMòß�<o<�m´·�àN�箩�G`MP<�Y óÞ·�àN��F� ¦�=@qMõôX<o· asSC1 traffic sources, the safety margin proposed was 0.55. In [13] all service classes carried UDP traffic, SC2/SC3used higher rate sources and § GcMPko· . In [11], with test conditions similar to the ones used in Test4, for Fint1, theproposed service margin for SC1 was 0.8.
168

7.3. EVALUATION OF THE AC CRITERIA
Similar to the safety margin tests, the results express the blocking probability, the number of
active flows and the mean utilization (see Figure 7.22), including as well, a packet level analysis
and graphical behavior of the QoS metrics under control.
0
20
40
60
80
100
Default Test4.1 Test4.2 Test4.3
Blo
ckin
g P
roba
bilit
y (%
)
Thresholds for SC2 and SC3
Thresholds vs.Blocking Probability
SC1SC2SC3
0
20
40
60
80
100
120
Default Test4.1 Test4.2 Test4.3
#act
_flo
ws
(avg
)
Thresholds for SC2 and SC3
Thresholds vs. Number of Active Flows
SC1SC2SC3
0
20
40
60
80
100
Default Test4.1 Test4.2 Test4.3
Util
izat
ion
(%)
Thresholds for SC2 and SC3
Thresholds vs. Utilization
SC1SC2SC3
CT-I2
Figure 7.22: Influence of varying the QoS thresholds on the blocking probabilities, averagenumber of active flows and mean utilization ( � ��� of SC2 cross traffic)
Test4.1 results
According to Figures 7.22 and 7.23, the results of Test4.1 show that, under a more relaxed IPLR
threshold, SC2 acceptance levels increase. As a consequence, the class utilization is higher and
closer to the defined share. IPTD also increases but is kept behind the defined threshold. In this
case, the AC decisions are determined by the QoS control rule according to the value of IPLR, and
although IPLR oscillates around the defined threshold, the magnitude of oscillations may reach
occasionally one order the magnitude above (see Figure 7.23 (right)). However, Å Ï � Û ß ��#Ù4 1for SC2 is kept controlled ( Å Ï � Û ß ��#Ù4 1 ë ���Z��ö
). With concurrent traffic, in presence of a more
relaxed IPLR threshold, AC decisions are mainly determined by the SLS rate control rule with
169
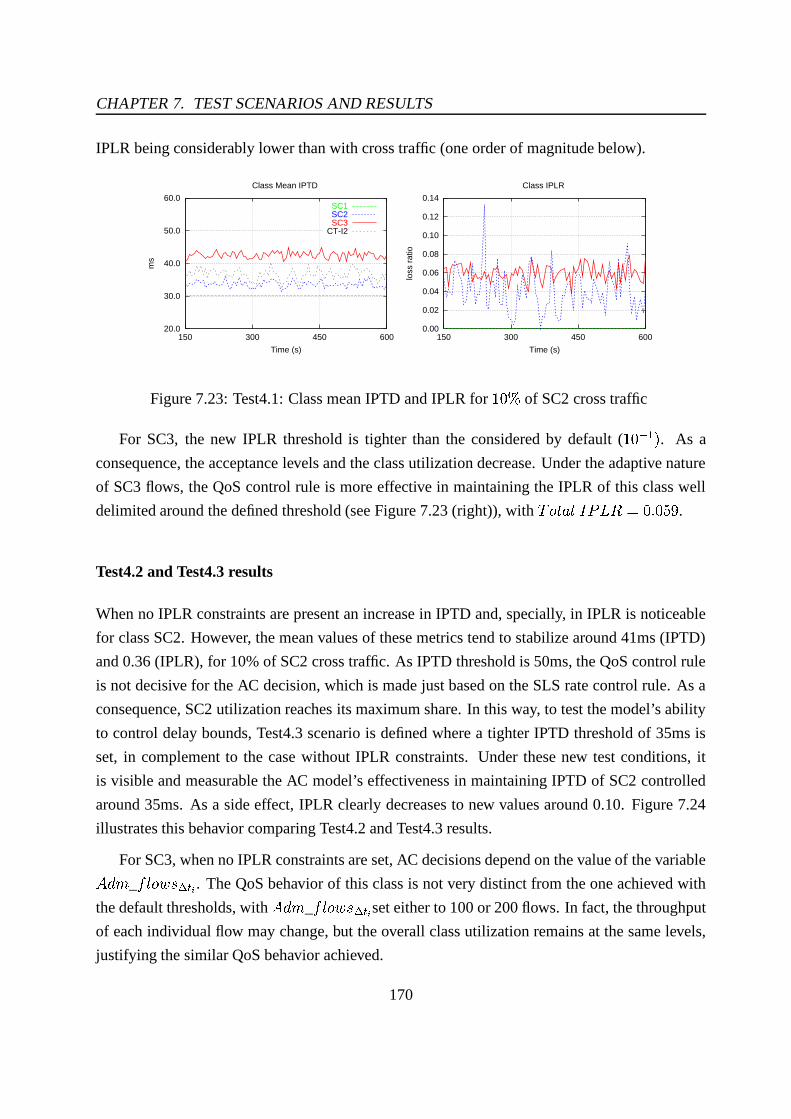
CHAPTER 7. TEST SCENARIOS AND RESULTS
IPLR being considerably lower than with cross traffic (one order of magnitude below).
20.0
30.0
40.0
50.0
60.0
150 300 450 600
ms
Time (s)
Class Mean IPTD
SC1SC2SC3
CT-I2
0.00
0.02
0.04
0.06
0.08
0.10
0.12
0.14
150 300 450 600
loss
rat
io
Time (s)
Class IPLR
Figure 7.23: Test4.1: Class mean IPTD and IPLR for � ��� of SC2 cross traffic
For SC3, the new IPLR threshold is tighter than the considered by default ( � � ÒÌ� ½ . As a
consequence, the acceptance levels and the class utilization decrease. Under the adaptive nature
of SC3 flows, the QoS control rule is more effective in maintaining the IPLR of this class well
delimited around the defined threshold (see Figure 7.23 (right)), with Å Ï � Û ß ��#"4 1 �-���Z����÷.
Test4.2 and Test4.3 results
When no IPLR constraints are present an increase in IPTD and, specially, in IPLR is noticeable
for class SC2. However, the mean values of these metrics tend to stabilize around 41ms (IPTD)
and 0.36 (IPLR), for 10% of SC2 cross traffic. As IPTD threshold is 50ms, the QoS control rule
is not decisive for the AC decision, which is made just based on the SLS rate control rule. As a
consequence, SC2 utilization reaches its maximum share. In this way, to test the model’s ability
to control delay bounds, Test4.3 scenario is defined where a tighter IPTD threshold of 35ms is
set, in complement to the case without IPLR constraints. Under these new test conditions, it
is visible and measurable the AC model’s effectiveness in maintaining IPTD of SC2 controlled
around 35ms. As a side effect, IPLR clearly decreases to new values around 0.10. Figure 7.24
illustrates this behavior comparing Test4.2 and Test4.3 results.
For SC3, when no IPLR constraints are set, AC decisions depend on the value of the variable
�äË�à _ Z ßJÏ?Ñ´/�� ã ú . The QoS behavior of this class is not very distinct from the one achieved with
the default thresholds, with �äË�à _ Z ß9Ï?Ñ´/�� ã ú set either to 100 or 200 flows. In fact, the throughput
of each individual flow may change, but the overall class utilization remains at the same levels,
justifying the similar QoS behavior achieved.
170

7.3. EVALUATION OF THE AC CRITERIA
20.0
25.0
30.0
35.0
40.0
45.0
50.0
150 300 450 600
ms
Time (s)
Class Mean IPTD for SC2
Test4.2Test4.3
0.00
0.05
0.10
0.15
0.20
0.25
0.30
0.35
0.40
0.45
0.50
150 300 450 600
loss
rat
io
Time (s)
Class IPLR for SC2
Figure 7.24: Test4.2 vs Test4.3: IPTD and IPLR behavior for 10% of SC2 cross traffic (Fint1)
For the three defined threshold conditions, the packet level analysis reveals that:
(i) SC1 maintains a behavior without QoS violations;
(ii) the percentage of packets exceeding the IPTD QoS (threshold) violations for SC2 is kept
low for Test4.1 and Test4.2, varying from 0.7% (Test4.1) to 6.2% (Test4.2). For Test4.3
conditions, where a tighter IPTD threshold of 35ms is set for class SC2, the percentage of
QoS violations at packet level reaches 30.5% (Fint2) and 33.6% (Fint1). For this test, only
1.1% (Fint2) and 3.1% (Fint1) of packets exceed the initial 50ms delay threshold;
(iii) although not being a variable under control in Test4.2 and Test4.3, Å Ï � Û ß ��#Ù4 1 for SC2
decreases from 0.36 (Test4.2) to 0.10 (Test4.3).
7.3.6 Test5 - Impact of traffic characteristics
From the analysis carried out so far, it is clear that controlling QoS and SLS utilization in a
multiservice domain involves configuring and handling multiple and interrelated variables. The
difficulty and complexity of such control cannot be dissociated from the statistical properties of
traffic entering the network domain. From the experiments above, several traffic aspects have
shown particular influence on the AC evaluation results, namely:
(i) the parameterization of the traffic source models ruling the generation of packets belonging
to individual or aggregate flows;
171

CHAPTER 7. TEST SCENARIOS AND RESULTS
(ii) the flows’ arrival and departure process, namely the flow interarrival and holding time dis-
tributions.
On the one hand, the choice and parameterization of a source model determine the intrinsic
characteristics of each traffic flow, reflecting the way it behaves during its lifetime. On the other
hand, at aggregate level, i.e., when considering multiple flows, they also determine the statistical
properties of the traffic within each service class, and consequently, the challenges posed to traffic
control mechanisms. For instance, low or high load estimates resulting from short-term traffic
fluctuations may mislead AC decisions, while long-term properties such as LRD have proved to
impact on the nature of congestion and on some AC algorithms [95]. The flows’ peak and mean
rates also have a noticeable effect in the QoS achieved by a service class and in its eventual QoS
degradation. Flows with higher peak and mean rates tend to produce higher fluctuations on the
load estimations and therefore, the number of positive AC decisions due to low estimates tend to
increase QoS degradation. The safety margins required in the presence of high flow rates need
to be large enough to accommodate traffic variability. This behavior is noticeable in simulations
with different flow rates on SC1 [13], being also visible when comparing the admission decision
results of SC1 and SC2, represented in Figure 7.12.
The flow arrival and departure process (flow interarrival time - fint; flow holding time - fhold)
is another aspect of traffic characterization that impacts on several issues regarding the perfor-
mance evaluation of the AC model. First of all, such process determines the flows’ dynamics
and load submitted to the network. More specifically, the average values of the flow interarrival
time, flow holding time and flow rate interfere with:
(i) global and service class utilization - in fact, fint, fhold, flow rate and each class allocated
bandwidth are closely interrelated and their values determine the way the network (and
the simulation model) is loaded. The mean class utilization, the mean number of active
flows, the maximum number of supported flows and the time required to reach a steady
state in the simulation depend on these variables. When considering a measurement time
interval�����
, in which the flow arrival is taken into consideration but the flow departure is
not considered, long lasting flows (larger fhold) lead to more stable operation and higher
utilization (see Test6 discussion in Section 7.3.7);
(ii) blocking probabilities - attending to each class allocated capacity and each flow rate, it is
possible to predict the maximum number of supported flows. On average, when the number
of potentially active flows, determined by the relation between fhold and fhint, falls behind
172

7.3. EVALUATION OF THE AC CRITERIA
this maximum number the blocking probability tends to be zero. In this way, for the same
fhold, a shorter fint leads to higher blocking probabilities. Therefore, when an AC proposal
is evaluated resorting to a blocking probabilities analysis, the marginal variation of the
blocking probabilities due to the change on AC parameters under evaluation should be
considered rather than taking the corresponding absolute values;
(iii) network dynamics - fint and fhold may also induce some nasty synchronization effects ac-
cording to their values. This may occur, for instance, when the fhold distribution leads
to synchronized flow departure and the fint distribution is very demanding to flow admis-
sion. This may generate load cycles influencing the acceptance/rejection AC decisions
accordingly;
(iv) the rate estimation mechanisms such as TW (see Section 7.2.3).
All the aspects discussed above stress the need to take into account the traffic characteristics
when configuring the monitoring and AC modules18. In the present context, maintaining an AC
parameterization similar to Test1 (i.e., the safety margins and thresholds), several experiments
were carried out to evaluate the impact of different types of sources on the performance of the
AC proposal. In this way, in addition to "!$#"%&% sources, Ú"Ø 1 and #P� 1 %&% sources were
included in the tests, as illustrated in Table 7.6. Pareto sources with a shape parameter � » ¾ »À
under aggregation allow to generate traffic exhibiting LRD.
Table 7.6: AC results for distinct source models
Src Type #act_flows %util. IPTD: mean; max; %pkts_viol Total IPLR* : < ��� Q 107.3 7.3 30.2 30.6 0.0 0.0* : < ��� V 116.3 44.0 31.2 38.0 0.0 0.0� � � ��� @ 61.6 43.0 42.7 74.9 n.a. 0.102�5DÝ��Ú?Ú;��� Q 105.9 7.2 30.2 30.6 0.0 0.0�5DÝ��Ú?Ú;��� V 116.6 44.2 32.4 69.9 1.58 0.0015� � �è��� @ 65.9 43.4 41.7 77.2 n.a. 0.102�5��<?Ú?Ú ��� Q 104.3 7.2 30.2 30.6 0.0 0.0�5��<?Ú?Ú ��� V 115.5 44.1 32.3 70.3 1.62 0.002� � � ��� @ 66.9 43.3 42.8 79.0 n.a. 0.103
The results obtained with these new source models similarly parameterized (in terms of rate,
fint, fhold and on/off periods when applicable) show that the utilization levels achieved for the
18Finding formal relations and guidelines between the considered variables and the system’s configuration wasleft for future study.
173

CHAPTER 7. TEST SCENARIOS AND RESULTS
distinct service classes are maintained. However, ��#´ÅLÓ Æ�Ç+È , % pkt_ violations on IPTD thresh-
old and Å Ï � Û ß ��#Ù4 1 tend to increase with traffic variability19. While for Ú"Ø 1 sources there
are no packets exceeding the IPTD threshold and there is no packet loss, for �!$#"%&% and
#P� 1 %&% sources the delay and loss behavior mentioned above is verified, in particular for SC2.
Nevertheless, each class QoS commitments are generically met.
In this context, the obtained results indicate that the proposed AC model exhibits good per-
formance in handling traffic burstiness and, eventually, long time scale fluctuations, stressing the
argument that LRD provides additional motivation to the use of measurement-based AC [99]. In
addition, following [121], from these results there is no reason to conclude that LRD will pose
particular challenges to the proposed AC approach. The only remark to hold is that the degree of
LRD is related to the number of aggregated sources, and the simulation time considered is also
relevant to the evaluation of long-term statistical properties. Although longer simulations did not
show significant changes in the results, additional tests using specific traffic aggregates exhibit-
ing LRD (e.g., for SLS AC) may be relevant to do in the future. Additional results on testing the
impact of traffic characteristics under different parameterization of AC and traffic flows can be
found in [13].
AC fairness on concurrent flows
Although a complete fairness study of AC decisions is suggested as topic of future research,
several preliminary tests were carried out in order to analyze the model behavior in the presence
of concurrent traffic with distinct flow characteristics within the same service class. Initial results
show that the model is able to adapt consistently to different conditions in the concurrent classes,
adjusting the number of admitted flows according to the flows’ defined rate and maintaining the
global and per-class utilization levels similar to the ones obtained previously.
The results in Table 7.7 illustrate this fair behavior when the concurrent service class is SC1
with more demanding flow peak rates, burstiness and flow arrival/holding times20. Under the
new traffic conditions, the QoS behavior of SC1 shows a slight degradation. However, the %
19According to [95, 20], IPTD and IPLR are the parameters mostly influenced by LRD.20The initial configuration of SC1 sources is referred as �5Di��Ú?Ú Q��� Q (rate = 64kbps; On = 0.96 /Off = 1.69ms
(mean rate = 23kbps); Fint = 0.3s; Fhold = 120s). �5Di��Ú?Ú V��� Q (rate = 256kbps; On/Off = 500ms (mean rate =128kbps); Fint = 0.3s; Fhold = 90s) corresponds to a more demanding traffic source and �5Di��Ú?Ú�@��� Q is equivalentto �5Di��Ú?Ú V��� Q varying the flow arrival and departure processes, i.e., ( �5Di��Ú?Ú V��� Q ; Fint = 0.6s; Fhold = 120s).As mentioned, to test more demanding traffic conditions and unbalanced loads, �5DÝ��Ú?Ú V��� Q and �5DÝ��Ú?ÚÃ@��� Qpeak rates are around five times �5Di��Ú?Ú Q��� Q peak rate.
174

7.3. EVALUATION OF THE AC CRITERIA
Table 7.7: AC results on fairness
Class Src Type #act_flows %util. %pkts_viol (IPTD ; ipdv) Total IPLR
SC1 �5DÝ��Ú?Ú Q��� Q 56.9 3.9 (0 ; 0) 0.0�{Di��Ú?Ú Q��� Q 58.4 4.0 (0.16 ; 0.035) 0.0010�{Di��Ú?Ú Q��� Q 52.4 3.6 (0.21 ; 0.052) 0.0012CT-I2 �5DÝ��Ú?Ú Q��� Q 58.2 3.9 (0 ; 0) 0.0�{Di��Ú?Ú V��� Q 10.4 3.9 (0.17 ; 0.026) 0.0011�{Di��Ú?ÚÃ@��� Q 11.5 4.2 (0.24 ; 0.039) 0.0014
SC2 �5DÝ��Ú?Ú;��� V 111.1 42.1 (0.19 ; n.a.) 0.0043�{Di��Ú?Ú ��� V 111.3 42.0 (0.17 ; n.a.) 0.0040�{Di��Ú?Ú ��� V 110.7 41.8 (0.09 ; n.a.) 0.0032SC3 �5DÝ��Ú?Ú;��� @ 99.4 49.3 (n.a. ; n.a.) 0.093�{Di��Ú?Ú;��� @ 99.4 49.1 (n.a. ; n.a.) 0.094�{Di��Ú?Ú;��� @ 99.1 49.1 (n.a. ; n.a.) 0.096
pkt_ violations is very low and Å Ï � Û ß ��#"4 1 is kept well bounded within one order of magnitude
above the established QoS thresholds. IPLR behavior in���=�
is illustrated in Figure 7.25.
0.00
0.02
0.04
0.06
0.08
0.10
0.12
150 300 450 600
loss
rat
io
Time (s)
Class IPLR
SC1SC2SC3
CT-I2
Figure 7.25: IPLR behavior (CT-I2 = "!$#"%&%&'(�) � )As mentioned earlier and also noticed in [13], the cause of QoS degradation is the higher
fluctuations in the rate estimations when SC1 flows’ rate is increased (see Figure 7.2621), irre-
spectively of the concurrent traffic having or not similar characteristics. The QoS degradation
noticed can be avoided resorting to a higher safety margin in the SLS rate control rule for SC1.
As illustrated in Table 7.7, the remaining service classes are not particularly affected by the new
test conditions.
21The difference between the green curve (rate Estimate) and the blue curve (Total) corresponds to the peak rateof the flow requiring admission (64kbps and 256kbps for SC1 and CT-I2, respectively). A flow rejection occurs ifthe blue curve is above the Target line. The green curve (and not the blue one) identifies episodes of rate violations.
175

CHAPTER 7. TEST SCENARIOS AND RESULTS
0.0
0.5
1.0
1.5
2.0
2.5
3.0
3.5
150 300 450 600
Rat
e (M
bps)
and
AC
Dec
isio
n
Time (s)
Rate Behavior and AC Decision for SC1
TargetEstimate
TotalDecision
0.0
0.5
1.0
1.5
2.0
2.5
3.0
3.5
150 300 450 600
Rat
e (M
bps)
and
AC
Dec
isio
n
Time (s)
Rate Behavior and AC Decision for CT-I2
TargetEstimate
TotalDecision
Figure 7.26: Rate estimations for SC1 and CT-I2 (CT-I2 = "!$#"%&% '(�) � )Results on concurrent traffic belonging to SC2 (e.g., with the flow mean rate halving the
previous CT-I2 rate configuration) exhibit similar trends regarding øbÛkN � _ Z ß9Ï�Ñä/ and achieved
utilization, and also a stable QoS behavior.
Additional remarks on distinct traffic sources
This section includes results from tests exclusively with UDP classes and using higher rate traffic
sources [13]. As SC3 is now a non-adaptive traffic class, the overall utilization tends to suffer
larger bounces. When the safety margins � �2� �� are increased to avoid QoS degradation, the
influence on the utilization levels is also more notorious, however, the overall utilization remains
high. Figure 7.27 [13] illustrates this behavior, assuming an initially defined SLS share of 10%,
50% and 40% for SC1, SC2 and SC3, respectively, and having SC3 as concurrent traffic.
0
10
20
30
40
50
60
70
80
90
100
150 200 250 300 350 400 450
%
Time (s)
Utilization
SC1SC2SC3
CT-I2total
0
10
20
30
40
50
60
70
80
90
100
150 200 250 300 350 400 450
%
Time (s)
Utilization
Figure 7.27: Utilization for distinct � ��� � : (left) ( 0.75; 0.90; 1.0); (right) (0.55; 0.75; 0.8)
176

7.3. EVALUATION OF THE AC CRITERIA
7.3.7 Test6 - Impact of the measurement time interval
The measurement time interval�b���
used in the evaluation of MBAC and EMBAC solutions may
vary significantly. For instance, in [157] the measuring time window to perform MBAC at ingress
nodes, based on their link capacity, ranges from 0.05s to 2s. While in some edge-to-edge MBAC
proposals a�b�¶�
as small as � / is used for AC performance evaluation [194], in real environments
larger time intervals should be used to reduce the overhead of keeping the metrics updated. For
instance, a�b�¶�
of,��
s to few minutes is sometimes recommended for one-way measurements
[223, 224].
In the context of the present work, the AC evaluation tests performed so far have used���T� �
��/, which has been defined and adjusted in order to maintain an updated view of each class’s
performance and, simultaneously, to face���=�
constraints imposed by the probing patterns in use
(see Section 7.2.2). Test6 experiments aim at evaluating the impact of larger���B�
on the AC
model’s performance. In this way, using the same test conditions of Test1 and SC2 as concurrent
traffic, new measurement time intervals of 30s and 60s are under evaluation.
As illustrated in Figure 7.28 (labels 5, 30, 60), on average, the number of active flows and
the utilization for SC1 and SC2 decrease, especially for SC1. As a result of this utilization
decrease, the QoS behavior of these service classes for�b�=� � Á ��/ and
���¶� ��,���/is better than
for����� �¿��/
, both from a measurement interval and packet level perspectives22. As usual, SC3
benefits from unused resources to increase its share while maintaining IPLR ë ��� � .
0
20
40
60
80
100
120
5 30 60 60-nadj
#act
_flo
ws
(avg
)
Measuring interval properties
Measuring Interval vs. Number of Active Flows
SC1SC2SC3
CT-I2
0
20
40
60
80
100
5 30 60 60-nadj
Util
izat
ion
(%)
Measuring interval properties
Measuring Interval vs. Utilization
SC1SC2SC3
CT-I2
Figure 7.28: Influence of�b���
on the number of active flows and utilization
22When increasing §6G e , the initial simulation convergence period and the running time need to be longer to sustainthis reasoning. In this way, the forthcoming analysis with §6G e Mùôo<o· reports to a simulation window from 240 to1440s.
177
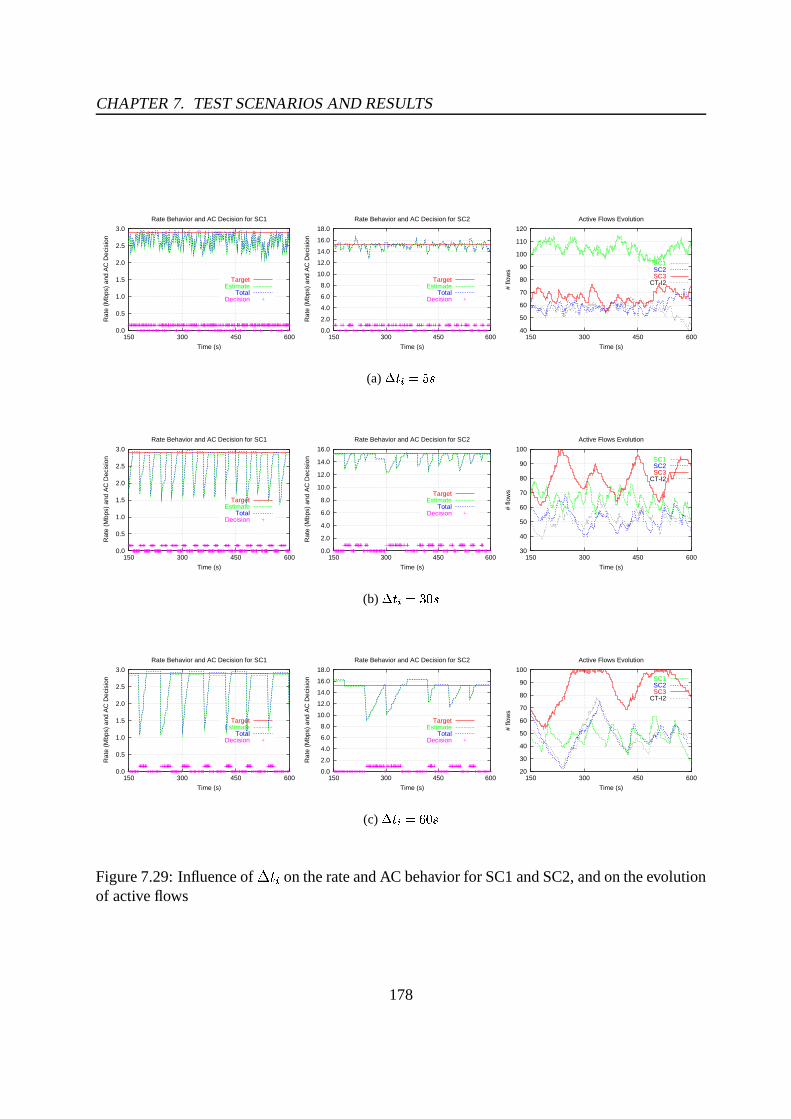
CHAPTER 7. TEST SCENARIOS AND RESULTS
0.0
0.5
1.0
1.5
2.0
2.5
3.0
150 300 450 600
Rat
e (M
bps)
and
AC
Dec
isio
n
Time (s)
Rate Behavior and AC Decision for SC1
TargetEstimate
TotalDecision
0.0
2.0
4.0
6.0
8.0
10.0
12.0
14.0
16.0
18.0
150 300 450 600
Rat
e (M
bps)
and
AC
Dec
isio
n
Time (s)
Rate Behavior and AC Decision for SC2
TargetEstimate
TotalDecision
(a) § G e MTßo·40
50
60
70
80
90
100
110
120
150 300 450 600
# flo
ws
Time (s)
Active Flows Evolution
SC1SC2SC3
CT-I2
0.0
0.5
1.0
1.5
2.0
2.5
3.0
150 300 450 600
Rat
e (M
bps)
and
AC
Dec
isio
n
Time (s)
Rate Behavior and AC Decision for SC1
TargetEstimate
TotalDecision
0.0
2.0
4.0
6.0
8.0
10.0
12.0
14.0
16.0
150 300 450 600
Rat
e (M
bps)
and
AC
Dec
isio
n
Time (s)
Rate Behavior and AC Decision for SC2
TargetEstimate
TotalDecision
(b) § G e MËÞX<²·30
40
50
60
70
80
90
100
150 300 450 600
# flo
ws
Time (s)
Active Flows Evolution
SC1SC2SC3
CT-I2
0.0
0.5
1.0
1.5
2.0
2.5
3.0
150 300 450 600
Rat
e (M
bps)
and
AC
Dec
isio
n
Time (s)
Rate Behavior and AC Decision for SC1
TargetEstimate
TotalDecision
0.0
2.0
4.0
6.0
8.0
10.0
12.0
14.0
16.0
18.0
150 300 450 600
Rat
e (M
bps)
and
AC
Dec
isio
n
Time (s)
Rate Behavior and AC Decision for SC2
TargetEstimate
TotalDecision
(c) §6G e MTôo<o·20
30
40
50
60
70
80
90
100
150 300 450 600
# flo
ws
Time (s)
Active Flows Evolution
SC1SC2SC3
CT-I2
Figure 7.29: Influence of�����
on the rate and AC behavior for SC1 and SC2, and on the evolutionof active flows
178

7.3. EVALUATION OF THE AC CRITERIA
In Figure 7.29, taking���+�
as 5, 30 and 60s, a longer cyclic behavior is noticeable both on the
AC decisions and on the number of active flows. In more detail, considering SC1 and�b�B� � ,���/
as an example, it is visible that after each load estimation update, the system enters into a positive
AC cycle with a slope that depends on fint. After each flow admission, each �?Î will update the
load estimate until detecting that the new acceptances lead to the defined utilization target. In
that moment, new incoming flows start to be refused and the last estimation is kept until�b�B� � ,
when a new load is estimated and provided. As flow departures within a time interval are not
taken into account, when the new update takes place, the rate estimation at the ingress node tends
to decrease abruptly23. From the results in Figure 7.29, it is also visible that this rate decrease
is more pronounced for a larger���+�
, as the number of departing flows in the interval tends to
increase. SC2 shows a similar behavior but not so precise due to the distinct traffic profile (higher
rates, longer fint and fhold), the presence of concurrency and the traffic scheduling discipline.
The graphs corresponding to the rate estimation and AC decision of SC3 flows are not included
as the rate control rule is disabled.
When exploring the impact of�b���
, there are, at least, three relevant aspects which may inter-
fere with the system’s behavior:
(i) update an estimate upon flow acceptance - update the rate estimates at each �?Î according to
the mean or peak rate of accepted flows leads to a more conservative AC as new incoming
rates are considered without pondering the compensation effect of departing flows. This
effect tends to be more notorious when���+�
increases as the �²Î estimation update reflecting
the real network conditions, sent by the monitoring module, is provided later. Keeping
rate estimates ( 01 ��� � ) unchanged during���+�
irrespective of flows acceptance, explores
this compensation effect but may increase overacceptance and lead to more QoS violations
in all the service classes. This was verified through simulation results, where the mean
number of active flows and the utilization obtained for���=�
=60s (labeled 60-nadj in Figure
7.28)24 and the QoS behavior of the service classes (illustrated in Figure 7.30) confirm this
tendency. The evolution of the number of active flows in both cases (illustrated in Figure
7.31) shows a longer cyclic behavior when 01 �2� � is not adjusted. This interesting side
effect results from consecutive�b���
intervals where the acceptance status is kept unchanged.
When the rate estimation exceeds its target and/or QoS degradation is sensed, the system
23A flow signaling process with explicit “teardown”, i.e., where flows’ departure is explicitly known, allows todecrement the rate estimate when a flow terminates. This may bring more stability to the mentioned system behavior.
24Although the concave tendency of SC1 and SC2 curves is visible, it is important to highlight that the smallinflection of SC1 (60-nadj) utilization curve corresponds to a 100% increase.
179
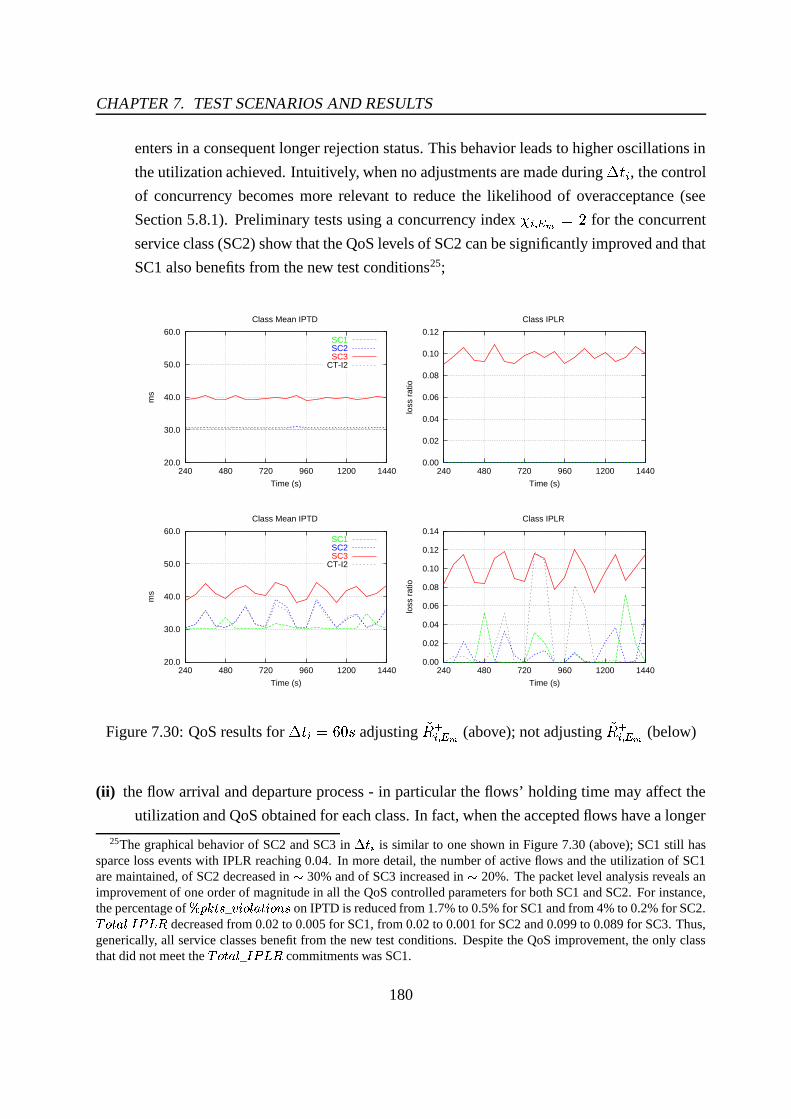
CHAPTER 7. TEST SCENARIOS AND RESULTS
enters in a consequent longer rejection status. This behavior leads to higher oscillations in
the utilization achieved. Intuitively, when no adjustments are made during�b�B�
, the control
of concurrency becomes more relevant to reduce the likelihood of overacceptance (see
Section 5.8.1). Preliminary tests using a concurrency index È �2� �� � Àfor the concurrent
service class (SC2) show that the QoS levels of SC2 can be significantly improved and that
SC1 also benefits from the new test conditions25;
20.0
30.0
40.0
50.0
60.0
240 480 720 960 1200 1440
ms
Time (s)
Class Mean IPTD
SC1SC2SC3
CT-I2
0.00
0.02
0.04
0.06
0.08
0.10
0.12
240 480 720 960 1200 1440
loss
rat
io
Time (s)
Class IPLR
20.0
30.0
40.0
50.0
60.0
240 480 720 960 1200 1440
ms
Time (s)
Class Mean IPTD
SC1SC2SC3
CT-I2
0.00
0.02
0.04
0.06
0.08
0.10
0.12
0.14
240 480 720 960 1200 1440
loss
rat
io
Time (s)
Class IPLR
Figure 7.30: QoS results for�b��� ��,���/
adjusting 01 �2� �� (above); not adjusting 01 ��� �� (below)
(ii) the flow arrival and departure process - in particular the flows’ holding time may affect the
utilization and QoS obtained for each class. In fact, when the accepted flows have a longer
25The graphical behavior of SC2 and SC3 in § G e is similar to one shown in Figure 7.30 (above); SC1 still hassparce loss events with IPLR reaching 0.04. In more detail, the number of active flows and the utilization of SC1are maintained, of SC2 decreased in x 30% and of SC3 increased in x 20%. The packet level analysis reveals animprovement of one order of magnitude in all the QoS controlled parameters for both SC1 and SC2. For instance,the percentage of î�..iAGJ· _ �o§¨ ¦�H¥²G¨§¨ T©�· on IPTD is reduced from 1.7% to 0.5% for SC1 and from 4% to 0.2% for SC2.� TG9¥Þ�l���5¬E< decreased from 0.02 to 0.005 for SC1, from 0.02 to 0.001 for SC2 and 0.099 to 0.089 for SC3. Thus,generically, all service classes benefit from the new test conditions. Despite the QoS improvement, the only classthat did not meet the
� TG9¥Þ� _ ���5¬E< commitments was SC1.
180
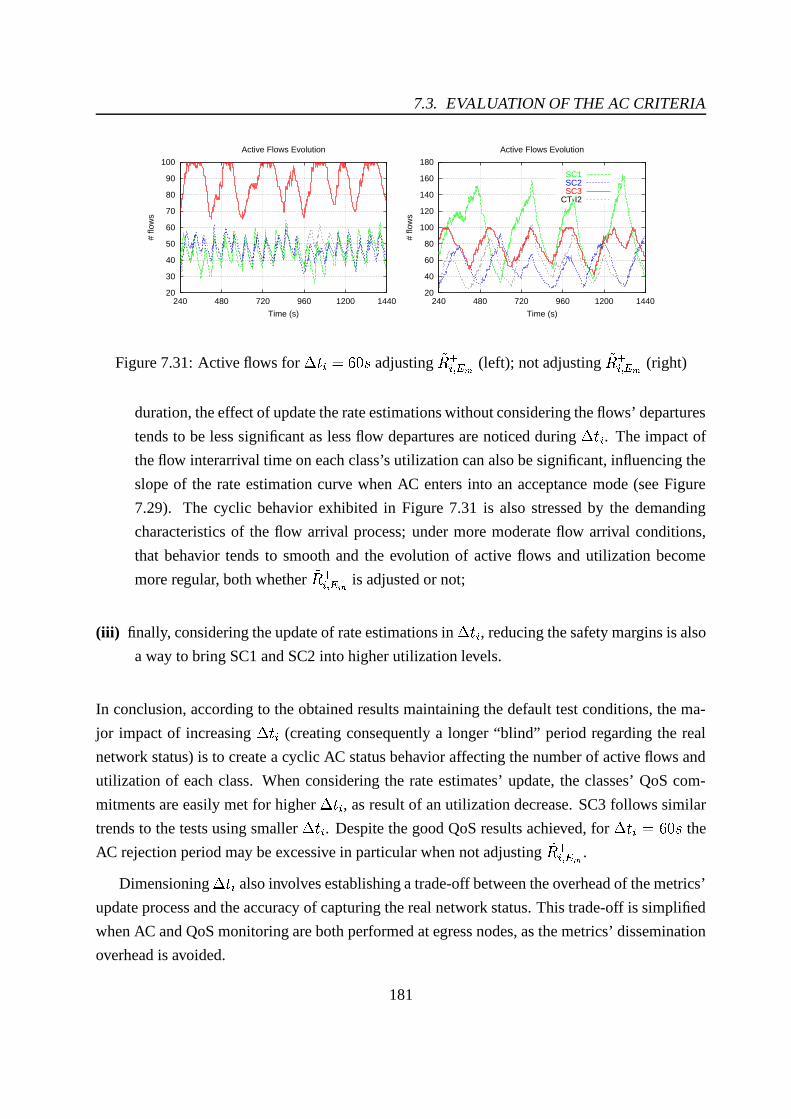
7.3. EVALUATION OF THE AC CRITERIA
20
30
40
50
60
70
80
90
100
240 480 720 960 1200 1440
# flo
ws
Time (s)
Active Flows Evolution
20
40
60
80
100
120
140
160
180
240 480 720 960 1200 1440
# flo
ws
Time (s)
Active Flows Evolution
SC1SC2SC3
CT-I2
Figure 7.31: Active flows for�b��� � ,���/
adjusting 01 ��� � (left); not adjusting 01 ��� � (right)
duration, the effect of update the rate estimations without considering the flows’ departures
tends to be less significant as less flow departures are noticed during���B�
. The impact of
the flow interarrival time on each class’s utilization can also be significant, influencing the
slope of the rate estimation curve when AC enters into an acceptance mode (see Figure
7.29). The cyclic behavior exhibited in Figure 7.31 is also stressed by the demanding
characteristics of the flow arrival process; under more moderate flow arrival conditions,
that behavior tends to smooth and the evolution of active flows and utilization become
more regular, both whether 01 ��� �� is adjusted or not;
(iii) finally, considering the update of rate estimations in���=�
, reducing the safety margins is also
a way to bring SC1 and SC2 into higher utilization levels.
In conclusion, according to the obtained results maintaining the default test conditions, the ma-
jor impact of increasing�����
(creating consequently a longer “blind” period regarding the real
network status) is to create a cyclic AC status behavior affecting the number of active flows and
utilization of each class. When considering the rate estimates’ update, the classes’ QoS com-
mitments are easily met for higher�b���
, as result of an utilization decrease. SC3 follows similar
trends to the tests using smaller���+�
. Despite the good QoS results achieved, for���=� � ,���/
the
AC rejection period may be excessive in particular when not adjusting 01 ��� �� .
Dimensioning�����
also involves establishing a trade-off between the overhead of the metrics’
update process and the accuracy of capturing the real network status. This trade-off is simplified
when AC and QoS monitoring are both performed at egress nodes, as the metrics’ dissemination
overhead is avoided.
181

CHAPTER 7. TEST SCENARIOS AND RESULTS
In summary, considering the test scenarios presented previously, a smaller���T�
may be prefer-
able to take advantage of the good compromise among network utilization, QoS and stability
achieved.
7.4 Comparison with other AC approaches
From a conceptual point of view, an extensive comparison of the proposed AC model with cur-
rent measurement-based AC approaches has been detailed in Section 5.7.3. Carrying out a strict
comparison in quantitative terms is rather hard to achieve for several reasons. Although having
in common some principles (being measurement-based), the AC approaches are mostly distinct
as regards their scope and the network variables that are kept under control. Therefore, repro-
ducing identical test conditions to allow that comparative study would imply to implement those
approaches (not always available), which falls outside the scope of this work.
Generically, every AC proposal includes a debate of performance aspects related to the so-
lution. However, the test conditions are usually very specific considering evaluation scenarios
difficult to compare to the ones defined in this work. Regarding the test platform and study
of cross traffic impact, [147] presents an approximate test topology to the one supporting the
present study, but it is mainly focused on single class environments and the control of SLSs is
not covered. Other studies are dedicated to survey and compare the performance of MBAC al-
gorithms [99, 105], or the performance of EMBAC solutions [106]. However, these studies have
to be well-delimited as regards the comparisons carried out. For instance, their concerns focus
on a single node perspective, evaluate few performance parameters (e.g., loss vs. load) or do not
study multiclass environments deeply. As far as the control of SLSs or the support of guaranteed
services are concerned, the comparison would have to include other type of AC proposals such
as BBs or DPS based strategies. The conceptual and practical divergence from these approaches
(see Section 3.3) and the lack of documentation reporting operational details make difficult their
implementation and comparison under similar test conditions.
In summary, the main objective of the performance evaluation carried out in this chapter was
to provide a proof-of-concept of the present AC proposal, identifying the critical aspects of the
model behavior and performance, highlighting as well aspects that deserve further research.
182

7.5. SCALABILITY ISSUES
7.5 Scalability issues
The scalability of the proposed AC model already debated within the QoS monitoring context
(see Section 4.4) is certainly an important topic to discuss and evaluate concerning its deployment
in real environments. The network dimension, the number of service classes 35Ú � and the number
of incoming flows and active flows are identified as the main variables to consider when studying
the scalability of an AC proposal. These aspects are serious constraints when the network keeps
per-flow state information and/or the AC decisions involve all network nodes along the data
path [23, 111]. When AC takes an SLS as reference, the number of existing SLSs should also be
considered as a variable with impact on scalability [12].
It is important to recall that performing edge-to-edge QoS control, embedding SLSs control
within the corresponding service class and keeping the amount of state information and signaling
reduced (see Section 5.7) are properties which increase the model’s resilience to scalability prob-
lems. Despite its potential ability to scale, studying the model’s scalability using more complex
simulation scenarios is an important issue suggested as topic for future work. As an initial step
for that debate, a summary identifying the impact that large-scale environments may have on
the proposed AC solution is highlighted in Table 7.8. Future work intends to sustain and extend
these initial considerations providing quantitative results on the topic.
Table 7.8: Issues on the AC model scalability
Main variables Scalability issues
Number of edge nodes involved:- impacts on edge state information and monitoring overhead
network dimension - may increase the need for handling concurrent ACCore complexity:
- no impact on model overhead- no significant impact expected on AC criteria efficiency
SCi state information at edge nodesnumber of SCi QoS monitoring overhead
Probing intrusion (if applicable)SLS state information at involved edge nodes
number of SLSs SLS utilization monitoring overheadNo impact on QoS monitoring overheadNumber of AC decisions
number of flows No impact on domain state informationTC at source domain ��� (if applicable)
183
CHAPTER 7. TEST SCENARIOS AND RESULTS
7.6 Summary
In this chapter, several test scenarios have been devised in order to evaluate two major compo-
nents of the proposed AC model: the QoS measurement methodology and the AC criteria. This
evaluation resorts to the simulation prototype of a multiclass network embedding the proposed
AC model, defined and configured in Chapter 6.
In more detail, the test scenarios for monitoring evaluation have been defined to pursue the
main objective of assessing the suitability and effectiveness of multipurpose in-band probing
patterns in measuring the defined QoS parameters. Several aspects of probing patterns such
as distribution, rate, color and packet size have been explored and tunned. In addition, a first
incursion in the evaluation of existing estimation mechanisms has been made. The test scenarios
for evaluating the AC criteria have been defined considering general and particular aspects likely
to influence the model performance, namely: (i) the initial assessment and tuning of the explicit
and implicit AC criteria; (ii) the impact of cross traffic on each service class; (iii) the safety
margins and thresholds; (iv) the influence of traffic characteristics and the measurement time
interval�����
. The obtained results have focused, whenever appropriate, on an analysis of the AC
model performance at class and packet levels.
Generically, the results show that the proposed AC model, using a two-rule AC criterion
defined on a service class basis, has been able to assure service level guarantees and achieve
high network utilization, without adding significant complexity to the network elements. The
use of systematic edge-to-edge monitoring and a controlled degree of overprovisioning revealed
to be essential design aspects contributing for reaching a good compromise between simplicity
and performance. A preliminary discussion on the AC model scalability issues has also been
launched, motivating further research on this topic.
A concluding analysis summarizing the more relevant results and contributions will be in-
cluded in the following chapter.
184

Chapter 8
Conclusions
This chapter provides a concluding review of the present research work. At first, an assessment
is carried out regarding to what extent the objectives outlined initially have been fulfilled, then
the main contributions of the thesis are presented and debated. Finally, possible future research
directions are pointed out.
8.1 Summary
The widespread use of high-speed networks, multimedia capable end-systems and the current
Internet popularity have fostered the development of multimedia applications highly demanding
in terms of network resources. To face this demand and support the coexistence of heteroge-
neous applications and services with distinct QoS requirements, the research community has
been contributing to enhance the TCP/IP stack with new protocols and service models. From the
network perspective, providing QoS brings an additional burden to the IP level. As new policy
rules and traffic control mechanisms have to be deployed, a major principle to preserve should be
keep it simple. The design of service-oriented networks based on CoS paradigm, where traffic is
aggregated in a limited number of classes according to its QoS requirements, pursues this prin-
ciple. To allow an efficient management of each class’s resources and fulfill SLS commitments,
lightweight AC mechanisms are convenient to keep classes under controlled load and assure the
required QoS levels with minor impact on network performance.
Considering the survey of current AC approaches provided in Chapter 3, it became evident
that despite the variety of existing proposals, the problematic of handling AC in CoS IP networks,
considering the simultaneous control of multiple intradomain QoS levels and interdomain SLSs
185

CHAPTER 8. CONCLUSIONS
in a simple and flexible way, is still an open issue. It is within this context that the motivation of
this work was raised, being its main objective defined as
achieving an encompassing, flexible and lightweight AC model able to control QoS
and SLSs in multiclass and multidomain environments.
Thus, taking simplicity, flexibility and easy deployment as initial goals, and considering the need
for on-line service monitoring and for traffic control at the network domain edges, a new service-
oriented distributed AC model has been proposed. The model resorts to feedback from edge-to-
edge on-line monitoring of relevant per-class service metrics to drive implicit and explicit AC
decisions. To improve the trade-off between service guarantees and complexity, the model relies
on the use of service-dependent levels of overprovisioning and QoS thresholds embedded in the
AC equations.
As stated in Chapter 1, a question that emerges from the model properties is whether the
defined AC rules driven by edge-to-edge on-line monitoring, without knowing details of the net-
work core, are able to control distinct service level guarantees and SLSs commitments properly.
Therefore, facing the conceptual and operational characteristics of the model,
exploring the challenges, effectiveness and efficiency of the distributed AC solution
based on on-line edge-to-edge monitoring in satisfying each service class commit-
ments and existing SLSs in a multiclass domain
has been defined as the proof-of-concept necessary to sustain the feasibility and contribution of
the devised AC proposal.
8.2 Reviewing objectives and results
Considering the main objectives of this work and the identification of the relevant interrelated
areas involved in the proposed AC model, namely service definition, on-line monitoring, AC al-
gorithms and CoS traffic characterization, a set of objectives was formulated in Chapter 1. These
objectives are here revisited and the main results obtained from their fulfillment are highlighted.
186

8.2. REVIEWING OBJECTIVES AND RESULTS
(i) To contextualize and clarify the underlying concepts of class-based IP networks
The proposed AC model is oriented to multiservice IP networks based on CoS paradigm. There-
fore, the first objective defined was performing a bibliographic review of the main concepts and
principles behind this paradigm to be used throughout this dissertation.
This objective was addressed in Chapter 2 where, after grounding the motivation for using
class-based QoS solutions, the theoretical background regarding the Diffserv model as a ref-
erence CoS model was provided both from a conceptual and practical perspective. The main
underlying principles of Diffserv, the model components and operation, the functionality of edge
and core nodes were explained.
(ii) To identify and structure the main issues and tasks subjacent to the definition and build-ing of network services both intra and interdomain
As service definition and deployment intra and interdomain is a key area of interest when devis-
ing a consistent multiservice AC proposal, the following topic addressed in Chapter 2 discusses
how to build services in Diffserv networks. The definitions and standardization efforts regarding
PHBs and PDBs were outlined and other main tasks required to support services were identi-
fied and layered in the data, control and management network operating planes. The next aspect
under study focused on the relevance of establishing standard SLA/SLS for domain QoS pro-
visioning, interdomain negotiation and end-to-end QoS delivery. Considering the outcome of
relevant works on this subject, an SLA/SLS template including the main service parameters and
their usual contents was proposed and the hierarchical relation between SLSs and the Diffserv
service building blocks established. The source and cascade business models for the support of
interdomain IP-based services were described, and the way SLSs are settled within these mod-
els and their main advantages and disadvantages were also discussed. Finally, a perspective on
additional SLSs deployment issues such as SLS control and auditing was presented.
(iii) To survey existing AC proposals, covering their main characteristics, advantages andlimitations
This objective concerns to the bibliographic review surveying current AC proposals. Having dis-
cussed the motivation to perform AC in multiservice networks, the survey carried out in Chapter
3 starts with an identification of multiple high-level aspects that distinguish existing AC ap-
proaches. Then, taking a service-oriented perspective, a detailed description of the main charac-
187

CHAPTER 8. CONCLUSIONS
teristics, advantages and limitations of those AC proposals provided a comprehensive analysis of
the current state-of-the-art in AC research area. Although the discussion embraced AC in IP net-
works following distinct QoS paradigms, the emphasis was given to proposals for class-based IP
networks. In more detail, centralized and distributed AC proposals oriented to either flow or hy-
brid or class-based QoS models, as well as measurement-based AC proposals based on passive
and active measurements were discussed. The role of the AC criterion regarding the trade-off
between service guarantees and resource usage, and the performance of common measurement-
based AC algorithms was also discussed. The analysis carried out under this objective grounded
the motivation for the present research study, pointing out the main strategic directions to achieve
an encompassing and lightweight AC model for CoS IP networks.
(iv) To identify and study the main issues and recent developments related to the problem-atic of QoS and SLS monitoring
The proposed AC model resorts to feedback from systematic edge-to-edge on-line monitoring to
control QoS and SLSs. Thus, a bibliographic review covering conceptual and practical aspects
of the problematic of QoS and SLS monitoring is of major importance. This objective was
addressed in Chapter 4, where an in-depth discussion of the recent developments in this research
area was carried out. Starting by a high-level presentation of relevant characteristics of today’s
monitoring systems, the main aspects covered in that discussion include:
: identification of relevant QoS and SLS metrics - both the ITU-T and the IETF IPPM WG
have devoted substantial efforts to this topic, trying to define a set of standard metrics
providing unbiased quantitative measures of Internet quality, performance and reliability.
In this way, the outcome of these works was studied and the proposed metrics identified,
classified and described considering the eventual distinct visions ITU-T and IPPM might
have;
: identification of adequate measurement methodologies and parameter estimation mecha-
nisms - the measurement methodologies were classified into passive and active and ex-
plained pondering their main advantages, disadvantages and suitability for edge-to-edge
measurements;
: identification of relevant high and low-level timing issues subjacent to an on-line monitor-
ing process.
188

8.2. REVIEWING OBJECTIVES AND RESULTS
Facing the additional challenges that multiclass networks pose to on-line QoS monitoring, spe-
cial attention was given to devise efficient monitoring solutions to be deployed in multiservice
CoS networks. Accomplishing this objective led both to the introduction of the concept - multi-
purpose probing pattern - which characterizes the ability of a single probing stream in capturing
simultaneously multiple QoS metrics of a service class, and to the design of a new probing source
and policer/marker scheme to improve multipurpose QoS estimation. The evaluation of the ad-
equacy and effectiveness of a multiclass and multipurpose active measurement methodology in
sensing each class’s behavior was carried out in Chapter 7.
The discussion on monitoring issues ends with a debate on eventual scalability problems of an
edge-to-edge monitoring process, pointing out principles for improving monitoring scalability.
(v) To understand and characterize statistically the properties of Internet traffic under theCoS paradigm
The relevance of this objective lays on the need to understand the characteristics of network
traffic, both at flow and aggregate level, in order to help devising and parameterizing service-
oriented AC algorithms and configuring network services consistently. In addition, modeling
traffic sources properly is a crucial step to achieve simulation models that express the dynamics
and realistic behavior of networks and communication systems. This research topic has been
covered in [20], where the impact of fractal properties on network traffic is emphasized. In this
thesis, that work was further developed within the context of multiclass networks [19]. Although
a brief theoretical review of this research was addressed in Chapter 2 and several tests evaluating
the impact of traffic characteristics carried out in Chapter 7, finding formal relations and guide-
lines among the variables describing the traffic behavior and the parameterization of AC rules
was left for future study. At present, the safety margins and thresholds of AC rules were used to
accommodate the effects of more demanding traffic properties such as LRD.
(vi) To conceive and specify the proposed AC model for the control of QoS and SLSs inmultiservice CoS networks
The achievement of this main objective, addressed in Chapter 5, resulted in the definition and
specification of a service-oriented distributed AC model for managing QoS and SLSs in multi-
class and multidomain environments, based on feedback of edge-to-edge on-line monitoring. In
more detail, this main objective was tackled as follows:
189
CHAPTER 8. CONCLUSIONS
: the strategic issues considered of major relevance for devising the AC model were iden-
tified. These issues include the model’s ability to be multiservice, multidomain, simple,
flexible, efficient, scalable and easy to deploy in real environments. Their fulfillment was
discussed after describing the model conceptually;
: the model’s underlying ideas were presented. Mainly, one idea was to take advantage of
the need for on-line QoS and SLS monitoring in today’s networks and use the resulting
monitoring information to drive distributed AC. The use of service-dependent overpro-
visioning levels to simplify AC, widening the range of service guarantees supported by
monitoring-based AC, was other relevant idea behind the model design;
: the initial assumptions were stated in order to clarify the positioning and operation of the
AC model;
: the model architecture, interrelating research outcome from service definition, monitoring,
traffic characterization and AC, was presented;
: a generic description of the model operation both intradomain and end-to-end was provided
to clarify its more detailed specification;
: the main components of the model were specified using an expressive notation introduced
for that purpose. For a multiclass domain, the ingress and egress nodes, the supported
service classes and controlled QoS parameters, the negotiated upstream and downstream
SLSs and the corresponding fields, the flows and its requirements were considered as key
entities;
: the AC criteria were defined and specified in order to cover both explicit and implicit AC. In
more detail, rate-based SLS control rules and QoS control rules for intradomain operation,
and cumulative QoS control rules for interdomain operation were defined. These rules
incorporate service-dependent overprovisioning levels, safety margins and thresholds;
: the state information and signaling required for the model operation were debated and
alternative AC scenarios to reduce the overhead of both aspects were suggested. In partic-
ular, a debate on the advantages and disadvantages of decoupling AC between ingress and
egress nodes was carried out;
: the major conceptual virtues and hurdles inherent to the proposed AC model were identi-
fied and discussed. Conceptually, the model was compared to other existing AC proposals
190

8.2. REVIEWING OBJECTIVES AND RESULTS
to further highlight its characteristics. Considering the difficulties pointed out, in particular
for the problematic of handling concurrency in distributed AC models, several approaches
to minimize the eventual occurrence of over or false acceptance were suggested. While the
main virtues of the model are evinced in the section describing the main contributions, the
difficulties deserving further study are discussed as part of future research topics.
(vii) To implement a simulation prototype of the proposed AC model covering a single mul-ticlass domain
This objective is a natural step that precedes the validation of the AC model. The use of a sim-
ulation prototype allows a flexible evaluation and improvement of the AC model functionality.
Accomplishing this objective, addressed in Chapter 6, led to the identification and discussion
of the main implementation aspects concerning the evaluation of the AC criteria and the mon-
itoring process. These aspects involve the definition of the service classes’ characteristics and
control policies, the identification of the QoS and SLS metrics to control, the corresponding
measurement methodologies and the parameterization of the AC criteria. The conceptual and
practical decisions made took as input the research outcome deriving from the achievement of
the objectives discussed above.
Regarding the development of a simulation prototype of a multiclass domain embedding the
proposed AC model, the choice of NS-2 as a simulation platform was justified and the main
characteristics of the developed simulation model presented. These include the model’s internal
structure, the simulation topology, the source models, the services’ configuration and AC config-
uration. The steps toward the validation of the simulation model were also discussed. The new
functions required to support particular aspects of the AC model under evaluation were defined
and added to the NS-2 libraries.
(viii) To provide a proof-of-concept of the proposed AC model
The proof-of-concept of the proposed AC model has as main target the performance evaluation
of the AC model, assessing its ability to self-adapt to network dynamics and to assure QoS and
SLS commitments in a multiclass domain efficiently. A second objective consists of assessing
the suitability and effectiveness of multipurpose in-band probing patterns in measuring the QoS
parameters of the defined service classes, while reducing network overhead and intrusion side
effects. These objectives, covered in Chapter 7, involved planning relevant test scenarios intend-
ing to explore different aspects which may influence the performance of the AC model and of
191

CHAPTER 8. CONCLUSIONS
the QoS monitoring process, demonstrating their behavior under distinct test conditions.
Starting by the evaluation of the multipurpose active measurement methodology, the devised
test scenarios explored multiple aspects of probing patterns such as probing distribution, rate,
precedence (color) and packet size when estimating simultaneously one-way delay, jitter and loss
related metrics. The main results on the measurements’ accuracy, when comparing the probing
and real traffic measurement outcome, are the following:
: common probing patterns for systematic measurement (e.g., Poisson traffic with light prob-
ing rates of 2 or 4 UDP pps) capture closely both the shape and scale of IPTD metric,
however, they fail to sense and measure ipdv and IPLR properly. In particular ipdv, being
a consecutive packet measure sensitive to probing gaps, is clearly overestimated and most
of IPLR events are missed unless heavy loss occurs. These results suggest the use of al-
ternative probing patterns with, for instance, higher rates and/or distinct drop precedence
marks;
: generically, a probing rate increase leads to an improvement in the accuracy of QoS metrics
estimation. This improvement is, however, rather dependent on each class characteristics
and on the metrics being estimated. Furthermore, the trade-off between the estimation ac-
curacy and probing overhead may be prohibitive, and even high probing rates were unable
to match both the scale and shape of metrics such as IPLR. This has motivated exploring
alternative or complementary probing features capable of increasing multipurpose active
monitoring efficiency. From the tested probing characteristics, the results have shown
that the dropping action of active queue management mechanisms on colored probes can
influence the probing measurement outcome significantly. Red probing packets strongly
improve the detection of loss events worsening IPTD estimation slightly. Interleaved color
schemes have exhibited a better compromise, which has proved to be particularly relevant
in service classes oriented to elastic traffic, where simultaneous estimation of IPTD and
IPLR has only been achieved with an interleaved colored probing stream. As regards the
probing packet distribution, a new hybrid on-off source, which allows to generate more
flexible probing streams with more controlled number of probing events and probing gaps,
has been proposed. The resulting probing streams, especially conceived to improve ipdv
estimation, when complemented by a proper coloring scheme can also improve the esti-
mation of the other metrics;
: the coloring scheme of probes is even more relevant when TCP probing is used, as the TCP
192

8.2. REVIEWING OBJECTIVES AND RESULTS
probing stream might be rather bandwidth consuming when green probes are used. The
coloring scheme is relevant to control both the accuracy of the estimate and the probing
overhead. The results have shown that an interleaved color TCP probing pattern leads to a
good compromise between accuracy and overhead.
Regarding the evaluation of the AC criteria, the devised test scenarios explored general and par-
ticular aspects likely to influence the model’s performance. In more detail, the tests covered:
(i) an initial assessment and tuning of the explicit and implicit AC criteria; (ii) studying the im-
pact of cross traffic on each service class; (iii) adjusting the safety margins and thresholds of
the service-dependent AC equations; (iv) studying the influence of flows’ traffic characteristics
and of the measurement interval�b���
on the results. The obtained results contemplating, when-
ever appropriate, an analysis of the AC criteria performance at class and packet level, are the
following:
: the initial assessment of the model’s performance has demonstrated that the self-adaptive
behavior inherent to on-line measurements combined with the proposed AC rules is ef-
fective in controlling QoS and SLS commitments of each service class. The obtained
measures of IPTD, ipdv and IPLR for the defined service classes exhibited a very stable
behavior regarding the pre-defined QoS thresholds. IPLR was the most difficult metric
to keep tightly controlled in each���+�
, triggering the QoS control rule more frequently.
The total IPLR achieved is in-line with the defined threshold and the percentage of QoS
violations at packet level was very small for all classes and in special for the most demand-
ing one. The bandwidth share configured for each class was well accomplished, and the
overall utilization obtained was very high. The implicit AC criteria on adaptive traffic was
redefined, being proposed the use of the QoS control rule neglecting the control on SLS
rate;
: the presence of cross traffic, i.e., traffic impacting on the domain’s load and QoS without
being explicitly measured, represents a bigger challenge for the AC criteria making evident
the relevance of the two defined AC rules. In fact, for explicit AC, the SLS rate control
rule assumes a preponderant role in controlling the traffic load and indirectly QoS in sit-
uations involving concurrent traffic. In the presence of unmeasured cross traffic, the QoS
control rule is decisive to assure the domain QoS levels. As in real environments the two
situations are likely to occur simultaneously, the two complementary rules increase the
domain capabilities to guarantee service commitments. In addition, knowing which AC
193

CHAPTER 8. CONCLUSIONS
rule has been more influent brings relevant inputs for improving service configuration and
provisioning both intra and interdomain. The importance of using a conservative degree of
overprovisioning for more demanding classes became also evident in the presence of cross
traffic;
: increasing the safety margins to avoid QoS violations at packet level has resulted in a con-
sistent decrease of each class utilization and number of accepted flows, and an increase
of blocking probabilities. The class with adaptive traffic takes clear advantage of unused
resources, showing an opposite behavior, i.e., increasing its utilization levels. Generically,
the tests with different QoS thresholds have revealed the capacity of the AC criteria in
bringing the QoS levels of each class to the established thresholds. Relaxing the IPLR
threshold and tightening the IPTD one has resulted, however, in more QoS threshold vio-
lations at packet level;
: regarding the impact of traffic characteristics on the performance of AC criteria, the flow
rate, the flow interarrival and holding times revealed to be the most influent variables, af-
fecting the global and each service class utilization, the flow blocking probabilities, the
network model dynamics and the rate estimation mechanisms. According to preliminary
results regarding the AC fairness on concurrent flows with distinct characteristics, the sys-
tem exhibited a consistent and fair behavior;
: the measurement time interval�b���
has a visible and measurable effect on the AC model
behavior. Increasing�����
creates a longer “blind” period regarding the real network status,
causing a cyclic behavior on the model operation and a decrease on each class utilization.
When exploring the impact of increasing���+�
in more detail, two aspects have been iden-
tified as interfering significantly with this behavior which are: (i) update or not the rate
estimates at each ingress upon a new flow acceptance; (ii) the characteristics of the flow’s
arrival and departure process. In particular, when rate estimates are not updated, the impact
of enlarging�����
on the utilization increase is notorious; nevertheless, acceptance/rejection
cycles are longer. Regarding the QoS behavior, the service commitments are met for higher���¶�with exception of the cases where rate estimates are not updated and overacceptance
occurs;
: generically, the proposed multiservice AC model has been able to establish a good com-
promise between simplicity, service level guarantee and network resource usage, even for
194

8.3. MAIN CONTRIBUTIONS
services with strict QoS requirements. Through the proposed service-dependent AC rules
and safety margins, service requirements and commitments have been efficiently satisfied
or bounded, proving that the simplicity and flexibility of the model can be explored to
control successfully the quality of multiple Internet services.
(ix) To perform an analysis of the proposed AC model, reflecting on future research steps
The achievement of this objective corresponds to the topics addressed along this chapter.
8.3 Main contributions
Taking into account the initial objectives and obtained results, the main contributions of this work
are summarized below.
: Design and definition of a new AC model for multiservice class-based IP networks - A
new encompassing and lightweight AC model for the control of QoS and SLSs in multi-
service networks based on the CoS paradigm has been devised [11, 12, 13, 10, 14] having
as major properties: (i) distributed control of domain QoS levels and negotiated SLSs be-
tween domains; (ii) self-adaptive behavior resorting to feedback from edge-to-edge on-line
monitoring; (iii) abstraction from network core heterogeneity and complexity through an
edge-to-edge QoS vision, i.e., involving only edge nodes; (iv) support of distinct service
assurance levels and applications requiring either implicit or explicit AC; (v) ability to op-
erate both intradomain and end-to-end with reduced state information, signaling, latency
and intrusion; (vi) flexibility to accommodate the evolution of applications, services and
technologies, and possible enhancements of AC algorithms and monitoring strategies. The
conceptual and operational properties characterizing the proposed AC model, which con-
stitutes a novel approach to the problematic of AC in class-based IP networks, corroborated
by performance evaluation results, are the principal contributions of this work.
: Definition of service-dependent AC criteria - The proposed AC criteria are based on two
complementary rules - QoS control rule and SLS rate control rule - for intradomain oper-
ation and on an end-to-end control rule. These rules are parameterized according to the
service type to be provided. In this way, the concepts of service-dependent overprovi-
sioning levels, safety margins and thresholds have been introduced and concretized in the
195
CHAPTER 8. CONCLUSIONS
rules in order to allow a flexible and efficient, yet simple, operation of the AC model. For
instance, larger safety margins and tighter thresholds can be applied for more demanding
classes. The AC rule defined for end-to-end operation considers AC as a repetitive and
cumulative process of available service computation. As regards rate control and QoS esti-
mation, the applicability of algorithms and mechanisms usually used within a single node
context have here been extended to edge-to-edge multiclass environments.
: Notation to specify AC model entities, rules and operation - An intuitive and expressive
notation based on the set theory has been introduced in order to specify the main network
domain entities concerning multiservice AC, SLSs and QoS management [11]. This no-
tation includes indexes reflecting the involved service classes, ingress and egress nodes.
As the model is class and edge-to-edge based, this approach enriches the notation seman-
tically while keeping it intuitive. In particular, considering a generic domain comprising
multiple ingress and egress nodes, the following entities have been considered and spec-
ified: (i) service classes; (ii) upstream SLSs; (iii) downstream SLSs; (iv) traffic flows.
The network resources have been implicitly considered and controlled by the edge-to-edge
monitoring process. Resorting to the proposed notation, the service-dependent AC criteria
and the model operation both intra and interdomain have been specified. As a final remark,
a matricial definition of accepted SLSs based on their scope has been introduced and its
potential in identifying the expected ingress-to-egress traffic load and downstream SLSs
utilization, useful for intra and inter domain service provisioning, has been highlighted.
: Proposals for handling concurrent AC - Distributed AC models may involve multiple
nodes making concurrent AC decisions. In order to tackle the eventual over or false accep-
tance deriving from concurrent AC, several alternative or complementary solutions have
been suggested. These proposals include (i) the definition of a per-class concurrency in-
dex; (ii) a token-based system; (iii) a rate-based credit system controlled by egress nodes
[15].
: Introduction of multipurpose active monitoring concept - This concept, proposed in the
context of multiclass on-line monitoring, reflects the ability of a single probing pattern
to capture multiple QoS metrics of a service class simultaneously. In fact, multiclass IP
networks open new dimensions and demands on active monitoring as efficient strategies of
in-band probing are required to sense each class’s performance without causing noticeable
side effects on real traffic. Hence, achieving light and multipurpose probing patterns is an
important step to reduce overhead and interference of on-line active monitoring. The work
196

8.3. MAIN CONTRIBUTIONS
reported in [16, 17] focuses on finding and tuning per-class multipurpose probing patterns
so that each class behavior is correctly captured, even if more than one QoS metric is under
control.
: Design and development of a new multipurpose colored probing scheme - This novel pro-
posal aims at improving the effectiveness of multipurpose active monitoring. In this way,
a flexible on-off probing source regulating both the occurrence of probing events and the
time gap between consecutive probes within an event has been devised to improve the es-
timation of delay-based metrics. Moreover, an approach of coloring probes using a single
color or interleaved color scheme has also been explored in this thesis to improve loss es-
timation. For this purpose, a new policer/marker able to mark packets with an interleaved
color scheme has also been developed [16].
: Proposal of an SLA/SLS template and additional insights on corresponding management
tasks - Considering previous work on SLS definition (see Section 2.2), an integrated SLA/SLS
template including its relevant parameters and typical contents has been defined. Addi-
tional SLS deployment issues such as SLS control and auditing have also been debated
[14]. In this context, as further highlighted and developed in [11], two relevant aspects of
the proposed AC model regarding SLSs management are: (i) the suitability of ingress-to-
egress QoS monitoring for SLS auditing purposes; (ii) the QoS control of accepted SLSs
(and respective flows) for a service class embedded within the corresponding class QoS
control performed at egress nodes. This simplifies the monitoring process and improves
scalability as QoS control is performed per-class and not per-SLS. New ongoing work
respects to SLS processing and validation [18].
: Definition of a traffic classification criteria and first results on CoS traffic characterization
- following the work initially carried out in [20], in [19] the problematic of traffic classi-
fication into distinct service classes has been introduced, a traffic classification criterion
has been proposed and the statistical properties of each service class traffic aggregate have
been analyzed following the concepts of fractal theory. This characterization work has
resorted to real traffic traces collected at an University of Minho’s major backbone router,
during distinct periods of network activity.
: Comprehensive survey encompassing both conceptual and practical issues on major areas
supporting the proposed AC model - In this survey the following contributions in each area
are highlighted: (i) multiservice class-based networks - their principles, components and
197
CHAPTER 8. CONCLUSIONS
operation mode have been discussed and the relevant tasks involved in building up ser-
vices identified and layered into distinct network operating planes; (ii) AC in multiservice
networks - the high-level characteristics which distinguish AC proposals have been iden-
tified and a service-oriented debate appraising the most relevant AC proposals has been
provided. The main characteristics subjacent to these proposals have been summarized in
a table to facilitate their comparison; (iii) QoS monitoring - the main characteristics and
challenges of today’s monitoring systems have been identified and discussed. Considering
the vision of distinct working groups on the topic, relevant metrics of Internet quality, per-
formance and reliability have been identified, classified and described, providing a clearer
understanding of their meaning and purpose. The most relevant measurement methodolo-
gies and parameter estimation mechanisms have been presented and discussed, debating
also timing related issues; (iv) traffic characterization - the motivation for new research
on traffic characterization and modeling under the new paradigm of CoS aggregation has
been presented and relevant aspects to characterize traffic both at flow and aggregated level
identified.
The main contributions regarding model implementation and performance evaluation are high-
lighted next.
: Development of an AC model prototype - A simulation prototype comprising a multiclass
domain controlled by the proposed AC model has been developed. The configuration of all
entities involved such as the service classes and traffic sources, the monitoring decisions
and the AC rules has been carefully established considering and interrelating realistic in-
puts and guidelines from the related research areas. In addition, to support the model
implementation, new functions have been added, or extended, to NS-2 libraries, such as
the simultaneous support of multiple TCP flows, multimetric QoS egress monitors, specific
probing sources and an interleaved color policer/marker.
: Expertise deriving from the AC model evaluation – The ability to perform an effective
distributed control of QoS and SLSs using feedback from edge-to-edge on-line monitor-
ing has been proved. The results have shown that the proposed multiservice manage-
ment scheme establishes a good compromise between simplicity and efficiency, allowing
to satisfy effectively distinct service level commitments, while achieving high network
utilization. Furthermore, the usefulness and the context of applicability of the two com-
plementary AC rules defined have revealed to bring relevant information and directions for
198

8.4. TOPICS OF FUTURE WORK
improving service configuration and provisioning both intra and interdomain. Establishing
service-dependent overprovisioning levels, especially for more demanding service classes,
has also proved to be crucial to allow using monitoring-based AC systems in multiservice
networks. Finally, regarding the monitoring process itself, the challenges and the viability
of multiclass and multipurpose active monitoring approaches have been explored.
8.4 Topics of future work
From the analysis carried out along this work, several topics have been identified as deserving
further research. A first set of topics derives directly from the assumptions, decisions and proce-
dures followed in the definition of the present AC proposal. Covering these topics may improve
particular aspects of the proposed solution or extend them. Thus, in addition to the discussion in
Section 5.8, interesting issues are:
: further develop the process of metrics computation and dissemination - the choice of
a light, effective and reliable process for computing and disseminating QoS metrics in
real environments is an aspect requiring further study. Although active measurements are
particularly suitable for edge-to-edge metrics’ computation, alternative or complementary
schemes to compute and provide measurements to edge nodes can be explored (e.g., the
use of passive measurements, the combination of hop-by-hop measures, the use of QoS
metrics provided by routing protocols). For the dissemination of metrics, evaluating the
performance of solutions based on, for instance, ICMP, routing updates or SNMP may
be useful. The use of multicast IP, where edge nodes can be member of specific network
monitoring groups, may also be considered to achieve an efficient metrics’ distribution;
: scalability analysis and end-to-end performance - future work intends to sustain and ex-
tend the obtained results of model evaluation to more complex network topologies and
test scenarios, involving also multiple domains and SLSs. Considering the preliminary
analysis of the main variables influencing the scalability of an AC proposal, summarized
in Table 7.8, quantitative results should also be provided. Although the model’s end-to-
end behavior has been conceptually debated, evaluating the end-to-end performance across
multiple domains and the effectiveness of the AC decision rule given by Eq. 5.12, deserves
further investigation;
199

CHAPTER 8. CONCLUSIONS
: handling concurrent AC - although the problem of concurrent AC has been here subject
of study, an in-depth analysis of the proposed solutions’ performance reflecting on their
implementation costs vs. service benefits is relevant;
: fairness of AC decisions - usually, MBAC and EMBAC have implicit a single decision
policy that tends to privilege small flows, flows with more relaxed QoS objectives and
flows that traverse smaller path lengths [99, 106]. Although not all of these cases apply
to the proposed AC model, studying the fairness of AC decisions involves defining a clear
and unambiguous criterion of fairness, and performing an analysis at flow level and/or at
SLS level to verify if fairness is accomplished. Improving the AC rules with additional
policies defined according to an established fairness criterion may be done in the future. In
particular, a progressive and proportional AC criteria (RIO-like AC), which would reduce
the privilege to small flows and the cyclic admission behavior in���B�
, could be explored.
AC algorithms alternative to the Measure Sum, including a more precise forecast of the
impact of accepting a new flow and/or formal relations between traffic characteristics and
AC equations’ parameters, could also be explored.
The following list comprises a set of more demanding and broader topics, pointing out future
research directions:
: policy-based management and security issues - in Chapter 1, several research areas have
been pointed out, and further developed in the following chapters, as relevant to devise a re-
alistic and consistent AC solution. The use of policy-based management and the inclusion
of security issues in the model have been left for future study. Examples of policy-based
management concepts applied to both AC and SLS contexts are proposed in [87, 225, 226].
In particular, specifying AC requests, SLS dynamic negotiation, definition and enforce-
ment of AC policies and systems’ configuration could benefit from policy-based manage-
ment. Thus, exploring the advantages and disadvantages of its use in the management of
the entities and decisions involved in the proposed AC solution and to support the configu-
ration and operation of the model is a topic to be covered1. The inclusion of functions and
state information related to security aspects regarding service usage, such as authentica-
1As an example, the paradigm and protocols behind policy-based management, such as COPS and COPS-PR,has the advantage of allowing a level of abstraction between the policy rules to apply and the devices configurationdetails, creating a normalized interface between the management decision entities and the managed entities. Theamount of signaling involved is a possible disadvantage.
200

8.4. TOPICS OF FUTURE WORK
tion, authorization and accounting [227] and denial of service attacks, is also an important
research topic related to AC;
: dynamic negotiation of SLSs and SLS AC - having tackled the problem of flow AC, the
proposed model may be extended to cover dynamic SLS negotiation and SLS AC. In fact,
as stated in Section 5.1.1, flow and SLS AC involve considering similar variables, such
as traffic profile and QoS objectives, being this last one bounded by the service class QoS
levels. However, the time and space granularity upon which the decision is made, the do-
main state information that sustain the decision, the new state information to keep and the
need to (re)configure the network elements involved are distinct. As an example, SLS AC
should not be sustained only by on-line monitoring information but also by less transient
information such as load forecasting based on the matrix of accepted SLSs for the validity
period of the new SLS. The challenges and changes required to support this topic may be
explored in the future;
: bi-directional AC - the present study covers unidirectional AC, which is in-line with, for
instance, the definition of PHBs and PDBs. This should not be viewed as a conceptual lim-
itation of the model as bi-directionality can be decoupled in unidirectional AC instances.
In fact, a bi-directional SLS can be defined as two unidirectional SLSs [69]. For the pro-
posed AC model, attending that an ingress node �ÞÎ maintains monitoring data for the pair
¹9�oÎ�ò¦ qÆ�½ and assuming that each edge node may be either an ingress or egress depending
on the flow’s direction, covering bi-directional AC may explore and take advantage of bi-
directional monitoring data located at each edge. The use of interdomain symmetric paths
clearly simplifies bi-directional AC;
: handling multicast and composite applications - multicast represents a challenge for AC
as traffic is replicated dynamically inside the network and it is difficult to know beforehand
how the multicast trees will expand. This behavior is a further motivation for the use of a
monitoring-based AC approach relying on systematic on-line monitoring, able to capture
intrinsically the network dynamics and load changes. Using more elaborate control strate-
gies and/or defining specific service classes and AC rules to handle multicast traffic flows is
also a future research topic. Extending flow AC to the application level should also deserve
attention giving that an application may encompass multiple interrelated flows requiring
admission. Leaving to composite applications the final AC decision following an applica-
tion dependent criterion based on flows’ admittance or extending AC model functionality
201

CHAPTER 8. CONCLUSIONS
is an aspect that needs to be pondered as the semantics’ enrichment in the AC model may
bring additional complexity and state information;
: handling route changes - the connectionless packet forwarding nature of IP clearly makes
difficult traffic control tasks and resource management as, in general, the entire route that
packets will follow is not known in advance, and the route may change during flows’ life-
time. As stated in Section 3.2, this is an aspect that increases the complexity and scalability
problems of strict AC proposals with state information closely tied to network topology,
routes and resource reservation, favoring measurement-based approaches. Especially in
the proposed AC model, intradomain route changes or route balancing are not particularly
troublesome due to the black box vision of the network core and adaptive nature of the
model. Handling interdomain path changes, which falls within the end-to-end AC per-
spective of the model operation, is particularly challengeable as the crossed domains and
the flow’s available service computation may change substantially. Despite the change
of interdomain routes may affect already accepted flows, and degradation may occur, this
problem is reduced by the fact that transit domains’ ingress nodes do not maintain per-flow
state information and ISPs’ neighboring tends to be rather stable. These considerations do
not avoid the need of more in-depth reasoning on this topic. Peering and AS-path infor-
mation collected by BGP and feedback mechanisms may be helpful for fast interdomain
service (re)negotiation and end-to-end service re-establishment;
: handling multipath options at domain boundaries - in the proposed model, unless AC is
decoupled between ingress and egress nodes, the topological, routing and service informa-
tion in the domain should allow to determine at network entrance the egress node which
will be used to leave the domain. Choosing the egress node ( èÆ ) and downstream SLS
( 3{463 ��� � ) to use when more than one possibility is available should be based on domain
policies to explore. In addition, assuring that all packets from a flow will use the same äÆand 3{4635��� �� selection, independently of following or not distinct intradomain paths, may
involve additional state information and registration of involved boundaries nodes. Note
that, this assurance may be provided at a higher level than the flow’s one, for instance,
at 35463 ��� 7 8 level. The use of other techniques, such as flooding of AC requests in distinct
boundaries ( qÆj½ for subsequent assessment and selection of the most favorable end-to-end
path, may also be explored in the future.
202
8.5. FINAL CONSIDERATIONS
: extending the proposed AC model to mobile environments - attending to a clear trend toward
mobility of users and devices, studying the viability, performance and migration issues of
the AC model to mobile environments, such as mobile IP and ad-hoc networks, is defi-
nitely a research direction for the present work. Mobile environments increase the changes
in topology and load conditions; thus, an important concern is to minimize convergence
time (e.g., efficient handoff and fast recovery from route instability, particularly in ad-hoc
networks). Several properties of the AC model such as its self-adaptive distributed nature,
the reduced control and state information required are likely to favor the model’s adequacy
to the dynamics inherent to mobility. Nonetheless, this issue needs further research.
8.5 Final considerations
This research work focused on multiple issues regarding the provision of QoS in IP networks. In
particular, the problematic of AC in multiservice class-based IP networks was the main subject of
research. As initially mentioned in this dissertation, there are no ubiquitous and perfect solutions
for a multidimensional problem as the one being addressed. Despite that, there was the intention
to endow the proposed AC solution with properties believed relevant for its feasibility in real
environments, balancing its underlying virtues and limitations. The topics pointed out as future
work, aiming at enhancing or extending the present AC proposal, reveal interesting research
directions remaining ahead.
203

CHAPTER 8. CONCLUSIONS
204

Appendix A
Summary of the Proposed Notation
Table A.1 summarizes the main components specified in Chapter 5, providing the definition and
a brief description of the notation proposed. This summary includes notation concerning:
: generic network domain entities;
: supported service classes and controlled parameters;
: negotiated upstream and downstream SLSs;
: traffic flows;
: matrices defined to aggregate data regarding
– accepted and active SLSs;
– QoS and SLS monitoring.
205

APPENDIX A. SUMMARY OF THE PROPOSED NOTATION
206

SUMMARY OF THE PROPOSED NOTATION
Table A.1: Model notation summary
Notation Definition DescriptionDomain Notation¢º� Current domain¢ >� Upstream domain¢ g� Downstream domain��� OA� Q S�� V S=Y�YZY�S��1ú [ Set of ingress nodes in domain ¢-��1� ;Ã��©Ù��³ Ingress node ©��� OA� Q S�� V S=Y�YZY�S���û"[ Set of egress nodes in domain ¢-�� ^ ;Ã��m��ü Egress node mService Class Notation¯+*5� O¦¯+* Q Sp¯+* V S+YZY�YZSp¯E*dýz[ Set of service classes supported in ¢-�¯+* e or § ;Ã��§Õ�üþ Service Class §�¥����� OÞE=� e � Q SJ� e � Q I�S+YZY�YZS=E0� e � Ü SU� e � Ü Il[ Set of controlled QoS parameter for ¯+* e� e � ¨ ;Ã�S.´�f� Target value of QoS parameter . for ¯+* e� e � ¨ Safety margin of QoS parameter . for ¯+* e� e � ¨ � e � ¨ �d� e � ¨ Threshold of QoS parameter . for ¯+* e used in AC equations
¯Ì¬õ¯ � ~��� � O¦¯Ì¬õ¯ e � " # Ø �1�Y³���� [ Set of accepted SLSs in ¢-� from upstream domains for ¯+* e¯Ì¬õ¯ e � "$# Accepted upstream SLS for ¯+* e connecting ¢ � through � �¯Ì¬õ¯ e � \ " # � ')( _ Accepted upstream ¯Ì¬õ¯ e � " # , considering � ^ ³ Scope< e � " # or < e � \ " # � � _ Negotiated rate for ¯¬õ¯ e � " # , independently of the domain � ^< e � \ " # � ')( _ Negotiated rate for ¯¬õ¯ e � " # , considering egress node � ^�< e � "$# Measured rate for ¯¬õ¯ e � "g# (estimated load)� e � " # Safety margin for < e � " # used in AC equations�¥��¸l�]�oÿ � # OA� e � " # � Q S=Y�YZY�S�� e � " # � Ü 2 [ Set of expected QoS parameters for ¯Ì¬õ¯ e � " #� e � " # � ¨ 2 ;Ã�S. � �Õ� � Target value of QoS parameter . �¯Ì¬õ¯ � ½����� O¦¯Ì¬õ¯ ge � ')( Ø � ^ ³����Þ[ Set of SLSs negotiated in ¢ � with downstream domains for ¯+* e¯Ì¬õ¯ ge � ')( Negotiated downstream SLS for ¯E* e leaving ¢�� through � ^< ge � ')( or < ge � \ �1� ' ( _ Negotiated rate for ¯¬õ¯ ge � '�( , independently of the domain ����< ge � ' ( Measured rate for ¯¬õ¯ ge � ' ( (estimated load)� ge � '�( Safety margin for < ge � ')( used in AC equations� ��¸l� ½�oÿ � ( OA� ge � ' ( � Q S+YZY�YZSD� ge � ' ( � Ü ½ [ Set of expected QoS parameters for ¯Ì¬õ¯ ge � ' (´³´¯¬õ¯ Traffic not supported by an SLS<-¶· ��¸l�e � " # or <&¶· ��¸l�e � ')( Rate limiting traffic not sustained by an SLS at ��� or � ^ for ¯+* e�<-¶· ��¸l�e � "$# Measured rate for traffic not sustained by an SLS at ��� for ¯+* e�d¶·e � "g# Safety margin for <�¶· ��¸l�e � "$# used in AC equationsFlow Notation� ± or � ± ³ä¯¬õ¯ e � "$# Flow
�belonging to an upstream SLS requiring AC� ± ´³´¯Ì¬õ¯ e � "$# Flow
�without a pre-defined upstream SLS requiring AC¤ ± Rate of flow � ± (peak or mean)�¤ e � \ " # � ')( _ Measured aggregated rate of flows between � � and � ^ for ¯E* e����� OÞE=� ± � Q S� ± � Q I�S+YZY�YZS=E0� ± � Ü 2 2 S� ± � Ü 2 2 Il[ Set of QoS parameter requirements for � ±� ± � ¨ 2 2 ;Ã�S. � � �Õ� � � Target value to QoS parameter . � �� ± � ¨ 2 2 Tolerance to parameter � ± � ¨ 2 2 degradation��° }¨} ~± � ¨ 2 2 Cumulative value for � ± � ¨ 2 2 when entering ¢ ���° }¨}± � ¨ 2 2 Cumulative value for � ± � ¨ 2 2 , including � e � ¨ of ¢ �
207

APPENDIX A. SUMMARY OF THE PROPOSED NOTATION
Table A.2: Model notation summary (cont.)
Notation Definition DescriptionSLS and QoS Matrix Notation¼ ��¸������� E0Á e � � I or E0Á e � \ ��� ^`_ I Matrix of accepted and active upstream SLSs for ¯+* eÁ e � � ¯Ì¬õ¯ e � " # Specific SLS matrix entryÁ e � \ ��� ^`_ ¯Ì¬õ¯ e � \ "$#�� ' ( _ Specific SLS matrix entry, considering � ^ ³è¯Ì¬õ¯ e � " # scope¼ ��¸���½��� � E0Á ge � ^ I Matrix of accepted and active downstream SLSs for ¯+* eÁ ge � ^ ¯Ì¬õ¯ ge � ')( Specific SLS matrix entry§6G e measurement time interval for ¯E* e¾ ¿vÀ ���� � Eoà e � \ ��� ^`_ I QoS monitoring matrix for ¯+* e in § G e for E=�1��SD� ^ I pairsà e � \ ��� ^`_ Specific matrix entry corresponding to E0� � SD� ^ I pairà e � � Specific matrix entry not dependent of � ^à e � ^ Specific matrix entry not dependent of � �à e � \ ��� ^`_ , �k¨ �� e � \ "$#7� ' ( _ � ¨ Measured QoS parameter . of �è����� for E0�1��S�� ^ I pairà e � \ ��� ^`_ , �;* _ ¯NG9¥²G¨£�· µ Ko� �;* _ ¯ÌG9¥oG¨£�· µ Ko� AC status for § G e considering all QoS parameters in � ��� ���@om _ 6��H T¡�· µ Ko� Number of admissible flows in §6G e for ¯+* e with implicit AC
208

Appendix B
AC Algorithms
This Appendix includes the description of several algorithms that support the explicit or implicit
AC decision process both intra and interdomain. This description, using pseudocode, considers
that:
: AC is carried out at ingress nodes �ÞÎ based on the complete set of equations defined in
Section 5.5;
: internal 35463 ��� 7 8 and 35463{��� � have been defined in the source and destination domains.
Covering this aspect simplifies the algorithms as they can be applied to source, destination
or transit domains, irrespectively;
: measured rate variables 01 �2� 7 8 , 01 �� (���(��� 7 8and 01 ��� �� included in the monitoring matrix
� �� ((�)�úare updated during
�����;
: all flows without a pre-defined upstream SLS requiring AC, i.e., � á �ù 35463 ��� 798 , are aggre-
gated within a specific 354 3 ��� 7 8 .
For implicit AC, new incoming flows need to be implicitly detected so that AC can take place.
Implicit AC algorithms are simpler as no verifications regarding the new flows’ traffic profile and
QoS requirements need to be performed. For implicit AC, oriented to elastic TCP traffic, it is
assumed that:
: the QoS and the optional rate control rules are complemented by an �èË�à _ � ß9Ï?Ñ´/�� ã ú vari-
able controlling the number of admitted flows within���=�
;
209

APPENDIX B. AC ALGORITHMS
: new flows are identified and controlled based on the detection and forwarding/discarding
of packets that initialize a TCP connection (SYN and SYN ACK).
The presented algorithms are possible proposals to implement and verify the set of QoS and rate
control rules defined in Section 5.5.
210

AC ALGORITHMS
Algorithm 1
This algorithm handles flows requiring explicit admission. Each new flow � á AC request is
processed at ingress node �²Î , after being classified and validated facing the requested service.
When valid, if ÓbÈ is the source domain then the corresponding ingress node identifier ���t��{ may
be kept for eventual TC configuration.
The variable �äÚ"Ó Ü N�É / É Ï?Ý is updated bitwise ¹��n½ according to the acceptance conditions or
rejection causes reported by AC rules. Based on its value, a flow � á is accepted and forward, or
rejected, being an AC request reply sent to source (and eventually processed at ���t��{ ). When the
destination is reached, the receiver accepts or rejects the AC request after verifying the flow’s
ÅL#iX Ï ZõÉ ß9Ü , 1 Ü�� j Ï 3 , j Ï 3*Å Ï�ßJÜ X�Û Ý N Ü , ��N�N�j Ï 3 fields. It may also propose to the source new
QoS parameter values within the flow’s acceptable tolerance range, updating � á QoS specifica-
tion accordingly.
211

APPENDIX B. AC ALGORITHMS
Algorithm 1: Explicit AC Decision �������������������� Î �"! á�#/* Ingress nodes process the incoming AC requests */(...)$ � �&%(' ��)+*,����-�.�/0� ! á�#$213$ ��� 7984%(' �656��70��-�.�/ $213$ � $ � � � � Î �"! á�# /* Considering8 Æ %(':9 ��� 8�;=< �����6� $ � � �"! á�>@? ��� �4U # � ! á �BA (���((�)�ú �BA (���( �(�)�ú #$213$ ��� � %C' �=5D��70�E-�.�/ $F1G$ � $ � � � 8 Æ4�"! á�# identify H ��� Î and H ��� Æ */I ��J���K�L,MN� <�O -E����-P�7Q� $ � � � $21G$ �2� 7J8 � $21G$ �2� �� �"! á�#R-�.F� ! áS> $ < K �VUUT ? È # �VJ���7� ! áW> � �t��{ #X%(' � Î/* At beginning of Y � � update Z ���`_ Î � Æ b > U�
_$ �V*=�E���
through��J���K�L\[UP $X$ �V*6���]�6� Z ���`_ Î � Æ b # ) */
�� ? ��KB-E��-P�7_^`� Z ���`_ Î � Æ b > U�_$ �V*=�E��� #
U� ? ��Ka-���-P�7_^b��J���K�L $213$X$ �V*=�E���D� H �2� Î � H �2� Æ � Z ��� Î � Æ �"! á >dc M < Pe.�-�)�� # U� ? ��Ka-���-P�7_^b��J���K�L, WKaK�[�P $ � $ � � �"! áW> �����f[�P $ �"! á�> [UP $ c P�)g� < *67hK�� �
! áW> WKaK�[�P $ #-�.F�� U� ? ��Ka-���-P�7_i
Accept# �jJ ��7
kml 5=*6�V���U*=�j� k ��* ; �6� Z ��� Î � ÆN�"! áW>nc M < Po.�-)g� #kml 5=*6�V�� SKpK�[UP $ � $ � � �"! á > WKaK�[�P $ #-�.q� $ KpP l ��i
External# �jJ ��7
/* optional information for downstream usage */I � ! áW> $213$ �VU #F%(' $213$ ��� � RI � ! áW>r? �VU #X%('s? È R! P <et * < 5=�������]�����p� ! áe#-�.F�� U� ? ��Ka-���-P�7_i
Reject# �jJ ��7
U�U��� l )+/]� ! á � U� ? ��Ka-���-P�7 #/* to ! á�> $ < K �4U �"! á�> � �t��{ */
(...)/* When the destination is reached */-�.F� ! á >u? ��� �VUUT 1 P�Kp*D)�v_Pe56� # �VJ���7
U� ? ��Ka-���-P�7 %(' ����Kp��-wD� < SKpK�� l �V*67hKp�� S) ; P < -�jJ O � ! á=#! âá %C' ����K���-w,� < vx� t [�P $ M < P l Po��*D)j� ! áo# U�U��� l )+/]� ! âá � U� $ �V*6���]� #
(...)
212

AC ALGORITHMS
Algorithm 2
This algorithm determines how a source and ingress node �l�t��{ process an AC reply to a previous
flow AC request. Note that, only these nodes process an AC reply, i.e., the reply is transparent
to transit ingress nodes. At �7�c�/{ , acceptance/rejection tables may be updated accordingly. These
tables can be used to control and avoid misbehaved sources, performing systematic AC requests
upon each rejection notification. In case of acceptance, TC configuration at ���c�/{ may occur using
� á L ÅL#iX Ï ZõÉ ß9Ü .Algorithm 2: AC Decision Notification Reception ������ l )+/0� ! á � �� $ �E*6�E��� #
(...)-�.F� ! áS> � �t��{ T 1 PeKp*D)+vqPe56� # �jJ ��7-�.F�� U� $ �E*6���]�Wi
Accept# �jJ ��7
�UP�7&.�- ; � < � c �y� ! áz>dc M < Pe.�-�)�� #I kQl 56*=�j�� WKpKp� l �V*=7hK�� c *D{a)g�=� ! á � ��- O �����V* O|l #R
-�.F�� U� $ �E*6���]�WiReject
# �jJ ��7I kQl 56*=�j�����B}=��Ka�E-P�7 c *,{B)g�6� ! á � �E- O �����E* O|l #R
(...)! P <et * < 5=��� l )+/]� ! á � U� $ �V*6���]� #
-�.F� ! áS> $ < K �VUUT 1 PeKa*D)�v_Pe5D� # �VJ���7$ ��7h56� < WKpK�� l �V*=7hK��� S) ; P < -�jJ O � ! á � �� $ �E*6�E��� #-�.F�j� ! áW> � �t��{�~T 1 PeKp*D)+vqPe56� # P < � ! á�> $ < K �4U ~T 1 PeKp*6)�vqPe56� #j# �jJ ��7
� ; 7hP < �� U�U��� l )+/]� #! P <et * < 5=��� l )+/]� ! á � U� $ �V*6���]� #
(...)
213

APPENDIX B. AC ALGORITHMS
Algorithm 3
This algorithm is responsible for performing the verification of 35463 ��� 798 and 35463{��� � rate control
rules (Eqs. (5.5) or (5.6), and (5.7)). When �ÞÎ and 35Ú � are used by � á �ù 354 3 �2� 7J8 , the rate of
traffic�ù 3{463 ��� 798 can also be controlled. However, Eq. (5.9) is considered a special case of Eq.
(5.5).
Algorithm 3: SLS Rate Usage Verification��J���K�L $21G$Q$ �E*6�E���D� H ��� Î�� H ��� Æ � Z ��� Î � Æ��"! áW>dc M < Pe.�-�)�� #(...)$213$ �U*=�j������)g� % � Z ��� Î > ��� ! áW>dc M < Po.�-)g� #G� � H ��� Î >n��� H ��� Î > � #/* When �� ��� 7 8 ,$213$ �U*=�j������)g� % � Z ���`_ Î � Æ b > ��� ! áS>dc M < Pe.�-�)�� #G�
� H �2�`_ Î � Æ b >n��� H �2�`_ Î � Æ b > � #*/
$213$ �U*=�j������)�� %(' � Z ��� Æ > � � ! áW>dc M < Po.�-)g� #G� � H ��� Æ >@�m� H ��� Æ > � #�����E� < 7h U�N��P�5D�=� $213$ �U*6�V������)g� �$213$ �U*=�j������)�� #
Algorithm 4
For a domain ÓbÈ , service class 35Ú � and ¹9�oÎ�òT qÆW½ pair, this algorithm determines the QoS accep-
tance status for�����
according to the QoS measures provided by egress node èÆ (Eq. (5.10)).
This acceptance status is updated once each���=�
interval, but other scenarios can be devised.
Algorithm 4: Domain QoS VerificationÚÝp Ü N�ñ¥j Ï 363 � Û �1� / ¹c� �2�`_ Î � Æ b ½(...)~ _ ç úom � � � úom � � � úVm � bÃù # (�)�úÅ �2� é��¼Â�� �2� éA# ��� éÉ�ZP¹=¹c� ���`_ Î � Æ bRL #õé�½�ü�Å ��� é�½ � p ÜÞݹt� ���`_ Î � Æ b L �äÚ _ 3 � Û �1� / ½��¼Â ��N�N Ü Ê � Ú Ï Ë ÜÜAßJ/?Ü
¹t� ���`_ Î � Æ b L �äÚ _ 3 � Û �1� / ½��¼Â 1 Ü]ð�Ü N � Ú Ï Ë Ü1 Ü �1� X Ý ¹U½(...)
214

AC ALGORITHMS
Algorithm 5
This algorithm performs the cumulative evaluation of QoS in Ó�È , checking the fulfillment of
flows’ requirements and end-to-end service availability (Eq. (5.12)). Performing this test in
all the involved domains allows to test if � á L 1 Ü�� j Ï 3 and � á L j Ï 3*Å Ï�ß9Ü X.Û Ý N Ü is met
considering both the domain’s metrics and � á L ��N�N�j Ï 3 . Testing if flow requirements fit
within the corresponding 35463 �2� 7 8 QoS specification is not necessary as 354 3 �2� 7 8 acceptance has
already been conditioned by 3{Ú � QoS.
Algorithm 5: End-to-End QoS VerificationÚÝp Ü N�ñv��N�N�j Ï 3q¹p35Ú � ò]� á L 1 Ü�� j Ï 3*ò]� á L j Ï 3*Å Ï�ß ò]� á L ��N�N�j Ï 3{½(...)~ùU# á+� é�òBå á+� é�ò¦# Ç�{t{ þá�� é ½ ù ¹D� á L 1 Ü�� j Ï 3*ò]� á L j Ï 3ÃÅ Ï�ß ò]� á L ��N�N�j Ï 36½# ��� é ù # (�)�úÉ�Z ÝcÏ � ¹=¹�¡�¢+£�¹U# Ç�{t{ þá+� é ò¦# �2� é?½B½ ¡�¢¥¤R¹¨å á+� éÞ# á+� é?½B½ � p ÜÞÝ1 Ü �1� X Ý �èÚÙÚ Ï Ë Ü ¹ Ü À Ü 1 Ü]ð�Ü N � Ú Ï Ë Ü ½1 Ü �1� X Ý �äÚ"Ú Ï Ë Ü ¹ Ü À Ü ��N�N Ü Ê � Ú Ï Ë Ü ½
Algorithm 6
This algorithm updates the rate estimates 01 ���`_�798?� ��b , 01 ���`_4�=� ��ïb or 01 �� (l�.(���`_Z7 8 � ��bin the monitoring matrix
located at ingress node �²Î . This update is only visible at the corresponding �ÞÎ and remains active
until the next�����
information update from RÆ to �oÎ takes place. This allows to count in advance
with the new flow rate until it can be sensed by the monitoring process in the following���T�
. If a
flow � á is rejected in Ó È , the next�����
update brings the system to the real state.
Algorithm 6: SLS Rate Usage UpdatekQl 56*=�j���U*6�j� k ��* ; �=� Z ��� Î � Æ �"! á >dc M < Po.�-)g� #/* Updates �� �2�`_�7 8 � ��b and �� ���`_4�=� � b at
� Î monitoring matrix.
(...)� Z ��� Î > � #F%C' � Z �2� Î > � #2' � ! áS>nc M < Po.�-)g� #/* When �� ��� 7 8 ,� Z ���`_ Î � Æ b > � #X%C' � Z ���`_ Î � Æ b > � #�' � ! á�>dc M < Po.�-)g� #
*/
� Z ��� Æ > � #X%(' � Z ��� Æ > � #F' � ! á >nc M < Po.�-)g� #(...)
215

APPENDIX B. AC ALGORITHMS
Algorithm 7
If a flow � á is accepted in domain ÓbÈ , � á L ��N�N�j Ï 3 is updated according to the QoS parameters
of 3{Ú � within Ó�È (Eq.5.13).
Algorithm 7: End2End Cumulative QoS UpdatekQl 56*=�j�� WKpK�[UPo�6� $ � � �"! á�> SKpK�[UP $ #(...)� M Ç�{t{ þá+� é T ! áW> SKpK�[UP $
M ��� é T M (�)�úM O Ç�{c{ þá+� é %('��o� £ ��M Ç�{t{ þá+� é � M ��� é #(...)
Algorithm 8
This algorithm handles implicit AC of TCP flows. After detecting implicitly a new flow � á , an
AC decision is made at ingress node �ÞÎ .
Algorithm 9
This algorithm exemplifies a verification of the implicit SLS rate usage. The function Z*¹p½ , which
takes the defined rate and the estimated rate, may determine how many flows will be allowed in
the interval.
216

AC ALGORITHMS
Algorithm 8: Implicit AC Decision(...)
! á %(' vx� t ! )�P t ? ���V��Ka��-P�7Q� #(...)� O|l )+-Ka-�V U�y��� Î �"! áe#(...)$ � �&%(' ��)+*,����-�.�/0� ! á�#$213$ ��� 7 84%(' �656��70��-�.�/ $213$ � $ � � � � Î �"! á # /* Considering8 Æ %(':9 ��� 8�;=< �����6� $ � � �"! á�>@? ��� �4U # � ! á �BA (���((�)�ú �BA (���( �(�)�ú #$213$ ��� �� %C' �=5D��70�E-�.�/ $F1G$ � $ � � � 8 Æ4�"! á�# identify H �2� Î and H ��� Æ */I ��J���K�L,MN� <�O -E����-P�7Q� $ � � � $21G$ �2� 7J8 � $21G$ �2� �� �"! á�#R/* At beginning of Y � � perform
��J���K�L\[UP $X$ �V*6���]�6� Z ���`_ Î � Æ b #[and
��J���K�L $213$X$ �V*=�E����� O|l � H �2� �� Z �2� Π#and/or
��J���K�L $213$X$ �V*=�E����� O|l � H ��� Æ � Z �2� Æ #R */
�� ? ��KB-E��-P�7 %(' � Z ���`_ Î � Æ b > U�_$ �V*=�E��� #
[ U� ? ��Ka-���-P�7 %(' � Z ��� Π> U�
_$ �V*=�E���
_� # *67h5D��P < � Z ��� Æ > ��
_$ �E*6�E���
_� #R
-�.q�� �� ? ��Ka-���-�P�7_iAccept
# *=7h5y� Z �2� Î > W5 O_ ! )�P t �4�s� #
then� Z ��� Π> S5 O_ ! )�P t � #Q%(' � Z ��� Π> W5 O
_ ! )+P t � 's��#! P <et * < 5
$ /D7Q� #��)g���
? -���Ka* < 5 $ /D7Q� #(...)
Algorithm 9: Implicit SLS Rate Usage Verification��J���K�L $21G$Q$ �E*6�E����� O|l � H ��� Π� Z ��� Π#(...)-�.q� Z �2� Π> � #G� � H ��� Π>@��#�� � H ��� Π> � # �jJ ��7
� Z ��� Π> ��_$ �E*6���]�
_� #F%C' SKpK�� l �j��P�5D�
��)g���� Z ��� Π> ��
_$ �E*6���]�
_� #F%C' ����}6��Ka�j��Pe56�
� Z ��� Π> W5 O_ ! )+P t � #F%(' .F�j� H �2� Π> � #2' � Z ��� Π> � #j#
(...)
217

APPENDIX B. AC ALGORITHMS
218
Appendix C
Performance Discussion of MBACAlgorithms
Conceptually, two goals drive the design of MBAC algorithms [99]: (i) to provide a parameter
that estimates a priori the level of service failures accurately; (ii) to achieve the highest possible
utilization for a given service failure level. According to [121, 99], MBAC algorithms comprise
two key components: a method for estimating the performance parameter under control (e.g.,
rate or utilization) and a decision algorithm that uses this estimation to make AC decisions.
Generically, the MBAC algorithms proposed in the literature differ in the following aspects [99]:
(i) some are based on solid mathematical formulations while others are more intuitive or ad-hoc;
(ii) the concrete equation used to make the AC decision; (iii) the calibration of the parameter
that influences the achieved performance; (iv) the measurement method used to produce the
parameter estimation (see examples in Section 6.3).
In [107], the AC algorithms are categorized as rate-based or delay-based. As rate-based algo-
rithms, the authors consider and evaluate Rate or Simple Sum, Measure Sum, Equivalent Band-
width, Acceptance Region. As delay-based algorithms, they focuses on the measurement-based
scheme with delay and bandwidth constraints proposed in [121]. According to the authors, all
these schemes can be applied as parameter-based or measurement-based, where in the latter case
the parameters are substituted by measured values. Their preliminary results show that the Mea-
sure Sum and Acceptance Region achieve the highest utilization (but under similar conditions
Acceptance Region has higher loss), the Equivalent Bandwidth algorithm is more conservative
(no loss) and Rate Sum, being parameter-based, achieves the lowest utilization results. In [105],
the same four admission control algorithms are also compared using single hop and multihop
simulation scenarios.
219

APPENDIX C. PERFORMANCE DISCUSSION OF MBAC ALGORITHMS
In [109], a broad set of algorithms proposed in the literature to provide statistical QoS guar-
antees in multiservice networks is considered, compared and divided into the following cate-
gories: (i) algorithms based on average/peak rate; (ii) algorithms based on additive effective
bandwidths; (iii) algorithms based on engineering the Loss Curve; (iv) algorithms based on max-
imum variance approaches; (v) algorithms based on refinements to effective bandwidths using
large deviation theory. A complete description of the principles of each category and their eval-
uation results are presented in [109]. In addition to the mentioned categories, the authors point
out measurement-based algorithms based on aggregate traffic measurements (traffic envelopes),
strategy refined by the authors in later publications [122, 123].
A comparison of algorithms to measure the aggregated traffic load and perform per-flow
admission based on flow traffic descriptors, namely Measure Sum, Hoeffding Bounds, Tangent
at Peak, Tangent at Origin, Measure CAC and Aggregate Traffic Envelopes is available in [99].
Their results for a single node test scenario reveal that, despite the mathematical foundations
complexity, those algorithms produce similar performance results when considering the trade-
off between utilization and loss, however, when considering a performance target, namely the
target loss rate, their tuning parameters are unable or fail to predict the loss target consistently.
According to the authors, regarding the performance of the algorithms, the way the new flows
arrival and departure is treated and the equations sensitivity to traffic fluctuations, controlled by
the measurement time interval, are more relevant than the foundations of the AC equations in
use. In [99], two distinct causes for variations in the number of admitted flows that may lead
to performance degradation of MBAC algorithms are identified. The first is related to how the
algorithms deal with the arrival and departure of flows. The second is related to how they respond
to load fluctuations. MBAC algorithms based on aggregate measurements do not know how
much a departing flow has contributed for the previous load estimate. For that, they must wait
for the new measurements to reflect the flow departure (if known) before admitting a new flow.
During this waiting time, additional departures may lead to a decrease on the number of flows
within the system. Similarly, when a new flow is admitted, the MBAC algorithm must assume
the flow worst-case behavior until its presence is reflected by new measurements. About the
second cause, as MBAC relies on measurements of current traffic load, it responds to significant
load fluctuations even when the number of flows has not changed. MBAC cannot distinguish
whether a load increase is due to an excessive number of accepted flows or due to a high-level
traffic fluctuation of a fixed number of flows. When the latter occurs, flows may be rejected
even if there are few flows in the system and, similarly, during a low-level traffic fluctuation new
flows can be accepted even if too many flows are present. Longer measurement intervals avoid
220

PERFORMANCE DISCUSSION OF MBAC ALGORITHMS
adjusting to short-term traffic fluctuations, however, lead to less reactive AC algorithms upon
the departure and arrival of flows. Trying to keep the number of flows constant is not the better
performance solution for all cases, for instance, with LRD traffic, the MBAC ability to adjust the
number of admitted flows in response to long-term variations increases performance.
Following the panoply of existing AC equations and their evaluation results, in [209] the
authors consider that more research in developing better AC equations may be fruitless, being
more relevant to discuss and, eventually, develop mechanisms that enable MBAC supporting a
range of policies beyond the usual single policy that tends to privilege small flows and flows that
traverse smaller path lengths.
221

APPENDIX C. PERFORMANCE DISCUSSION OF MBAC ALGORITHMS
222

Appendix D
Monitoring Applications and Tools
A QoS monitoring system can be build based on common open-source or freeware software man-
agement tools (SMTs) or on commercial products. These solutions differ in terms of complexity,
scalability, installation and operation cost, security and availability [190].
Open-source SMTs, such as CAIDA tools, RUDE/CRUDE, netperf, usually following a
sender/receiver (client/server) model, are particularly suitable for the deployment of distributed
monitoring infrastructures. They can be used to build a low cost monitoring infrastructure easily
extended to other domains or end-users, and adjusted to specific or new measuring requirements.
The provided APIs for collecting measuring data allow an easy manipulation of that data and cor-
responding on-line or off-line analysis for continuous or sparse network performance evaluation.
The security vulnerabilities, the lack of tools for presenting monitoring results in an integrated
and consistent way, and the knowledge required to define appropriate measurement scenarios are
usually pointed out as disadvantages of SMTs.
Commercial products such as RIPE TTM, Brix Networker, Matrix, SAA, Ipanema, IxChariot
follow typically a centralized model, which facilitates to have an integrated view of the network
performance, commonly supported by graphical facilities. Scalability problems may, however,
occur when monitoring large-scale measurement infrastructures. Commercial monitoring sys-
tems, having technical vendor support, are easy to deploy and maintain in production scenarios,
however, being based on a closed architecture, more limited scenarios and monitored parameters
are imposed, and the support of new features has generally to wait for new software versions at
additional costs. The usually required GPS receivers for synchronization purposes make these
systems accurate but with high installation costs [190].
Common and widely spread ad-hoc management tools (classical tools) such as ping, tracer-
223

APPENDIX D. MONITORING APPLICATIONS AND TOOLS
oute and netstat are sometimes used to assist network monitoring, such as in RIPE TTM. In
RIPE TTM traceroute is more sparsely used than other measures (for instance, each six minutes)
to register a vector of routes the traffic is following. Changes in the routing vectors can often
explain why the mean delay has suddenly changed. These vectors are also of interest to verify
the stability of routes and path conformance with a routing policy [92]. Reporting the path tra-
versed by the test packets along with the metric results, whenever possible, is also recommended
[168, 167].
An overview describing and evaluating existing tools for measuring QoS parameters defined
in Section 4.2.1, covering aspects such as the tool measurement purpose, its measurement under-
lying principles and obtained accuracy is provided in [81, 104, 176, 179, 228].
224

Bibliography
[1] P. Georgatsos, J. Spencer, D. Griffin, P. Damilatis, H. Asgari, J. Griem, G. Pavlou, and
P. Morand. Provider-level Service Agreements for Inter-domain QoS delivery. Fourth
International Workshop on Advanced Internet Charging and QoS Technologies (ICQT04),
September 2004.
[2] P. Trimintzios, I. Andrikopoulos, G. Pavlou, C.F. Cavalcanti, D. Goderis, Y. T’Joens,
P. Georgatsos, L. Georgiadis, D. Griffin, C. Jacquenet, R. Egan, and G. Memenios. An Ar-
chitectural Framework for Providing QoS in IP Differentiated Services Networks. In 7th
IFIP/IEEE International Symposium on Integrated Network Management - IM’01, 2001.
[3] G. Huston. Next Steps for the IP QoS Architecture. RFC 2990 (Informational), November
2000.
[4] S. Blake, D. Black, M. Carlson, E. Davies, Z. Wang, and W. Weiss. An Architecture for
Differentiated Service. RFC 2475 (Informational), December 1998. Updated by RFC
3260.
[5] D. Grossman. New Terminology and Clarifications for Diffserv. RFC 3260 (Informa-
tional), April 2002.
[6] J. Evans C. Filsfils. Deploying Diffserv in Backbone Networks for Tight SLA Control.
IEEE Internet Computing, 9(1):58–65, Jan.-Feb. 2005.
[7] F. Baker. The Case for QoS. Packet, pages 62–66, Fourth Quarter 2000.
[8] R. Atkinson, S. Floyd, and Internet Architecture Board. IAB Concerns and Recommen-
dations Regarding Internet Research and Evolution. RFC 3869 (Informational), August
2004.
225
BIBLIOGRAPHY
[9] J. Babiarz, K. Chan, and F. Baker. Configuration Guidelines for Diffserv Service Classes.
IETF Draft : draft-ietf-tsvwg-diffserv-service-classes-01.txt (work in progress), July
2005.
[10] S. Lima, P. Carvalho, A. Santos, and V. Freitas. A Distributed Admission Control Model
for CoS Networks using QoS and SLS Monitoring. In IEEE International Conference on
Communications (ICC’03). IEEE Communications Society Press, May 2003.
[11] S. Rito Lima, P. Carvalho, and V. Freitas. Self-adaptive Distributed Management of QoS
and SLSs in Multiservice Networks. In IEEE/IFIP International Conference on Integrated
Management (IM 2005), Nice, France, May 2005. IEEE Press.
[12] S. Rito Lima, P. Carvalho, and V. Freitas. Distributed Admission Control for QoS and SLS
Management. Journal of Network and Systems Management - Special Issue on Distributed
Management, 12(3):397–426, September 2004.
[13] S. Lima, P. Carvalho, A. Santos, and V. Freitas. Managing Services Quality through
Admission Control and Active Monitoring. In A. Marshall and N. Agoulmine, editors,
6th IFIP/IEEE Management of Multimedia Networks and Services (MMNS’03), volume
2839, pages 142–154, Belfast, Northern Ireland, September 2003. Springer.
[14] S. Lima, P. Carvalho, A. Santos, and V. Freitas. A Distributed Admission Control Model
for Class-based Networks. In 8th IEEE International Conference on Communications
Systems (ICCS’02), Singapore, November 2002.
[15] S. Rito Lima, P. Carvalho, and V. Freitas. Handling Concurrent Admission Control in
Multiservice IP Networks (accepted paper). In IEEE Consumer Communications and
Networking Conference (CCNC 2006), U.S.A, January 2006. IEEE Press.
[16] S. Lima, P. Carvalho, and V. Freitas. Measuring QoS in Class-based IP Networks using
Multipurpose Colored Probing Patterns. In SPIE ITCom 2004 - Performance, Quality of
Service, and Control of Next-Generation Communication Networks, volume 5598, pages
171–182, Philadelphia, U.S.A., October 2004. SPIE Press, ISBN 0-8194-5551-2.
[17] S. Lima, P. Carvalho, and V. Freitas. Tuning Active Monitoring in Multiservice IP Net-
works. In Performance Modelling and Evaluation of Heterogeneous Networks (HET-
Nets’04), Ilkley, U.K., July 2004. Networks UK.
226

BIBLIOGRAPHY
[18] P. Alipio, S. Rito Lima, and P. Carvalho. XML Service Level Specification and Validation.
In IEEE International Symposium on Computer Communications (ISCC’05), Cartagena,
Spain, June 2005. IEEE ComSoc.
[19] S. Lima, M. Silva, P. Carvalho, A. Santos, and V. Freitas. Long Range Dependence of
Internet Traffic Aggregates. In E. Gregori, M. Conti, A. Campbell, G. Omidyar, and
M. Zuckerman, editors, IFIP Networking 2002, volume 2345, pages 1159–1164, Pisa,
Italy, May 2002. Springer.
[20] S. Rito Lima. Avaliação de Mecanismos de Controlo de Congestão em Sistemas Inter-
mediários da Camada de Rede com Tráfego Fractal. Master’s thesis, Universidade do
Minho, July 1997.
[21] D. Awduche, A. Chiu, A. Elwalid, I. Widjaja, and X. Xiao. Overview and Principles of
Internet Traffic Engineering. RFC 3272 (Informational), May 2002.
[22] V. Paxson, G. Almes, J. Mahdavi, and M. Mathis. Framework for IP Performance Metrics.
RFC 2330 (Informational), May 1998.
[23] R. Braden, D. Clark, and S. Shenker. Integrated Services in the Internet Architecture: an
Overview. RFC 1633 (Informational), June 1994.
[24] K. Nichols, S. Blake, F. Baker, and D. Black. Definition of the Differentiated Services
Field (DS Field) in the IPv4 and IPv6 Headers. RFC 2474 (Proposed Standard), December
1998. Updated by RFCs 3168, 3260.
[25] E. Crawley, R. Nair, B. Rajagopalan, and H. Sandick. A Framework for QoS-based Rout-
ing in the Internet. RFC 2386 (Informational), August 1998.
[26] G. Apostolopoulos, S. Kama, D. Williams, R. Guerin, A. Orda, and T. Przygienda. QoS
Routing Mechanisms and OSPF Extensions. RFC 2676 (Experimental), August 1999.
[27] E. Rosen, A. Viswanathan, and R. Callon. Multiprotocol Label Switching Architecture.
RFC 3031 (Proposed Standard), January 2001.
[28] R. Braden, L. Zhang, S. Berson, S. Herzog, and S. Jamin. Resource ReSerVation Protocol
(RSVP) – Version 1 Functional Specification. RFC 2205 (Proposed Standard), September
1997. Updated by RFCs 2750, 3936.
227
BIBLIOGRAPHY
[29] H. Schulzrinne, S. Casner, R. Frederick, and V. Jacobson. RTP: A Transport Protocol for
Real-Time Applications. RFC 3550 (Standard), July 2003.
[30] Y. Bernet, P. Ford, R. Yavatkar, F. Baker, L. Zhang, M. Speer, R. Braden, B. Davie, J. Wro-
clawski, and E. Felstaine. A Framework for Integrated Services Operation over Diffserv
Networks. RFC 2998 (Informational), November 2000.
[31] F. Le Faucheur and W. Lai. Requirements for Support of Differentiated Services-aware
MPLS Traffic Engineering. RFC 3564 (Informational), July 2003.
[32] D. Awduche, J. Malcolm, J. Agogbua, M. O’Dell, and J. McManus. Requirements for
Traffic Engineering Over MPLS. RFC 2702 (Informational), September 1999.
[33] T. Li and Y. Rekhter. A Provider Architecture for Differentiated Services and Traffic
Engineering (PASTE). RFC 2430 (Informational), October 1998.
[34] IEEE Standards for Local and Metropolitan Area Networks: Virtual Bridged Local Area
Networks, 802.1Q, 2003.
[35] IEEE Standards for Local and Metropolitan Area Networks: Media Access Control
(MAC) Bridges, 802.1D, 2004.
[36] ATM Forum. ATM User-Network Interface Specification, Version 3.0 (UNI 3.0), Septem-
ber 1993.
[37] ATM Forum. ATM User-Network Interface Specification, Version 3.1 (UNI 3.1), Septem-
ber 1994.
[38] Y. Bernet. The complementary Roles of RSVP and Differentiated Services in the Full-
Service QoS Network. IEEE Communications Magazine, pages 154–162, February 2000.
[39] K. Nichols and B. Carpenter. Definition of Differentiated Services Per Domain Behaviors
and Rules for their Specification. RFC 3086 (Informational), April 2001.
[40] J. Postel. Service mappings. RFC 795, September 1981.
[41] J. Babiarz, K. Chan, and F. Baker. Configuration Guidelines for Diffserv Service Classes.
IETF Draft : draft-baker-diffserv-basic-classes-04.txt (working draft), October 2004.
[42] J. Heinanen and R. Guerin. A Single Rate Three Color Marker. RFC 2697 (Informational),
September 1999.
228

BIBLIOGRAPHY
[43] J. Heinanen and R. Guerin. A Two Rate Three Color Marker. RFC 2698 (Informational),
September 1999.
[44] W. Fang, N. Seddigh, and B. Nandy. A Time Sliding Window Three Colour Marker
(TSWTCM). RFC 2859 (Experimental), June 2000.
[45] J. Turner. New Directions in Communications (or Which Way to the Information Age?).
IEEE Communications Magazine, 24(10):8–15, October 1986.
[46] T. Ferrari and P. Chimento. A Measurement-based Analysis of Expedited Forwarding
PHB Mechanisms. TERENA, 2000.
[47] C. Dovrolis et al. Proportional Differentiated Services: Delay Differentiation and Packet
Scheduling. IEEE/ACM Transactions on Networking, 10(1), February 2002.
[48] P. Sousa, P. Carvalho, and V. Freitas. A Multi-constrained QoS Aware Scheduler for Class-
based IP Networks. In 4th Symposium on Communication Systems, Networks and Digital
Signal Processing (CSNDSP 2004), Newcastle-upon-Tyne, U.K., July 2004. ISBN: 0-
7017-0177-3.
[49] G. Quadros, A. Alves, E. Monteiro, and F. Boavida. An Effective Scheduler for IP Routers.
In 5th IEEE International Symposium on Computers and Communications (ISCC’00),
Antibes, France, July 2000.
[50] S. Floyd and V. Jacobson. On Traffic Phase Effects in Packet-Switched Gateways. Inter-
networking: Research and Experience, 3(3):115–156, 1992.
[51] S. Floyd and V. Jacobson. Random Early Detection Gateways for Congestion Avoidance.
IEEE/ACM Transactions on Networking, 1(4):397–413, August 1993.
[52] R. Makkar et al. Empirical Study of Buffer Management Scheme for Diffserv AF PHB.
In ICCCN’00, 2000.
[53] S. McCreary. Trends in Wide Area IP Traffic Patterns.
http://www.caida.org/outreach/papers/.
[54] A. Bak, W.Burakowski, F. Ricciato, S. Salsano, and H. Tarasiuk. Traffic Handling in
AQUILA QoS IP Networks. In M. Smirnov, J. Crowcroft, J. Roberts, and F. Boavida,
editors, QofIS’01, volume 2156, pages 243–260, September 2001.
229
BIBLIOGRAPHY
[55] A. Croll and E. Packman. Managing Bandwidth: Deploying QoS in Enterprise Networks.
Prentice Hall, 2000.
[56] G. Quadros, A. Alves, E. Monteiro, and F. Boavida. An Approach to Support Traffic
Classes in IP Networks. In J. Crowcroft, J. Roberts, and M. Smirnov, editors, Quality
of Future Internet Services (QofIS2000), volume 1922, pages 285–299, Berlin, Germany,
September 2000.
[57] B. Davie, A. Charny, J.C.R. Bennet, K. Benson, J.Y. Le Boudec, W. Courtney, S. Davari,
V. Firoiu, and D. Stiliadis. An Expedited Forwarding PHB (Per-Hop Behavior). RFC
3246 (Proposed Standard), March 2002.
[58] A. Charny, J. Bennet, K. Benson, J. Boudec, A. Chiu, W. Courtney, S. Davari, V. Firoiu,
C. Kalmanek, and K. Ramakrishnan. Supplemental Information for the New Definition
of the EF PHB (Expedited Forwarding Per-Hop Behavior). RFC 3247 (Informational),
March 2002.
[59] V. Jacobson, K. Nichols, and K. Poduri. An Expedited Forwarding PHB. RFC 2598
(Proposed Standard), June 1999. Obsoleted by RFC 3246.
[60] B. Teitelbaum and S. Shalunov. Why Premium IP Service Has Not Deployed (and Prob-
ably Never Will) Internet2 QoS Working Group Informational Document, May 2002.
[61] E. Mykoniati, C. Charalampous, P. Georgatsos, T. Damilatis, D. Goderis, P. Trimintzios,
G. Pavlou, and D. Griffin. Admission Control for Providing QoS in IP Diffserv Net-
works: The TEQUILA Approach. IEEE Communications, special issue on QoS Advances,
41(1):38–44, January 2003.
[62] J. Heinanen, F. Baker, W. Weiss, and J. Wroclawski. Assured Forwarding PHB Group.
RFC 2597 (Proposed Standard), June 1999. Updated by RFC 3260.
[63] C. Parada, J. Carapinha, F. Fontes, S. Lima, and P. Carvalho. Testing IP Differentiated
Services Implementations. In Ina Schieferdecker, Hartmut Konig, and Adam Wolisz, edi-
tors, Testing of Communicating Systems XIV, ISBN 0-7923-7691-1, pages 55–71. Kluwer,
May 2002.
[64] R. Bless, K. Nichols, and K. Wehrle. A Lower Effort Per-Domain Behavior (PDB) for
Differentiated Services. RFC 3662 (Informational), December 2003.
230

BIBLIOGRAPHY
[65] P. Morand, M. Boucadair, P. Levis, R. Egan, H. Asgari, D. Griffin, J. Griem, J. Spencer,
P. Trimintzios, M. Howarth, N. Wang, P. Flegkas, K. Ho, S. Georgoulas, G. Pavlou,
P. Georgatsos, and T. Damilatis. Mescal D1.2 - Initial Specification of Protocols and
Algorithms for Inter-domain SLS Management and Traffic Engineering for QoS-based IP
Service Delivery and their Test Requirements. Mescal Project IST-2001-37961, January
2004.
[66] A. Diaconescu, S. Antonio, M. Esposito, S. Romano, and M. Potts. Cadenus D2.3 -
Resource Management in SLA Networks. Cadenus Project IST-1999-11017, May 2003.
[67] D. Goderis, D. Griffin, C. Jacquenet, and G. Pavlou (Eds.). Attributes of a Service Level
Specification (SLS) Template. IETF Draft : draft-tequila-sls-02.txt (working draft), Octo-
ber 2003.
[68] D. Goderis, S. Bosch, Y. T’Joens, O. Poupel, C. Jacquenet, G. Memenios, G. Pavlou,
R. Egan, D. Griffin, P. Georgatsos, and P. Heuven. Service Level Specification Semantics
and Parameters. draft-tequila-sls-02.txt (working draft), February 2002.
[69] A. Sevasti and M. Campanella. Geant D9.1 - Service Level Agreements Specification for
IP Premium Service. Geant and Sequin Projects, October 2001.
[70] S. Salsano, F. Ricciato, M. Winter, G. Eichler, A. Thomas, F. Fuenfstueck, T. Ziegler,
and C. Brandauer. Definition and Usage of SLSs in the Aquila consortium. IETF Draft:
draft-salsano-aquila-sls-00.txt (working draft), November 2000.
[71] M. Mellia, C. Casetti, G. Mardente, and M. Marsan. An Analytical Framework for SLA
Admission Control in a Diffserv Domain. In IEEE INFOCOM’03, March 2003.
[72] A. Keller and H. Ludwig. The WSLA Framework: Specifying and Monitoring Service
Level Agreements for Web Services. Journal of Network and Systems Management, Spe-
cial Issue on E-business Management, 11(1), March 2003.
[73] J. Chen, A. McAuley, V. Sarangan, S. Baba, and Y. Ohba. Dynamic Service Negotiation
Protocol (DSNP) and Wireless Diffserv. In ICC’02, April 2002.
[74] P. Bhoj, S. Singhal, and S. Chutani. SLA Management in Federated Environments. Com-
puter Networks, 35(1), January 2001.
231
BIBLIOGRAPHY
[75] A. Prieto and M. Brunner. SLS to Diffserv Configuration Mappings. In 12th International
Workshop on Distributed Systems: Operations and Management - DSOM’01, October
2001.
[76] D. Raz and Y. Shavitt. Optimal Partition of QoS requirements with Discrete Cost Func-
tions. IEEE Journal on Selected Areas in Communications (JSAC), 18(12):2593–2602,
December 2000.
[77] Neal Seitz. ITU-T QoS Standards for IP-Based Networks. IEEE Communications Maga-
zine, 41(5), June 2003.
[78] "ITU-T Study Group 13". Internet Protocol Data Communication Service - IP Perfor-
mance and Availability Objectives and Allocations. ITU-T Recommendation Y.1541, May
2002.
[79] "ITU-T Study Group 13". IP Packet Transfer and Availability Performance Parameters.
ITU-T Recommendation Y.1540, December 2002.
[80] D. Miras et al. A Survey of Network QoS Needs of Advanced Internet Applications.
Internet2 Working Document, November 2002.
[81] S. Leinen and V. Reijs. Geant D9.7 - Testing of Traffic Measurement Tools. Geant Project,
September 2002.
[82] M. Campanella. IP QoS Parameters. http://axgarr.dir.garr.it/c̃mp/tf-ngn/QoS-
ValueTable.html, January 2001.
[83] T. Chahed. TF-NGN - IP QoS Parameters. TF-NGN, November 2000.
[84] P. Trimintzios, I. Andrikopoulos, G. Pavlou, P. Flegkas, D. Griffin, P. Georgatsos,
D. Goderis, Y. T’Joens, L. Georgiadis, C. Jacquenet, and R. Egan. A Management and
Control Architecture for Providing IP Differentiated Services in MPLS-Based Networks.
IEEE Communications Magazine, 39(5):80–88, May 2001.
[85] R. Neilson, J. Wheeler, F. Reichmeyer, and S. Hares. A Discussion of Bandwidth Broker
Requirements for Internet2 QBone Deployment. Internet2 QBone BB Advisory Council,
August 1999.
[86] P. Chimento et al. SIBBS: Simple Inter-domain Bandwidth Broker Signaling. Final Re-
port. QBone Signalling Design Team, http://qbone.internet2.edu/bb, 2002.
232

BIBLIOGRAPHY
[87] T. Nguyen, N. Boukhatem, Y. Doudane, and G. Pujolle. COPS-SLS: A Service Level
Negotiation Protocol for the Internet. IEEE Communications Magazine, 40(5):158–165,
May 2002.
[88] R. Liao and A. Campbell. Dynamic Edge Provisioning for Core IP Networks. In IEEE
IWQoS’00, June 2000.
[89] P. Morand, M. Boucadair, P. Levis, Y. Noisette, N. Cantenot, R. Egan, H. Asgari, D. Grif-
fin, J. Griem, P. Trimintzios, P. Flegkas, N. Wand, M. Howarth, G. Pavlou, P. Georgatsos,
T. Damilatis, G. Memenios, and D. Makris. Mescal D1.1 - Specification of Business
Models and a Functional Architecture for Inter-domain QoS Delivery. Mescal Project
IST-2001-37961, June 2003.
[90] P. Morand, M. Boucadair, H. Asgari, R. Egan, M. Irons, J. Griem, D. Griffin, J. Spencer,
P. Flegkas, T. Trimintzios, T. Damilatis, and P. Georgatsos. Mescal D1.4 - Issues in
MESCAL Inter-domain QoS Delivery: Technologies, Bi-directionality, Inter-operability,
and Financial Settlements. Mescal Project IST-2001-37961, January 2004.
[91] EUROSCOM - Project 1008 - Inter-operator interfaces for ensuring end-to-end IP QoS,
Deliverable 2, Selected Scenarios and requirements for end-to-end IP QoS management,
2001.
[92] F. Georgatos, F. Gruber, D. Karrenberg, M. Santcroos, H. Uijterwaal, and R. Wilhelm.
Providing Active Measurements as a Regular Service for ISPs. In PAM’01, April 2001.
[93] M.S. Taqqu, W. Willinger, W.E. Leland, and D.V. Wilson. On the Self-Similar Nature of
Ethernet Traffic. In ACM SIGCOMM’93, 1993.
[94] T. Karagiannis, M. Molle, and M. Faloutsos. Long-range dependence ten years of Internet
traffic modeling. IEEE Internet Computing, 8(5):57–64, Sept.-Oct. 2004.
[95] A. Erramilli and W. Willinger. Experimental Queueing Analysis with Long-Range De-
pendent Packet Traffic. IEEE/ACM Transactions on Networking, 4(2), April 1996.
[96] L. Trajkovie and A. Neidhardt. Effect of Traffic Knowledge on the Efficiency of Ad-
mission Control Policies. Computer Communication Review, ACM Sigcomm, 29(1):5–34,
1999.
233

BIBLIOGRAPHY
[97] M. Grossglauser and D. Tse. A Time-Scale Decomposition Approach to Measurement-
based Admission Control. IEEE/ACM Transactions on Networking, 11(4):550–563, April
2003.
[98] R. Gibbens and F. Kelly. Measurement-based Connection Admission Control. In 15th
International Teletraffic Congress, June 1997.
[99] L. Breslau and S. Jamin. Comments on the Performance of Measurement-Based Admis-
sion Control Algorithms. In IEEE INFOCOM’00, March 2000.
[100] W. Willinger, M. Taqqu, R. Sherman, and D. Wilson. Self-similarity through high-
variability: statistical analysis of ethernet LAN traffic at the source level. In SIGCOMM
’95: Proceedings of the conference on Applications, technologies, architectures, and pro-
tocols for computer communication, pages 100–113, New York, NY, USA, 1995. ACM
Press.
[101] W. Willinger and V. Paxson and R. Riedi and M. Taqqu. Long-Range Dependence and
Data Network Traffic, 2002.
[102] W.E. Leland, M.S. Taqqu, W. Willinger, and D.V. Wilson. On the Self-Similar Nature of
Thernet Traffic (Extended Version). IEEE/ACM Transactions on Networking, 2(1):1–15,
February 1994.
[103] C. Dovrolis and M. Jain. End-to-End Available Bandwidth: Measurement methodology,
Dynamics, and Relation with TCP Throughput. In ACM SIGCOMM’02, August 2002.
[104] M. Przybylski and S. Trocha. Network Measurement Tools Test.
http://qos.man.poznan.pl/files/measurement_full.pdf, June 2001.
[105] S. Jamin, S. Shenker, and P. B. Danzig. Comparison of Measurement-Based Call Admis-
sion Control Algorithms for Controlled-Load Service. In INFOCOM’97, pages 973–980,
April 1997.
[106] L. Breslau, E. Knightly, S. Shenker, I. Stoica, and H. Zhang. Endpoint Admission Control:
Architectural Issues and Performance. In ACM SIGCOMM’00, 2000.
[107] M. Gerla. A Survey of Admission Control Algorithms. Technical Report CS215, UCLA,
December 1998.
234

BIBLIOGRAPHY
[108] M. Gerla, S. Lee, G. Reali, and D. Sorte. Performance of Different Call Admission
Schemes in a QoS Diffserv Domain. http://www.cs.ucla.edu/ñrl/hpi/papers/2001-milcom-
0.ps.gz, 2001.
[109] E. Knightly and N. Shroff. Admission Control for Statistical QoS: Theory and Practice.
IEEE Network, 13(2):20–29, March 1999.
[110] D. Tse and M. Grossglauser. Measurement-based Call Admission Control: Analysis and
Simulation. In INFOCOM’97, April 1997.
[111] J. Wroclawski. The Use of RSVP with IETF Integrated Services. RFC 2210 (Proposed
Standard), September 1997.
[112] F. Baker, C. Iturralde, F. Le Faucheur, and B. Davie. Aggregation of RSVP for IPv4 and
IPv6 Reservations. RFC 3175 (Proposed Standard), September 2001.
[113] Z. Duan, Z. Zhang, Y. Hou, and L. Gao. A Core Stateless Bandwidth Broker Architec-
ture for Scalable Support of Guaranteed Services. IEEE Trans. Parallel Distrib. Syst.,
15(2):167–182, 2004.
[114] B. Teitelbaum, S. Hares, L. Dunn, R. Neilson V. Narayan, and F. Reichmeyer. Inter-
net2 QBone: building a testbed for differentiated services. IEEE Network, 13(5):8–16,
"September/October" 1999.
[115] I. Khalil and T. Braun. Edge Provisioning and Fairness in VPN-Diffserv Networks. Jour-
nal of Network and Systems Management, Special Issue on Management of Converged
Networks, 10(1), March 2002.
[116] Z. Zhang, Z. Duan, Y. Hou, and L. Gao. Decoupling QoS Control from Core Routers: A
Novel Bandwidth Broker Architecture for Scalable Support of Guaranteed Services. In
ACM SIGCOMM’00, 2000.
[117] Qbone bandwidth broker architecture. http://qbone.internet2.edu/bb/bboutline2.html.
[118] K. Nichols, V. Jacobson, and L. Zhang. A Two-bit Differentiated Services Architecture
for the Internet. RFC 2638 (Informational), July 1999.
[119] L. Westberg. Resource Management in Diffserv (RMD) Framework. IETF Draft: draft-
westberg-rmd-framework-04.txt (working draft), September 2003.
235

BIBLIOGRAPHY
[120] I. Stoica and Hui Zhang. Providing Guaranteed Services Without Per Flow Management.
In ACM SIGCOMM’99, October 1999.
[121] S. Jamin, P. Danzig, S. Shenker, and L. Zhang. A Measurement-Based Call Admis-
sion Control Algorithm for Integrated Services Packet Networks (Extended Version).
IEEE/ACM Transactions on Networking, pages 56–70, February 1997.
[122] C. Cetinkaya, V. Kanodia, and E. Knightly. Scalable Services via Egress Admission Con-
trol. IEEE Transactions on Multimedia, 3(1):69–81, March 2001.
[123] J. Qiu and E. Knightly. Measurement-Based Admission Control with Aggregate Traffic
Envelopes. IEEE/ACM Transactions on Networking, 9(2):199–210, April 2001.
[124] V. Elek, G. Karlsson, and R. Rnngren. Admission Control Based on End-to-End Measure-
ments. In IEEE INFOCOM’00, 2000.
[125] G. Bianchi, A. Capone, and C. Petrioli. Throughput Analysis of End-to-End
Measurement-based Admission Control in IP. In IEEE INFOCOM’00, 2000.
[126] F. Kelly, P. Key, and S. Zachary. Distributed Admission Control. IEEE Journal on Selected
Areas in Communications (JSAC), 18(12), December 2000.
[127] R. Gibbens and F. Kelly. Distributed Connection Acceptance Control for a Connectionless
Network. In 16th International Teletraffic Congress, June 1999.
[128] D. Lourenço, P. Loureiro, G. Quadros, and E. Monteiro. Estratégias de Controlo de Ad-
missão no Contexto dos Modelos de QoS Propostos pelo IETF. In Actas da CRC’2001 -
4 Conferência sobre Redes de Computadores - Tecnologias e Aplicações, Universidade da
Beira Interior, Covilhã, Portugal, November 2001.
[129] L. Massoulié and J. Roberts. Arguments in Favour of Admission Control for TCP Flows.
In 16th International Teletraffic Congress, pages 33–44, June 1999.
[130] R. Mortier, I. Pratt, C. Clark, and S. Crosby. Implicit Admission Control. IEEE Journal
on Selected Areas in Communication, 18(12):2629–2639, December 2000.
[131] N. Benameur, S. Fredj, F. Delcoigne, S. Oueslati-Boulahia, and J. Roberts. Integrated Ad-
mission Control for Streaming and Elastic Traffic. In M. Smirnov, J. Crowcroft, J. Roberts,
and F. Boavida, editors, QofIS’01, volume 2156, pages 67–81, September 2001.
236

BIBLIOGRAPHY
[132] S. Fredj, S. Oueslati-Boulahia, and J. Roberts. Measurement-based Admission Control
for Elastic Traffic. In 17th International Teletraffic Congress, June 2001.
[133] J. Manner and X. Fu. Analysis of Existing Quality-of-Service Signaling Protocols. RFC
4094 (Informational), May 2005.
[134] P. Ji, Z. Ge, J. Kurose, and D. Towsley. A comparison of hard-state and soft-state signaling
protocols. In SIGCOMM ’03: Proceedings of the 2003 Conference on Applications, Tech-
nologies, Architectures, and Protocols for Computer Communications, pages 251–262,
New York, NY, USA, 2003. ACM Press.
[135] R. Hancock, G. Karagiannis, J. Loughney, and S. Van den Bosch. Next Steps in Signaling
(NSIS): Framework. RFC 4080 (Informational), June 2005.
[136] H. Fu and E. Knightly. Aggregation and Scalable QoS: A Performance Study. In
IWQoS’01, June 2001.
[137] S. Sargento. Gestão de Recursos em Redes com Suporte de Qualidade de Serviço. PhD
thesis, Universidade de Aveiro, Departamento de Electrónica e Telecomunicações, 2003.
[138] K. Chan, J. Seligson, D. Durham, S. Gai, K. McCloghrie, S. Herzog, F. Reichmeyer,
R. Yavatkar, and A. Smith. COPS Usage for Policy Provisioning (COPS-PR). RFC 3084
(Proposed Standard), March 2001.
[139] M. MacFaden, D. Partain, J. Saperia, and W. Tackabury. Configuring Networks and De-
vices with Simple Network Management Protocol (SNMP). RFC 3512 (Informational),
April 2003.
[140] D. Levi, P. Meyer, and B. Stewart. Simple Network Management Protocol (SNMP) Ap-
plications. RFC 3413 (Standard), December 2002.
[141] D. Durham, J. Boyle, R. Cohen, S. Herzog, R. Rajan, and A. Sastry. The COPS (Common
Open Policy Service) Protocol. RFC 2748 (Proposed Standard), January 2000.
[142] B. Lee, W. Woo, C. Yeo, T. Lim, B. Lim, Y. He, and J. Song. Secure communications
between bandwidth brokers. SIGOPS Operating Systems Review, 38(1):43–57, 2004.
[143] Z. Zhang, Z. Duan, and Y. Hou. Virtual Time Reference System: A Unifying Scheduling
Framework for Scalable Support of Guaranteed Services. IEEE Journal on Selected Areas
in Communication, 18(12), December 2000.
237

BIBLIOGRAPHY
[144] M. Mahajan, A. Ramanathan, and M. Parashar. Active Resource Management for the
Differentiated Services Environment. International Journal of Network Management,
14(2):149–165, March 2004.
[145] Z-L. Zhang and Z. Duan and Y. Hou. On scalable network resource management us-
ing bandwidth brokers. In IEEE/IFIP Network Operations and Management Symposium
(NOMS 2002), pages 169–186, April 2002.
[146] J. Qiu and E. Knightly. Inter-class Resource Sharing using Statistical Service Envelopes.
In IEEE INFOCOM’99, March 1999.
[147] J. Schlembach, A. Skoe, P. Yuan, and E. Knightly. Design and Implementation of Scalable
Admission Control. In International Workshop on QoS in Multiservice IP Networks, April
2001.
[148] I. Szabo. A Call Admission Control Method for Supporting Telephony Sessions in a Best
Effort Network. In QofIS’01, September 2001.
[149] Mescal Project IST-2001-37961. http://www.mescal.org.
[150] Cadenus Project IST-1999-11017. http://wwwcadenus.fokus.fraunhofer.de/.
[151] Tequila Project. http://www.ist-tequila.org.
[152] Aquila Project. http://www-st.inf.tu-dresden.de/aquila.
[153] QoS II Project. http://marco.uminho.pt/%7Ealex/QoSII.
[154] Internet2 qbone site. http://qbone.internet2.edu.
[155] Deliverable D1201, System architecture and specification for the first trial - Aquila Project
Consortium. http://www-st.inf.tu-dresden.de/aquila, June 2000.
[156] S. Georgoulas, P. Trimintzios, and G. Pavlou. Admission Control Placement in Differen-
tiated Services Networks. Proceedings of the IEEE Symposium on Computers and Com-
munications (ISCC’2004), June 2004.
[157] S. Georgoulas, P. Trimintzios, and G. Pavlou. Joint Measurement- and Traffic Descriptor-
based Admission Control at Real-Time Traffic Aggregation Points. IEEE International
Conference on Communications (ICC2004), QoS and Performance Symposium, June
2004.
238

BIBLIOGRAPHY
[158] R. Sofia and R. Guerin and P. Veiga. Enabling Scalable Inter-AS Signaling: a Load
Reduction Approach. In International Symposium on Computers and Communications
(ISCC’05), June 2005.
[159] R. Sofia and R. Guerin and P. Veiga. SICAP, a Shared-segment Inter-domain Control
Aggregation Protocol. In High Performance Switching and Routing, HPSR 2003, pages
73–78, June 2003.
[160] S. Salsano et al. Inter-domain QoS Signaling: the BGRP Plus Architecture. IETF Draft:
draft-salsano-bgrpp-arch-00.txt (working draft), May 2002.
[161] W. Lai, B. Christian, R. Tibbs, and S. Berghe. A Framework for Internet Traffic Engineer-
ing Measurement. IETF Draft : draft-ietf-tewg-measure-01.txt (working draft), March
2002.
[162] H. Asgari, P. Trimintzios, M. Irons, R. Egan, and G. Pavlou. Building Quality-of-Service
Monitoring Systems for Traffic Engineering and Service Management. Journal of Network
and Systems Management, 11(4):399–426, December 2003.
[163] F. Strohmeier, H. Dorken, and B. Hechenleitner. Aquila Distributed QoS Measurement.
Aquila Project, August 2001.
[164] S. Shalunov and B. Teitelbaum. One-way Active Measurement Protocol (OWAMP) Re-
quirements. RFC 3763 (Informational), April 2004.
[165] K. Glossbrenner. Internet Protocol Data Communication Service - IP Packet Transfer and
Availability Performance Parameters. ITU-T Recommendation I.380, 1999.
[166] IETF IPPM-WG. IP Performance Measurements Working Group.
http:/www.ietf.org/html.charters/ippm-charter.html.
[167] G. Almes, S. Kalidindi, and M. Zekauskas. A One-way Delay Metric for IPPM. RFC
2679 (Proposed Standard), September 1999.
[168] G. Almes, S. Kalidindi, and M. Zekauskas. A One-way Packet Loss Metric for IPPM.
RFC 2680 (Proposed Standard), September 1999.
[169] C. Demichelis and P. Chimento. IP Packet Delay Variation Metric for IP Performance
Metrics (IPPM). RFC 3393 (Proposed Standard), November 2002.
239

BIBLIOGRAPHY
[170] R. Koodli and R. Ravikanth. One-way Loss Pattern Sample Metrics. RFC 3357 (Informa-
tional), August 2002.
[171] G. Almes, S. Kalidindi, and M. Zekauskas. A Round-trip Delay Metric for IPPM. RFC
2681 (Proposed Standard), September 1999.
[172] J. Mahdavi and V. Paxson. IPPM Metrics for Measuring Connectivity. RFC 2678 (Pro-
posed Standard), September 1999.
[173] M. Mathis and M. Allman. A Framework for Defining Empirical Bulk Transfer Capacity
Metrics. RFC 3148 (Informational), July 2001.
[174] S. Kalidindi and M. Zekauskas. Surveyor: An Infrastructure for Internet Performance
Measurements. In INET’99, San Jose, CA, USA, June 1999.
[175] Surveyor Project. http:/www.advanced.org/surveyor.
[176] CAIDA Tools. http://www.caida.org/tools/index.xml.
[177] C. Dovrolis et al. Bandwidth Estimation: Methodologies and Applications.
http://www.caida.org/projects/bwest/presentations/.
[178] C. Demichelis. Packet Delay Variation: Comparison Between ITU-T and IETF Draft
Definitions.
[179] R. Prasad, C. Dovrolis, M.Murray, and K. Claffy. Bandwidth Estimation: Metrics, Mea-
surement Techniques and Tools. IEEE Network, 2003.
[180] J. Patdhye. Modeling TCP Throughput: A Simple Model and Its Empirical Validation.
ACM SIGCOMM’98, 1998.
[181] V. Paxson, A. Adams, and M. Mathis. Experiences with NIMI. In PAM’00, Hamilton,
New Zeland, April 2000.
[182] National Laboratory for Applied Network Research (NLANR). Active Measurement
Project (AMP). http://watt.nlanr.net, August 2001.
[183] L. Cottrell et al. Comparison of some Internet Active End-to-End Performance Measure-
ment Projects. http://www.slac.stanford.edu/comp/net/wan-mon/iepm-cf.html, 1999.
240

BIBLIOGRAPHY
[184] J. Park, J. Baek, and J. Hong. Management of Service Level Agreements for Multimedia
Internet Service Using a Utility Model. IEEE Communications Magazine, May 2001.
[185] F. Baker, K. Chan, and A. Smith. Management Information Base for the Differentiated
Services Architecture. RFC 3289 (Proposed Standard), May 2002.
[186] Cisco Systems. NetFlow. http://www.cisco.com/warp/public/cc/pd/iosw/ioft/neflct/tech/
napps_wp.htm.
[187] Waikato University. DAG-Project. http://wand.cs.waikato.ac.nz.
[188] J. Coppens, S. Berghe, H. Bos, E. Markatos, F. Turck, A. Oslebo, and S. Ubik. SCAMPI:
A Scalable and Programmable Architecture for Monitoring Gigabit Networks. In 6th
IFIP/IEEE International Conference on Management of Multimedia Networks and Ser-
vices - MMNS’03, September 2003.
[189] I. Cozzani and S. Giordano. Traffic Sampling Methods for End-to-End QoS Evaluation
in Large Heterogeneous Networks. Computer Networks and ISDN Systems, September
1998.
[190] A. Liakopoulos. D2.1 - Monitoring and Verifying Premium IP SLAs. Sequin Project,
April 2002.
[191] J. Corral, G. Texier, and L. Toutain. End-to-end Active Measurement Architecture in IP
Networks (SATURNE). In PAM’03, 2003.
[192] B. Lowekamp. Combining Active and Passive Network Measurements to Build Scalable
Monitoring Systems on the Grid. ACM Performance Evaluation Review, 30(4):19–26,
2003.
[193] Thomas Lindh. A New Approach to Performance Monitoring in IP Networks - Combining
Active and Passive Methods. In PAM’02, Fort Collins CO, March 2002.
[194] P. Yuan, J. Schlembach, A. Skoe, and E. Knightly. Design and Implementation of Scalable
Edge-based Admission Control. Computer Networks, 37:507–518, 2001.
[195] V. Paxson. On calibrating measurements of packet transit times. In ACM Sigmetrics, pages
11–21, June 1998.
241
BIBLIOGRAPHY
[196] G. Huston. Measuring IP Network Performance. The Internet Protocol Journal, 6(1):2–
19, March 2003.
[197] T. McGregor, H-W. Braun, and J. Brown. The NLANR Network Analysis Infrastructure.
IEEE Communications Magazine, 38(5), May 2000.
[198] R. Whitner, G. Pollock, and C. Cook. On Active Measurements in QoS-Enabled IP Net-
works. In PAM’02, Fort Collins CO, March 2002.
[199] J. Hill. Assessing the Accuracy of Active Probes for Determining Network Delay, Jitter
and Loss. Master’s thesis, MSc in High Performance Computing, University of Edinburgh,
2002.
[200] J. Kim and J. Hong. Monitoring Edge-to-Edge Traffic Aggregates in Differentiated Ser-
vices Networks. Journal of Network and Systems Management, Special Issue on IP Op-
erations and Management, 9(3), September 2001.
[201] C. Dovrolis, P. Ramanathan, and D. Moore. What Do Packet Dispersion Techniques
Measure? In IEEE INFOCOM’01, 2001.
[202] C. Dovrolis and M. Jain. Pathload: A Measurement Tool for End-to-End Available Band-
width. In PAM’02, Fort Collins CO, March 2002.
[203] V.Reijs. Tools for measuring the SLS metric.
http://www.heanet.ie/Heanet/projects/nat_infrastruct/nettools.html, July 2002.
[204] C. Man, G. Hasegawa, and M. Murata. A New Available Bandwidth Measurement
Technique for Service Overlay Networks. In 6th IFIP/IEEE International Conference,
MMNS’03, pages 436–448, September 2003.
[205] X. Xiao, A. Hannan, B. Bailey, and L. Ni. Traffic Engineering with MPLS in the Internet.
IEEE Network, 14(2):28–33, March/April 2000.
[206] Cisco Systems White Paper. Service Provider Quality-of-Service Overview.
http://www.cisco.com/warp/public/cc/so/neso/sqso/spqos_wp.pdf.
[207] J. Roberts. IP traffic and QoS Control: the need for flow aware networking, June 2003.
[208] N. Tang, S. Tsui, L. Wang, and M. Gerla. A Survey of Admission Control Algorithms.
CS215, 1998.
242

BIBLIOGRAPHY
[209] L. Breslau and S. Jamin. Measurement-based Admission Control: What is the Research
Agenda? In IEEE IWQoS’99, 1999.
[210] C. Partridge. Isochronous applications do not require jitter-controlled networks. RFC
1257 (Informational), September 1991.
[211] S. Floyd. Comments on measurement-based admissions control for controlled-load ser-
vices. Technical report, LBNL, 1996.
[212] V. S. Frost and B. Melamed. Traffic Modeling for Telecommunications Networks. IEEE
Communications Magazine, 32(3):70–81, March 1994.
[213] J. Hayes. Modeling and Analysis of Computer Communications Networks (Applications
of Communications Theory). Plenum Publishing Corporation, December 1984.
[214] S. Bohacek, J. Hespanha, J. Lee, and K. Obraczka. A hybrid systems modeling framework
for fast and accurate simulation of data communication networks. In SIGMETRICS ’03:
Proceedings of the 2003 ACM SIGMETRICS international conference on Measurement
and modeling of computer systems, pages 58–69, New York, NY, USA, 2003. ACM Press.
[215] OMNeT++ Community Site. http://www.omnetpp.org.
[216] The VINT Project. The Network Simulator. http://www.isi.edu/nsnam/ns.
[217] V. Paxson and S. Floyd. Why We Don’t Know How to Simulate the Internet. In S. An-
dradóttir, K. J. Healy, D. H. Withers, and B. L. Nelson, editors, Winter Simulation Con-
ference, pages 1037–1044, 1997.
[218] Vint Project. Virtual InterNetwok Testbed. http://www.isi.edu/nsnam/vint/index.html.
[219] The VINT Project. The ns Manual. http://www.isi.edu/nsnam/ns, October 2003.
[220] OMNeT++ - Mail Archive. http://www.omnetpp.org/listarchive/msg01965.php.
[221] Gnumeric - Gnu Office Spreadsheet. http://www.gnome.org/projects/gnumeric.
[222] Gnuplot Homepage. http://www.gnuplot.info.
[223] M. Przybylski and S. Trocha. Network Measurement Tools Test - Part II (draft).
http://qos.man.poznan.pl/files/measurement2.pdf, July 2001.
243

BIBLIOGRAPHY
[224] TF-NGN - Mail Archive. http://www.terena.nl/mail-archives/tf-ngn.
[225] P. Flegkas, P. Trimintzios, and G. Pavlou. A Policy-Based Quality of Service Management
System for IP Diffserv Networks. IEEE Network, 16(2):50–56, "March/April" 2002.
[226] P. Flegkas et al. On Policy-Based Extensible Hierarchical Network Management in QoS-
enable IP Networks. In IEEE Workshop on Policies in Dist. Systems Networks, pages
230–246, January 2001.
[227] C. de Laat, G. Gross, L. Gommans, J. Vollbrecht, and D. Spence. Generic AAA Architec-
ture. RFC 2903 (Experimental), August 2000.
[228] H. Schulzrinne. Measurement Tools. http://www.cs.columbia.edu/ hgs/internet/tools.html,
August 2004.
244