Embed Size (px)
Citation preview
U. S. Department of the Interior
U.S. Geological Survey
A Dual Drawworks Controller for Borehole Tomography
Thomas P. Grover1 , Roy P. Kipfinger1 , and David L. Wright1
Open-File Report #93-324
Any use of trade, product, or firm names is for descriptive purposes only and does not imply endorsement by the U.S. Geological Survey.
Denver, CO
1993
CONTENTS
PageIntroduction 4Operator controls 5System block diagram 6Servo control analysis 8Master speed control 8Slave speed control 10Power control 11Slave communication 13Operating Experience - 13References 15Appendix: Circuit descriptions 16
FIGURES
PageFigure 1. Schematic of hole-to-hole tomography system 4 Figure 2. Operator winch-control consoles 6 Figure 3. System control block diagram 7 Figure 4. Control loop 8 Figure 5. Master output logic - ~ 9 Figure 6. Output control logic 11 Figure 7. Power control 12 Figure 8. Slave interface 14 Figure 9. Depth display and alarm schematic - one digit 19 Figure 10. Master speed control and display 20 Figure 11. Error counter and frequency-to-voltage converter 21 Figure 12. Slave speed control and depth power 22 Figure 13. Encoder interface and audible alarm 23 Figure 14. Motor control and alarm logic 24 Figure 15. Slave tension alarm and digital depth display 25 Figure 16. Power interface 26 Figure 17. Slave power control circuits 27 Figure 18. Master tension display 28 Figure 19. Tension alarm sense/latch 29 Figure 20. Slave tension display 30 Figure 21. Slave tension sense and analog to digital conversion 31 Figure 22. Slave tension data clocks 32 Figure 23. Fiber optic interface and master 33 Figure 24. Slave optical receiver 34 Figure 25. Slave data transmitter 35 Figure 26. Master to slave control link 36 Figure 27. Master link clocks 37
1. Introduction
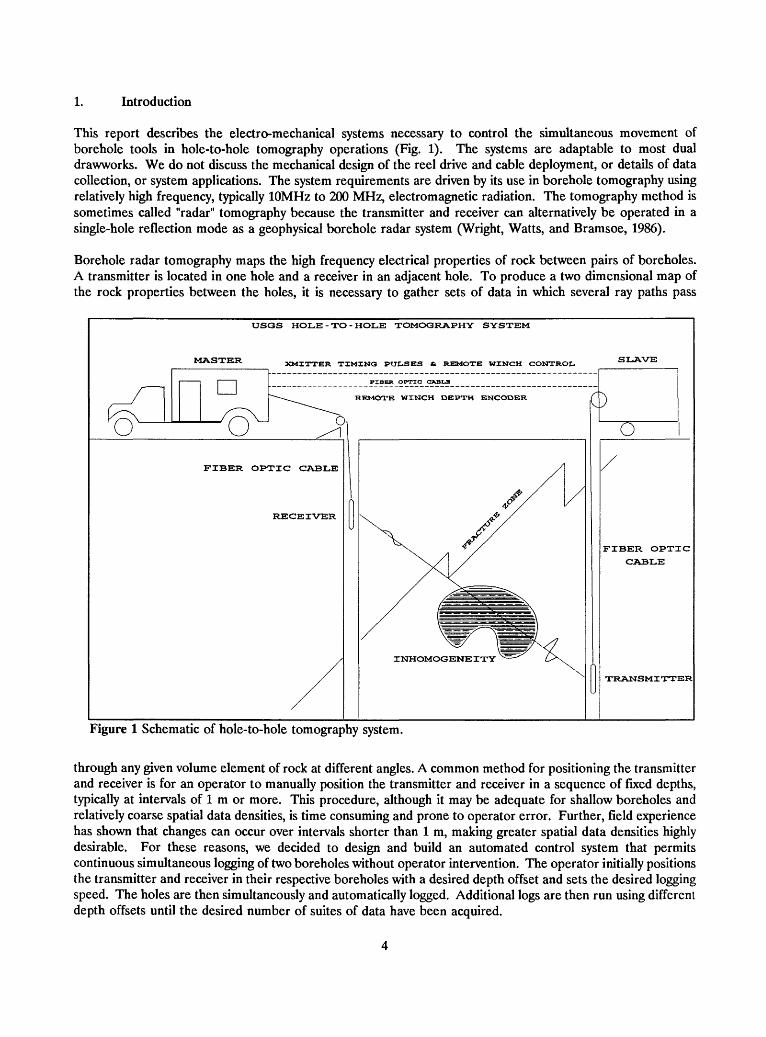
This report describes the electro-mechanical systems necessary to control the simultaneous movement of borehole tools in hole-to-hole tomography operations (Fig. 1). The systems are adaptable to most dual drawworks. We do not discuss the mechanical design of the reel drive and cable deployment, or details of data collection, or system applications. The system requirements are driven by its use in borehole tomography using relatively high frequency, typically 10MHz to 200 MHz, electromagnetic radiation. The tomography method is sometimes called "radar" tomography because the transmitter and receiver can alternatively be operated in a single-hole reflection mode as a geophysical borehole radar system (Wright, Watts, and Bramsoe, 1986).
Borehole radar tomography maps the high frequency electrical properties of rock between pairs of boreholes. A transmitter is located in one hole and a receiver in an adjacent hole. To produce a two dimensional map of the rock properties between the holes, it is necessary to gather sets of data in which several ray paths pass
MASTER
USGS HOLE-TO-HOLE TOMOGRAPHY SYSTEM
XMITTER TIMING PULSES & REMOTE WINCH CONTROL
FIBER OPTIC GABLB
REMOTE WINCH DEPTH ENCODER
FIBER OPTIC CABLE
RECEIVER
INHOMOGENEITY
C)
FIBER OPTIC
CABLE
TRANSMITTER
Figure 1 Schematic of hole-to-hole tomography system.
through any given volume element of rock at different angles. A common method for positioning the transmitter and receiver is for an operator to manually position the transmitter and receiver in a sequence of fixed depths, typically at intervals of 1 m or more. This procedure, although it may be adequate for shallow boreholes and relatively coarse spatial data densities, is time consuming and prone to operator error. Further, field experience has shown that changes can occur over intervals shorter than 1 m, making greater spatial data densities highly desirable. For these reasons, we decided to design and build an automated control system that permits continuous simultaneous logging of two boreholes without operator intervention. The operator initially positions the transmitter and receiver in their respective boreholes with a desired depth offset and sets the desired logging speed. The holes are then simultaneously and automatically logged. Additional logs are then run using different depth offsets until the desired number of suites of data have been acquired.
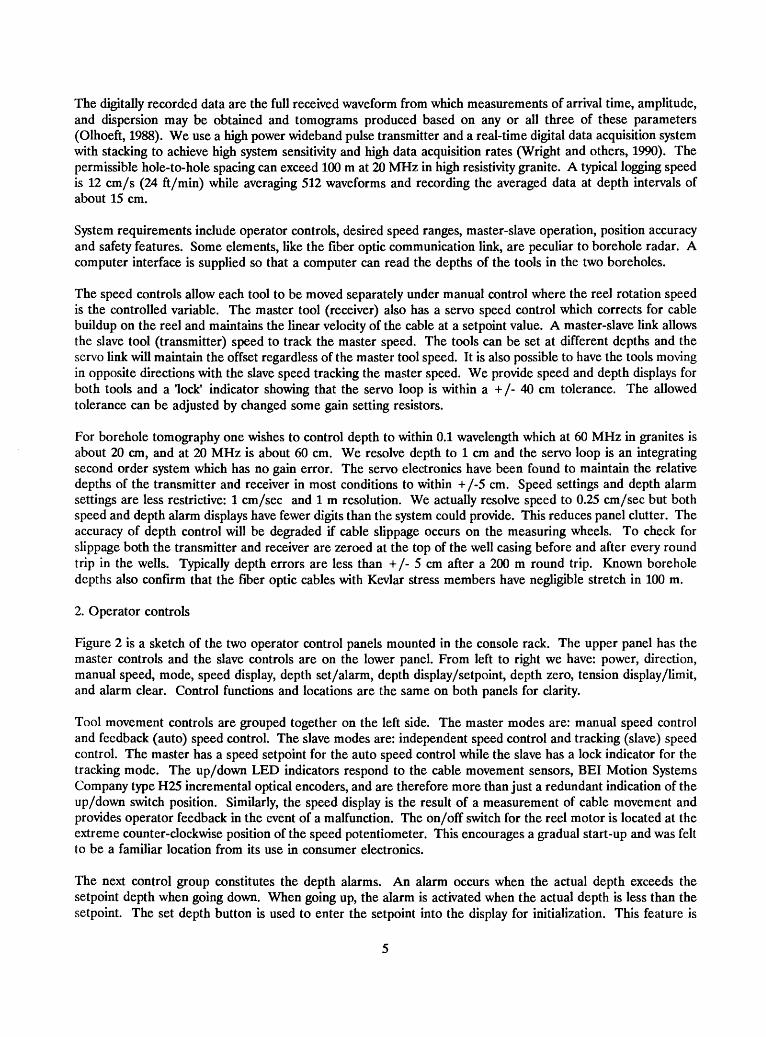
The digitally recorded data are the full received waveform from which measurements of arrival time, amplitude, and dispersion may be obtained and tomograms produced based on any or all three of these parameters (Olhoeft, 1988). We use a high power wideband pulse transmitter and a real-time digital data acquisition system with stacking to achieve high system sensitivity and high data acquisition rates (Wright and others, 1990). The permissible hole-to-hole spacing can exceed 100 m at 20 MHz in high resistivity granite. A typical logging speed is 12 cm/s (24 ft/min) while averaging 512 waveforms and recording the averaged data at depth intervals of about 15 cm.
System requirements include operator controls, desired speed ranges, master-slave operation, position accuracy and safety features. Some elements, like the fiber optic communication link, are peculiar to borehole radar. A computer interface is supplied so that a computer can read the depths of the tools in the two boreholes.
The speed controls allow each tool to be moved separately under manual control where the reel rotation speed is the controlled variable. The master tool (receiver) also has a servo speed control which corrects for cable buildup on the reel and maintains the linear velocity of the cable at a setpoint value. A master-slave link allows the slave tool (transmitter) speed to track the master speed. The tools can be set at different depths and the servo link will maintain the offset regardless of the master tool speed. It is also possible to have the tools moving in opposite directions with the slave speed tracking the master speed. We provide speed and depth displays for both tools and a 'lock' indicator showing that the servo loop is within a +/- 40 cm tolerance. The allowed tolerance can be adjusted by changed some gain setting resistors.
For borehole tomography one wishes to control depth to within 0.1 wavelength which at 60 MHz in granites is about 20 cm, and at 20 MHz is about 60 cm. We resolve depth to 1 cm and the servo loop is an integrating second order system which has no gain error. The servo electronics have been found to maintain the relative depths of the transmitter and receiver in most conditions to within + /-5 cm. Speed settings and depth alarm settings are less restrictive: 1 cm/sec and 1 m resolution. We actually resolve speed to 0.25 cm/sec but both speed and depth alarm displays have fewer digits than the system could provide. This reduces panel clutter. The accuracy of depth control will be degraded if cable slippage occurs on the measuring wheels. To check for slippage both the transmitter and receiver are zeroed at the top of the well casing before and after every round trip in the wells. Typically depth errors are less than +/- 5 cm after a 200 m round trip. Known borehole depths also confirm that the fiber optic cables with Kevlar stress members have negligible stretch in 100 m.
2. Operator controls
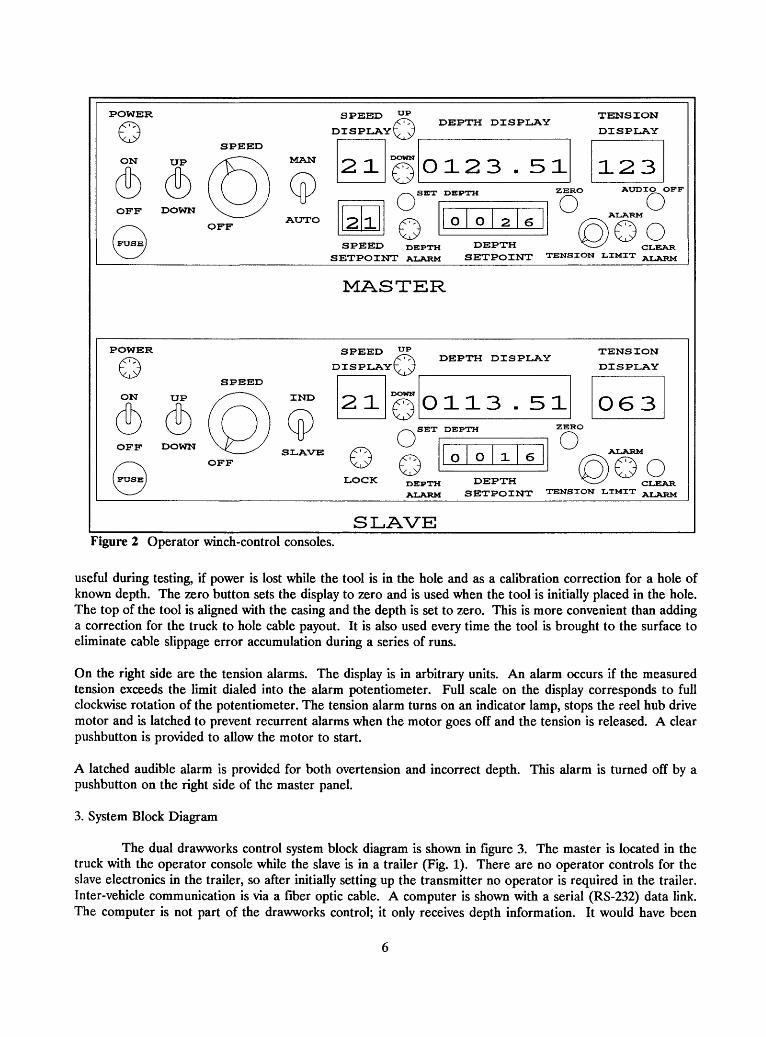
Figure 2 is a sketch of the two operator control panels mounted in the console rack. The upper panel has the master controls and the slave controls are on the lower panel. From left to right we have: power, direction, manual speed, mode, speed display, depth set/alarm, depth display/setpoint, depth zero, tension display/limit, and alarm clear. Control functions and locations are the same on both panels for clarity.
Tool movement controls are grouped together on the left side. The master modes are: manual speed control and feedback (auto) speed control. The slave modes are: independent speed control and tracking (slave) speed control. The master has a speed setpoint for the auto speed control while the slave has a lock indicator for the tracking mode. The up/down LED indicators respond to the cable movement sensors, BEI Motion Systems Company type H25 incremental optical encoders, and are therefore more than just a redundant indication of the up/down switch position. Similarly, the speed display is the result of a measurement of cable movement and provides operator feedback in the event of a malfunction. The on/off switch for the reel motor is located at the extreme counter-clockwise position of the speed potentiometer. This encourages a gradual start-up and was felt to be a familiar location from its use in consumer electronics.
The next control group constitutes the depth alarms. An alarm occurs when the actual depth exceeds the setpoint depth when going down. When going up, the alarm is activated when the actual depth is less than the setpoint. The set depth button is used to enter the setpoint into the display for initialization. This feature is
POWER
© E SPEED
ON UP XfT ~\ MAN
OFF DOWN \^^^/
^v OFF AUT°
(FUSE]
s
SPEED UP
ISPLAY^^)
21
21
DOWN __
x v SET
DEPTH DISPLAY
123 51
TENSION
DISPLAY
123DEPTH ZERO AUDIO OFF o °
O O 2 6^^
ALARM
x-j-x v^y ^^L^ ^-^SPEED DEPTH DEPTH *^ / CLEAR
ETPOINT ALARM SETPOINT TENSION LIMIT ALARM
MASTER
POWER
SPEED
ON UP X"" ~~\ IND
OFF DOWN ^^__^S e^-LAVE
©OFF
SPEED up
HSPLAY^^
21DOWN ^^
oSBTLOCK DEPTI
ALARt
DEPTH DISPLAY
113 - 51
TENSION
DISPLAY
O63DEPTH ZERO
( )
0016
f DEPTH 4 SETPOINT TENST
ALARM
^^ s CLEAR ON LTMIT ALARM
SLAVEFigure 2 Operator winch-control consoles.
useful during testing, if power is lost while the tool is in the hole and as a calibration correction for a hole of known depth. The zero button sets the display to zero and is used when the tool is initially placed in the hole. The top of the tool is aligned with the casing and the depth is set to zero. This is more convenient than adding a correction for the truck to hole cable payout. It is also used every time the tool is brought to the surface to eliminate cable slippage error accumulation during a series of runs.
On the right side are the tension alarms. The display is in arbitrary units. An alarm occurs if the measured tension exceeds the limit dialed into the alarm potentiometer. Full scale on the display corresponds to full clockwise rotation of the potentiometer. The tension alarm turns on an indicator lamp, stops the reel hub drive motor and is latched to prevent recurrent alarms when the motor goes off and the tension is released. A clear pushbutton is provided to allow the motor to start.
A latched audible alarm is provided for both overtension and incorrect depth. This alarm is turned off by a pushbutton on the right side of the master panel.
3. System Block Diagram
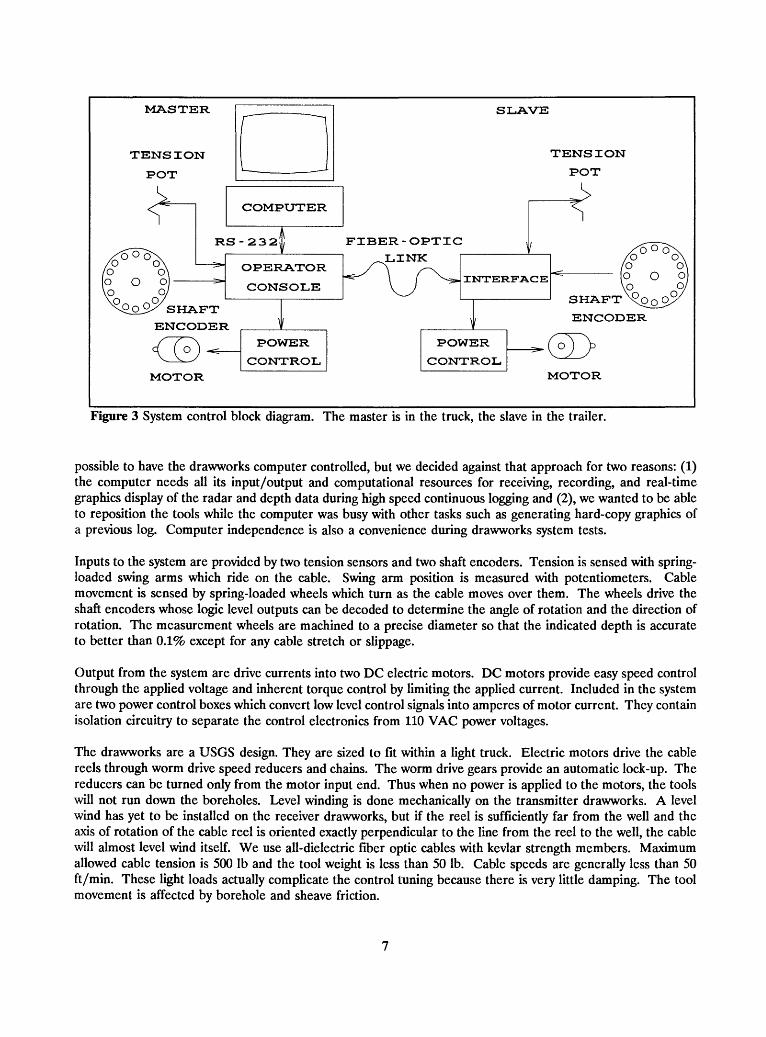
The dual drawworks control system block diagram is shown in figure 3. The master is located in the truck with the operator console while the slave is in a trailer (Fig. 1). There are no operator controls for the slave electronics in the trailer, so after initially setting up the transmitter no operator is required in the trailer. Inter-vehicle communication is via a fiber optic cable. A computer is shown with a serial (RS-232) data link. The computer is not part of the drawworks control; it only receives depth information. It would have been
MASTE
TENS I Ol
POT
ky5
/^^\1° °\[o O o \p Q/
\°_Qj>/ SHA
ENCO
<EMOTO]
:R
tsT
R
^__^
.FT
DEE
)-R
S
>
r~ "^-1
u__ __________ __.
COMPUTER
-232JJ
OPERATOR
CONSOLE
VPOWER
CONTROL
SLAVE
TENSION
POT
A"-S
FIBER-OPTIC w ^=r~-^V x6oo\LINK /O <J\
/^L x- \ /O O\ *5"' \ 1 ^=~ INTERFACE 1° ^ uj
»jiJ.«..i_' JL \y O zi^
y ENCODER
POWER __ ̂ (V) \ CONTROL V^i_y
MOTOR
Figure 3 System control block diagram. The master is in the truck, the slave in the trailer.
possible to have the drawworks computer controlled, but we decided against that approach for two reasons: (1) the computer needs all its input/output and computational resources for receiving, recording, and real-time graphics display of the radar and depth data during high speed continuous logging and (2), we wanted to be able to reposition the tools while the computer was busy with other tasks such as generating hard-copy graphics of a previous log. Computer independence is also a convenience during drawworks system tests.
Inputs to the system are provided by two tension sensors and two shaft encoders. Tension is sensed with spring- loaded swing arms which ride on the cable. Swing arm position is measured with potentiometers. Cable movement is sensed by spring-loaded wheels which turn as the cable moves over them. The wheels drive the shaft encoders whose logic level outputs can be decoded to determine the angle of rotation and the direction of rotation. The measurement wheels are machined to a precise diameter so that the indicated depth is accurate to better than 0.1% except for any cable stretch or slippage.
Output from the system are drive currents into two DC electric motors. DC motors provide easy speed control through the applied voltage and inherent torque control by limiting the applied current. Included in the system are two power control boxes which convert low level control signals into amperes of motor current. They contain isolation circuitry to separate the control electronics from 110 VAC power voltages.
The drawworks are a USGS design. They are sized to fit within a light truck. Electric motors drive the cable reels through worm drive speed reducers and chains. The worm drive gears provide an automatic lock-up. The reducers can be turned only from the motor input end. Thus when no power is applied to the motors, the tools will not run down the boreholes. Level winding is done mechanically on the transmitter drawworks. A level wind has yet to be installed on the receiver drawworks, but if the reel is sufficiently far from the well and the axis of rotation of the cable reel is oriented exactly perpendicular to the line from the reel to the well, the cable will almost level wind itself. We use all-dielectric fiber optic cables with kevlar strength members. Maximum allowed cable tension is 500 Ib and the tool weight is less than 50 Ib. Cable speeds are generally less than 50 ft/min. These light loads actually complicate the control tuning because there is very little damping. The tool movement is affected by borehole and sheave friction.
4. Servo Control Analysis
HI
PASS
LO
PASS
MASTER
SPEED
M
M-S
00
00-H
-L- S
ELECTRONIC MECHANICAL
SYSTEM EQUATION
USING LAPLACE
NOTATION
H = HI-PASS TIME CONSTANT
L = LO-PASS TIME CONSTANT
IF H = L THEN (M-S)=EXP(-TIME)
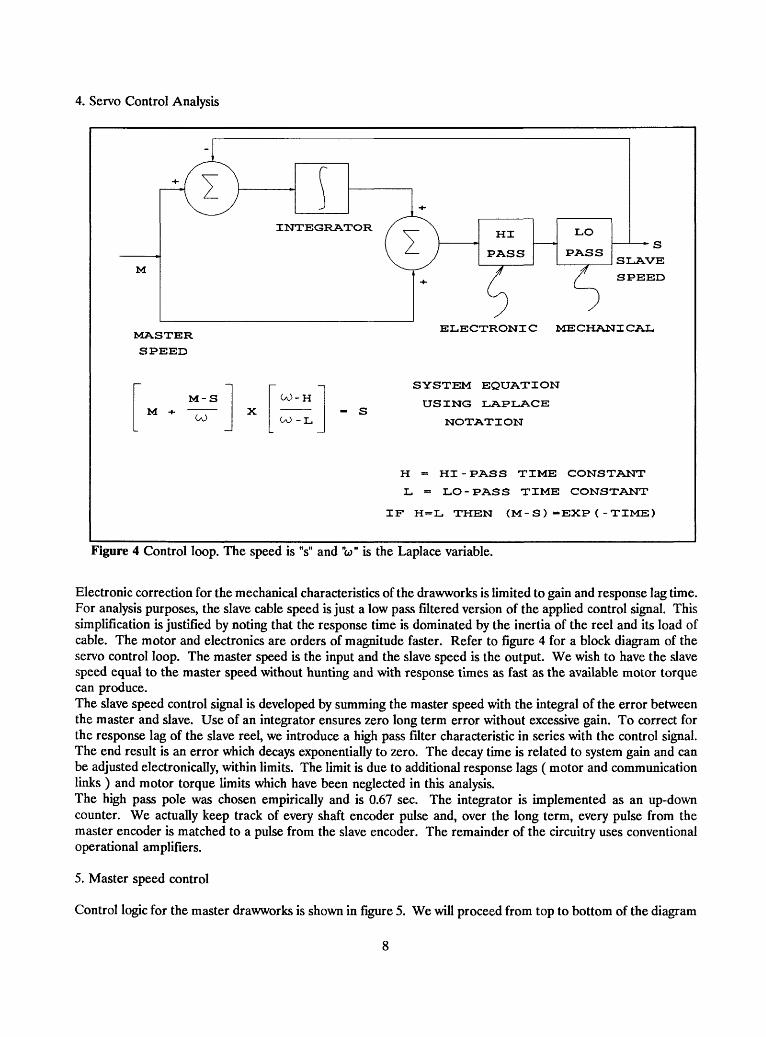
Figure 4 Control loop. The speed is "s" and V is the Laplace variable.
Electronic correction for the mechanical characteristics of the drawworks is limited to gain and response lag time. For analysis purposes, the slave cable speed is just a low pass filtered version of the applied control signal. This simplification is justified by noting that the response time is dominated by the inertia of the reel and its load of cable. The motor and electronics are orders of magnitude faster. Refer to figure 4 for a block diagram of the servo control loop. The master speed is the input and the slave speed is the output. We wish to have the slave speed equal to the master speed without hunting and with response times as fast as the available motor torque can produce.The slave speed control signal is developed by summing the master speed with the integral of the error between the master and slave. Use of an integrator ensures zero long term error without excessive gain. To correct for the response lag of the slave reel, we introduce a high pass filter characteristic in series with the control signal. The end result is an error which decays exponentially to zero. The decay time is related to system gain and can be adjusted electronically, within limits. The limit is due to additional response lags ( motor and communication links ) and motor torque limits which have been neglected in this analysis.The high pass pole was chosen empirically and is 0.67 sec. The integrator is implemented as an up-down counter. We actually keep track of every shaft encoder pulse and, over the long term, every pulse from the master encoder is matched to a pulse from the slave encoder. The remainder of the circuitry uses conventional operational amplifiers.
5. Master speed control
Control logic for the master drawworks is shown in figure 5. We will proceed from top to bottom of the diagram
8
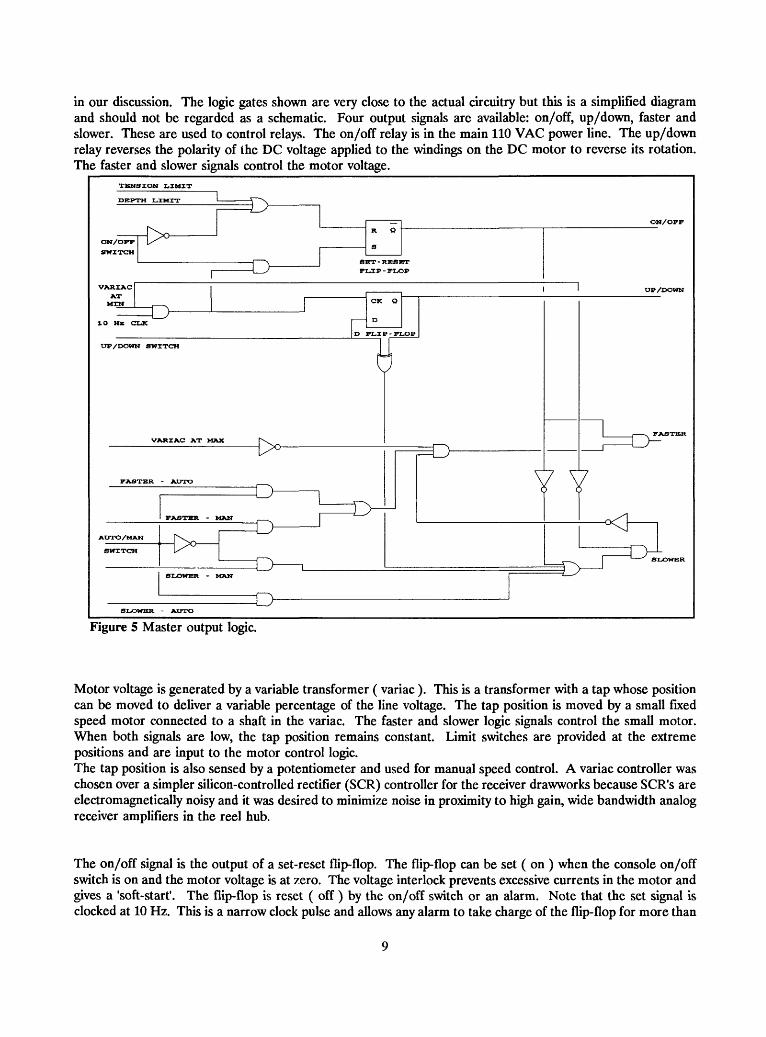
in our discussion. The logic gates shown are very close to the actual circuitry but this is a simplified diagram and should not be regarded as a schematic. Four output signals are available: on/off, up/down, faster and slower. These are used to control relays. The on/off relay is in the main 110 VAC power line. The up/down relay reverses the polarity of the DC voltage applied to the windings on the DC motor to reverse its rotation. The faster and slower signals control the motor voltage.
TENSION LIMIT
SLOWER - AUTO
Figure 5 Master output logic.
Motor voltage is generated by a variable transformer ( variac ). This is a transformer with a tap whose position can be moved to deliver a variable percentage of the line voltage. The tap position is moved by a small fixed speed motor connected to a shaft in the variac. The faster and slower logic signals control the small motor. When both signals are low, the tap position remains constant. Limit switches are provided at the extreme positions and are input to the motor control logic.The tap position is also sensed by a potentiometer and used for manual speed control. A variac controller was chosen over a simpler silicon-controlled rectifier (SCR) controller for the receiver drawworks because SCR's are electromagnetically noisy and it was desired to minimize noise in proximity to high gain, wide bandwidth analog receiver amplifiers in the reel hub.
The on/off signal is the output of a set-reset flip-flop. The flip-flop can be set ( on ) when the console on/off switch is on and the motor voltage is at zero. The voltage interlock prevents excessive currents in the motor and gives a 'soft-start1 . The flip-flop is reset ( off ) by the on/off switch or an alarm. Note that the set signal is clocked at 10 Hz. This is a narrow clock pulse and allows any alarm to take charge of the flip-flop for more than
99% of the time, thus effectively over-riding any set signal. The motor relay cannot respond to the narrow clock pulse.
The up/down control signal is generated by a 'D' flip-flop. The flip-flop output equals the up/down switch input after a clock pulse is received. The clock pulse is prevented from reaching the flip-flop except when the motor speed control is at zero. This speed interlock prevents motor damage due to the over-current condition which would occur if the supply voltage were reversed while the motor was rotating. Note the exclusive-or gate connected between the up/down switch and the up/down control voltage. This gate forces the slower output on whenever a change of direction is requested by the operator. That is, even if the operator neglects to reduce the motor speed before changing direction, the logic will still force the speed to zero before reversing the motor.
An increase in motor speed will occur if comparison logic (Schematic in Fig. 10) calls for it and the variac is not at its maximum position and the slower output is off and the on/off control signal is on. The comparison logic operates on two inputs: an analog comparison of the variac tap position versus the manual speed potentiometer position and a digital comparison of the auto speed control setpoint versus the measured speed from the shaft encoder pulse rate. The auto/manual switch controls which 'faster' signal is used.
A decrease in motor speed will occur if requested by comparison logic ( not shown ), if a change in direction is requested, if the on/off control goes off, and the variac is not at its minimum output position. The motor voltage is thus automatically taken to zero by an alarm or by shutting down the drawworks. This ensures a soft-start when operation resumes.
6. Slave Speed Control
The drawworks slave uses a commercial phase-control SCR circuit rather than a variac to generate the DC voltage for the reel hub motor. Direction ( up/down ) and on/off are controlled by relays. The slave also has a local/remote switch at the SCR motor control box. The local position of the switch allows on/off, up/down and speed control ( via a potentiometer ) at the slave reel. This is convenient for docking and initial setup. Control logic for the slave is located in the operator console in the master vehicle. The power electronics is located in the slave vehicle. The master directs control data to the slave; the slave directs shaft encoder ( cable movement ) and tension data to the master.
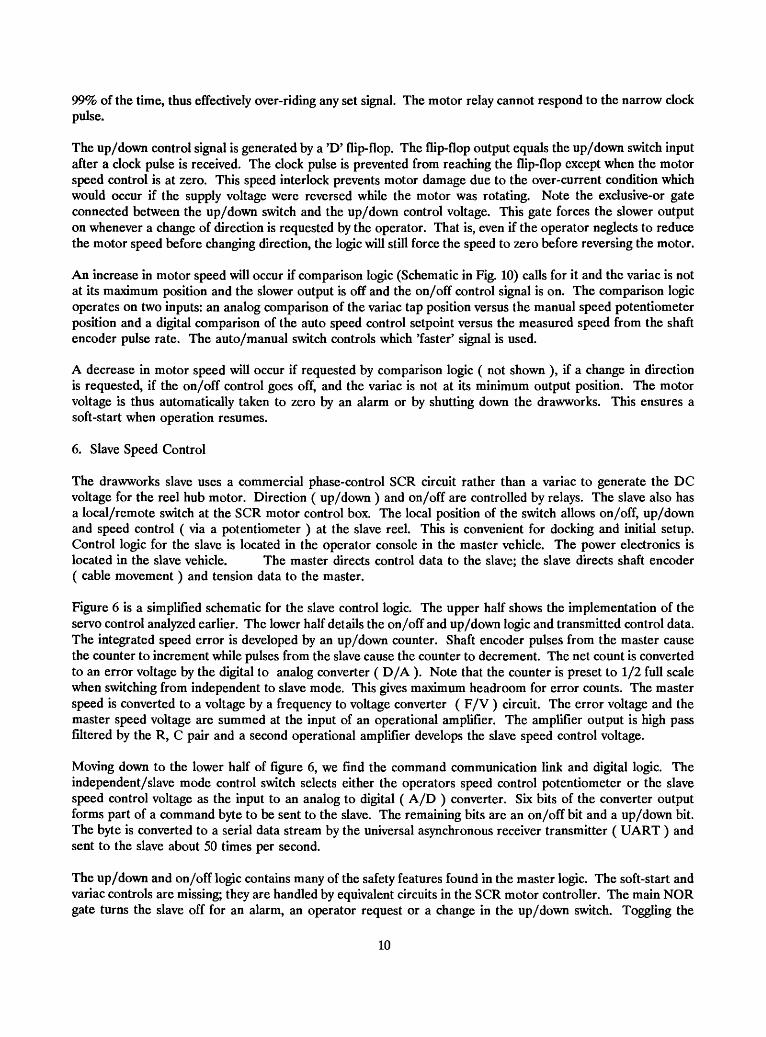
Figure 6 is a simplified schematic for the slave control logic. The upper half shows the implementation of the servo control analyzed earlier. The lower half details the on/off and up/down logic and transmitted control data. The integrated speed error is developed by an up/down counter. Shaft encoder pulses from the master cause the counter to increment while pulses from the slave cause the counter to decrement. The net count is converted to an error voltage by the digital to analog converter ( D/A ). Note that the counter is preset to 1/2 full scale when switching from independent to slave mode. This gives maximum headroom for error counts. The master speed is converted to a voltage by a frequency to voltage converter ( F/V ) circuit. The error voltage and the master speed voltage are summed at the input of an operational amplifier. The amplifier output is high pass filtered by the R, C pair and a second operational amplifier develops the slave speed control voltage.
Moving down to the lower half of figure 6, we find the command communication link and digital logic. The independent/slave mode control switch selects either the operators speed control potentiometer or the slave speed control voltage as the input to an analog to digital ( A/D ) converter. Six bits of the converter output forms part of a command byte to be sent to the slave. The remaining bits are an on/off bit and a up/down bit. The byte is converted to a serial data stream by the universal asynchronous receiver transmitter ( UART ) and sent to the slave about 50 times per second.
The up/down and on/off logic contains many of the safety features found in the master logic. The soft-start and variac controls are missing; they are handled by equivalent circuits in the SCR motor controller. The main NOR gate turns the slave off for an alarm, an operator request or a change in the up/down switch. Toggling the
10
SLAVE
DEPTH
ENCODER
MASTER
DEPTH
ENCODER
UP/DOWN COUNTER
CONTROL
VOLTAGE
ED POT
UP /DOWN SWITCH
ONE
SHOT
D rrTENSION ALARM
DEPTH HALT
ON/OFF SWITCH
FIBER OPTIC
OUTPUT
OUTPUT CONTROL LOGIC
Figure 6 Output control logic.
up/down switch triggers a three second pulse from the one-shot. This pulse turns the slave off long enough to bring the reel hub to a complete stop. Note that the up/down bit is delayed relative to the one shot pulse. This guarantees that the motor current will be zero before the up/down relay is switched.
7. Power Control
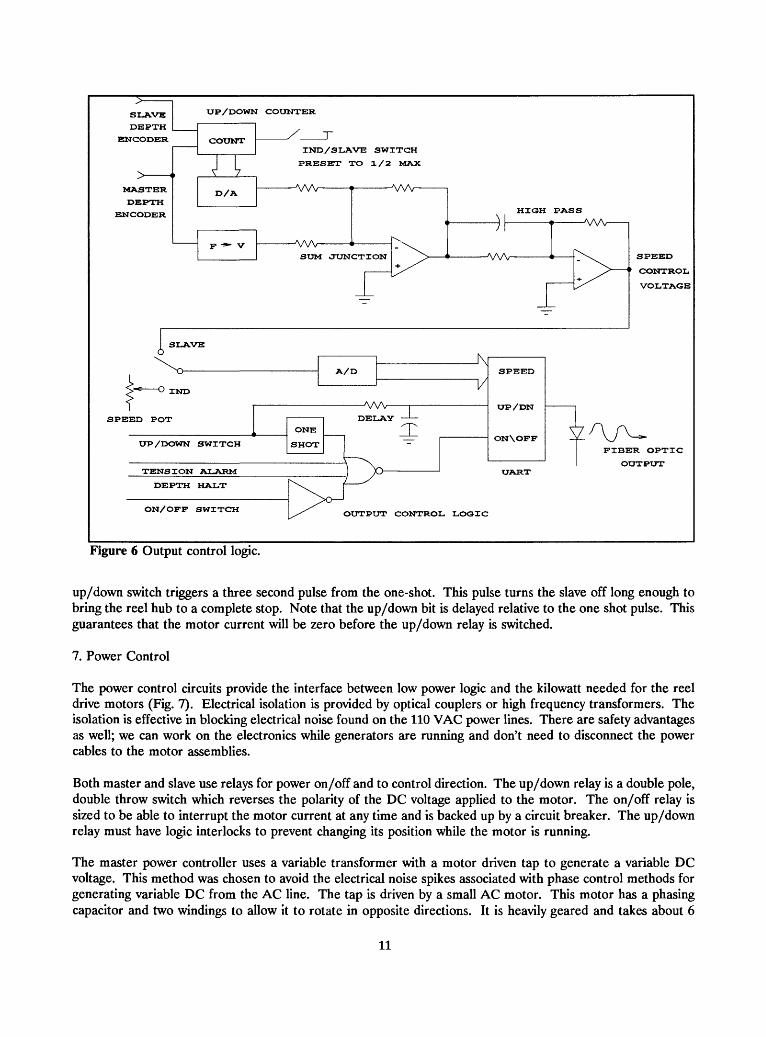
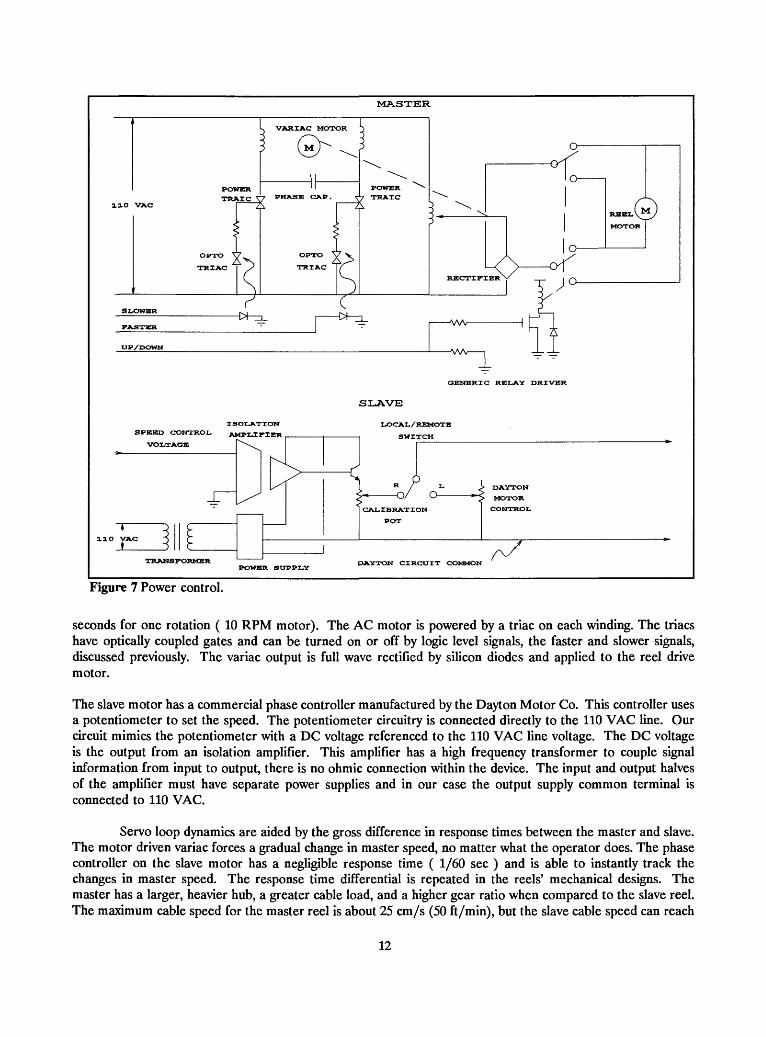
The power control circuits provide the interface between low power logic and the kilowatt needed for the reel drive motors (Fig. 7). Electrical isolation is provided by optical couplers or high frequency transformers. The isolation is effective in blocking electrical noise found on the 110 VAC power lines. There are safety advantages as well; we can work on the electronics while generators are running and don't need to disconnect the power cables to the motor assemblies.
Both master and slave use relays for power on/off and to control direction. The up/down relay is a double pole, double throw switch which reverses the polarity of the DC voltage applied to the motor. The on/off relay is sized to be able to interrupt the motor current at any time and is backed up by a circuit breaker. The up/down relay must have logic interlocks to prevent changing its position while the motor is running.
The master power controller uses a variable transformer with a motor driven tap to generate a variable DC voltage. This method was chosen to avoid the electrical noise spikes associated with phase control methods for generating variable DC from the AC line. The tap is driven by a small AC motor. This motor has a phasing capacitor and two windings to allow it to rotate in opposite directions. It is heavily geared and takes about 6
11
MASTER
QENERZG RELA.Y DRXVER
SLAVE
ISOLATION
SPBBD CONTROL
VOLTAGE
LOCAL/REMOTE
SWITCH
TRANSFORMERPOWER SUPPLY
DAYTON CIRCUZT COMMON
Figure 7 Power control.
seconds for one rotation ( 10 RPM motor). The AC motor is powered by a triac on each winding. The triacs have optically coupled gates and can be turned on or off by logic level signals, the faster and slower signals, discussed previously. The variac output is full wave rectified by silicon diodes and applied to the reel drive motor.
The slave motor has a commercial phase controller manufactured by the Dayton Motor Co. This controller uses a potentiometer to set the speed. The potentiometer circuitry is connected directly to the 110 VAC line. Our circuit mimics the potentiometer with a DC voltage referenced to the 110 VAC line voltage. The DC voltage is the output from an isolation amplifier. This amplifier has a high frequency transformer to couple signal information from input to output, there is no ohmic connection within the device. The input and output halves of the amplifier must have separate power supplies and in our case the output supply common terminal is connected to 110 VAC.
Servo loop dynamics are aided by the gross difference in response times between the master and slave. The motor driven variac forces a gradual change in master speed, no matter what the operator does. The phase controller on the slave motor has a negligible response time ( 1/60 sec ) and is able to instantly track the changes in master speed. The response time differential is repeated in the reels' mechanical designs. The master has a larger, heavier hub, a greater cable load, and a higher gear ratio when compared to the slave reel. The maximum cable speed for the master reel is about 25 cm/s (50 ft/min), but the slave cable speed can reach
12
30 cm/s (60 ft/min).
8. Slave communication
Communication between master and slave is carried over a fiber optic link (Fig. 1). This reduces ground loop problems because the master and slave often use separate motor-generator sets for 110 VAC power. The link is immune to electrical noise, does not need to be insulated from wet ground, will not cause a electrical shock hazard if severed by a vehicle and has better high frequency performance than a digital logic line of similar length. All data on this link are converted to digital information, packed into eight bit ( one byte ) characters and transmitted serially. Serial transmission is asynchronous with start and stop bits and a parity check bit to preserve data integrity. The link is full duplex with no hand-shaking as the associated circuitry is fully dedicated.
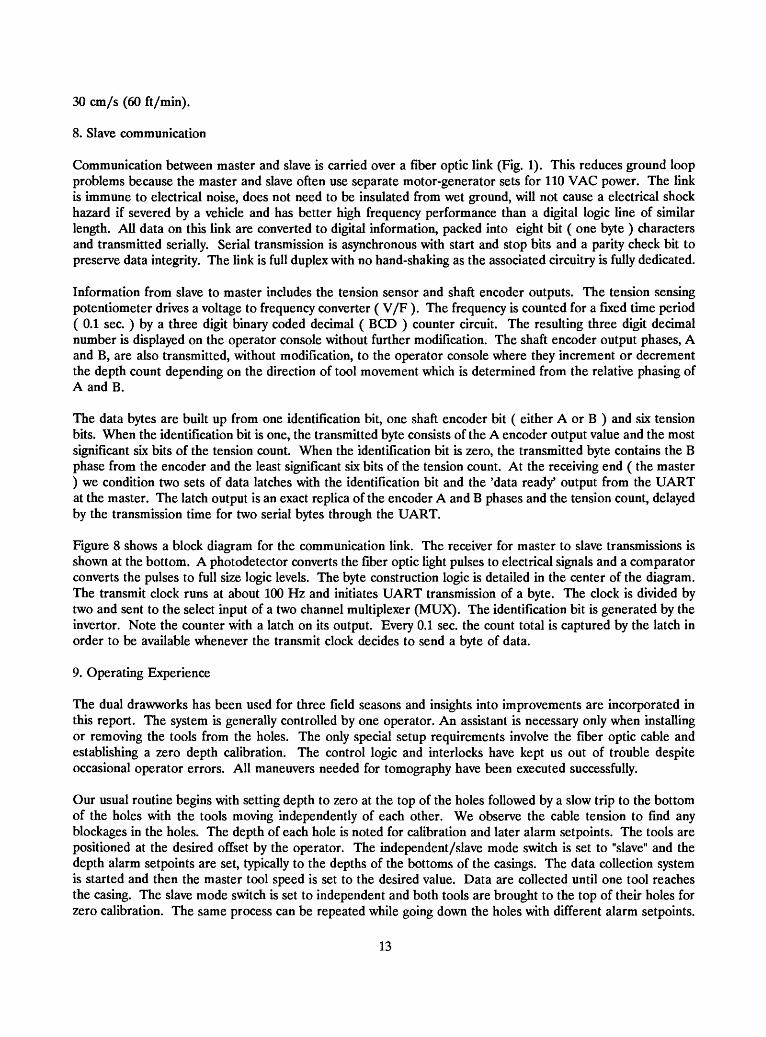
Information from slave to master includes the tension sensor and shaft encoder outputs. The tension sensing potentiometer drives a voltage to frequency converter ( V/F ). The frequency is counted for a fixed time period (0.1 sec. ) by a three digit binary coded decimal ( BCD ) counter circuit. The resulting three digit decimal number is displayed on the operator console without further modification. The shaft encoder output phases, A and B, are also transmitted, without modification, to the operator console where they increment or decrement the depth count depending on the direction of tool movement which is determined from the relative phasing of A and B.
The data bytes are built up from one identification bit, one shaft encoder bit ( either A or B ) and six tension bits. When the identification bit is one, the transmitted byte consists of the A encoder output value and the most significant six bits of the tension count. When the identification bit is zero, the transmitted byte contains the B phase from the encoder and the least significant six bits of the tension count. At the receiving end ( the master ) we condition two sets of data latches with the identification bit and the 'data ready* output from the UART at the master. The latch output is an exact replica of the encoder A and B phases and the tension count, delayed by the transmission time for two serial bytes through the UART.
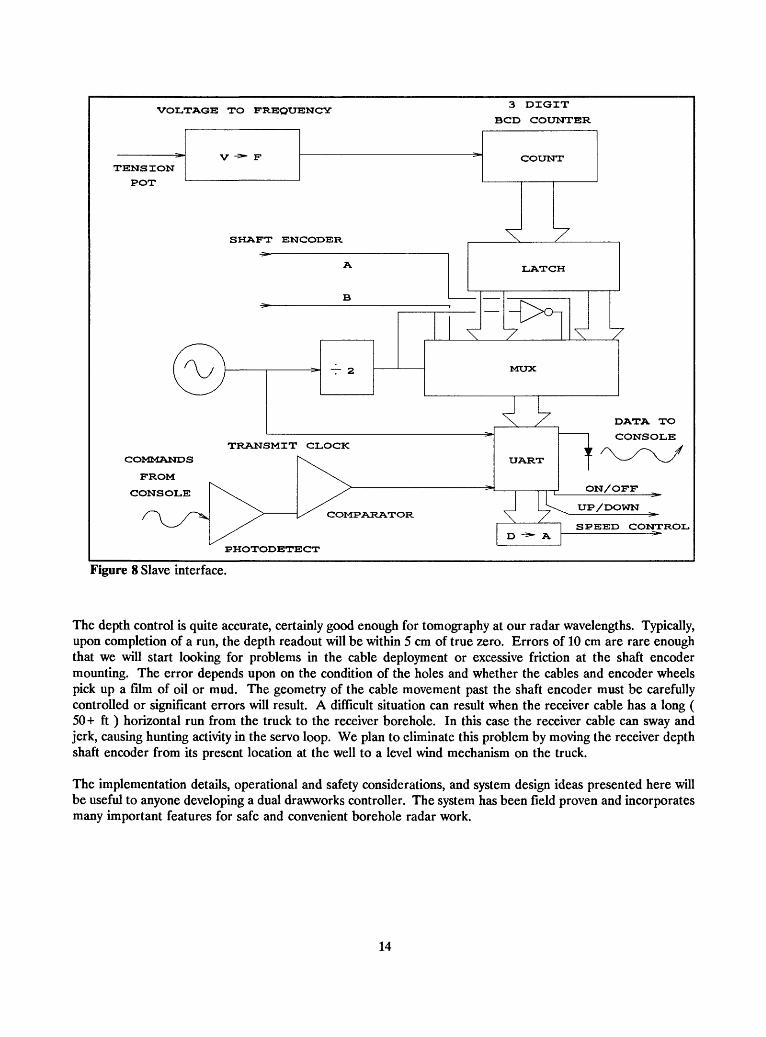
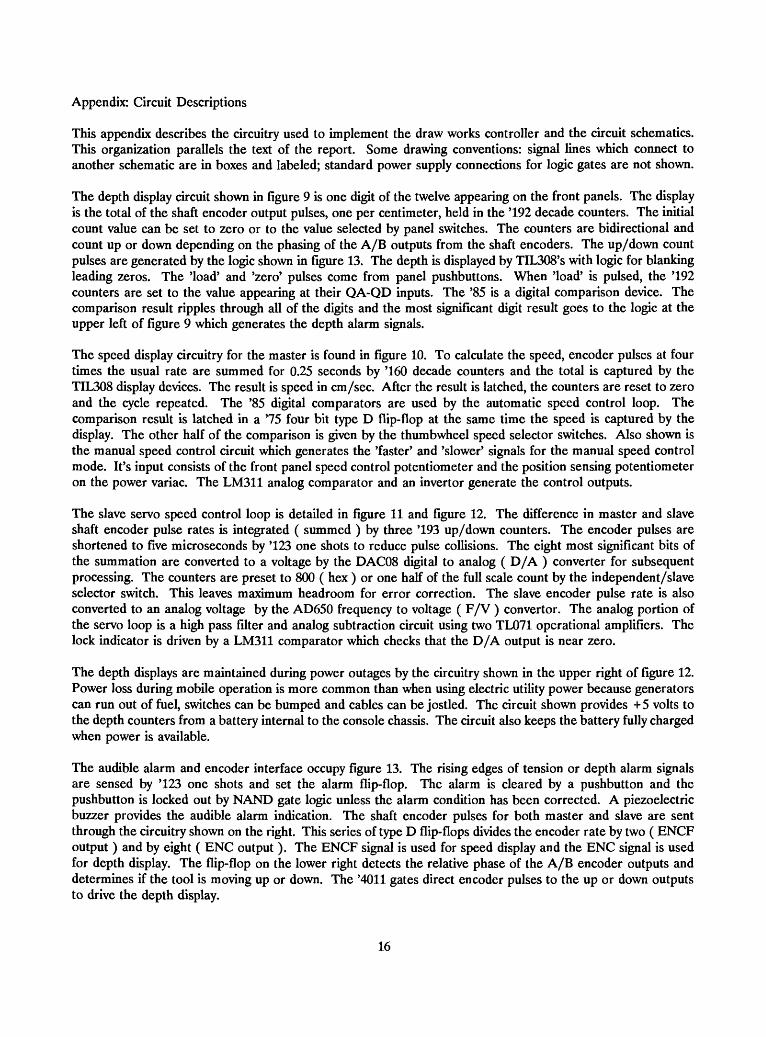
Figure 8 shows a block diagram for the communication link. The receiver for master to slave transmissions is shown at the bottom. A photodetector converts the fiber optic light pulses to electrical signals and a comparator converts the pulses to full size logic levels. The byte construction logic is detailed in the center of the diagram. The transmit clock runs at about 100 Hz and initiates UART transmission of a byte. The clock is divided by two and sent to the select input of a two channel multiplexer (MUX). The identification bit is generated by the inverter. Note the counter with a latch on its output. Every 0.1 sec. the count total is captured by the latch in order to be available whenever the transmit clock decides to send a byte of data.
9. Operating Experience
The dual drawworks has been used for three field seasons and insights into improvements are incorporated in this report. The system is generally controlled by one operator. An assistant is necessary only when installing or removing the tools from the holes. The only special setup requirements involve the fiber optic cable and establishing a zero depth calibration. The control logic and interlocks have kept us out of trouble despite occasional operator errors. All maneuvers needed for tomography have been executed successfully.
Our usual routine begins with setting depth to zero at the top of the holes followed by a slow trip to the bottom of the holes with the tools moving independently of each other. We observe the cable tension to find any blockages in the holes. The depth of each hole is noted for calibration and later alarm setpoints. The tools are positioned at the desired offset by the operator. The independent/slave mode switch is set to "slave" and the depth alarm setpoints are set, typically to the depths of the bottoms of the casings. The data collection system is started and then the master tool speed is set to the desired value. Data are collected until one tool reaches the casing. The slave mode switch is set to independent and both tools are brought to the top of their holes for zero calibration. The same process can be repeated while going down the holes with different alarm setpoints.
13
VOLTAGE TO FREQUENCY3 DIGIT
BCD COUNTER
PENSION
POT
V -^ F COUNT
SHAFT ENCODER
COMMANDS
FROM
CONSOLE
PHOTODETECT
Figure 8 Slave interface.
The depth control is quite accurate, certainly good enough for tomography at our radar wavelengths. Typically, upon completion of a run, the depth readout will be within 5 cm of true zero. Errors of 10 cm are rare enough that we will start looking for problems in the cable deployment or excessive friction at the shaft encoder mounting. The error depends upon on the condition of the holes and whether the cables and encoder wheels pick up a film of oil or mud. The geometry of the cable movement past the shaft encoder must be carefully controlled or significant errors will result. A difficult situation can result when the receiver cable has a long ( 50+ ft ) horizontal run from the truck to the receiver borehole. In this case the receiver cable can sway and jerk, causing hunting activity in the servo loop. We plan to eliminate this problem by moving the receiver depth shaft encoder from its present location at the well to a level wind mechanism on the truck.
The implementation details, operational and safety considerations, and system design ideas presented here will be useful to anyone developing a dual drawworks controller. The system has been field proven and incorporates many important features for safe and convenient borehole radar work.
14

10. References
Olhoeft, G. R., 1988, Interpretation of hole-to-hole radar measurements: in Proc. of the Third Tech. Symp. on Tunnel Detection, January 12-15, 1988, Golden, CO p. 616-629.
Wright, D. L., Watts, R. D., and Bramsoe, E., 1986, Single-hole short-pulse borehole radar experiments and a crosshole transponder; in Borehole Geophysics for Mining and Geotechnical Applications, ed. P. G. Killeen, Geological Survey of Canada, Paper 85-27, p. 207-216, 1986.
Wright, D. L., and others, 1990, A digital low-frequency, surface-profiling ice radar system, by D. L. Wright, S. M. Hodge, J. A. Bradley, T. P. Grover, and R. W. Jacobel: Journal of Glaciology, v. 36, no. 122, p. 112- 121.
15
Appendix: Circuit Descriptions
This appendix describes the circuitry used to implement the draw works controller and the circuit schematics. This organization parallels the text of the report. Some drawing conventions: signal lines which connect to another schematic are in boxes and labeled; standard power supply connections for logic gates are not shown.
The depth display circuit shown in figure 9 is one digit of the twelve appearing on the front panels. The display is the total of the shaft encoder output pulses, one per centimeter, held in the '192 decade counters. The initial count value can be set to zero or to the value selected by panel switches. The counters are bidirectional and count up or down depending on the phasing of the A/B outputs from the shaft encoders. The up/down count pulses are generated by the logic shown in figure 13. The depth is displayed by TIL308's with logic for blanking leading zeros. The 'load' and 'zero' pulses come from panel pushbuttons. When 'load' is pulsed, the '192 counters are set to the value appearing at their QA-QD inputs. The '85 is a digital comparison device. The comparison result ripples through all of the digits and the most significant digit result goes to the logic at the upper left of figure 9 which generates the depth alarm signals.
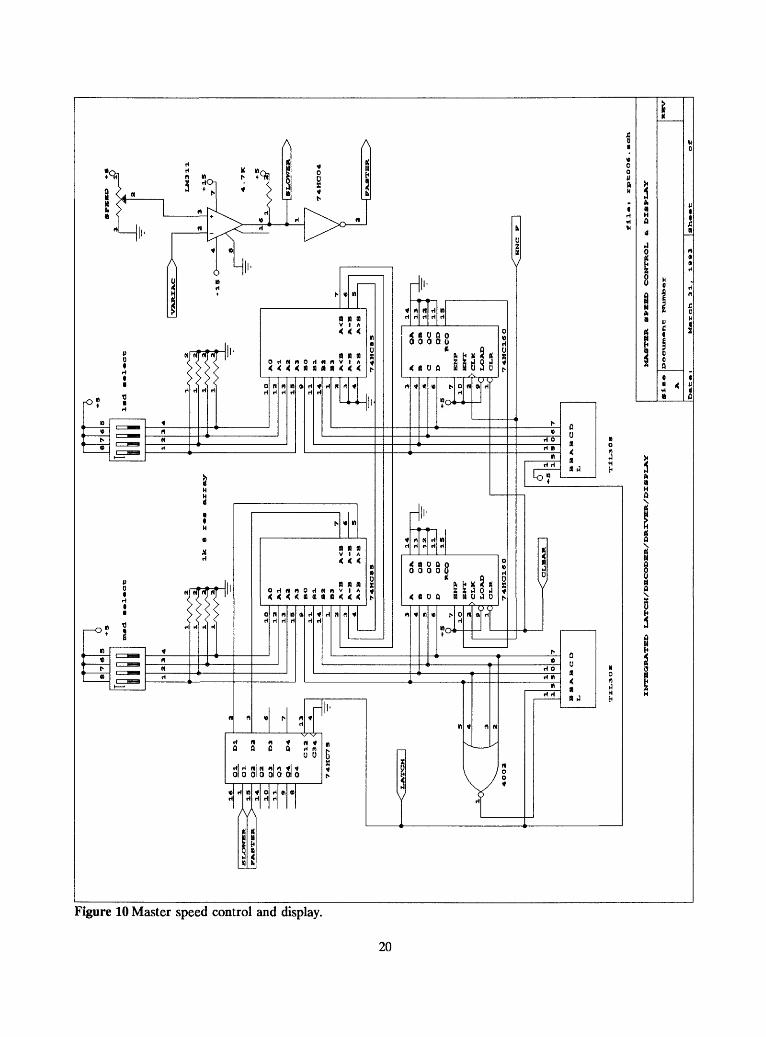
The speed display circuitry for the master is found in figure 10. To calculate the speed, encoder pulses at four times the usual rate are summed for 0.25 seconds by '160 decade counters and the total is captured by the TIL308 display devices. The result is speed in cm/sec. After the result is latched, the counters are reset to zero and the cycle repeated. The '85 digital comparators are used by the automatic speed control loop. The comparison result is latched in a '75 four bit type D flip-flop at the same time the speed is captured by the display. The other half of the comparison is given by the thumbwheel speed selector switches. Also shown is the manual speed control circuit which generates the 'faster' and 'slower' signals for the manual speed control mode. It's input consists of the front panel speed control potentiometer and the position sensing potentiometer on the power variac. The LM311 analog comparator and an inverter generate the control outputs.
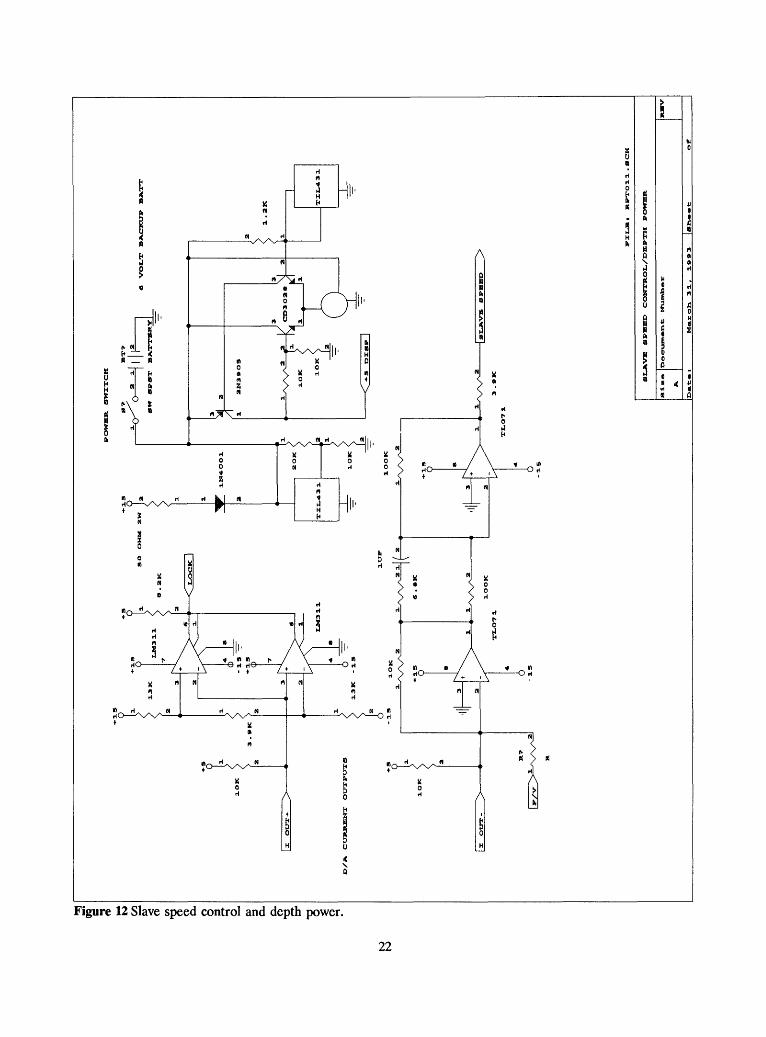
The slave servo speed control loop is detailed in figure 11 and figure 12. The difference in master and slave shaft encoder pulse rates is integrated ( summed ) by three '193 up/down counters. The encoder pulses are shortened to five microseconds by '123 one shots to reduce pulse collisions. The eight most significant bits of the summation are converted to a voltage by the DAC08 digital to analog ( D/A ) converter for subsequent processing. The counters are preset to 800 ( hex ) or one half of the full scale count by the independent/slave selector switch. This leaves maximum headroom for error correction. The slave encoder pulse rate is also converted to an analog voltage by the AD650 frequency to voltage ( F/V ) converter. The analog portion of the servo loop is a high pass filter and analog subtraction circuit using two TL071 operational amplifiers. The lock indicator is driven by a LM311 comparator which checks that the D/A output is near zero.
The depth displays are maintained during power outages by the circuitry shown in the upper right of figure 12. Power loss during mobile operation is more common than when using electric utility power because generators can run out of fuel, switches can be bumped and cables can be jostled. The circuit shown provides +5 volts to the depth counters from a battery internal to the console chassis. The circuit also keeps the battery fully charged when power is available.
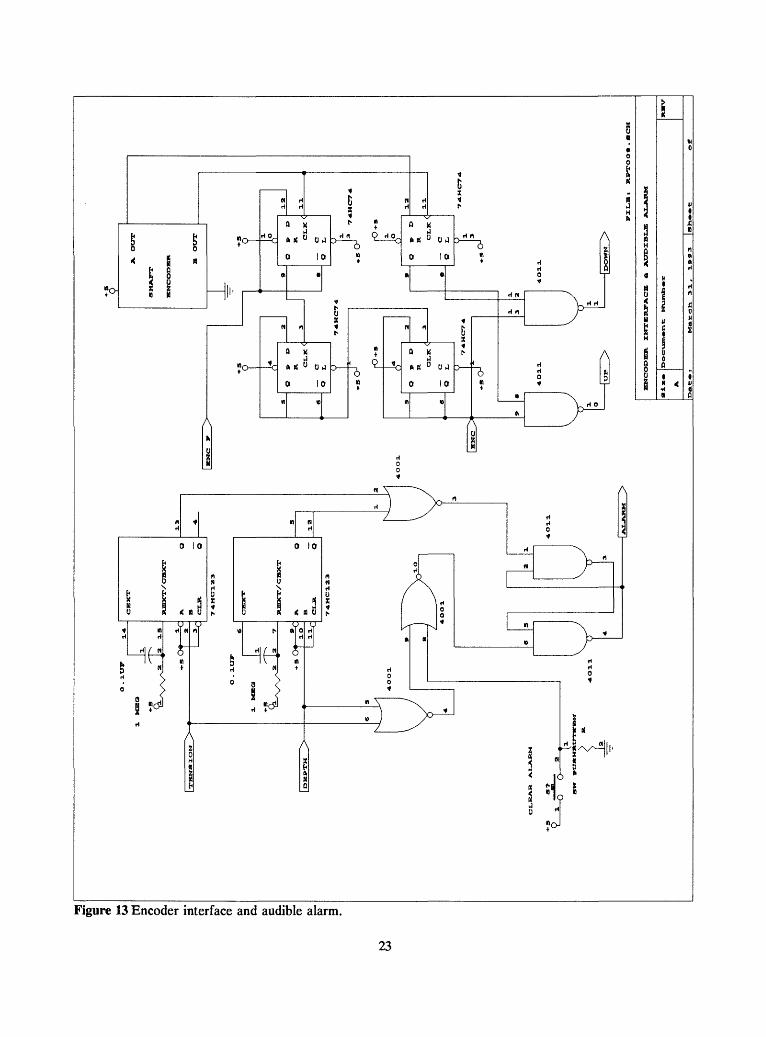
The audible alarm and encoder interface occupy figure 13. The rising edges of tension or depth alarm signals are sensed by '123 one shots and set the alarm flip-flop. The alarm is cleared by a pushbutton and the pushbutton is locked out by HAND gate logic unless the alarm condition has been corrected. A piezoelectric buzzer provides the audible alarm indication. The shaft encoder pulses for both master and slave are sent through the circuitry shown on the right. This series of type D flip-flops divides the encoder rate by two ( ENCF output ) and by eight ( ENC output ). The ENCF signal is used for speed display and the ENC signal is used for depth display. The flip-flop on the lower right detects the relative phase of the A/B encoder outputs and determines if the tool is moving up or down. The '4011 gates direct encoder pulses to the up or down outputs to drive the depth display.
16
Alarm logic and motor control logic for the master are detailed in figure 14. This schematic is almost identical to figure 4 and we refer you to the previous discussion.
The slave speed display and tension alarm circuits are found in figure 15. Tension display data ( see figure 20 ) is input to a DAC08 D/A converter. The output voltage is compared to a front panel potentiometer setting by a LM311 comparator and the comparison result sets the alarm flip-flop built from two '4011 gates. The flip-flop is cleared by a pushbutton. The slave speed display uses '160 counters to sum the shaft encoder outputs for 0.25 seconds. The count is latched to TIL308 displays and the counters are reset to zero to repeat the cycle. A '7555 astable multivibrator and two '123 one shots provide the latch and zero pulses.
The 110 VAC isolation and master draw works reel motor control circuits are shown in figure 16. Logic levels drive MOSFETs which, in turn, drive relays to handle the large currents involved. The variac shaft driver is a synchronous AC motor with two windings. Two SC141 triacs and a luF 600 vac capacitor control the relative phase of the current in the windings and thus the direction of rotation. The triac gates have optically coupled MOC633 drivers whose LED sources are driven, in turn, by MOSFETS. The current for the motor is converted from AC to DC by a diode bridge.
The corresponding motor circuits for the slave are shown in figure 17. The slave motor requires larger currents and there is a two stage relay setup where a DC relay drives the coil of a high power AC relay to turn the motor on and off. The speed control uses a commercial SCR controller ( not shown ) whose input is a DC voltage referenced to the 110 VAC line voltage. Our isolated DC supply is shown on the right and the 3650 isolation amplifier and operational amplifier buffer provide the controller input voltage. The phase control potentiometer is used to adjust the full scale range of the control voltage.
Tension display and alarm circuits occupy figure 18, figure 19 and figure 20. The master tension display sums the TCL clock for 0.25 seconds with '160 decade counters. The total is latched to TIL308 displays with leading zero blanking logic. The counters are reset to zero and the cycle is repeated. A '7555 astable multivibrator and two '123 one shots generate the latch and zero pulses.The TCL clock comes from a voltage to frequency ( V/F ) converter. The tension sensing potentiometer voltage output is buffered by an operational amplifier and input to an integrator. The integrator output level is sensed by a LM311 comparator. When the ( calibrated ) trip point is reached, a dump pulse is generated by a '123 one shot to discharge the integration capacitor with a MPF910 MOSFET. The dump pulse is also the TCL clock. The master tension alarm is generated by a LM311 comparator whose inputs are the tension sensing potentiometer and a front panel tension alarm level selection potentiometer. The comparator sets a flip-flop to generate the alarm logic signal. The flip-flop is cleared by a panel pushbutton. The flip-flop prevents recurrent alarms due to the change in tension when the main motor is shut off in response to the alarm.
The slave tension display uses twelve binary coded decimal ( BCD ) digits transmitted through the fiber optic link. They are latched in two groups of six by three '75 latches. Latch input data comes from a UART. The 'data ready' ( DR ) output from the UART is sent to logic shown at the left of figure 20. The logic selects the latch to receive the current data word depending on the value of the most significant bit ( MSB ) of the data word. The actual display uses TIL308's with leading zero blanking logic. Note that the TIL308 latching logic cannot be used because the middle digit is split between two data words.
Slave tension sensing and A/D conversion circuits are shown in figure 21 and figure 22. An AD537 F/V converts the tension sensing potentiometer output to a pulse rate. The total count after 20 ms is in three digit BCD format within the three '160 counters. The total is captured by two '174 six digit latches and the counters are reset to zero. The cycle repeats at a 50 Hz rate. Two '123 one shots generate the latch and zero pulses. The slave system clock chain begins with a 16 MHz oscillator divided by 16 with a '193 four digit binary counter to yield a 1 MHz clock for the UART transmitter and receiver. This gives a baud rate of 62.5 kHz for the UART. A division by 256 yields a 3906 kHz TBRL clock. This is the rate a which new data words are sent between the master and slave. A division by two by a 4027 J-K flip-flop develops latch pulses ( DLD ) for the
17

two data words needed to transmit the slave tension data. Finally, a division by 100 in a pair of '162's gives the 50Hz update rate for the tension A/D conversion.
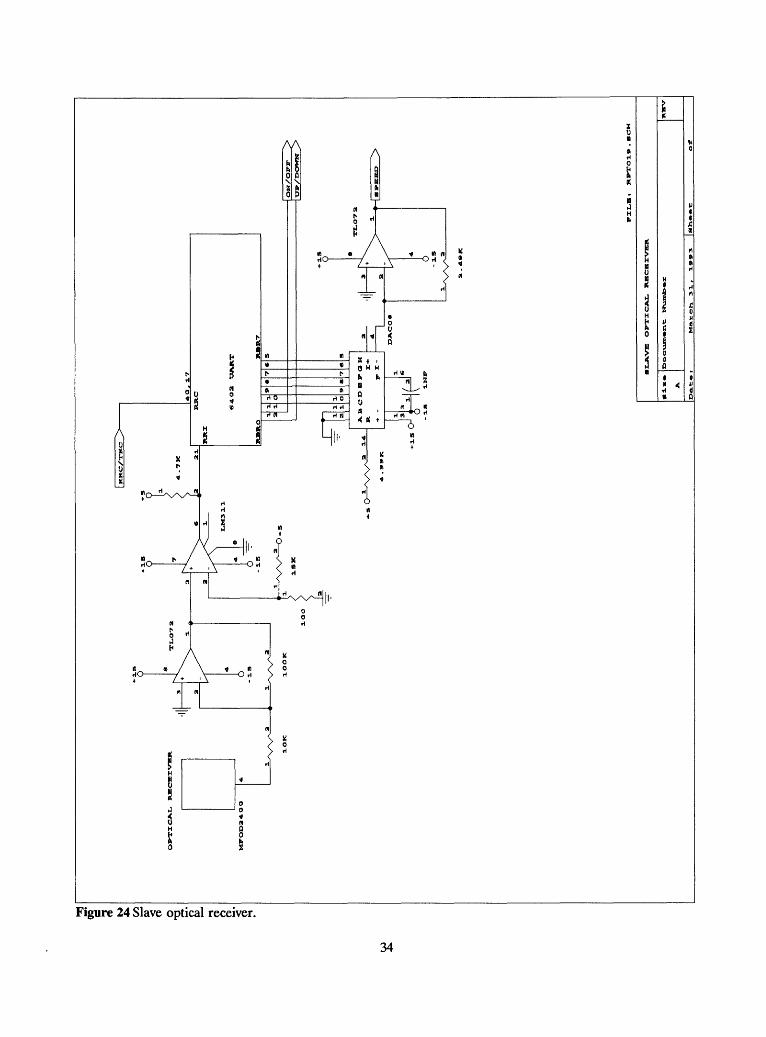
The fiber optic data link circuits are shown in the remaining figures. The first two are the receivers and the remainder show data packing and transmission. The slave data are converted to digital pulses at the master receiver by a MFOD2404 detector, an operational amplifier X10 gain stage and a LM306 comparator. The 6402 universal asynchronous receiver transmitter ( UART ) converts the serial data to byte wide data words, places them on its receiver buffer register ( RBRO-RBR7 ) and pulses the 'data ready' line ( DR ). Two '123 one shots generate a latch command to capture the current word and a reset command ( DDR ) to tell the UART that the data have been accepted.
The master data at the slave receiver are not latched; instead the data are immediately converted to a speed control voltage by a DAC08 D/A with an operational amplifier buffer. The up/down and on/off logic levels at the UART receiver buffer are sent to the MOSFETs controlling the motor relays.
The slave data transmitter loads the least significant data byte and the A encoder output alternately with the most significant data byte and the B encoder output. A MOSFET and a MFOE1200 LED generate light pulses to send to the master receiver. The master transmitter circuitry of figure 26 also includes the control logic for the slave motor. Tension alarms, depth alarms, the on/off switch and a one second direction reversal delay pulse are input to a 4002 gate to generate the on/off signal. The up/down switch generates the direction signal and triggers two '123 one shots to create the reversal delay. The remaining six bits of UART input data come from a ADC0804 analog to digital converter. Its analog input is either the slave speed control voltage from the servo loop circuitry or the manual speed control potentiometer output. The UART output ( TRO ) drives an MFOE1200 LED. The UART timing clock chain begins with a 16 MHz oscillator divided by 16 with a '163 to develop the baud clocks RRC and TRC. This is followed by a division by 256 to generate the data loading pulse TBRL. The TBRL pulse is delayed by two '123 one shots and sent to the ADC0804 to instruct it to initiate the next analog to digital conversion.
18

Figure 9 Depth display and alarm schematic - one digit.
19
A
Figure 10 Master speed control and display.
20

Figure 11 Error counter and frequency-to-voltage converter.
21
A
Figure 12 Slave speed control and depth power.
22
< g H
£ °
« H
/
?
|l''
n
V
o
0
H 0
-8=
nH
01
(1
H H
A«
J
N a»«
J
/
K JJ 0
1
/
Li
ja
j
0
d
0X
h
c
s ^HI
n
i 9_
n t
HO
-*:
;
A
H H
N
Q
ft«
a
N
aA«
0
<J o
1
/
L i
^a
^ a
6X
H (
«
I
h
J
1~2>
i~6n+
\
rf M
rf n
ft
Figure 13 Encoder interface and audible alarm.
23
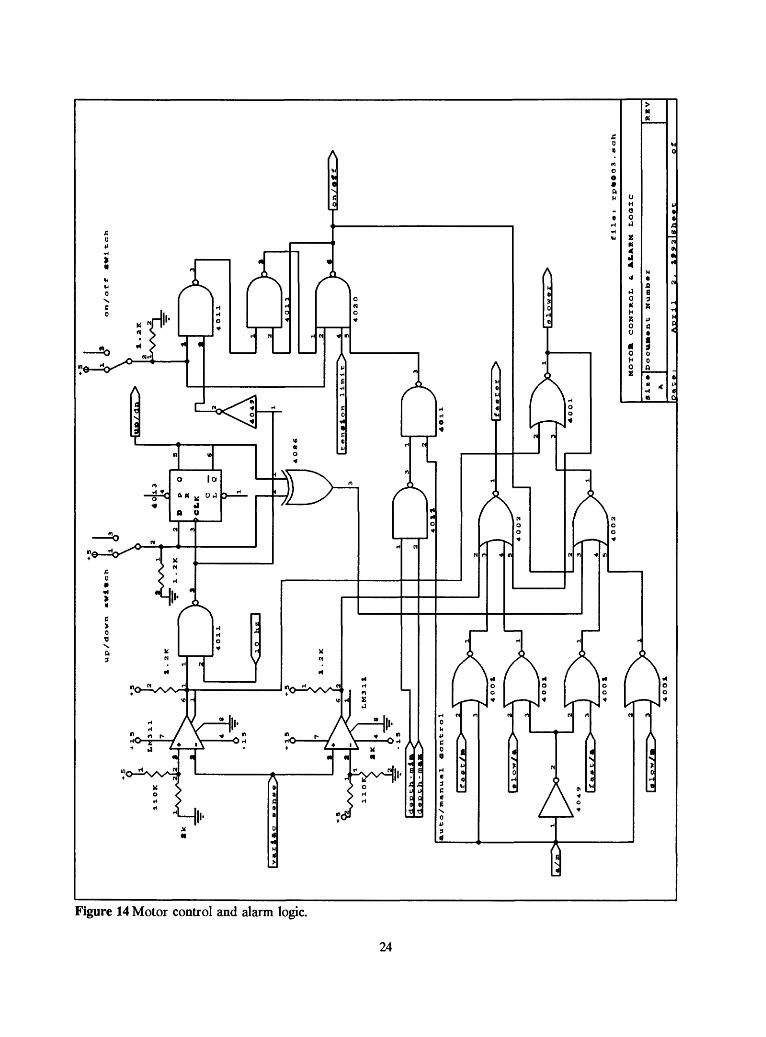
Figure 14 Motor control and alarm logic.
24
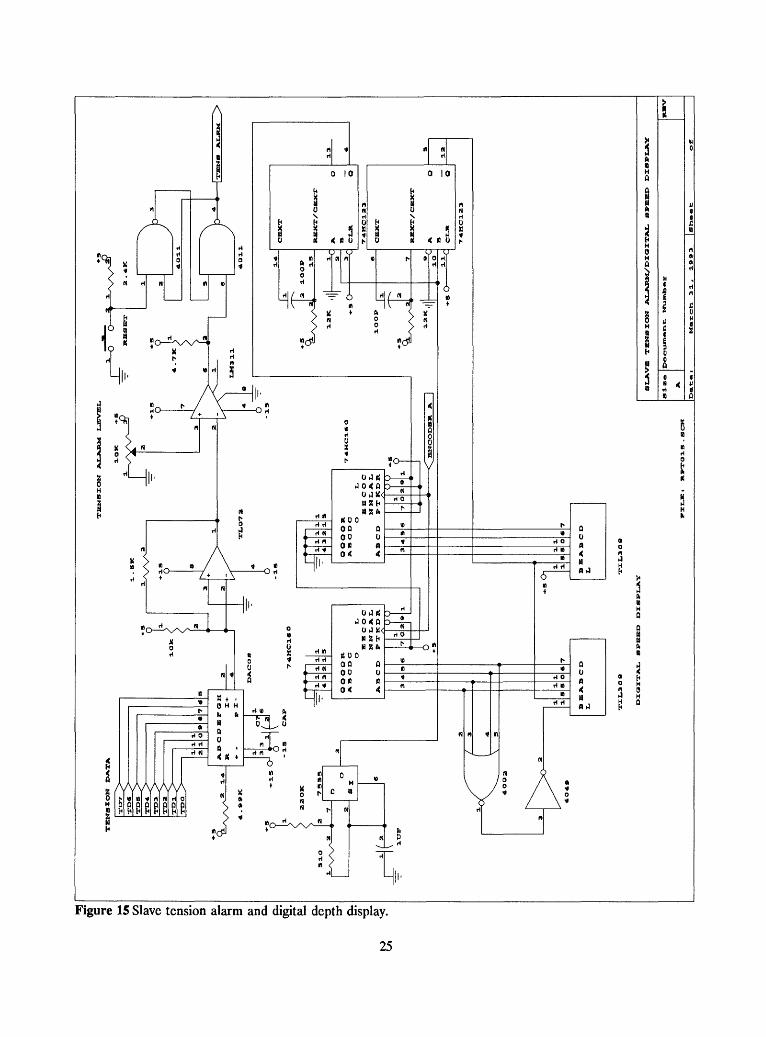
Figure 15 Slave tension alarm and digital depth display.
25
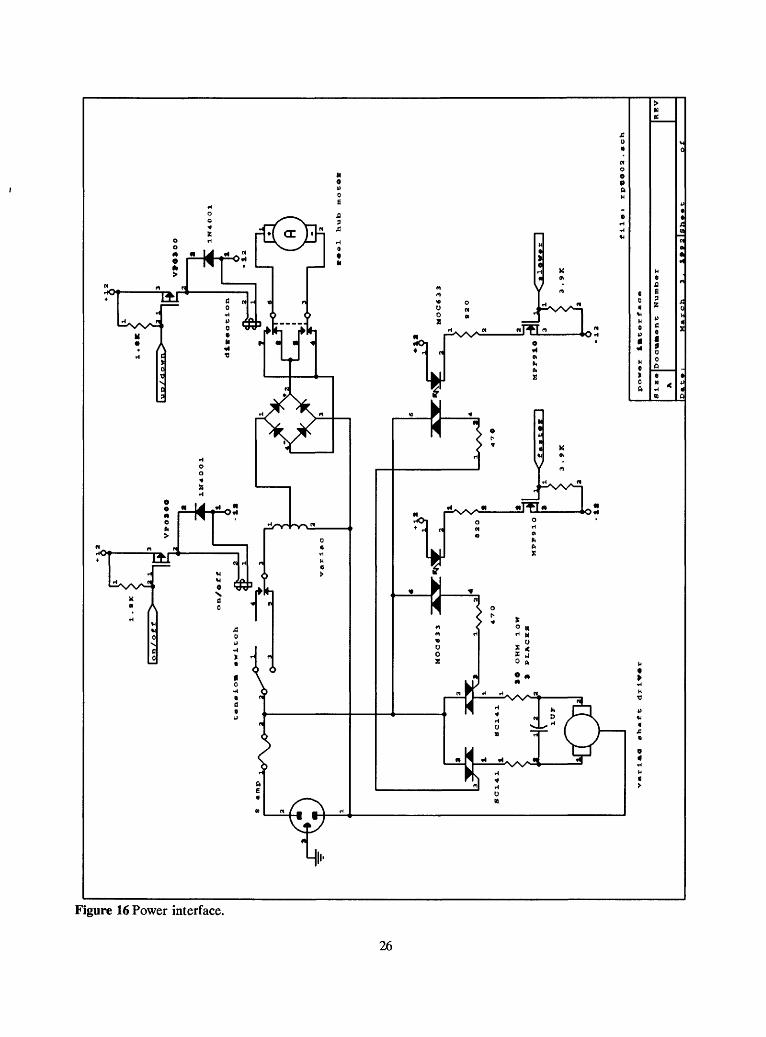
Figure 16 Power interface.
26

Figure 17 Slave power control circuits.
27

Figure 18 Master tension display.
28

Figure 19 Tension alarm sense/latch.
29
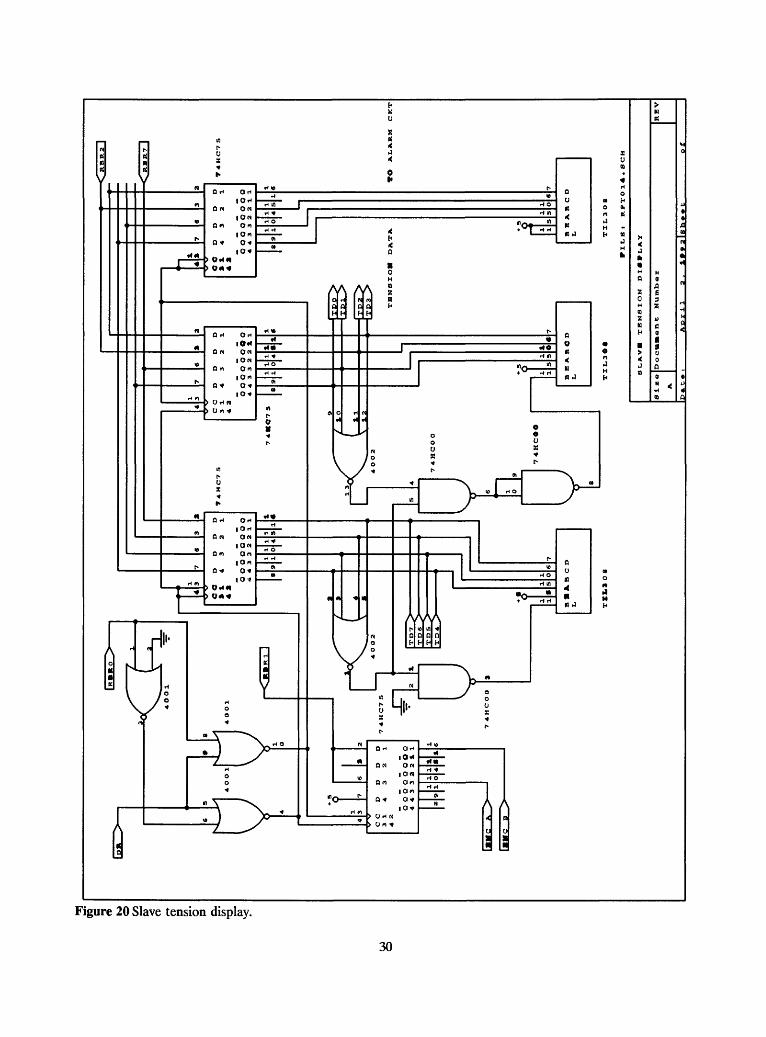
Figure 20 Slave tension display.
30

Figure 21 Slave tension sense and analog to digital conversion.
31
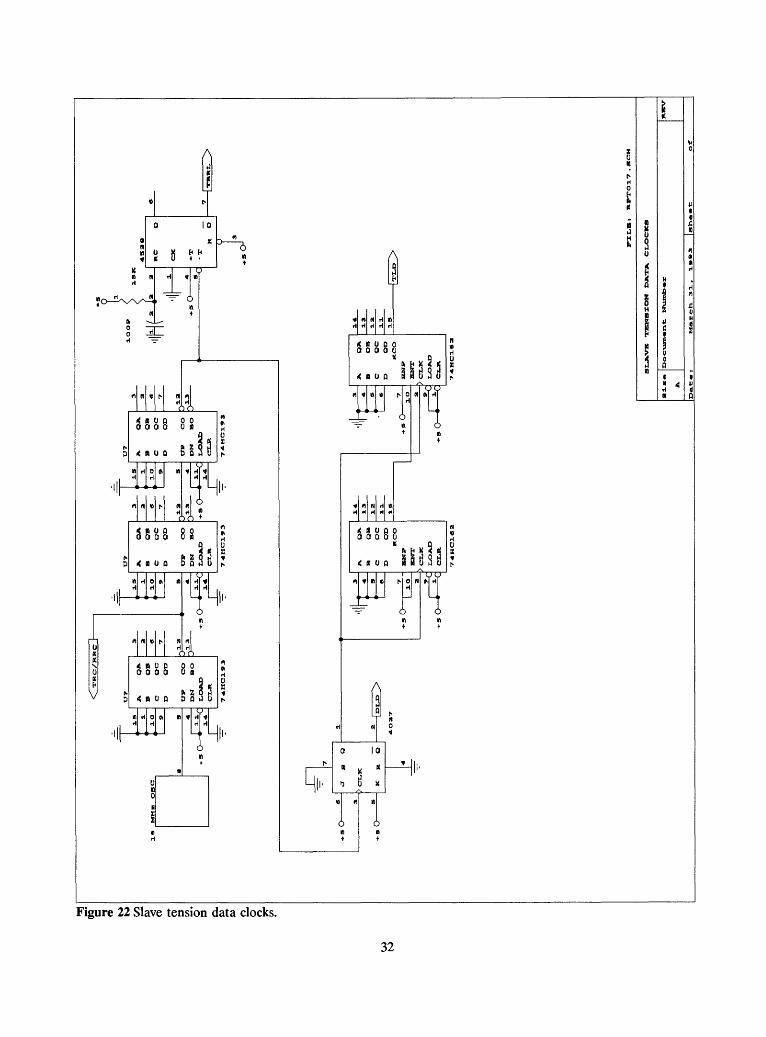
Figure 22 Slave tension data clocks.
32
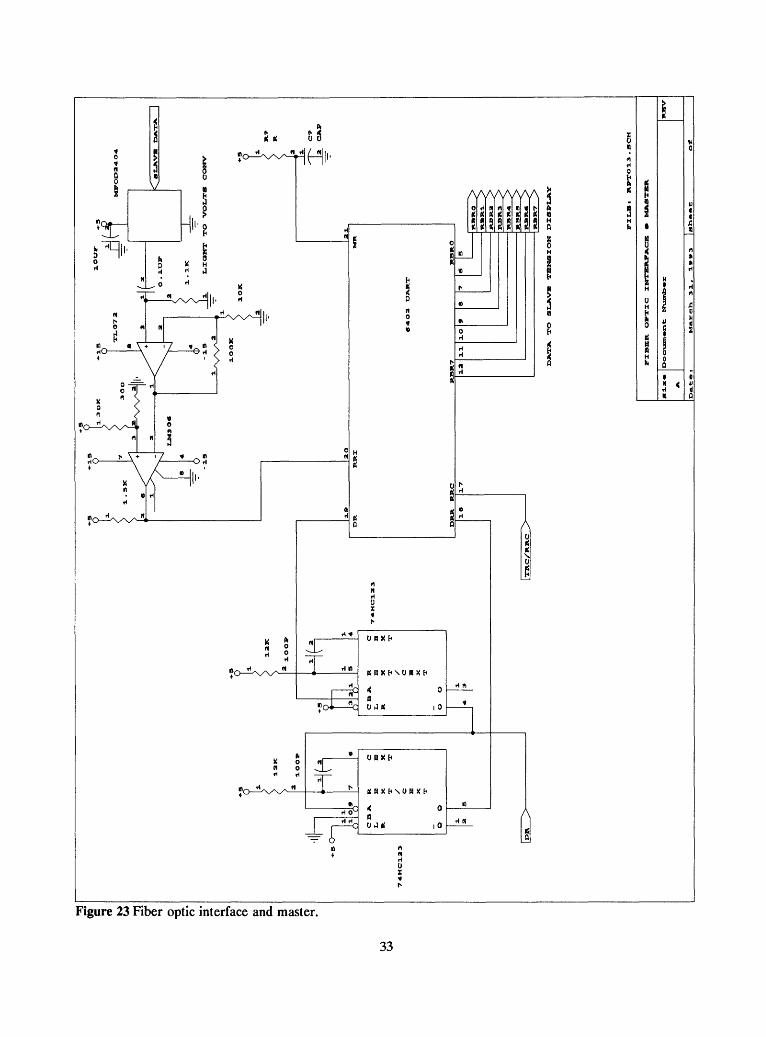
Figure 23 Fiber optic interface and master.
33
AA
Figure 24 Slave optical receiver.
34
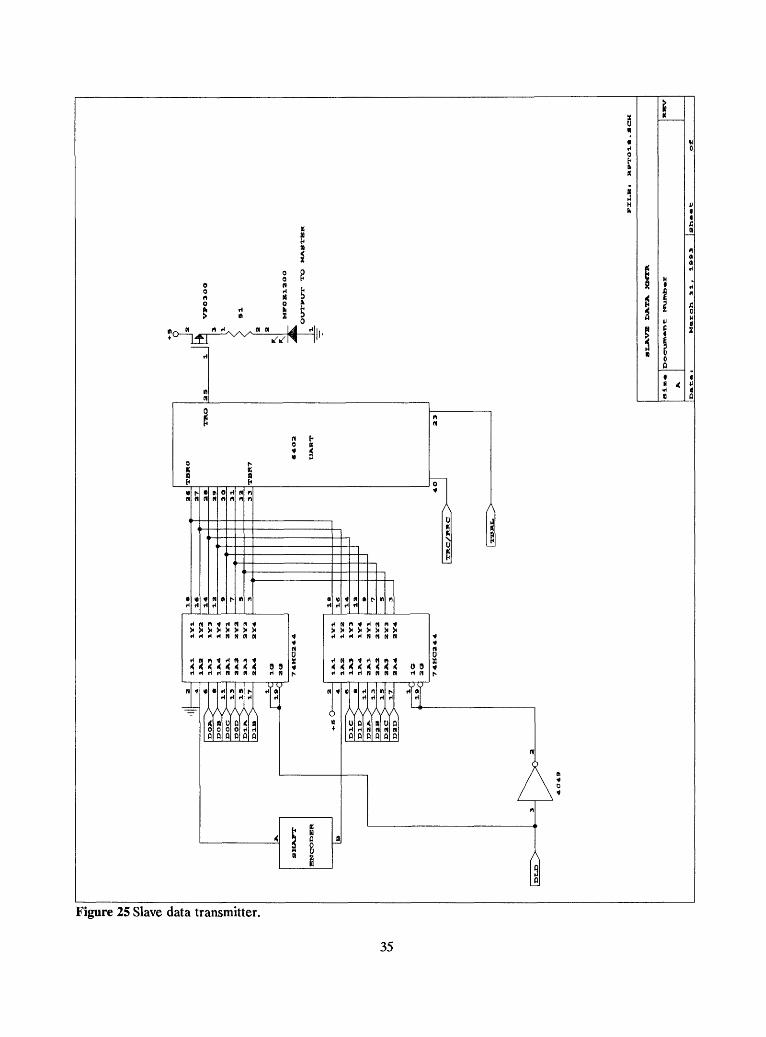
Figure 25 Slave data transmitter.
35

Figure 26 Master to slave control link.
36
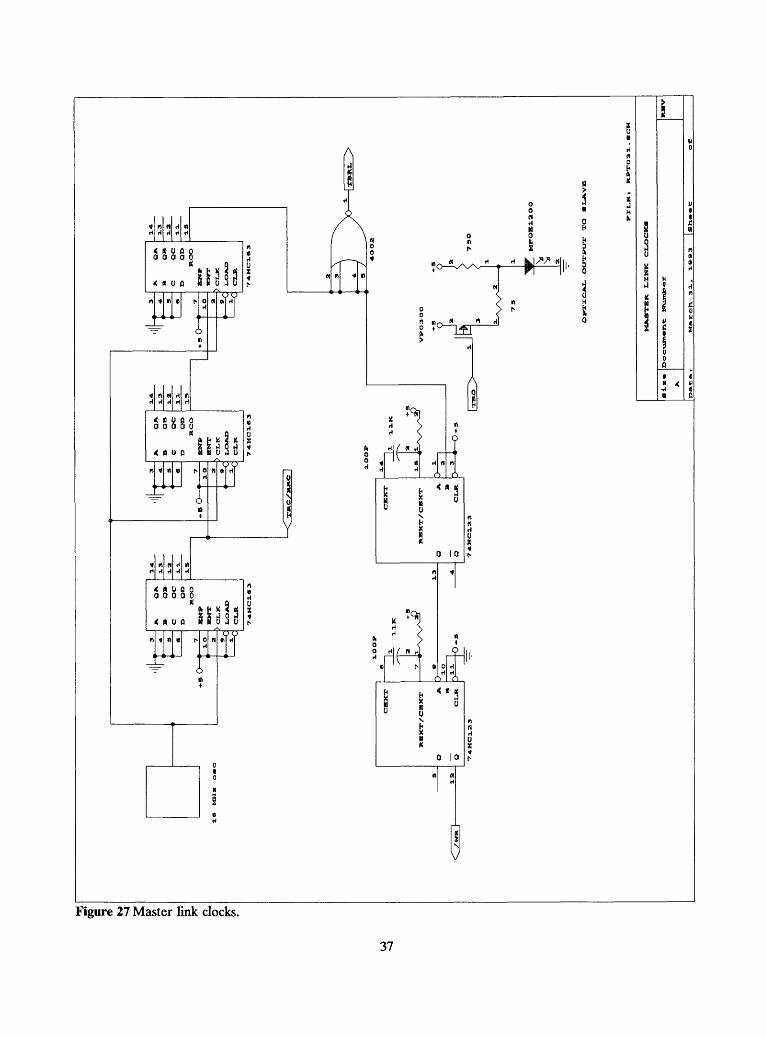
Figure 27 Master link clocks.
37