Embed Size (px)
Citation preview
RESEARCH Open Access
A dynamic credit risk assessment modelwith data mining techniques: evidencefrom Iranian banksSomayeh Moradi1 and Farimah Mokhatab Rafiei2*
* Correspondence:[email protected] Modares University, Tehran,IranFull list of author information isavailable at the end of the article
Abstract
Giving loans and issuing credit cards are two of the main concerns of banks in thatthey include the risks of non-payment. According to the Basel 2 guidelines, banks needto develop their own credit risk assessment systems. Some banks have such systems;nevertheless they have lost a large amount of money simply because the models theyused failed to accurately predict customers’ defaults. Traditionally, banks have usedstatic models with demographic or static factors to model credit risk patterns. However,economic factors are not independent of political fluctuations, and as the politicalenvironment changes, the economic environment evolves with it.This has been especially evident in Iran after the 2008–2016 USA sanctions, as manypreviously reliable customers became unable to repay their debt (i.e., became badcustomers). Nevertheless, a dynamic model that can accommodate fluctuating politico-economic factors has never been developed. In this paper, we propose a model thatcan accommodate factors associated with politico-economic crises. Human judgementis removed from the customer evaluation process. We used a fuzzy inference system tocreate a rule base using a set of uncertainty predictors. First, we train an adaptivenetwork-based fuzzy inference system (ANFIS) using monthly data from a customerprofile dataset. Then, using the newly defined factors and their underlying rules, asecond round of assessment begins in a fuzzy inference system.Thus, we present a model that is both more flexible to politico-economic factors andcan yield results that are max compatible with real-life situations. Comparison betweenthe prediction made by proposed model and a real non-performing loan indicates littledifference between them. Credit risk specialists also approve the results. The majorinnovation of this research is producing a table of bad customers on a monthly basisand creating a dynamic model based on the table. The latest created model is used forassessing customers henceforth, so the whole process of customer assessment neednot be repeated. We assert that this model is a good substitute for the static modelscurrently in use as it can outperform traditional models, especially in the face ofeconomic crisis.
Keywords: Fuzzy clustering, Non-performing loan, Credit risk, FIS, Dynamism, ANFIS
IntroductionA commercial bank, hereafter referred to as a bank, is a type of financial institution
that provides services such as accepting deposits, making business loans, and offering
basic investment products. Inevitably, banks must take risks in giving loans and credit
Financial Innovation
© The Author(s). 2019 Open Access This article is distributed under the terms of the Creative Commons Attribution 4.0 InternationalLicense (http://creativecommons.org/licenses/by/4.0/), which permits unrestricted use, distribution, and reproduction in any medium,provided you give appropriate credit to the original author(s) and the source, provide a link to the Creative Commons license, andindicate if changes were made.
Moradi and Mokhatab Rafiei Financial Innovation (2019) 5:15 https://doi.org/10.1186/s40854-019-0121-9

cards to customers because these are economic drivers. This is delicate because a
bank’s survival is tied to taking appropriate risks; a non-risk-taking bank is as vulner-
able as an overly-risk-taking one (Narindra Mandalaa & Fransiscus, 2012). Therefore,
when banks are faced with a risk, appropriate risk management depends on identifying,
understanding, measuring, and finally providing appropriate strategies towards it
(Bekhet & Eletter, 2014). According to the Basel 2 accord, credit risk is one of the risks
that banks face in allocating resources. It is defined as the probability of non-payment
or delayed payment by customers or their inability to repay a loan (Cisko & Klieštik,
2013). Customers with a high probability of loan repayment are classified in the good
customer group and customers with a high probability of default are classified in the
bad customer group (Akkoc, 2012).
Credit risk assessment is vital for banks; they must ensure that borrowers are able to
pay their installments before allocating a loan to them (Narindra Mandalaa & Fransis-
cus, 2012). According to Basel 2, each bank needs to organize and develop its own in-
ternal credit scoring system with which they can analyze a borrower’s risk. This has led
to an upsurge in the demand for scoring systems that can accurately model risks at
high resolution; some institutions are remunerated very well to develop such models
for banks upon request. These credit-scoring techniques can then be used as decision
support tools or as automated decision algorithms for a wide range of customers
(Heiat, 2012). Most current credit risk models have been developed based on trial and
error and lack a theoretical framework (Wang et al., 2014). Moreover, most of these
models are static and are unable to function efficiently in economic crises. Tradition-
ally, banks have used static modeling frameworks to assess customer credit risks; how-
ever, the lack of responsiveness to the evolving economic environment renders these
models inefficient, especially in the face of concept drifts, where a portion of previously
good costumers fall into default (i.e., become bad customers). While, the traditional
static models have proven to work reasonably well during periods of stasis, they fail to
do so in the face of economic and political fluctuations. This is especially evident in
Iran, after the governing regime (the Islamic Republic) came under several international
political and economic sanctions. Consequently, the number of non-performing loans
(NPLs) increased and many Iranian customers became unable to repay their obliga-
tions. As new factors were introduced during this period, the model criteria needed to
be updated, as well. Opting for appropriate factors that work well in all circumstances
is difficult (if not impossible); therefore, a dynamic model that can accommodate new
factors is desirable. In this paper, we introduce a new model that can accommodate
changing uncertain factors as well as the more stable certain factors used in static
models.
BackgroundAnalyzing credit risk is a pattern recognition problem (Kruppa & Schwarz, 2013) and
includes functions for predicting whether or not a customer will pay off a loan (Emel et
al., 2003); therefore, the most important features are resolution and accuracy. Credit
scoring evaluation used to focus primarily on delinquencies. In recent years, however,
loss given default (LGD) and exposure have been among its most important criteria.
In this field, researchers have tried to solve the customer credit risk assessment prob-
lem, each using a different approach and technique; and each of them has tried to
Moradi and Mokhatab Rafiei Financial Innovation (2019) 5:15 Page 2 of 27
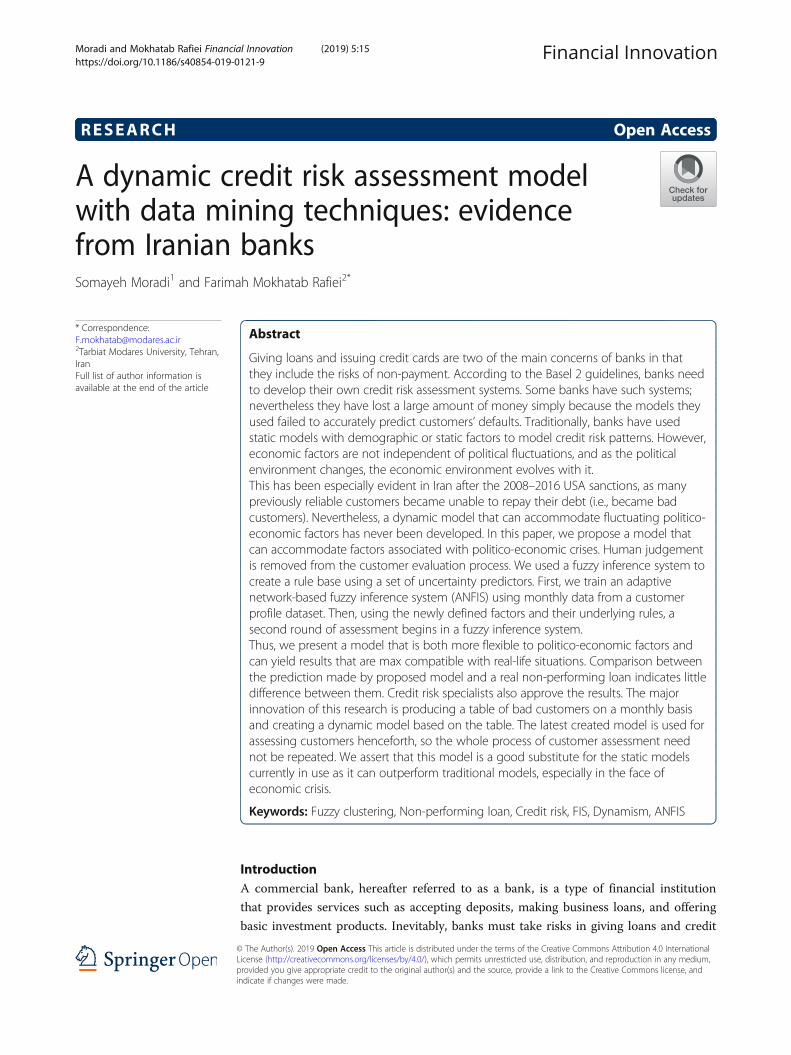
present a more accurate model than the others (see Table 1). With the advances made
in computer technology, data collection and manipulation has become more feasible
than ever; consequently, the demand for data analysis and data classification has in-
creased (Zanin et al., 2016). Machine learning and data mining are among the most
popular techniques used in this area. The latter refers to mining data in order to
recognize its hidden patterns and relationships (Sumathi & Sivanandam, 2006). Systems
such as artificial intelligence, which reveal patterns in a database, are called data mining
systems (Saitta et al., 2008).
Table 1 Proposed models of credit risk. The researchers have tried to solve the customer creditrisk assessment problem, using a different approach and technique, and each of them has tried topresent a more accurate model than others. Table 1 summarizes these researches. It shows that90.9% of the previous models are static and only 9.1% of them are dynamic
Authors’ name Techniques Static / Dynamic Type of predictor(Certain/Uncertain)
Hussain Ali Bekhet et al., 2014 ANN: RBF Static Certain
Gusti Ngurah Narndra Mandalaa.Et al, 2012
Decision Tree: c 5.0 Static Certain
Weimin Chen et al., 2012 Clustering, SVM Static Certain
Fatemeh Nemati Koutanaeiet al., 2015
GA, SVM, PCA Static Certain
Zhiwang Zhang et al., 2014 Kernel, fuzzification, penaltyfactors
Static Certain
Danenas P et al., 2015 SVM Static Certain
Ghodselahi, 2011 SVM, Fuzzy clustering Static Certain
Shahrzad Zaman, 2013 MLP, RBF Static Certain
Vahid Baradaran, 2015 ANFIS Static Certain
Blanco et al., 2013 MLP, linear discriminant analysis,quadratic discriminant analysis,logistic regression
Dynamic Certain
Bensic et al., 2005 Logistic regression, NNs andClassification and regression trees
Static Certain
West, 2000 Linear discriminant, analysis andlogistic regression, decision trees,kernel density estimation, nearestneighbor
Static Certain
Witkowska et al., 2004 MLP, RBF Static Certain
Yeh et al., 2009 K-nearest neighbor (KNN) classifiers,Logistic regression, Discriminantanalysis, Naı¨ve Bayesian classifier,Classification trees, ANN
Static Certain
Ping et al., 2011 SVM Static Certain
Tsai, 2008 MLP Static Certain
Twala, 2010 ANN, decision tree, Naïve Bayes,k-NN,logistic, discriminant analysis
Static Certain
Hsieh et al., 2010 NN, support vector machine, andBayesian network
Static Certain
Paleologo et al., 2010 SVM, decision trees, KNN, AdaBoost,Subagged classifiers
Static Certain
Wang et al., 2011 SVM Static Certain
Oreski et al., 2014 Presented a new hybrid GA withANN
Static Certain
Maria Rocha Sousa et al., 2016 Generalized Additive Model (GAM) Dynamic Certain
Moradi and Mokhatab Rafiei Financial Innovation (2019) 5:15 Page 3 of 27

There are several techniques for data mining, each with different capabilities: e.g., de-
cision trees and rule induction, neural networks, fuzzy modeling, support vector ma-
chines (SVMs), k-nearest neighbors (k-NN), Bayesian networks (BNs), instance-based
algorithms, and learning classifier systems (Berthold & Hand, 2003). All of these tech-
niques can be classified into one of three categories: a) classical statistics, b) artificial
intelligence, and c) machine learning (Girjia & Sirvatsa, 2006). Attempts to acquire
knowledge using machines date back to the 1950s (see (Rosenblatt, 1958) and the refer-
ences therein). Today, machine learning is used in a wide range of fields including
speech and image recognition, and its algorithms facilitate many routines such as fraud
detection, web searches, text-based sentiment analysis, image segmentation, object rec-
ognition, and credit scoring. Materials science pioneered machine learning in the
1990s, applying artificial neural networks (ANNs) and other methods to predict corro-
sion behavior (Rao & Mukherjee, 1996).
Statistical learning concerns learning from existing data and includes two types: su-
pervised and unsupervised learning. The approach of clustering, i.e., partitioning a
dataset into groups of similar members, has been established (Kaufman & Rousseeuw,
2009). To find appropriate machine learning techniques such as ensemble methods,
Nanni et al. (Nanni & Lumini, 2009) used Australian, German, and Japanese financial
datasets. They found that the “random subspace” of the Levenberg– Marquardt neural
net was the best method of classification (Nanni & Lumini, 2009).
The models presented so far can be organized into two categories. The first category
applies already existing models such as ANN and SVM. The second category proposes
a new hybrid model based on the existing models. Many models have been presented;
however, banks still require a model that calculates customer credit risk and decreases
the amount of NPLs. Here we review some such models.
Single-method model
Mandala et al. (Narindra Mandalaa & Fransiscus, 2012), identified factors at a rural
bank– Bank Perkreditan Rakyat– that are necessary for assessing credit applications.
Additionally, a decision tree model was proposed on the basis of data mining method-
ology. Aiming to reduce the number of NPLs, current decision criteria for credit risk
assessment are evaluated.
The credit risk assessment model was applied to the bank PT BPR X in Bali, which
contains 1082 lenders (11.99%) with NPLs identified as bad loan cases. This brought
PT BPR X into the category of poorly performing banks.
Data mining is used in developing a decision tree model for credit assessment as it
can indicate whether the class of the request of lenders is of performing loan or NPL
risk. Using C 5.0 methodology, a new decision tree model was generated. The model
suggests new criteria for analyzing loan applications. The evaluation results show that,
by applying this model, PT BPR X can reduce the amount of NPLs to less than 5% and
the bank can be consequently classified as a well-performing bank (Narindra Mandalaa
& Fransiscus, 2012). Abdou et al. (Abdou & Pointon, 2009) considered the current
credit-scoring approach, which is based on personal judgment. It is shown that, com-
pared to the currently used judgment techniques, statistical scoring techniques provide
more efficient classification results (Abdou & Pointon, 2009). Furthermore, neural net
Moradi and Mokhatab Rafiei Financial Innovation (2019) 5:15 Page 4 of 27

models provide better average correct classification rates, but the optimal choice of
technique depends on the misclassification cost ratio. For a lower cost ratio, a probabil-
istic neural net is preferred while, for a higher ratio, multiple discriminant analysis
(MDA) is the preferred choice (Abdou & Pointon, 2009). Thus, there is a role for MDA
as well as for neural nets.
There is some evidence of statistically significant differences between advanced scor-
ing models and conventional models (Abdou & Pointon, 2009). Zamani (Zamani, 2011)
studied customers’ behavior patterns under two models: a multilayer perceptron net-
work (MLP) and a neural network composed of radial basis functions (RBFs). Compari-
son of the two models showed that the MLP is better than RBFs in predicting the
credit risk of legal clients (Zamani, 2011).
Bensic (Bensic et al., 2005) studied some important features of credit scoring in
small-business lending by comparing the accuracy of logistic regression, neural net-
works (NNs), and classification and regression tree (CART) decision trees. The results
showed that the probabilistic NN model achieves the highest “hit rate” and the lowest
type I error (Bensic et al., 2005). West (West, 2000) investigated the accuracy of five
NN models of credit scoring; namely, multilayer perceptron, mixture-of experts, RBF,
learning vector quantization, and fuzzy adaptive resonance. The results showed that
the mixture-of-experts and RBF neural network models are more sensitive than the
multilayer perceptron approach (West, 2000). Yeh et al. (Yeh & Lien, 2009) explored
data mining methods in an attempt to find the most accurate and predictive methods
for finding the probability of defaults. They found that artificial neural networks pro-
vide the most accurate estimation of the probability of default among the six data min-
ing techniques examined. Based on this, they established a model called the sorting
smoothing method (Yeh & Lien, 2009).
Hybrid model
A hybrid data mining model of feature selection and ensemble learning classification al-
gorithms was developed by Koutanaei et al. (Nemati Koutanaei et al., 2015) based on
three stages. The first stage concerns data gathering and pre-processing. In the second
stage, four feature selection (FS) algorithms, including principal component analysis
(PCA), genetic algorithms (GA), information gain ratio, and relief attribute evaluation
functions are employed. Here, parameters of the FS methods are set from the classifica-
tion accuracy of the SVM classification algorithm. After selecting the appropriate
model for each selected feature, they are applied to the base and ensemble classification
algorithms. Accordingly, the best FS algorithm (along with its parameters) is indicated
for the modeling stage of the proposed model. In the third stage, classification algo-
rithms are employed for the prepared dataset of each FS algorithm. The results of the
second stage revealed that the PCA algorithm is the best FS algorithm. In the third
stage, the classification results showed higher accuracy achieved by the ANN adaptive
boosting (AdaBoost) method (Nemati Koutanaei et al., 2015).
A novel multi-criteria optimization classifier based on kernel, fuzzy, and penalty fac-
tors was proposed by Zhang et al. (Zhang, 2014): a kernel function is used first to map
the input points into a high-dimensional feature space; an appropriate fuzzy member-
ship function is then introduced to a multi-criteria optimization classifier that
Moradi and Mokhatab Rafiei Financial Innovation (2019) 5:15 Page 5 of 27

associates it with each data point in the feature space; and finally, unequal penalty fac-
tors are added to the input points of the imbalanced classes. Thus, the effects of the
aforementioned problems are reduced (Zhang, 2014). Rather than expending effort on
determining which of the two models provides greater predictive capacity, Baixauli et
al. (Baixauli et al., 2012) highlighted the importance of combining a structural model
with an accounting model. In fact, recent literature indicates that there is no superiority
of one approach over the other because they both capture different aspects of the risk
of bankruptcy in companies, and they should be combined to improve credit risk man-
agement (Baixauli et al., 2012). Shahari et al. (Shahari et al., 2015) collected the annual
panel data from 2005 to 2012 from 40 Islamic banks from 12 countries. They provided
some policy recommendations that can result in further reduction of credit risks and
improvement of bankers’ confidence level in implementing asset-based financing pol-
icies (Shahari et al., 2015). Using a hybrid data mining technique, Chen et al. (Chen et
al., 2012) proposed a credit-scoring model that has two processing stages: clustering
and classification. In the clustering stage, samples of accepted and new applicants are
divided into homogeneous clusters, the isolated samples are excluded, and inconsistent
samples are relabeled. In the classification stage, samples with new labels are fed into
SVMs to build the scoring model. One difference between this model and the other
credit-scoring models is that the samples are classified into three or four classes rather
than just “good” and “bad” classes. Based on the credit data set provided by a local
bank in China, their experimental results showed that choosing a proper cut-off point
can result in superior classification accuracy of good and bad customers. According to
the characteristics of each class, risk management strategies are then developed (Chen
et al., 2012). Research shows that defaults relate largely to macroeconomic variables
(Yurdakul, 2014) and that uncertainty of economic policies increases banks’ credit risks
(Chi & Li, 2017) with negative effects on loan size (Chi & Li, 2017). Danenas (Danenas
& Garsva, 2015) proposed a credit risk evaluation method consisting of SVM classifier
selection, external evaluation, and a sliding window. Results showed that the proposed
method is comparable to other classifications like RBF networks and logistic regression
(Danenas & Garsva, 2015).
Ping et al. (Ping & Yongheng, 2011) proposed a hybrid SVM-based model for evaluating
credit scores based on customer variables which consists of four methods: (1) using a rough
neighborhood to set input feature selections; (2) applying a grid search for optimizing RBF
kernel parameters; (3) using hybrid optimal input features and a model; and (4) comparison
between the accuracy of the suggested method and other methods. Results illustrated that
the SVM-based hybrid classifier and the rough neighborhood set yield the best
credit-scoring ability in comparison with other hybrid classifiers. They also outperformed
linear discriminant analysis, logistic regression, and NNs (Ping & Yongheng, 2011).
Combining classifiers is one of the concerns of recent research in machine learning.
Twala (Twala, 2010) explored the predictions of five classifiers in credit risk predictions
based on their manner of confronting noise and accuracy in applying classifier ensem-
bles. He showed that the ensemble of classifiers can improve the accuracy of prediction
(Twala, 2010). Hsieh et al. (Hsieh & Hung, 2010) introduced a preprocessing step for
obtaining an efficient ensemble classifier. They proposed class-wise classification using
several data-mining techniques such as NN, SVM, and Bayesian networks to further in-
crease the efficiency of the ensemble of classifiers (Hsieh & Hung, 2010).
Moradi and Mokhatab Rafiei Financial Innovation (2019) 5:15 Page 6 of 27

Table 1 summarizes data-mining techniques and types of predictors.
It shows that 90.9% of the previous models are static and only 9.1% of them are dy-
namic. International sanctions were inflicted on the Iranian regime during 2008–2016.
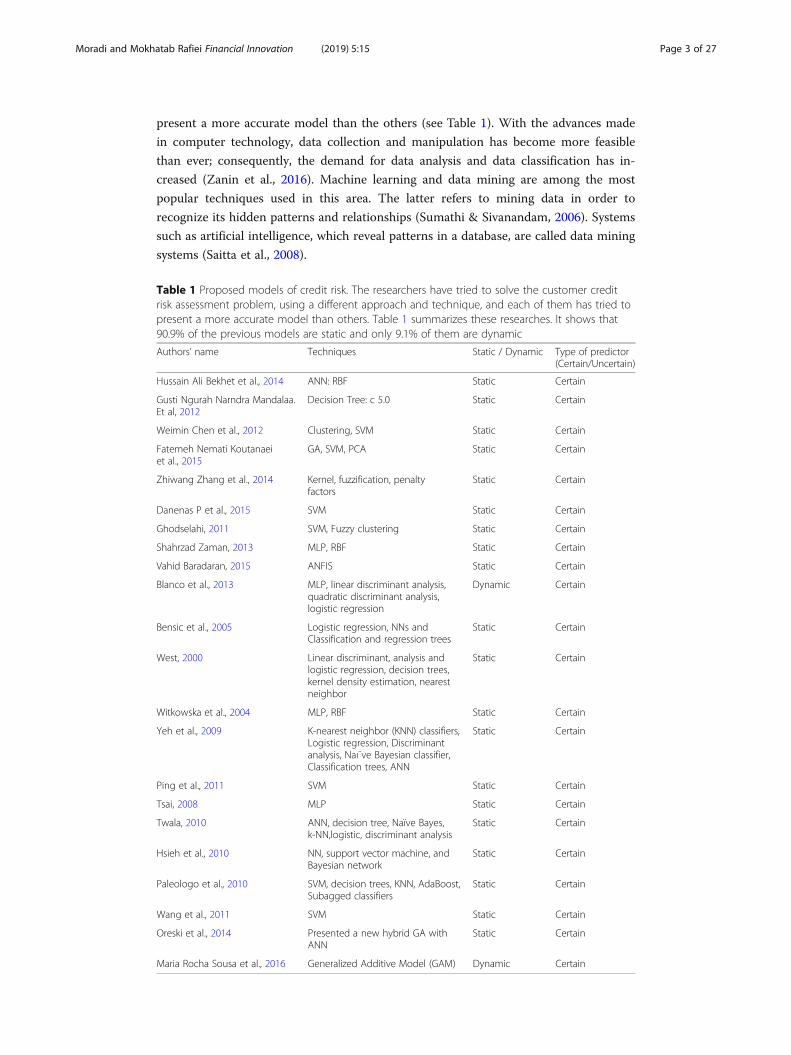
The number of NPLs increased (Fig. 1) and economic sectors were affected by the
NPLs (Fig. 2). Our experiences with Iran showed that critical circumstances such as
hyperinflation, sanctions, and unemployment can affect customers’ lives and move
them from the “good customer” segment to the “bad customer” segment.
Interestingly, more than 73% of NPLs were backed loans (in which the borrower of-
fers very large collaterals to secure the loan). Apparently, these collaterals could not
guarantee customer repayment. The prevailing credit risk assessment models were in-
accurate in critical situations like those of sanctions. Customer behavior is subject to
change with the passage of time, and so is customer credit risk. A sophisticated dy-
namic model that can account for these kinds of crises is required.
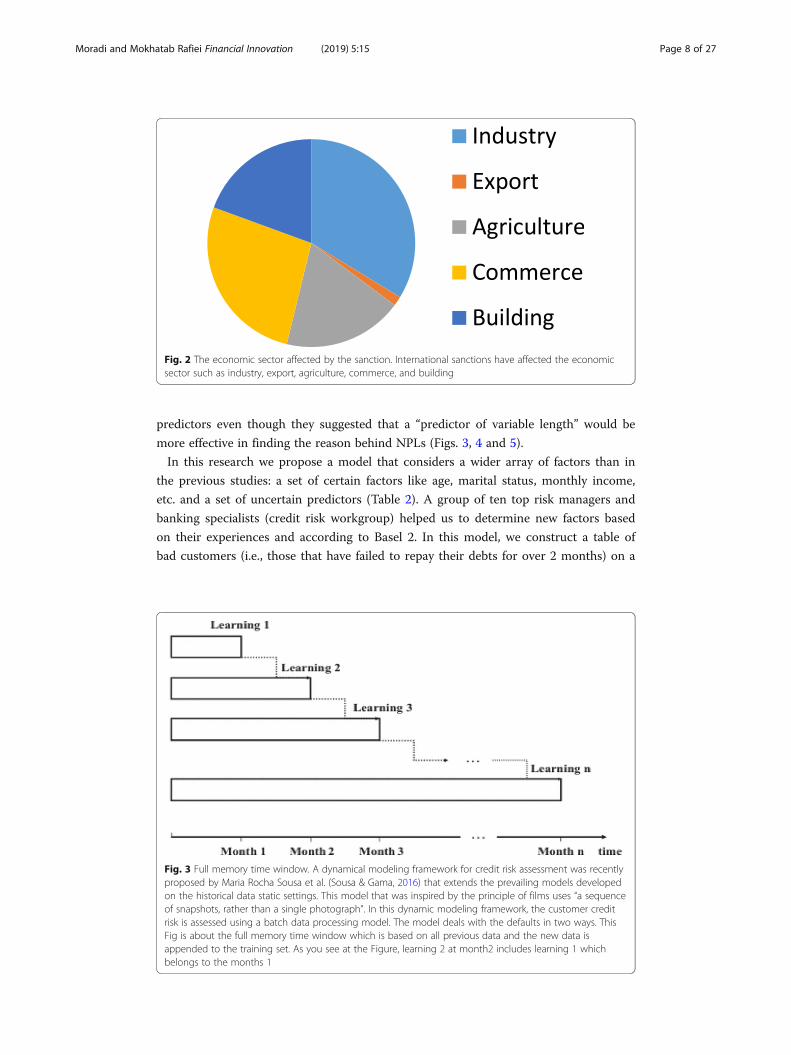
A dynamical modelling framework for credit risk assessment was recently proposed
by Sousa et al. (Sousa & Gama, 2016); it extends the prevailing models developed on
the basis of historical data static settings. This model was inspired by the principle of
films, using “a sequence of snapshots, rather than a single photograph.” In this dynamic
modeling framework, customer credit risk is assessed using a batch data processing
model. A generalized additive model (GAM) is used for classification of data in a super-
vised training environment and the learning units are set as static units. The re-
searchers used a Gini coefficient for measuring model performance from data from
previous months. The model deals with defaults in two ways: a full-memory time win-
dow based on all previous data, in which new data is appended to the training set
(which is unable to adapt to major changes); and a fixed short-memory time window
that forgets the past. The latter was used because the researchers believed that there is
a low correlation between ongoing defaults and past instances. Figures 3 and 4 show
the full- and short-memory time windows, respectively (Sousa & Gama, 2016). Al-
though this model has been proven to outperform static models in helping the banks
to prevent probable future losses, it has some shortcomings. In the banking industry,
credit-scoring models are usually developed from static windows and are kept un-
changed for long periods of time, possibly years. Although, Sousa et al. (Sousa & Gama,
2016) provided convincing results in their research, they did not consider some import-
ant topics in credit risk assessment. For example, their model considered a set of fixed
Fig. 1 Non-performing loan chart. International sanctions inflicted the Iranian regime during 2008–2016and the NPL increased. The vertical axis shows the average of NPL and the horizontal axis shows the year.The chart shows the NPL at each year
Moradi and Mokhatab Rafiei Financial Innovation (2019) 5:15 Page 7 of 27
predictors even though they suggested that a “predictor of variable length” would be
more effective in finding the reason behind NPLs (Figs. 3, 4 and 5).
In this research we propose a model that considers a wider array of factors than in
the previous studies: a set of certain factors like age, marital status, monthly income,
etc. and a set of uncertain predictors (Table 2). A group of ten top risk managers and
banking specialists (credit risk workgroup) helped us to determine new factors based
on their experiences and according to Basel 2. In this model, we construct a table of
bad customers (i.e., those that have failed to repay their debts for over 2 months) on a
Fig. 2 The economic sector affected by the sanction. International sanctions have affected the economicsector such as industry, export, agriculture, commerce, and building
Fig. 3 Full memory time window. A dynamical modeling framework for credit risk assessment was recentlyproposed by Maria Rocha Sousa et al. (Sousa & Gama, 2016) that extends the prevailing models developedon the historical data static settings. This model that was inspired by the principle of films uses “a sequenceof snapshots, rather than a single photograph”. In this dynamic modeling framework, the customer creditrisk is assessed using a batch data processing model. The model deals with the defaults in two ways. ThisFig is about the full memory time window which is based on all previous data and the new data isappended to the training set. As you see at the Figure, learning 2 at month2 includes learning 1 whichbelongs to the months 1
Moradi and Mokhatab Rafiei Financial Innovation (2019) 5:15 Page 8 of 27
monthly basis; then we train the ANFIS with this data. A fuzzy inference system (FIS)
then applies our defined rules to model the customers’ defaults.
The conceptual diagram of the proposed model is shown in Fig. 6.
In lending, it is vital to rely on models instead of human judgement (Khandani &
Kim, 2010). In this model, human judgement is removed from the customer evaluation
process. The factors have been chosen in such a way that they cluster customers better
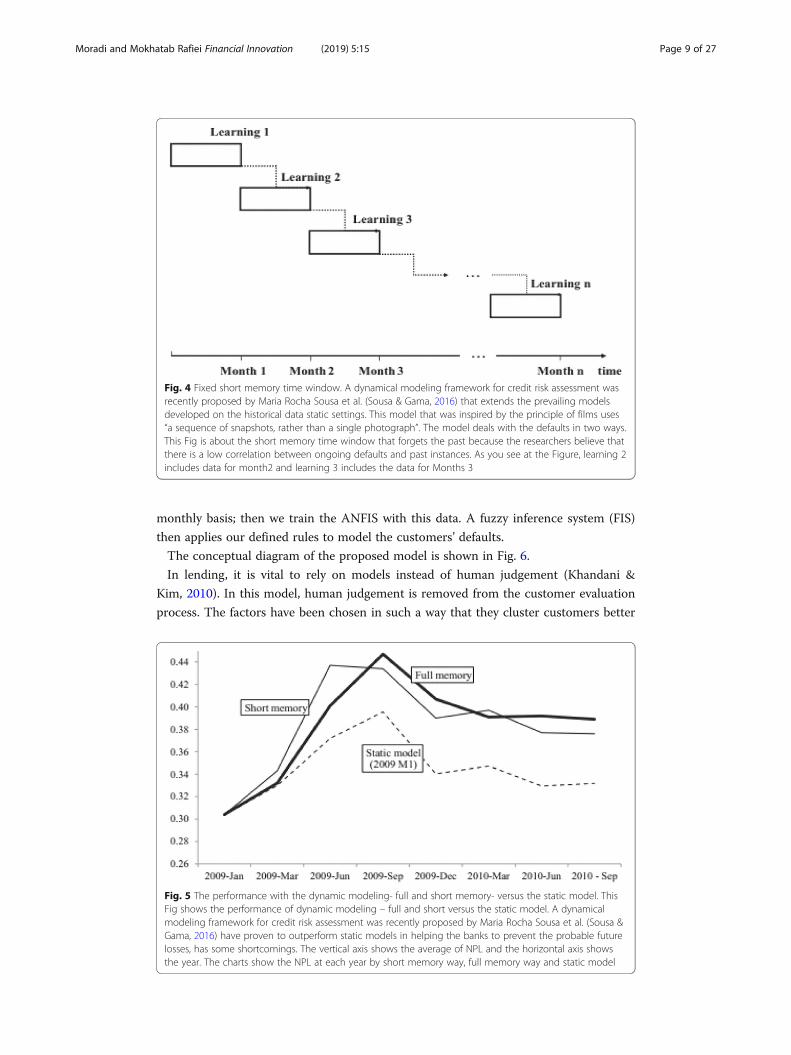
Fig. 4 Fixed short memory time window. A dynamical modeling framework for credit risk assessment wasrecently proposed by Maria Rocha Sousa et al. (Sousa & Gama, 2016) that extends the prevailing modelsdeveloped on the historical data static settings. This model that was inspired by the principle of films uses“a sequence of snapshots, rather than a single photograph”. The model deals with the defaults in two ways.This Fig is about the short memory time window that forgets the past because the researchers believe thatthere is a low correlation between ongoing defaults and past instances. As you see at the Figure, learning 2includes data for month2 and learning 3 includes the data for Months 3
Fig. 5 The performance with the dynamic modeling- full and short memory- versus the static model. ThisFig shows the performance of dynamic modeling – full and short versus the static model. A dynamicalmodeling framework for credit risk assessment was recently proposed by Maria Rocha Sousa et al. (Sousa &Gama, 2016) have proven to outperform static models in helping the banks to prevent the probable futurelosses, has some shortcomings. The vertical axis shows the average of NPL and the horizontal axis showsthe year. The charts show the NPL at each year by short memory way, full memory way and static model
Moradi and Mokhatab Rafiei Financial Innovation (2019) 5:15 Page 9 of 27

than the models currently in use. Dynamic clustering techniques were used for cluster-
ing. In the next section, we present a description of the main concepts such as fuzzy
theory, the fuzzy inference system (FIS), and the adaptive network-based fuzzy infer-
ence system (ANFIS). Section 3 presents the research methodology as well as the
Table 2 Factors of the proposed model. In this research, we propose a model which considers awider array of factors than the previous researches: a set of certain factors like age, marital status,monthly income, etc. And a set of uncertain predictors (Table 2). A group of 10 top risk managersand banking specialists (credit risk workgroup) helped us to determine these new factors base ontheir experiences and according to Basel 2
Variables Type of customer thatcorresponds to the variable
Certain oruncertain
Number of customer product Individual/legal customer Certain
Number of adverse judgment Individual/legal customer Certain
Number of loan repayment past due Individual/legal customer Certain
Non-performing amount Individual/legal customer Certain
Number of hard inquiries Individual/legal customer Certain
Number of rejected request Individual/legal customer Certain
Number of dishonored cheque Individual/legal customer Certain
Collateral valuation Individual Uncertain
Number of risky customers guaranteed individual Certain
Number of write off Individual Certain
Duration of non-performing Individual/legal customer Certain
Exposure amount for each customer Individual/legal customer Uncertain
Expected loss Individual/legal customer Uncertain
Deposit amount Individual Certain
Debt to income ratio Individual Certain
Credit score of guarantor Individual/legal customer uncertain
Customer probability of default Individual/legal customer uncertain
Capital return legal customer uncertain
Arrears amount legal customer Certain
Liability Individual/legal customer Certain
Net flow legal customer Certain
Average asset balance previous 12 month legal customer Certain
Available credit amount Individual/legal customer Certain
Number of repossessions Individual/legal customer Certain
Pay hike/rise legal customer Certain
Earning power legal customer Certain
Earning asset legal customer Certain
Intangible asset legal customer Certain
Deferred income legal customer Certain
Recovery rate Individual/legal customer Uncertain
Due date Individual/legal customer Certain
Post-dated check Individual/legal customer Certain
Non mortgage credit payment Individual Certain
Customer life time value Individual/legal customer Certain
Occupation stability Individual/legal customer Uncertain
Moradi and Mokhatab Rafiei Financial Innovation (2019) 5:15 Page 10 of 27

dynamic model of this research. A case study and its solution is provided, as well. Sec-
tion 4 includes the results and discussion of the study; finally, Section 5 concludes this
paper.
Fuzzy theory
The word fuzzy in the Longman Dictionary of Contemporary English is defined to
mean inaccurate and unclear (Procter, 1978). For over two thousand years, Aristotle’s
law has governed our perception of what is true and what is false, philosophically. In
1960, Professor Zade, a prominent scholar of control theory, presented fuzzy theory to
explain real phenomena that are ambiguous and fuzzy. Unlike Boolean logic, which
works based zeros and ones, fuzzy logic works based on the degree of membership of
an element in a fuzzy set defined by a membership function. Figure 7 shows the
Fig. 6 Conceptual model of the dynamic model. T1, t2 … tn show the months. We organize a table basedon the monthly data on bad customers (i.e. those who have not paid their debt for the last 2 months orso), then we apply FCM to cluster customers, then we train the ANFIS and construct a dynamic modelbased on the data in this table. This model is used then to assess the customers’ credit risk at the time ofregistry. Only if the customer is assessed to be low risk, they are given credit. Otherwise, if they are foundhigh risk they will get no credit. Alternatively, if the customer belonged to the medium-risk segment in theanalysis with the dynamic model, the second round of assessment will begin using a fuzzy inferencesystem based on our predefined rules. The analysis ends if the customer is still shown to be too risky.However, if they are shown to belong to the medium risk group, conditional credit can be allocated tothese customers
Moradi and Mokhatab Rafiei Financial Innovation (2019) 5:15 Page 11 of 27

graphical representation of the membership function of the fuzzy set of real numbers
near one (Dikjkman et al., 1983).
To illustrate the difference between Aristotelian/Boolean and fuzzy logic (Fig. 8), con-
sider the expression of people’s height in fuzzy theory. The degree of height for individ-
uals between 150 and 180 cm tall would appear as shown in Fig. 9.
Practical applications of fuzzy theory were initiated in the 1970s as skepticism about
its existential nature was dispelled (see Amid (Amid, n.d.) and the references therein).
Fuzzy theory has since become popular because it provides an appropriate tool for
modeling complex and uncertain systems. Fuzzy logic has several suitable features that
make it a flexible and powerful toolbox for dealing with inaccurate data (for a review of
applications, see (Dikjkman et al., 1983)). Moreover, a fuzzy system can easily be estab-
lished on the expertise of experienced people. Human opinions can be converted into
rules using fuzzy theory. Therefore, since part of this research is based on expert know-
ledge, we used fuzzy logic (see the research methodology section).
Fuzzy inference system (FIS)
The fuzzy inference system (FIS) provides a systematic process for converting a
knowledge-based system into a nonlinear mapping. The first component of the sys-
tem is fuzzification, which converts the numerical values of input variables into a
fuzzy set. The second component includes a fuzzy rule base that is a set of if-then
rules and a fuzzy inference engine that converts the inputs into a series of outputs.
Finally, a defuzzification mechanism that converts the fuzzy output into a definite
number (Nauk et al., 1997) is applied. Figure 10 shows the steps of the fuzzy infer-
ence system.
Fig. 7 Membership function of a real number. This Fig is the graphical representation of the membershipfunction of the fuzzy set of real numbers near one. The horizontal axis is number and the vertical axis is thevalue of the membership. For example, the value of the membership of number one is one
Fig. 8 Boolean logic and Fuzzy logic. This Fig illustrates the difference between Aristotelian/Boolean andfuzzy logic. Aristotelian logic has defined border between zero and one but Fuzzy logic does not havedefined border. It is a range between zero and one
Moradi and Mokhatab Rafiei Financial Innovation (2019) 5:15 Page 12 of 27

Various methods have been used in the literature for fuzzifying and defuzzifying vari-
ables (Wang & Chen, 2014). Through a series of trial and error, we chose the Sugeno
method (Sugeno, 1985), in which the preceding expressions are fuzzy and yielded more
accurate results.
Adaptive network-based fuzzy inference system (ANFIS)
Consider a system that looks like a black box. It receives some inputs and produces
some outputs. The aim is to design a neuro-fuzzy model that accurately describes the
system. According to Fig. 11, if the error is zero for every input, then the model works
exactly like the system.
Jang (Jang, 1993), the inventor of this method, defined a function called mean
squared error (MSE) and proved that, if the value of the cost function is minimized by
changing the model parameters, the model approaches the real system. This process is
called training. There is a theorem according to which, if there is a target system like
that shown in Fig. 11, then a fuzzy system can be designed as closely as desired to the
system. Different methods have been proposed for the implementation of Fig. 11, but
the most important structure proposed so far is an adaptive network-based fuzzy
Fig. 9 Membership function of tallness. This Fig considers the expression of the people’s height in the fuzzytheory. The degree of tallness for individuals between 150 and 180 cm
Input (crisp) Output (crisp)
Fuzzy rule base
Fuzzification Defuzzification
Inference engine (fuzzy input) (fuzzy output)
Fig. 10 Fuzzy inference system. The Fuzzy Inference System (FIS) provides a systematic process for convertinga knowledge-based system into a nonlinear mapping. The first component of the system is a fuzzification thatconverts the numerical values of input variables to a fuzzy set. The second component includes a fuzzy rulebase that is a set of if-then rules and a fuzzy inference engine that converts the inputs into a series of outputs.And finally, a defuzzification component that converts the fuzzy output to a definite number
Moradi and Mokhatab Rafiei Financial Innovation (2019) 5:15 Page 13 of 27

inference system (ANFIS). It adapts itself to the input data and gradually minimizes
error based on the gradient descent training principle. An ANFIS is a comparative
neural network offering the advantages of learning, optimization, and fuzzy logic.
An adaptive network is a network structure that connects several nodes to several links.
The nodes represent processing units and the links show the connection between
those processing units. The rules of learning are made in a way to reduce system error
and properly correct the node parameters. To determine the parameters, the ANFIS
uses the hybrid learning principle, which combines the method of gradient descent and
the least squares method.
Sugeno or Takagi–Sugeno–Kang is a method of fuzzy inference. Consider a Sugeno
fuzzy model with two inputs and one output. The fuzzy rules can be set as follows:
If Input 1 = x and Input 2 = y, then the Output is z = ax + by + c (formula 1).
The total output is the weighted average of outputs. The structure of the ANFIS is
shown in Fig. 12 (Polat & Günes, 2006).
Research methodologyApproach
Our model takes a straightforward route. We organize a table based on monthly data
on bad customers (i.e., those who have not repaid their debts for the last 2 months or
Fig. 11 System Figure. This Fig supposes a system like a black box. It gets xi s as inputs and gives tis as outputs.The aim is to design a model of a neuro-fuzzy that describes the system accurately. If the error is zero for everyinput, then the model works exactly like the system
Fig. 12 The structure of the ANFIS. An adaptive network is a network structure that contains five layers andlinks a number of nodes to a number of links. The nodes represent processing units and the links show theconnection between those processing units. The rules of learning are made in a way to reduce the systemerror and correct the node parameters as they should. To determine the parameters, the ANFIS uses thehybrid learning principle, which combines the method of the gradient and the least squares method
Moradi and Mokhatab Rafiei Financial Innovation (2019) 5:15 Page 14 of 27

so); then we train the ANFIS and construct a dynamic model based on the data in this
table. This model is then used to assess the customers’ credit risk at the time of regis-
try. Only if the customer is assessed to be risk free based on the static models from the
dataset containing the information on all customers, is the customer given credit.
Otherwise, if the customer is found to be too risky, the customer is given no credit. Al-
ternatively, if the customer belongs to the medium-risk segment in the analysis
using the dynamic model, a second round of assessment begins using a fuzzy infer-
ence system based on our predefined rules. The system classifies customers into
three clusters of low, medium, and high risk. The analysis ends if the customer is
still shown to be too risky. However, if the customer is shown to belong to the
medium-risk group, conditional credit can be allocated; if classified in the low-risk
group based on the second round of analysis, the customer is given credit and the
analysis ends.
All calculations and the construction of FIS and ANFIS was done by the FIS and
ANFIS toolboxes in MATLAB R2015b. However, for developing the model for a
larger scale, Java and Oracle can be used. Figure 13 summarizes the research
methodology.
Dynamic model for credit risk
Traditionally, researchers have applied methods like SVM, PCA, and ANN and focused
mainly on repetitive demographic factors to forecast credit risk. While these models
work reasonably well during periods of stasis, they cannot take economic crises into ac-
count. A model is needed that can account for the passage of time and critical situa-
tions like sanctions, which can have unfortunate impacts on customers’ personal lives
and, more importantly, on their ability to repay their obligations.
Fig. 13 Research methodology. The research methodology includes four steps as follows: Credit risk variables,FIS, Clustering the dataset and ANFIS. Each step includes one or some activities. The first step is credit riskvariables which define and approve factors for evaluating customer credit risk according to risk managers. Thesecond step is FIS which includes the activities shows in FIS step of Fig. 13. The third step is clustering thedataset which includes the activities shows in clustering the dataset step of Fig. 13.The fourth step is ANFISwhich includes the activities shows in ANFIS step of Fig. 13
Moradi and Mokhatab Rafiei Financial Innovation (2019) 5:15 Page 15 of 27

The default rate has grown at an alarming rate in Iran following the economic and
political sanctions applied against the governing regime. This growth has been unpre-
dictable in the static models that Iranian banks currently use. We combine FIS, fuzzy
clustering, and ANFIS to create a dynamic model that is robust to these political and
economic fluctuations. Therefore, the factors applied in this model are different from
those of previous research, and can be used for both individuals and legal customers
(see Table 2). We defined these factors and a group of ten top risk managers in several
meetings, who approved them. Some of the factors do not change over time; we called
these certain factors. Others do change; we called these uncertain factors. We applied
fuzzy theory to the uncertain factors.
We used FIS and fuzzy theory to implement risk managers’ opinions as a rule base
for the dynamic model. The FIS contained the new credit risk factors and related rules
between them.
Considering the behavioral features of customers in special economic and polit-
ical conditions, fuzzy numbers and their related calculations can be applied in solv-
ing customer credit risk problems. Fuzzy systems have a unique capability in
utilizing human knowledge and are appropriate tools for modelling complex sys-
tems dealing with uncertainty. As reviewed in the background section, ANNs can-
not individually exploit human knowledge as they are a data driven method and
need data; but fuzzy systems are knowledge-based systems. In ANNs, it is difficult
to define a rule that can be used by a human. However, in a fuzzy system, it is
possible to create a rule that is understandable and implementable by a human.
We divide the customers into three groups based on how late they have been in
paying instalments: low risk (LR), indicating less than 2 months; medium risk
(MR), from 2 to 6 months; and high risk (HR), more than 6 months. According to
the membership function concept, each customer belongs partly to each group and
there are no definite boundaries between them.
Dynamic engine of the proposed model
The statistical population used in this study contains 9000 records of bank customer
profiles in a database that includes properties like name, age, time at current address,
monthly income, and application date, due date, instalment date, and number of prod-
ucts, gender, and names of the parents of the customers. Some behavioral patterns are
clearly observable based on the database; however, these patterns have proved to
change as the political and economic environment changes.
Moreover, training using all data from the customer dataset and constructing a dy-
namic model of credit risk that needs to be updated every few months is costly for
banks and financial institutions; they usually decline to use such models. They prefer to
construct a model once and use it for years. In order to determine the behavioral pat-
terns of customers in a period of economic crisis, we collected data monthly on cus-
tomers that failed to repay their debts for over 2 months and organized them into a
table. Then we used this data in an ANFIS to create a new dynamic model. Jang
(Sugeno, 1985) found that models developed via ANFIS, which is a general approxima-
tor, can be very close to reality. This model then became the dynamic engine of our
model.
Moradi and Mokhatab Rafiei Financial Innovation (2019) 5:15 Page 16 of 27

The customer features with the most impact on the patterns were selected in this re-
search; they include age, monthly income, number of dependents, marital status, occu-
pation code, type of home, and bill payment experience.
As mentioned above, the input for ANFIS was the monthly customer profile dataset.
Some underlying rules in the customer profile dataset are hidden from a human obser-
ver; therefore, we fuzzy-clustered the customers before feeding them into the ANFIS,
thus letting the models recognize the rules better and decreasing the calculation load.
There are several available clustering methods like k-means, FCM, and subtractive ap-
proaches. To find which is best for our research, we clustered the customers using
k-means, FCM, and subtractive clustering methods. The MSEs of three methods
(k-means, FCM, and subtractive clustering) are shown respectively in Figs. 14, 15, and 16.
Figure 15 shows that the FCM yields the best results. The k-means method had a
crisp border between the three clusters but most of the risks occurred along the bor-
ders. How best to behave with these borderline customers is an important problem.
The results of FCM analysis were the best because it changed to adopt milder behav-
ior at the borders. The subtractive method clustered customers into several segments
and did not fit the purpose of the model.
The customer dataset was clustered into three segments fed into the ANFIS as input.
After training the ANFIS, the underlying hidden rules of the system became evident.
We first clustered the data set into manageable segments using an unsupervised fuzzy
clustering method because it assumed no definite boundaries between the customer
segments. The unsupervised approach was taken because we wanted the system to
cluster customers without any bias. This network can adapt itself over time and can
discover the rules of the system.
Fig. 14 K-means MSE. There are some clustering methods like K-Means, FCM, and subtractive. To find whichone is the best for our research, we have clustered the customers using K-Means, FCM, and subtractiveclustering methods and compared the methods’ MSEs. The MSEs (Mean-Square Error) of the k-means is shownin Fig. 14. The error mean is = − 1.7356e-0.5 and std. = 0.00020128. The Mean squared error (MSE) measures theaverage of the squares of the errors
Moradi and Mokhatab Rafiei Financial Innovation (2019) 5:15 Page 17 of 27

Making a fuzzy inference system for the proposed model
The fuzzy variables used to create the FIS rule base in this research were defined based
on trapezoidal fuzzy numbers. As an example, consider these two factors: the number
of loan repayments past due and debt-to-income ratio, as shown in Table 3. To limit
the description of the value of factors, we used SD as little, MD as medium and LD as
Fig. 15 The FCM MSE. There are some clustering methods like K-Means, FCM, and subtractive. To findwhich one is the best for our research, we have clustered the customers using K-Means, FCM, andsubtractive clustering methods and compared the methods’ MSEs. The MSEs (Mean-Square Error) of theFCM is shown in Fig. 15. The error mean is = − 2.177e-0.6 and std. = 6.343e-0.5. The Mean squared error(MSE) measures the average of the squares of the errors
Fig. 16 The subtractive clustering MSE. There are some clustering methods like K-Means, FCM, andsubtractive. To find which one is the best for our research, we have clustered the customers using K-Means,FCM, and subtractive clustering methods and compared the methods’ MSEs. The MSEs (Mean-Square Error)of the subtractive is shown in Fig. 16. The error mean is = 2.9142e-0.8 and std. = 5.5786e-0.5 The Meansquared error (MSE) measures the average of the squares of the errors
Moradi and Mokhatab Rafiei Financial Innovation (2019) 5:15 Page 18 of 27

high (SD, MD, and LD are not acronyms. They are just terms that we assumed. SD
stands for little, MD stands for medium, and LD stands for high).
When debt to income is greater than one it is SD. When debt to income is equal to
one it is MD, and when debt to income is less than one it is LD. If loan repayments
past due is less than two it is SD. If loan repayments past due is between two and six it
is MD, and if loan repayments past due is greater than six it is LD.
Table 3 combines two input variables. It indicates that, if the number of loan repay-
ments past due is low (SD) and the ratio of debt-to-income is low (SD), then the cus-
tomer is recognized as low-risk. If the number of loan repayments past due is around
the middle (MD) and the ratio of debt-to-income is high (LD) then the customer is rec-
ognized as high-risk (HR). The following are some of the rules applied according to
specialist knowledge:
1. If (debt-to-income ratio is SD) and (number of loan repayments past due is SD),
then (customer evaluation is MR) (1).
2. If (debt-to-income ratio is SD) and (number of loan repayments past due is MD),
then (customer evaluation is HR) (2).
For each factor, the membership function was defined; it is shown in Fig. 17.
The aggregation function was defined to map the input to the output, as shown in
Fig. 18. Among defuzzifying methods such as “large of maximum” (LOM), “small of
maximum” (SOM), and “centroid of area” (COA), COA was applied because it had the
least error and the best results.
The FIS toolbox in MATLAB R2015b was used for the calculations.
Statistical analysis and model estimation
As mentioned above, the statistical population of this research includes defaulters, i.e.,
customers who paid their installments late: from 2 to 6months, from 6 to 18 months,
and more than 18 months late. We collected data randomly by meeting with credit ex-
perts from bank branches, examining existing archives, and monitoring the collection
of claims. Thus, we used 9000 records of customers who received credit from banks
from 2008 to 2016. From this collection of data, we used 7920 records to design and
train the ANFIS and 1080 records to test the efficiency and predictive power of the
model. Sample customers consisted of 6658 medium-risk customers (i.e., who had re-
paid their installments between 2 and 6months late) and 1262 high-risk customers
(who had not paid their installments for more than 6months). Considering the number
Table 3 Fuzzy evaluation for debt to Income ratio and Number of Loan Repayments Past Due.This table combines two input variables. It describes that if the number of loan repayments pastdue is low (SD) and the amount of debt to income is low (SD) then the customer is recognized aslow-risk. If the number of loan repayments past due is at around the middle (MD) and the amountof debt to income is high (LD) then the customer is recognized as the high-risk (HR). To limit thedescribing of the value of factors, we have used SD as little, MD as medium and LD as high
Number of loan repayment past due SD MD LD
Debt to income ratio
SD LR LR MR
MD MR MR MR
LD MR HR HR
Moradi and Mokhatab Rafiei Financial Innovation (2019) 5:15 Page 19 of 27
of variables in the customer profile, in order to improve the accuracy of the model, it
was necessary to select the most important variables to include in the model. SPSS soft-
ware (IBM SPSS Statistics) (SPSS Statistics, 2009) was used to calculate correlation co-
efficients. Variables with the largest correlation coefficients with respect to the
dependent variable (i.e. the amount of delay in installment payment) were determined.
Figure 19 displays the design of the model.
In this section of the study, customer information was processed in MATLAB
R2015b before entering the model. Next, 9000 records were entered into the model.
Given that the range of values each variable can take was different, we normalized all
data by converting them into numbers between zero and one. After this stage, the
training and testing data are separately entered into the software, which then began to
fit the model. Figure 20 shows the fuzzy inference system obtained in the process of
training the network in MATLAB R2015b.
The parameters of the model, including the target error rate, number of repetitions,
and number of fuzzy sets of each of the variables, were considered to be 0, 80, and 3,
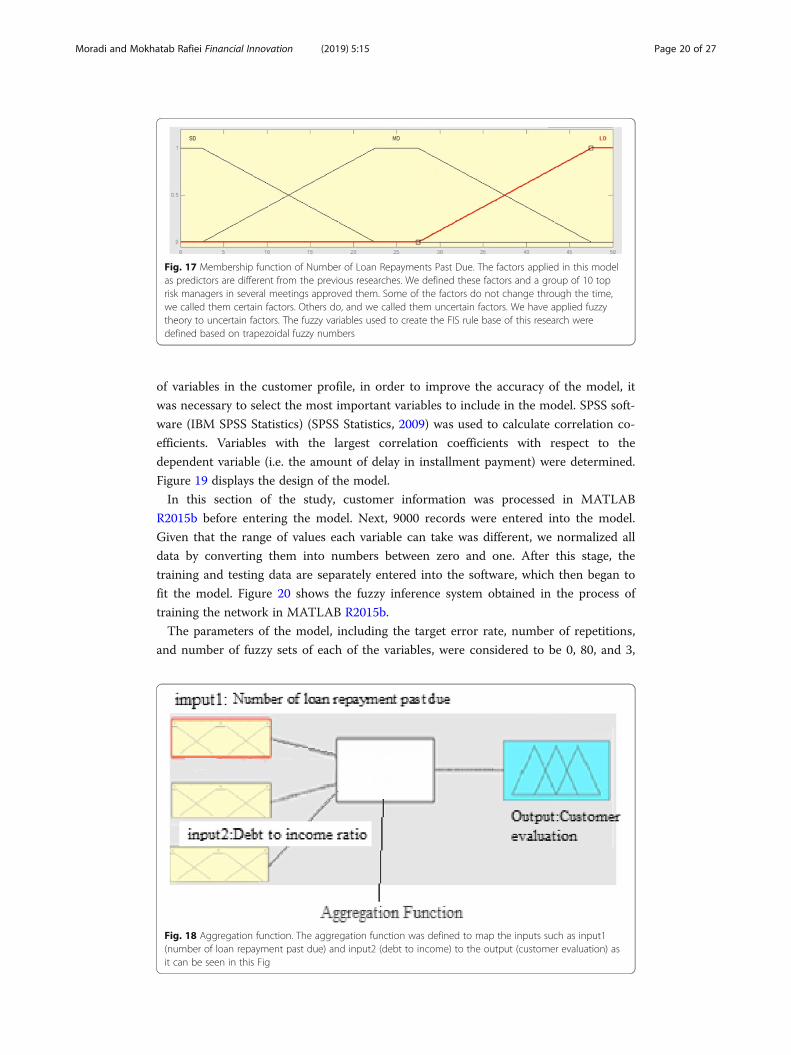
Fig. 17 Membership function of Number of Loan Repayments Past Due. The factors applied in this modelas predictors are different from the previous researches. We defined these factors and a group of 10 toprisk managers in several meetings approved them. Some of the factors do not change through the time,we called them certain factors. Others do, and we called them uncertain factors. We have applied fuzzytheory to uncertain factors. The fuzzy variables used to create the FIS rule base of this research weredefined based on trapezoidal fuzzy numbers
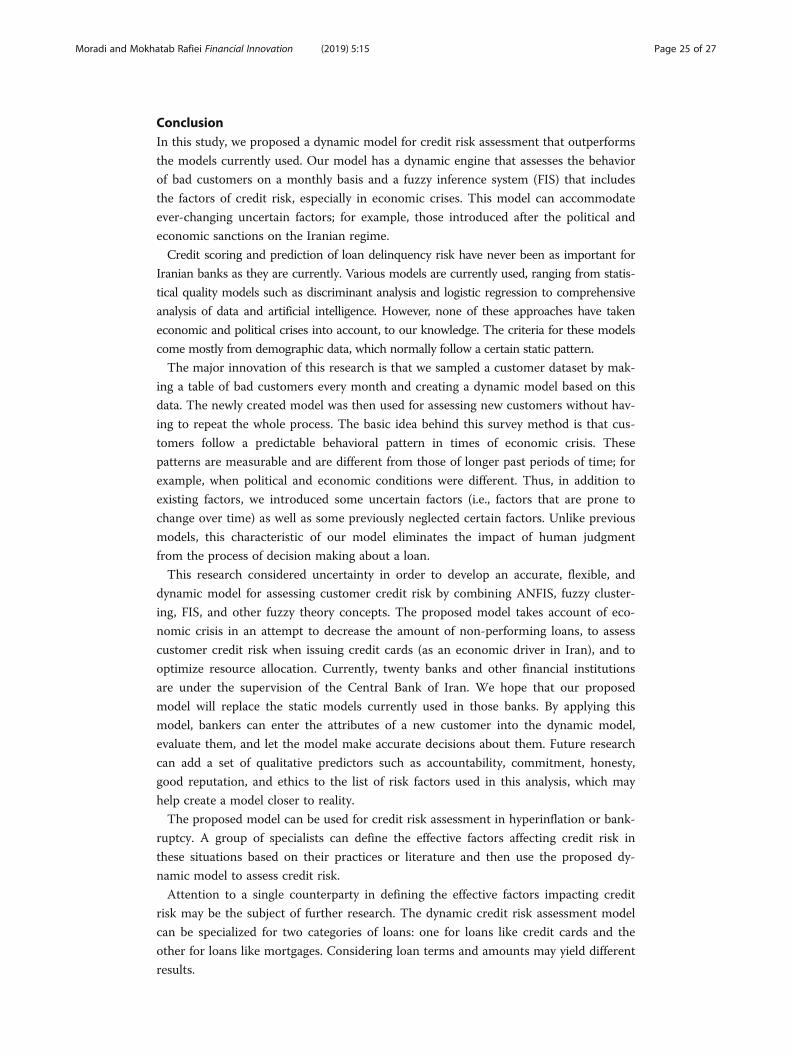
Fig. 18 Aggregation function. The aggregation function was defined to map the inputs such as input1(number of loan repayment past due) and input2 (debt to income) to the output (customer evaluation) asit can be seen in this Fig
Moradi and Mokhatab Rafiei Financial Innovation (2019) 5:15 Page 20 of 27

respectively. It should be noted that the numbers of fuzzy sets for each of variables 3
and 4 were investigated. Based on the error index, fuzzy set 3 was selected. The rate of
root-mean-square error (RMSE) was determined in different repetitions. The RMSE
was reduced to less than 80 repetitions, after which no significant change was observed.
Therefore, 80 repetitions were selected in executing the algorithm.
The performance of the model was evaluated by two indicators:
1) degree of sensitivity: the proportion of bad customers that the model classifies into
the bad customer group.
2) degree of diagnosis: the proportion of well-off customers that the model classifies
into the good customer group. In order to judge customers and group them into low,
medium, and high risk, the probability of default within the interval [0, 1] was
Fig. 19 Design of the model. This Figure shows the ANFIS model. It has five layers. The input layer. The leftnodes are the inputs. Actually, the inputs are more than eight but it is just a sample. The second layer fromthe left is the inputmfs which are the membership functions of the inputs. The third layer is the rules whichANFIS find them after training. The fourth layer is outputmfs which are the membership functions of theoutputs. The fifth and last layer is the output
Fig. 20 The fuzzy Inference system of the network. Customer information was processed in Matlab R2015bbefore entering the model. Next, the 9000 records were entered into the model. Given that the range ofthe values each variable can take is different, we normalized all data by converting them into numbersbetween zero and one. After this stage, the training and testing data are separately entered into thesoftware and begin to fit the model. This Fig shows the Fuzzy Inference system that is obtained in processof training the network in Matlab R2015b
Moradi and Mokhatab Rafiei Financial Innovation (2019) 5:15 Page 21 of 27

determined. If the probability of default was greater than one, the customer was consid-
ered as high-risk; a probability of less than one meant that the customer was low risk.
The optimized threshold limits of the model were assigned using the evaluation cri-
teria. Korsholm (2004) proposed various target functions for optimization. In this study,
the optimal threshold limit is equal to a value that maximizes the degree of sensitivity
and the degree of diagnosis of the model.
Figure 21 shows that the optimal threshold (Y) of the degree of sensitivity and degree
of detection is 0.37.
Table 4 shows the predicted values of the probability for the dependent variable Y
based on being above or below the threshold in contrast with the actual values ob-
served in the model data. It shows that the degree of sensitivity and degree of diagnosis
of ANFIS in the model data were 87.08% and 91.03%, respectively.
To evaluate the performance of the model, we used its predictive power for data out-
side the model. 54,000 records that were not used in training were entered into the
model and their probability was calculated and compared with the values of the table.
The results can be seen in Table 5. The degree of sensitivity and diagnosis of the model
were 0.84.05% and 89.23%, respectively.
Results and discussionWe compared the NPL rate predicted by the static models used by the banks with our
proposed dynamic model; there was a significant difference (p value = 0.006) between
the predictions of the two models (Fig. 22).
Figure 22 shows the comparison between the prediction of our proposed model and
the real NPL. There was little difference between them according to the proposed
Fig. 21 The optimal threshold. The performance of the model is evaluated by two indicators: 1) Degree ofsensitivity: A proportion of bad customers that the model classifies in a bad customer group. 2) The degreeof diagnosis: A proportion of well-off customers that the model classifies in a good customer group. Inorder to judge customers and group them into low risk, medium risk, and high-risk customers, the probabilityof default within the interval [0, 1] was determined. If the probability of defaults were on more than one point,the customer was considered with a high risk and less than that means the customer is low risk. In this paper,the optimal threshold limit equals a value that maximizes the degree of sensitivity and the degree of diagnosisof the model. This Fig shows that the optimal threshold (Y) of the degree of sensitivity and degree of detectionis 0.37. The blue line is the degree of sensitivity and the red line is the degree of diagnosis
Moradi and Mokhatab Rafiei Financial Innovation (2019) 5:15 Page 22 of 27

model. As an example, the average NPL was predicted as 200 billion Rials: more than
the real NPL in 2012.
The ability of the new predictors to cluster customers into segments was analyzed
and approved by the credit risk workgroup. Table 6 shows the dynamism of customers
between segments of the bank’s static model and the proposed model in terms of eco-
nomic sectors. For example, it shows that, because of the sanctions, 17.1% and 5.1% of
customers moved from the good segment to the bad (i.e., high-risk) segment, respect-
ively. In the export sector, 0.2% of customers moved from the good segment to the
high-risk segment. In the agriculture sector, 8.3% of customers moved from the good
segment to the high-risk segment and 4.1% moved from the good segment to the
medium-risk segment. In the commercial sector, 12.5% of customers moved from the
good segment to the high-risk segment and 6.3% of customers moved from the good
segment to the medium-risk segment. In the building sector, 9.7% of customers moved
from the good segment to the high-risk segment and 3.4% moved from the good seg-
ment to the medium-risk segment.
Morality plays an impressive role in defaults. 5% of bad debtors on high-amount
loans do not suffer from any economic or other special challenge. They simply would
not repay their loans before the bank forecloses.
We propose a new dynamic model for assessing the credit risk that outperforms the
static models currently used, especially in the face of economic crises. Our model sam-
ples the customer database and creates a table containing data on bad customers (those
with arrearage of more than 2 months) and reveals the behavioral patterns of these cus-
tomers. Additionally, the model takes into account some previously neglected factors;
by combining them with expert knowledge, it yields results that are closer to reality.
Table 4 Predictive power of the model. This table shows the predicted values of the probabilityfor the dependent variable Y based on being above or below the threshold, in contrast with theactual values observed in the model data. It shows that the degree of sensitivity and degree ofdiagnosis of ANFIS in the model data were 87.08% and 91.03%, respectively
Real estimate observation Medium risk customers High risk customers Total
P(Y) < =0.37 6061 163 6224
P(Y) > 0.37 597 1099 1696
Total 6658 1262 7920
Correct 6061 1099 7160
Correct percent 91.03% 87.08% 90.04%
Incorrect percent 8.96% 12.91% 9.5%
Table 5 Performance of the model. To evaluate the performance of the model, we use itspredictive power for data outside the model. 54,000 records that were not used in training wereentered into the model and their probability was calculated and compared with the values of thetable. The degree of sensitivity and diagnosis of the model were 0.84.05% and 89.23%, respectively
Real estimate observation Medium risk customers High risk customers Total
P(Y) < =0.37 638 58 696
P(Y) > 0.37 77 307 384
Total 715 365 1080
Correct 638 307 945
Correct percent 89.23% 84.05% 87.5%
Incorrect percent 10.76% 84.1% 12.5%
Moradi and Mokhatab Rafiei Financial Innovation (2019) 5:15 Page 23 of 27

During the last decade or so, the governing regime in Iran has been under many polit-
ical and economic international sanctions, which has introduced new credit risk factors.
Consequently, traditional models have failed to accurately predict the behaviors of cus-
tomers. This may lead to major losses on the part of banks.
Interestingly, we found that many of the defaults were among backed loans and were
securitized by large collaterals. Therefore, the accuracy of the segmentations is crucial
for the banks to recognize and deal with vulnerable customers. Traditional static
models have proved to work reasonably well in predicting credit risks during periods of
stasis, but they fail to do so in the face of economic and political fluctuations. As new
factors are introduced during such a period, the model criteria need to be updated, as
well. Opting for appropriate factors that work well in all circumstances is difficult (if
not impossible), and a model frame that can accommodate the new factors is desirable.
The credit risk workgroups can update the criteria for the model in intervals of, say, 3
months, and thus help the model to maintain its dynamism and predictions with
optimum accuracy. Subsequently, banks may reserve some money for credit loss, which
may help them to survive crises.
Fig. 22 The comparison between the static model, dynamic model and real. We compared the NPL ratepredicted by the static models used by the banks with our proposed dynamic model and there is asignificant difference (p value = 0.006) between the predictions of the two models. This Fig shows thecomparison between the prediction of our proposed model and the real NPL. There is a little differencebetween them according to the proposed model. As an example, the average of NPL has been predicted200billion Rials more than real NPL in 2012. The light blue line is the NPL according to the dynamic model.The dark blue line is the NPL according to the real and the gray line is the NPL base on the static model
Table 6 Dynamism between segments. This table shows the dynamism of customers betweensegments of the bank’s static model and the proposed model in terms of economic sectors. Forexample, it shows that because of the sanctions 17.1% and 5.1% of the customers have movedfrom the good segment to the bad (i.e. high-risk) segment, respectively
Moradi and Mokhatab Rafiei Financial Innovation (2019) 5:15 Page 24 of 27
ConclusionIn this study, we proposed a dynamic model for credit risk assessment that outperforms
the models currently used. Our model has a dynamic engine that assesses the behavior
of bad customers on a monthly basis and a fuzzy inference system (FIS) that includes
the factors of credit risk, especially in economic crises. This model can accommodate
ever-changing uncertain factors; for example, those introduced after the political and
economic sanctions on the Iranian regime.
Credit scoring and prediction of loan delinquency risk have never been as important for
Iranian banks as they are currently. Various models are currently used, ranging from statis-
tical quality models such as discriminant analysis and logistic regression to comprehensive
analysis of data and artificial intelligence. However, none of these approaches have taken
economic and political crises into account, to our knowledge. The criteria for these models
come mostly from demographic data, which normally follow a certain static pattern.
The major innovation of this research is that we sampled a customer dataset by mak-
ing a table of bad customers every month and creating a dynamic model based on this
data. The newly created model was then used for assessing new customers without hav-
ing to repeat the whole process. The basic idea behind this survey method is that cus-
tomers follow a predictable behavioral pattern in times of economic crisis. These
patterns are measurable and are different from those of longer past periods of time; for
example, when political and economic conditions were different. Thus, in addition to
existing factors, we introduced some uncertain factors (i.e., factors that are prone to
change over time) as well as some previously neglected certain factors. Unlike previous
models, this characteristic of our model eliminates the impact of human judgment
from the process of decision making about a loan.
This research considered uncertainty in order to develop an accurate, flexible, and
dynamic model for assessing customer credit risk by combining ANFIS, fuzzy cluster-
ing, FIS, and other fuzzy theory concepts. The proposed model takes account of eco-
nomic crisis in an attempt to decrease the amount of non-performing loans, to assess
customer credit risk when issuing credit cards (as an economic driver in Iran), and to
optimize resource allocation. Currently, twenty banks and other financial institutions
are under the supervision of the Central Bank of Iran. We hope that our proposed
model will replace the static models currently used in those banks. By applying this
model, bankers can enter the attributes of a new customer into the dynamic model,
evaluate them, and let the model make accurate decisions about them. Future research
can add a set of qualitative predictors such as accountability, commitment, honesty,
good reputation, and ethics to the list of risk factors used in this analysis, which may
help create a model closer to reality.
The proposed model can be used for credit risk assessment in hyperinflation or bank-
ruptcy. A group of specialists can define the effective factors affecting credit risk in
these situations based on their practices or literature and then use the proposed dy-
namic model to assess credit risk.
Attention to a single counterparty in defining the effective factors impacting credit
risk may be the subject of further research. The dynamic credit risk assessment model
can be specialized for two categories of loans: one for loans like credit cards and the
other for loans like mortgages. Considering loan terms and amounts may yield different
results.
Moradi and Mokhatab Rafiei Financial Innovation (2019) 5:15 Page 25 of 27

AbbreviationsANFIS: Adaptive Network-based Fuzzy Inference System; ANN: Artificial Neural Network; BN: Bayesian networks;FCM: Fuzzy C-Means; FIS: Fuzzy Inference System; FS: Feature Selection; GA: Genetic Algorithm; GAM: GeneralizedAdditive Model; HR: High Risk; K-NN: K-Nearest Neighbors; LGD: loss given default; LR: Low Risk; MDA: MultipleDiscriminant Analysis; MLP: Multilayer Perceptron Network; MR: Medium Risk; MSE: Mean Squared Error; NN: NeuralNetworks; NPL: Non-Performing Loan; PCA: Principal Component Analysis; RBF: Radial Base Function; RMSE: Root-Mean-Square Error; SVM: Support Vector Machine
AcknowledgementsNot applicable.
FundingThis research did not receive any specific grant from funding agencies in the public, commercial, or not-for-profitsectors.
Availability of data and materialsWe have used a customer dataset of a bank which emphasized data and bank name must be kept confidential.
Authors’ contributionsBoth authors read and approved the final manuscript
Competing interestsThe authors declare that they have no competing interests.
Publisher’s NoteSpringer Nature remains neutral with regard to jurisdictional claims in published maps and institutional affiliations.
Author details1Science and Research Branch, Islamic Azad University, Tehran, Iran. 2Tarbiat Modares University, Tehran, Iran.
Received: 21 November 2017 Accepted: 18 January 2019
ReferencesAbdipour S, Nasseri A, Akbarpour M, Parsian H, and Zamani S (2013) Integrating neural network and colonial competitive
algorithm: a new approach for predicting bankruptcy in tehran security exchange. Asian Econ Fin Rev 3(11):1528–1539.Abdou H, Pointon J (2009) Credit scoring and decision making in Egyptian public sector banks. Int J Manag Finance 5(4):391–406 .Akkoc S (2012) An empirical comparison of conventional techniques, neural networks and the three stage hybrid adaptive
neuro fuzzy inference system (ANFIS) model for credit scoring analysis: the case of Turkish credit card data. Eur J OperatRes 222(1):168–178.
Amid A. (n.d.) Fuzzy logic, in press.Baixauli J, Alvarez S, Módica A (2012) Combining structural models and accounting based models for measuring credit risk in
real estate companies. I J Manag Finance 8(1):73–95.Bekhet HA, and Eletter SFK, (2014) Credit risk assessment model for Jordanian commercial banks: Neural scoring approach.
Review of Development Finance. 4(1):20–28.Baradaran V, and Keshavarz M (2015) An integrated approach of system dynamics simulation and fuzzy inference system for
retailers’ credit scoring. Economic research - Ekonomska istraživanja. 28(1):959–980. https://doi.org/10.1016/j.ejor.2012.04.009.Bensic M, Sarlija N, Zekic-Susac M (2005) Modeling small-business credit scoring by using logistic regression, neural networks
and decision trees. Intelligent Syst Account Fin Manage 13(3):133–150.Berthold MR, Hand DJ (2003) Intelligent data analysis: an introduction. 2nd. Springer-Verlag Berlin Heidelberg, New York.Blanco A, Pino-Mejías R, Lara J, Rayo S (2013) Credit scoring models for the microfinance industry using neural networks:
Evidence from Peru. Expert Systems with Applications. 40(1);356–364.Chen W, Xiang G, Liu Y, Wang K (2012) Credit risk evaluation by hybrid data mining technique. Syst Eng Procedia 3:194–200.Chi Q, Li W (2017) Economic policy uncertainty, credit risks and banks’lending decisions: Evidence from Chinese commercial
banks. China J Account Res 10(1):33–50.Cisko Š, Klieštik T. Finančný manažment podniku II. Žilina (2013) EDIS Publishers, University of Žilina.Danenas P, and Garsva G (2015) Selection of Support Vector Machines based classifiers for credit risk domain. Expert Syst.
Appl. 42(6):3194-3204.Dikjkman JG, Vanhaeringen haerongen H, Delanges SJ (1983) Fuzzy Numbers. J Math Anal Appl 92(2):301–341.Emel A, Oral M, Reisman A, Yolalan R (2003) A credit scoring approach for the commercial banking sector. Socio Econ Plan
Sci 37(2):103–123.Ghodselahi A (2011) A Hybrid Support Vector Machine Ensemble Model for Credit Scoring. International Journal of Computer
Applications 17:0975–8887.Girjia N, Sirvatsa SK (2006) A research study: using data mining in knowledge base business strategies. Inf Technol J 7(2):590–600.Heiat A (2012) Comparing performance of data mining models for computer credit scoring. J Int Fin Econ 12(1):78–83.Hsieh NC, Hung LP (2010) A data driven ensemble classifier for credit scoring analysis. Expert Syst Appl 37(1):534–545.Jang J-SR (1993) ANFIS: adaptive-network-based fuzzy inference systems. IEEE Trans Syst Man Cybernetics 23(3):665–685.Kaufman L, Rousseeuw PJ (2009) Finding groups in data: an introduction to cluster analysis. Wiley, New York.Khandani A, Kim A, Lo A (2010) Consumer credit-risk model via machine learning algorithms. J Bank Finance 34(11):2767–2787.
Moradi and Mokhatab Rafiei Financial Innovation (2019) 5:15 Page 26 of 27
Korsholm, L (2004), Analysis of diagnostic studies, sensitivity and specificity positive predicted values ROC curves tests basedon logistic regression. Department of statistics and demography, University of Southern Denmark.
Kruppa J, Schwarz AG, Ziegler A (2013) Customer credit risk: individual probability estimates using machine learning. ExpertSyst Appl 40(13):5125–5131.
MATLAB And statistics toolbox release R2015b, the math works, Inc., Natick, Massachusetts, United States (n.d.).Nanni L, Lumini A (2009) An experimental comparison of ensemble of classifiers for bankruptcy prediction and credit scoring.
Expert Syst Appl 36(2):3028–3033.Mandala I.G.N.N., Nawangpalupi C. A., and Praktikto F. R (2012) Assessing Credit Risk: An Application of Data Mining in a Rural
Bank. Procedia Economics and Finance. 4:406–412.Nauk D, Klawonn F, Kruse R (1997) Foundations of neuro-fuzzy systems. Willey, New York.Koutanaei F.N., Sajedi H, and Khanbabaei M (2015) A hybrid data mining model of feature selection algorithms and ensemble
learning classifiers for credit scoring. J Retail Consum Serv 27:11–23.Oreski S, and Oreski G, (2014) Genetic algorithm-based heuristic for feature selection in credit risk assessment. Expert Syst
Appl 41(4):2052–2064Paleologo G, Elisseeff A, and Antonini G (2010) Subagging for credit scoring models. Eur J Oper Res 201(2);490–499Ping Y, Yongheng L (2011) Neighborhood rough set and SVM based hybrid credit scoring classifier. Expert Syst Appl 38(9):
11300–11304.Polat K, Günes S (2006) an expert system approach based on principal component analysis and adaptive neuro-fuzzy
inference system to diagnosis of diabetes disease. Digital Signal Process 17(4):702–710.Procter P (1978). Longman dictionary of contemporary English. Harlow [England], Longman.Rao HS, Mukherjee A (1996) Artificial neural networks for predicting the macro mechanical behavior of ceramic-matrix
composites. Comput Mater Sci 5(4):307–322.Rosenblatt F (1958) The perceptron: a probabilistic model for information storage and organization in the brain. Psychol Rev
65(6):38–65.Saitta S, Kripakaran P, Raphael B, Smith IF (2008) Improving system identification using clustering. J Comput Civ Eng
22(5):292–302.Shahari F, Zakaria R, Rahman S (2015) Investigation of the expected loss of sharia credit instruments in global Islamic banks.
Int J Manag Finance 11(4):503–512.Sousa M R, Gama J and Brandão E. A new dynamic modeling framework for credit risk assessment. Expert Syst Appl 45:341–351.Sugeno, M (1985). Industrial applications of fuzzy control. Elsevier Science Ltd; First Edition.Sumathi S, Sivanandam SN (2006) Introduction to data mining and its applications. Springer-Verlag, Berlin.SPSS Statistics is a software package used for logical batched and non-batched statistical analysis. Long produced by SPSS
Inc., it was acquired by IBM in 2009. The current versions are officially named IBM SPSS Statistics.Tsai CFT (2008) Using neural network ensembles for bankruptcy prediction and credit scoring. Expert Syst Appl 34(4):2639–2649.Twala B (2010) Multiple classifier application to credit risk assessment. Expert Syst Appl 37(4):3326–3336.Wang G, Hao J, Ma J, Jiang H (2011) A comparative assessment of ensemble learning for credit scoring. Expert Syst
Appl 38(1):223–230.Wang G, Ma J, Yang S (2014) An improved boosting based on feature sekection for corporate bankruptcy prediction. Expert
Syst Appl 41(5):2353–2361.Wang Y, Chen Y (2014) A comparison of madman and Sugeno fuzzy inference systems for traffic flow prediction. J Comput
9(1):12–21.West D (2000) Neural network credit scoring models. Comp Operat Res 2000:1131–1152.Witkowska D (2006) Discrete Choice Model Application to the Credit Risk Evaluation. Int. Adv. Econ. Res. 12(1)33–42.Yeh IC and Lien CH. The comparisons of data mining techniques for the predictive accuracy of probability of default of
credit card clients. Expert Syst Appl 36(2):2473–2480.Yurdakul F (2014) Macroeconomic modelling of credit risk for banks. Procedia Soc Behavioral 109:784–793.Zamani S (2011) Evaluating of predicting power of ANN in order to predict customer’s credit risk. Thesis.Zanin M et al (2016) Combining complex networks and data mining: why and how. Phys Rep 635:1–44.Zhiwang Zhang, Guangxia Gao,and Yong Shi (2014) Credit risk evaluation using multi-criteria optimization classifier with
kernel, fuzzification and penalty factors. Eur. J. Oper. Res. 237(1):335-348.
Moradi and Mokhatab Rafiei Financial Innovation (2019) 5:15 Page 27 of 27