Embed Size (px)
Citation preview
NORRIS I. BRUCE, B.P.S. MURTHI, and RAM C. RAO*
The authors study the joint effects of creative format, message content,and targeting on the performance of digital ads over time. Specifically, theypresent a dynamic model to measure the effects of various sizes of static(GIF) and animated (Flash) display ad formats and consider whetherdifferent ad contents, related to the brand or a price offer, are more or lesseffective for different ad formats and targeted or retargeted customersegments. To this end, the authors obtain six months of data on dailyimpressions, clicks, targeting, and ad creative content from a major U.S.retailer, and they develop a dynamic zero-inflated count model. Given thesparse, nonlinear, and non-Gaussian nature of the data, the study designsa particle filter/Markov chain Monte Carlo scheme for estimation. Resultsshow that carry-over rates for dynamic formats are greater than those forstatic formats; however, static formats can still be effective for price ads andretargeting.Most notably, results also show that retargeted ads are effectiveonly if they offer price incentives. The study then considers the import ofthese results for the retailer’s media schedules.
Keywords: online advertising, ad formats (static vs. animated), ad content,dynamic zero-inflated Poisson, particle filtering/smoothing
Online Supplement : http://dx.doi.org/10.1509/jmr.14.0117
A Dynamic Model for Digital Advertising:The Effects of Creative Format, MessageContent, and Targeting on Engagement
Advertisers often use multiple creative formats in their digitalcampaigns to target and retarget consumers with product-basedmessages and price incentives. These include static formats(e.g., GIF, JPG) that offer neither animation nor interactivity;simple Flash formats (e.g., SWF) that offer animation but nointeractivity; and rich-media formats (e.g., HTML, Java) thatoffer both interactivity and animation, with elements such assound, video,floating images, and screen take-overs.As a result,advertisers have the nontrivial task of jointly assessing the ef-fects over time of design elements available in the large numberof such formats as they decide on budgets, message objectives,and consumer targeting. There is, however, some evidence
from industry studies that ad format size, location, and creativeelements such as color, interactivity, and animation may allindependently influence engagement (e.g., Cole, Spalding,and Fayer 2009; DoubleClick 2009). Yet this evidence raisesdifficult questions. For example, a retailer may still wonderwhether product-based content or price incentives would bemore suitable message content for animated and static ads; orwhich ad formats and message are more effective for retarget-ing, the canonical tactic of tracking visitors to a firm’s site andthen serving the firm’s ads to them when they visit other sites(Lambrecht and Tucker 2013).
The retailer may also be interested in the temporal effects ofonline ads, but extant work has been largely cross-sectionaland so cannot help to formulate dynamic advertising strategies(Breuer, Brettel, and Engelen 2011). Internet ad–exposuremodels in marketing (e.g., Danaher 2007; Danaher, Lee, andKerbache 2010) have, however, explored the performance ofad formats over time. Thus, it is necessary to consider not onlywhen formats work but also how long their effects persist, so
*Norris I. Bruce (e-mail: [email protected]) is Associate Professorof Marketing, B.P.S. Murthi (e-mail: [email protected]) is Professor ofMarketing, and Ram C. Rao (e-mail: [email protected]) is Founders Pro-fessor of Marketing, Naveen Jindal School of Management, University ofTexas at Dallas. Coeditor: Robert Meyer; Associate Editor: Carl Mela.
© 2017, American Marketing Association Journal of Marketing ResearchISSN: 0022-2437 (print) Vol. LIV (April 2017), 202–218
1547-7193 (electronic) DOI: 10.1509/jmr.14.0117202
that firms can better match formats to admessages and targetedconsumers (e.g., Tellis, Chandy, and Thaivanich 2000). Forinstance, a large body of work on offline ads has suggestedthat ads have both instantaneous and long-term, or carry-over, effects (e.g., Sethuraman, Tellis, and Briesch 2011). Yetstudies of digital ads have largely ignored carry-over, attribut-ing consumer engagement to recent impressions. Braun andMoe (2013) model carry-over effects but treat them as ho-mogeneous. Given the evidence that carry-over may differ, forexample, across e-mail and online channels (Breuer, Brettel,and Engelen 2011), a useful direction to explore would beto model heterogeneous carry-over effects. Furthermore, weknow that the effects of ad messages may vary across mediaand markets (Deighton, Henderson, and Neslin 1994; D’Souzaand Rao 1995; MacInnis, Rao, and Weiss 2002), so we mightwant to consider how such effects differ across online retar-geted consumers. Knowing these features of digital ads, theeffects of carry-over, format, target, and message could helpmanagers improve ad engagement. This, in turn, could ulti-mately help firms better allocate ad resources throughout theirdigital advertising campaigns (Rust and Leone 1984).
This study attempts to fill some of the central gaps in extantwork by developing a dynamic response model to study thejoint effects of creative format, message content, and targeting/retargeting on the performance of digital ads over time.Specifically, the model examines the dynamic effects of adtheme (price or product) and creative format (animated andstatic ads of varied sizes) on the clicking behaviors of targetedversus retargeted consumers. We address the following sub-stantive questions: How do carry-over effects vary acrossanimated and static ads and across targeted consumers? Whatis the effect of format (size/position) on consumer clickingbehavior? What are the effects of price theme versus producttheme within different digital formats? (Prior research hasposited that ad format effectiveness can vary with ad copyelements; Grass andWallace 1969; Naik,Mantrala, and Sawyer1998). Most important, which ad format and copy theme (pricevs. product) are most effective for retargeting?
We also innovate methodologically to be able to extendeconometric studies of advertising’s dynamic and contenteffects (e.g., Bass et al. 2007; Chandy et al. 2001; Clarke 1976;MacInnis, Rao, and Weiss 2002) to the domain of digitaladvertising. Digital ad response data, consisting of clicks inthis study, are time series of counts, which contain a highfrequency of zeros due to nonresponse that result in “zeroinflation.” This presents a challenge: failure to account for zeroinflation and/or dynamics may result in misleading inferenceand the detection of spurious associations. To address thesetwo concerns and the substantive questions posed earlier,we propose a dynamic, state space, zero-inflated count model(e.g., Poisson, negative-binomial). The resulting responsemodel is both dynamic and nonlinear, and therefore, we es-timate it using a combination of particle filtering and Markovchain Monte Carlo (MCMC) procedures (Doucet, De Freitas,and Gordon 2001; Liu and Chen 1998; Ristic, Arulampalam,and Gordon 2004). Particle filtering, in its many variations, iswidely applied in statistics; it is a flexible Bayesian inferentialmethod used to estimate nonlinear/non-normal dynamic sys-tems. In these systems, the posterior distributions of the statespace parameters are analytically intractable, and thus, the filteroperates by drawing weighted samples from a time-varyingproposal distribution (i.e., an importance function). The
analytic expression for the optimal form of this importancedistribution—optimal in terms of computational efficiency—isavailable only in special cases (e.g., Doucet, De Freitas, andGordon 2001). It is possible, however, to obtain a linear/normalapproximation of this function at its mode, where the modearises from an iterative Newton–Raphson step embeddedwithinthe particle filter. The resulting algorithm provides an approachto estimate any state space model within the exponential family(Doucet, Godsill, andAndrieu 2000), and it is more general thanGaussian filters such as the extended and the unscented Kalmanfilters (Ristic, Arulampalam, and Gordon, p. 32).
The article, therefore, contributes to an emerging literatureon digital ad response models in the following ways. First,we find that animated ads have significantly higher carry-overeffects and impact consumer engagement over a longer du-ration than static ads, in all ad formats and among both targetedand retargeted consumers. Second, within the animated for-mats, price-themed ads aremore effective than product-themedads. Third, retargeted ads are effective only when they offerprice incentives, a finding consistent with Lambrecht andTucker (2013), who find retargeted ads effective only whenconsumers have strong preferences such that they have in-centives to buy. Fourth,wefind that all ads (i.e., by formats andmessages) targeted to the female segment are effective; thissuggests that, in our example, female shoppers are morewilling to engage, perhaps confirming the axiom from brick-and-mortar studies that “women shop; men buy.”1 Fifth, toanswer our questions, we had to introduce new Bayesianmethods that respect features of digital ad data and the un-derlying nonlinear dynamics process that generates them. Webelieve this approach, which is our main contribution, com-plements othermethods, including bandit problems (sequentialexperiments) and the Bayesian algorithms (e.g., Thompsonsampling) used to study them (Scott 2010); for modelingnonlinear dynamics, data sparsity (e.g., nonresponse), andthe effects of multiple exposures (i.e., ad repetition) presentchallenges to such algorithms (e.g., Agarwal 2010; Schwartz,Bradlow, and Fader 2016). Admittedly, hierarchical mod-eling (i.e., Bayesian) can help obviate the sparsity problemwhen Thompson sampling is used, but dynamics andmultipleexposures are not straightforward extensions. Finally, weconduct simulations to show the import of our findings; theseshould be of interest to online retailers and digital mediaplanners.
To address the questions in the study, we obtained paneldata from a major U.S. retailer in an industry that providesproducts and services for the home. The data set offers aselection of daily ad impressions and their associated clicks,with both clicks and impressions disaggregated by consumertargets, ad format, and message content; ad networks com-monly release such data to their clients. Specifically, the dataset contains a panel of click counts for 154 days, across sixcreative formats and four targeted segments: Flash and GIFformats2 in each of three size–orientation combinations (160 ×600, 300 × 250, and 728 × 90), and segments classified as
1“‘Men Buy, Women Shop’: The Sexes Have Different Priorities WhenWalking Down the Aisles,” Knowledge@Wharton podcast (Nov 28, 2007),http://knowledge.wharton.upenn.edu/article/men-buy-women-shop-the-sexes-have-different-priorities-when-walking-down-the-aisles/.
2Simple Flash ads contain animation frames and multiple click-throughbuttons but lack interactive elements; GIF ads have only a single click-through button and no animation frames or interactive elements.
A Dynamic Model for Digital Advertising 203
retargeted, male, female, and age. A unique feature of the datais that daily impressions (within format and target) cluster intoprice, product, and control impressions, where price impres-sions are price promotion ads, product impressions are ads thatstress brand benefits other than price; and control impressionsare blank impressions used to exclude non-U.S. consumersfrom viewing specific ads.We (and the retailer) note that theseblank ads often artificially inflate engagement measure-ments because viewers click on them, largely from curiosity(e.g., white objects become visually salient), but also in error(McConnell 2012). Finally, we model impressions as poten-tially endogenous (Lee, Hosanagar, and Nair 2015) becausethey may depend on omitted factors such as website content,format type, or clicking history.
The remainder of the article is organized as follows. Thenext section provides a brief review of the relevant streams inthe advertising content and dynamic effects literatures. Sub-sequent sections develop the empirical model and describe itsestimation and the data we employ, in that order. The last twosections describe our estimation results and conduct simula-tions to summarize their impact on a hypothetical mediaschedule. The article concludes with an overview of thefindings and the limitations of the study.
LITERATURE
We provide a brief review of the academic literature rele-vant to the effects of ad formats (size and animation), content,targeting, and carry-over rates, all on response metrics such asclick-through rate (CTR), attention, and recall. Admittedly, weknow much about the effectiveness of traditional ads, but ourunderstanding of the effectiveness of digital ads is rapidlyevolving. This review reflects that notion.
The Impact of Ad Size
Although one would expect larger banner ads to be moreeffective than smaller ads (ceteris paribus), the evidence seemsinconclusive. Larger ads seemingly could improve memoryfor products and are more likely to be seen and rememberedrelative to smaller ads (Chandon, Chtourou, and Fortin 2003;Cho 1999). They have also been associated with greater at-tention and response (Baltas 2003), greater intention to spreadpositive word of mouth (Chtourou and Chandon 2000), higherrecall (Chatterjee 2008), and higher CTR (Rettie, Grandcolas,andMcNeil 2004; Robinson, Wusocka, and Hand 2007).3 YetCho (2003) and Dreze and Hussherr (2003) find no significanteffect of ad size on engagement. They suggest that users learnto avoid looking at ads, even though the ads may affect themthrough their peripheral vision. These differing results perhapssuggest a tension between the ability of large ads to attractattention and their more intrusive nature that leads to avoid-ance. Thus, the problem needs more study, with a focus onboth the research methods and the ad context (e.g., type ofproducts/websites).
The Impact of Animation
Experiments, in contrast, have confirmed that animationin banner ads can attract users’ attention and increase
engagement. For example, Li and Bukovac (1999) find thatusers are able to quickly identify and better recall animatedbanner ads than static banner ads. Cho, Lee, and Tharp(2001) show that a higher degree of forced exposure to an-imated banner ads yields higher CTRs and more favorableattitudes among users. Animation has also been associatedwith greater clicking behavior in econometric studies (Hong,Thong, and Tam2007; Lohtia, Donthu, andHershberger 2003;Tsang and Tse 2005). These studies propose that when con-sumers have not decided on the items they want, they are morelikely to click on animated ads because these ads may leadthem to attribute a higher quality to the advertised products orpay greater attention. Similarly, other works have suggestedthat animation is more likely to be effective when user ex-perience and brand familiarity are low (Dahlen 2001) or whenusers are searching for fun rather than for specific information(Tuten, Bosnjak, and Bandilla 2000).
Impact of Ad Content
There have been several major studies on the effects of adcreative or content in offline advertising, but there have beenno major studies considering these effects in digital ads. Forexample, MacInnis, Rao, and Weiss (2002) find in a study ofTV commercials that emotional content is more likely to in-crease sales and that ads that use rational appeal are less likelyto produce increases. Chandy et al. (2001) study the effects ofadvertising on sales across multiple creatives. While they findmany creative executions to be ineffective in increasing sales,they confirm that emotional ads are more effective in maturemarkets and argument-based appeals more effective in newermarkets. Similarly, Bass et al. (2007)find that rational adswearout faster than emotional ads: for example, in their data, priceadvertising has the highest wear-out among all appeals. Still, inthe digital space evidence about the role of ad content is stillemerging. Chtourou, Chandon, and Zollinger (2002) suggestthat banner ads with promotional incentives have higher CTRsthan those that lack incentive offers. Xie et al. (2004) also findevidence that incentive offers improve CTRs but that the ef-fect varies by the type of appeal (rational vs. emotional). Thus,for example, in their study, banners with positive emotionalappeals and incentive offers generated higher click-throughthan those with positive appeals and no incentives. Similarly,Hupfer and Grey (2005) show that banner ads that offer a freesample achieved higher click-through than banner ads withinformation only. Braun and Moe (2013) also find that theeffects of creative content in banner ads can differ, even thoughtheir data do not ascribe substantive meaning to these contents.Nevertheless, taken together, these studies indicate the im-portance of ad content for digital media.
Impacts of Ad Targeting
The marketing literature has shown that more precise tar-geting can increase CTRs for banner ads (Briggs and Hollis1997; Chandon, Chtourou, and Fortin 2003; Chatterjee, Hoffman,and Novak 2003; Sherman and Deighton 2001). For example,with regard to retail shopping, there is some evidence thatwomen are more invested in the experience and thus morelikely to spendmore time browsing online; in contrast, men aremore goal oriented (Passyn, Diriker, and Settle 2011), and formany product categories, women are the primary purchasers.Moreover, given current and exact technology, once con-sumers browse a firm’s website, an ad network can use their
3Not surprisingly, given its interest in ensuring continued growth of digitaladvertising, DoubleClick (2009) also reports that CTRs for large ads (300 ×600 and 240 × 400) were three times greater in their study than those forsmaller ad formats.
204 JOURNAL OF MARKETING RESEARCH, APRIL 2017
browsing histories to serve thatfirm’s banner ads to themwhenthey the visit other sites. Research suggests that such retargetedads are, on average, surprisingly ineffective unless the con-sumers’ preferences for products viewed earlier are well de-fined, that is, unless “they have a detailed view of what productthey wish to purchase” (Lambrecht and Tucker 2013, p. 2).This suggests that retargeted ads that offer the consumer in-centives to buy should, on average, be more effective than adsthat merely provide nonprice information.
Carry-Over Rates for Different Media and Targets
Braun and Moe (2013) evaluate the carry-over effects ofbanner ads in a model designed to study effectiveness ofcreative content, where carry-over is the extent to which pastimpressions affect the contemporaneous effects of banner adson response behavior (Bass et al. 2007). The study uses dataacross individuals to obtain a homogeneous estimate of carry-over.
It is, however, well documented that the effects of adver-tising (and, thus, carry-over) can differ across channel, tar-get markets and media. For example, Sethuraman, Tellis, andBriesch (2011) report, from a meta-analysis of 56 studies, thattelevision advertising has higher short-term elasticity butlower long-term elasticity than print advertising. Berkowitz,Allaway, and D’Souza (2001) model weekly data from threestores of a large national retailer and find that the carry-overeffect of radio is higher than that of billboards. Similarly, Naik andRaman (2003), in a study that considers media synergy, find thatcarry-over for television is approximately 2.5 times that of print.With regard to markets, the literature (Deighton, Henderson,and Neslin 1994; D’Souza and Rao 1995) have reported thatadvertising is more effective among consumers who are moreloyal for experience than for search goods (Hoch and Ha1986). Finally, Breuer, Brettel, and Engelen (2011) find in astudy of online channels that e-mail advertising has a longereffect than banner advertising. This raises questions of howcarry-over effects may vary across different online formats,animated and static ad types, and different targets. Our studyprovides some answers to these questions.
DYNAMIC MODEL OF DIGITAL ADVERTISING
We now present a nonlinear, state-space model to track theeffectiveness of online display ads over time, across digitalformats and targets. Themodel adopts an observation equationin which daily clicks follow an event-count distribution (e.g.,Poisson), extended however to allow for different forms ofnonresponse (e.g., zero clicks), because it can be shown thatthe presence of zeros in count data may lead to overdispersion,where the variance of the count distribution exceeds its mean(Greene 1994). This and other forms of dispersion violate basicassumptions in the standard event-count models. The stateequation, in contrast, assumes a model of advertising goodwill(Nerlove and Arrow 1962) in which goodwill evolves over timeas a function of banner size, animation, ad targeting, and dif-ferent thematic impressions (price and product). The naturalthematic variation in the data allows for the identification of theeffects of price and product ads. Moreover, we control for thepotential endogeneity of targeted impressions because suchimpressions may covary with unobservable site content, formattype, or clicking history.
First, in a dynamic model of display advertising, one has toaccount for presence of excess zeros (zero-inflation) because of
the typical low level of response to digital ads. Here, one mayobserve zero clicks because online consumers are unawareof advertising impressions, or they are aware but choose notto respond for numerous reasons, many unobservable to theresearcher. In the former case, we observe what is often termed“structural zeros,” which are inevitable; in the latter case, weobserve “sampling zeros,” which occur at random; the twoevents emerge from potentially distinct data generating pro-cesses (e.g., Greene 1994; Lambert 1992).
Let fðyijkt��lijktÞ be the distribution for the random number
of clicks yijkt during period t, for format i (flash or GIF), sizej (728 × 90, 300 × 250, or 160 × 600) and target k with meanEðYijktÞ = lijkt. In Equation 1, we adopt the familiar Poissoncount distribution (Poisson-P); in a later section, we consider alinear model and other count models, including the negativebinomial and the zero hurdle models:
fP�yijkt
��lijkt� = exp�−lijkt
�lYijkt
ijt
yijkt!:(1)
As just described, we may observe zero clicks under distinctdata-generating processes: we may observe structural zeroswhen, say, impressions go unnoticed, or randomly as a countevent from Equation 1. Suppose pijkt is the probability of ob-serving structural zero clicks for format I, size J, and targetk; and, conversely, supposed 1− pijkt is the probability thatclick-through occurs at some rate lijkt, with IðYijkt = 0Þ anindicator function; then the distribution of clicks is thefollowing:
p�Yijkt = yijkt
�=
8<: pijkt +
�1− pijkt
�f�0��lijkt� if yijkt = 0�
1 − pijkt�f�yijkt
��lijkt� if yijkt > 0,(2)
or, equivalently,
(3) p�Yijkt = yijkt
�= pijktI
�yijkt = 0
�+�1 − pijkt
�f�yijkt
��lijkt�for i = 1, 2, :::, I; j = 1, 2, :::, J; k = 1, 2, :::, K; t = 1, 2, :::, T:
Note that Equations 2 and 3 can be viewed as a two-componentmixture of an ordinary count distribution fðyijkt
��lijktÞ and adegenerate distribution having a point mass at zero; that is,the probability of no response, pðYijkt = 0Þ, is a weightedaverage of both outcomes described previously. Note herethe standard Poisson count model (obtained when pijk = 0)is fully embedded in Equations 2 and 3. Finally, let cijkt bea dichotomous variable that indicates whether the observedresponse (i.e., nonresponse) comes from the degenerate(cijkt = 1) or randomly from the ordinary event-count com-ponent (cijkt = 0). We propose a simple hierarchical modelfor cijkt, where cijkt ~ Bernoulli(pijk) and the probability pijkof the degenerate event has the logistic transformationpijk = ½1 + expð−g ijkÞ�−1. Therefore, Equations 1–3 constitutea zero-inflated Poisson (Greene 1994; Lambert 1992); it is themost widely applied technique for addressing overdispersionin count data. Finally, the log-likelihood contribution from asingle format and target in the Poisson case is therefore thefollowing:
LLijk = �T
i=1log
24pijkI�yijkt = 0
�+
�1− pijk
�exp
�−lijkt
�lyijktijkt
yijkt!
35:(4)
Given the preceding familiar framework, we can now de-velop a model to study the dynamic effects of advertising
A Dynamic Model for Digital Advertising 205
throughout a digital campaign. For instance, one may askwhether online ads exhibit carry-over similar to offline ads, andif they do, whether carry-over varies by digital media formatand target. That is, does a consumer’s decision to click on an adat time t depend not only on the current impression but also onpast, or carry-over, impressions? One could assess, too, whethersome formats are better for different thematic impressions—specifically, whether incentive-based messages are better forretargeting—and assess the impact of size and animation ondigital ad effectiveness. To do this, we employ a flexible state-space model, wherein unobservable mean clicks lijkt in Equa-tions 1–4 evolve over time in the following multiplicative way:
lijkt = ldijkijkt−1 exp
0@aik + sjk + �
L
l=1bijkl�f
�aijklt
�+ vgijkt
1A,
vgijkt ~ N�0,w2
ijk
�,
(5)
where goodwill is log of the latent mean clicks, gijkt =logðlijktÞ, and
gijkt = goodwill of ads in format i (Flash or GIF), size j,target k at time t;
�fðaijktÞ = a function of ad impression aijklt in format i, size j,target k, theme l at time t;4
bijkl = effectiveness of impression in format i, size j, targetk, theme l;
dijk = carry-over rate in format i, size j, target k;aik = fixed effect of animation in Flash ads in target k;sjk = fixed effect of size across Flash and GIF ads in
target k; andvgijkt = mean-zero, normal error for format i, size j, target k.
Thus, with log-link gijkt = logðlijktÞ, Equation 5 is the fa-miliar discrete-time goodwill model due to Nerlove–Arrow.That is, one assumes that goodwill gijkt decays in proportionto prior goodwill gijkt−1 and is sustained here by an addi-tive function of advertising exposures �fðaijkltÞ. Moreover,although in the digital arena consumers can only click throughif they see an ad, the decision to click is attributed to boththe current and the cumulative effects, or goodwill of past adimpressions.Without carry-over, our model would attribute adresponse only to current impressions at time t. The fixed-effects parameters ðaik andsjkÞ control for the possibility thatdigital media characteristics (i.e., size and animation), influenceresponse; that is, online consumers may respond differently tomessages in different ad formats and sizes. To separately identifythe effects of size and animation, however, we setaik = 0 for theGIF formats. Apart from their simple interpretations in termsof our substantive questions, there are other desirable featuresof these fixed effect parameters: first, they help imposecorrelation among multivariate count data; second, theyexplicitly account for one source of endogeneity that couldarise if they were omitted, because format and size effectscould indeed be correlated with ad impressions.
Yet more likely sources of endogeneity in ad impressions,covðaijklt, vgijktÞ „ 0, may be due to the context consisting ofunobservable site features such as the information content ofthe site. Ad networks are likely to serve more impressions tosites whose context matches the advertised product. Given
these reliability concerns, we follow Naik and Tsai (2000)and Sonnier, Rutz, and McAlister (2011) to account forendogeneity:
mkt = qkt + hkzkt + vmkt;(6)
qkt = Bkqkt−1 + vqkt,(7)
where
mkt = ½�fða11k1tÞ, :::, �fða23k1tÞ,�fða11k2tÞ, :::,�fða23k2tÞ�0,vmkt =
�vm11k1t, :::, v
m23k1t, v
m11k2t, :::, v
m23k2t
�0,
vqkt =�vq11k1t, :::, v
q23k1t, v
q11k2t, :::, v
q23kt2t
�,
vqijkt ~ N�0,Sijk
�,hvgijkt, v
mijkt
i~ N
�0,Hijk
�, and
Hijk =
w2ijk S
0ijk
Sijk Wijk
:
That is, Equations 6–7 model impressions (mkt) across for-mats, messages, and targets as functions of (1) covariates Zkt,dummy variables for the category of the product embedded inthese impressions; (2) a random measurement noise vqkt; and(3) a latent time-varying component qkt that is governed by afirst-order autoregressive process (Naik and Tsai 2000). Thecategory dummies are proxy measures for the web context,aiming to capture endogeneity in impressions due to thematching of website with the retailer’s advertised product;the latent measure qkt captures variation in impressions dueto other unobserved factors. Recall that our data capture theproduct-related promotions of a (multicategory) retailer. Assuch, the objectives of these ads are to create awareness of andengagement with the retailer’s products among targeted con-sumers, using targeted price- and product-related messages.Note that many of these products have specific uses and thusare often advertised on sites where they are related to thecontent of the sites; the retailer’s targets are likely to visitcontextually matched sites, and when they do so, they arelikely to engage. This type of matching suggests that ourproduct category dummies are potentially valid instruments,related to website content and traffic.5 Note also that our in-strumental variable model is a state-pace model, with a time-varying intercept qkt as defined in Equation 6. This helpscontrol for other time-varying unobservables that could co-vary with ad impressions. Formally, to control for potentialendogeneity (which becomes relevant when elements ofcovðvgijkt vmijktÞ = Sijk „ 0), we condition the analysis of Equa-tions 1–5 on vmijkt (see, e.g., Rossi, Allenby, and McCulloch2005).
In summary, we propose a model to investigate the effectsof digital ads served across multiple formats, messages, andtargeted consumer segments over time. The model has threemajor components: a nonlinear model of ad response thataccounts for the presence of zeros in event-count data; a modelof ad dynamics that links impressions and targeting decisionsto ad response; and a linear measurement model that controlsfor endogeneity in ad impressions. The model can address
4The estimation uses a semilog transformation:�fðaijkltÞ = lnð1 + aijkltÞ: Forthe justifications for these functional forms, see Bass et al. (2007).
5The population R2 values from the regression of log(1 + ad impression)against these instruments range from .63 to .73 across the four consumertargets (see Web Appendix for further assessment of our instruments).
206 JOURNAL OF MARKETING RESEARCH, APRIL 2017
several questions about the duration of advertising acrossdigital formats, including whether some formats and retar-geting strategies are more effective with price-based incentivesand what the impact of size and animation are on digital adeffectiveness. First, however, we must develop an estima-tion scheme, whose primary challenge will be to recovertime-varying vectors that include both linear and nonlinearcomponents.
ESTIMATION AND INFERENCE
We adopt a Bayesian approach to estimation because ofits versatility and our need to evaluate nonlinear, nonnormalstate-space parameters. With few exceptions (e.g., Lopeset al. 2010), the Bayesian approach to such problems relies onconditional independence to iteratively sample a sequence ofconditional posteriors (for the fixed and time-varying pa-rameters) rather than sample directly from their intractablejoint (Doucet, De Freitas, and Gordon 2001). How, then,does conditional independence help resolve our estima-tion problem defined by Equations 1–7? First, consider ouressential task: to recover a joint, but intractable, posteriorpðqt, gtjyt,mt, zÞ (intractable because yt is nonlinear/non-Gaussian), where gt = fg11t, g12t, :::, gIJtg ðgt = logðltÞÞ andqt = fq11t, q12t, :::, qIJtg are the vectors of goodwill and mea-surement state variables just described; z is a collection of allthe static parameters; and yt and mt are clicks and impres-sions, respectively, at time t (here we suppress the targetsubscript, k) (see Equations 1–5). Thus, in our case, con-ditional on gt, the clicks yt provide no further informationfor estimating the measurement state variable qt. In otherwords, gt becomes a sufficient statistic for estimating qt; thus,Equations 5–6 become the linear observation equations andEquation 7 becomes the linear system equation for the stateqt. We can therefore apply the basic Kalman filter/smootheralgorithm to estimate pðqtj, g,mt, zÞ and its related fixedparameters in z (see, e.g., Bass et al. 2007; Carter and Kohn1994; Fruhwirth-Schnatter 1994).
In contrast, the conditional posterior pðgtj, yt, zÞ of good-will is nonlinear and non-Gaussian (because its observationEquation 2 is zero-inflated Poisson), and so there is no general(or closed-form) expression for its probability density function;we thus approximate it using the particle filter (Bruce 2008;Doucet, De Freitas, and Gordon 2001; Liu and Chen 1998).Particle filtering belongs to a class of sequential Monte Carlointegration methods based on Bayesian inference. It is moreflexible than the extended and unscented Kalman filters,methods that work with Gaussian approximations for posteriordensities, which make them simpler to implement and fasterto execute but preclude them from modeling the higher-order moments of truly non-Gaussian distributions (Ristic,Arulampalam, and Gordon 2004). Particle filtering involvesthe use of particles, samples drawn from an importance func-tion, and their associated weights to approximate the proba-bility density function. The procedure, based on importancesampling (e.g., Geweke 1989), provides a discrete approxi-mation to the posterior density of the states through a set ofsupport Ns points (or particles) fgn0:tgNs
n=1 and their respectiveweights, fwn
0:tgNsn=1, where wn
t > 0 and �Nsn=1 w
nt = 1. These
particles are drawn from an importance function; the choice ofthis density is one of the most important decisions in con-structing particle filter algorithms.
CHOOSING AN IMPORTANCE FUNCTION
In many applications of the particle filter, the chosen im-portance function is the transition density (Equation 5) becauseit is simple and readily available from the model. Yet we knowthat particle filter algorithms that use this (prior) importancefunction often suffer from the degeneracy problem; that is, thevariance of the importance weights increases over time. In-tuitively, if the data are very informative (i.e., the variance ofdata distribution is very small), the algorithm would wastemany samples and time by exploring regions of low impor-tance. Tomake the methodmore effective, Doucet, De Freitas,and Gordon (2001) and Liu and Chen (1998) suggest im-portance functions of the form pðgtjgt−1, ytÞ, that is, ones thatincorporate both the system and observation processes. In-deed, Doucet, De Freitas, and Gordon (2001) show that thisimportance function pðgtjgt−1, ytÞ addresses the degeneracyproblem by minimizing the variance of the (unnormalized)importance weight fwn
0:tgNsn=1. Nevertheless, it is very dif-
ficult to derive optimal importance functions of the formpðgtjgt−1, ytÞ analytically, outside a few special cases (e.g.,Bruce 2008) and certainly not in our case, where the obser-vations are nonlinear and non-Gaussian. Yet we can derive alinear-normal approximation of this optimal function (see theWeb Appendix):
~pðgtjgt−1, ytÞ = N�g*t , −
�l00�g*t��
−1�,(8)
where lðgtÞ = ln pðytjgtÞpðgtjgt−1Þ, with derivatives of this logdistribution, l0 and l00, evaluated at its mode:
l0�g*t�=¶lðgtÞ¶gt
jgt=g*t , and
l00�g*t�= −
¶2lðgtÞ¶gt¶g0t
�����gt=g
*t
:
We can obtain the mode g*t of lðgtÞ by applying an iterativeNewton–Raphson procedure, initialized with g0t = gt−1 at eachstep of the filter:
gk+1t = gkt −�lw�gkt��
−1�l0�gkt��:(9)
DATA AND IDENTIFICATION
Recall that our substantive aim is to explore how centralfeatures of digital ads affect consumer engagement over time.Thus, to identify the cross-sectional and temporal features ofthe problem, we acquired panel data from a major U.S. retailerin an industry that provides products and services for the home.The data contain daily ad impressions served via an ad net-work, as well as the resulting clicks. Both sets of data aredisaggregated by target, format, and message and cover aperiod of T = 154 days, from February 14, 2011, to July 17,2011. In this campaign, the retailer targeted four broad seg-ments, one behavioral (retargeted) and three demographic(male, female, age); and employed two ad formats, Flash(animated) and GIF (static). Flash ads appear as a sequence offour to eight time-delayed images, with the last image identicalto the corresponding static GIF image. Flash ads not onlyinclude colorful, attractive animation but also deliver alonger message than GIF ads. There are also three stan-dard size–orientation combinations for ads: 728 × 90
A Dynamic Model for Digital Advertising 207
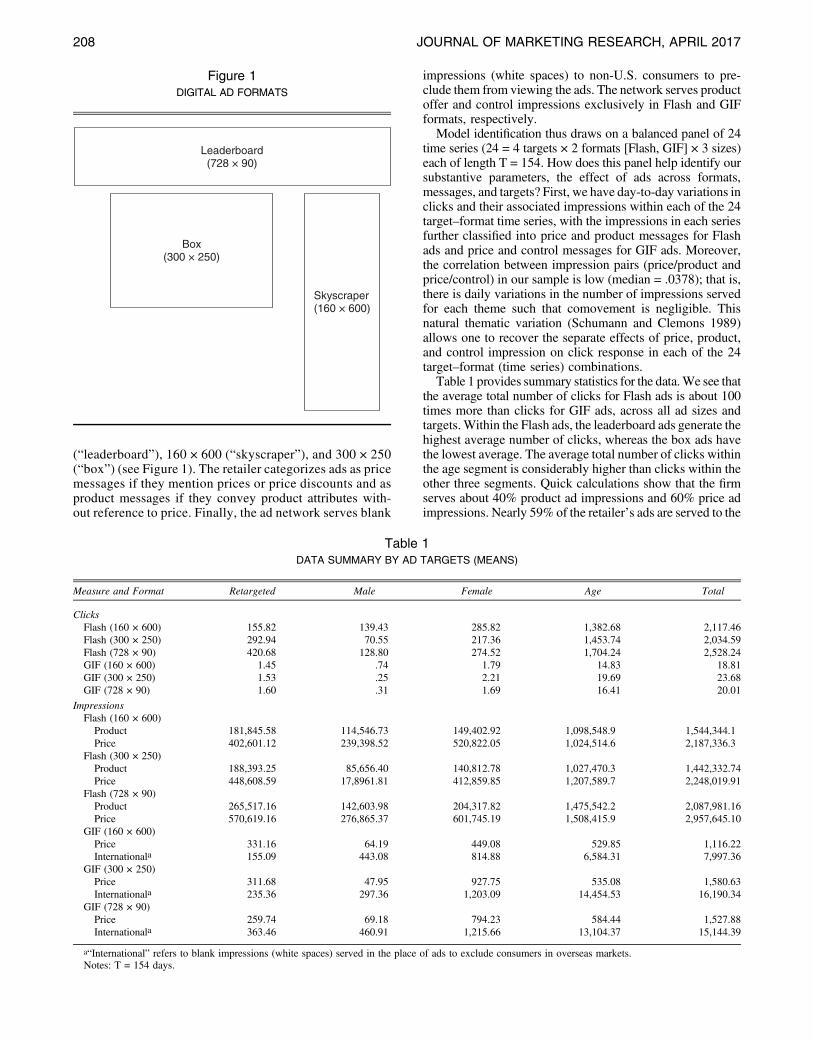
(“leaderboard”), 160 × 600 (“skyscraper”), and 300 × 250(“box”) (see Figure 1). The retailer categorizes ads as pricemessages if they mention prices or price discounts and asproduct messages if they convey product attributes with-out reference to price. Finally, the ad network serves blank
impressions (white spaces) to non-U.S. consumers to pre-clude them from viewing the ads. The network serves productoffer and control impressions exclusively in Flash and GIFformats, respectively.
Model identification thus draws on a balanced panel of 24time series (24 = 4 targets × 2 formats [Flash, GIF] × 3 sizes)each of length T = 154. How does this panel help identify oursubstantive parameters, the effect of ads across formats,messages, and targets? First, we have day-to-day variations inclicks and their associated impressions within each of the 24target–format time series, with the impressions in each seriesfurther classified into price and product messages for Flashads and price and control messages for GIF ads. Moreover,the correlation between impression pairs (price/product andprice/control) in our sample is low (median = .0378); that is,there is daily variations in the number of impressions servedfor each theme such that comovement is negligible. Thisnatural thematic variation (Schumann and Clemons 1989)allows one to recover the separate effects of price, product,and control impression on click response in each of the 24target–format (time series) combinations.
Table 1 provides summary statistics for the data.We see thatthe average total number of clicks for Flash ads is about 100times more than clicks for GIF ads, across all ad sizes andtargets. Within the Flash ads, the leaderboard ads generate thehighest average number of clicks, whereas the box ads havethe lowest average. The average total number of clicks withinthe age segment is considerably higher than clicks within theother three segments. Quick calculations show that the firmserves about 40% product ad impressions and 60% price adimpressions. Nearly 59% of the retailer’s ads are served to the
Figure 1DIGITAL AD FORMATS
Leaderboard (728 × 90)
Box(300 × 250)
Skyscraper(160 × 600)
Table 1DATA SUMMARY BY AD TARGETS (MEANS)
Measure and Format Retargeted Male Female Age Total
ClicksFlash (160 × 600) 155.82 139.43 285.82 1,382.68 2,117.46Flash (300 × 250) 292.94 70.55 217.36 1,453.74 2,034.59Flash (728 × 90) 420.68 128.80 274.52 1,704.24 2,528.24GIF (160 × 600) 1.45 .74 1.79 14.83 18.81GIF (300 × 250) 1.53 .25 2.21 19.69 23.68GIF (728 × 90) 1.60 .31 1.69 16.41 20.01
ImpressionsFlash (160 × 600)
Product 181,845.58 114,546.73 149,402.92 1,098,548.9 1,544,344.1Price 402,601.12 239,398.52 520,822.05 1,024,514.6 2,187,336.3
Flash (300 × 250)Product 188,393.25 85,656.40 140,812.78 1,027,470.3 1,442,332.74Price 448,608.59 17,8961.81 412,859.85 1,207,589.7 2,248,019.91
Flash (728 × 90)Product 265,517.16 142,603.98 204,317.82 1,475,542.2 2,087,981.16Price 570,619.16 276,865.37 601,745.19 1,508,415.9 2,957,645.10
GIF (160 × 600)Price 331.16 64.19 449.08 529.85 1,116.22Internationala 155.09 443.08 814.88 6,584.31 7,997.36
GIF (300 × 250)Price 311.68 47.95 927.75 535.08 1,580.63Internationala 235.36 297.36 1,203.09 14,454.53 16,190.34
GIF (728 × 90)Price 259.74 69.18 794.23 584.44 1,527.88Internationala 363.46 460.91 1,215.66 13,104.37 15,144.39
a“International” refers to blank impressions (white spaces) served in the place of ads to exclude consumers in overseas markets.Notes: T = 154 days.
208 JOURNAL OF MARKETING RESEARCH, APRIL 2017
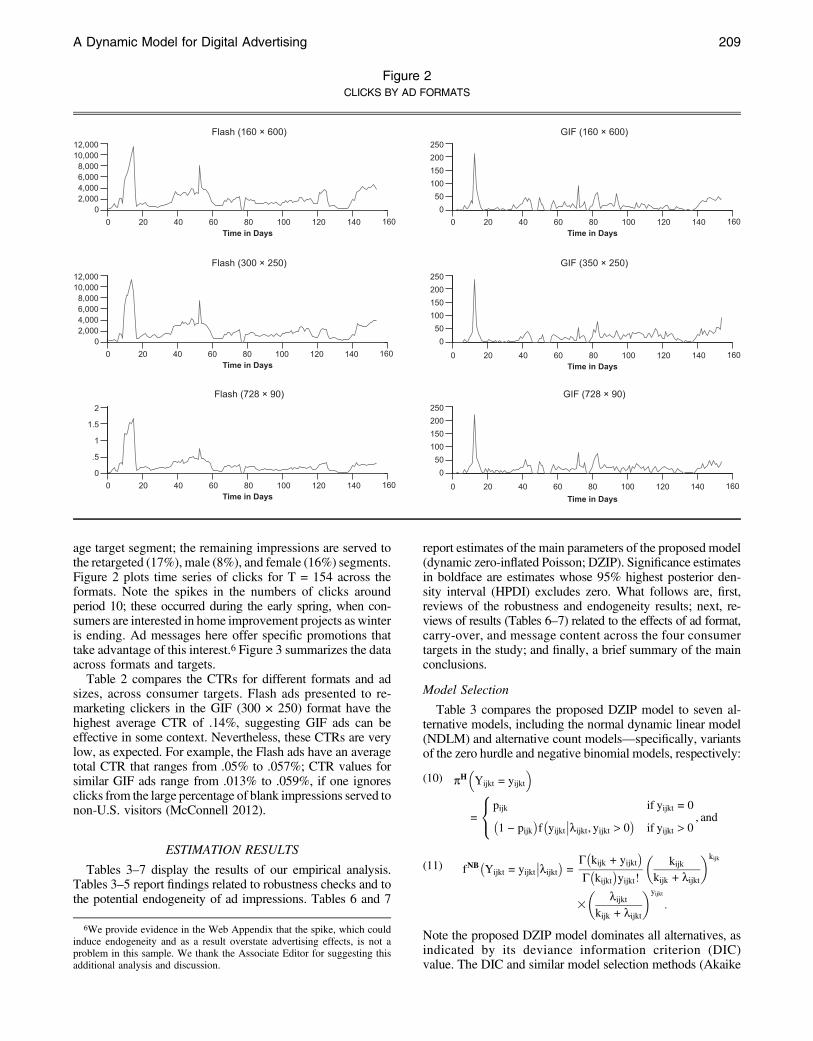
age target segment; the remaining impressions are served tothe retargeted (17%), male (8%), and female (16%) segments.Figure 2 plots time series of clicks for T = 154 across theformats. Note the spikes in the numbers of clicks aroundperiod 10; these occurred during the early spring, when con-sumers are interested in home improvement projects as winteris ending. Ad messages here offer specific promotions thattake advantage of this interest.6 Figure 3 summarizes the dataacross formats and targets.
Table 2 compares the CTRs for different formats and adsizes, across consumer targets. Flash ads presented to re-marketing clickers in the GIF (300 × 250) format have thehighest average CTR of .14%, suggesting GIF ads can beeffective in some context. Nevertheless, these CTRs are verylow, as expected. For example, the Flash ads have an averagetotal CTR that ranges from .05% to .057%; CTR values forsimilar GIF ads range from .013% to .059%, if one ignoresclicks from the large percentage of blank impressions served tonon-U.S. visitors (McConnell 2012).
ESTIMATION RESULTS
Tables 3–7 display the results of our empirical analysis.Tables 3–5 report findings related to robustness checks and tothe potential endogeneity of ad impressions. Tables 6 and 7
report estimates of the main parameters of the proposed model(dynamic zero-inflated Poisson; DZIP). Significance estimatesin boldface are estimates whose 95% highest posterior den-sity interval (HPDI) excludes zero. What follows are, first,reviews of the robustness and endogeneity results; next, re-views of results (Tables 6–7) related to the effects of ad format,carry-over, and message content across the four consumertargets in the study; and finally, a brief summary of the mainconclusions.
Model Selection
Table 3 compares the proposed DZIP model to seven al-ternative models, including the normal dynamic linear model(NDLM) and alternative count models—specifically, variantsof the zero hurdle and negative binomial models, respectively:
pH�Yijkt = yijkt
�
=
8<:
pijk if yijkt = 0�1 − pijk
�f�yijkt
��lijkt, yijkt > 0�
if yijkt > 0, and
(10)
fNB�Yijkt = yijkt
��lijkt� = G�kijk + yijkt
�G�kijkt
�yijkt!
�kijk
kijk + lijkt
�kijk
3
�lijkt
kijk + lijkt
�yijkt
:
(11)
Note the proposed DZIP model dominates all alternatives, asindicated by its deviance information criterion (DIC)value. The DIC and similar model selection methods (Akaike
Figure 2CLICKS BY AD FORMATS
12,00010,000
8,0006,0004,0002,000
0
250200150100
500
250200150100
500
250200150100
500
12,00010,000
8,0006,0004,0002,000
0
Time in Days0 20 40 60 80 100 120 140 160
Time in Days0 20 40 60 80 100 120 140 160
Time in Days0 20 40 60 80 100 120 140 160
Time in Days0 20 40 60 80 100 120 140 160
Time in Days0 20 40 60 80 100 120 140 160
2
1.5
1
.5
0
Time in Days0 20 40 60 80 100 120 140 160
Flash (160 × 600)
Flash (728 × 90)
Flash (300 × 250)
GIF (160 × 600)
GIF (728 × 90)
GIF (350 × 250)
6We provide evidence in the Web Appendix that the spike, which couldinduce endogeneity and as a result overstate advertising effects, is not aproblem in this sample. We thank the Associate Editor for suggesting thisadditional analysis and discussion.
A Dynamic Model for Digital Advertising 209
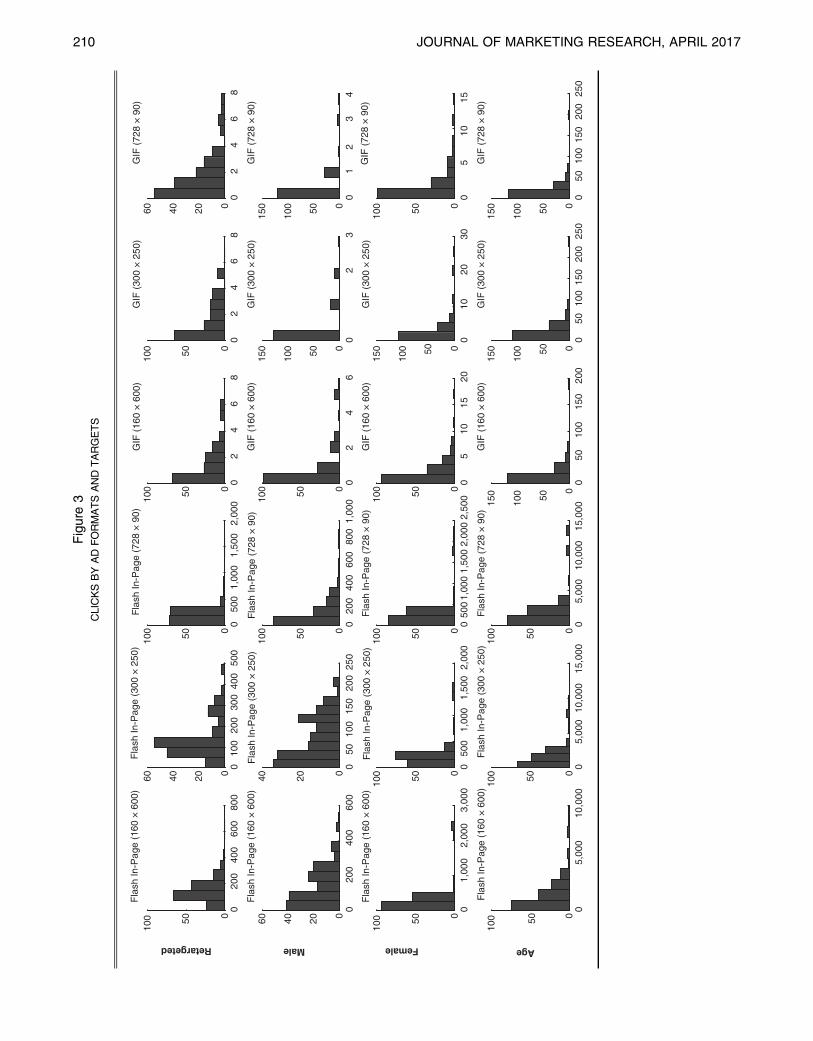
Figure3
CLICKSBYAD
FORMATSAND
TARGETS
020
040
060
080
0050
100
Fla
sh In
-Pag
e (1
60 ×
600
)
010
020
030
040
050
00204060
Fla
sh In
-Pag
e (3
00 ×
250
)
050
01,
000
1,50
02,
000
050100
Fla
sh In
-Pag
e (7
28 ×
90)
02
46
8050100
GIF
(16
0 ×
600
)
02
46
8050100
GIF
(30
0 ×
250
)
02
46
80204060
GIF
(72
8 ×
90)
020
040
060
00204060
050
100
150
200
250
02040
020
040
060
080
01,
000
050100
02
46
050100
GIF
(16
0 ×
600
)
02
3050100
150
GIF
(30
0 ×
250
)
01
23
4050100
150
GIF
(72
8 ×
90)
01,
000
2,00
03,
000
050
100
050
01,
000
1,50
02,
000
050100
050
01,
000
1,50
02,
000
2,50
0050100
05
1015
20050100
GIF
(16
0 ×
600
)
010
2030
050
100
150
GIF
(30
0 ×
250
)
05
1015
050100
GIF
(72
8 ×
90)
05,
000
10,0
000
100
05,
000
10,0
0015
,000
050100
05,
000
10,0
0015
,000
050100
Fla
sh In
-Pag
e (7
28 ×
90)
050
100
150
200
0
50100
150
GIF
(16
0 ×
600
)
050
100
150
200
250
050
100
150
GIF
(30
0 ×
250
)
050
100
150
200
250
050100
150
GIF
(72
8 ×
90)
Retargeted Male Female Age
Fla
sh In
-Pag
e (1
60 ×
600
)
Fla
sh In
-Pag
e (1
60 ×
600
)
Fla
sh In
-Pag
e (1
60 ×
600
)
50
Fla
sh In
-Pag
e (3
00 ×
250
)
Fla
sh In
-Pag
e (3
00 ×
250
)
Fla
sh In
-Pag
e (3
00 ×
250
)
Fla
sh In
-Pag
e (7
28 ×
90)
Fla
sh In
-Pag
e (7
28 ×
90)
210 JOURNAL OF MARKETING RESEARCH, APRIL 2017
information criterion [AIC] andBayesian information criterion[BIC]) include penalty terms to offset gains in model fit duesolely to added complexity, since more complex models withmore parameters generally provide better fit. For Bayesianhierarchical models, however, the number of parameters is lessclear. Spiegelhalter et al. (2002) propose the DIC to addressthis uncertain complexity in Bayesian hierarchical models(e.g., Equation 5).With the DIC, then, the worst model (Model8) is the NDLM; this confirms that here, a normal approxi-mation to the distribution of the data (clicks) is inappropriate.The negative binomial models also perform poorly relative toPoisson models, and among the latter, the DZIP model dom-inates. Thus, we show that it is important to consider thedynamic effects of digital ads as well as to control for over-dispersion. Finally, Figure 4 shows the fit of the DZIP modelby plotting its posterior mean (lijkt) against the actual numberof daily clicks for different formats and targets. The proposedmodel fits the data quite well.
Endogeneity of Impressions
Tables 4 and 5 show the results of an analysis into the po-tential endogeneity of ad impressions. In implementation,this means controlling for the potential comovement of themeasurement (vmijkt) and goodwill noises (vgijkt) (Naik and Tsai2000; Rossi, Allenby, andMcCulloch 2005), after accounting forthe unobserved information context of the publisher’s site, usingproduct category dummies. Table 4 reports the effects of thesedummies on the volume of impressions. The significant pa-rameters show that some category dummies predict product andprice ad impressions and thus could account for the unobservablematching features of the publisher sites; therefore, if the corre-lations between vmijkt and vgijkt are not significantly different fromzero, then one can conclude that measurement noise is in-consequential in our sample. Table 5, however, shows that 5–10of the 12 correlations in each target are still significant. Thissuggests controlling for endogeneity is essential for determiningthe effectiveness of digitals ads (e.g., Lee, Hosanagar, and Nair2015).
Animated Versus Statics Display Ads
Tables 6 and 7 report estimates from the proposed DZIPmodel. First, Table 6 shows that Flash ads have significantlymore average clicks than GIF ads, as seen by the fixed effectof Flash ads, supporting the notion that animation can fosterengagement (Li and Bukovac 1999). These results are con-sistent across all consumer targets. Recall that the dependentparameter in Equation 5 is the log-link, log(lijkt); thus, the
effectiveness of Flash ads across retargeted, male, female, andage segments is 11.8, 10.4, 16.9, and 12.6 times (respectively)that of similar GIF ads, ceteris paribus. These results reflect themuch greater sparsity of click response to GIF ads (Table 1).The effects of orientation–size combinations (exp(sik)) acrosssegments are significant too, but their relative effects on en-gagement are mixed, as predicted (e.g., Chandon, Chtourou,and Fortin 2003; Cho 2003). For example, box ads are mosteffective in the age segment, but leaderboard ads are most ef-fective among retargeted consumers, and all are equallyeffective among women. The latter result seems to supportthe prediction that female retail shoppers are more likely tobrowse (e.g., Passyn, Diriker, and Settle 2011).
Carry-Over Effects
Carry-over rates for Flash (GIF) ads are significant acrossthe four segments (Table 6), with values ranging from .52to .75 (.09 to .27). Thus, animated banner ads have signifi-cantly higher carry-over rates than GIF ads, across consumersegments and size–orientation combinations. The increase incarry-over rates is roughly three to five times greater when oneuses animated ads rather than static ads, across targets andformats. These results seem consistent with Naik and Raman(2003), who find that carry-over for TV (animated) is ap-proximately 2.5 times that of static print. Thus, in our study,animated ads have the potential to engage consumers forlonger periods. To make this result more concrete, we com-puted the 90% duration for each format and target (D90 days),that is, the number of days it takes for an ad to lose 90% ofits effect. Thus, in Table 7, the average D90 across the foursegments ranges from 4.8 to 9.4 days for Flash ads, while it isapproximately 2.2–3.1 days for GIF ads. Similarly, in Table 7,themean ad elasticity (calculated using the posterior draws) forFlash ads ranges from .2412 to .3708, whereas the range forGIF ads is .0682 to .1595.
Price- Versus Product-Based Messages
Consider now the effects of product-based and priceincentive–based messages—specifically, how these effectsvary across creative formats and targeted consumer segments.Table 6 reports the immediate, or short-term, effects bijk ofads by themes, across formats and sizes, and among differentconsumers. From these results, we can see that price ads aremore effective than product ads within the Flash format, inall sizes and target markets; this result builds on evidencethat price incentives can motivate engagement (Chtourou,
Table 2CTR (%) BY MEDIA FORMATS AND AD TARGETS
Format Retargeted Male Female Age Total
Flash (160 × 600) .0530 .0394 .0426 .0652 .0567Flash (300 × 250) .0460 .0267 .0393 .0651 .0551Flash (728 × 90) .0503 .0307 .0340 .0571 .0501GIF (160 × 600)a .1003 .0906 .0043 .0684 .0134GIF (300 × 250)a .1359 .0068 .0716 .0598 .0686GIF (728 × 90)a .0357 .0727 .0525 .0413 .0435
aCTR – price ads.Notes: T = 154 days.
Table 3ALTERNATIVE MODELS
Model Description DIC Rank
Model 1 Dynamic zero-inflated Poisson (DZIP) 14,256.9 1Model 2 Dynamic Poisson (DP) 22,989.4 2Model 3 Dynamic hurdle Poisson (DHP) 23,733.6 3Model 4 Zero-inflated Poisson (ZIP), no
dynamics, d = 025,402.3 4
Model 5 Dynamic zero-inflated negativebinomial (DZINB)
31,705.8 5
Model 6 Dynamic negative binomial (DNB) 31,978.5 6Model 7 Zero-inflated negative binomial (ZINB), d = 0 32,556.4 7Model 8 Normal dynamic linear model (NDLM) 33,455.8 8
A Dynamic Model for Digital Advertising 211
Chandon, and Zollinger 2002; Hupfer and Grey 2005; Xieet al. 2004). Product ads, nevertheless, are still effective in themale, female, and age segments across all size–orientationcombinations (with one exception: leaderboard ads amongmen); although these effects differ marginally, they are onaverage highest among targeted women (.0325, .0335, and.0372, for 728 × 90, 300 × 250, and 150 × 600 Flash ads,respectively; see Table 6), whom retailing studies predict tobe more engaged shoppers. Yet product ads are ineffectiveamong retargeted consumers, while, in contrast, price adsin Flash format that are otherwise similar are effective inall segments, even among retargeted consumers. Recall thatevidence suggests that retargeted ads are ineffective unlessserved to consumers who havewell-defined preferences, suchthat they are willing to purchase (Lambrecht and Tucker2013). Thus, our finding suggests that when retargetingconsumers, one should also recognize that price incentivescan be useful in making ads more effective by addressingconsumer willingness to pay.
The discussion, hitherto, has reviewed the effects of Flashads; earlier, we reported that, ceteris paribus, Flash ads garnermore engagement than GIF ads. Table 6, however, shows thatstatic GIF ads with price offer messages can be effectiveamong retargeted and female shoppers. Furthermore, whileprice ads are more effective in generating engagement in theFlash than in the GIF format for the male and age segments (Liand Bukovac 1999), price ads are equally effective for GIF and
Flash among women and the retargeted. Finally, we note theparameters for international GIF ads (e.g., b42). Recall thatbecause this campaign targets U.S. consumers, the ad serversends blank impressions to non-U.S. consumers. Nevertheless,these consumers may still click on blank images, usually fromcuriosity (e.g., when blank ads are visually salient; Wedel andPieters 2008) but also in error (McConnell 2012). As a result,the parameters that capture the effects of these clicks are largeand significant. While these measures have no managerialinterpretation in terms of ad content, they do show how thetactic of serving blanks can distort naivemeasures of campaigneffectiveness (e.g., CTR).
In summary, Tables 6–7 help reveal the workings of digitalads. For instance, in our sample, animated ads are more ef-fective than static ads and have longer duration. There is alsoheterogeneity in the performance of banner ads across formats,messages, and targets. For example, within the Flash format,price ads are more effective in generating engagement thanproduct ads in all three size–orientation combinations and allfour target markets defined in this study. Product ads, incontrast, are ineffective among retargeted consumers. Thus,retargeted consumers are less likely to engage when ads ex-clude price incentives. Finally, although Flash ads engagemore consumers than GIF ads, they are still effective forengaging retargeted and female consumers; the latter con-sumers are seemingly more willing to engage with ads of allformats and messages.
Robustness Check of Results
As a final step, we investigate the robustness of our findingsby comparing them with results from five (simpler) variationsof the proposed model (see the Web Appendix):
• Model A: a linear state-spacemodel (NDLM)with click data onoriginal scale;
Table 4EFFECT OF PRODUCT CONTEXTUAL VARIABLES
ON IMPRESSIONS
Retargeted Male Female Age
Product AdsCategory 1 .0919 .0407 −.0122 −.0094Category 2 −.0442 −.0284 −.2460 −.1262Category 3 .5249 .6214 .8791 .6189Category 4 .7994 .9754 1.1196 .9306Category 5 .6459 .5762 .8399 .9794Category 6 .3274 .2446 .2356 .3586Category 7 −.1851 −.3391 −.4695 −.5563Category 8 1.2745 1.3370 1.8473 1.3779Category 9 −.0643 −.1789 −.3717 −.1785Category 10 .1265 −.1205 −.0904 −.4301Category 11 −.0387 −.1015 −.0675 .0682Category 12 −.7680 −.9852 −1.4167 −.8812Category 13 −.7346 −.8950 −1.3714 −.8087Category 14 −.1503 .4245 −.1945 −.6860
Price AdsCategory 1 .0640 .0510 .0346 −.1529Category 2 .0960 −.0135 .3031 .2283Category 3 .0257 −.0559 .2017 −.0575Category 4 .1597 .0530 .1768 .1298Category 5 .3704 .4333 .8596 .8727Category 6 −.0762 −.0776 .0800 −.0998Category 7 −.0525 .0486 .0717 −.0942Category 8 −.1455 −.1300 .1539 −.1491Category 9 .2914 .3909 .2642 .4060Category 10 .0729 −.0262 −.1305 .0099Category 11 −.1270 −.2344 −.2613 −.1664Category 12 .1459 −.0054 −.2542 .0390Category 13 .1426 .2781 −.4545 .1064Category 14 .2922 .2111 .4132 .4688
Notes: Boldface indicates values for which the 95% HPDI excludes zero.
Table 5MEASUREMENT MODEL: CORRELATIONS WITH GOODWILL
ERROR
Format and Message Retargeted Male Female Age
Flash (160 × 600)Product .1801 .2788 .1596 .2224Price .1342 .2669 .1810 .3137
Flash (300 × 250)Product .2350 .1737 .2074 .2556Price .1294 .2492 .2788 .4743
Flash (728 × 90)Product .2188 .2660 .2077 .2191Price .1810 .2387 .2111 .3029
GIF (160 × 600)Price .1168 .0035 .1290 .2438Internationala .1155 .0877 .0432 −.0592
GIF (300 × 250)Price .2051 .0660 .1416 .2316Internationala .1402 .0255 −.0996 .4237
GIF (728 × 90)Price .1016 .0063 .2059 .3756Internationala .0930 .3027 .0583 .0226
a“International” refers to blank impressions (white spaces) served in theplace of ads to exclude consumers in overseas markets.
Notes: Boldface indicates values for which the 95% HPDI excludes zero.
212 JOURNAL OF MARKETING RESEARCH, APRIL 2017
• Model B: a log-linear state-space model with click data log-transformed;
• Model C: a dynamic Poisson model without endogeneity orzero inflation;
• Model D: a static Poisson model without endogeneity or zeroinflation;
• Model E: a dynamic negative binomial without endogeneity orzero inflation.
Notably, results from the generalized linear models (GLMs)(Models C, D, and E) are more consistent with the resultsfrom the proposed model (Table 3; Tables S1–S5 in the WebAppendix). The NDLM, by contrast reports mixed findingsfor Flash and size effects. That is, in some cases, Flash ads, onaverage, are no more effective at generating clicks than GIFads, ceteris paribus. Similarly, the effects of some ad sizes arenot significant. Although the log-linear Model B producesmany results similar to the GLM findings, it too reports mixedresults for the fixed effects of size and format. (We alsoestimated, but did not report, a square root–transformed datamodel and found conflicting evidence.) In general, we knowthat GLMs are better suited for count data, more so when theyinclude zero observations; and log transformations are moreeffective when mean counts are large and overdispersion issmall (e.g., O’Hara and Kotze 2010).
REALLOCATION ANALYSIS
The final task of this study is to conduct a simulation thatsummarizes the import of the previous results. One approach isto see how these results influence the reallocation of ad im-pressions across the duration of the campaign. That is, givenhyperparameters z, we solve a problem that reallocates thetotal ad impressions (bt) in each period across ad format (GIF,Flash), sizes, themes, and targets to maximize the total ex-pected clicks ðytÞ over T = 154 days. That is, with estimatesof the state vectors from the particle filter fgn0:T,wn
0:TgNsn=1, we
solve the following problem:
maxa111:::aIJT
�T
t=1�N
n=1wh
ijt−1E�yijt
��gnijt−1�
such that�K
k=1�I
i�J
j�2
laijklt £ bt, aijklt ‡ 0, t = 1, :::, T
(12)
whereaijt = ffaijkltg2l=1gK
k=1 and fgnijt,wnijtg = fgnijkt, wn
ijktgKk=1 areimpressions, goodwill, and particle weights across formats,messages, and targets. In addition, Eðyijt
��gnijt−1Þ is the one-step-ahead forecast vector at the particle fgnijt−1g, and aijklt is the im-pression for ad theme l in format i, size j, and target k at periodt.7 We select solutions to Equation 12 that give allocations that
Table 6ESTIMATES FROM PROPOSED MODEL BY FORMATS,
MESSAGES, AND AD TARGETS
Parameters Retargeted Male Female Age
Flash Effect 2.4688 2.3394 2.8292 2.5346
Banner Orientation–SizeCombination160 × 600, s1 −1.5515 −1.8996 −2.5996 −2.1887300 × 250, s2 −2.0080 −2.1199 −2.7617 −1.3978728 × 90, s3 −1.1505 −1.8390 −2.6533 −2.3606
Flash FormatsFlash (160 × 600)
Carry-over rate, d1 .5243 .6180 .5582 .6767Product offer, b11 .0025 .0254 .0372 .0303Price offer, b12 .1264 .0965 .1472 .1164
Flash (300 × 250)Carry-over rate, d2 .6849 .7004 .5996 .6397Product offer, b21 .0110 .0308 .0335 .0245Price offer, b22 .0960 .1051 .1341 .0865
Flash (728 × 90)Carry-over rate, d3 .6734 .6764 .5835 .7547Product offer, b31 −.0046 .0068 .0325 .0223Price offer, b32 .0784 .0406 .1330 .0935
GIF FormatsGIF (160 × 600)
Carry-over rate, d4 .1190 .1223 .1482 .1116Price offer, b41 −.0179 .0231 .1062 .0243International, b42a .7783 .3196 .8475 .8196
GIF (300 × 250)Carry-over rate, d5 .1258 .2725 .1916 .1714Price offer, b51 .0961 −.0483 .1230 −.0050International, b52a .7774 .3661 .8076 .7053
GIF (728 × 90):Carry-over rate, d6 .0869 .1410 .1615 .1288Price offer, b61 .0722 .0117 .1344 −.0188International, b62a .6507 .1920 .7671 .7942
a“International” refers to blank impressions (white spaces) served in theplace of ads to exclude consumers in overseas markets.
Notes: Boldface indicates values for which the 95% HPDI excludes zero.
Table 790% DEPRECIATION AND AD ELASTICITY
Target and Format Mean (d)D90
(Days)Elasticityof Product
Elasticityof Price
RetargetedFlash (160 × 600) .5243 4.8404 .0043 .2663Flash (300 × 250) .6849 7.3075 .0344 .3128Flash (728 × 90) .6734 7.0502 −.0157 .2437GIF (160 × 600) .1190 2.6136 — −.0182GIF (300 × 250) .1258 2.6639 — .0983GIF (728 × 90) .0869 2.5217 — .0786
MaleFlash (160 × 600) .6180 6.0277 .0695 .2540Flash (300 × 250) .7004 7.6855 .1073 .3708Flash (728 × 90) .6764 7.1155 .0209 .2440GIF (160 × 600) .1223 2.6234 — .0354GIF (300 × 250) .2725 3.1651 — −.0621GIF (728 × 90) .1410 2.6805 — .0140
FemaleFlash (160 × 600) .5582 5.2118 .0885 .3471Flash (300 × 250) .5996 5.7505 .0968 .3051Flash (728 × 90) .5835 5.5284 .0784 .3210GIF (160 × 600) .1482 2.7032 — .1233GIF (300 × 250) .1916 2.8483 — .1362GIF (728 × 90) .1615 2.2761 — .1595
AgeFlash (160 × 600) .6767 7.1221 .0956 .3660Flash (300 × 250) .6397 6.3907 .0682 .2412Flash (728 × 90) .7547 9.3869 .0939 .3933GIF (160 × 600) .1116 2.5918 — —-GIF (300 × 250) .1714 2.7789 — —-GIF (728 × 90) .1288 2.6430 — —-
Notes: Boldface indicates values for which the 95% HPDI excludes zero.Elasticity evaluated at posterior draws; elasticity = ð¶l=¶aÞða=lÞ = abf 0ðaÞ=ð1 − dÞ.
7Solved in Tomlab/SNOPT.
A Dynamic Model for Digital Advertising 213
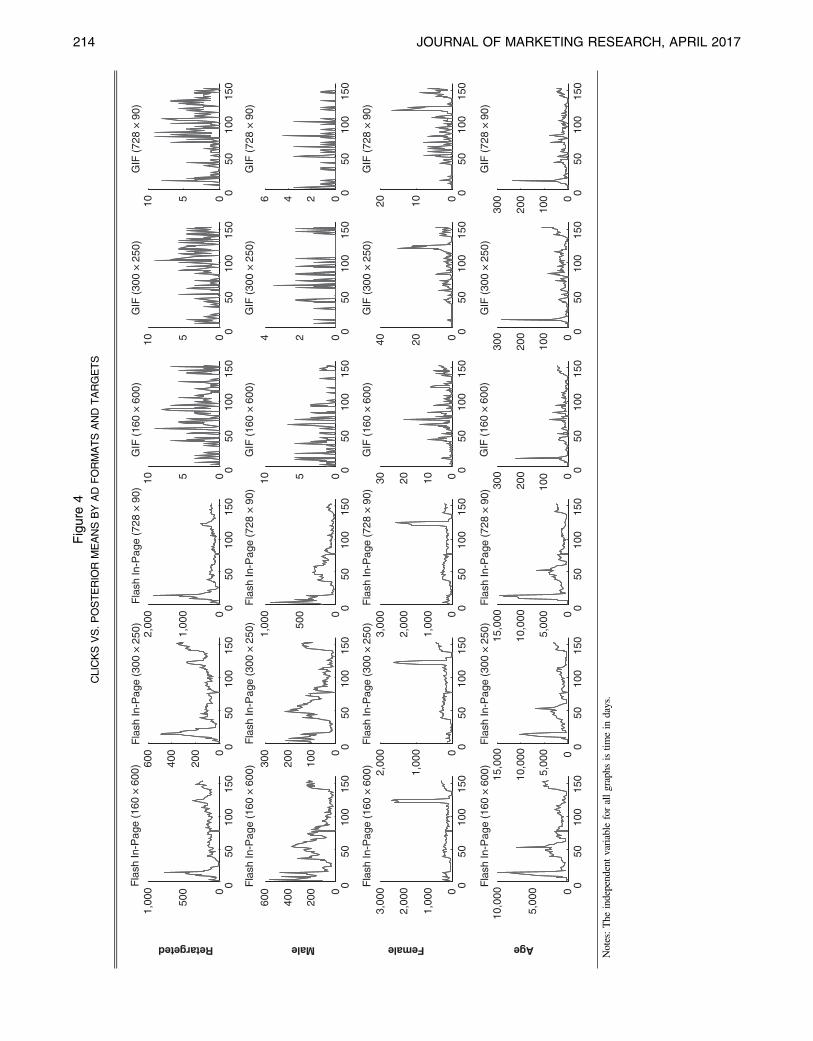
Figure4
CLICKSVS.POSTERIO
RMEANSBYAD
FORMATSAND
TARGETS
050
100
150
0
500
1,00
0F
lash
In-P
age
(160
× 6
00)
050
100
150
0
200
400
600
050
100
150
0
1,00
0
2,00
0
050
100
150
0510
050
100
150
0510
050
100
150
0510
050
100
150
0
200
400
600
050
100
150
0
100
200
300
050
100
150
0
500
1,00
0
050
100
150
0510
050
100
150
024
050
100
150
0246
050
100
150
0
1,00
0
2,00
0
3,00
0
050
100
150
0
1,00
0
2,00
0
050
100
150
0
1,00
0
2,00
0
3,00
0
050
100
150
0102030
050
100
150
02040
050
100
150
01020
050
100
150
0
5,00
0
10,0
00
050
100
150
0
5,00
0
10,0
00
15,0
00
050
100
150
0
5,00
0
10,0
00
15,0
00
050
100
150
0
100
200
300
050
100
150
0
100
200
300
050
100
150
0
100
200
300
Fla
sh In
-Pag
e (1
60 ×
600
)
Fla
sh In
-Pag
e (3
00 ×
250
)
Fla
sh In
-Pag
e (3
00 ×
250
)
Fla
sh In
-Pag
e (1
60 ×
600
)
Fla
sh In
-Pag
e (1
60 ×
600
)
Fla
sh In
-Pag
e (3
00 ×
250
)
Fla
sh In
-Pag
e (3
00 ×
250
)
Fla
sh In
-Pag
e (7
28 ×
90)
Fla
sh In
-Pag
e (7
28 ×
90)
Fla
sh In
-Pag
e (7
28 ×
90)
Fla
sh In
-Pag
e (7
28 ×
90)
GIF
(16
0 ×
600)
GIF
(16
0 ×
600)
GIF
(16
0 ×
600)
GIF
(16
0 ×
600)
GIF
(30
0 ×
250)
GIF
(30
0 ×
250)
GIF
(30
0 ×
250)
GIF
(30
0 ×
250)
GIF
(72
8 ×
90)
GIF
(72
8 ×
90)
GIF
(72
8 ×
90)
GIF
(72
8 ×
90)
Retargeted Male Female Age
Notes:The
independentvariable
forallgraphs
istim
ein
days.
214 JOURNAL OF MARKETING RESEARCH, APRIL 2017
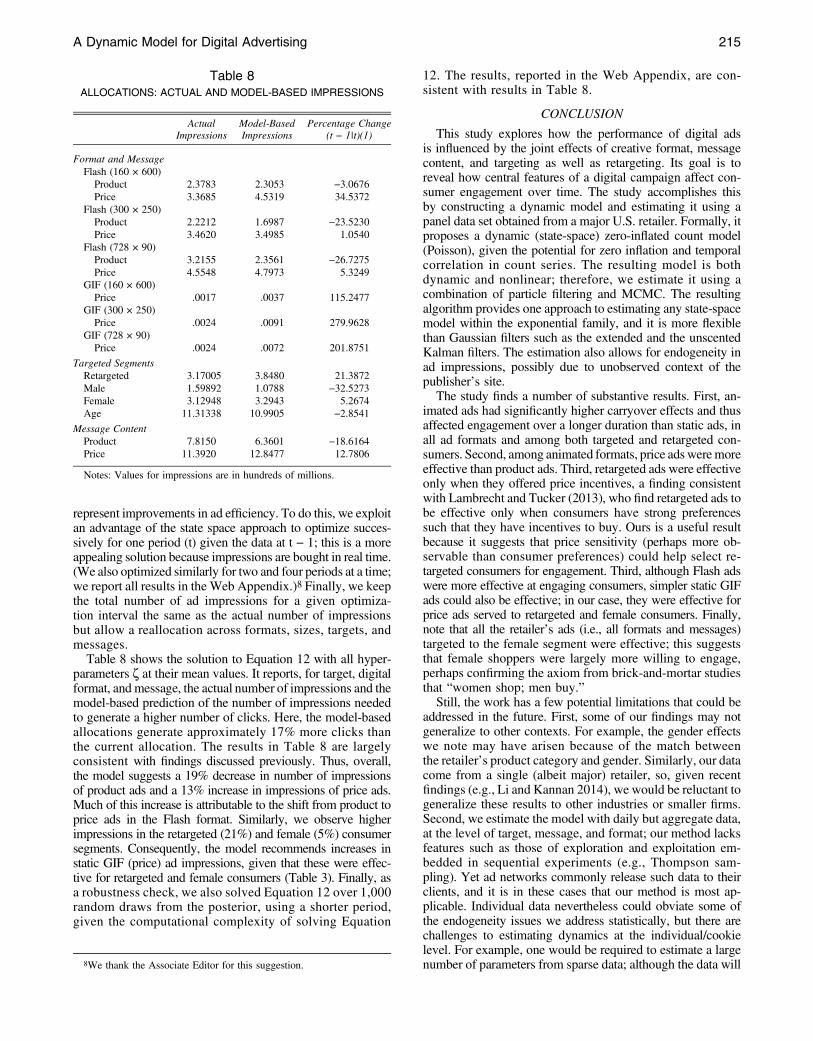
represent improvements in ad efficiency. To do this, we exploitan advantage of the state space approach to optimize succes-sively for one period (t) given the data at t − 1; this is a moreappealing solution because impressions are bought in real time.(We also optimized similarly for two and four periods at a time;we report all results in the Web Appendix.)8 Finally, we keepthe total number of ad impressions for a given optimiza-tion interval the same as the actual number of impressionsbut allow a reallocation across formats, sizes, targets, andmessages.
Table 8 shows the solution to Equation 12 with all hyper-parameters z at their mean values. It reports, for target, digitalformat, and message, the actual number of impressions and themodel-based prediction of the number of impressions neededto generate a higher number of clicks. Here, the model-basedallocations generate approximately 17% more clicks thanthe current allocation. The results in Table 8 are largelyconsistent with findings discussed previously. Thus, overall,the model suggests a 19% decrease in number of impressionsof product ads and a 13% increase in impressions of price ads.Much of this increase is attributable to the shift from product toprice ads in the Flash format. Similarly, we observe higherimpressions in the retargeted (21%) and female (5%) consumersegments. Consequently, the model recommends increases instatic GIF (price) ad impressions, given that these were effec-tive for retargeted and female consumers (Table 3). Finally, asa robustness check, we also solved Equation 12 over 1,000random draws from the posterior, using a shorter period,given the computational complexity of solving Equation
12. The results, reported in the Web Appendix, are con-sistent with results in Table 8.
CONCLUSION
This study explores how the performance of digital adsis influenced by the joint effects of creative format, messagecontent, and targeting as well as retargeting. Its goal is toreveal how central features of a digital campaign affect con-sumer engagement over time. The study accomplishes thisby constructing a dynamic model and estimating it using apanel data set obtained from a major U.S. retailer. Formally, itproposes a dynamic (state-space) zero-inflated count model(Poisson), given the potential for zero inflation and temporalcorrelation in count series. The resulting model is bothdynamic and nonlinear; therefore, we estimate it using acombination of particle filtering and MCMC. The resultingalgorithm provides one approach to estimating any state-spacemodel within the exponential family, and it is more flexiblethan Gaussian filters such as the extended and the unscentedKalman filters. The estimation also allows for endogeneity inad impressions, possibly due to unobserved context of thepublisher’s site.
The study finds a number of substantive results. First, an-imated ads had significantly higher carryover effects and thusaffected engagement over a longer duration than static ads, inall ad formats and among both targeted and retargeted con-sumers. Second, among animated formats, price adsweremoreeffective than product ads. Third, retargeted ads were effectiveonly when they offered price incentives, a finding consistentwith Lambrecht and Tucker (2013), who find retargeted ads tobe effective only when consumers have strong preferencessuch that they have incentives to buy. Ours is a useful resultbecause it suggests that price sensitivity (perhaps more ob-servable than consumer preferences) could help select re-targeted consumers for engagement. Third, although Flash adswere more effective at engaging consumers, simpler static GIFads could also be effective; in our case, they were effective forprice ads served to retargeted and female consumers. Finally,note that all the retailer’s ads (i.e., all formats and messages)targeted to the female segment were effective; this suggeststhat female shoppers were largely more willing to engage,perhaps confirming the axiom from brick-and-mortar studiesthat “women shop; men buy.”
Still, the work has a few potential limitations that could beaddressed in the future. First, some of our findings may notgeneralize to other contexts. For example, the gender effectswe note may have arisen because of the match betweenthe retailer’s product category and gender. Similarly, our datacome from a single (albeit major) retailer, so, given recentfindings (e.g., Li and Kannan 2014), we would be reluctant togeneralize these results to other industries or smaller firms.Second, we estimate the model with daily but aggregate data,at the level of target, message, and format; our method lacksfeatures such as those of exploration and exploitation em-bedded in sequential experiments (e.g., Thompson sam-pling). Yet ad networks commonly release such data to theirclients, and it is in these cases that our method is most ap-plicable. Individual data nevertheless could obviate some ofthe endogeneity issues we address statistically, but there arechallenges to estimating dynamics at the individual/cookielevel. For example, one would be required to estimate a largenumber of parameters from sparse data; although the data will
Table 8ALLOCATIONS: ACTUAL AND MODEL-BASED IMPRESSIONS
ActualImpressions
Model-BasedImpressions
Percentage Change(t − 1|t)(1)
Format and MessageFlash (160 × 600)
Product 2.3783 2.3053 −3.0676Price 3.3685 4.5319 34.5372
Flash (300 × 250)Product 2.2212 1.6987 −23.5230Price 3.4620 3.4985 1.0540
Flash (728 × 90)Product 3.2155 2.3561 −26.7275Price 4.5548 4.7973 5.3249
GIF (160 × 600)Price .0017 .0037 115.2477
GIF (300 × 250)Price .0024 .0091 279.9628
GIF (728 × 90)Price .0024 .0072 201.8751
Targeted SegmentsRetargeted 3.17005 3.8480 21.3872Male 1.59892 1.0788 −32.5273Female 3.12948 3.2943 5.2674Age 11.31338 10.9905 −2.8541
Message ContentProduct 7.8150 6.3601 −18.6164Price 11.3920 12.8477 12.7806
Notes: Values for impressions are in hundreds of millions.
8We thank the Associate Editor for this suggestion.
A Dynamic Model for Digital Advertising 215
containmany individuals, many of these will be unique or one-time visitors. To address this sparseness problem, one couldperhaps build a hierarchical dynamic model using demo-graphics and retargeting data (Agarwal 2010) to definesegment-level distributions from which individual behaviorcould arise. Notably, in this case, the substantive parameterswould again be at the segment level. Finally, although ourmodel fits the data satisfactorily, another potential criticism,given the full Bayesian approach, is that we adopt standardparametric assumptions for all model components, for ex-ample, normal random noise in the state equation (Equation 5).To mitigate this criticism, one could model errors as Gaussianmixtures or take a fully Bayesian nonparametric approach inwhich the distributions of the errors are themselves unknownand treated as objects to be estimated (Hjort et al. 2010; Phadia2013). Again, a nonparametric approach could be more feasibleat the segment level, given data sparseness at the cookie level.
APPENDIX: OVERVIEW OF MCMC ALGORITHM
This appendix provides an overview of the MCMC algo-rithm we employ to recover both time-varying ðgt, qtÞ andfixed parameters z: Recall, our main task is to estimate ajoint conditional posterior pðqt, gtjyt,mt, zÞ that includes bothlinear and nonlinear time-varying components. It is easierto obtain this posterior from conditionals pðqtj, g,mt, zÞ andpðgtj, yt, zÞ. That is, we sample the first conditional with theKalman filter because its state vectors, the measurement pa-rameters q0:T = fqtgTt=1, are linear, and the second with theparticle filter because its state vectors are the nonlineargoodwill vectors g0:T = fgtgTt=1. (Note that for simplicity, wewill suppress the target index, k.)
1.0. Sampling pðutjgt ,mt , §ÞFirst, conditional on g1:T, it is straightforward to sample theposterior pðqtjgt,mt, xÞ. To see this, note that for any gt =fg11t, g12t, :::, gIJtg, we can rewrite Equations 5–7 as the fol-lowing system:
mijt = Fqijt + Lvijt,(A1)
where F =
266664bij1 bij2 / bij1 0 / 00 1 0 0« 0 1 «0 / / 1
377775L =
2666641 bij1 bij2 / bij0 1 0 / 00 0 1 0 0« « 0 1 «0 0 / / 1
377775,
mijt =hgijt − dijgijt−1 − ai − sj − b0ijhijZijt,mijt − hijZijt
i0, and
vijt =hvgijt, v
mijt
i0;
qijt = Bijqijt−1 + vqijt, with(A2)
vqijt ~ N�0,Sij
�, vijt =
hvgijt, v
mijt
i0, vijt ~ N
�0,Hij
�, and
Hij =
"w2ij S0ij
Sij Wij
#:
Thus, Equations A1–A2 constitute a linear state-space modelwith respect to qijt, and so we sample pðqtj, g,mt, zÞ usingKalman filter/MCMC ideas (for details, see Bass et al. 2007).
2.0. Sampling pðgt , jyt , zÞThe posterior pðgtjyt, zÞ is, however, nonlinear in the goodwillstate vector gt because the observation Equation 1 is nonlinear/non-Gaussian and is thus sampled using particle filters. Thebasic procedure, based on sequential importance sampling,a Monte Carlo integration method (see, e.g., Bruce 2008;Geweke 1989), provides a discrete approximation to the post-erior density of the states through a set of support Ns points (orparticles)fgn0:tgNs
n=1, and their respective weights, fwn0:tgNs
n=1,wherewn
t > 0 and�Nsn=1 w
nt = 1. Unfortunately, the optimal im-
portance function pðgtjgt−1, ytÞ is unavailable here because ofthe zero-inflated Poisson assumption; however, we obtain alinear/normal approximation ~qðgt−1jgt−1, ytÞ with a Newton–Raphson step (see the Web Appendix).
2.1. Simulation for g0:TForward filtering algorithm (sampling importance resampling).
1. For n = 1, :::, Ns, sample gn0 ~ pðg0Þ, wn0 = −1=Ns. Set t→1.
2. For n = 1, :::, Ns, sample gnt ~ ~qðgtjgt−1, ytÞ from the approx-imate optimal importance function obtained via Newton–Raphson as just described.
3. For n = 1, ::, Ns, update weights:wn
t = wnt−1pðytjgnt Þpðgnt
��gnt−1Þ=~qðgnt ��gnt−1, ytÞ, and normalizethem: wn
t →wnt =�
Nsl=1 w
lt. pð:Þ and p(.) are likelihood and
goodwill state equations, respectively.4. If Neff < :8Ns, resample with replacement from the setfgnt gNs
n=1, wherewnt is the probability of resampling the state gnt .
Reset the weights wnt = 1=Ns.
5. Set t→t + 1, and repeat Step 2 until end of time period (T).Filtered estimates of the full posterior are obtained fromfgn0:T,wn
0:TgNsn=1.
Backward sampling algorithm (see Godsill, Doucet, and West2004).
1. Choose gT = gnT with probability wnT.
2. For t = T − 1 to 1,• calculate wn
tjt + 1}wnt fðgt+1
��gnt Þ for each n = 1, :::, Ns;• gt = gnt with probability wn
tjt + 1.3. The results are draws g1:T = fg1, g2, :::, gTg from the fullconditional posterior, pðg0:Tjy1:T, xÞ (for more details, seeBruce 2008).
2.2. Samplingð§jgt , ut ,mtÞGiven draws for the state vectors gt = fg11t, g12t, :::, gIJtg andqt = fq11t, q12t, :::, qIJtg, one can sample the fixed parametersz = fz1, z2g using basic MCMC ideas. For example, let§1 = fsj,aj, dij,bijg be the vector of fixed parameters definedin the state Equation 5, and let §2 = fhij, Bijg be those de-fined in the measurement Equations 6–7, chosen to haveindependent normal priors. Assume also that the priors onthe system and observation variances A2 = f�ij,Hijg in themeasurement model are each independent inverse Wisharts,with all priors chosen to be vague. The joint distributionpð§2, A2jm1:T, g1:T, q0:TÞ is thus readily simulated via a setof normal and inverse Wishart conditionals (Gamerman 1997;Rossi, Allenby, and McCulloch 2005). Finally, with con-ditional distribution pðvgijt
��vmijtÞ derived from measurementmodel, one can similarly sample conditional posteriors andpð§1j:g0:T,HÞ.
216 JOURNAL OF MARKETING RESEARCH, APRIL 2017
REFERENCES
Agarwal, Deepak (2010), “‘A Modern Bayesian Look at the Multi-Armed Bandit’ by Steven Scott: Discussion,” Applied StochasticModels in Business and Industry, 26 (6), 639–58.
Baltas, George (2003), “Determinants of Internet AdvertisingEffectiveness: An Empirical Study,” International Journal ofMarket Research, 45 (4), 505–13.
Bass, Frank, Norris Bruce, Sumit Majumdar, and B.P.S. Murthi(2007), “Wearout Effects of Different Advertising Themes: ADynamic Bayesian Model of Advertising-Sales Relationship,”Marketing Science, 26 (2), 179–95.
Berkowitz, David, Arthur Allaway, and Giles D’Souza (2001),“Estimating Differential Lag Effects for Multiple Media AcrossMultiple Stores,” Journal of Advertising, 30 (4), 59–65.
Braun, Michael, and Wendy Moe (2013), “Online Display Ad-vertising: Modeling the Effects of Multiple Creatives and Indi-vidual Impression Histories,”Marketing Science, 32 (5), 753–67.
Breuer, Ralph, Malte Brettel, and Andreas Engelen (2011), “In-corporating Long-Term Effects in Determining the Effectivenessof Different Types of Online Advertising,” Marketing Letters,22 (4), 327–40.
Briggs, Rex, and Nigel Hollis (1997), “Advertising on the Web: IsThere Any Response Before Clickthrough?” Journal of Adver-tising Research, 37 (2), 33–46.
Bruce, Norris (2008), “Pooling and Dynamic Forgetting Effects inMulti-Theme Advertising: Tracking the Ad Sales Relationshipwith Particle Filters,” Marketing Science, 27 (4), 659–73.
Carter, C., and R. Kohn (1994), “OnGibbs Sampling for State SpaceModels,” Biometrika, 81 (3), 541–53.
Chandon, Jean-Louis, Mohamed Saber Chtourou, and David R.Fortin (2003), “Effects of Configuration and Exposure Levelson Responses to Web Advertisements,” Journal of AdvertisingResearch, 34 (3), 217–29.
Chandy, Rajesh K., Gerard J. Tellis, Deborah J. MacInnis, andPattana Thaivanich (2001), “What to Say When: AdvertisingAppeals in Evolving Markets,” Journal of Marketing Research,38 (November), 399–414.
Chatterjee, Patrali (2008), “Are Unclicked Ads Wasted? EnduringEffects of Banner and Pop-Up Ad Exposures on Brand Memoryand Attitudes,” Journal of Electronic Commerce Research, 9 (1),51–61.
Chatterjee, Patrali, Donna L. Hoffman, and Thomas P. Novak(2003), “Modeling the Clickstream: Implications for Web-BasedAdvertising Efforts,” Marketing Science, 22 (4), 520–41.
Cho, Chang-Hoan (1999), “How Advertising Works on the WWW:Modified Elaboration Likelihood Model,” Journal of CurrentResearch in Advertising, 27 (1), 33–50.
Cho, Chang-Hoan (2003), “The Effectiveness of Banner Adver-tisements: Involvement and Click-Through,” Journalism & MassCommunication Quarterly, 80 (3), 623–45.
Cho, Chang-Hoan, Jung-Gyo Lee, and Marye Tharp (2001),“Different Forced Exposure Levels to Banner Advertisements,”Journal of Advertising Research, 41 (4), 45–56.
Chtourou, Mohamed Saber, and Jean-Louis Chandon (2000),“Impact of Motion, Picture, and Size on Recall and Word ofMouth for Internet Banners,” INFORMS Internet and MarketingScience Conference (May), University of Southern California.
Chtourou, Mohamed Saber, Jean-Louis Chandon, and MoniqueZollinger (2002), “Effect of Price Information and Promotionon Click-Through Rates for Internet Banners,” Journal of Euro-marketing, 11 (2), 23–40.
Clarke, Darell G. (1976), “Econometric Measurement of the Du-ration of Advertising Effect on Sales,” Journal of MarketingResearch, 13 (November), 345–57.
Cole, Sally G., Leah Spalding, and Amy Fayer (2009), “The BrandValue of Rich Media and Video Ads,” DoubleClick researchreport (accessed April 16, 2013), http://static.googleusercontent.com/media/www.google.com/en/us/doubleclick/pdfs/DoubleClick-06-2009-The-Brand-Value-of-Rich-Media-and-Video-Ads.pdf.
Dahlen, Michael (2001), “Banner Advertisements Through a NewLens,” Journal of Advertising Research, 41 (4), 23–30.
Danaher, Peter J. (2007), “Modeling Page Views Across MultipleWebsites with an Application to Internet Reach and FrequencyPrediction,” Marketing Science, 26 (3), 422–37.
Danaher, Peter J., Janghyuk Lee, and Laoucine Kerbache (2010),“Optimal Internet Media Selection,” Marketing Science, 29 (2),336–47.
Deighton, John, Caroline Henderson, and Scott A. Neslin (1994),“The Effects of Advertising on Brand Switching and RepeatPurchasing,” Journal of Marketing Research, 31 (February),28–43.
DoubleClick (2009), “2009 Year-in-Review Benchmarks,” (accessedApril 16, 2013), https://static.googleusercontent.com/media/www.google.com/en//doubleclick/pdfs/DoubleClick-07-2010-DoubleClick-Benchmarks-Report-2009-Year-in-Review-US.pdf.
Doucet, Arnaud, Nando de Freitas, and Neil Gordon, eds. (2001),SequentialMonte CarloMethods in Practice. New York: Springer.
Doucet, Arnaud, Simon Godsill, and Christophe Andrieu (2000),“On Sequential Monte Carlo Sampling Methods for BayesianFiltering,” Statistics and Computing, 10 (3), 197–208.
Dreze, Xavier, and François-Xavier Hussherr (2003), “InternetAdvertising: Is Anybody Watching?” Journal of InteractiveAdvertising, 17 (4), 8–23.
D’Souza, Giles, and Ram C. Rao (1995), “Can Repeating an Ad-vertisement More Frequently Than the Competition Affect BrandPreference in a Mature Market?” Journal of Marketing, 59 (April),32–42.
Fruhwirth-Schnatter, Sylvia (1994), “Data Augmentation and Dy-namic Linear Models,” Time Series Analysis, 15 (2), 183–202.
Gamerman, Dani (1997), Markov Chain Monte Carlo: StochasticSimulation for Bayesian Inference. London: Chapman and Hall,124–32.
Geweke, John (1989), “Bayesian Inference in Econometric ModelsUsing Monte Carlo Integration,” Econometrica, 57 (6), 1317–39.
Godsill, Simon, Arnaud Doucet, and Mike West (2004), “MonteCarlo Smoothing for Nonlinear Time Series,” Journal of Sta-tistical Association, 99 (465), 156–68.
Grass, Robert, and W.H. Wallace (1969), “Satiation Effects of TVCommercials,” Journal of Advertising Research, 9 (3), 3–8.
Greene, William H. (1994), “Accounting for Excess Zeros andSample Selection in Poisson and Negative Binomial RegressionModels,” Working Paper EC-94-10, Department of Economics,New York University.
Hjort, Nils L., Chris Holmes, Peter Muller, and Stephen E. Walker,eds. (2010), Bayesian Nonparametrics. Cambridge, UK: Cam-bridge University Press.
Hoch, Stephen J., and Young-Won Ha (1986), “Consumer Learn-ing: Advertising and the Ambiguity of Product Experience,”Journal of Consumer Research, 13 (2), 221–33.
Hong, Weiyin, James Y.L. Thong, and Kar Yan Tam (2007), “HowDo Web Users Respond to Non-Banner-Ads Animation? TheEffects of Task Type and User Experience,” Journal of theAmerican Society for Information Science and Technology,58 (10), 1467–82.
Hupfer, Maureen E., and Alex Grey (2005), “Getting Somethingfor Nothing: The Impact of a Sample Offer and User Modeon Banner Ad Response,” Journal of Interactive Advertising,6 (1), 105–17.
A Dynamic Model for Digital Advertising 217

Lambert, Diane (1992), “Zero-Inflated Poisson Regression, with anApplication to Defects in Manufacturing,” Technometrics, 34 (1),1–14.
Lambrecht, Anja, and Catherine Tucker (2013), “When DoesRetargeting Work? Information Specificity in Online Advertis-ing,” Journal of Marketing Research, 50 (October), 561–76.
Lee, Dokyun, Kartik Hosanagar, and Harikesh S. Nair (2015),“Advertising Content and Consumer Engagement on SocialMedia: Evidence from Facebook,” working paper, WhartonSchool of Business, University of Pennsylvania.
Li, Hairong, and Janice L. Bukovac (1999), “Cognitive Impact ofBanner Ad Characteristics: An Experimental Study,” Journalism& Mass Communication Quarterly, 76 (Summer), 341–53.
Li, Hongshuang (Alice), and P.K. Kannan (2014), “AttributingConversions in a Multichannel Online Marketing Environment:An Empirical Model and a Field Experiment,” Journal of Mar-keting Research, 51 (February), 40–56.
Liu, Jun S., and Rong Chen (1998), “Sequential Monte CarloMethods for Dynamic Systems,” Journal of the American Sta-tistical Association, 93 (443), 1032–43.
Lohtia, Ritu, Naveen Donthu, and Edmund K. Hershberger (2003),“The Impact of Content and Design Elements on Banner Ad-vertising Click-Through Rates,” Journal of Advertising Research,43 (4), 410–18.
Lopes, Herbert F., Carlos M. Carvalho, Michael S. Johannes, andNicholas G. Polson (2010), “Particle Learning for SequentialBayesian Computation,” in Bayesian Statistics 9, J. Bernardo, M.Bayarr, J. Berger, A. Dawid, D. Heckerman, A. Smith, et al., eds.New York: Oxford University Press.
MacInnis, Deborah J., Ambar Rao, and Allen Weiss (2002), “Assess-ing When Increased Media Weight of Real-World AdvertisementsHelps Sales,” Journal of Marketing Research, 39 (November),391–407.
McConnell, Ted (2012), “How Blank Display Ads Managed to TotUp Some Impressive Numbers,” Advertising Age (July 23), http://adage.com/article/digital/incredible-click-rate/236233.
Naik, PrasadA.,MuraliMantrala, andAlan Sawyer (1998), “PlanningMedia Schedules in the Presence ofDynamicAdvertisingQuality,”Marketing Science, 17 (3), 214–35.
Naik, Prasad A., and Kalyan Raman (2003), “Understanding theImpact of Synergy in Multimedia Communications,” Journal ofMarketing Research, 40 (November), 375–88.
Naik, Prasad A., and Chih-Ling Tsai (2000), “Controlling Mea-surement Errors in Models of Advertising Competition,” Journalof Marketing Research, 37 (February), 113–24.
Nerlove, Marc, and Kenneth Arrow (1962), “Optimal AdvertisingPolicy Under Dynamic Conditions,” Economica, 29 (May),129–42.
O’Hara, R., and J. Kotze (2010), “Do Not Log Transform CountData,” Methods in Ecology and Evolution, 1 (2), 118–22.
Passyn, Kirsten A., Memo Diriker, and Robert B. Settle (2011),“Images of Online Versus Store Shopping: Have the Attitudes ofMen and Women, Young and Old Really Changed?” Journal ofBusiness & Economics Research, 9 (1), 99–110.
Phadia, Eswar G. (2013), Prior Processes and Their Applications:Nonparametric Bayesian Inference. New York: Springer.
Rettie, Ruth, Ursula Grandcolas, and Charles McNeil (2004), “PostImpressions: Internet Advertising Without Click-Through,”paper presented at Academy of Marketing Annual Conference
2004, Cheltenham, U.K., http://eprints.kingston.ac.uk/2104/1/Post_Impressions_Internet_Advertising_without_Click-Through.pdf.
Ristic, Branko, Sanjeev Arulampalam, and Neil Gordon (2004),Beyond the Kalman Filter: Particle Filters for Tracking Appli-cations. Boston: Artech House.
Robinson, Helen, Anna Wusocka, and Chris Hand (2007), “InternetAdvertising Effectiveness: The Effect of Design on Click-Through Rates for Banner Ads,” International Journal of Ad-vertising, 26 (4), 527–41.
Rossi, Peter, Greg Allenby, and Rob McCulloch (2005), BayesianStatistics and Marketing. Hoboken, NJ: John Wiley & Sons.
Rust, Roland T., and Robert P. Leone (1984), “The Mixed-MediaDirichlet Multinomial Distribution: A Model for EvaluatingTelevision-Magazine Advertising Schedules,” Journal of Mar-keting Research, 21 (February), 89–99.
Schumann, David W., and D. Scott Clemons (1989), “TheRepetition/Variation Hypothesis: Conceptual and MethodologicalIssues,” in Advances in Consumer Research, Vol. 16, Thomas K.Srull, ed. Provo, UT: Association for Consumer Research,529–34.
Schwartz, Eric M., Eric T. Bradlow, and Peter S. Fader (2016),“Customer Acquisition via Display Advertising Using Multi-Armed Bandit Experiments,” working paper, DOI: http://dx.doi.org/10.2139/ssrn.2368523.
Scott, Steven (2010), “AModern Bayesian Look at theMulti-ArmedBandit,” Applied Stochastic Models in Business and Industry,26 (6), 639–58.
Sethuraman, Raj, Gerard J. Tellis, and Richard Briesch (2011),“How Well Does Advertising Work? Generalizations froma Meta-Analysis of Brand Advertising Elasticity,” Journal ofMarketing Research, 48 (June), 457–71.
Sherman, L., and J. Deighton (2001), “Banner Advertising: Mea-suring Effectiveness and Optimizing Placement,” Journal ofInteractive Marketing, 15 (2), 60–64.
Sonnier, Garret P., Oliver Rutz, and Leigh McAlister (2011), “ADynamic Model of the Effect of Online Communications on FirmSales,” Marketing Science, 30 (4), 702–16.
Spiegelhalter, David, N.G. Best, B.P. Carlin, andA.V. Linde (2002),“Bayesian Measures of Model Complexity and Fit,” Journalof the Royal Statistical Society B: Methodological, 64 (4),583–639.
Tellis, Gerard J., Rajesh Chandy, and Pattana Thaivanich (2000),“Decomposing the Effects of Direct Advertising: Which BrandWorks, When, Where, and How Long?” Journal of MarketingResearch, 37 (February), 32–46.
Tsang, P.M., and S. Tse (2005), “A Hedonic Model for EffectiveWeb Marketing: An Empirical Examination,” Industrial Man-agement & Data Systems, 105 (8), 1039–52.
Tuten, Tracy L., Michael Bosnjak, and Wolfgang Bandilla (2000),“Banner-Advertised Web Surveys,”Marketing Research, 11 (4),17–21.
Wedel, Michel, and Rik Pieters (2008), “Informativeness of EyeMovements for Visual Attention: Six Cornerstones,” in VisualMarketing: From Attention to Action, Michel Wedel and RikPieters, eds. New York: Lawrence Erlbaum Associates, 43–71.
Xie, Tian (Frank), Naveen Donthu, Ritu Lohtia, and TalaiOsmonbekov (2004), “Emotional Appeal and Incentive Offering inBanner Advertisements,” Journal of Interactive Advertising, 4 (2),30–37.
218 JOURNAL OF MARKETING RESEARCH, APRIL 2017