Embed Size (px)
Citation preview

OISD Technology Department of Architecture, School of the Built Environment, Oxford Brookes University, Gipsy Lane Campus Oxford OX3 0BP
Phone: +44 (0) 1865 483208, Fax +44 (0) 1865 483298, Email [email protected] http://www.brookes.ac.uk/schools/be/oisd/act/technology/index.html!
Report 090110BRE
A dynamic thermal modelling study of a typical metal clad building to evaluate
overheating in the UK
Clients
Metal Cladding and Roofing Manufacturers Association (MCRMA) and National Association of
Rooflight Manufacturers (NARM)
Oxford 10th January 2009
Authors
Chris Kendrick and Shaun Wang
Modern methods of construction and prefabrication Sustainable building design Construction and life cycle costing Steel, concrete, timber, masonry and glass construction Construction design guidance and regulation Building physics including: thermal, acoustic, structural and airtightness testing and analysis Building envelope systems Product and systems development CAD and computer modeling Contact: Prof. Ray Ogden

1
Summary A typical modern portal frame warehouse building with in-plane GRP rooflights was modelled using Tas and Lumen Designer software to assess annual heating loads and summertime thermal comfort in the south of the UK. The effects of rooflight area, ventilation strategy and stratification were assessed. Various combinations of ventilation strategy to reduce internal temperatures in the summer were investigated, including natural ventilation through cargo doors and/or ridge vents, and mechanical ventilation. The effect of ventilation was found to be critical, and by far the greatest effect on overheating risk. The ‘base case’ building incorporated 10% rooflights; the effects of increasing rooflights to 14%, or eliminating rooflights were investigated. Use of daylight through rooflights offers major benefits to the internal environment within a metal clad building, as well as potential savings in energy use, running cost and CO2 emissions. Use of 14% rooflights reduces lighting load by approximately 40% from that of a portal frame building with no rooflights, whilst beneficial solar gain also counteract the additional heat losses from the rooflights, resulting in heating loads only marginally greater. It was found that total CO2 emissions (heating and lighting) are reduced by 30% (14% rooflights) when rooflights are used with dimmable lighting because the saving in lighting electricity far outweighs the additional heating. However, the daylighting benefit is at the expense of some increase in summertime overheating risk. Stratification was investigated by assessing temperature on an imaginary mezzanine floor. Temperatures were found to be lower at floor level than at high level, but not to a high extent. It was found that overheating occurred for the unventilated base case. However, introduction of some natural ventilation just by opening cargo doors and personnel doors was sufficient to avoid overheating, with temperatures kept down to acceptable levels (less than 1% of occupied hours above 28°C) at ground level. It was found that rooflight area had some effect on overheating risk: eliminating rooflights reduces risk of overheating (although not a viable solution to most practical cases) whilst increasing rooflight area from 10% to 14% did show an increase in internal temperatures. However, this was a secondary effect in comparison to ventilation strategy, which had a far greater effect; a well ventilated building with good daylighting through 10-14% rooflights had lower risk of overheating than a non-ventilated building without rooflights. Introduction of ventilation by leaving cargo doors open was found to have a significant effect on internal temperatures. Ridge vents had less effect on their own but offered more benefit when used with open cargo doors to allow increased throughput of air. Ridge vents that were left open at night had some effect, although this was minimal. Mechanical ventilation was found to offer some benefit, although less effective than cargo doors in conjunction with ridge vents, whilst plant size and consequent energy consumption is a deterrent to its use in practice. The Building Regulations Solar Overheating criterion was investigated. ADL2 suggests total internal gains should not exceed 35W/m2K when averaged over a specified period. Application of the approximate method in CIBSE TM37 (Design for Improved Solar Shading Control) indicated that this figure is not exceeded for a metal clad building with either 10% or 14% rooflights. The Tas modelling results agree closely. However, buildings with higher internal loads, such as retail display lighting and/or much higher occupancy levels, can give risk of overheating unless alternative precautions are taken.

2
Introduction The objective of this study was to better understand the extent of overheating likely with current metal clad portal frame buildings when rooflights are used. In particular, the temperature at different levels due to stratification within the occupied space needs to be determined. Various mitigation strategies will also be investigated using natural/mechanical ventilation at high and low level. 1. The Model: Weather, geometry and internal conditions 1.1 Weather/Location The building is located in Southern England, so that CIBSE Design Summer Year (London DSY) weather file is used for thermal modelling. 1.2. Geometry The building has two bays, each with a 6° duopitch roof, and is 60m in length, 40m in width and 7m height (floor to eave). There is an office area in one corner of the building with a floor area of 120m2 (6mx20m) with two storeys (floor height is 3m each). Two cases are modelled: 10% and 14% nominal rooflight area, which are detailed in the table below. A ‘frame’ (overlap with opaque cladding) of 12.75% area was assumed.
Case Nominal Glazing Glazing dimensions (m2)
Number of rooflights
1 10% 8.75% 4.5m×0.925m 48 2 14% 12.25% 6.3m×0.925m 48
Table 1. Rooflight dimensions Including frames, the total rooflight area for 10% case is 227m2, for 14% case is 319m2. There are no rooflights on the roof of the office area. External surfaces are all goosewing (mid) grey.
Figure 1. 3-D model of the portal frame building
3
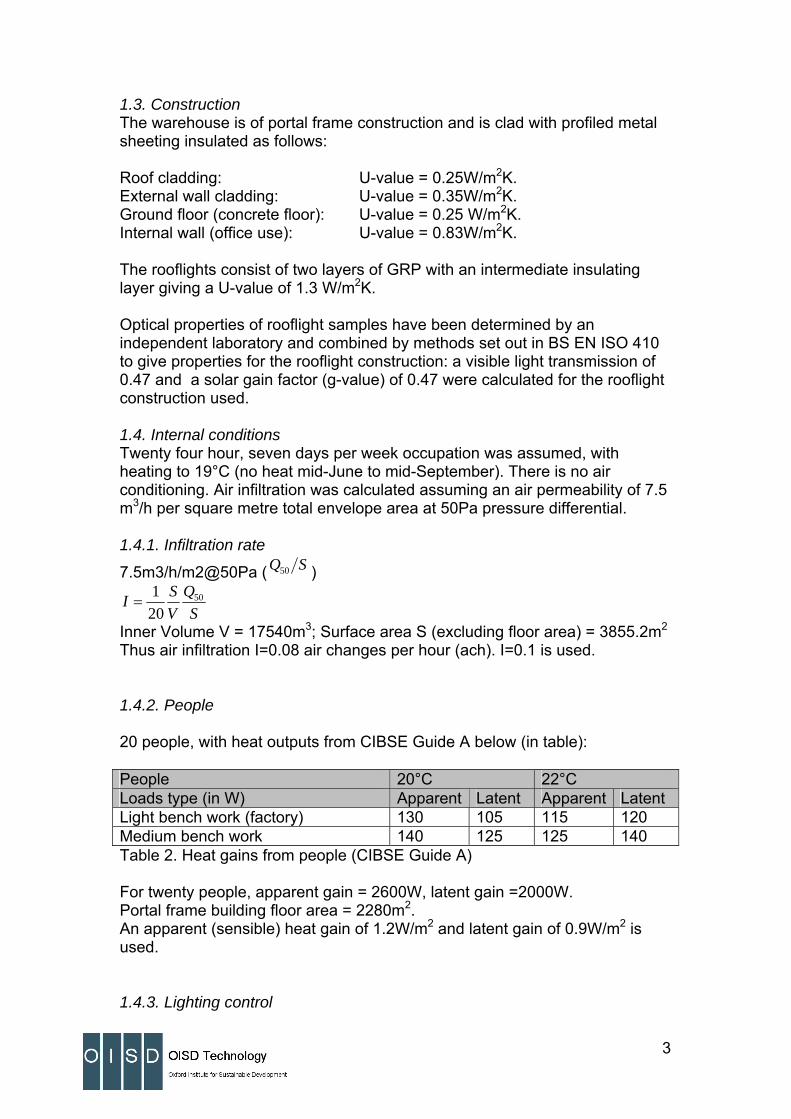
1.3. Construction The warehouse is of portal frame construction and is clad with profiled metal sheeting insulated as follows: Roof cladding: U-value = 0.25W/m2K. External wall cladding: U-value = 0.35W/m2K. Ground floor (concrete floor): U-value = 0.25 W/m2K. Internal wall (office use): U-value = 0.83W/m2K. The rooflights consist of two layers of GRP with an intermediate insulating layer giving a U-value of 1.3 W/m2K. Optical properties of rooflight samples have been determined by an independent laboratory and combined by methods set out in BS EN ISO 410 to give properties for the rooflight construction: a visible light transmission of 0.47 and a solar gain factor (g-value) of 0.47 were calculated for the rooflight construction used. 1.4. Internal conditions Twenty four hour, seven days per week occupation was assumed, with heating to 19°C (no heat mid-June to mid-September). There is no air conditioning. Air infiltration was calculated assuming an air permeability of 7.5 m3/h per square metre total envelope area at 50Pa pressure differential. 1.4.1. Infiltration rate
7.5m3/h/m2@50Pa ( SQ50 )
SQ
VSI 50
201
=
Inner Volume V = 17540m3; Surface area S (excluding floor area) = 3855.2m2 Thus air infiltration I=0.08 air changes per hour (ach). I=0.1 is used. 1.4.2. People 20 people, with heat outputs from CIBSE Guide A below (in table): People 20°C 22°C Loads type (in W) Apparent Latent Apparent Latent Light bench work (factory) 130 105 115 120 Medium bench work 140 125 125 140 Table 2. Heat gains from people (CIBSE Guide A) For twenty people, apparent gain = 2600W, latent gain =2000W. Portal frame building floor area = 2280m2. An apparent (sensible) heat gain of 1.2W/m2 and latent gain of 0.9W/m2 is used. 1.4.3. Lighting control

4
Auto control/dimmed; Photocell control dimming; Maximum light gain: 5.6W/m2; Target Room Illuminance: 350lux. 2. Daylight modelling Lumen Designer was used to investigate the daylighting (illuminance distribution) on the floor. 2.1. Orientation of the building There was found to be little difference of average daylight factor across whole building area (excluding offices) between different orientations of the building because of the very shallow slope of the roof. Therefore, thermal modelling was based on the long axis running east-west. 2.2. Daylight modelling results
0-2 2-4 4-6 6-8 8-10 10-12 12-14 14-16 16-18
Figure 2. Left - Interior rendering by illuminance levels; Right -Daylight factor distribution on the floor (excluding the office at right bottom corner) Nominal rooflight percentage Average daylight factor (%) 14% 5.60 10% 3.41
Table 3. Daylight factor for different rooflight percentages 3. Thermal modelling

5
3.1. Method A dynamic thermal model was created using TAS software, integrating daylight analysis results from Lumen Designer. A daylight availability analysis enabled the extent of artificial lighting to be controlled automatically to maintain 350lux. With realistic levels of interior heat gains from people, lights and equipment, and with solar radiation accounted for, the temperatures can be determined throughout the year at ground and mezzanine floor level. Overheating is investigated by graphs showing percentage of temperature excess hours. Both mechanical ventilation and natural ventilation are investigated in this study. 3.2. Natural Ventilation Natural ventilation includes cargo doors and ridge vents and the combination of these two. The temperature for opening cargo doors is set to 20ºC. The dimensions of natural ventilation openings are summarised in the following table. Openings Area (m2) Percentage of wall/floor
area Cargo doors 49.3 3.52% (of wall) Personnel doors 10.8 0.77% (of wall) Ridge vents 40.0 1.67% (of floor) Table 4. Natural ventilation openings An additional natural ventilation scheme allowed for ridge vents opening on summer nights. 3.3. Mechanical ventilation Mechanical ventilation is set at 2.5ach, supplying outside air to the ground floor zone and exhausting from the roof zone.

6
4. Thermal modelling results for Case 1 (10% rooflights) 4.1. Summary of loads and CO2 emissions Table 5. Loads summary (kWh/m2 per year): 10% rooflights Heating Solar People/
Equipment Lighting
Base case 22.23 34.22 10.18 29.89Base case without rooflights 16.85 0.00 10.18 49.06Mechanical ventilation 22.32 34.22 10.18 29.89Natural ventilation (by cargo doors) 22.50 34.22 10.18 29.89Natural ventilation (by ridge openings) 22.57 34.22 10.18 29.89Natural ventilation (cargo doors + ridge openings) 22.69 34.22 10.18 29.89
Natural ventilation (cargo doors + ridge NIGHT) 22.70 34.22 10.18 29.89 Table 6. CO2 emissions (kg/m2 per year): 10% rooflights Heating Lighting Base case 5.39 13.21 Base case without rooflights 4.17 21.68 Mechanical ventilation 5.41 13.21 Natural ventilation (by cargo doors) 5.46 13.21 Natural ventilation (by ridge openings) 5.47 13.21 Natural ventilation (cargo doors + ridge openings) 5.50 13.21 Natural ventilation (cargo doors + ridge NIGHT openings) 5.51 13.21
4.2. Monthly loads
0.0
0.5
1.0
1.5
2.0
2.5
3.0
3.5
4.0
4.5
5.0
1 2 3 4 5 6 7 8 9 10 11 12
Month
Hea
ting
load
s (k
Wh/
m2 )
Base caseBase case without rooflightsMechanical ventilationNatural ventilation (by cargo doors)Natural ventilation (by ridge openings)Natural ventilation (cargo doors + ridge openings)Natural ventilation (cargo doors + ridge openings)
Figure 3.Monthly heating loads for different ventilation schemes: 10% rooflights

7
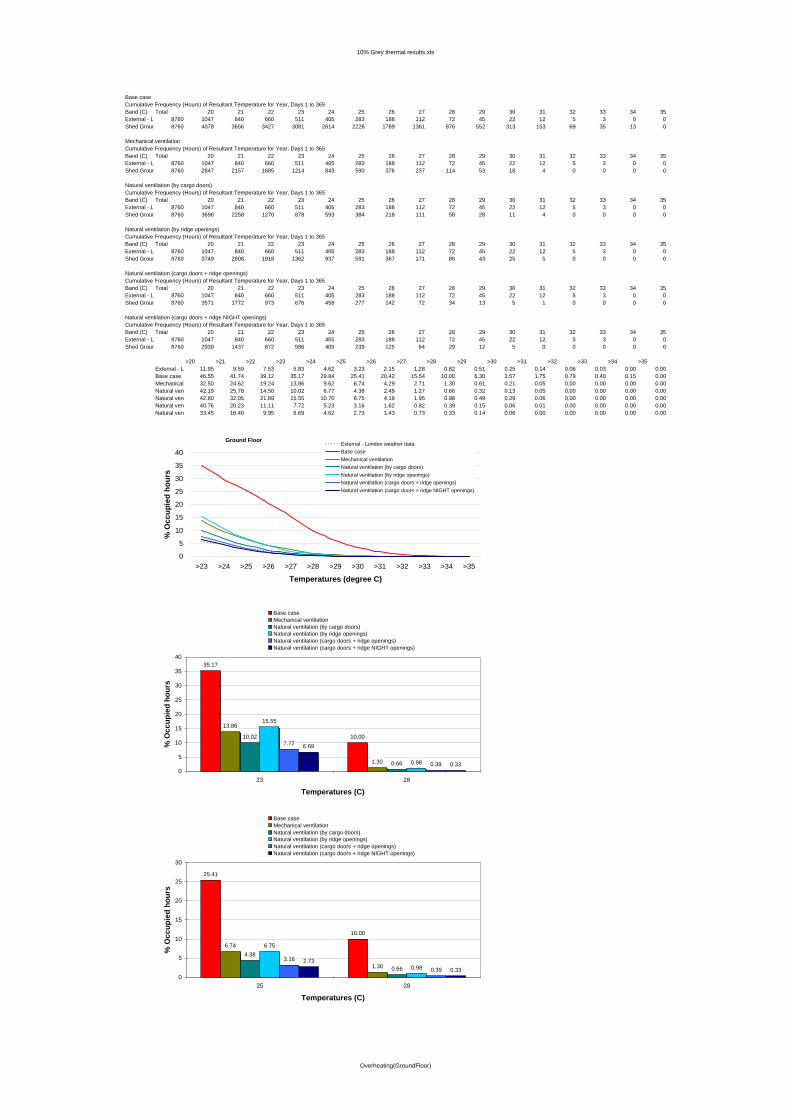
Ventilation scheme has little effect upon heating loads, and any variations can be ascribed to lack of optimisation of heating control (some heating may be applied at the same time as ventilation). 4.3. Overheating (ground floor)
Ground Floor
0
5
10
15
20
25
30
35
40
>23 >24 >25 >26 >27 >28 >29 >30 >31 >32 >33 >34 >35
Temperatures (degree C)
% O
ccup
ied
hour
s
External - London Weather DataBase caseBase case without rooflightsMechanical ventilationNatural ventilation (by cargo doors)Natural ventilation (by ridge openings)Natural ventilation (cargo doors + ridge openings)Natural ventilation (cargo doors + ridge NIGHT openings)
Figure 4. Ground floor overheating: 10% rooflights
35.17
10.00
27.29
0.95
13.86
1.30
10.02
0.66
15.55
0.98
7.72
0.39
6.69
0.330
5
10
15
20
25
30
35
40
23 28
Temperatures (C)
% O
ccup
ied
hour
s
Base caseBase case without rooflightsMechanical ventilationNatural ventilation (by cargo doors)Natural ventilation (by ridge openings)Natural ventilation (cargo doors + ridge openings)Natural ventilation (cargo doors + ridge NIGHT openings)
Figure 5. Percentage of occupied hours over certain temperatures: 10% rooflights

8
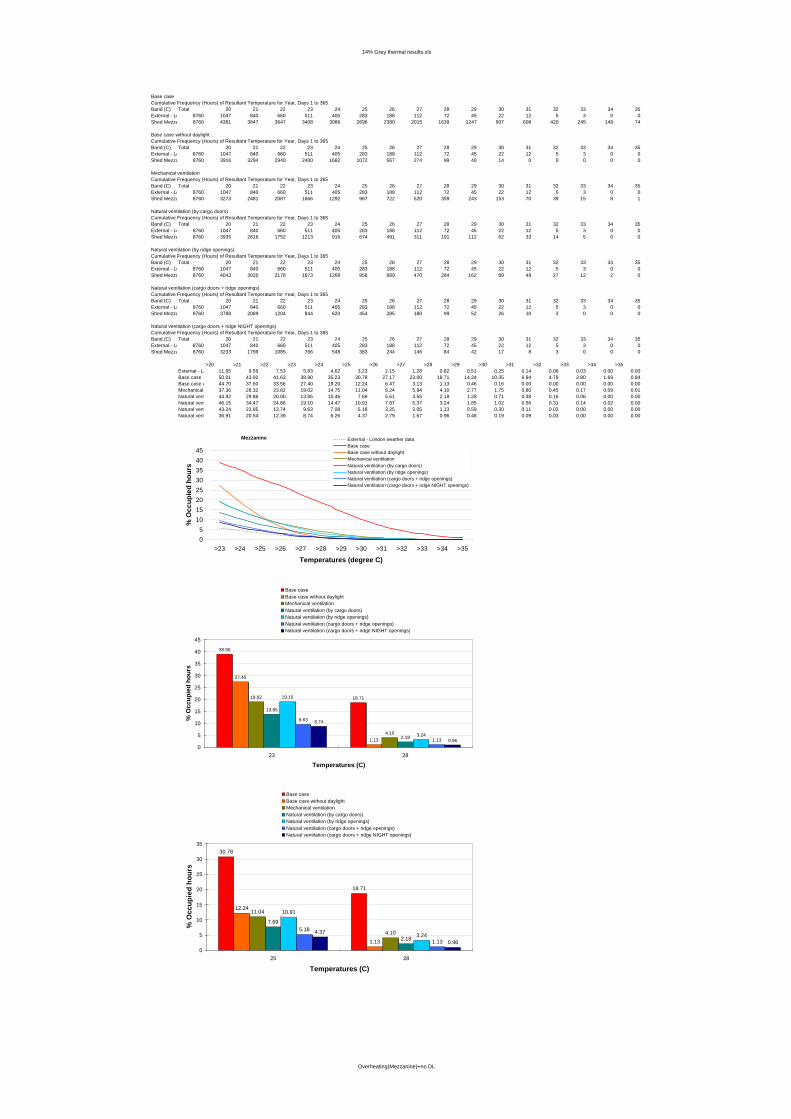
The base case shows significant risk of overheating when there is no ventilation. Elimination of rooflights does reduce the risk of overheating, although this would result in a significant increase in energy use, running costs and resultant CO2 emissions and would have a serious effect upon the internal environment for occupants. Introduction of natural ventilation through open cargo doors has a much greater effect and ensures lower risk of overheating. This example building with 10% rooflights would not exceed 28°C for more than 1% of occupied hours. Ridge vents are less effective on their own, but would also substantially decrease overheating risk. However, ridge vents in conjunction with cargo doors allows cross-flow ventilation and gives the best results. 4.4. Overheating (mezzanine) The effect of stratification was investigated by analysing temperatures at a notional mezzanine level.
Mezzanine
0
5
10
15
20
25
30
35
40
>23 >24 >25 >26 >27 >28 >29 >30 >31 >32 >33 >34 >35
Temperatures (degree C)
% O
ccup
ied
hour
s
External - London Weather DataBase caseBase case without rooflightsMechanical ventilationNatural ventilation (by cargo doors)Natural ventilation (by ridge openings)Natural ventilation (cargo doors + ridge openings)Natural ventilation (cargo doors + ridge NIGHT openings)
Figure 6. Mezzanine floor overheating: 10% rooflights

9
35.06
10.78
27.39
1.13
14.76
1.88
11.26
1.11
15.25
1.36
8.21
0.68
7.36
0.590
5
10
15
20
25
30
35
40
23 28
Temperatures (C)
% O
ccup
ied
hour
s
Base caseBase case without rooflightsMechanical ventilationNatural ventilation (by cargo doors)Natural ventilation (by ridge openings)Natural ventilation (cargo doors + ridge openings)Natural ventilation (cargo doors + ridge NIGHT openings)
Figure 7.Percentage of occupied hours over certain temperatures: 10% rooflights The mezzanine floor level is subject to higher temperatures than the ground floor, but thermal comfort remains close to an acceptable level.

10
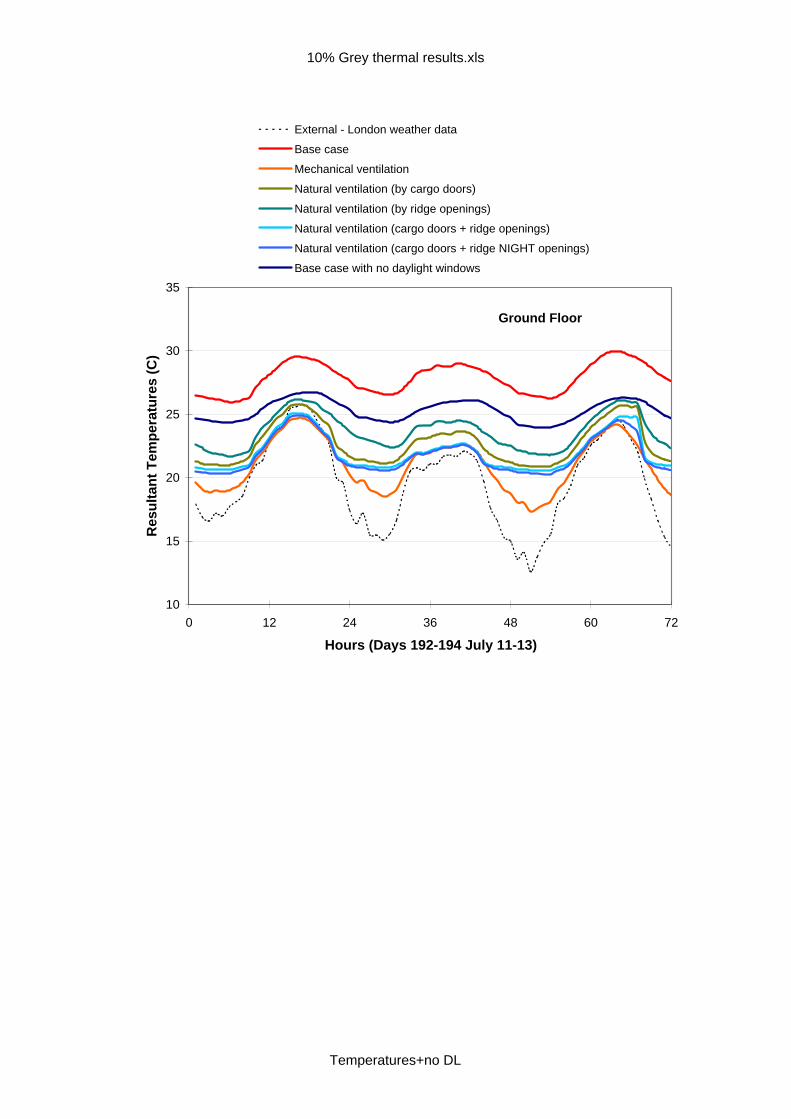
4.5. Temperatures for three warmest days
Ground Floor
10
15
20
25
30
35
0 12 24 36 48 60 72
Hours (Days 192-194 July 11-13)
Res
ulta
nt T
empe
ratu
res
(C)
London external
Base case
Mechanical ventilation
Natural ventilation (by cargo doors)
Natural ventilation (by ridge openings)
Natural ventilation (cargo doors + ridge openings)
Natural ventilation (cargo doors + ridge NIGHT openings)
Base case without rooflights
Figure 8. Resultant temperatures on ground floor for three warmest days: 10% rooflights Mechanical ventilation is most effective at reducing temperatures overnight. However, using natural ventilation (cargo doors and ridge vents) keeps daytime peak resultant temperatures as low as achieved by mechanical ventilation. The unventilated building (with or without rooflights) gets significantly hotter than any of the ventilated cases, demonstrating that ventilation strategy is critical, and is of greater significance than rooflight area (up to a point) in avoiding overheating. The example building with 10% rooflights, ventilated with cargo doors and ridge vents, does not exceed 25°C resultant temperature of any of the three warmest days.

11
5. Thermal modelling results for Case 2 (14% rooflights) 5.1. Summary of loads and CO2 emissions Table 7. Loads summary (kWh/m2 per year): 14% rooflights Heating Solar People/
Equipment Lighting
Base case 22.69 48.09 10.18 28.14Base case without rooflights 16.85 0.00 10.18 49.06Mechanical ventilation 22.79 48.09 10.18 28.14Natural ventilation (by cargo doors) 23.09 48.09 10.18 28.14Natural ventilation (by ridge openings) 23.19 48.09 10.18 28.14Natural ventilation (cargo doors + ridge openings) 23.32 48.09 10.18 28.14Natural ventilation (cargo doors + ridge NIGHT) 23.33 48.09 10.18 28.14
Table 8.CO2 emissions (kg/m2 per year): 14% rooflights Heating Lighting Base case 5.50 12.44 Base case without rooflights 4.09 21.68 Mechanical ventilation 5.53 12.44 Natural ventilation (by cargo doors) 5.60 12.44 Natural ventilation (by ridge openings) 5.62 12.44 Natural ventilation (cargo doors + ridge openings) 5.65 12.44 Natural ventilation (cargo doors + ridge NIGHT openings) 5.66 12.44
5.2. Monthly loads
0.0
1.0
2.0
3.0
4.0
5.0
6.0
1 2 3 4 5 6 7 8 9 10 11 12
Month
Hea
ting
load
s (k
Wh/
m2 )
Base caseBase case without rooflightsMechanical ventilationNatural ventilation (by cargo doors)Natural ventilation (by ridge openings)Natural ventilation (cargo doors + ridge openings)Natural ventilation (cargo doors + ridge openings)
Figure 9. Monthly heating loads: 14% rooflights This graph shows very similar results to Figure 3 (10% rooflights), as heating loads are not significantly affected by rooflight area.

12
5.3. Overheating (ground floor)
Ground Floor
0
5
10
15
20
25
30
35
40
45
>23 >24 >25 >26 >27 >28 >29 >30 >31 >32 >33 >34 >35
Temperatures (degree C)
% O
ccup
ied
hour
s
External - London weather dataBase caseBase case without rooflightsMechanical ventilationNatural ventilation (by cargo doors)Natural ventilation (by ridge openings)Natural ventilation (cargo doors + ridge openings)Natural ventilation (cargo doors + ridge NIGHT openings)
Figure 10. Ground floor overheating: 14% rooflights
39.27
18.73
27.31
0.95
18.56
3.73
12.27
1.28
19.97
2.59
9.30
0.78
8.32
0.620
5
10
15
20
25
30
35
40
45
23 28
Temperatures (C)
% O
ccup
ied
hour
s
Base caseBase case without rooflightsMechanical ventilationNatural ventilation (by cargo doors)Natural ventilation (by ridge openings)Natural ventilation (cargo doors + ridge openings)Natural ventilation (cargo doors + ridge NIGHT openings)
Figure 11.Percentage of occupied hours over certain temperatures: 14% rooflights These graphs shows similar results to Figures 4 and 5 (10% rooflights). There is a significant risk of overheating in the unventilated base case. Eliminating rooflights does reduce the risk of overheating, but at the cost of increased energy consumption, running costs and CO2 emissions together with a poorer

13
internal environment. Even at 14% rooflights, natural ventilation through cargo doors has a greater effect and ensures lower risk of overheating. Ridge vents are less effective on their own, but, when combined with open cargo doors, give the best results, and this example building with 14% rooflights would not exceed 28C for more than 1% of occupied hours. 5.4. Overheating (mezzanine) The effect of stratification was investigated by analysing temperatures at a notional mezzanine level.
Mezzanine
0
5
10
15
20
25
30
35
40
45
>23 >24 >25 >26 >27 >28 >29 >30 >31 >32 >33 >34 >35
Temperatures (degree C)
% O
ccup
ied
hour
s
External - London weather dataBase caseBase case without rooflightsMechanical ventilationNatural ventilation (by cargo doors)Natural ventilation (by ridge openings)Natural ventilation (cargo doors + ridge openings)Natural ventilation (cargo doors + ridge NIGHT openings)
Figure 12. Mezzanine floor overheating: 14% rooflights
38.90
18.71
27.40
1.13
19.02
4.10
13.85
2.18
19.10
3.24
9.63
1.13
8.74
0.960
5
10
15
20
25
30
35
40
45
23 28
Temperatures (C)
% O
ccup
ied
hour
s
Base caseBase case without rooflightsMechanical ventilationNatural ventilation (by cargo doors)Natural ventilation (by ridge openings)Natural ventilation (cargo doors + ridge openings)Natural ventilation (cargo doors + ridge NIGHT openings)
Figure 13.Percentage of occupied hours over certain temperatures: 14% rooflights

14
The model does show higher temperatures at mezzanine level, indicating some thermal stratification. 5.5. Temperatures for three warmest days
Ground Floor
10
15
20
25
30
35
0 12 24 36 48 60 72
Hours (Days 192-194 July 11-13)
Res
ulta
nt T
empe
ratu
res
(C)
London ExternalBase case
Mechanical ventilationNatural ventilation (by cargo doors)
Natural ventilation (by ridge openings)Natural ventilation (cargo doors + ridge openings)Natural ventilation (cargo doors + ridge NIGHT openings)
Base case without rooflights
Figure 14.Resultant temperatures on ground floor for three warmest days: 14% rooflights Mechanical ventilation is most effective at reducing temperatures overnight. However, using natural ventilation (cargo doors and ridge vents) keeps peak daytime resultant temperatures as low as achieved using mechanical ventilation. The unventilated example building gets significantly hotter than any of the ventilated cases, demonstrating that ventilation strategy is critical and of greater significance than rooflight area (up to a point) in avoiding overheating. A building with 14% rooflights does not exceed a resultant temperature of 26°C on any of the three warmest days.

15
6. Comparison between different rooflight percentages The comparative analyses are based on cases of no ventilation at all and natural ventilation by opening cargo doors. 6.1. Loads and CO2 emissions Table 9.Loads (kWh/m2 per year) Ventilation schemes Heating Solar People/
Equipment Lighting
0% Base case 17.18 0 10.18 49.06 10% Base case 22.23 34.22 10.18 29.89 14% Base case 22.69 48.09 10.18 28.14 10% with cargo doors open 22.50 34.22 10.18 29.89
14% with cargo doors open 23.09 48.09 10.18 28.14
Table 10.CO2 emissions (kg/m2 per year) Ventilation schemes Heating Lighting Heating+Lighting 0% Base case 4.17 21.68 25.85 10% Base case 5.39 13.21 18.60 14% Base case 5.50 12.44 17.94 10% with cargo doors open 5.46 13.21 18.67 14% with cargo doors open 5.60 12.44 18.03
6.2. Monthly heating loads
0.0
1.0
2.0
3.0
4.0
5.0
6.0
1 2 3 4 5 6 7 8 9 10 11 12
Month
Hea
ting
load
s (k
Wh/
m2)
10% Cargo doors 14% Cargo doors10% base case 14% base case
Figure 15.Heating loads for base case and natural ventilation (cargo doors open)
16
6.3. Overheating (ground floor)
Ground Floor
0
5
10
15
20
25
30
35
40
45
>23 >24 >25 >26 >27 >28 >29 >30 >31 >32 >33 >34 >35
Temperatures (degree C)
% O
ccup
ied
hour
s
External - London 10% Base case14% Base case10% with cargo doors open14% with cargo doors open
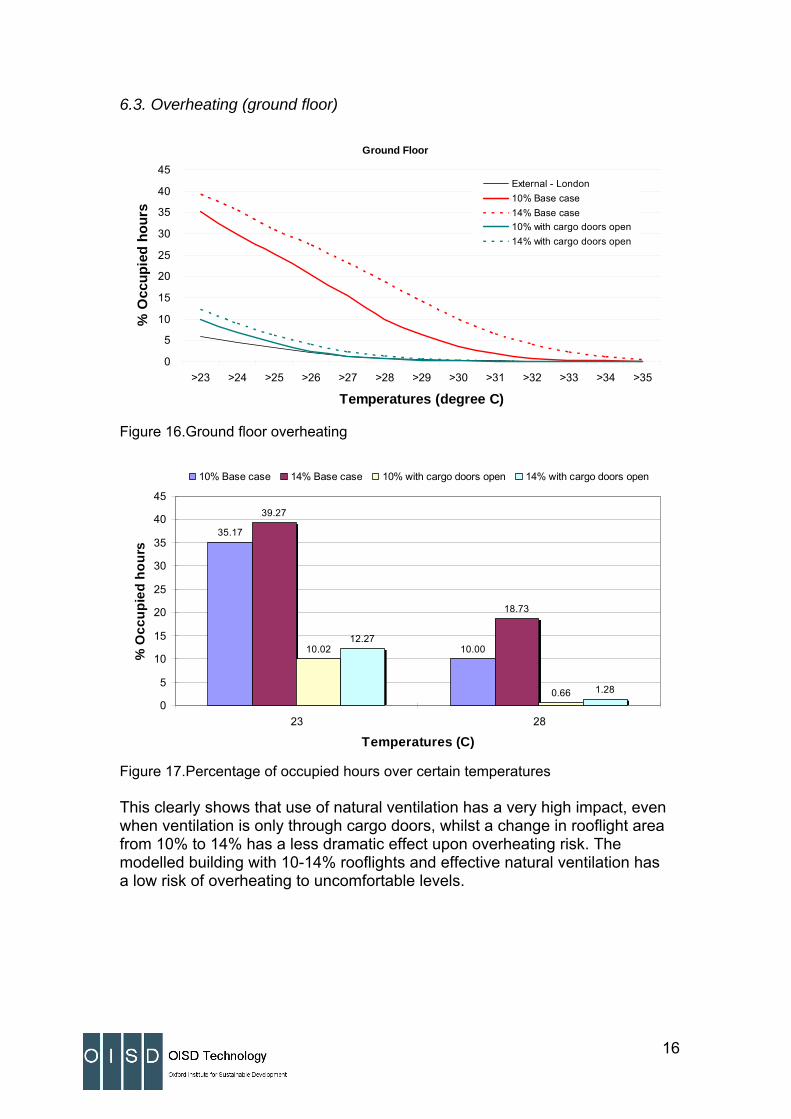
Figure 16.Ground floor overheating
35.17
10.00
39.27
18.73
10.02
0.66
12.27
1.28
0
5
10
15
20
25
30
35
40
45
23 28
Temperatures (C)
% O
ccup
ied
hour
s
10% Base case 14% Base case 10% with cargo doors open 14% with cargo doors open
Figure 17.Percentage of occupied hours over certain temperatures This clearly shows that use of natural ventilation has a very high impact, even when ventilation is only through cargo doors, whilst a change in rooflight area from 10% to 14% has a less dramatic effect upon overheating risk. The modelled building with 10-14% rooflights and effective natural ventilation has a low risk of overheating to uncomfortable levels.

17
6.4. Overheating (mezzanine) The effect of stratification was investigated by introducing a notional mezzanine floor level.
Mezzanine
0
5
10
15
20
25
30
35
40
45
>23 >24 >25 >26 >27 >28 >29 >30 >31 >32 >33 >34 >35
Temperatures (degree C)
% O
ccup
ied
hour
s
External - London 10% Base case14% Base case10% with cargo doors open14% with cargo doors open
Figure 18.Mezzanine floor overheating
35.06
10.78
38.90
18.71
11.26
1.11
13.85
2.18
0
5
10
15
20
25
30
35
40
45
23 28
Temperatures (C)
% O
ccup
ied
hour
s
10% Base case 14% Base case 10% with cargo doors open 14% with cargo doors open
Figure 19.Percentage of occupied hours over certain temperatures The model shows higher temperatures at the mezzanine level, indicating some thermal stratification.

18
6.5. Temperatures for three warmest days
Ground Floor
10
15
20
25
30
35
0 12 24 36 48 60 72
Hours (Days 192-194 July 11-13)
Res
ulta
nt T
empe
ratu
res
(C)
External -London 10% Base case14% Base case 10% with cargo doors open14% with cargo doors open
Figure 20.Resultant temperatures on ground floor for three warmest days This graph shows that at the hottest point on the three warmest days of the year, unventilated buildings may overheat (reaching temperatures of over 30°C) but use of natural ventilation, if only through cargo doors, limits peak temperatures and significantly reduces overheating risk. Rooflight area (10-14% investigated) is a secondary effect for the example building studied, with an increase from 10% rooflights to 14% rooflights making less than 1°C difference to peak temperatures in the ventilated building. 7. Building Regulations Criterion 3: Limiting the effects of solar gains Building Regulations Approved Document L2A states that reasonable provision could be: a) when the building is subject to design irradiancies for July given in CIBSE Design Guide A, the combined solar and internal gains per unit floor area should not exceed 35W/m2 when averaged between 0630 and 1630 GMT b) the operative temperature does not exceed a threshold for more than a reasonable number of hours per year when the building is tested against the CIBSE Design Summer Year appropriate to the building location. For offices, a threshold of 1% over 28°C is suggested.

19
1% over 28°C may be considered unnecessarily onerous for many industrial and warehouse buildings, but it is still met by most of the cases analysed, except those without any ventilation Analysis of the internal solar gains in the building with the CIBSE Design Summer Weather Year data used for July shows that the total average gains are never near 35W/m2, even for 14% nominal rooflight area, as shown in the following graphs.
0
5
10
15
20
25
30
1 2 3 4 5 6 7 8 9 10 11 12 13 14 15 16 17 18 19 20 21 22 23 24 25 26 27 28 29 30 31
Day of July
Gai
ns (W
/m2)
Solar gains
Total internal gains
Figure 21. Total and solar gains for July (10% rooflights)

20
0
5
10
15
20
25
30
35
1 2 3 4 5 6 7 8 9 10 11 12 13 14 15 16 17 18 19 20 21 22 23 24 25 26 27 28 29 30 31
Day of July
Gai
ns (W
/m2)
Solar gains
Total internal gains
Figure 22. Total and solar gains for July (14% rooflights) Using CIBSE Technical Memorandum TM37:2006 (Design for improved shading control), as recommended in ADL2, it is possible to calculate the approximate solar gain in a building from the location, the area and orientation of glazing, and the floor area. The solar load per unit floor area is given by:
( ) ( )∑=Φ effsgPsl gAA φ1 Where =PA Perimeter floor area =gA Net area of glazing =sφ external solar radiation for the orientation of the opening =effg effective g-value (gain) of the glazing Applying this equation and using the tables in TM37 with an assumed g-value for the rooflights of 0.47 (as used in the modelling) and for London: Perimeter area Ap = Total floor area – office area = 2400 – 120 = 2280m2 Glazing area Ag (10%) = 199.8m2 Glazing Area Ag (14%) = 279.7m2

21
Average outside solar irradiance for London on horizontal plane (Table 5.2 in TM37): φs = 655 W/m2 Effective g-value = g x 0.71 = 0.47 x 0.71 = 0.33 Rooflight percentage Solar gain (TM37)
W/m2 for July 4th Solar gain (TAS) W/m2 for July 4th
10% 19.1 21.3 14% 26.7 29.9 Table 11. Average solar gains for TM37 method and TAS model Internal gains add approximately 2.5W/m2 to these figures, depending upon lighting load, taking the total load to over 23.8W/m2 and 32.4W/m2 for 10% and 14% rooflights respectively. 8. Conclusions
• Analysis shows there is an overheating risk with buildings that are totally unventilated
• Ventilation strategy and rooflight area both affect the risk of
overheating, but ventilation strategy is by far the dominant effect.
• In a large open span metal clad building, cargo and personnel doors can be opened to provide effective cross ventilation as required. Opening cargo doors is common practice and is effectively self-regulating. Roof vents allow air to escape at high level and increase the effect of ventilation. They may also be left open at night to give secure night ventilation.
• Introduction of some natural ventilation (by opening cargo doors) has a
significant effect, and ensures there is no overheating risk for buildings of this type incorporating 10% or 14% rooflights.
• The example building with either 10% or 14% rooflights with ridge
vents and open cargo doors did not have total solar+internal gains exceeding 35W/m2, and did not exceed 28oC for more than 1% of occupied hours, thus complying with both main criteria in Building Regulations Approved Document L2A for demonstrating solar overheating will not occur. Modelling also showed that resultant temperature is not predicted to exceed 26oC on the three warmest days of the year.
• Overheating risk can be reduced by eliminating rooflights altogether,
but this would result in significant increases in overall energy use,

22
running costs, CO2 emissions, and would give a significantly poorer internal environment inside the building.
• Rooflights save approximately 40% of lighting energy with only a small
heating penalty, provided that appropriate controls are fitted to enable dimming in response to available daylight.
• Total CO2 emissions (heating and lighting) are reduced by 30% (14%
rooflights) when rooflights are used with dimmable lighting because the saving in lighting electricity far outweighs the additional heating gas required.
• Investigation of stratification shows this has some effect, particularly at
higher rooflight areas, but the modelling suggest this is not a very significant factor.
The work demonstrates that there is no overheating problem at 14% rooflight area, for the warehouse considered. However, if other internal gains are higher (for example from significantly increased occupation density, or retail display lighting), it is possible that overall overheating criteria may be exceeded at lower rooflight areas. APPENDIX

10% Grey thermal results.xls
Base caseValue in kWhMonth Heating Solar Internal (L,O,E)
1 10850.15 1568.14 9392.382 8961.61 2678.95 7783.013 6127.00 4806.03 7794.034 4838.49 7283.20 6821.255 18.96 13153.88 6446.946 0.00 11911.41 5901.037 0.00 13154.08 6275.408 0.00 10397.97 6792.329 0.00 6245.05 7248.68
10 427.54 3638.99 8269.0911 9329.07 2114.36 8870.1212 10132.26 1078.42 9761.11
Total 50685.07 78030.45 91355.38Peak 43.99 65.39 15.42Day 330 171 1Hour 6 13 1
Heating Peaks Solar Peaks onInternal (L,O,E) Peaks on Day 1, Hour 1
Base case with no daylight windowsValue in kWhMonth Heating Solar Internal (L,O,E)
1 7917.41 0.00 11440.962 6752.57 0.00 10333.773 4616.92 0.00 11440.964 4755.87 0.00 11071.895 12.92 0.00 11440.966 17.37 0.00 11071.897 0.00 0.00 11440.968 0.00 0.00 11440.969 0.00 0.00 11071.89
10 155.23 0.00 11440.9611 6870.72 0.00 11071.8912 7319.00 0.00 11440.96
Total 38418.02 0.00 134707.86Peak 37.96 0.00 15.38Day 330 0 1Hour 6 0 1
Heating Peaks Solar Peaks onInternal (L,O,E) Peaks on Day 1, Hour 1
Mechanical ventilationValue in kWhMonth Heating Solar Internal (L,O,E)
1 10850.15 1568.14 9392.382 8961.61 2678.95 7783.013 6127.00 4806.03 7794.034 4838.49 7283.20 6821.255 18.96 13153.88 6446.946 0.00 11911.41 5901.037 0.00 13154.08 6275.408 0.00 10397.97 6792.329 94.07 6245.05 7248.68
10 526.08 3638.99 8269.0911 9350.17 2114.36 8870.1212 10134.12 1078.42 9761.11
Total 50900.66 78030.45 91355.38Peak 44.00 65.39 15.42Day 330 171 1Hour 6 13 1
Heating Peaks Solar Peaks onInternal (L,O,E) Peaks on Day 1, Hour 1
Natural ventilation (by cargo doors)Value in kWhMonth Heating Solar Internal (L,O,E)
1 10856.48 1568.14 9392.382 8966.30 2678.95 7783.013 6169.56 4806.03 7794.034 4993.74 7283.20 6821.255 25.88 13153.88 6446.946 35.52 11911.41 5901.037 0.00 13154.08 6275.408 0.00 10397.97 6792.329 15.83 6245.05 7248.68
10 722.32 3638.99 8269.0911 9374.88 2114.36 8870.1212 10140.75 1078.42 9761.11
Total 51301.27 78030.45 91355.38Peak 44.01 65.39 15.42Day 330 171 1Hour 6 13 1
Heating Peaks Solar Peaks onInternal (L,O,E) Peaks on Day 1, Hour 1
Loads
10% Grey thermal results.xls
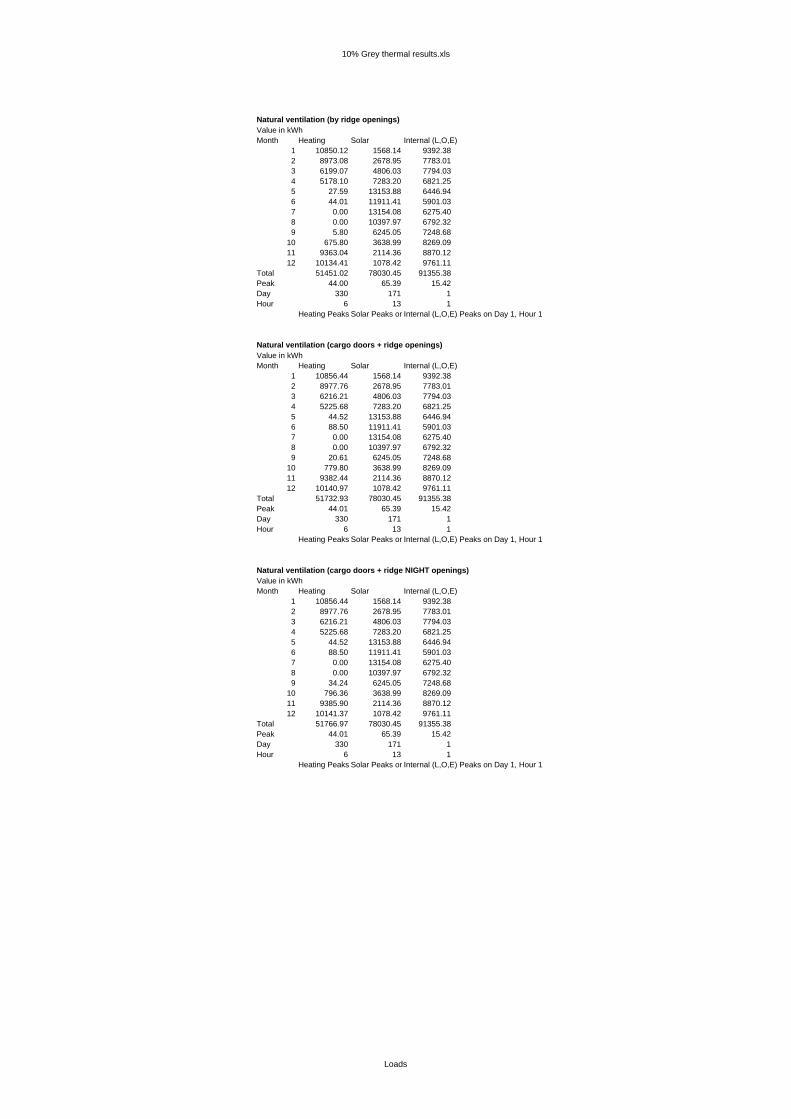
Natural ventilation (by ridge openings)Value in kWhMonth Heating Solar Internal (L,O,E)
1 10850.12 1568.14 9392.382 8973.08 2678.95 7783.013 6199.07 4806.03 7794.034 5178.10 7283.20 6821.255 27.59 13153.88 6446.946 44.01 11911.41 5901.037 0.00 13154.08 6275.408 0.00 10397.97 6792.329 5.80 6245.05 7248.68
10 675.80 3638.99 8269.0911 9363.04 2114.36 8870.1212 10134.41 1078.42 9761.11
Total 51451.02 78030.45 91355.38Peak 44.00 65.39 15.42Day 330 171 1Hour 6 13 1
Heating Peaks Solar Peaks onInternal (L,O,E) Peaks on Day 1, Hour 1
Natural ventilation (cargo doors + ridge openings)Value in kWhMonth Heating Solar Internal (L,O,E)
1 10856.44 1568.14 9392.382 8977.76 2678.95 7783.013 6216.21 4806.03 7794.034 5225.68 7283.20 6821.255 44.52 13153.88 6446.946 88.50 11911.41 5901.037 0.00 13154.08 6275.408 0.00 10397.97 6792.329 20.61 6245.05 7248.68
10 779.80 3638.99 8269.0911 9382.44 2114.36 8870.1212 10140.97 1078.42 9761.11
Total 51732.93 78030.45 91355.38Peak 44.01 65.39 15.42Day 330 171 1Hour 6 13 1
Heating Peaks Solar Peaks onInternal (L,O,E) Peaks on Day 1, Hour 1
Natural ventilation (cargo doors + ridge NIGHT openings)Value in kWhMonth Heating Solar Internal (L,O,E)
1 10856.44 1568.14 9392.382 8977.76 2678.95 7783.013 6216.21 4806.03 7794.034 5225.68 7283.20 6821.255 44.52 13153.88 6446.946 88.50 11911.41 5901.037 0.00 13154.08 6275.408 0.00 10397.97 6792.329 34.24 6245.05 7248.68
10 796.36 3638.99 8269.0911 9385.90 2114.36 8870.1212 10141.37 1078.42 9761.11
Total 51766.97 78030.45 91355.38Peak 44.01 65.39 15.42Day 330 171 1Hour 6 13 1
Heating Peaks Solar Peaks onInternal (L,O,E) Peaks on Day 1, Hour 1
Loads

10% Grey thermal results.xls
Shed floor area= 2280 m2Base caseValue in kWh Lighting electri 29.642Month Heating Solar Internal (L,O,E)
1 4.76 0.69 4.122 3.93 1.17 3.413 2.69 2.11 3.424 2.12 3.19 2.995 0.01 5.77 2.836 0.00 5.22 2.597 0.00 5.77 2.758 0.00 4.56 2.989 0.00 2.74 3.18
10 0.19 1.60 3.6311 4.09 0.93 3.8912 4.44 0.47 4.28
Total 22.23 34.22 40.07
Base case with no daylight windowsValue in kWh Lighting electri 48.656Month Heating Solar Internal (L,O,E)
1 3.47 0.00 5.022 2.96 0.00 4.533 2.02 0.00 5.024 2.09 0.00 4.865 0.01 0.00 5.026 0.01 0.00 4.867 0.00 0.00 5.028 0.00 0.00 5.029 0.00 0.00 4.86
10 0.07 0.00 5.0211 3.01 0.00 4.8612 3.21 0.00 5.02
Total 16.85 0.00 59.08
Mechanical ventilationValue in kWh Lighting electri 29.642Month Heating Solar Internal (L,O,E)
1 4.76 0.69 4.122 3.93 1.17 3.413 2.69 2.11 3.424 2.12 3.19 2.995 0.01 5.77 2.836 0.00 5.22 2.597 0.00 5.77 2.758 0.00 4.56 2.989 0.04 2.74 3.18
10 0.23 1.60 3.6311 4.10 0.93 3.8912 4.44 0.47 4.28
Total 22.32 34.22 40.07
Natural ventilation (by cargo doors)Value in kWh Lighting electri 29.642Month Heating Solar Internal (L,O,E)
1 4.76 0.69 4.122 3.93 1.17 3.413 2.71 2.11 3.424 2.19 3.19 2.995 0.01 5.77 2.836 0.02 5.22 2.597 0.00 5.77 2.758 0.00 4.56 2.989 0.01 2.74 3.18
10 0.32 1.60 3.6311 4.11 0.93 3.8912 4.45 0.47 4.28
Total 22.50 34.22 40.07
0.0
0.5
1.0
1.5
2.0
2.5
3.0
3.5
4.0
4.5
5.0
1 2 3 4 5 6 7 8 9 10 11 12
Month
Hea
ting
load
s (k
Wh/
m2 )
Base caseBase case with no daylight windowsMechanical ventilationNatural ventilation (by cargo doors)Natural ventilation (by ridge openings)Natural ventilation (cargo doors + ridge openings)Natural ventilation (cargo doors + ridge openings)
0
5
10
15
20
25
Heating Lighting
Load type
CO
2 em
issi
ons
(kg/
m2 )
Base caseBase case with no daylight windowsMechanical ventilationNatural ventilation (by cargo doors)Natural ventilation (by ridge openings)Natural ventilation (cargo doors + ridge openings)Natural ventilation (cargo doors + ridge NIGHT openings)
Loads per floor area + CO2

10% Grey thermal results.xls
Natural ventilation (by ridge openings)Value in kWh Lighting electri 29.642Month Heating Solar Internal (L,O,E)
1 4.76 0.69 4.122 3.94 1.17 3.413 2.72 2.11 3.424 2.27 3.19 2.995 0.01 5.77 2.836 0.02 5.22 2.597 0.00 5.77 2.758 0.00 4.56 2.989 0.00 2.74 3.18
10 0.30 1.60 3.6311 4.11 0.93 3.8912 4.44 0.47 4.28
Total 22.57 34.22 40.07
Natural ventilation (cargo doors + ridge openings)Value in kWh Lighting electri 29.642Month Heating Solar Internal (L,O,E)
1 4.76 0.69 4.122 3.94 1.17 3.413 2.73 2.11 3.424 2.29 3.19 2.995 0.02 5.77 2.836 0.04 5.22 2.597 0.00 5.77 2.758 0.00 4.56 2.989 0.01 2.74 3.18
10 0.34 1.60 3.6311 4.12 0.93 3.8912 4.45 0.47 4.28
Total 22.69 34.22 40.07
Natural ventilation (cargo doors + ridge NIGHT openings)Value in kWh Lighting electri 29.642Month Heating Solar Internal (L,O,E)
1 4.76 0.69 4.122 3.94 1.17 3.413 2.73 2.11 3.424 2.29 3.19 2.995 0.02 5.77 2.836 0.04 5.22 2.597 0.00 5.77 2.758 0.00 4.56 2.989 0.02 2.74 3.18
10 0.35 1.60 3.6311 4.12 0.93 3.8912 4.45 0.47 4.28
Total 22.70 34.22 40.07
Loads summary kWh/m2Heating Solar Internal Lighting
Base case 22.23 34.22 40.07 29.64Base case wit 16.85 0.00 59.08 48.66Mechanical ve 22.32 34.22 40.07 29.64Natural ventila 22.50 34.22 40.07 29.64Natural ventila 22.57 34.22 40.07 29.64Natural ventila 22.69 34.22 40.07 29.64Natural ventila 22.70 34.22 40.07 29.64
CO2 emissions kg/m2Heating Solar Internal Lighting
Base case 5.39 15.13 17.71 13.10Base case wit 4.09 0.00 26.11 21.51Mechanical ve 5.41 15.13 17.71 13.10Natural ventila 5.46 15.13 17.71 13.10Natural ventila 5.47 15.13 17.71 13.10Natural ventila 5.50 15.13 17.71 13.10Natural ventila 5.51 15.13 17.71 13.10
Loads per floor area + CO2

10% Grey thermal results.xls
Base caseCumulative Frequency (Hours) of Resultant Temperature for Year, Days 1 to 365Band (C) Total 20 21 22 23 24 25 26 27 28 29 30 31 32 33 34 35External - L 8760 1047 840 660 511 405 283 188 112 72 45 22 12 5 3 0 0Shed Groun 8760 4078 3656 3427 3081 2614 2226 1789 1361 876 552 313 153 69 35 13 0
Base case without daylightCumulative Frequency (Hours) of Resultant Temperature for Year, Days 1 to 365Band (C) Total 20 21 22 23 24 25 26 27 28 29 30 31 32 33 34 35External - L 8760 1047 840 660 511 405 283 188 112 72 45 22 12 5 3 0 0Shed Groun 8760 3940 3291 2976 2391 1672 1026 496 210 83 35 0 0 0 0 0 0
Mechanical ventilationCumulative Frequency (Hours) of Resultant Temperature for Year, Days 1 to 365Band (C) Total 20 21 22 23 24 25 26 27 28 29 30 31 32 33 34 35External - L 8760 1047 840 660 511 405 283 188 112 72 45 22 12 5 3 0 0Shed Groun 8760 2847 2157 1685 1214 843 590 376 237 114 53 18 4 0 0 0 0
Natural ventilation (by cargo doors)Cumulative Frequency (Hours) of Resultant Temperature for Year, Days 1 to 365Band (C) Total 20 21 22 23 24 25 26 27 28 29 30 31 32 33 34 35External - L 8760 1047 840 660 511 405 283 188 112 72 45 22 12 5 3 0 0Shed Groun 8760 3696 2258 1270 878 593 384 218 111 58 28 11 4 0 0 0 0
Natural ventilation (by ridge openings)Cumulative Frequency (Hours) of Resultant Temperature for Year, Days 1 to 365Band (C) Total 20 21 22 23 24 25 26 27 28 29 30 31 32 33 34 35External - L 8760 1047 840 660 511 405 283 188 112 72 45 22 12 5 3 0 0Shed Groun 8760 3749 2808 1918 1362 937 591 367 171 86 43 25 5 0 0 0 0
Natural ventilation (cargo doors + ridge openings)Cumulative Frequency (Hours) of Resultant Temperature for Year, Days 1 to 365Band (C) Total 20 21 22 23 24 25 26 27 28 29 30 31 32 33 34 35External - L 8760 1047 840 660 511 405 283 188 112 72 45 22 12 5 3 0 0Shed Groun 8760 3571 1772 973 676 458 277 142 72 34 13 5 1 0 0 0 0
Natural ventilation (cargo doors + ridge NIGHT openings)Cumulative Frequency (Hours) of Resultant Temperature for Year, Days 1 to 365Band (C) Total 20 21 22 23 24 25 26 27 28 29 30 31 32 33 34 35External - L 8760 1047 840 660 511 405 283 188 112 72 45 22 12 5 3 0 0Shed Groun 8760 2930 1437 872 586 405 239 125 64 29 12 5 0 0 0 0 0
>20 >21 >22 >23 >24 >25 >26 >27 >28 >29 >30 >31 >32 >33 >34 >35External - L 11.95 9.59 7.53 5.83 4.62 3.23 2.15 1.28 0.82 0.51 0.25 0.14 0.06 0.03 0.00 0.00Base case 46.55 41.74 39.12 35.17 29.84 25.41 20.42 15.54 10.00 6.30 3.57 1.75 0.79 0.40 0.15 0.00Base case w 44.98 37.57 33.97 27.29 19.09 11.71 5.66 2.40 0.95 0.40 0.00 0.00 0.00 0.00 0.00 0.00Mechanical 32.50 24.62 19.24 13.86 9.62 6.74 4.29 2.71 1.30 0.61 0.21 0.05 0.00 0.00 0.00 0.00Natural ven 42.19 25.78 14.50 10.02 6.77 4.38 2.49 1.27 0.66 0.32 0.13 0.05 0.00 0.00 0.00 0.00Natural ven 42.80 32.05 21.89 15.55 10.70 6.75 4.19 1.95 0.98 0.49 0.29 0.06 0.00 0.00 0.00 0.00Natural ven 40.76 20.23 11.11 7.72 5.23 3.16 1.62 0.82 0.39 0.15 0.06 0.01 0.00 0.00 0.00 0.00Natural ven 33.45 16.40 9.95 6.69 4.62 2.73 1.43 0.73 0.33 0.14 0.06 0.00 0.00 0.00 0.00 0.00
Ground Floor
0
5
10
15
20
25
30
35
40
>23 >24 >25 >26 >27 >28 >29 >30 >31 >32 >33 >34 >35
Temperatures (degree C)
% O
ccup
ied
hour
s
External - London weather dataBase caseBase case without daylightMechanical ventilationNatural ventilation (by cargo doors)Natural ventilation (by ridge openings)Natural ventilation (cargo doors + ridge openings)Natural ventilation (cargo doors + ridge NIGHT openings)
35.17
10.00
27.29
0.95
13.86
1.30
10.02
0.66
15.55
0.98
7.72
0.39
6.69
0.330
5
10
15
20
25
30
35
40
23 28
Temperatures (C)
% O
ccup
ied
hour
s
Base caseBase case without daylightMechanical ventilationNatural ventilation (by cargo doors)Natural ventilation (by ridge openings)Natural ventilation (cargo doors + ridge openings)Natural ventilation (cargo doors + ridge NIGHT openings)
25.41
10.0011.71
0.95
6.74
1.30
4.38
0.66
6.75
0.983.16
0.392.73
0.330
5
10
15
20
25
30
25 28
Temperatures (C)
% O
ccup
ied
hour
s
Base caseBase case without daylightMechanical ventilationNatural ventilation (by cargo doors)Natural ventilation (by ridge openings)Natural ventilation (cargo doors + ridge openings)Natural ventilation (cargo doors + ridge NIGHT openings)
Overheating(GroundFloor)+no DL
10% Grey thermal results.xls
Base caseCumulative Frequency (Hours) of Resultant Temperature for Year, Days 1 to 365Band (C) Total 20 21 22 23 24 25 26 27 28 29 30 31 32 33 34 35External - Lo 8760 1047 840 660 511 405 283 188 112 72 45 22 12 5 3 0 0Shed Groun 8760 4078 3656 3427 3081 2614 2226 1789 1361 876 552 313 153 69 35 13 0
Mechanical ventilationCumulative Frequency (Hours) of Resultant Temperature for Year, Days 1 to 365Band (C) Total 20 21 22 23 24 25 26 27 28 29 30 31 32 33 34 35External - Lo 8760 1047 840 660 511 405 283 188 112 72 45 22 12 5 3 0 0Shed Groun 8760 2847 2157 1685 1214 843 590 376 237 114 53 18 4 0 0 0 0
Natural ventilation (by cargo doors)Cumulative Frequency (Hours) of Resultant Temperature for Year, Days 1 to 365Band (C) Total 20 21 22 23 24 25 26 27 28 29 30 31 32 33 34 35External - Lo 8760 1047 840 660 511 405 283 188 112 72 45 22 12 5 3 0 0Shed Groun 8760 3696 2258 1270 878 593 384 218 111 58 28 11 4 0 0 0 0
Natural ventilation (by ridge openings)Cumulative Frequency (Hours) of Resultant Temperature for Year, Days 1 to 365Band (C) Total 20 21 22 23 24 25 26 27 28 29 30 31 32 33 34 35External - Lo 8760 1047 840 660 511 405 283 188 112 72 45 22 12 5 3 0 0Shed Groun 8760 3749 2808 1918 1362 937 591 367 171 86 43 25 5 0 0 0 0
Natural ventilation (cargo doors + ridge openings)Cumulative Frequency (Hours) of Resultant Temperature for Year, Days 1 to 365Band (C) Total 20 21 22 23 24 25 26 27 28 29 30 31 32 33 34 35External - Lo 8760 1047 840 660 511 405 283 188 112 72 45 22 12 5 3 0 0Shed Groun 8760 3571 1772 973 676 458 277 142 72 34 13 5 1 0 0 0 0
Natural ventilation (cargo doors + ridge NIGHT openings)Cumulative Frequency (Hours) of Resultant Temperature for Year, Days 1 to 365Band (C) Total 20 21 22 23 24 25 26 27 28 29 30 31 32 33 34 35External - Lo 8760 1047 840 660 511 405 283 188 112 72 45 22 12 5 3 0 0Shed Groun 8760 2930 1437 872 586 405 239 125 64 29 12 5 0 0 0 0 0
>20 >21 >22 >23 >24 >25 >26 >27 >28 >29 >30 >31 >32 >33 >34 >35External - Lo 11.95 9.59 7.53 5.83 4.62 3.23 2.15 1.28 0.82 0.51 0.25 0.14 0.06 0.03 0.00 0.00Base case 46.55 41.74 39.12 35.17 29.84 25.41 20.42 15.54 10.00 6.30 3.57 1.75 0.79 0.40 0.15 0.00Mechanical 32.50 24.62 19.24 13.86 9.62 6.74 4.29 2.71 1.30 0.61 0.21 0.05 0.00 0.00 0.00 0.00Natural vent 42.19 25.78 14.50 10.02 6.77 4.38 2.49 1.27 0.66 0.32 0.13 0.05 0.00 0.00 0.00 0.00Natural vent 42.80 32.05 21.89 15.55 10.70 6.75 4.19 1.95 0.98 0.49 0.29 0.06 0.00 0.00 0.00 0.00Natural vent 40.76 20.23 11.11 7.72 5.23 3.16 1.62 0.82 0.39 0.15 0.06 0.01 0.00 0.00 0.00 0.00Natural vent 33.45 16.40 9.95 6.69 4.62 2.73 1.43 0.73 0.33 0.14 0.06 0.00 0.00 0.00 0.00 0.00
Ground Floor
0
5
10
15
20
25
30
35
40
>23 >24 >25 >26 >27 >28 >29 >30 >31 >32 >33 >34 >35
Temperatures (degree C)
% O
ccup
ied
hour
s
External - London weather dataBase caseMechanical ventilationNatural ventilation (by cargo doors)Natural ventilation (by ridge openings)Natural ventilation (cargo doors + ridge openings)Natural ventilation (cargo doors + ridge NIGHT openings)
35.17
10.00
13.86
1.30
10.02
0.66
15.55
0.98
7.72
0.39
6.69
0.330
5
10
15
20
25
30
35
40
23 28
Temperatures (C)
% O
ccup
ied
hour
s
Base caseMechanical ventilationNatural ventilation (by cargo doors)Natural ventilation (by ridge openings)Natural ventilation (cargo doors + ridge openings)Natural ventilation (cargo doors + ridge NIGHT openings)
25.41
10.00
6.74
1.30
4.38
0.66
6.75
0.983.16
0.392.73
0.330
5
10
15
20
25
30
25 28
Temperatures (C)
% O
ccup
ied
hour
s
Base caseMechanical ventilationNatural ventilation (by cargo doors)Natural ventilation (by ridge openings)Natural ventilation (cargo doors + ridge openings)Natural ventilation (cargo doors + ridge NIGHT openings)
Overheating(GroundFloor)

10% Grey thermal results.xls
Base caseCumulative Frequency (Hours) of Resultant Temperature for Year, Days 1 to 365Band (C) Total 20 21 22 23 24 25 26 27 28 29 30 31 32 33 34 35External - Lo 8760 1047 840 660 511 405 283 188 112 72 45 22 12 5 3 0 0Shed Mezza 8760 4087 3646 3397 3071 2610 2221 1798 1367 944 589 378 206 96 46 24 4
Base case without daylightCumulative Frequency (Hours) of Resultant Temperature for Year, Days 1 to 365Band (C) Total 20 21 22 23 24 25 26 27 28 29 30 31 32 33 34 35External - Lo 8760 1047 840 660 511 405 283 188 112 72 45 22 12 5 3 0 0Shed Mezza 8760 3914 3293 2940 2399 1682 1071 567 273 99 40 14 0 0 0 0 0
Mechanical ventilationCumulative Frequency (Hours) of Resultant Temperature for Year, Days 1 to 365Band (C) Total 20 21 22 23 24 25 26 27 28 29 30 31 32 33 34 35External - Lo 8760 1047 840 660 511 405 283 188 112 72 45 22 12 5 3 0 0Shed Mezza 8760 2866 2197 1717 1293 924 653 436 280 165 74 36 14 1 0 0 0
Natural ventilation (by cargo doors)Cumulative Frequency (Hours) of Resultant Temperature for Year, Days 1 to 365Band (C) Total 20 21 22 23 24 25 26 27 28 29 30 31 32 33 34 35External - Lo 8760 1047 840 660 511 405 283 188 112 72 45 22 12 5 3 0 0Shed Mezza 8760 3637 2268 1406 986 711 497 322 187 97 54 25 10 4 0 0 0
Natural ventilation (by ridge openings)Cumulative Frequency (Hours) of Resultant Temperature for Year, Days 1 to 365Band (C) Total 20 21 22 23 24 25 26 27 28 29 30 31 32 33 34 35External - Lo 8760 1047 840 660 511 405 283 188 112 72 45 22 12 5 3 0 0Shed Mezza 8760 3749 2647 1824 1336 975 660 431 235 119 58 34 15 2 0 0 0
Natural ventilation (cargo doors + ridge openings)Cumulative Frequency (Hours) of Resultant Temperature for Year, Days 1 to 365Band (C) Total 20 21 22 23 24 25 26 27 28 29 30 31 32 33 34 35External - Lo 8760 1047 840 660 511 405 283 188 112 72 45 22 12 5 3 0 0Shed Mezza 8760 3468 1722 1003 719 518 340 211 108 60 30 11 5 1 0 0 0
Natural ventilation (cargo doors + ridge NIGHT openings)Cumulative Frequency (Hours) of Resultant Temperature for Year, Days 1 to 365Band (C) Total 20 21 22 23 24 25 26 27 28 29 30 31 32 33 34 35External - Lo 8760 1047 840 660 511 405 283 188 112 72 45 22 12 5 3 0 0Shed Mezza 8760 2804 1427 899 645 461 289 183 95 52 23 11 5 0 0 0 0
>20 >21 >22 >23 >24 >25 >26 >27 >28 >29 >30 >31 >32 >33 >34 >35External - Lo 11.95 9.59 7.53 5.83 4.62 3.23 2.15 1.28 0.82 0.51 0.25 0.14 0.06 0.03 0.00 0.00Base case 46.66 41.62 38.78 35.06 29.79 25.35 20.53 15.61 10.78 6.72 4.32 2.35 1.10 0.53 0.27 0.05Base case w 44.68 37.59 33.56 27.39 19.20 12.23 6.47 3.12 1.13 0.46 0.16 0.00 0.00 0.00 0.00 0.00Mechanical 32.72 25.08 19.60 14.76 10.55 7.45 4.98 3.20 1.88 0.84 0.41 0.16 0.01 0.00 0.00 0.00Natural vent 41.52 25.89 16.05 11.26 8.12 5.67 3.68 2.13 1.11 0.62 0.29 0.11 0.05 0.00 0.00 0.00Natural vent 42.80 30.22 20.82 15.25 11.13 7.53 4.92 2.68 1.36 0.66 0.39 0.17 0.02 0.00 0.00 0.00Natural vent 39.59 19.66 11.45 8.21 5.91 3.88 2.41 1.23 0.68 0.34 0.13 0.06 0.01 0.00 0.00 0.00Natural vent 32.01 16.29 10.26 7.36 5.26 3.30 2.09 1.08 0.59 0.26 0.13 0.06 0.00 0.00 0.00 0.00
Mezzanine
0
5
10
15
20
25
30
35
40
>23 >24 >25 >26 >27 >28 >29 >30 >31 >32 >33 >34 >35
Temperatures (degree C)
% O
ccup
ied
hour
s
External - London weather dataBase caseBase case without daylightMechanical ventilationNatural ventilation (by cargo doors)Natural ventilation (by ridge openings)Natural ventilation (cargo doors + ridge openings)Natural ventilation (cargo doors + ridge NIGHT openings)
35.06
10.78
27.39
1.13
14.76
1.88
11.26
1.11
15.25
1.36
8.21
0.68
7.36
0.590
5
10
15
20
25
30
35
40
23 28
Temperatures (C)
% O
ccup
ied
hour
s
Base caseBase case without daylightMechanical ventilationNatural ventilation (by cargo doors)Natural ventilation (by ridge openings)Natural ventilation (cargo doors + ridge openings)Natural ventilation (cargo doors + ridge NIGHT openings)
25.35
10.7812.23
1.13
7.45
1.88
5.67
1.11
7.53
1.363.88
0.68
3.30
0.590
5
10
15
20
25
30
25 28
Temperatures (C)
% O
ccup
ied
hour
s
Base caseBase case without daylightMechanical ventilationNatural ventilation (by cargo doors)Natural ventilation (by ridge openings)Natural ventilation (cargo doors + ridge openings)Natural ventilation (cargo doors + ridge NIGHT openings)
Overheating(Mezzanine)+no DL

10% Grey thermal results.xls
Base caseCumulative Frequency (Hours) of Resultant Temperature for Year, Days 1 to 365Band (C) Total 20 21 22 23 24 25 26 27 28 29 30 31 32 33 34 35External - L 8760 1047 840 660 511 405 283 188 112 72 45 22 12 5 3 0 0Shed Mezza 8760 4087 3646 3397 3071 2610 2221 1798 1367 944 589 378 206 96 46 24 4
Mechanical ventilationCumulative Frequency (Hours) of Resultant Temperature for Year, Days 1 to 365Band (C) Total 20 21 22 23 24 25 26 27 28 29 30 31 32 33 34 35External - L 8760 1047 840 660 511 405 283 188 112 72 45 22 12 5 3 0 0Shed Mezza 8760 2866 2197 1717 1293 924 653 436 280 165 74 36 14 1 0 0 0
Natural ventilation (by cargo doors)Cumulative Frequency (Hours) of Resultant Temperature for Year, Days 1 to 365Band (C) Total 20 21 22 23 24 25 26 27 28 29 30 31 32 33 34 35External - L 8760 1047 840 660 511 405 283 188 112 72 45 22 12 5 3 0 0Shed Mezza 8760 3637 2268 1406 986 711 497 322 187 97 54 25 10 4 0 0 0
Natural ventilation (by ridge openings)Cumulative Frequency (Hours) of Resultant Temperature for Year, Days 1 to 365Band (C) Total 20 21 22 23 24 25 26 27 28 29 30 31 32 33 34 35External - L 8760 1047 840 660 511 405 283 188 112 72 45 22 12 5 3 0 0Shed Mezza 8760 3749 2647 1824 1336 975 660 431 235 119 58 34 15 2 0 0 0
Natural ventilation (cargo doors + ridge openings)Cumulative Frequency (Hours) of Resultant Temperature for Year, Days 1 to 365Band (C) Total 20 21 22 23 24 25 26 27 28 29 30 31 32 33 34 35External - L 8760 1047 840 660 511 405 283 188 112 72 45 22 12 5 3 0 0Shed Mezza 8760 3468 1722 1003 719 518 340 211 108 60 30 11 5 1 0 0 0
Natural ventilation (cargo doors + ridge NIGHT openings)Cumulative Frequency (Hours) of Resultant Temperature for Year, Days 1 to 365Band (C) Total 20 21 22 23 24 25 26 27 28 29 30 31 32 33 34 35External - L 8760 1047 840 660 511 405 283 188 112 72 45 22 12 5 3 0 0Shed Mezza 8760 2804 1427 899 645 461 289 183 95 52 23 11 5 0 0 0 0
>20 >21 >22 >23 >24 >25 >26 >27 >28 >29 >30 >31 >32 >33 >34 >35External - L 11.95 9.59 7.53 5.83 4.62 3.23 2.15 1.28 0.82 0.51 0.25 0.14 0.06 0.03 0.00 0.00Base case 46.66 41.62 38.78 35.06 29.79 25.35 20.53 15.61 10.78 6.72 4.32 2.35 1.10 0.53 0.27 0.05Mechanical 32.72 25.08 19.60 14.76 10.55 7.45 4.98 3.20 1.88 0.84 0.41 0.16 0.01 0.00 0.00 0.00Natural ven 41.52 25.89 16.05 11.26 8.12 5.67 3.68 2.13 1.11 0.62 0.29 0.11 0.05 0.00 0.00 0.00Natural ven 42.80 30.22 20.82 15.25 11.13 7.53 4.92 2.68 1.36 0.66 0.39 0.17 0.02 0.00 0.00 0.00Natural ven 39.59 19.66 11.45 8.21 5.91 3.88 2.41 1.23 0.68 0.34 0.13 0.06 0.01 0.00 0.00 0.00Natural ven 32.01 16.29 10.26 7.36 5.26 3.30 2.09 1.08 0.59 0.26 0.13 0.06 0.00 0.00 0.00 0.00
Mezzanine
0
5
10
15
20
25
30
35
40
>23 >24 >25 >26 >27 >28 >29 >30 >31 >32 >33 >34 >35
Temperatures (degree C)
% O
ccup
ied
hour
s
External - London weather dataBase caseMechanical ventilationNatural ventilation (by cargo doors)Natural ventilation (by ridge openings)Natural ventilation (cargo doors + ridge openings)Natural ventilation (cargo doors + ridge NIGHT openings)
35.06
10.78
14.76
1.88
11.26
1.11
15.25
1.36
8.21
0.68
7.36
0.590
5
10
15
20
25
30
35
40
23 28
Temperatures (C)
% O
ccup
ied
hour
s
Base caseMechanical ventilationNatural ventilation (by cargo doors)Natural ventilation (by ridge openings)Natural ventilation (cargo doors + ridge openings)Natural ventilation (cargo doors + ridge NIGHT openings)
25.35
10.78
7.45
1.88
5.67
1.11
7.53
1.36
3.88
0.68
3.30
0.590
5
10
15
20
25
30
25 28
Temperatures (C)
% O
ccup
ied
hour
s
Base caseMechanical ventilationNatural ventilation (by cargo doors)Natural ventilation (by ridge openings)Natural ventilation (cargo doors + ridge openings)Natural ventilation (cargo doors + ridge NIGHT openings)
Overheating(Mezzanine)

10% Grey thermal results.xls
0
5
10
15
20
25
30
1 2 3 4 5 6 7 8 9 10 11 12 13 14 15 16 17 18 19 20 21 22 23 24 25 26 27 28 29 30 31
Day of July
Gai
ns (W
/m2)
Solar gainsTotal internal gains
Solar Gains in July (7-17h)

10% Grey thermal results.xls
Ground Floor
10
15
20
25
30
35
0 12 24 36 48 60 72
Hours (Days 192-194 July 11-13)
Res
ulta
nt T
empe
ratu
res
(C)
External - London weather data
Base case
Mechanical ventilation
Natural ventilation (by cargo doors)
Natural ventilation (by ridge openings)
Natural ventilation (cargo doors + ridge openings)
Natural ventilation (cargo doors + ridge NIGHT openings)
Temperatures
10% Grey thermal results.xls
Ground Floor
10
15
20
25
30
35
0 12 24 36 48 60 72
Hours (Days 192-194 July 11-13)
Res
ulta
nt T
empe
ratu
res
(C)
External - London weather data
Base case
Mechanical ventilation
Natural ventilation (by cargo doors)
Natural ventilation (by ridge openings)
Natural ventilation (cargo doors + ridge openings)
Natural ventilation (cargo doors + ridge NIGHT openings)
Base case with no daylight windows
Temperatures+no DL
14% Grey thermal results.xls
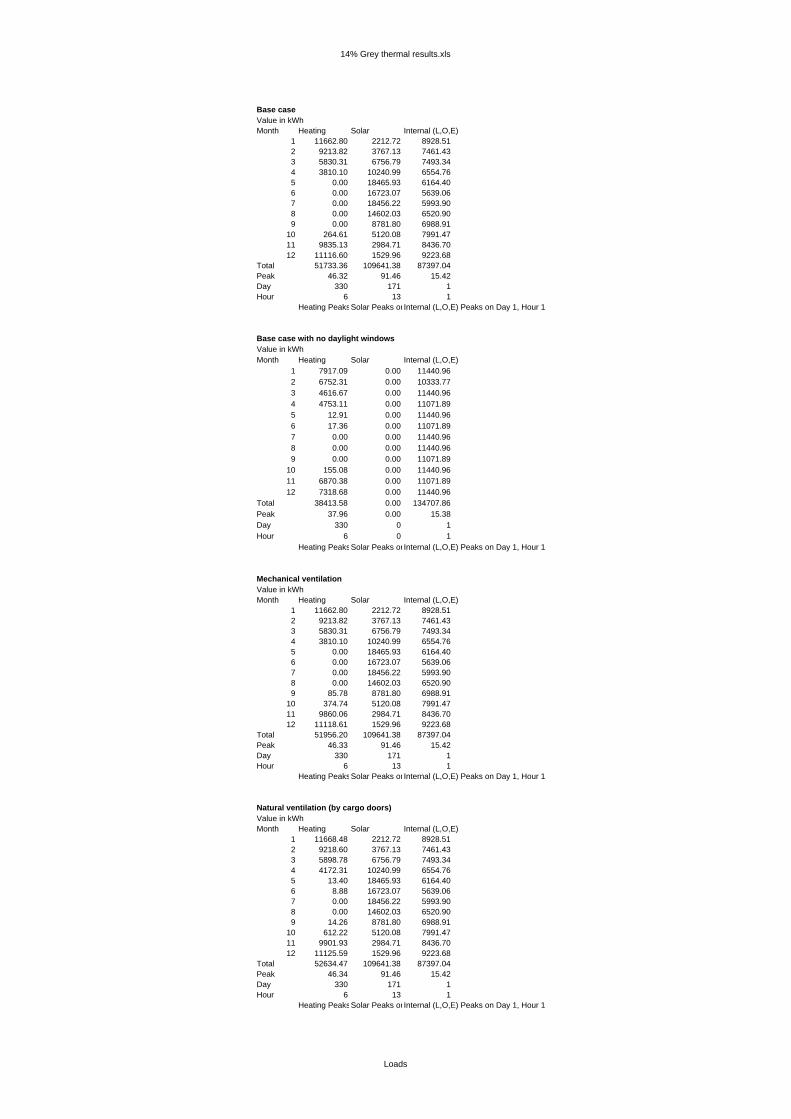
Base caseValue in kWhMonth Heating Solar Internal (L,O,E)
1 11662.80 2212.72 8928.512 9213.82 3767.13 7461.433 5830.31 6756.79 7493.344 3810.10 10240.99 6554.765 0.00 18465.93 6164.406 0.00 16723.07 5639.067 0.00 18456.22 5993.908 0.00 14602.03 6520.909 0.00 8781.80 6988.91
10 264.61 5120.08 7991.4711 9835.13 2984.71 8436.7012 11116.60 1529.96 9223.68
Total 51733.36 109641.38 87397.04Peak 46.32 91.46 15.42Day 330 171 1Hour 6 13 1
Heating PeaksSolar Peaks onInternal (L,O,E) Peaks on Day 1, Hour 1
Base case with no daylight windowsValue in kWhMonth Heating Solar Internal (L,O,E)
1 7917.09 0.00 11440.962 6752.31 0.00 10333.773 4616.67 0.00 11440.964 4753.11 0.00 11071.895 12.91 0.00 11440.966 17.36 0.00 11071.897 0.00 0.00 11440.968 0.00 0.00 11440.969 0.00 0.00 11071.89
10 155.08 0.00 11440.9611 6870.38 0.00 11071.8912 7318.68 0.00 11440.96
Total 38413.58 0.00 134707.86Peak 37.96 0.00 15.38Day 330 0 1Hour 6 0 1
Heating PeaksSolar Peaks onInternal (L,O,E) Peaks on Day 1, Hour 1
Mechanical ventilationValue in kWhMonth Heating Solar Internal (L,O,E)
1 11662.80 2212.72 8928.512 9213.82 3767.13 7461.433 5830.31 6756.79 7493.344 3810.10 10240.99 6554.765 0.00 18465.93 6164.406 0.00 16723.07 5639.067 0.00 18456.22 5993.908 0.00 14602.03 6520.909 85.78 8781.80 6988.91
10 374.74 5120.08 7991.4711 9860.06 2984.71 8436.7012 11118.61 1529.96 9223.68
Total 51956.20 109641.38 87397.04Peak 46.33 91.46 15.42Day 330 171 1Hour 6 13 1
Heating PeaksSolar Peaks onInternal (L,O,E) Peaks on Day 1, Hour 1
Natural ventilation (by cargo doors)Value in kWhMonth Heating Solar Internal (L,O,E)
1 11668.48 2212.72 8928.512 9218.60 3767.13 7461.433 5898.78 6756.79 7493.344 4172.31 10240.99 6554.765 13.40 18465.93 6164.406 8.88 16723.07 5639.067 0.00 18456.22 5993.908 0.00 14602.03 6520.909 14.26 8781.80 6988.91
10 612.22 5120.08 7991.4711 9901.93 2984.71 8436.7012 11125.59 1529.96 9223.68
Total 52634.47 109641.38 87397.04Peak 46.34 91.46 15.42Day 330 171 1Hour 6 13 1
Heating PeaksSolar Peaks onInternal (L,O,E) Peaks on Day 1, Hour 1
Loads

14% Grey thermal results.xls
Natural ventilation (by ridge openings)Value in kWhMonth Heating Solar Internal (L,O,E)
1 11662.81 2212.72 8928.512 9232.79 3767.13 7461.433 5957.96 6756.79 7493.344 4376.33 10240.99 6554.765 16.44 18465.93 6164.406 13.30 16723.07 5639.067 0.00 18456.22 5993.908 0.00 14602.03 6520.909 7.00 8781.80 6988.91
10 584.62 5120.08 7991.4711 9893.89 2984.71 8436.7012 11119.66 1529.96 9223.68
Total 52864.80 109641.38 87397.04Peak 46.34 91.46 15.42Day 330 171 1Hour 6 13 1
Heating PeaksSolar Peaks onInternal (L,O,E) Peaks on Day 1, Hour 1
Natural ventilation (cargo doors + ridge openings)Value in kWhMonth Heating Solar Internal (L,O,E)
1 11668.47 2212.72 8928.512 9237.07 3767.13 7461.433 5976.64 6756.79 7493.344 4463.31 10240.99 6554.765 19.60 18465.93 6164.406 44.84 16723.07 5639.067 0.00 18456.22 5993.908 0.00 14602.03 6520.909 22.40 8781.80 6988.91
10 692.81 5120.08 7991.4711 9917.13 2984.71 8436.7012 11126.07 1529.96 9223.68
Total 53168.36 109641.38 87397.04Peak 46.35 91.46 15.42Day 330 171 1Hour 6 13 1
Heating PeaksSolar Peaks onInternal (L,O,E) Peaks on Day 1, Hour 1
Natural ventilation (cargo doors + ridge NIGHT openings)Value in kWhMonth Heating Solar Internal (L,O,E)
1 11668.47 2212.72 8928.512 9237.07 3767.13 7461.433 5976.64 6756.79 7493.344 4463.31 10240.99 6554.765 19.60 18465.93 6164.406 44.84 16723.07 5639.067 0.00 18456.22 5993.908 0.00 14602.03 6520.909 30.41 8781.80 6988.91
10 705.87 5120.08 7991.4711 9920.33 2984.71 8436.7012 11126.35 1529.96 9223.68
Total 53192.88 109641.38 87397.04Peak 46.35 91.46 15.42Day 330 171 1Hour 6 13 1
Heating PeaksSolar Peaks onInternal (L,O,E) Peaks on Day 1, Hour 1
Loads

14% Grey thermal results.xls
Shed floor area= 2280 m2Base caseValue in kWh Lighting electri 27.906Month Heating Solar Internal (L,O,E)
1 5.12 0.97 3.922 4.04 1.65 3.273 2.56 2.96 3.294 1.67 4.49 2.875 0.00 8.10 2.706 0.00 7.33 2.477 0.00 8.09 2.638 0.00 6.40 2.869 0.00 3.85 3.07
10 0.12 2.25 3.5111 4.31 1.31 3.7012 4.88 0.67 4.05
Total 22.69 48.09 38.33
Base case with no daylight windowsValue in kWh Lighting electri 48.656Month Heating Solar Internal (L,O,E)
1 3.47 0.00 5.022 2.96 0.00 4.533 2.02 0.00 5.024 2.08 0.00 4.865 0.01 0.00 5.026 0.01 0.00 4.867 0.00 0.00 5.028 0.00 0.00 5.029 0.00 0.00 4.86
10 0.07 0.00 5.0211 3.01 0.00 4.8612 3.21 0.00 5.02
Total 16.85 0.00 59.08
Mechanical ventilationValue in kWh Lighting electri 27.906Month Heating Solar Internal (L,O,E)
1 5.12 0.97 3.922 4.04 1.65 3.273 2.56 2.96 3.294 1.67 4.49 2.875 0.00 8.10 2.706 0.00 7.33 2.477 0.00 8.09 2.638 0.00 6.40 2.869 0.04 3.85 3.07
10 0.16 2.25 3.5111 4.32 1.31 3.7012 4.88 0.67 4.05
Total 22.79 48.09 38.33
Natural ventilation (by cargo doors)Value in kWh Lighting electri 27.906Month Heating Solar Internal (L,O,E)
1 5.12 0.97 3.922 4.04 1.65 3.273 2.59 2.96 3.294 1.83 4.49 2.875 0.01 8.10 2.706 0.00 7.33 2.477 0.00 8.09 2.638 0.00 6.40 2.869 0.01 3.85 3.07
10 0.27 2.25 3.5111 4.34 1.31 3.7012 4.88 0.67 4.05
Total 23.09 48.09 38.33
0.0
1.0
2.0
3.0
4.0
5.0
6.0
1 2 3 4 5 6 7 8 9 10 11 12
Month
Hea
ting
load
s (k
Wh/
m2 )
Base caseBase case with no daylight windowsMechanical ventilationNatural ventilation (by cargo doors)Natural ventilation (by ridge openings)Natural ventilation (cargo doors + ridge openings)Natural ventilation (cargo doors + ridge openings)
0
5
10
15
20
25
Heating Lighting
Load type
CO
2 em
issi
ons
(kg/
m2 )
Base caseBase case with no daylight windowsMechanical ventilationNatural ventilation (by cargo doors)Natural ventilation (by ridge openings)Natural ventilation (cargo doors + ridge openings)Natural ventilation (cargo doors + ridge NIGHT openings)
Loads per floor area + CO2

14% Grey thermal results.xls
Natural ventilation (by ridge openings)Value in kWh Lighting electri 27.906Month Heating Solar Internal (L,O,E)
1 5.12 0.97 3.922 4.05 1.65 3.273 2.61 2.96 3.294 1.92 4.49 2.875 0.01 8.10 2.706 0.01 7.33 2.477 0.00 8.09 2.638 0.00 6.40 2.869 0.00 3.85 3.07
10 0.26 2.25 3.5111 4.34 1.31 3.7012 4.88 0.67 4.05
Total 23.19 48.09 38.33
Natural ventilation (cargo doors + ridge openings)Value in kWh Lighting electri 27.906Month Heating Solar Internal (L,O,E)
1 5.12 0.97 3.922 4.05 1.65 3.273 2.62 2.96 3.294 1.96 4.49 2.875 0.01 8.10 2.706 0.02 7.33 2.477 0.00 8.09 2.638 0.00 6.40 2.869 0.01 3.85 3.07
10 0.30 2.25 3.5111 4.35 1.31 3.7012 4.88 0.67 4.05
Total 23.32 48.09 38.33
Natural ventilation (cargo doors + ridge NIGHT openings)Value in kWh Lighting electri 27.906Month Heating Solar Internal (L,O,E)
1 5.12 0.97 3.922 4.05 1.65 3.273 2.62 2.96 3.294 1.96 4.49 2.875 0.01 8.10 2.706 0.02 7.33 2.477 0.00 8.09 2.638 0.00 6.40 2.869 0.01 3.85 3.07
10 0.31 2.25 3.5111 4.35 1.31 3.7012 4.88 0.67 4.05
Total 23.33 48.09 38.33
Loads summary kWh/m2Heating Solar Internal Lighting
Base case 22.69 48.09 38.33 27.91Base case wit 16.85 0.00 59.08 48.66Mechanical ve 22.79 48.09 38.33 27.91Natural ventila 23.09 48.09 38.33 27.91Natural ventila 23.19 48.09 38.33 27.91Natural ventila 23.32 48.09 38.33 27.91Natural ventila 23.33 48.09 38.33 27.91
CO2 emissions kg/m2Heating Solar Internal Lighting
Base case 5.50 21.26 16.94 12.33Base case wit 4.09 0.00 26.11 21.51Mechanical ve 5.53 21.26 16.94 12.33Natural ventila 5.60 21.26 16.94 12.33Natural ventila 5.62 21.26 16.94 12.33Natural ventila 5.65 21.26 16.94 12.33Natural ventila 5.66 21.26 16.94 12.33
Loads per floor area + CO2

14% Grey thermal results.xls
Base caseCumulative Frequency (Hours) of Resultant Temperature for Year, Days 1 to 365Band (C) Total 20 21 22 23 24 25 26 27 28 29 30 31 32 33 34 35External - L 8760 1047 840 660 511 405 283 188 112 72 45 22 12 5 3 0 0Shed Groun 8760 4407 3831 3636 3440 3114 2720 2393 2029 1641 1246 870 571 352 203 103 44
Base case without daylightCumulative Frequency (Hours) of Resultant Temperature for Year, Days 1 to 365Band (C) Total 20 21 22 23 24 25 26 27 28 29 30 31 32 33 34 35External - L 8760 1047 840 660 511 405 283 188 112 72 45 22 12 5 3 0 0Shed Groun 8760 3940 3291 2977 2392 1672 1027 495 211 83 35 0 0 0 0 0 0
Mechanical ventilationCumulative Frequency (Hours) of Resultant Temperature for Year, Days 1 to 365Band (C) Total 20 21 22 23 24 25 26 27 28 29 30 31 32 33 34 35External - L 8760 1047 840 660 511 405 283 188 112 72 45 22 12 5 3 0 0Shed Groun 8760 3284 2440 2048 1626 1227 896 664 471 327 208 113 50 22 10 1 0
Natural ventilation (by cargo doors)Cumulative Frequency (Hours) of Resultant Temperature for Year, Days 1 to 365Band (C) Total 20 21 22 23 24 25 26 27 28 29 30 31 32 33 34 35External - L 8760 1047 840 660 511 405 283 188 112 72 45 22 12 5 3 0 0Shed Groun 8760 4022 2670 1602 1075 791 544 353 207 112 61 31 11 3 0 0 0
Natural ventilation (by ridge openings)Cumulative Frequency (Hours) of Resultant Temperature for Year, Days 1 to 365Band (C) Total 20 21 22 23 24 25 26 27 28 29 30 31 32 33 34 35External - L 8760 1047 840 660 511 405 283 188 112 72 45 22 12 5 3 0 0Shed Groun 8760 4075 3180 2304 1749 1292 938 618 417 227 123 60 35 15 2 0 0
Natural ventilation (cargo doors + ridge openings)Cumulative Frequency (Hours) of Resultant Temperature for Year, Days 1 to 365Band (C) Total 20 21 22 23 24 25 26 27 28 29 30 31 32 33 34 35External - L 8760 1047 840 660 511 405 283 188 112 72 45 22 12 5 3 0 0Shed Groun 8760 3890 2243 1173 815 574 370 228 121 68 30 11 4 0 0 0 0
Natural ventilation (cargo doors + ridge NIGHT openings)Cumulative Frequency (Hours) of Resultant Temperature for Year, Days 1 to 365Band (C) Total 20 21 22 23 24 25 26 27 28 29 30 31 32 33 34 35External - L 8760 1047 840 660 511 405 283 188 112 72 45 22 12 5 3 0 0Shed Groun 8760 3374 1878 1047 729 508 315 193 100 54 23 11 4 0 0 0 0
>20 >21 >22 >23 >24 >25 >26 >27 >28 >29 >30 >31 >32 >33 >34 >35External - L 11.95 9.59 7.53 5.83 4.62 3.23 2.15 1.28 0.82 0.51 0.25 0.14 0.06 0.03 0.00 0.00Base case 50.31 43.73 41.51 39.27 35.55 31.05 27.32 23.16 18.73 14.22 9.93 6.52 4.02 2.32 1.18 0.50Base case w 44.98 37.57 33.98 27.31 19.09 11.72 5.65 2.41 0.95 0.40 0.00 0.00 0.00 0.00 0.00 0.00Mechanical 37.49 27.85 23.38 18.56 14.01 10.23 7.58 5.38 3.73 2.37 1.29 0.57 0.25 0.11 0.01 0.00Natural ven 45.91 30.48 18.29 12.27 9.03 6.21 4.03 2.36 1.28 0.70 0.35 0.13 0.03 0.00 0.00 0.00Natural ven 46.52 36.30 26.30 19.97 14.75 10.71 7.05 4.76 2.59 1.40 0.68 0.40 0.17 0.02 0.00 0.00Natural ven 44.41 25.61 13.39 9.30 6.55 4.22 2.60 1.38 0.78 0.34 0.13 0.05 0.00 0.00 0.00 0.00Natural ven 38.52 21.44 11.95 8.32 5.80 3.60 2.20 1.14 0.62 0.26 0.13 0.05 0.00 0.00 0.00 0.00
Ground Floor
05
1015202530354045
>23 >24 >25 >26 >27 >28 >29 >30 >31 >32 >33 >34 >35
Temperatures (degree C)
% O
ccup
ied
hour
s
External - London weather dataBase caseBase case without daylightMechanical ventilationNatural ventilation (by cargo doors)Natural ventilation (by ridge openings)Natural ventilation (cargo doors + ridge openings)Natural ventilation (cargo doors + ridge NIGHT openings)
39.27
18.73
27.31
0.95
18.56
3.73
12.27
1.28
19.97
2.59
9.30
0.78
8.32
0.620
5
10
15
20
25
30
35
40
45
23 28
Temperatures (C)
% O
ccup
ied
hour
s
Base caseBase case without daylightMechanical ventilationNatural ventilation (by cargo doors)Natural ventilation (by ridge openings)Natural ventilation (cargo doors + ridge openings)Natural ventilation (cargo doors + ridge NIGHT openings)
31.05
18.73
11.72
0.95
10.23
3.736.21
1.28
10.71
2.594.22
0.783.60
0.620
5
10
15
20
25
30
35
25 28
Temperatures (C)
% O
ccup
ied
hour
s
Base caseBase case without daylightMechanical ventilationNatural ventilation (by cargo doors)Natural ventilation (by ridge openings)Natural ventilation (cargo doors + ridge openings)Natural ventilation (cargo doors + ridge NIGHT openings)
Overheating(GroundFloor)+no DL

14% Grey thermal results.xls
Base caseCumulative Frequency (Hours) of Resultant Temperature for Year, Days 1 to 365Band (C) Total 20 21 22 23 24 25 26 27 28 29 30 31 32 33 34 35External - L 8760 1047 840 660 511 405 283 188 112 72 45 22 12 5 3 0 0Shed Groun 8760 4407 3831 3636 3440 3114 2720 2393 2029 1641 1246 870 571 352 203 103 44
Mechanical ventilationCumulative Frequency (Hours) of Resultant Temperature for Year, Days 1 to 365Band (C) Total 20 21 22 23 24 25 26 27 28 29 30 31 32 33 34 35External - L 8760 1047 840 660 511 405 283 188 112 72 45 22 12 5 3 0 0Shed Groun 8760 3284 2440 2048 1626 1227 896 664 471 327 208 113 50 22 10 1 0
Natural ventilation (by cargo doors)Cumulative Frequency (Hours) of Resultant Temperature for Year, Days 1 to 365Band (C) Total 20 21 22 23 24 25 26 27 28 29 30 31 32 33 34 35External - L 8760 1047 840 660 511 405 283 188 112 72 45 22 12 5 3 0 0Shed Groun 8760 4022 2670 1602 1075 791 544 353 207 112 61 31 11 3 0 0 0
Natural ventilation (by ridge openings)Cumulative Frequency (Hours) of Resultant Temperature for Year, Days 1 to 365Band (C) Total 20 21 22 23 24 25 26 27 28 29 30 31 32 33 34 35External - L 8760 1047 840 660 511 405 283 188 112 72 45 22 12 5 3 0 0Shed Groun 8760 4075 3180 2304 1749 1292 938 618 417 227 123 60 35 15 2 0 0
Natural ventilation (cargo doors + ridge openings)Cumulative Frequency (Hours) of Resultant Temperature for Year, Days 1 to 365Band (C) Total 20 21 22 23 24 25 26 27 28 29 30 31 32 33 34 35External - L 8760 1047 840 660 511 405 283 188 112 72 45 22 12 5 3 0 0Shed Groun 8760 3890 2243 1173 815 574 370 228 121 68 30 11 4 0 0 0 0
Natural ventilation (cargo doors + ridge NIGHT openings)Cumulative Frequency (Hours) of Resultant Temperature for Year, Days 1 to 365Band (C) Total 20 21 22 23 24 25 26 27 28 29 30 31 32 33 34 35External - L 8760 1047 840 660 511 405 283 188 112 72 45 22 12 5 3 0 0Shed Groun 8760 3374 1878 1047 729 508 315 193 100 54 23 11 4 0 0 0 0
>20 >21 >22 >23 >24 >25 >26 >27 >28 >29 >30 >31 >32 >33 >34 >35External - L 11.95 9.59 7.53 5.83 4.62 3.23 2.15 1.28 0.82 0.51 0.25 0.14 0.06 0.03 0.00 0.00Base case 50.31 43.73 41.51 39.27 35.55 31.05 27.32 23.16 18.73 14.22 9.93 6.52 4.02 2.32 1.18 0.50Mechanical 37.49 27.85 23.38 18.56 14.01 10.23 7.58 5.38 3.73 2.37 1.29 0.57 0.25 0.11 0.01 0.00Natural ven 45.91 30.48 18.29 12.27 9.03 6.21 4.03 2.36 1.28 0.70 0.35 0.13 0.03 0.00 0.00 0.00Natural ven 46.52 36.30 26.30 19.97 14.75 10.71 7.05 4.76 2.59 1.40 0.68 0.40 0.17 0.02 0.00 0.00Natural ven 44.41 25.61 13.39 9.30 6.55 4.22 2.60 1.38 0.78 0.34 0.13 0.05 0.00 0.00 0.00 0.00Natural ven 38.52 21.44 11.95 8.32 5.80 3.60 2.20 1.14 0.62 0.26 0.13 0.05 0.00 0.00 0.00 0.00
Ground Floor
05
1015202530354045
>23 >24 >25 >26 >27 >28 >29 >30 >31 >32 >33 >34 >35
Temperatures (degree C)
% O
ccup
ied
hour
s
External - London weather dataBase caseMechanical ventilationNatural ventilation (by cargo doors)Natural ventilation (by ridge openings)Natural ventilation (cargo doors + ridge openings)Natural ventilation (cargo doors + ridge NIGHT openings)
39.27
18.7318.56
3.73
12.27
1.28
19.97
2.59
9.30
0.78
8.32
0.620
5
10
15
20
25
30
35
40
45
23 28
Temperatures (C)
% O
ccup
ied
hour
s
Base caseMechanical ventilationNatural ventilation (by cargo doors)Natural ventilation (by ridge openings)Natural ventilation (cargo doors + ridge openings)Natural ventilation (cargo doors + ridge NIGHT openings)
31.05
18.73
10.23
3.736.21
1.28
10.71
2.594.22
0.783.60
0.620
5
10
15
20
25
30
35
25 28
Temperatures (C)
% O
ccup
ied
hour
s
Base caseMechanical ventilationNatural ventilation (by cargo doors)Natural ventilation (by ridge openings)Natural ventilation (cargo doors + ridge openings)Natural ventilation (cargo doors + ridge NIGHT openings)
Overheating(GroundFloor)
14% Grey thermal results.xls
Base caseCumulative Frequency (Hours) of Resultant Temperature for Year, Days 1 to 365Band (C) Total 20 21 22 23 24 25 26 27 28 29 30 31 32 33 34 35External - Lo 8760 1047 840 660 511 405 283 188 112 72 45 22 12 5 3 0 0Shed Mezza 8760 4381 3847 3647 3408 3086 2696 2380 2015 1639 1247 907 608 420 245 148 74
Base case without daylightCumulative Frequency (Hours) of Resultant Temperature for Year, Days 1 to 365Band (C) Total 20 21 22 23 24 25 26 27 28 29 30 31 32 33 34 35External - Lo 8760 1047 840 660 511 405 283 188 112 72 45 22 12 5 3 0 0Shed Mezza 8760 3916 3294 2940 2400 1682 1072 567 274 99 40 14 0 0 0 0 0
Mechanical ventilationCumulative Frequency (Hours) of Resultant Temperature for Year, Days 1 to 365Band (C) Total 20 21 22 23 24 25 26 27 28 29 30 31 32 33 34 35External - Lo 8760 1047 840 660 511 405 283 188 112 72 45 22 12 5 3 0 0Shed Mezza 8760 3273 2481 2087 1666 1292 967 722 520 359 243 153 70 39 15 8 1
Natural ventilation (by cargo doors)Cumulative Frequency (Hours) of Resultant Temperature for Year, Days 1 to 365Band (C) Total 20 21 22 23 24 25 26 27 28 29 30 31 32 33 34 35External - Lo 8760 1047 840 660 511 405 283 188 112 72 45 22 12 5 3 0 0Shed Mezza 8760 3935 2616 1752 1213 916 674 491 311 191 112 62 33 14 5 0 0
Natural ventilation (by ridge openings)Cumulative Frequency (Hours) of Resultant Temperature for Year, Days 1 to 365Band (C) Total 20 21 22 23 24 25 26 27 28 29 30 31 32 33 34 35External - Lo 8760 1047 840 660 511 405 283 188 112 72 45 22 12 5 3 0 0Shed Mezza 8760 4043 3020 2178 1673 1268 956 689 470 284 162 89 49 27 12 2 0
Natural ventilation (cargo doors + ridge openings)Cumulative Frequency (Hours) of Resultant Temperature for Year, Days 1 to 365Band (C) Total 20 21 22 23 24 25 26 27 28 29 30 31 32 33 34 35External - Lo 8760 1047 840 660 511 405 283 188 112 72 45 22 12 5 3 0 0Shed Mezza 8760 3788 2089 1204 844 620 454 285 180 99 52 26 10 3 0 0 0
Natural ventilation (cargo doors + ridge NIGHT openings)Cumulative Frequency (Hours) of Resultant Temperature for Year, Days 1 to 365Band (C) Total 20 21 22 23 24 25 26 27 28 29 30 31 32 33 34 35External - Lo 8760 1047 840 660 511 405 283 188 112 72 45 22 12 5 3 0 0Shed Mezza 8760 3233 1799 1085 766 548 383 244 146 84 42 17 8 3 0 0 0
>20 >21 >22 >23 >24 >25 >26 >27 >28 >29 >30 >31 >32 >33 >34 >35External - Lo 11.95 9.59 7.53 5.83 4.62 3.23 2.15 1.28 0.82 0.51 0.25 0.14 0.06 0.03 0.00 0.00Base case 50.01 43.92 41.63 38.90 35.23 30.78 27.17 23.00 18.71 14.24 10.35 6.94 4.79 2.80 1.69 0.84Base case w 44.70 37.60 33.56 27.40 19.20 12.24 6.47 3.13 1.13 0.46 0.16 0.00 0.00 0.00 0.00 0.00Mechanical 37.36 28.32 23.82 19.02 14.75 11.04 8.24 5.94 4.10 2.77 1.75 0.80 0.45 0.17 0.09 0.01Natural vent 44.92 29.86 20.00 13.85 10.46 7.69 5.61 3.55 2.18 1.28 0.71 0.38 0.16 0.06 0.00 0.00Natural vent 46.15 34.47 24.86 19.10 14.47 10.91 7.87 5.37 3.24 1.85 1.02 0.56 0.31 0.14 0.02 0.00Natural vent 43.24 23.85 13.74 9.63 7.08 5.18 3.25 2.05 1.13 0.59 0.30 0.11 0.03 0.00 0.00 0.00Natural vent 36.91 20.54 12.39 8.74 6.26 4.37 2.79 1.67 0.96 0.48 0.19 0.09 0.03 0.00 0.00 0.00
Mezzanine
05
1015202530354045
>23 >24 >25 >26 >27 >28 >29 >30 >31 >32 >33 >34 >35
Temperatures (degree C)
% O
ccup
ied
hour
s
External - London weather dataBase caseBase case without daylightMechanical ventilationNatural ventilation (by cargo doors)Natural ventilation (by ridge openings)Natural ventilation (cargo doors + ridge openings)Natural ventilation (cargo doors + ridge NIGHT openings)
38.90
18.71
27.40
1.13
19.02
4.10
13.85
2.18
19.10
3.24
9.63
1.13
8.74
0.960
5
10
15
20
25
30
35
40
45
23 28
Temperatures (C)
% O
ccup
ied
hour
s
Base caseBase case without daylightMechanical ventilationNatural ventilation (by cargo doors)Natural ventilation (by ridge openings)Natural ventilation (cargo doors + ridge openings)Natural ventilation (cargo doors + ridge NIGHT openings)
30.78
18.71
12.24
1.13
11.04
4.10
7.69
2.18
10.91
3.245.18
1.13
4.37
0.960
5
10
15
20
25
30
35
25 28
Temperatures (C)
% O
ccup
ied
hour
s
Base caseBase case without daylightMechanical ventilationNatural ventilation (by cargo doors)Natural ventilation (by ridge openings)Natural ventilation (cargo doors + ridge openings)Natural ventilation (cargo doors + ridge NIGHT openings)
Overheating(Mezzanine)+no DL
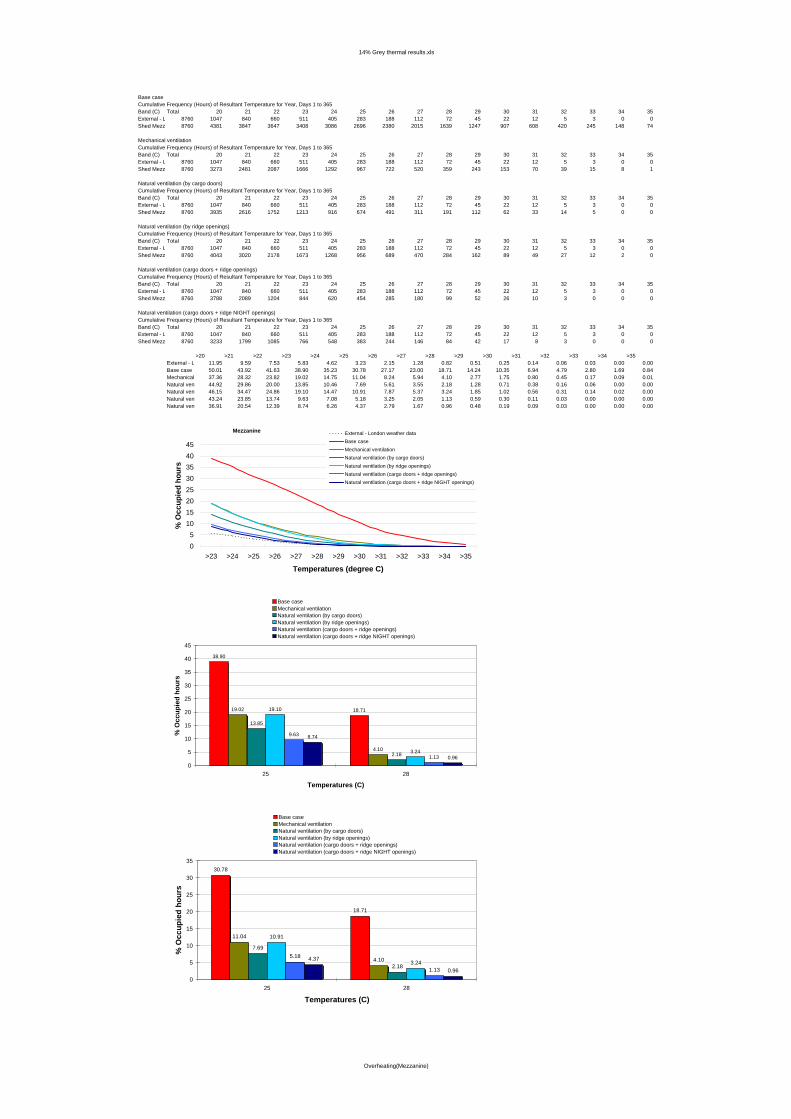
14% Grey thermal results.xls
Base caseCumulative Frequency (Hours) of Resultant Temperature for Year, Days 1 to 365Band (C) Total 20 21 22 23 24 25 26 27 28 29 30 31 32 33 34 35External - L 8760 1047 840 660 511 405 283 188 112 72 45 22 12 5 3 0 0Shed Mezza 8760 4381 3847 3647 3408 3086 2696 2380 2015 1639 1247 907 608 420 245 148 74
Mechanical ventilationCumulative Frequency (Hours) of Resultant Temperature for Year, Days 1 to 365Band (C) Total 20 21 22 23 24 25 26 27 28 29 30 31 32 33 34 35External - L 8760 1047 840 660 511 405 283 188 112 72 45 22 12 5 3 0 0Shed Mezza 8760 3273 2481 2087 1666 1292 967 722 520 359 243 153 70 39 15 8 1
Natural ventilation (by cargo doors)Cumulative Frequency (Hours) of Resultant Temperature for Year, Days 1 to 365Band (C) Total 20 21 22 23 24 25 26 27 28 29 30 31 32 33 34 35External - L 8760 1047 840 660 511 405 283 188 112 72 45 22 12 5 3 0 0Shed Mezza 8760 3935 2616 1752 1213 916 674 491 311 191 112 62 33 14 5 0 0
Natural ventilation (by ridge openings)Cumulative Frequency (Hours) of Resultant Temperature for Year, Days 1 to 365Band (C) Total 20 21 22 23 24 25 26 27 28 29 30 31 32 33 34 35External - L 8760 1047 840 660 511 405 283 188 112 72 45 22 12 5 3 0 0Shed Mezza 8760 4043 3020 2178 1673 1268 956 689 470 284 162 89 49 27 12 2 0
Natural ventilation (cargo doors + ridge openings)Cumulative Frequency (Hours) of Resultant Temperature for Year, Days 1 to 365Band (C) Total 20 21 22 23 24 25 26 27 28 29 30 31 32 33 34 35External - L 8760 1047 840 660 511 405 283 188 112 72 45 22 12 5 3 0 0Shed Mezza 8760 3788 2089 1204 844 620 454 285 180 99 52 26 10 3 0 0 0
Natural ventilation (cargo doors + ridge NIGHT openings)Cumulative Frequency (Hours) of Resultant Temperature for Year, Days 1 to 365Band (C) Total 20 21 22 23 24 25 26 27 28 29 30 31 32 33 34 35External - L 8760 1047 840 660 511 405 283 188 112 72 45 22 12 5 3 0 0Shed Mezza 8760 3233 1799 1085 766 548 383 244 146 84 42 17 8 3 0 0 0
>20 >21 >22 >23 >24 >25 >26 >27 >28 >29 >30 >31 >32 >33 >34 >35External - L 11.95 9.59 7.53 5.83 4.62 3.23 2.15 1.28 0.82 0.51 0.25 0.14 0.06 0.03 0.00 0.00Base case 50.01 43.92 41.63 38.90 35.23 30.78 27.17 23.00 18.71 14.24 10.35 6.94 4.79 2.80 1.69 0.84Mechanical 37.36 28.32 23.82 19.02 14.75 11.04 8.24 5.94 4.10 2.77 1.75 0.80 0.45 0.17 0.09 0.01Natural ven 44.92 29.86 20.00 13.85 10.46 7.69 5.61 3.55 2.18 1.28 0.71 0.38 0.16 0.06 0.00 0.00Natural ven 46.15 34.47 24.86 19.10 14.47 10.91 7.87 5.37 3.24 1.85 1.02 0.56 0.31 0.14 0.02 0.00Natural ven 43.24 23.85 13.74 9.63 7.08 5.18 3.25 2.05 1.13 0.59 0.30 0.11 0.03 0.00 0.00 0.00Natural ven 36.91 20.54 12.39 8.74 6.26 4.37 2.79 1.67 0.96 0.48 0.19 0.09 0.03 0.00 0.00 0.00
Mezzanine
05
1015202530354045
>23 >24 >25 >26 >27 >28 >29 >30 >31 >32 >33 >34 >35
Temperatures (degree C)
% O
ccup
ied
hour
s
External - London weather dataBase caseMechanical ventilationNatural ventilation (by cargo doors)Natural ventilation (by ridge openings)Natural ventilation (cargo doors + ridge openings)Natural ventilation (cargo doors + ridge NIGHT openings)
38.90
18.7119.02
4.10
13.85
2.18
19.10
3.24
9.63
1.13
8.74
0.960
5
10
15
20
25
30
35
40
45
25 28
Temperatures (C)
% O
ccup
ied
hour
s
Base caseMechanical ventilationNatural ventilation (by cargo doors)Natural ventilation (by ridge openings)Natural ventilation (cargo doors + ridge openings)Natural ventilation (cargo doors + ridge NIGHT openings)
30.78
18.71
11.04
4.10
7.69
2.18
10.91
3.245.18
1.13
4.37
0.960
5
10
15
20
25
30
35
25 28
Temperatures (C)
% O
ccup
ied
hour
s
Base caseMechanical ventilationNatural ventilation (by cargo doors)Natural ventilation (by ridge openings)Natural ventilation (cargo doors + ridge openings)Natural ventilation (cargo doors + ridge NIGHT openings)
Overheating(Mezzanine)

14% Grey thermal results.xls
0
5
10
15
20
25
30
35
1 2 3 4 5 6 7 8 9 10 11 12 13 14 15 16 17 18 19 20 21 22 23 24 25 26 27 28 29 30 31
Day of July
Gai
ns (W
/m2)
Solar gainsTotal internal gains
Solar Gains in July (7-17h)
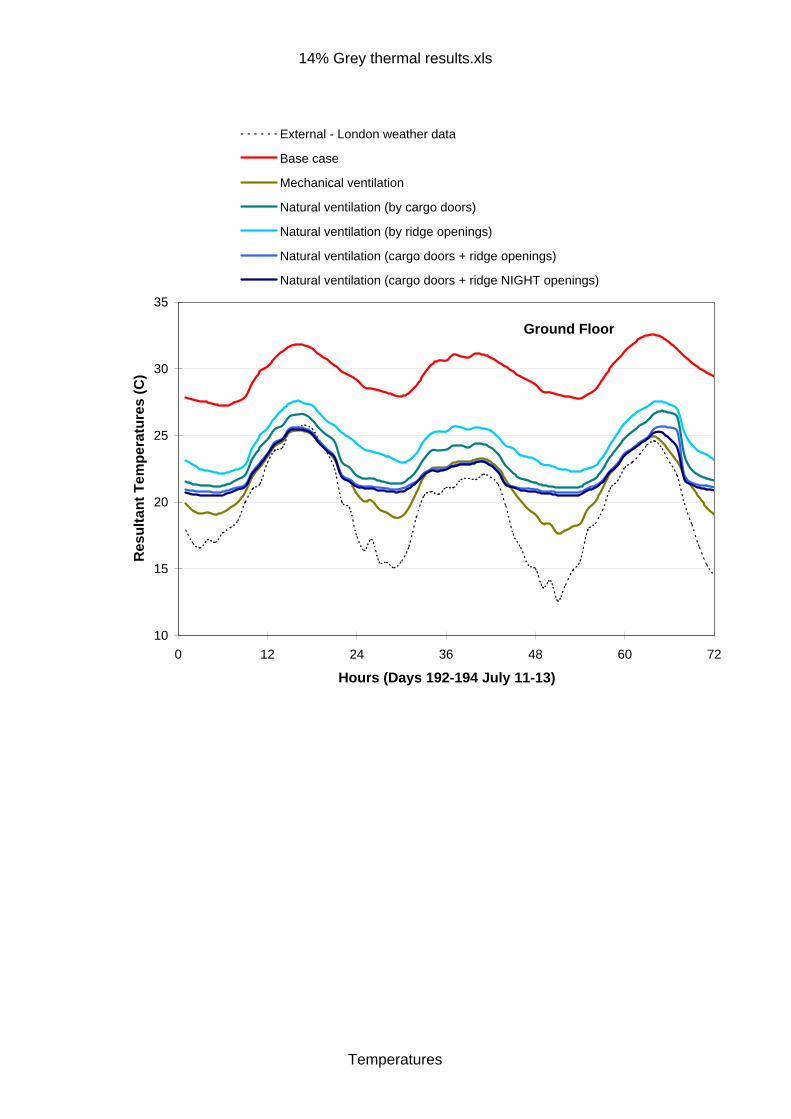
14% Grey thermal results.xls
Ground Floor
10
15
20
25
30
35
0 12 24 36 48 60 72
Hours (Days 192-194 July 11-13)
Res
ulta
nt T
empe
ratu
res
(C)
External - London weather data
Base case
Mechanical ventilation
Natural ventilation (by cargo doors)
Natural ventilation (by ridge openings)
Natural ventilation (cargo doors + ridge openings)
Natural ventilation (cargo doors + ridge NIGHT openings)
Temperatures

14% Grey thermal results.xls
Ground Floor
10
15
20
25
30
35
0 12 24 36 48 60 72
Hours (Days 192-194 July 11-13)
Res
ulta
nt T
empe
ratu
res
(C)
External - London weather dataBase caseMechanical ventilationNatural ventilation (by cargo doors)Natural ventilation (by ridge openings)Natural ventilation (cargo doors + ridge openings)Natural ventilation (cargo doors + ridge NIGHT openings)Base case with no daylight windows
Temperatures+no DL

Comparisons between 10% and 14% Grey thermal results.xls
10% Base caseValue in kWhMonth Heating Solar Internal (L,O,E)
1 10850.15 1568.14 9392.382 8961.61 2678.95 7783.013 6127.00 4806.03 7794.034 4838.49 7283.20 6821.255 18.96 13153.88 6446.946 0.00 11911.41 5901.037 0.00 13154.08 6275.408 0.00 10397.97 6792.329 0.00 6245.05 7248.68
10 427.54 3638.99 8269.0911 9329.07 2114.36 8870.1212 10132.26 1078.42 9761.11
Total 50685.07 78030.45 91355.38Peak 43.99 65.39 15.42Day 330 171 1Hour 6 13 1
Heating PeaksSolar Peaks onInternal (L,O,E) Peaks on Day 1, Hour 1
14% Base caseValue in kWhMonth Heating Solar Internal (L,O,E)
1 11662.80 2212.72 8928.512 9213.82 3767.13 7461.433 5830.31 6756.79 7493.344 3810.10 10240.99 6554.765 0.00 18465.93 6164.406 0.00 16723.07 5639.067 0.00 18456.22 5993.908 0.00 14602.03 6520.909 0.00 8781.80 6988.91
10 264.61 5120.08 7991.4711 9835.13 2984.71 8436.7012 11116.60 1529.96 9223.68
Total 51733.36 109641.38 87397.04Peak 46.32 91.46 15.42Day 330 171 1Hour 6 13 1
Heating PeaksSolar Peaks onInternal (L,O,E) Peaks on Day 1, Hour 1
10% with cargo doors openValue in kWhMonth Heating Solar Internal (L,O,E)
1 10856.48 1568.14 9392.382 8966.30 2678.95 7783.013 6169.56 4806.03 7794.034 4993.74 7283.20 6821.255 25.88 13153.88 6446.946 35.52 11911.41 5901.037 0.00 13154.08 6275.408 0.00 10397.97 6792.329 15.83 6245.05 7248.68
10 722.32 3638.99 8269.0911 9374.88 2114.36 8870.1212 10140.75 1078.42 9761.11
Total 51301.27 78030.45 91355.38Peak 44.01 65.39 15.42Day 330 171 1Hour 6 13 1
Heating PeaksSolar Peaks onInternal (L,O,E) Peaks on Day 1, Hour 1
14% with cargo doors openValue in kWhMonth Heating Solar Internal (L,O,E)
1 11668.48 2212.72 8928.512 9218.60 3767.13 7461.433 5898.78 6756.79 7493.344 4172.31 10240.99 6554.765 13.40 18465.93 6164.406 8.88 16723.07 5639.067 0.00 18456.22 5993.908 0.00 14602.03 6520.909 14.26 8781.80 6988.91
10 612.22 5120.08 7991.4711 9901.93 2984.71 8436.7012 11125.59 1529.96 9223.68
Total 52634.47 109641.38 87397.04Peak 46.34 91.46 15.42Day 330 171 1Hour 6 13 1
Heating PeaksSolar Peaks onInternal (L,O,E) Peaks on Day 1, Hour 1
Loads

Comparisons between 10% and 14% Grey thermal results.xls
Shed floor area= 2280 m210% Base caseValue in kWh Lighting electric 29.642Month Heating Solar Internal (L,O,E)
1 4.76 0.69 4.122 3.93 1.17 3.413 2.69 2.11 3.424 2.12 3.19 2.995 0.01 5.77 2.836 0.00 5.22 2.597 0.00 5.77 2.758 0.00 4.56 2.989 0.00 2.74 3.18
10 0.19 1.60 3.6311 4.09 0.93 3.8912 4.44 0.47 4.28
Total 22.23 34.22 40.07
14% Base caseValue in kWh Lighting electric 27.906Month Heating Solar Internal (L,O,E)
1 5.12 0.97 3.922 4.04 1.65 3.273 2.56 2.96 3.294 1.67 4.49 2.875 0.00 8.10 2.706 0.00 7.33 2.477 0.00 8.09 2.638 0.00 6.40 2.869 0.00 3.85 3.07
10 0.12 2.25 3.5111 4.31 1.31 3.7012 4.88 0.67 4.05
Total 22.69 48.09 38.33
10% with cargo doors openValue in kWh Lighting electric 29.642Month Heating Solar Internal (L,O,E)
1 4.76 0.69 4.122 3.93 1.17 3.413 2.71 2.11 3.424 2.19 3.19 2.995 0.01 5.77 2.836 0.02 5.22 2.597 0.00 5.77 2.758 0.00 4.56 2.989 0.01 2.74 3.18
10 0.32 1.60 3.6311 4.11 0.93 3.8912 4.45 0.47 4.28
Total 22.50 34.22 40.07
14% with cargo doors openValue in kWh Lighting electric 27.906Month Heating Solar Internal (L,O,E)
1 5.12 0.97 3.922 4.04 1.65 3.273 2.59 2.96 3.294 1.83 4.49 2.875 0.01 8.10 2.706 0.00 7.33 2.477 0.00 8.09 2.638 0.00 6.40 2.869 0.01 3.85 3.07
10 0.27 2.25 3.5111 4.34 1.31 3.7012 4.88 0.67 4.05
Total 23.09 48.09 38.33
Loads summary kWh/m2Heating Solar Internal Lighting
10% Base cas 22.23 34.22 40.07 29.6414% Base cas 22.69 48.09 38.33 27.9110% with carg 22.50 34.22 40.07 29.6414% with carg 23.09 48.09 38.33 27.91
CO2 emissions kg/m2Heating Solar Internal Lighting Heating+Lighting
10% Base cas 5.39 15.13 17.71 13.10 18.4914% Base cas 5.50 21.26 16.94 12.33 17.8410% with carg 5.46 15.13 17.71 13.10 18.5614% with carg 5.60 21.26 16.94 12.33 17.93
Base condition
0.0
1.0
2.0
3.0
4.0
5.0
6.0
7.0
8.0
9.0
1 2 3 4 5 6 7 8 9 10 11 12
Month
Load
s (k
Wh/
m2)
10% heating 14% heating10% solar 14% solar10% internal 14% internal
0
2
4
6
8
10
12
14
16
18
20
Heating Lighting Heating+Lighting
Load type
CO
2 em
issi
ons
(kg/
m2 )
10% Base case14% Base case10% with cargo doors open14% with cargo doors open
0.0
1.0
2.0
3.0
4.0
5.0
6.0
1 2 3 4 5 6 7 8 9 10 11 12
Month
Hea
ting
load
s (k
Wh/
m2)
10% Cargo doors 14% Cargo doors
10% base case 14% base case
Loads per floor area + CO2

Comparisons between 10% and 14% Grey thermal results.xls
10% Base caseCumulative Frequency (Hours) of Resultant Temperature for Year, Days 1 to 365Band (C) Total 20 21 22 23 24 25 26 27 28 29 30 31 32 33 34 35External - Lo 8760 1047 840 660 511 405 283 188 112 72 45 22 12 5 3 0 0Shed Groun 8760 4078 3656 3427 3081 2614 2226 1789 1361 876 552 313 153 69 35 13 0
14% Base caseCumulative Frequency (Hours) of Resultant Temperature for Year, Days 1 to 365Band (C) Total 20 21 22 23 24 25 26 27 28 29 30 31 32 33 34 35External - Lo 8760 1047 840 660 511 405 283 188 112 72 45 22 12 5 3 0 0Shed Groun 8760 4407 3831 3636 3440 3114 2720 2393 2029 1641 1246 870 571 352 203 103 44
10% with cargo doors openCumulative Frequency (Hours) of Resultant Temperature for Year, Days 1 to 365Band (C) Total 20 21 22 23 24 25 26 27 28 29 30 31 32 33 34 35External - Lo 8760 1047 840 660 511 405 283 188 112 72 45 22 12 5 3 0 0Shed Groun 8760 3696 2258 1270 878 593 384 218 111 58 28 11 4 0 0 0 0
14% with cargo doors openCumulative Frequency (Hours) of Resultant Temperature for Year, Days 1 to 365Band (C) Total 20 21 22 23 24 25 26 27 28 29 30 31 32 33 34 35External - Lo 8760 1047 840 660 511 405 283 188 112 72 45 22 12 5 3 0 0Shed Groun 8760 4022 2670 1602 1075 791 544 353 207 112 61 31 11 3 0 0 0
>20 >21 >22 >23 >24 >25 >26 >27 >28 >29 >30 >31 >32 >33 >34 >35External - Lo 11.95 9.59 7.53 5.83 4.62 3.23 2.15 1.28 0.82 0.51 0.25 0.14 0.06 0.03 0.00 0.0010% Base c 46.55 41.74 39.12 35.17 29.84 25.41 20.42 15.54 10.00 6.30 3.57 1.75 0.79 0.40 0.15 0.0014% Base c 50.31 43.73 41.51 39.27 35.55 31.05 27.32 23.16 18.73 14.22 9.93 6.52 4.02 2.32 1.18 0.5010% with ca 42.19 25.78 14.50 10.02 6.77 4.38 2.49 1.27 0.66 0.32 0.13 0.05 0.00 0.00 0.00 0.0014% with ca 45.91 30.48 18.29 12.27 9.03 6.21 4.03 2.36 1.28 0.70 0.35 0.13 0.03 0.00 0.00 0.00
Ground Floor
05
1015202530354045
>23 >24 >25 >26 >27 >28 >29 >30 >31 >32 >33 >34 >35
Temperatures (degree C)
% O
ccup
ied
hour
s
External - London weather data10% Base case14% Base case10% with cargo doors open14% with cargo doors open
35.17
10.00
39.27
18.73
10.02
0.66
12.27
1.28
0
5
10
15
20
25
30
35
40
45
23 28
Temperatures (C)
% O
ccup
ied
hour
s
10% Base case 14% Base case 10% with cargo doors open 14% with cargo doors open
25.41
10.00
31.05
18.73
4.38
0.66
6.21
1.28
0
5
10
15
20
25
30
35
25 28
Temperatures (C)
% O
ccup
ied
hour
s
10% Base case 14% Base case 10% with cargo doors open 14% with cargo doors open
Overheating(Groundfloor)

Comparisons between 10% and 14% Grey thermal results.xls
10% Base caseCumulative Frequency (Hours) of Resultant Temperature for Year, Days 1 to 365Band (C) Total 20 21 22 23 24 25 26 27 28 29 30 31 32 33 34 35External - Lo 8760 1047 840 660 511 405 283 188 112 72 45 22 12 5 3 0 0Shed Mezza 8760 4087 3646 3397 3071 2610 2221 1798 1367 944 589 378 206 96 46 24 4
14% Base caseCumulative Frequency (Hours) of Resultant Temperature for Year, Days 1 to 365Band (C) Total 20 21 22 23 24 25 26 27 28 29 30 31 32 33 34 35External - Lo 8760 1047 840 660 511 405 283 188 112 72 45 22 12 5 3 0 0Shed Mezza 8760 4381 3847 3647 3408 3086 2696 2380 2015 1639 1247 907 608 420 245 148 74
10% with cargo doors openCumulative Frequency (Hours) of Resultant Temperature for Year, Days 1 to 365Band (C) Total 20 21 22 23 24 25 26 27 28 29 30 31 32 33 34 35External - Lo 8760 1047 840 660 511 405 283 188 112 72 45 22 12 5 3 0 0Shed Mezza 8760 3637 2268 1406 986 711 497 322 187 97 54 25 10 4 0 0 0
14% with cargo doors openCumulative Frequency (Hours) of Resultant Temperature for Year, Days 1 to 365Band (C) Total 20 21 22 23 24 25 26 27 28 29 30 31 32 33 34 35External - Lo 8760 1047 840 660 511 405 283 188 112 72 45 22 12 5 3 0 0Shed Mezza 8760 3935 2616 1752 1213 916 674 491 311 191 112 62 33 14 5 0 0
>20 >21 >22 >23 >24 >25 >26 >27 >28 >29 >30 >31 >32 >33 >34 >35External - Lo 11.95 9.59 7.53 5.83 4.62 3.23 2.15 1.28 0.82 0.51 0.25 0.14 0.06 0.03 0.00 0.0010% Base c 46.66 41.62 38.78 35.06 29.79 25.35 20.53 15.61 10.78 6.72 4.32 2.35 1.10 0.53 0.27 0.0514% Base c 50.01 43.92 41.63 38.90 35.23 30.78 27.17 23.00 18.71 14.24 10.35 6.94 4.79 2.80 1.69 0.8410% with ca 41.52 25.89 16.05 11.26 8.12 5.67 3.68 2.13 1.11 0.62 0.29 0.11 0.05 0.00 0.00 0.0014% with ca 44.92 29.86 20.00 13.85 10.46 7.69 5.61 3.55 2.18 1.28 0.71 0.38 0.16 0.06 0.00 0.00
Mezzanine
05
1015202530354045
>23 >24 >25 >26 >27 >28 >29 >30 >31 >32 >33 >34 >35
Temperatures (degree C)
% O
ccup
ied
hour
s
External - London weather data10% Base case14% Base case10% with cargo doors open14% with cargo doors open
35.06
10.78
38.90
18.71
11.26
1.11
13.85
2.18
0
5
10
15
20
25
30
35
40
45
23 28
Temperatures (C)
% O
ccup
ied
hour
s
10% Base case 14% Base case 10% with cargo doors open 14% with cargo doors open
25.35
10.78
30.78
18.71
5.67
1.11
7.69
2.18
0
5
10
15
20
25
30
35
25 28
Temperatures (C)
% O
ccup
ied
hour
s
10% Base case 14% Base case 10% with cargo doors open 14% with cargo doors open
Overheating(Mezzanine)
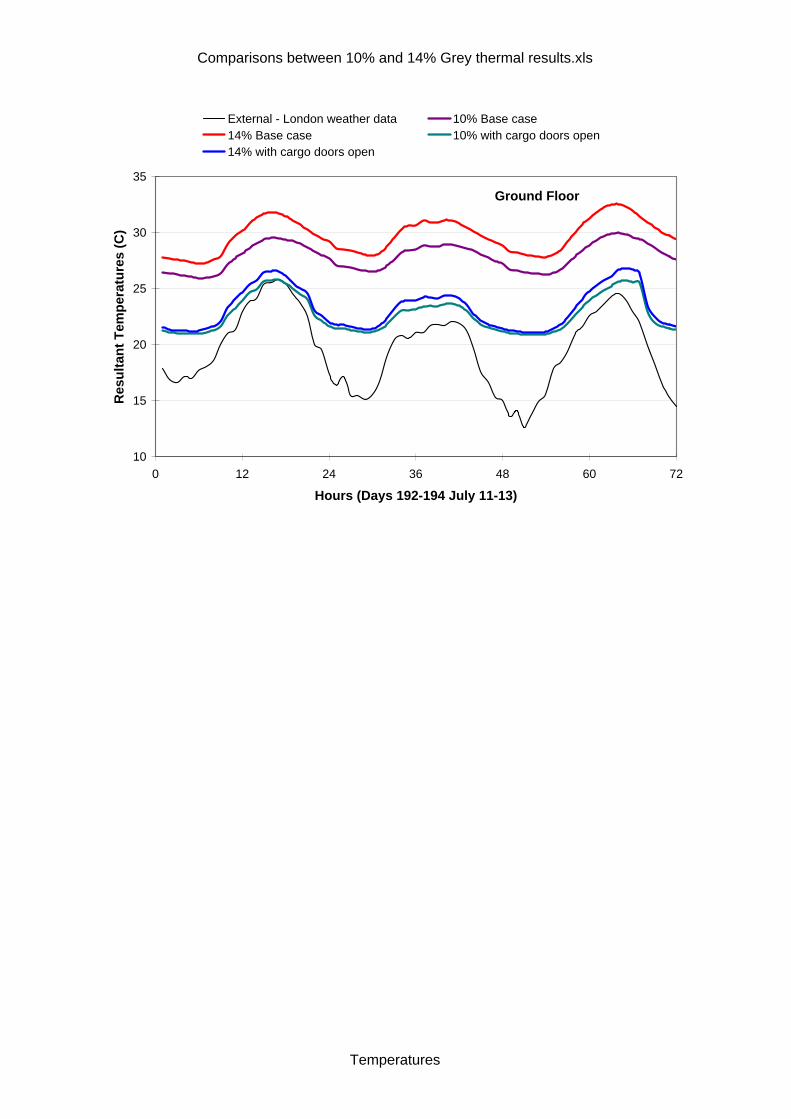
Comparisons between 10% and 14% Grey thermal results.xls
Ground Floor
10
15
20
25
30
35
0 12 24 36 48 60 72
Hours (Days 192-194 July 11-13)
Res
ulta
nt T
empe
ratu
res
(C)
External - London weather data 10% Base case14% Base case 10% with cargo doors open14% with cargo doors open
Temperatures