Embed Size (px)
Citation preview
Plan Sponsor Newsletter 2012 Issue 3
This newsletter is brought to you by
Investment Corner
01 International Investing Opportunities for Plan Participants
Strategies for Communicating with Participants
03 Finding Words That Work
What’s Up on Capitol Hill?
04 Rebuilding 401(k)s
Asset Class Score Card
07 The Winners and the Runners-Up
And More…
08 Upcoming Events
09 Compliance Calendar
10 What’s New on the IDCI Website
11 About IDCI
12 About Invesco
13 Index Definitions
A focus on international investing
Next

01 IDCI Matters Newsletter 2012 Issue 3For Plan Sponsor or Consultant Use Only
Investment Corner
International Investing Opportunities for Plan Participantsby Matthew Dennis, CFA, portfolio manager, Invesco international/global growth products
With 95% of the world’s population, 78% of the world’s GDP and 54% of the world’s market cap coming from beyond US borders,1 the question is becoming less “why” participants should allocate a portion of their retirement account to international investments, and more “how much” and “where” should they be allocating assets.
Even though more than 84% of profit sharing/401(k) plans offer an international stock fund as a stand-alone option in their line-ups, less than 10% of plan assets are allocated to an international strategy.2 Some of the reticence on the part of plan participants might be the perceived turmoil in international markets: International stock markets have certainly been challenged with the constant stream of recent negative economic news. In the Eurozone especially, debate over debt levels and austerity measures continue, while elections in Greece and France added to the uncertainty. In the Asia-Pacific region, markets struggled to rally in the face of the weak global macro environment.
The US has ranked in the top 10 performing countries only three times in the last 10 years.3
But we believe the flip side of the negative news is some compelling international opportunities for retirement plan investors who are willing to look beyond the near-term slowdown and negative headlines. Despite some of the challenges in current international markets, we believe exposure to this asset class may be a critical tool to help retirement plan participants develop a well-diversified portfolio.
Let’s take a look at how overseas regions fared through the first half of 2012.
With 54% of the world’s market cap outside the US, only 10% of DC plan assets are invested in international stock funds
Domestic stock 33.9
Target retirement/risk 17.7
Cash/Stable value 13.4
Balanced 6.5
International stock 9.9
Bonds 9.2
Company stock 4.0
Other 5.4
Source: PSCA 54th Annual Survey of Profit Sharing and 401(k) Plans
EuropeEurope is a focal point of most investors, with concerns including:•Southern European debt levels which
continued to rattle investors.•Northern Europe’s persistent demands
for austerity, particularly from the Germans, who hold the checkbook.
•Regulatory confusion and the fragile macroeconomic environment in Europe and beyond.
In Greece and France, elections in early May resulted in political shifts to the left and endorsement of more populist policies. In our opinion, the policy shifts upended market hopes for quick solutions and increased the probability of continued uncertainty and market volatility.
While it’s easy to get caught up in all of the negative headlines, stock prices of European companies seem to take into account these negative headlines, meaning many companies are selling at a discount.•The Eurozone is today trading at a
40% discount to the US.4
•That’s a very large discount that, in fact, puts Europe at a 40-year low on a relative basis to the US.4
•The US is clearly facing many challenges of its own, but arguably US valuations may not yet take into account those issues as much as European valuations already do.
Asia-Pacific ex-JapanIn the Asia-Pacific ex-Japan region, including China, negative numbers started to create more opportunities during the second quarter.
Previous Next
02
Investment Corner (continued)
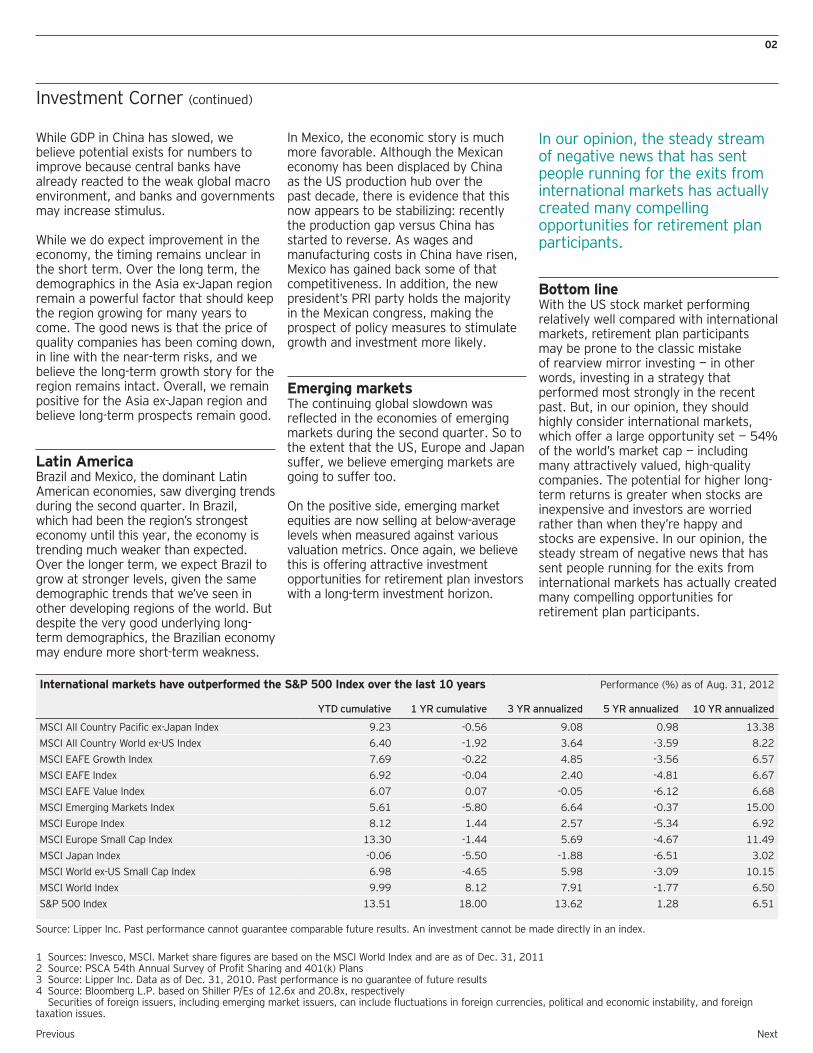
International markets have outperformed the S&P 500 Index over the last 10 years Performance (%) as of Aug. 31, 2012
YTD cumulative 1 YR cumulative 3 YR annualized 5 YR annualized 10 YR annualized
MSCI All Country Pacific ex-Japan Index 9.23 -0.56 9.08 0.98 13.38
MSCI All Country World ex-US Index 6.40 -1.92 3.64 -3.59 8.22
MSCI EAFE Growth Index 7.69 -0.22 4.85 -3.56 6.57
MSCI EAFE Index 6.92 -0.04 2.40 -4.81 6.67
MSCI EAFE Value Index 6.07 0.07 -0.05 -6.12 6.68
MSCI Emerging Markets Index 5.61 -5.80 6.64 -0.37 15.00
MSCI Europe Index 8.12 1.44 2.57 -5.34 6.92
MSCI Europe Small Cap Index 13.30 -1.44 5.69 -4.67 11.49
MSCI Japan Index -0.06 -5.50 -1.88 -6.51 3.02
MSCI World ex-US Small Cap Index 6.98 -4.65 5.98 -3.09 10.15
MSCI World Index 9.99 8.12 7.91 -1.77 6.50
S&P 500 Index 13.51 18.00 13.62 1.28 6.51
Source: Lipper Inc. Past performance cannot guarantee comparable future results. An investment cannot be made directly in an index.
While GDP in China has slowed, we believe potential exists for numbers to improve because central banks have already reacted to the weak global macro environment, and banks and governments may increase stimulus.
While we do expect improvement in the economy, the timing remains unclear in the short term. Over the long term, the demographics in the Asia ex-Japan region remain a powerful factor that should keep the region growing for many years to come. The good news is that the price of quality companies has been coming down, in line with the near-term risks, and we believe the long-term growth story for the region remains intact. Overall, we remain positive for the Asia ex-Japan region and believe long-term prospects remain good.
Latin AmericaBrazil and Mexico, the dominant Latin American economies, saw diverging trends during the second quarter. In Brazil, which had been the region’s strongest economy until this year, the economy is trending much weaker than expected. Over the longer term, we expect Brazil to grow at stronger levels, given the same demographic trends that we’ve seen in other developing regions of the world. But despite the very good underlying long-term demographics, the Brazilian economy may endure more short-term weakness.
In Mexico, the economic story is much more favorable. Although the Mexican economy has been displaced by China as the US production hub over the past decade, there is evidence that this now appears to be stabilizing: recently the production gap versus China has started to reverse. As wages and manufacturing costs in China have risen, Mexico has gained back some of that competitiveness. In addition, the new president’s PRI party holds the majority in the Mexican congress, making the prospect of policy measures to stimulate growth and investment more likely.
Emerging marketsThe continuing global slowdown was reflected in the economies of emerging markets during the second quarter. So to the extent that the US, Europe and Japan suffer, we believe emerging markets are going to suffer too.
On the positive side, emerging market equities are now selling at below-average levels when measured against various valuation metrics. Once again, we believe this is offering attractive investment opportunities for retirement plan investors with a long-term investment horizon.
In our opinion, the steady stream of negative news that has sent people running for the exits from international markets has actually created many compelling opportunities for retirement plan participants.
Bottom lineWith the US stock market performing relatively well compared with international markets, retirement plan participants may be prone to the classic mistake of rearview mirror investing — in other words, investing in a strategy that performed most strongly in the recent past. But, in our opinion, they should highly consider international markets, which offer a large opportunity set — 54% of the world’s market cap — including many attractively valued, high-quality companies. The potential for higher long-term returns is greater when stocks are inexpensive and investors are worried rather than when they’re happy and stocks are expensive. In our opinion, the steady stream of negative news that has sent people running for the exits from international markets has actually created many compelling opportunities for retirement plan participants.
1 Sources: Invesco, MSCI. Market share figures are based on the MSCI World Index and are as of Dec. 31, 20112 Source: PSCA 54th Annual Survey of Profit Sharing and 401(k) Plans3 Source: Lipper Inc. Data as of Dec. 31, 2010. Past performance is no guarantee of future results4 Source: Bloomberg L.P. based on Shiller P/Es of 12.6x and 20.8x, respectively Securities of foreign issuers, including emerging market issuers, can include fluctuations in foreign currencies, political and economic instability, and foreign taxation issues.
NextPrevious

03 IDCI Matters Newsletter 2012 Issue 3For Plan Sponsor or Consultant Use Only
Strategies for Communicating with Participants
Finding Words That Work
by David Saylor, Campaign Consultant, Invesco Consulting
Mr. Saylor currently directs LanguAGEwave, Fi-natical Curiosity, Income-ing Age and New Word Order consulting programs. He is the co-author of the books Get Inspired to Retire and The Language of Trust.
Which words resonate with investors today? “Dream retirement” or “comfortable retirement?” “Financial freedom” or “financial security?” “Investment solutions” or “investment strategies?” Invesco Consulting joined forces with the word specialists and political consulting firm, Maslansky Luntz + Partners (ml+p) in an effort to help plan sponsors and advisors communicate more effectively with participants. Maslansky Luntz + Partners, well known for shifting public opinion with phrases like “Contract with America,” “Death Tax” and “Energy Exploration,” applied their unique,
scientific research to investments. After five years of research, 15 dial sessions, and 4,300 investors surveyed, Invesco has learned the words to use and the words to lose in today’s New Word Order.
ExamplesYou say DREAM RETIREMENT and they hear…… you overpromising. Investors today are more realistic about what the financial markets can do for them – and do to them. Promises of hot stocks leading to ranches and racecars in retirement are no longer plausible.
Instead, try ... Investing for a COMFORTABLE retirement.1
When we asked investors what their top priority in retirement was, their responses were:•A Comfortable Retirement 61%•To Maintain My Current Lifestyle 29%•Achieving My Dream Retirement 10%
You say DOLLAR COST AVERAGING (DCA) and they hear……cost. Sure, investors are more sophisticated today. But they still don’t really know what DCA means. Why? The phrase is just not intuitive. “What is the average cost of a dollar?” they asked, while others focused on cost.”Is this an expense or an investment?”
Investors prefer the simple description: Automatic monthly investments.1
When we asked investors which phrase was most appealing, they answered:•Automatic monthly investments 28%•Dollar cost averaging 13%•Consistent monthly investments 27%•Regular interval investing 20%
You say NEST EGG and they hear…… chirping. Investors are befuddled by this term nest egg. Some are even upset. “Don’t call my money an egg. What do you think I am, a bird?” “Paycheck” was another word that did not resonate with investors. They said it made them feel like they were working in retirement.
Just call it what it is — investment income.1
When asked what interests them more, investors responded:•Retirement paycheck 8%•Investment income 27%•Retirement income 21%•Nest egg 8%
Look for information on the latest research on the Language of Risk in late 2012. For more information on words to use and words to lose, visit the participant communication strategies page on Invesco’s Defined Contribution Institute website at invesco.com/dc.
1 Based on our firm’s research with Maslansky Luntz + Partners 2007–2012
Previous Next

04
What’s Up on Capitol Hill?
Rebuilding 401(k)s
by Jon Vogler, senior analyst, retirement research
401(k) plans have evolved to be the predominant source of retirement wealth for most Americans. Two-thirds of employers (67%) report that these plans are the primary retirement savings vehicle for the employees they cover.1 And the plans have proved successful in helping workers save for retirement; more than $3 trillion has been accumulated in them as of the end of 2011.2
While 401(k) plans have positive attributes — convenience, tax deferral, participant investment selection from among plan offerings, employer matching and portability — there are concerns including limited participation, investment risks assumed by participants, lack of financial education and fee levels. In this article, we’ll examine some ways to rebuild these plans and address these concerns.
Increasing participationAdopt automatic enrollment. Auto enrollment in 401(k) plans has grown steadily since Pension Protection Act of 2006 rules clarified its use. Because only about half of US 401(k) plans currently have an auto enrollment feature, there is certainly room for further expansion.
Plan sponsors should consider automatically enrolling employees at a higher deferral percentage rate — say, 6% rather than the typical 3%. While some plan sponsors fear that participants will reject higher auto enrollment deferral rates, studies have shown that 60% of participants leave the default rate unchanged.3 In addition, plan sponsors should also consider extending auto enrollment to current employees as well as new hires.
While some plan sponsors fear that participants will reject higher auto enrollment deferral rates, studies have shown that 60% of participants leave the default rate unchanged.3
Focus on effective employee communication. Many employee communications are ineffective for one reason — new hires and participants don’t read them. And with the increasing adoption of automatic features, there is a need to move beyond traditional education that is entirely plan-centered, such as
the enrollment process or investments offered, toward engaging participants in a more personalized discussion about individual savings behaviors and strategies, such as their future monthly retirement income needs, spending power and projected retirement lifestyle.4
Preserve employer and worker incentives to contribute. A tax-reform proposal eliminating the existing favorable tax treatment of both employer and worker contributions was recently floated. A subsequent survey determined that if workers’ ability to deduct any amount of the 401(k) contribution from taxable income were removed, 65% of the plan sponsors surveyed would have less desire to continue offering their 401(k) plan.5 Retaining incentives for retirement plan savings is critical in the effort to maintain or increase participation.
If workers’ ability to deduct any amount of the 401(k) contribution from taxable income were removed, 65% of the plan sponsors surveyed would have less desire to continue offering their 401(k) plan.5
1 Hewitt, Trends and Experience in 401(k) Plans, 20092 Investment Company Institute, Investment Company Fact Book, 20123 Fidelity Perspectives, “Evaluating Auto Solutions,” summer 20094 Lincoln Financial Group, “Retirement Plan Communication in an Auto-Features World,” July 20125 Principal Financial Group Survey, June 2011
Previous Next

05 IDCI Matters Newsletter 2012 Issue 3For Plan Sponsor or Consultant Use Only
What’s Up on Capitol Hill? (continued)
Boosting savingsEncouraging more savings. Before the recent financial downturn, service providers and researchers estimated that, in retirement, workers would need to replace between 70% to 75% of preretirement income. While the replacement rate will differ for each person’s situation, estimates now drift toward 80% in the face of questions about Social Security, the rising cost of health care, longevity and other financial planning considerations.1
Despite a challenging economic environment, there may still be room for additional retirement savings. In a recent DC investor survey, 83% of respondents said they could cut their household budgets by at least 5% to save more, including 64% who said they could reduce their budgets by 10% or more.2
Adopt automatic escalation. Automatic escalation — with a ceiling that is typically 10%— has proved effective in ratcheting up savings rates. Plans with automatic escalation experienced deferral rates of 8% or higher compared with the average deferral rates of 4% or less for the majority of plans.3 Plan sponsors may wish to consider:•Raising automatic escalation above 10%.•Arranging (with an opt-out provision)
for a portion of each raise to flow automatically to the participant’s 401(k) account.
Encourage diversification. Professionally managed investment options can be a valuable tool in diversifying investments. The increasing use of target date funds as QDIAs has also helped with the diversification of assets within participant accounts.
Keep an eye on expenses. Plan sponsors should carefully track expenses since fees and expenses can significantly affect a participant’s total long-term earnings. Negotiating better fee arrangements could help drive down costs over time.
But plan sponsors must also consider the value and quality of investment options; the lowest-priced fund may not always be the best selection for plan participants.
“Stretch” the match. For example, rather than matching 50 cents on the dollar for the first 6% of an employee’s pay, an employer could consider “stretching” the match up to a higher percentage of pay, such as 30 cents on the first 10% of pay. Doing so may encourage participants to defer a higher percentage of pay to get the maximum match.
Fewer than half of US workers will have enough money saved to retire at 65. If they keep working until age 70, the picture improves dramatically, with 86% likely to be financially comfortable in retirement.1
Encourage participants to work longer. Fewer than half of US workers will have enough money saved to retire at 65.1 But according to a study by the Center for Retirement Research at Boston College,
if they keep working until age 70, the picture improves dramatically, with 86% likely to be financially comfortable in retirement. The study concludes that starting to save early for retirement and working longer are more effective levers for ensuring retirement security than earning a higher return on savings.1
While working full time past age 65 is not feasible for everyone, a phased retirement— as opposed to going straight from working life into full retirement— is set to become the norm as more people expect to continue some kind of work activity past traditional retirement age. While 54% of the current generation of retirees went straight from work into full retirement, only 30% of the current working generation expects a similar path.4
Improve plan loan features. When a participant retires or changes employers, any outstanding 401(k) plan loan balance is generally due in full within 60 days. Loans that default in this manner represent a form of “leakage” from the plan. Policymakers should consider extending the 401(k) loan repayment period for terminated participants.
1 Center for Retirement Research at Boston College, “How Much to Save for a Secure Retirement,” November 20112 State Street Global Advisors, Defined Contribution Investor Survey, July 20123 Lincoln Financial Group, “Retirement Plan Communication in an Auto-Features World,” July 20124 AEGON, “The Changing Face of Retirement,” June 2012
NextPrevious

06
1 State Street Global Advisors, Defined Contribution Investor Survey, July 20122 MetLife, Retirement Income Practices Study, 20123 Committee on Ways and Means Hearing on Tax Reform and Tax-Favored Accounts, ASPPA testimony, April 2012
What’s Up on Capitol Hill? (continued)
A provision of the Savings Enhancement by Alleviating Leakage in 401(k) Savings Act of 2011 (SEAL Act), introduced in November 2011, would allow a participant to contribute the outstanding plan loan amount to an IRA by the time they file taxes for that year. Other ideas for reforming 401(k) loans include enabling the outstanding loan balance to be transferred to another 401(k) plan, limiting the number or size of 401(k) loans, and automatically enrolling 401(k) borrowers into loan protection insurance.
People who default on plan loans get hit on three fronts: Aside from depleting their retirement accounts, they incur a tax on their borrowing and an additional penalty of 10% if they are under age 59½.
While working full time past age 65 is not feasible for everyone, a phased retirement — as opposed to going straight from working life into full retirement — is set to become the norm.
Enhancing financial educationClose the gap. A recent survey disclosed the gap between understanding what’s important and knowing how to take action. For example, 78% of respondents think it’s important to determine how much they’ll need to save to have a secure retirement, yet only 33% feel knowledgeable about it. Likewise, 82% think it’s important to know how to make retirement savings last a lifetime, but just 28% say they know how to achieve this.1
While the amount of accumulated savings is critical, a retirement plan’s success is increasingly being measured by how effectively a participant’s income will be replaced in retirement.
Focusing on outcomesEmphasize retirement income. While the amount of accumulated savings is critical, a retirement plan’s success is increasingly being measured by how effectively a participant’s income will be replaced in retirement. Retirement income options in DC plans help ensure that retirees can match income with expenses by allowing participants to think in monthly terms, as they would with DB plans. By putting savings into the context of the employee’s future income, plan sponsors can help participants estimate how much they will have when they retire, which can help them see the plan’s value. Gap analysis tells participants whether they are on course to have adequate retirement income, and if not, what they need to do.
Placing a higher priority on retirement income creates the need for more specialized education on such key issues as income replacement ratios, Social Security benefits, life expectancy, the probabilities of exceeding life expectancy and sustainable withdrawal rates in retirement.
Overcome obstacles to retirement income options. Currently, only 28% of plan sponsors provide online projections of the retirement income that can be generated from a participant’s 401(k) account, with roughly the same percentage showing this information on participant statements.2 Recent regulatory and legislative initiatives aim to raise these percentages:•Treasury Department guidance
on lifetime income options issued in February 2012 recognizes the importance of making retirement assets last for a lifetime.
•The Lifetime Income Disclosure Act, introduced in Congress in February 2011, would require DC plan sponsors to notify participants annually about the projected monthly income they could anticipate receiving (based on their account assets) if they take distributions as annuities.
•An upcoming Department of Labor rule on benefit statements will also demonstrate how to show participants how much their account balance would provide in terms of monthly income at retirement.
Retirement income options in DC plans are not currently popular; only 15% of plan sponsors offer a lifetime annuity payout option.2 There is increasing interest in overcoming obstacles to providing them. For participants, concerns include portability (within and outside of the plan), control, perceived complexity and cost. For plan sponsors, concerns include recordkeeping, the investment provider’s reputation, liability and product mitigation of risk.
Making 401(k) plans strongerWhile 401(k) plans have been successful in getting workers across all income levels to save for retirement,3 addressing concerns about retirement income will become increasingly important. Plan sponsors need to reframe the focus of their DC plans from savings to retirement income, and consider providing retirement income options to participants and educate them about the importance of generating a retirement income that can last a lifetime.
Previous Next

07 IDCI Matters Newsletter 2012 Issue 3For Plan Sponsor or Consultant Use Only
Source: Lipper, Inc. Data from Jan. 1, 2012, through Aug. 31, 2012. Past performance cannot guarantee future results. An investment cannot be made in an index. For index definitions, see page 13. The index performance shown is not meant to be a proxy for any Invesco product.
Asset Class Score Card
The Winners and the Runners-Up
Year-to-Date Performance as of Aug. 31, 2012
0 5 10 15 20
Commodities
Commodities
US
Non-US
Real Estate
Emerging Market Debt
International
High yield
Intermediate
Government
TIPS
Bonds
Emerging
Developed
Small-cap
Mid-cap
Large-cap
Value
Growth
International
US
Equities
3.86
17.54
21.95
9.26
3.17
10.59
3.85
2.35
1.29
5.61
9.99
10.60
11.63
13.37
12.19
14.55
6.92
13.51
Equities US — S&P 500 Index International — MSCI EAFE Index Growth — Russell 1000 Growth Index Value — Russell 1000 Value Index Large-cap — Russell 1000 Index Mid-cap — Russell Mid Cap Index Small-cap — Russell 2000 Index Developed — MSCI World Index Emerging — MSCI Emerging Markets Index
Bonds TIPS — Barclays U.S. TIPS Index Government — Barclays U.S. Govt Bond Index Intermediate — Barclays U.S. Aggregate Index High yield — Barclays High Yield Index nternational — Barclays Global Aggregate ex U.S. Index
Emerging Market — JP Morgan EMBI Global Diversified Composite
Real Estate Non-US — FTSE EPRA/NAREIT Dev Ex-U.S. Real Estate Index
US — FTSE NAREIT Equity REIT Index
Commodities Dow Jones — UBS Commodity Index
Previous Next

08
Pensions & Investments West Coast DC Conference
Nov. 4–6, 2012 | San Francisco
Featuring: David Gluch, CFA global asset allocation client portfolio manager, InvescoSpeaking on: War Gaming Your Target Date Fund
Webinars
Oct. 16, 2012, 2pm ET
Collective Trust Funds and the R6 Share Class: A Transparent Alternative For Your DC PlanHosted by PLANSPONSOR and featuring Betsy Warrick, vice president, Invesco National Trust Company, Greg Jenkins, CFA, consultant relations senior director, Invesco and Scott Faris, JD, CFA, senior consultant, Hyas Group
To register for our next webinar, visit invesco.com/dc
Are you looking for a resource to help benchmark your plan?
Invesco’s DC PlanAnalyzer Web tool can play a key role in helping you benchmark your plan. The tool uses PLANSPONSOR’s DC Survey data to enable you to compare plan design, investments, participant behavior and plan oversight with all plans in the survey and plans of similar size in the same or similar industry. To request a custom report using Invesco’s DC PlanAnalyzer Web tool, please email us at [email protected] for more information.
Upcoming Events
Invesco’s Defined Contribution Institute Upcoming EventsSpeaking engagements at industry conferences
NextPrevious

09 IDCI Matters Newsletter 2012 Issue 3For Plan Sponsor or Consultant Use Only
Defined Contribution Compliance CalendarFor plans in which the plan year-end falls on Dec. 31
Sept. 30•Deadline for distributing Summary Annual Report (SAR) to participants (provided deadline for Form 5500 was not extended)
Oct. 15•IRS Form 5500 due if IRS Form 5558 extension has been filed prior to the July 31, 2012 deadline
Nov. 14•Due date for first quarterly statements of fees and expenses actually deducted from participant accounts in participant-directed
DC plans
Dec. 1 •Deadline for sending annual 401(k) and (m) safe harbor notice•Deadline for sending annual qualified default investment alternative (QDIA) notice•Deadline for sending annual automatic contribution arrangement notice
Note: The above notices may be combined
Dec. 14•Extended deadline for distributing Summary Annual Report (SAR) to participants
Dec. 31•Deadline for processing corrective distributions for failed 2011 ADP/ACP test with 10% excise tax•Deadline for correcting a failed 2011 ADP/ACP test with qualified nonelective contributions (QNEC)•Deadline for amendment to convert existing 401(k) plan to safe harbor design for next plan year•Deadline for amendment to remove safe harbor status for next plan year•Minimum distributions due for participants who are age 70½ and have either retired or are 5% owners
Previous Next

10
What’s New
On Invesco’s Defined Contribution Institute website at invesco.com/dc
Since the Pension Protection Act of 2006, target date funds (TDFs) have been the focus of many discussions among plan sponsors, consultants, recordkeepers, investment managers, regulators and legislators, and for good reason. Defined contribution (DC) plans are in the midst of a major shift from supplemental assets for retirees to the primary means of saving for retirement. Combine this trend with the fact that TDFs are projected to be the largest recipient of future DC participant contributions and you definitely have something worth monitoring closely. Because many Americans will rely on TDFs to take them to, and possibly through, retirement, it’s important to ensure this one investment can carry that heavy burden.
The “to vs. through” glide path debate is important, but the backbone of the TDF — the asset allocation framework itself and its embedded assumptions — certainly deserves more attention.
We’ve assembled an outstanding team of industry experts to share their insights and perspectives on asset allocation frameworks for TDFs, including more traditional approaches and the risk parity approach.
Target Date Funds Are Projected to Be the Largest Holding of US Defined Contribution Participants by 2020Predicted allocation of the $7.7 trillion in US defined contribution assets in 2020 (%)
• Target Date Funds 48
• All Other DC Investment Options 52
Source: Casey Quirk & Associates
Moderator:Peter GallagherNational Sales Manager, Institutional Business Development, Invesco
Contributor:Scott Wolle, CFA, CIOGlobal Asset Allocation, Invesco
Contributor:Phillip Nelson, CFAResearch Consultant, NEPC
Brought to you by:
Retirement Round-table Risk Parity: Challenging
the traditional asset allocation framework of target date funds
Retirement Roundtable — Risk Parity for DC Plans
Retirement industry experts discuss challenging the traditional asset allocation framework of target date funds.
Read the Retirement Roundtable.
Risk Parity for Defined Contribution Plans Thank you for your interest in the recent aiCIO webcast sponsored by Invesco. If you missed the webcast, you can now listen to the replay of Kip McDaniel, editor-in-chief of aiCIO, and Invesco's David Gluch, as they cover the following key points:
• Target date funds (TDFs) are projected to be the largest holding of U.S.defined contribution assets in the future; • Equity exposure and dependence are still issues for those TDFs built upon a traditional asset allocation framework; in contrast, a risk parity asset allocation approach starts with balancing risk across non-correlated assets; • A TDF employing risk parity may help prepare plan participants for all economic environments — recessionary, inflationary and non-inflationary growth; and • Risk parity can be used as either a core holding or as a component within a custom target-date fund.
For additional information, please contact: mailto:[email protected]
EXPLORE MORE RESOURCES
Retirement Roundtable: Risk Parity
Kip McDaniel Editor-in-Chief aiCIO
David Gluch Client Portfolio Manager Invesco
Page 1 of 1Untitled
9/11/2012mhtml:file://\\iiatlfil1\users\donovh\My Documents\PLANSPONSOR Webcast - Risk Parity\Replay - 360 email\Webcast 360 rep...
Webcast Replay: Risk Parity in DC Plans
Moderated by Kip McDaniel, aiCIO editor-in-chief, featuring guest panelist David Gluch, Invesco client portfolio manager.
Watch the webcast.1
August 2012, Number 12-15
2010 SCF SUGGESTS EVEN GREATER
RETIREMENT RISKS
* Alicia H. Munnell is director of the Center for Retirement Research at Boston College and the Peter F. Drucker Professor of Management Sciences at Boston College’s Carroll School of Management. This brief updates a previous analysis (Munnell, Webb, and Delorme 2006).
Introduction People often ask how baby boomers compare with their parents in terms of being prepared for retire-ment. The easiest way to answer that question is to look at the ratio of wealth to income from the 2010 Survey of Consumer Finances (SCF), the Federal Re-serve’s comprehensive triennial survey of household wealth in the United States, and compare it to earlier surveys.1 The notion is that the wealth-to-income ra-tio is a good proxy for the extent to which people can replace their pre-retirement earnings in retirement.
This brief proceeds as follows. The first section shows the wealth-to-income ratio for each SCF survey from 1983 through 2010. The ratio in 2010, in the wake of the financial crisis and ensuing recession, was way below that for all the other survey years. The second section identifies four reasons why people need a higher wealth-to-income ratio to be as well off as their parents – increased life expectancy, the shift to 401(k)s, higher health care costs, and lower real interest rates. The third section concludes that the constant ratio of wealth to income between 1983 and 2007 should never have been a source of comfort. The world has changed in important ways that all
require more wealth to sustain living standards in retirement. Thus, the sharp decline in the wealth-to-income ratio reported in the 2010 SCF signals even more serious problems for future retirees.
Ratio of Wealth to IncomeFigure 1 on the next page presents the ratio of wealth to income by age for each Survey of Consumer Finances from 1983 through 2010. Wealth includes all finan-cial assets, 401(k) accumulations, and real estate less any outstanding debt. Income includes earnings and returns on financial assets.2 The wealth-to-income ratio is a good indication of the extent to which people can replace their pre-retirement earnings in retire-ment.
Do not try to distinguish among the individual lines in Figure 1. The point of the chart is that the ratios for each age from each survey lie virtually on top of one another. That is, the pattern of wealth ac-cumulation by age appears to have remained virtually unchanged over the nine surveys from 1983 to 2007.
By Alicia H. Munnell*
R E S E A R C HRETIREMENT 2010 SCF Suggests Even Greater Retirement Risks
The Center for Retirement Research at Boston College discusses the latest 2010 Survey of Consumer Finances reflecting a substantial drop in wealth-to-income ratios, signaling even more serious problems ahead for future retirees.
Read the brief.
1 The above link will direct you to a site not affiliated with Invesco. This site is for informational purposes only. Invesco does not guarantee nor take any responsibility for the content.
NextPrevious

11 IDCI Matters Newsletter 2012 Issue 3For Plan Sponsor or Consultant Use Only
About IDCI
The Institute’s MissionTo help plan sponsors and their consultants build better plans with insights from Invesco’s experts on specific aspects of plan management. Our areas of expertise include: •Asset allocation frameworks and alternative asset classes.•Legislative and regulatory changes.•Alternative funding options — collective trusts and ETFs.•Participant communication strategies.
The Institute’s WorkWe deliver expert insights for plan sponsors: •Insights and commentary, including investment, legislative and retirement matters•Newsletters designed specifically for plan sponsors•Timely Web forums focused on the latest retirement trends and topics •Industry leadership as subject matter expert panelists at industry forums
Previous Next

12
About Invesco
Explore Intentional Investing with InvescoSM
Commitment to investment excellenceWe believe the best investment insights come from specialized investment teams with discrete investment perspectives, operating under a disciplined philosophy and process with strong risk oversight and quality controls. This approach enables our portfolio managers, analysts and researchers to pursue consistent, repeatable results — results that are aligned with client expectations.
We support an investment-centric culture that minimizes noninvestment distractions. That allows our investment teams to focus their energy and talent on seeking superior investment opportunities around the globe.
We believe high-quality results begin with specialized insight and disciplined oversight.
Depth of investment capabilitiesInvestors need choices to tailor their financial plans to their objectives. Our long history of providing client-driven investment solutions means we offer a wide range of single-country, regional and global capabilities across major equity, fixed income and alternative asset classes.
We deliver those capabilities through a diverse set of investment vehicles, from open- and closed-end mutual funds to ETFs, unit investment trusts, cash products, collective trusts, separate accounts for retail and institutional clients, and more.
Our wide range of investment capabilities is designed to support a variety of financial objectives.
Organizational strengthAt Invesco, we believe focus brings success. That’s why investment management is all we do. We direct all of our intellectual capital, global strength and operational stability toward helping investors achieve their long-term financial objectives.
As an independent firm, our global organization is solely focused on investment management.
Intentional InvestingSM is the science and art of investing with purpose, prudence and diligence. It’s the philosophy that forms the foundation of our “investors first” approach, exemplified by our:
NextPrevious

13 IDCI Matters Newsletter 2012 Issue 3For Plan Sponsor or Consultant Use Only
All data as of Dec. 31, 2011, unless otherwise noted.
Index Definitions
Barclays Global Aggregate ex U.S. Index is an unmanaged index considered representative of bonds of foreign countries.
Barclays High Yield Index is an unmanaged index that covers the US dollar-denominated, non-investment grade, fixed-rate, taxable corporate bond market.
Barclays U.S. Aggregate Index is an unmanaged index considered representative of the US investment-grade, fixed-rate bond market.
Barclays U.S. Government Bond Index is a market value weighted index of US Government and government agency securities (other than mortgage securities) with maturities of one year or more.
Barclays U.S. TIPS Index is an unmanaged index that measures the performance of The US Treasury Inflation Protected Securities (“TIPS”) market.
Dow Jones-UBS Commodity IndexSM is a broadly diversified index that allows investors to track commodity futures through a single, simple measure.
FTSE EPRA/NAREIT Developed ex U.S. Real Estate Index is an unmanaged index considered representative of real estate companies and REITs outside of the US.
FTSE NAREIT Equity REITs Index is an unmanaged index considered representative of US REITs.
JP Morgan EMBI Global Diversified Index is a uniquely weighted index that tracks total returns for US dollar- denominated Brady bonds, Eurobonds, traded loans, and local market debt instruments issued by sovereign and quasi-sovereign entities.
MSCI All Country Pacific ex-Japan Index is an unmanaged index considered representative of Pacific region stock markets, excluding Japan.
MSCI All Country World ex-US Index is an index considered representative of stock markets of developed and emerging markets, excluding those of the US.
MSCI Emerging Markets Index® is an unmanaged index considered representative of stocks of developing countries.
MSCI EAFE® Index is an unmanaged index considered representative of stocks of Europe, Australasia and the Far East.
MSCI EAFE® Growth Index is an unmanaged index considered representative of growth stocks of Europe, Australasia and the Far East.
MSCI EAFE® Value Index is an unmanaged index considered representative of value stocks of Europe, Australasia and the Far East.
MSCI Europe IndexSM
is an unmanaged index considered representative of stocks of developed European countries.
MSCI Europe Small Cap Indexis an unmanaged index considered representative of small-cap European stocks.
MSCI Japan Indexis an unmanaged index considered representative of stocks of Japan.
MSCI World Index® is an unmanaged index considered representative of stocks of developed countries.
MSCI World Ex-US Small Cap Index is an unmanaged index considered representative of small-cap stocks of global developed markets, excluding those of the US.
Russell 1000® Growth Index is an unmanaged index considered representative of large-cap growth stocks. The Russell 1000 Growth Index is a trademark/service mark of the Frank Russell Co. Russell® is a trademark of the Frank Russell Co.
Previous Next

14
All data as of Dec. 31, 2011, unless otherwise noted.
Index Definitions (continued)
Russell 1000® Index is an unmanaged index considered representative of large-cap stocks. The Russell 1000 Index is a trademark/service mark of the Frank Russell Co. Russell® is a trademark of the Frank Russell Co.
Russell 1000® Value Index is an unmanaged index considered representative of large-cap value stocks. The Russell 1000 Value Index is a trademark/service mark of the Frank Russell Co. Russell® is a trademark of the Frank Russell Co.
Russell 2000® Index is an unmanaged index considered representative of small-cap stocks. The Russell 2000 Index is a trademark/service mark of the Frank Russell Co. Russell® is a trademark of the Frank Russell Co.
Russell Midcap® Index is an unmanaged index considered representative of mid-cap stocks. The Russell Midcap Index is a trademark/service mark of the Frank Russell Co. Russell® is a trademark of the Frank Russell Co.
S&P 500® Index is an unmanaged index considered representative of the US stock market.
NextPrevious

This newsletter is not intended to be legal or tax advice or to offer a comprehensive resource for tax-qualified retirement plans. Always consult your own legal or tax professional for information concerning your individual situation. All material presented is compiled from sources believed to be reliable and current, but accuracy cannot be guaranteed. This is not to be construed as an offer to buy or sell any financial instruments and should not be relied upon as the sole factor in an investment making decision. As with all investments there are associated inherent risks. Please obtain and review all financial material carefully before investing. Note: For more information on any of the topics discussed please contact your Invesco Representative.
invesco.com/dc IDCI-NLR-3-E 09/12 Invesco Distributors, Inc. 12926
Previous