Embed Size (px)
Citation preview
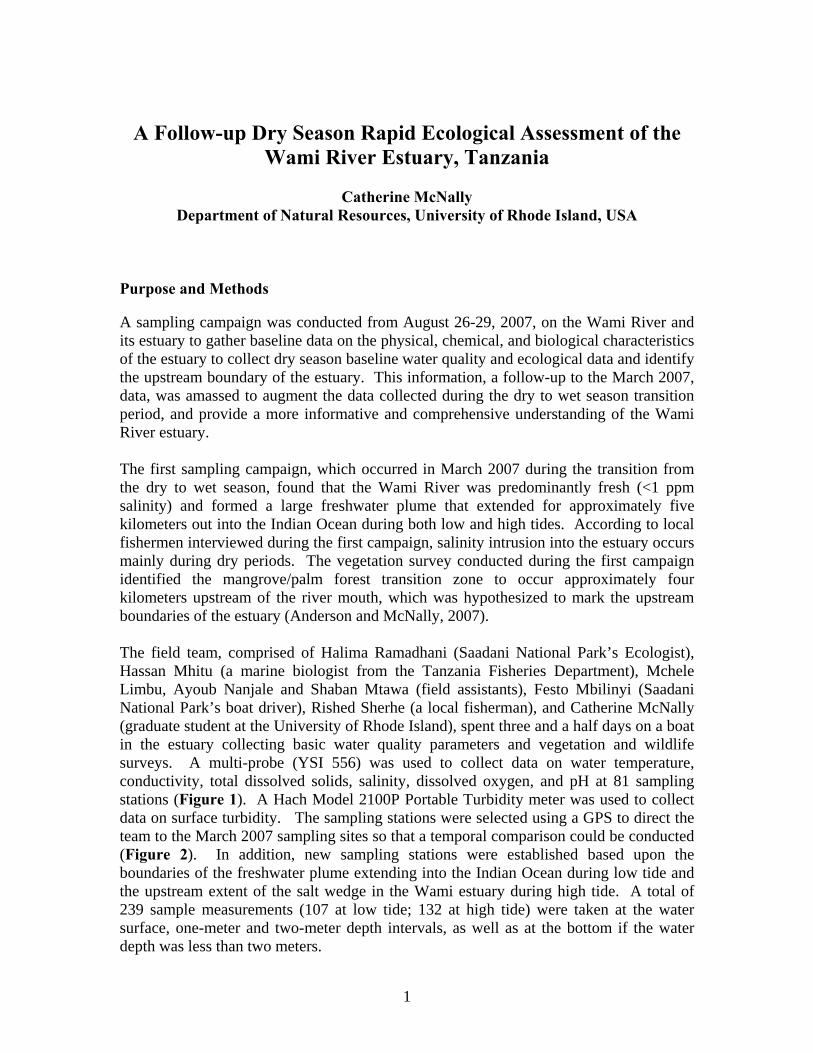
A Follow-up Dry Season Rapid Ecological Assessment of the
Wami River Estuary, Tanzania
Catherine McNally Department of Natural Resources, University of Rhode Island, USA
Purpose and Methods A sampling campaign was conducted from August 26-29, 2007, on the Wami River and its estuary to gather baseline data on the physical, chemical, and biological characteristics of the estuary to collect dry season baseline water quality and ecological data and identify the upstream boundary of the estuary. This information, a follow-up to the March 2007, data, was amassed to augment the data collected during the dry to wet season transition period, and provide a more informative and comprehensive understanding of the Wami River estuary. The first sampling campaign, which occurred in March 2007 during the transition from the dry to wet season, found that the Wami River was predominantly fresh (<1 ppm salinity) and formed a large freshwater plume that extended for approximately five kilometers out into the Indian Ocean during both low and high tides. According to local fishermen interviewed during the first campaign, salinity intrusion into the estuary occurs mainly during dry periods. The vegetation survey conducted during the first campaign identified the mangrove/palm forest transition zone to occur approximately four kilometers upstream of the river mouth, which was hypothesized to mark the upstream boundaries of the estuary (Anderson and McNally, 2007). The field team, comprised of Halima Ramadhani (Saadani National Park’s Ecologist), Hassan Mhitu (a marine biologist from the Tanzania Fisheries Department), Mchele Limbu, Ayoub Nanjale and Shaban Mtawa (field assistants), Festo Mbilinyi (Saadani National Park’s boat driver), Rished Sherhe (a local fisherman), and Catherine McNally (graduate student at the University of Rhode Island), spent three and a half days on a boat in the estuary collecting basic water quality parameters and vegetation and wildlife surveys. A multi-probe (YSI 556) was used to collect data on water temperature, conductivity, total dissolved solids, salinity, dissolved oxygen, and pH at 81 sampling stations (Figure 1). A Hach Model 2100P Portable Turbidity meter was used to collect data on surface turbidity. The sampling stations were selected using a GPS to direct the team to the March 2007 sampling sites so that a temporal comparison could be conducted (Figure 2). In addition, new sampling stations were established based upon the boundaries of the freshwater plume extending into the Indian Ocean during low tide and the upstream extent of the salt wedge in the Wami estuary during high tide. A total of 239 sample measurements (107 at low tide; 132 at high tide) were taken at the water surface, one-meter and two-meter depth intervals, as well as at the bottom if the water depth was less than two meters.
1
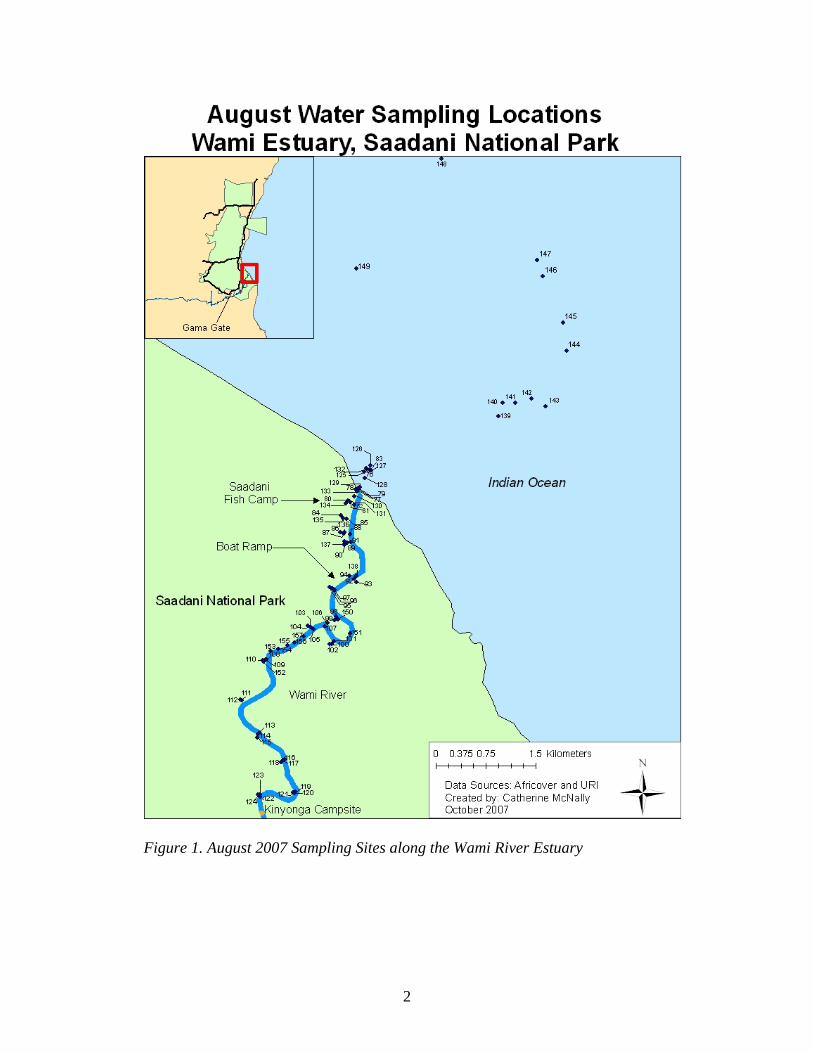
Figure 1. August 2007 Sampling Sites along the Wami River Estuary
2
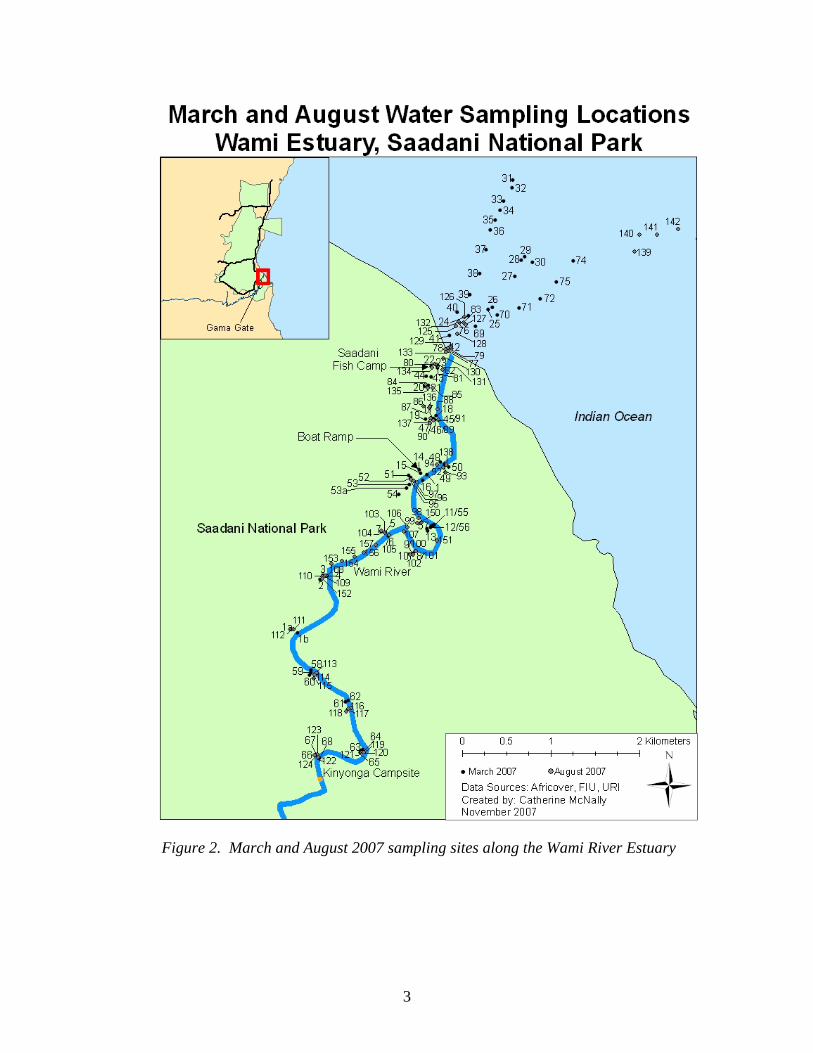
Figure 2. March and August 2007 sampling sites along the Wami River Estuary
3
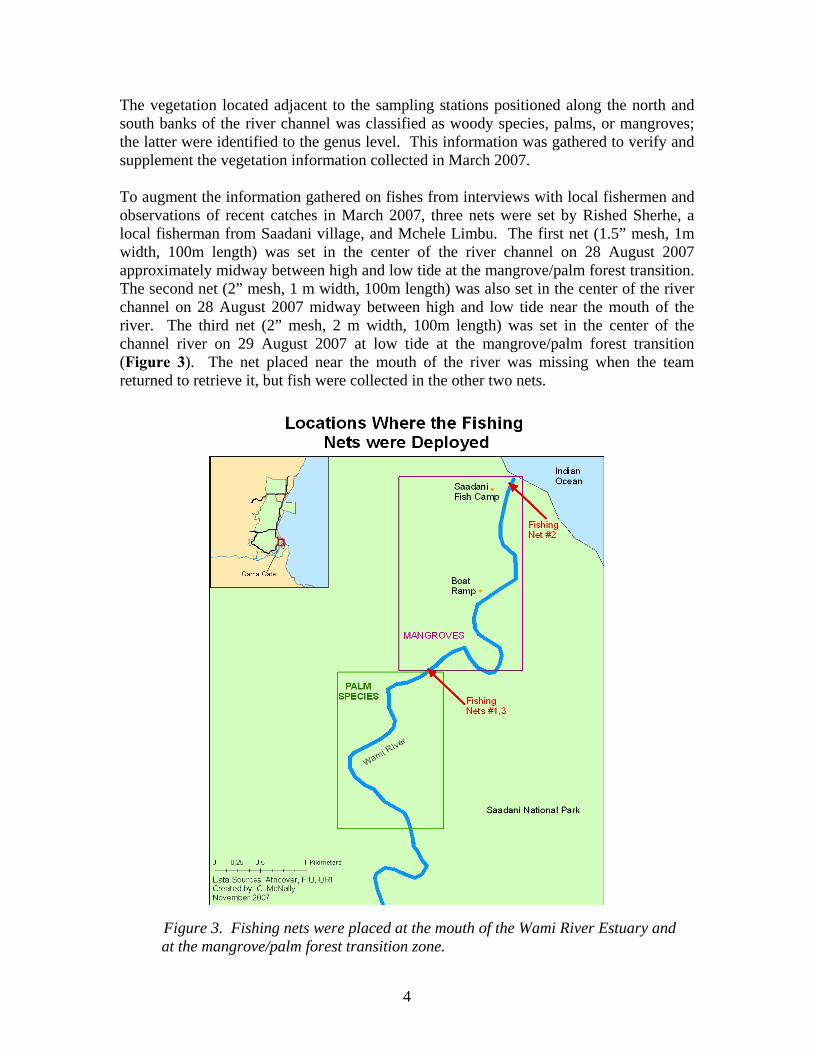
The vegetation located adjacent to the sampling stations positioned along the north and south banks of the river channel was classified as woody species, palms, or mangroves; the latter were identified to the genus level. This information was gathered to verify and supplement the vegetation information collected in March 2007. To augment the information gathered on fishes from interviews with local fishermen and observations of recent catches in March 2007, three nets were set by Rished Sherhe, a local fisherman from Saadani village, and Mchele Limbu. The first net (1.5” mesh, 1m width, 100m length) was set in the center of the river channel on 28 August 2007 approximately midway between high and low tide at the mangrove/palm forest transition. The second net (2” mesh, 1 m width, 100m length) was also set in the center of the river channel on 28 August 2007 midway between high and low tide near the mouth of the river. The third net (2” mesh, 2 m width, 100m length) was set in the center of the channel river on 29 August 2007 at low tide at the mangrove/palm forest transition (Figure 3). The net placed near the mouth of the river was missing when the team returned to retrieve it, but fish were collected in the other two nets.
Figure 3. Fishing nets were placed at the mouth of the Wami River Estuary and
at the mangrove/palm forest transition zone.
4
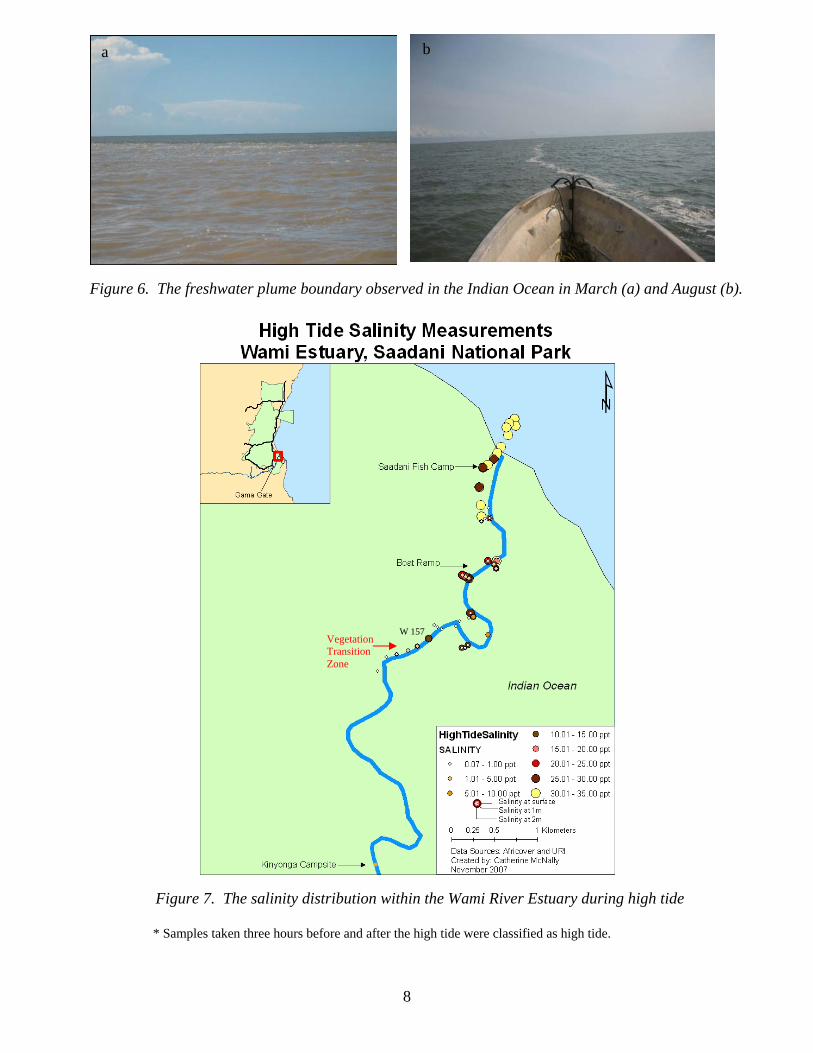
A formal bird count, which lasted approximately 2.5 hours, was conducted from the boat along the Wami River starting from its mouth and continuing until the area near Kinyonga campsite the morning of 28 August 2007. The bird count conducted in March 2007 covered the area up to Gama Gate, but due to shallower water depth our team did not travel upstream of the Kinyonga campsite. Birds observed were identified to species where possible by the field team using the Birds of Kenya and Northern Tanzania field guide and Field Guide to the Birds of East Africa. The presence and location of hippopotamus, crocodiles, and colobus monkeys observed throughout the field sampling campaign were recorded. Additional information was gathered on the various hippopotamus groups from discussions with Festo Mbilinyi, the boat driver who has worked at Saadani National Park for four years. Results and Discussion During the low tide events, water within the river channel was mainly fresh (0.07 – 0.4 ppt), while minimally brackish (2.95 ppt) in an area subject to direct influence of a tidal creek (Figure 4). As observed in March, a large freshwater plume extended approximately five kilometers into the Indian Ocean, but only during periods of low tide. The dry season (August) freshwater plume was observed to extend in a more northerly direction than the freshwater plume observed during the transition between the dry and wet season (March) (Figure 5). A visible line demarcated the edge of the freshwater plume, but it was not as distinct as the line observed in March (Figure 6). During the high tide events, a salt wedge, which is distinguished by a large difference in salinity between surface, water column, and bottom waters along a gradient, was observed approximately four kilometers upstream of the river mouth corresponding to the mangrove/palm forest vegetation transition zone. The greatest salinity values were observed within this transition zone at high tide on 28 August 2007 at sampling station W157, and were 13.25 ppt at the surface, 16.6 ppt at a depth of one meter, 20.82 at a depth of two meters, and 22.59 ppt at a depth of approximately 2.3 meters (Figure 7). Data from the five sampling stations located just downstream of sampling station W157 were collected on 26 August 2007, approximately one to two hours after high tide. The highest salinity values recorded at that time were 0.1 ppt. This demonstrates how quickly the salinity values in this area fluctuate from greater than 20 ppt to less than 1 ppt. According to SANAPA personnel, the saltwater moves up the estuary through the deeper areas of the river channel during high tide (personal comm., Festo Mbilinyi 2007). Salinity values of 25 to 35 ppt were observed to extend approximately one kilometer upstream of the mouth of the river during high tide. In addition, a foam boundary, which demarcated the upstream extent of the salt wedge, was observed moving up the river during the high tide (Figure 8).
5
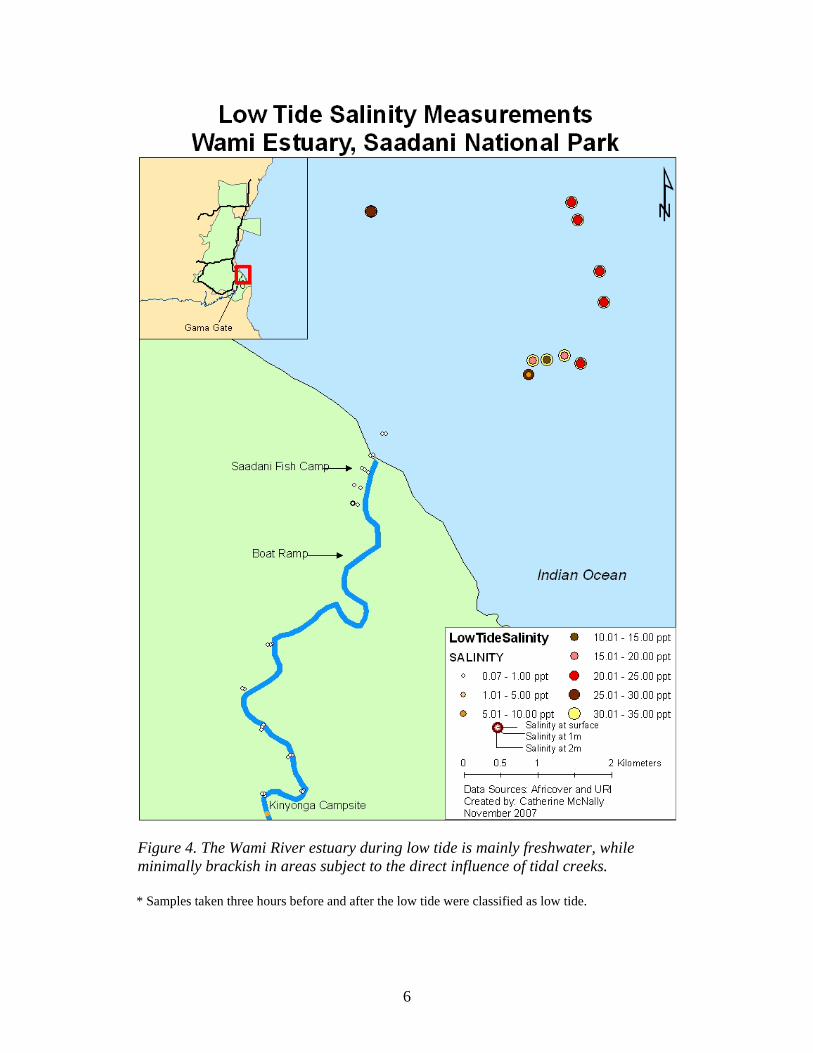
Figure 4. The Wami River estuary during low tide is mainly freshwater, while minimally brackish in areas subject to the direct influence of tidal creeks.
* Samples taken three hours before and after the low tide were classified as low tide.
6
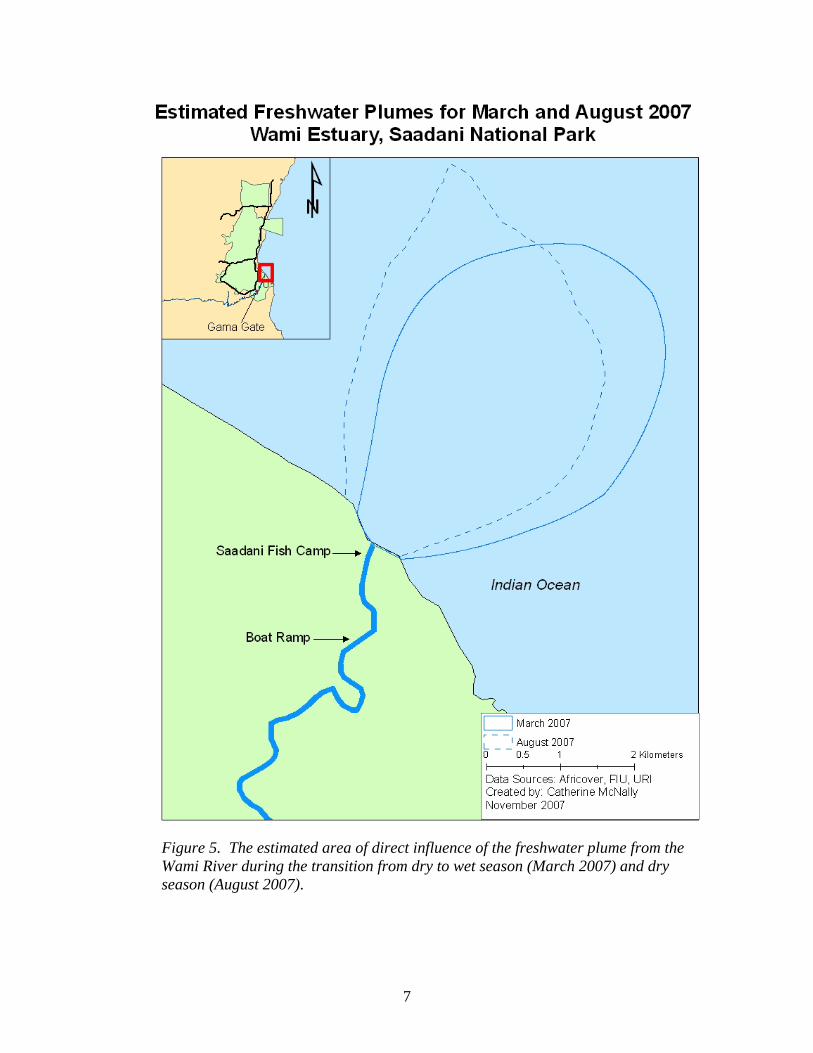
Figure 5. The estimated area of direct influence of the freshwater plume from the Wami River during the transition from dry to wet season (March 2007) and dry season (August 2007).
7
b
a
Figure 6. The freshwater plume boundary observed in the Indian Ocean in March (a) and August (b).
W 157 Vegetation Transition Zone
Figure 7. The salinity distribution within the Wami River Estuary during high tide
* Samples taken three hours before and after the high tide were classified as high tide.
8
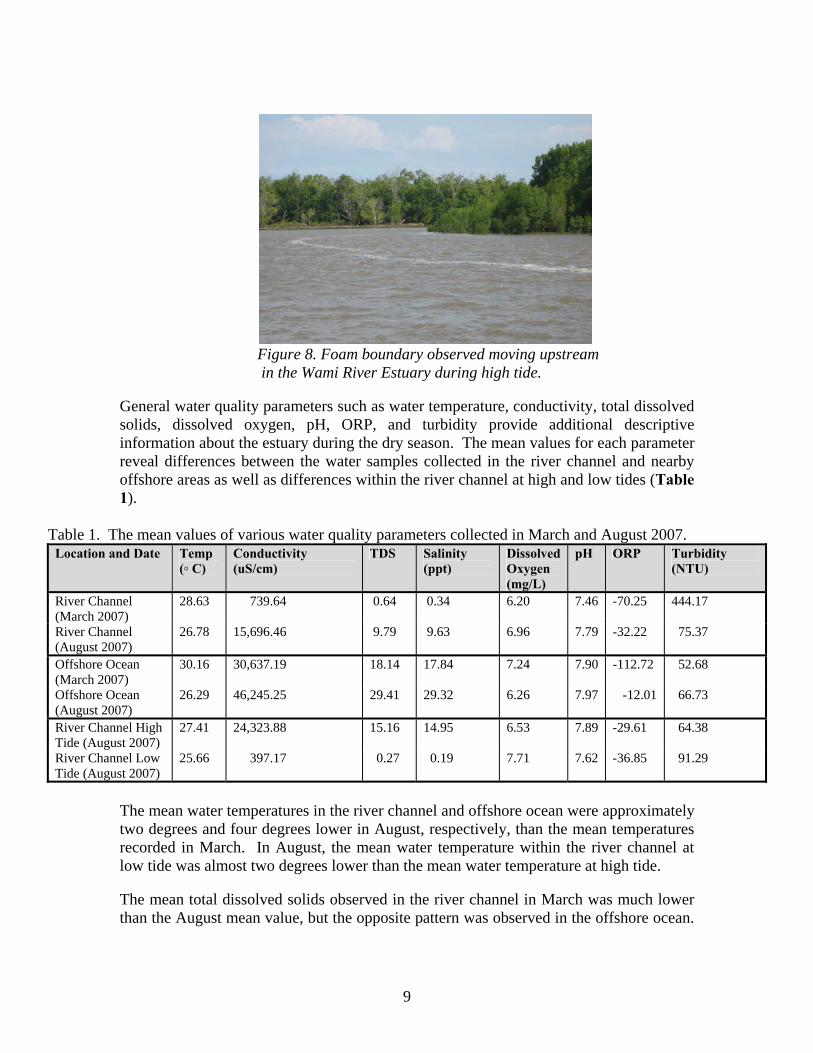
Figure 8. Foam boundary observed moving upstream in the Wami River Estuary during high tide.
General water quality parameters such as water temperature, conductivity, total dissolved solids, dissolved oxygen, pH, ORP, and turbidity provide additional descriptive information about the estuary during the dry season. The mean values for each parameter reveal differences between the water samples collected in the river channel and nearby offshore areas as well as differences within the river channel at high and low tides (Table 1).
Table 1. The mean values of various water quality parameters collected in March and August 2007. Location and Date Temp
(◦ C) Conductivity (uS/cm)
TDS Salinity (ppt)
Dissolved Oxygen (mg/L)
pH ORP Turbidity (NTU)
River Channel (March 2007)
28.63 739.64 0.64 0.34 6.20 7.46 -70.25 444.17
River Channel (August 2007)
26.78 15,696.46 9.79 9.63 6.96 7.79 -32.22 75.37
Offshore Ocean (March 2007)
30.16 30,637.19 18.14 17.84 7.24 7.90 -112.72 52.68
Offshore Ocean (August 2007)
26.29 46,245.25 29.41 29.32 6.26 7.97 -12.01 66.73
River Channel High Tide (August 2007)
27.41 24,323.88 15.16 14.95 6.53 7.89 -29.61 64.38
River Channel Low Tide (August 2007)
25.66 397.17 0.27 0.19 7.71 7.62 -36.85 91.29
The mean water temperatures in the river channel and offshore ocean were approximately two degrees and four degrees lower in August, respectively, than the mean temperatures recorded in March. In August, the mean water temperature within the river channel at low tide was almost two degrees lower than the mean water temperature at high tide. The mean total dissolved solids observed in the river channel in March was much lower than the August mean value, but the opposite pattern was observed in the offshore ocean.
9
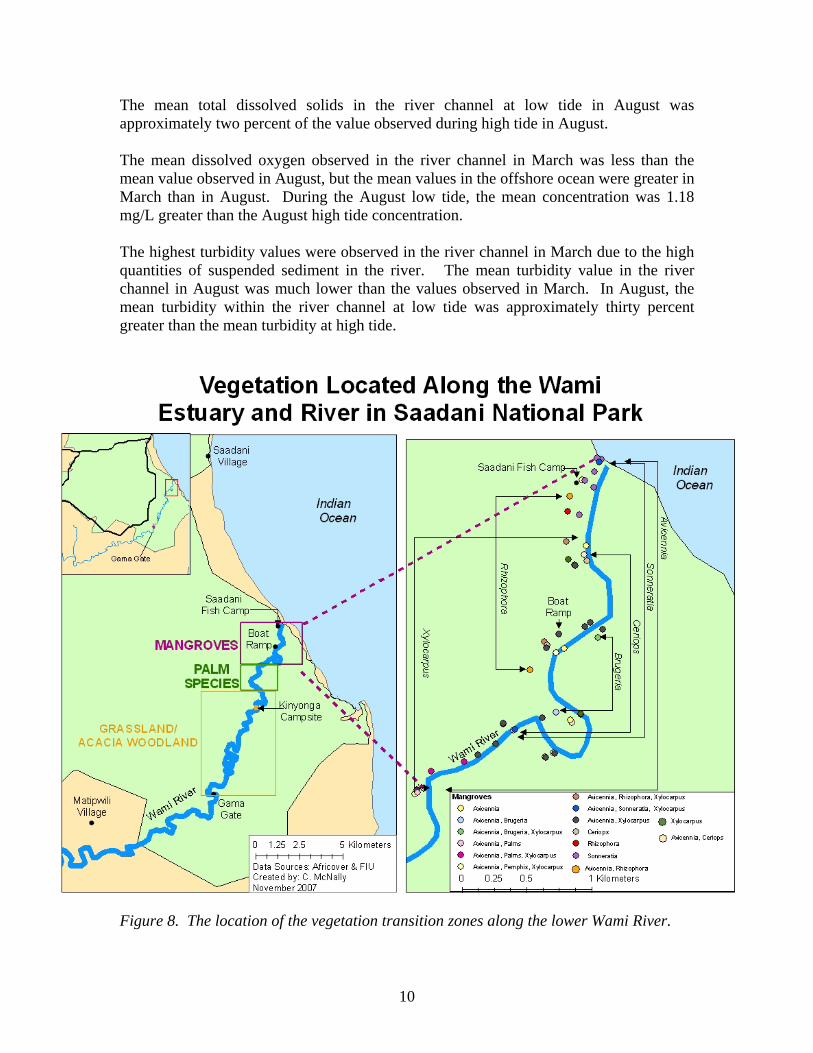
The mean total dissolved solids in the river channel at low tide in August was approximately two percent of the value observed during high tide in August. The mean dissolved oxygen observed in the river channel in March was less than the mean value observed in August, but the mean values in the offshore ocean were greater in March than in August. During the August low tide, the mean concentration was 1.18 mg/L greater than the August high tide concentration. The highest turbidity values were observed in the river channel in March due to the high quantities of suspended sediment in the river. The mean turbidity value in the river channel in August was much lower than the values observed in March. In August, the mean turbidity within the river channel at low tide was approximately thirty percent greater than the mean turbidity at high tide.
Figure 8. The location of the vegetation transition zones along the lower Wami River.
10
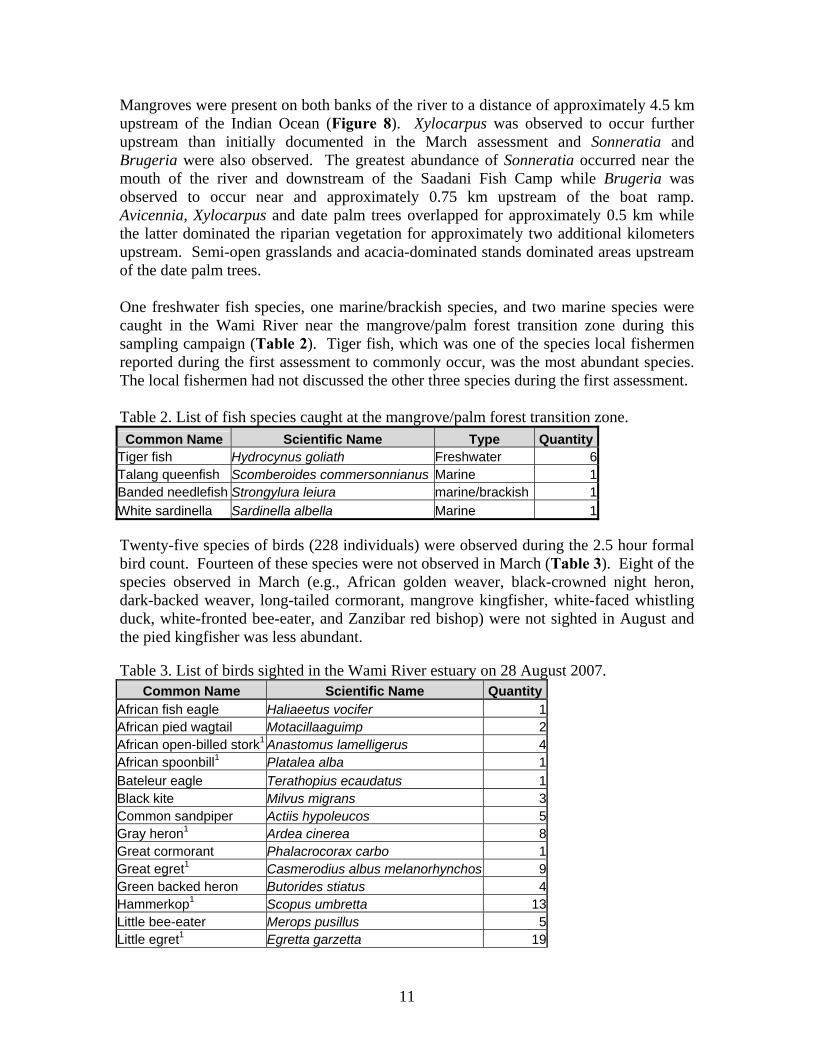
Mangroves were present on both banks of the river to a distance of approximately 4.5 km upstream of the Indian Ocean (Figure 8). Xylocarpus was observed to occur further upstream than initially documented in the March assessment and Sonneratia and Brugeria were also observed. The greatest abundance of Sonneratia occurred near the mouth of the river and downstream of the Saadani Fish Camp while Brugeria was observed to occur near and approximately 0.75 km upstream of the boat ramp. Avicennia, Xylocarpus and date palm trees overlapped for approximately 0.5 km while the latter dominated the riparian vegetation for approximately two additional kilometers upstream. Semi-open grasslands and acacia-dominated stands dominated areas upstream of the date palm trees. One freshwater fish species, one marine/brackish species, and two marine species were caught in the Wami River near the mangrove/palm forest transition zone during this sampling campaign (Table 2). Tiger fish, which was one of the species local fishermen reported during the first assessment to commonly occur, was the most abundant species. The local fishermen had not discussed the other three species during the first assessment. Table 2. List of fish species caught at the mangrove/palm forest transition zone. Common Name Scientific Name Type Quantity
Tiger fish Hydrocynus goliath Freshwater 6Talang queenfish Scomberoides commersonnianus Marine 1Banded needlefish Strongylura leiura marine/brackish 1White sardinella Sardinella albella Marine 1
Twenty-five species of birds (228 individuals) were observed during the 2.5 hour formal bird count. Fourteen of these species were not observed in March (Table 3). Eight of the species observed in March (e.g., African golden weaver, black-crowned night heron, dark-backed weaver, long-tailed cormorant, mangrove kingfisher, white-faced whistling duck, white-fronted bee-eater, and Zanzibar red bishop) were not sighted in August and the pied kingfisher was less abundant. Table 3. List of birds sighted in the Wami River estuary on 28 August 2007.
Common Name Scientific Name QuantityAfrican fish eagle Haliaeetus vocifer 1African pied wagtail Motacillaaguimp 2African open-billed stork1 Anastomus lamelligerus 4African spoonbill1 Platalea alba 1Bateleur eagle Terathopius ecaudatus 1Black kite Milvus migrans 3Common sandpiper Actiis hypoleucos 5Gray heron1 Ardea cinerea 8Great cormorant Phalacrocorax carbo 1Great egret1 Casmerodius albus melanorhynchos 9Green backed heron Butorides stiatus 4Hammerkop1 Scopus umbretta 13Little bee-eater Merops pusillus 5Little egret1 Egretta garzetta 19
11
Common Name Scientific Name QuantityMalachite kingfisher1 Alcedo cristata galerita 2Marsh sandpiper Tringa stagnatilis 1Palm-nut vulture Gypohierax angolensis 2Pied Kingfisher1 Ceryle rudis 4Pink-backed pelican Pelecanus rufescens 12Sacred ibis1 Threskiornis aethiopicus 2Tropical bulbul 1Water thick-knee Burhinus vermiculatus 1Wooly-necked stork1 Ciconia episcopus microecelis 65Yellow-billed oxpecker Buphagus africanus 3Yellow-billed stork1 Mycteria ibis 591 Species observed in March 2007 and August 2007
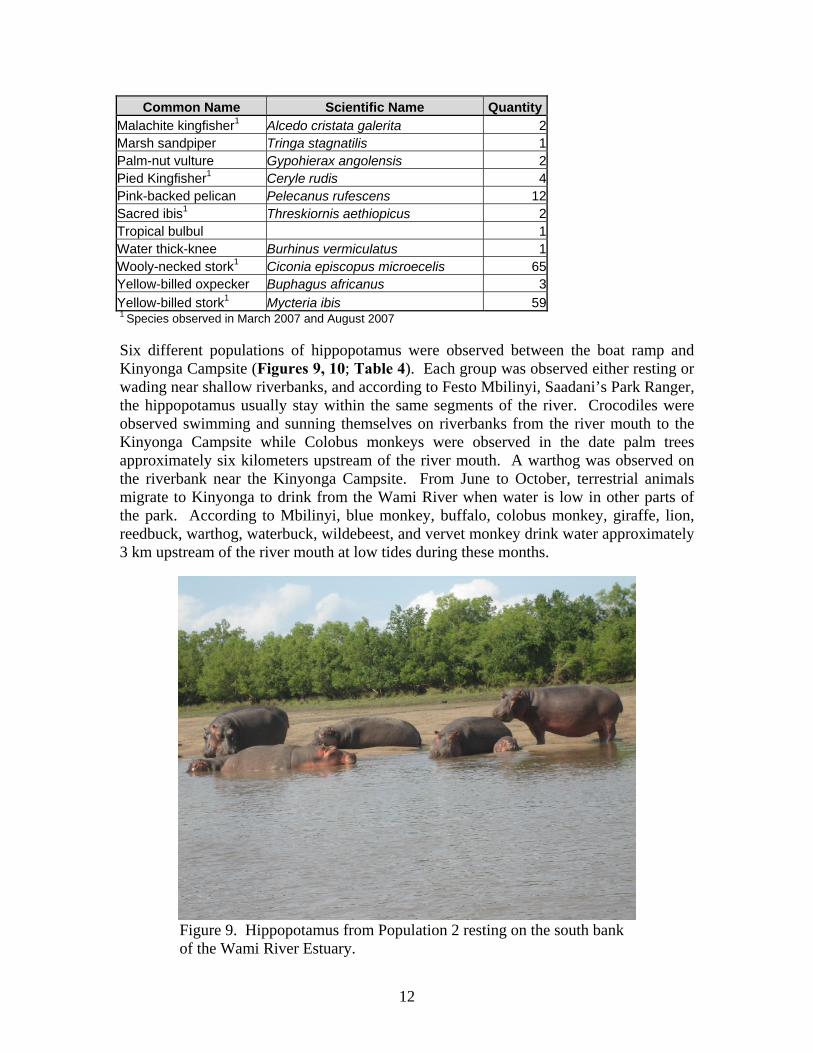
Six different populations of hippopotamus were observed between the boat ramp and Kinyonga Campsite (Figures 9, 10; Table 4). Each group was observed either resting or wading near shallow riverbanks, and according to Festo Mbilinyi, Saadani’s Park Ranger, the hippopotamus usually stay within the same segments of the river. Crocodiles were observed swimming and sunning themselves on riverbanks from the river mouth to the Kinyonga Campsite while Colobus monkeys were observed in the date palm trees approximately six kilometers upstream of the river mouth. A warthog was observed on the riverbank near the Kinyonga Campsite. From June to October, terrestrial animals migrate to Kinyonga to drink from the Wami River when water is low in other parts of the park. According to Mbilinyi, blue monkey, buffalo, colobus monkey, giraffe, lion, reedbuck, warthog, waterbuck, wildebeest, and vervet monkey drink water approximately 3 km upstream of the river mouth at low tides during these months.
Figure 9. Hippopotamus from Population 2 resting on the south bank of the Wami River Estuary.
12
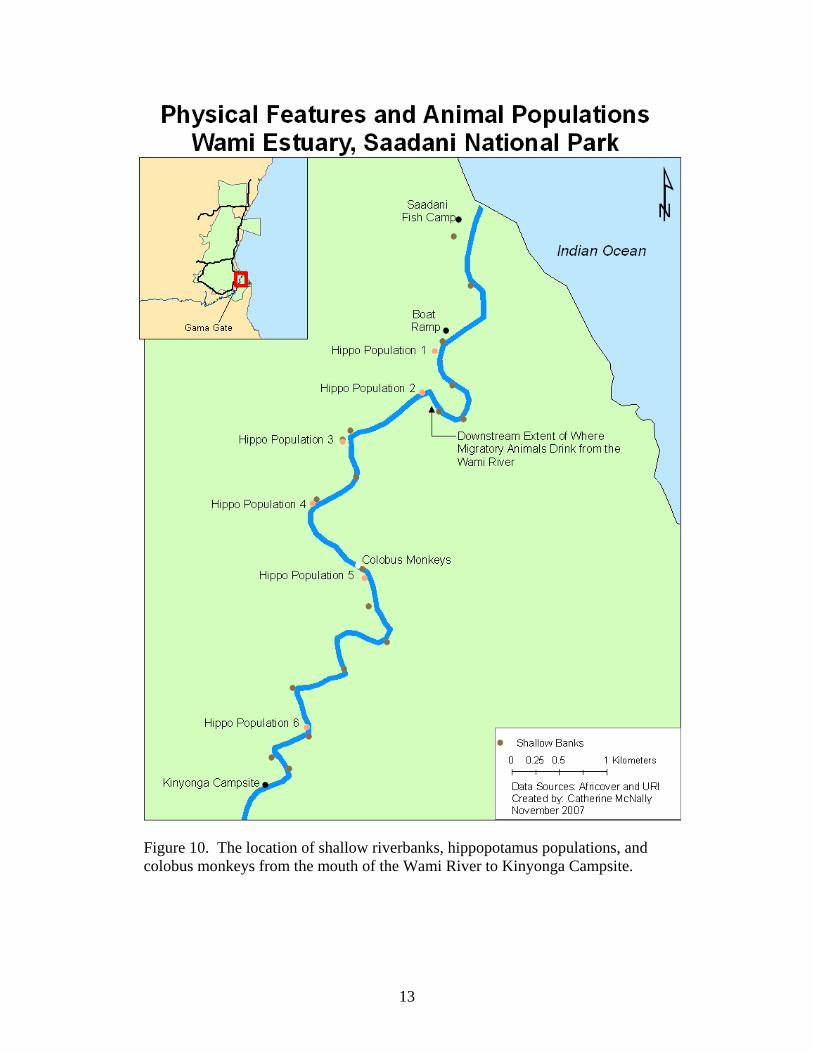
Figure 10. The location of shallow riverbanks, hippopotamus populations, and colobus monkeys from the mouth of the Wami River to Kinyonga Campsite.
13
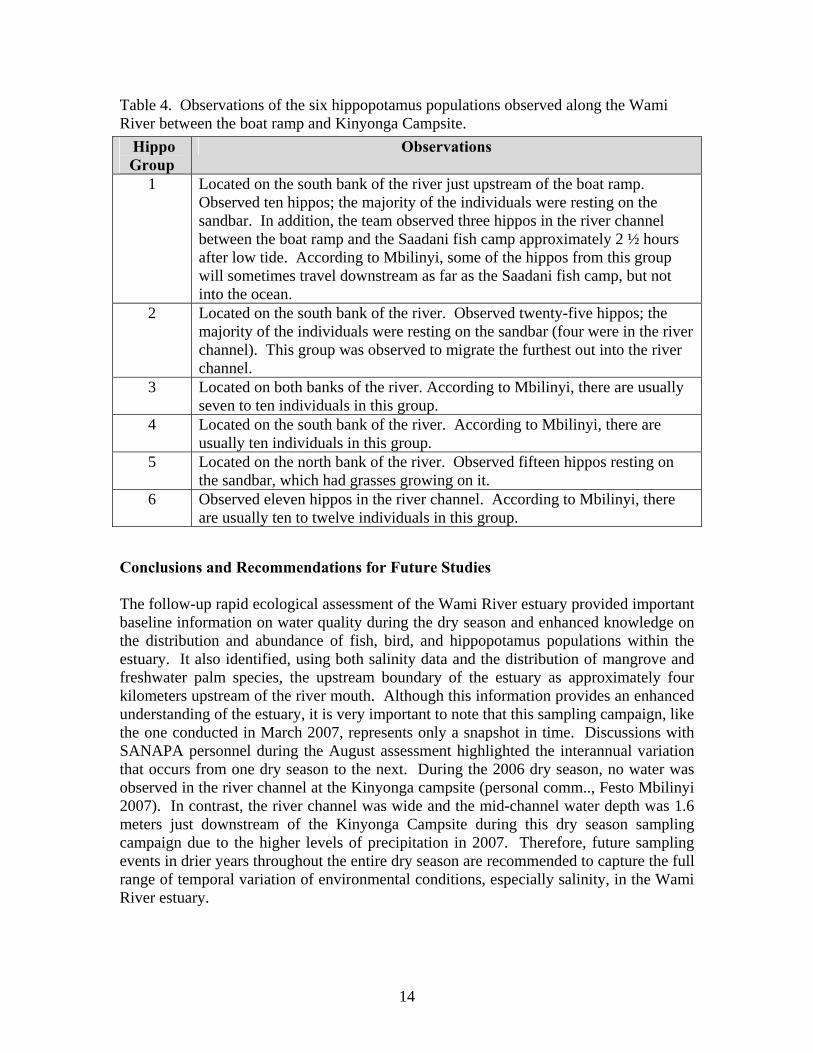
Table 4. Observations of the six hippopotamus populations observed along the Wami River between the boat ramp and Kinyonga Campsite.
Hippo Group
Observations
1 Located on the south bank of the river just upstream of the boat ramp. Observed ten hippos; the majority of the individuals were resting on the sandbar. In addition, the team observed three hippos in the river channel between the boat ramp and the Saadani fish camp approximately 2 ½ hours after low tide. According to Mbilinyi, some of the hippos from this group will sometimes travel downstream as far as the Saadani fish camp, but not into the ocean.
2 Located on the south bank of the river. Observed twenty-five hippos; the majority of the individuals were resting on the sandbar (four were in the river channel). This group was observed to migrate the furthest out into the river channel.
3 Located on both banks of the river. According to Mbilinyi, there are usually seven to ten individuals in this group.
4 Located on the south bank of the river. According to Mbilinyi, there are usually ten individuals in this group.
5 Located on the north bank of the river. Observed fifteen hippos resting on the sandbar, which had grasses growing on it.
6 Observed eleven hippos in the river channel. According to Mbilinyi, there are usually ten to twelve individuals in this group.
Conclusions and Recommendations for Future Studies The follow-up rapid ecological assessment of the Wami River estuary provided important baseline information on water quality during the dry season and enhanced knowledge on the distribution and abundance of fish, bird, and hippopotamus populations within the estuary. It also identified, using both salinity data and the distribution of mangrove and freshwater palm species, the upstream boundary of the estuary as approximately four kilometers upstream of the river mouth. Although this information provides an enhanced understanding of the estuary, it is very important to note that this sampling campaign, like the one conducted in March 2007, represents only a snapshot in time. Discussions with SANAPA personnel during the August assessment highlighted the interannual variation that occurs from one dry season to the next. During the 2006 dry season, no water was observed in the river channel at the Kinyonga campsite (personal comm.., Festo Mbilinyi 2007). In contrast, the river channel was wide and the mid-channel water depth was 1.6 meters just downstream of the Kinyonga Campsite during this dry season sampling campaign due to the higher levels of precipitation in 2007. Therefore, future sampling events in drier years throughout the entire dry season are recommended to capture the full range of temporal variation of environmental conditions, especially salinity, in the Wami River estuary.
14
In August 2007, SANAPA staff commenced monthly water quality monitoring at fixed stations identified with the assistance of Dr. Wolanski from the Australian Marine Institute. The stations within the Wami River and estuary extend from the Saadani fish camp to seven kilometers upstream of the river mouth. If possible, it is recommended that SANAPA personnel collect the water quality samples on the date corresponding to the highest tide of the month, and collect the sample closest to the vegetation transition zone at the height of the high tide. This information, collected under similar circumstances each month, will allow one to examine if, and to what degree, the upstream extent of the salt wedge varies throughout the year. In addition, to examine the relationship between salinity and freshwater flow, it is recommended that the water quality sampling data be analyzed in concert with the flow data that has been recorded at the Mandera and Matipwili gage sites for at least the week prior to the water quality sampling event. Once this relationship is better understood, it might be possible to predict how the upstream extent of salinity within the estuary and river will change with increasing freshwater withdrawals from the river. Other recommendations to provide a more comprehensive and holistic overview of the estuary include the following: 1) add the mangrove/freshwater palm transition zone segment of the Wami River and estuary to the upcoming dry season environmental flow assessment sampling campaign; 2) perform a more detailed inventory of the freshwater vegetation and fauna located between the mangrove and grassland/acacia sections of the river to assess how saltwater encroachment due to further upstream water withdrawals could impact the functions and services provided by that ecosystem; 3) conduct a study to ascertain the location of important shrimp and fish nursery habitat within the estuary and determine the relationship between wet season freshwater flows and shrimp productivity; 4) gather additional information on the feeding, roosting, and nesting habitats of flow sensitive bird species, as well as the location and condition of hippopotamus and crocodile habitat during the dry season; and 5) conduct key informant interviews and implement quantitative surveys to assess how different stakeholders value and prioritize the resources of the Wami River estuary, and examine how these identified valued ecosystem components could be affected by additional upstream water withdrawals.
15
16
Acknowledgements This assessment would not have been possible without the hard work and much appreciated assistance of Halima Ramadhani, Hassan Mhitu, Mchele Limbu, Ayoub Nanjale, Shaban Mtawa, Festo Mbilinyi and Rished Sherhe. I learned a great deal from each of you during the sampling campaign, and I thank you for sharing your knowledge so freely and lending a helping hand so cheerfully. I would like to thank Dr. Arthur Gold, Dr. Candace Oviatt and Dr. EIizabeth Anderson for their guidance on the design of this follow-up assessment. I would also like to thank Dr. Rashid Tamatamah for loaning our assessment team two fishing nets and lining up Mchele Limbu to assist with the dry season assessment, Dr. Peter August for loaning us a GPS, and Saadani National Park for allowing us to use their boat. Finally, this assessment would not have been possible without the logistical support provided Halima Ramadhani, the Tanzania Coastal Management Partnership, in particular Baraka Kalangahe and Ayoub Nanjale, and the financial support provided by the Coastal Resources Center and the Coastal Institute IGERT Project. References Anderson, E., C.G. McNally, B. Kalangahe, H. Ramadhani, and H. Mhitu. 2007. The
Wami River Estuary: A Rapid Ecological Assessment. Technical Report prepared for the Tanzania Coastal Management Partnership and the Coastal Resources Center, University of Rhode Island.
Stevenson, T. and J. Fanshawe. Field Guide to the Birds of East Africa: Kenya, Tanzania,
Uganda, Rwanda, Burundi. London: T & A D Poyser Ltd, 2002. Zimmerman, D.A., D.A. Turner, D.J. Pearson, I. Willis, H.D. Pratt. Birds of Kenya and Northern Tanzania. Princeton: Princeton University Press, 1999.