Embed Size (px)
Citation preview

A Highly Reliable Platform with a Serpentine Antenna for IEEE 802.15.4 over a Wireless Sensor Network
Chiu-Ching Tuan
Institute of Computer and Communication Engineering National Taipei University of Technology
1, Sec. 3, Chung-hsiao E. Rd.,Taipei City, 10608 Taiwan, R.O.C.
Hung-Li Tseng Department of Computer Science and Information Engineering,
Minghsin University, 1, Xinxing Rd., Xinfeng Hsinchu 30401,
Taiwan, R.O.C. [email protected]
Yuan-Jen Chang
Department of Management Information Systems, Central Taiwan University,
666, Buzih Road, Beitun District, Taichung City 40601, Taiwan, R.O.C.
Chin-Hsing Chen Department of Management Information Systems,
Central Taiwan University, 666, Buzih Road, Beitun District, Taichung City 40601,
Taiwan, R.O.C. [email protected]
H.-D.J. Jeong
Department of Internet Information, Korean Bible University
Nowon-ku Seoul 139-791, Seoul Korea
Wen-Tzeng Huang Department of Computer Science and Information Engineering,
Minghsin University, 1, Xinxing Rd., Xinfeng Hsinchu 30401,
Taiwan, R.O.C. [email protected]
WSEAS TRANSACTIONS on CIRCUITS and SYSTEMS
Chiu-Ching Tuan, Hung-Li Tseng, Yuan-Jen Chang, Chin-Hsing Chen, H.-D. J. Jeong, Wen-Tzeng Huang
E-ISSN: 2224-266X 182 Issue 6, Volume 11, June 2012

Abstract: - Wireless sensor networks (WSNs) are a developing area in the modern health-care service industry. Traditional circuit layout rules generally cannot be used for the stringent requirements of such systems due to unstable signals and non-ideal conditions. We propose and have implemented a hardware platform to eliminate the poor layout rules. During the design phase, our proposed design procedure can help analyze the signal propagation conditions of the printed circuit board (PCB) design by simulating board-level signal integrity. Moreover, this procedure leads to better layout rule parameters. A designer can effectively build a reliable hardware platform for the design of microcontroller unit schematics with superior system performance using our proposed layout rules. Such layout technologies are the major goal of original design manufacturers in their overall PCB designs. Moreover, since the PCB serpentine antenna has the advantages of low cost, light weight, simple construction, and easy integration, we used formulas and simulation software tools to analyze its characteristics and then constructed a prototype with better performance for IEEE 802.15.4 wireless antenna applications. Our experiments showed that the transmission distance can be greater than 18 m without any loss of data over a WSN when using this antenna. Key-Words: - Wireless sensor network, ZigBee, IEEE 802.15.4, Signal integrity, Layout rules, Serpentine antenna.
1 Introduction Increasing numbers of studies concerning telecare services and wireless home-care systems have been reported in recent years. Some of these have concentrated on hardware design, including improving the human interface of wireless sensor devices, detecting wireless sensor signals without errors, and increasing signal detection ranges [1]. Some studies have focused on integrating the hardware and communication interface so that physiological information received from different types of medical instruments is transmitted and integrated into the same database for analysis and display [2][3]. Other studies have focused on the design of the communication network structure to improve the acquisition and transmission framework so that it is more suitable to physiological signals [4][5]. Other studies have concentrated on the development of a physiological signal measurement tool so that patients can participate in all hospital activities without any limitation while their physiological information is recorded in real time [6]. Although some studies related to wireless sensor network (WSN) applications have taken place, there has been little attention to building turnkey hardware platforms for these applications. IEEE 802.15.4 contains two layers: the physical layer and the media access control layer [7][8]. Highly reliable hardware platforms are critical in determining whether a system will be stable and work well. Low interference noise and enhanced signal integrity are essential characteristics of printed circuit board (PCB) design for high-reliability platforms [9][10]. Therefore, we propose a development procedure for producing high-reliability platforms for WSN applications.
A meander line antenna is often referred to as a serpentine antenna due to its shape [11][12]. Because the antenna is built on a PCB substrate, it has the advantages of low profile, light weight, simple construction, and easy integration with other circuit components. Therefore, a serpentine antenna was used in this study, not only to reduce the manufacturing cost, but also to decrease the required layout space. A serpentine antenna for the ZigBee 2.45-GHz specification can be designed and implemented according to published equations [9][11][13][14][15][16]. Our earlier paper discussed the high-reliability wireless sensor network platform with a serpentine antenna design [17]. The remainder of this paper is organized as follows. Section 2 describes the background and related work. Section 3 describes the system structure. Section 4 presents our results and discussions, and Section 5 presents our conclusions.
2 Background and related work WSNs represent a development area in the health-care service industry. The physiological signals of temperature, blood pressure, electrocardiogram, heart rate, and oxygen saturation (SpO2) of patients are measured by sensor devices and transmitted to WSN systems [2][3][18]. In this research, we used the ZigBee wireless standard based on IEEE 802.15.4 [19]; this is a wireless personal area network (WPAN) with low power consumption that is able to address many devices. We also used a microcontroller unit (MCU) with a low power consumption [20]. There are two important considerations in the design of a digital system. The first is high-speed data transmission and the second is small PCB size. Narrow PCB traces are not ideal for high-speed data because of the coupling noise that occurs among
WSEAS TRANSACTIONS on CIRCUITS and SYSTEMS
Chiu-Ching Tuan, Hung-Li Tseng, Yuan-Jen Chang, Chin-Hsing Chen, H.-D. J. Jeong, Wen-Tzeng Huang
E-ISSN: 2224-266X 183 Issue 6, Volume 11, June 2012

them [9][10]. When a high-speed signal is transmitted on a PCB trace, it causes obvious changes at the receiver input. For most electronic products, signal integrity effects begin to be important at clock frequencies above about 100 MHz, called the high-speed effect [9]. An engineer without experience in high-speed digital system design will produce an unstable system by following only traditional design guidelines. We studied some approaches to high-speed digital system design, and propose a procedure to design high-speed digital hardware platforms. Our proposed procedure provides an analysis method using signal integrality simulation software and helps an engineer produce a better PCB design solution during circuit design. This is the main goal in PCB layout technologies for original design manufacturers (ODMs). We first propose the high-reliability hardware platform design procedure shown in Procedure High-reliability Schematics Design(), which is unlike the procedure for the traditional design shown in Procedure Traditional Schematics Design(). The electronics engineer must pay attention to the signal integrity of the high-speed signal and the ZigBee portions of the system in the circuit design. Procedure High-reliability Schematics Design()
1 Arrange specifications 2 Build the PCB stack design 3 Do Build and Make the integrity
simulation 4 While (Result has not met specifications) 5 Generate the layout rules
Procedure Traditional Schematics Design()
1 Loop: 2 Build the PCB layout and then Make
hardware 3 Check system verification 4 If (Hardware has not met specifications) 5 Then Debug the hardware 6 Goto loop 7 Else (Prepare mass production)
This sequence of modification, simulation, and checking continues until all the specifications are met as shown in our proposed procedure. Using such a procedure to design hardware greatly reduces the system development time and controls the system reliability effectively. Since the traditional design process has no simulation stage for checking to see if the design meets the specifications, it requires more time to achieve an acceptable design.
Therefore, the proposed method can reduce the development cost and time required to create PCBs. 2.1 Circuit design and hardware specifications A two-layer PCB structure was used in our stack design. Figure 1 shows the major parameters: FR4 εr = 4.3 [9], copper thickness = 7 mil, and dielectric thickness = 40 mil. The characteristic impedance of the microstrip and the propagation delay time [9][10][14][15] are.
)8.0
98.5ln(
41.1
87
tw
hZ m
(1)
67047500171 .ε..t rpd (2)
where Zm is the characteristic impedance of the microstrip (Ω), h is the thickness of the microstrip substrate (in), tpd is the propagation delay time (ps/in), w is the width of the microstrip (in), t is the thickness of the microstrip (in), and εr is the effective relative dielectric constant of the material. The tolerable range of the trace width and length can be obtained from this characteristic impedance formula.
Figure 1. Example of a two-layer PCB stack structure 2.2 Serpentine antenna design rule Figure 2(b) shows a serpentine antenna, which is essentially a serpentine-shaped version of the line antenna [12] shown in Fig. 2(a). Since the antenna is manufactured on a PCB substrate, it has the advantages of low profile, light weight, and easy construction. It is also easily integrated with other circuit components. A PCB line antenna is too long for many modern applications that require a small size. A serpentine antenna was used in this study to reduce both the manufacturing cost and layout space.
(a) (b)
Figure 2. Structure of a (a) line antenna and (b) serpentine antenna
WSEAS TRANSACTIONS on CIRCUITS and SYSTEMS
Chiu-Ching Tuan, Hung-Li Tseng, Yuan-Jen Chang, Chin-Hsing Chen, H.-D. J. Jeong, Wen-Tzeng Huang
E-ISSN: 2224-266X 184 Issue 6, Volume 11, June 2012

A PCB was used as the serpentine antenna part of our hardware platform. The actual size of the serpentine antenna and the ZigBee chip was 13 × 8.5 × 1.0 mm3. Figure 3(a) shows the structure of a complete serpentine antenna, where w is the antenna width, l is the antenna length, a is the width of a short-terminated segment, and b is the diameter of the line segment. Figure 3(b) shows the configuration of a short-terminated segment, one of the basic components of the serpentine antenna. In the conceptual design, the four short-terminated segments and one straight conductor shown in Figure 3(c) are combined into one complete serpentine antenna, as shown in Figure 3(a). In the actual PCB design, the straight conductor is not visible in the serpentine antenna. One short-terminated segment and its equivalent inductor are shown in Figure 3(d).
(a) (b)
(c) (d)
Figure 3. Structure of the PCB serpentine antenna: (a) complete serpentine antenna, (b) one short-terminated segment, (c) four short-terminated segments and one straight conductor to be combined into one serpentine antenna, and (d) one short-terminated segment and its equivalent inductor There are four short-terminated segments and one straight conductor in the serpentine antenna design. If Zc is the essential impendence, then the characteristic impendence Zo of one short-terminated segment can be expressed as [14][15]
2logc
o
Z aZ
b
(3)
We assume that each short-terminated segment is the equivalent of one inductor effect, as shown in Figure 3(d) [13], since they are all the same type of trace. If the short-terminated segment is lossless, the input impendence Zin will be pure reactance jx,
tan2in o
wZ jX jZ
(4)
where is the phase constant. Moreover, when the length of one short-terminated segment is about half the width of the antenna, as shown in Fig. 10(b), i.e., w/2, then tan (w/2) can be simplified as
31
tan2 2 3 2
w w w
(5)
since its reactance is too small to ignore. This serpentine antenna can be a single conductor as shown in Fig. 10(d), when its length is less than 1/4 of the wavelength [21]. If Lm is the inductance of all short-terminated segments, then j L m can be obtained from Eqs. (3) and (4) as follows:
31
2 3 2m in o
w wj L N Z jNZ
(6)
Let μ be the permeability and ε be the permittivity [14]. Then, substituting Eq. (3) into Eq. (6), Lm can be re-written as
2 21 2 1
1 log 13 2 2 3 2
om
NZ w w w a wL N
c b
(7)
Moreover, let Ll be the self-inductance of a straight inductor of length l, expressed as
log 4 1l
lL l
d
(8)
Also, let Lt be the total inductance of the serpentine antenna, expressed as
21
log 4 1 log 13 2t l m
l a wL L L l Nw
d b
(9)
Here, we discuss the relationship between the parameters and the inductance. Let Ld be the self-inductance of the line antenna, as shown in Fig. 9(a), with the 1/4 wavelength,
log 14dL
d
(10)
where r
c
f
Let be the wavelength of the resonance frequency (m), c be the speed of light (3×10⁸ m/s), and f be the resonance frequency (Hz) [9]. Since the idea of replacing the line antenna with the serpentine antenna is to reduce the size while keeping the same resonance frequency, the inductance of the two antennas should be the same. The total inductance of the serpentine antenna Lt is equal to the self-inductance Ld of the line antenna,
t dL L (11)
WSEAS TRANSACTIONS on CIRCUITS and SYSTEMS
Chiu-Ching Tuan, Hung-Li Tseng, Yuan-Jen Chang, Chin-Hsing Chen, H.-D. J. Jeong, Wen-Tzeng Huang
E-ISSN: 2224-266X 185 Issue 6, Volume 11, June 2012

By substituting Eqs. (9) and (10) into Eq. (11), the number of short-terminated segments N can be obtained from
2
log 1 log 4 14
1log 1
3 2
ll
d dN
a ww
b
(12)
From Eq. (5), the progression can be simplified to only the first progression, as shown in Eq. (13), when w < ( /2). Therefore, if the width, length, diameter, and the interval of the antenna are known, the number of short-terminated segments is
log 1 log 4 14
log
ll
d dN
aw
b
(13)
Let the actual size of the primitive PCB serpentine antenna be 13 × 8.5 × 1.0 mm. The PCB serpentine antenna for the ZigBee platform can be designed and implemented according to Eq. (13) [13]-[15]. Therefore, there are four short-terminated segments in this primitive PCB antenna design.
3 System structure In this study, we use the ZigBee wireless standard based on IEEE 802.15.4 and the ZigBee Alliance [19], which define the specifications of the network, application, and security layers. ZigBee technology has the slogan, “Wireless control that simply works” [22]. It includes a network and application layer architecture designed for low-power usage with a long battery life (months to years on a single set of batteries), a standardized protocol designed to allow interoperability between vendors, reliability in harsh environments, cost-effectiveness, and wireless connectivity [23][24]. It provides two operational bands divided into several channels, and a data rate
channel for monitoring and control purposes. It also supports large networks in mesh, tree, and star configurations. There are just two types of components in this ZigBee application: the personal area network coordinator (simply referred to the as the “coordinator”) and the devices. The coordinator is in charge of constructing the WPAN network and allocating the network addresses. The device can only choose and join a network that others have already formed, and then transmit its data. 3.1 Hardware architecture design The major system structure of our proposed WSN system is divided into devices and coordinators, as shown in Figure 4. The SpO2 sensor is used here to provide the system with the bio-information it obtains from the person being tested. The coordinator receives the bio-information packages from the sensor devices and transmits them to the gateway, whose function is to connect two heterogeneous networks. The protocol used between the coordinator and the devices will be discussed later. 3.2 MCU and ZigBee design structure Figure 5 shows the structure of the MCU, which has serial peripheral interface (SPI) and universal asynchronous receiver transmitter (UART) modules, and ZigBee. Each device includes the signal processing circuits [20], a ZigBee transceiver [20], and an SpO2 sensor. The signal processing circuits contain a processing unit with some interfaces. The ZigBee transceiver receives remote signals or transmits the data obtained from various sensors to remote mobile phones or computers. The bio-information sensor is used to measure the physiological signals from patients. There are two major components: the ZigBee transceiver chip and the PCB serpentine antenna.
SP02
SP02
SP02
SPO2 Sensor 1
SPO2 Sensor 2
SPO2 Sensor n
Gateway
Figure 4. Our proposed system structure
WSEAS TRANSACTIONS on CIRCUITS and SYSTEMS
Chiu-Ching Tuan, Hung-Li Tseng, Yuan-Jen Chang, Chin-Hsing Chen, H.-D. J. Jeong, Wen-Tzeng Huang
E-ISSN: 2224-266X 186 Issue 6, Volume 11, June 2012

Figure 5. Block diagram of our proposed sensor
hardware platform 3.3 Circuit design and hardware specifications The design procedure of the WSN hardware platform followed our proposed approach. The Interrupt, SO, SI, SCLK, and SEN signal lines between the MCU (MSP430) and the ZigBee transceiver (UZ2400) are shown in Figure 6 according to specifications for constructing our system schematics [20][25]. The physical size of the PCB was 50 × 50 mm2. All chips worked at a voltage within the accepted range of tolerances according to the specifications. If the voltage of a signal were higher than the specifications, the chip would be unstable and render the system unstable. The system power source was VDD = 3.3 V and the system ground was VSS = 0 V. Table 1 shows the output high and low working voltages of the MSP430 [20], and Table 2 shows the accepted working range between the high and low voltages of the UZ2400 [25]. Most of the signals in this design are output by the MCU and input to the ZigBee chip. The output high- and low-level voltages of the MSP430 are referred to as VOH and VOL, respectively [20], and the input high- and low-level voltages of the UZ2400 are VIH and VIL, respectively [25].
Figure 6. Partial schematic of communications between MSP430 and UZ2400 [20] [25]
Table 1. MSP430 output working voltage [20]
Description Min. Max. Units
VOH output high voltage 3.05 3.3 V
VOL output low voltage 0 0.25 V
Table 2. UZ2400 input working voltage [25]
Description Min. Max. Units
VIH input high voltage 1.65 3.6 V
VIL input low voltage –0.3 0.66 V
4 Results and discussion 4.1 PCB signal integrity simulation and analysis After obtaining all the necessary requirements of the PCB parameters, the simulation parameters listed in Table 3 were used in the simulation software. The simulation gives the layout rules, and the workable width and length of the signal traces to meet the specification requirements. The rising and falling ZigBee wave affected by the MCU can be obtained from these layout rules. Figure 7 shows the signal integrity variations for a trace width of 10 mil. The various ZigBee VIH and VIL values are dominated by the VOH and VOL of the MCU under seven trace lengths of 0.2, 0.5, 1.0, 1.5, 1.6, 1.7, and 1.8 in. Figures 7(a) and 8(b) show the simulated results of VIH rising waves for VOH = 3.3 V and VOH = 3.05 V, respectively. Figures 7(c) and (d) show the simulated results of VIL falling waves for VOL = 0 V and VOL = 0.25 V, respectively.
Table 3. PCB analytical parameters
PCB parameters Simulation parameters Units
Trace width 8, 10, 12, 14 mil
Trace length 0.2, 0.5, 1.0, 1.5, 1.6, 1.7, 1.8 in
Dielectric thickness
top and bottom = 7, FR4 = 40 mil
εr 4.3
These simulation results are also listed in Tables 4 and 5. They show that VIH and VIL will not meet the specification when the trace length is greater than 1.7 in and VOH = 3.3 V, i.e., VIH will exceed the UZ2400 working maximum of 3.6 V in that case. It is more difficult to control the impedance of longer traces where signal reflection will cause more overshoot, undershoot, and ringing noise to exceed the normal working range. Therefore, according to these simulation results, the layout rule is that the trace length should be no more than 1.6 in.
WSEAS TRANSACTIONS on CIRCUITS and SYSTEMS
Chiu-Ching Tuan, Hung-Li Tseng, Yuan-Jen Chang, Chin-Hsing Chen, H.-D. J. Jeong, Wen-Tzeng Huang
E-ISSN: 2224-266X 187 Issue 6, Volume 11, June 2012

In some cases, the layout length of the trace will be more than 1.6 in and longer than the working specification defined in the simulation rule. This means that the layout rule must be revised to change the trace width to meet the working requirements. The simulation tool was also used here to determine the relationship between the trace length and spacing. Figures 6(a) and (b) show the simulation
results for trace lengths of 1.7 and 1.8 in, respectively, for VOH = 3.3 V and VOL = 0 V at the MCU, and for trace widths of 8, 10, 12, 14, and 16 mil. The simulation results of Figs. 6(a) and (b) are tabulated in Tables 6 and 7, respectively. The results indicate that a trace width of 8–10 (8–12) mil cannot be met for trace lengths of 1.7 (1.8) in.
Table 4. Comparison of VOH and VIH for different lengths with trace space = 10 mil
Trace Length (in) VOH = 3.3 V VOH = 3.05 V
VIH (max.) VIH (min.) VIH (max.) VIH (min.)
0.2 3.31 3.24 3.06 2.99
0.5 3.38 3.21 3.12 2.96
1.0 3.53 3.12 3.26 2.89
1.5 3.48 3.15 3.22 2.91
1.6 3.54 3.10 3.27 2.87
1.7 3.61 3.04 3.34 2.81
1.8 3.69 2.98 3.41 2.76 Note: Values in bold are greater than the working maximum voltage of 3.6 V.
Table 5. Comparison of VOL and VIL for different lengths with trace space = 10 mil
Trace Length (in) VOL = 0 V VOL = 0.25 V
VIL (max.) VIL
(min.) VIL (max.)
VIL (min.)
0.2 0.01 –0.01 0.26 0.24
0.5 0.09 –0.08 0.34 0.19
1.0 0.18 –0.23 0.41 0.04
1.5 0.15 –0.18 0.39 0.08
1.6 0.20 –0.24 0.43 0.03
1.7 0.26 –0.31 0.49 –0.04
1.8 0.32 –0.39 0.54 –0.11
Note: Values in bold are below the working minimum voltage of –0.3 V.
Table 6. Comparison of VOL and VIL of different trace widths for trace length = 1.7 in Trace space
(mil) VOH = 3.3 V VOL = 0 V
VIH (max.) VIH (min.) VIL (max.) VIL (min.) 8 3.68 2.99 0.31 –0.38
10 3.61 3.04 0.26 –0.31 12 3.57 3.08 0.22 –0.28 14 3.53 3.11 0.19 –0.23 16 3.50 3.13 0.17 –0.20
Note: Values in bold are above or below the specifications.
WSEAS TRANSACTIONS on CIRCUITS and SYSTEMS
Chiu-Ching Tuan, Hung-Li Tseng, Yuan-Jen Chang, Chin-Hsing Chen, H.-D. J. Jeong, Wen-Tzeng Huang
E-ISSN: 2224-266X 188 Issue 6, Volume 11, June 2012

0.0
0.5
1.0
1.5
2.0
2.5
3.0
3.5
4.0
0 1 2 3 4 5 6 7 8 9 10Time (ns)
Vol
tage
(V
)
0.2 inch 0.5 inch 1.0 inch1.5 inch 1.6 inch 1.7 inch1.8 inch
0.0
0.5
1.0
1.5
2.0
2.5
3.0
3.5
4.0
0 1 2 3 4 5 6 7 8 9 10Time (ns)
Vol
tage
(V
)
0.2 inch 0.5 inch 1.0 inch1.5 inch 1.6 inch 1.7 inch1.8 inch
(a) (b)
-0.5
0.0
0.5
1.0
1.5
2.0
2.5
3.0
3.5
0 1 2 3 4 5 6 7 8 9 10
Time (ns)
Vol
tage
(V
)
0.2 inch 0.5 inch 1.0 inch1.5 inch 1.6 inch 1.7 inch1.8 inch
-0.50.00.51.01.52.02.53.03.5
0 1 2 3 4 5 6 7 8 9 10
Time (ns)
Vol
tage
(V
)
0.2 inch 0.5 inch 1.0 inch1.5 inch 1.6 inch 1.7 inch1.8 inch
(c) (d)
Figure 7. Four simulation results for seven trace lengths with trace spacing = 10 mil for (a) VOH = 3.3 V, VIH rising waves, (b) VOH = 3.05 V, VIH rising waves, (c) VOL = 0 V, VIH falling waves, and (d) VOL = 0.25 V, VIH falling waves
(a) (b)
Figure 8. Simulation of five trace widths for VOH = 3.3 V and VOL = 0 V at the MCU for trace lengths of (a) 1.7 in and (b) 1.8 in
Table 7. Comparison of VOL and VIL of different trace widths for trace length = 1.8 in
Trace space (mil)
VOH = 3.3 V VOL = 0 V VIH (max.) VIH (min.) VIL (max.) VIL (min.)
8 3.76 2.92 0.37 –0.46 10 3.69 2.98 0.32 –0.39 12 3.64 3.02 0.28 –0.34 14 3.60 3.06 0.24 –0.30 16 3.56 3.09 0.21 –0.26
Note: Values in bold are above or below the specifications.
WSEAS TRANSACTIONS on CIRCUITS and SYSTEMS
Chiu-Ching Tuan, Hung-Li Tseng, Yuan-Jen Chang, Chin-Hsing Chen, H.-D. J. Jeong, Wen-Tzeng Huang
E-ISSN: 2224-266X 189 Issue 6, Volume 11, June 2012

These simulation results show that VIH and VIL can be obtained to meet the specifications when the trace length is equal to 1.7 in and the trace width is greater than 12 mil. Moreover, VIH and VIL will meet the specifications when the trace length is equal to 1.8 in and the trace width is greater than 14 mil. Because 14 mil gives the minimum acceptable performance, a trace width of 16 mil will be somewhat more reliable. Therefore, the simulation results lead to the three PCB layout rules below. Following these layout rules during system implementation will result in a high-reliability platform with an optimal PCB stack. Rule 1: When the signal trace width is 10 mil, the signal trace length must be no more than 1.6 in. Rule 2: When the signal trace length is in the range 1.6–1.7 in, the width of the signal trace must be greater than 12 mil. Rule 3: When the signal trace length is in the range 1.7–1.8 in, the width of the signal trace must be greater than 16 mil. 4.2 PCB signal integrity experiments The major purpose of a better layout is to improve the system stability and reliability. A layout engineer can complete the PCB layout for a high-stability platform using the proposed layout rules. Figures 9(a) and (b) show the physical layout of the top and bottom MCU layer configuration, respectively, and Figures 9(c) and (d) show the physical layout of the top and bottom ZigBee PCB layer configuration. The ZigBee portion will be discussed later. Figures 10(a), (b), and (c) show the simulated and prototype values for the SO, SCLK, and Interrupt, respectively. The layout lengths of the SO, SCLK, and Interrupt were 0.41, 0.22, and 1.03 in, respectively, all following the proposed layout rules. Although VIH in the prototype was equal to 3.3 V
and the equivalent value from the simulation was 3.05 V, the prototype measurement still met the requirements of the specifications with a 0.3-V margin. Because all parameters of the simulation result represent ideal conditions, no errors exist in the impendence, component characteristics, or temperature. In contrast with this ideal case, errors do exist in the measured parameters of PCB impendence, instrument error (without instrument), and component characteristic error temperature. Hence, the measured and simulated results were somewhat different, as shown in Fig. 8. Although this difference was small, the major criterion to be evaluated is whether the measured results meet the specification. If so, the layout rules can be accepted for this platform. 4.3 PCB antenna design and simulation The “RF input” is the signal input port of the ZigBee chip, and the “GND” is connected to the ground. We used an Agilent ADS2005A advanced design system to simulate the resonance frequency of the primitive PCB antenna. Table 8 shows the parameters of the primitive design, and Fig. 11(b) shows the primitive simulation results of the serpentine antenna. The resonance frequency was 2.52 GHz and S11 was –10.25 dB. This resonance frequency does not meet the ZigBee specifications. The simulation results in Fig. 11(b) and the experimental results in Fig. 14(b) indicate that the primitive design antenna parameters cannot meet the specification requirements and must be improved.
Table 8. Primitive design parameters
Antenna Parameters T1 W1 W2 L1
Units (mm) 1 1.5 1.5 5
(a) (b)
(c) (d)
Figure 9. Physical layout configuration: (a) top layer of the MCU PCB, (b) bottom layer of the MCU PCB, (c) top layer of the ZigBee PCB, and (d) bottom layer of the ZigBee PCB
WSEAS TRANSACTIONS on CIRCUITS and SYSTEMS
Chiu-Ching Tuan, Hung-Li Tseng, Yuan-Jen Chang, Chin-Hsing Chen, H.-D. J. Jeong, Wen-Tzeng Huang
E-ISSN: 2224-266X 190 Issue 6, Volume 11, June 2012

(a) (b)
(c)
Figure 10. Comparison of simulation and experiment (prototype) measure-ments of the (a) SO, (b) SCLK, and (c) Interrupt
(a) (b)
Figure 11. Primitive serpentine antenna (a) design and (b) simulation results
WSEAS TRANSACTIONS on CIRCUITS and SYSTEMS
Chiu-Ching Tuan, Hung-Li Tseng, Yuan-Jen Chang, Chin-Hsing Chen, H.-D. J. Jeong, Wen-Tzeng Huang
E-ISSN: 2224-266X 191 Issue 6, Volume 11, June 2012

-12.0
-11.0
-10.0
-9.0
-8.0
-7.0
-6.0
-5.0
-4.0
-3.0
-2.0
2.2 2.3 2.3 2.4 2.4 2.5 2.5 2.5 2.6 2.6 2.7
Frequency (G Hz)
S11
(dB
)
1.5 mm
1.0 mm0.5 mm
-12.0
-11.0
-10.0
-9.0
-8.0
-7.0
-6.0
-5.0
-4.0
-3.0
-2.0
2.20 2.25 2.30 2.35 2.40 2.45 2.50 2.55 2.60 2.65 2.70
Frequency (G Hz)
S11
(dB
) 2.0 mm
1.5 mm
1.0 mm
0.5 mm
(a) (b)
-12.0
-11.0
-10.0
-9.0
-8.0
-7.0
-6.0
-5.0
-4.0
-3.0
-2.0
2.20 2.25 2.30 2.35 2.40 2.45 2.50 2.55 2.60 2.65 2.70
Frequency (G Hz)
S11
(dB
)
2.0 mm
1.5 mm
1.0 mm
0.5 mm
-12.0
-11.0
-10.0
-9.0
-8.0
-7.0
-6.0
-5.0
-4.0
-3.0
-2.0
2.20 2.25 2.30 2.35 2.40 2.45 2.50 2.55 2.60 2.65 2.70
Frequency (G Hz)
S11
(dB
)6.0 mm
5.5 mm
5.0 mm
4.5 mm
4.0 mm
(c) (d)
Figure 12. Relationship of the resonance frequency and S11 in the simulation phase to different parameters: (a) T1 = 0.5, 1.0, or 1.5 mm; (b) W1 = 0.5, 1.0, 1.5, or 2.0 mm; (c) W2 = 0.5, 1.0, 1.5, or 2.0 mm; and (d) L1 = 4.0, 4.5, 5.0, 5.5, or 6.0 mm From Eq. (13), we see that the four parameters T1, W1, W2, and L1 of the PCB serpentine antenna can be analyzed to determine the relationship of the resonance frequency and S11 in the simulation phase. First, parameter T1 can be adjusted to determine the major frequency, as shown in Fig. 12(a). The simulation results indicate that a wider T1 produces a lower resonance frequency and lower S11. After determining the major frequency, we can adjust W1 and W2 to obtain better performance. A wider W1 and W2 also reduce the resonance frequency and S11, as shown in Figs. 12(b) and (c). Although W1 and W2 can be used to adjust S11, they also affect the major 2.45-GHz frequency. Finally, because L1 can be used to offset the resonance frequency, a narrower L1 increases the resonance frequency, as shown in Fig. 12(d). That is, L1 can adjust the resonance frequency back to 2.45 GHz. Our results indicate that parameter T1 can be used for rough adjustments of the resonance frequency, and W1 and W2 can be used to adjust S11. Then parameter L1 can be used to fine tune the
resonance frequency. Figures 12(a), (b), (c), and (d) show the analysis for different parameters: T1 = 0.5, 1.0, or 1.5 mm; W1 = 0.5, 1.0, 1.5, or 2.0 mm; W2 = 0.5, 1.0, 1.5, or 2.0 mm; and L1 = 4.0, 4.5, 5.0, 5.5, or 6.0 mm, respectively. Moreover, Procedure Adjust the parameters() shows the procedure for adjusting the parameters for the PCB serpentine antenna. Procedure Adjust the parameters() 1 Do Adjust T1 2 While (f is not 2.45 GHz) 3 Do Adjust W1 and W2 4 While (S11 is not optimal) 5 Do Adjust L1 6 While (f is not 2.45 GHz) In contrast with the primitive design parameters of Table 8, Table 9 shows the final parameters of the serpentine antenna after adjustment. These produce an antenna with better performance that can meet the ZigBee specifications with a resonance frequency of 2.45 GHz, bandwith of 100 MHz, and high S11 of –14.87 dB, as shown in Fig. 13(b). This
WSEAS TRANSACTIONS on CIRCUITS and SYSTEMS
Chiu-Ching Tuan, Hung-Li Tseng, Yuan-Jen Chang, Chin-Hsing Chen, H.-D. J. Jeong, Wen-Tzeng Huang
E-ISSN: 2224-266X 192 Issue 6, Volume 11, June 2012

figure also shows the results of the simulation and the original design for the sake of comparison. Table 9. Our design parameters for the serpentine antenna
Antenna parameters T1 T2 W1 W2
Units (mm) 1.0 1.5 1.0 1.5
Antenna Parameters W3 W4 L1 L2
Units (mm) 1.5 1.0 5.0 5.5
Gnd
RF Input
(a)
(b)
Figure 13. Primitive serpentine antenna (a) design and (b) simulation results
4.4 Experimental measurement of the serpentine antenna Figures 14(a), (b), and (c) show the measurements of the XZ-, YZ-, and XY-plane radiation patterns at
2.45 GHz, respectively. Figure 14(d) shows the measurement of the physical antenna and Fig. 14(e) shows the three-dimensional measurement of the radiation pattern at 2.45 GHz. The measured radiation pattern can be summarized as follows. The peak gain of the serpentine antenna at 2.45 GHz was about 2.4 dBi, the efficiency was 71.24%, the directivity was 3.87, and the mean effective gain was –2.30 dBi. Moreover, Table 10 shows the S11 performance of the simulated antenna compared with that of the actual prototype for the primitive design of Fig. 11(a) and our approach of Fig. 13(a) built using the parameters in Tables 8 and 9, respectively. The performance was measured using an Advantest R3765CG network analyzer. Figure 13(b) compares the results of the final design simulation (indicated by “Final”) and prototype (indicated by “Measured”) with those of the primitive design simulation (indicated by “Original”) and primitive prototype (indicated by “Measured Original”). Table 10 indicates that the resonance frequency of the primitive design did not meet the ZigBee specifications in either the simulation or the primitive prototype. Compared with the primitive design, these results show that the differences between the simulated and measured values of S11 of the final antenna for different frequencies over a 100-MHz bandwidth were less than 1 dB, thus meeting the ZigBee requirements. 4.5 Real prototype structure Figure 15(a) shows the actual size of our ZigBee platform with the serpentine antenna; Fig. 15(b) shows the physical system configuration, one gateway, one coordinator, and two SpO2 devices [26]. The coordinator hardware is the same as that of the devices; only the firmware is different. After the ZigBee network has been established, the coordinator can obtain the bio-information from the sensor devices and then transmit this information to PCs or to the gateway. Figure 16 shows the user interface for real integration measurements in which the SpO2 sampling rate and heart rate are set to 3 and 75 times per second, respectively. The pulse curve can be obtained from the SpO2 sensor, and the heart rate can be measured from the pulse curve [26].
WSEAS TRANSACTIONS on CIRCUITS and SYSTEMS
Chiu-Ching Tuan, Hung-Li Tseng, Yuan-Jen Chang, Chin-Hsing Chen, H.-D. J. Jeong, Wen-Tzeng Huang
E-ISSN: 2224-266X 193 Issue 6, Volume 11, June 2012
-20-18-16-14-12-10-8-6-4-2024
015
30
45
60
75
90
105
120
135
150165
180195
210
225
240
255
270
285
300
315
330345
-20-18-16-14-12-10
-8-6-4-2024
015
30
45
60
75
90
105
120
135
150165
180195
210
225
240
255
270
285
300
315
330345
(a) (b)
-20-18-16-14-12-10
-8-6-4-2024
015
30
45
60
75
90
105
120
135
150165
180195
210
225
240
255
270
285
300
315
330345
(c) (d)
(e)
Figure 14. Measurements at 2.45 GHz: (a) XZ-plane radiation pattern, (b) YZ-plane radiation pattern, (c) XY-plane radiation pattern, (d) physical antenna, and (e) three-dimensional XY-plane radiation pattern
Table 10. Comparison of simulated and experimental S11 values of the primitive design and our approach for the final PCB serpentine antenna
2.4GHz 2.45GHz 2.5GHz
S11 Primitive
design Our
approach Primitive
design Our
approach Primitive
design Our
approach
Simulation(dB) -4.41 -11.17 -6.37 -14.87 -9.89 -10.34
Experiment (dB) -4.87 -10.28 -7.12 -15.61 -9.78 -10.04
WSEAS TRANSACTIONS on CIRCUITS and SYSTEMS
Chiu-Ching Tuan, Hung-Li Tseng, Yuan-Jen Chang, Chin-Hsing Chen, H.-D. J. Jeong, Wen-Tzeng Huang
E-ISSN: 2224-266X 194 Issue 6, Volume 11, June 2012
(a) (b)
Figure 15. (a) Actual hardware platform with the serpentine antenna and (b) actual system configuration
4.6 Wireless sensor performance evaluation It is important that this structure operate in real time. The coordinator allocates the transmission space and the protocol between it and a device in four phases, as shown in Figure 2. When the coordinator is ready to receive data, it sends a CMD to the device, which sends the data immediately. The gateway then sends out the data it receives from the coordinator. A completed transmission cycle requires 16.5 ms in the system structure shown in Fig. 2. The coordinator requires 4 ms to send a CMD to the device; each device takes 4 ms to respond with an ACK and 4.5 ms to transmit the data back to the coordinator. Finally, the coordinator requires 4 ms to send an ACK to the device. This means about 60 packages are possible each second for a transmission rate of about 38 Kbps. In beaconless mode [21], the ideal transmission rate is about 140 Kbps achieved by not using any ACKs. In our design, one data set takes 4.5 ms to send, so our full-speed transmission rate is about 142 Kbps in beaconless mode [21]. In the actual design, the transmission rate is as expressed as
data
cmd ack data ack
TSysSpeed Fullspeed
T T T T
(14)
for sending one complete data set, which requires the time for CMD, ACK, data, and ACK, or Tcmd, Tack, Tdata, and Tack, respectively. Therefore, the transmission rate of our design is about 35.6 (about 142/4) Kbps. In Eq. (14), SysSpeed is the actual transmission speed, Tcmd is the CMD time, Tdata is the transmission time of the physical data, and FullSpeed is 142 Kbps. One set (time) contains 4 bytes: identification (ID), Type, Data1, and Data2. The ID is used to distinguish the different users, the Type is used to distinguish the kind of sensor, and the two data bytes are available to store information. Because the transmission data of the SpO2 sensor and the heart
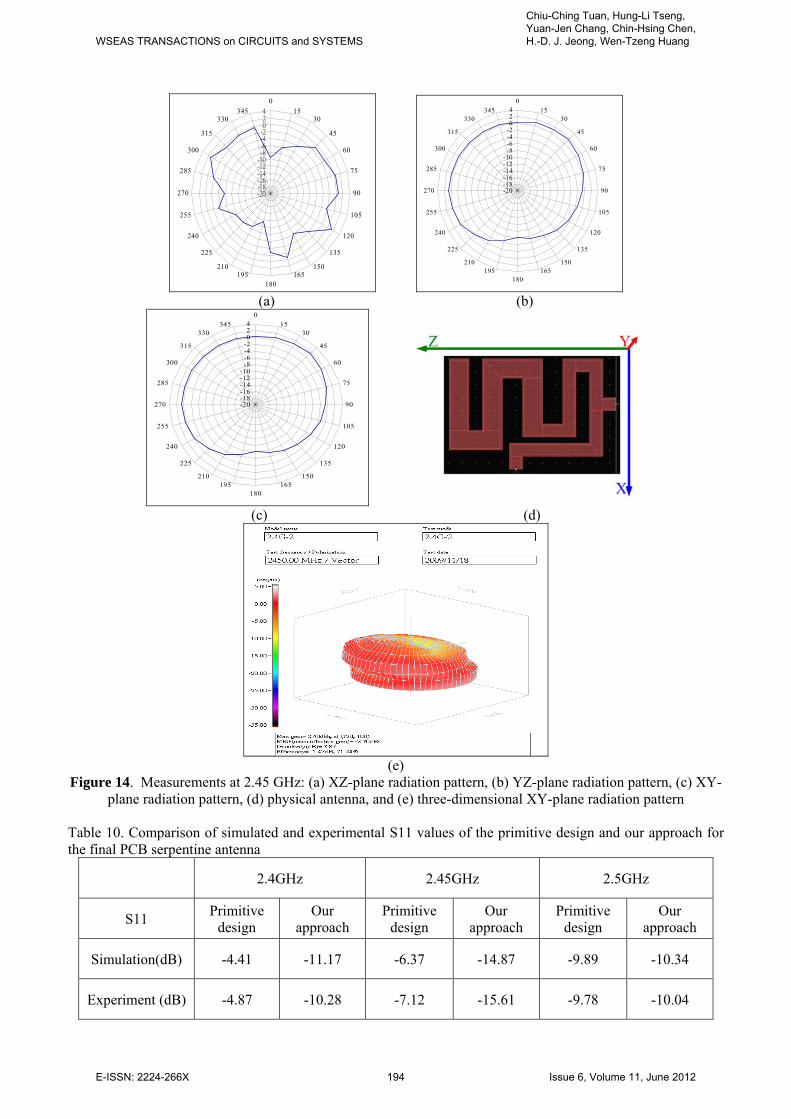
rate detection are combined into one set with the sampling rate set to 75 times per second, the transmission rate is 75 (times/s) × 4 (bytes/time) × 8 (bits/byte) = 2.4 Kbps. Since the maximum transmission rate of our system is 35.6 Kbps, there can be 14 sensors operating at full speed. Our experiments showed that the correct package transmission rate was more than 97.5% when the transmitting distance was less than 18 m.
40
50
60
70
80
90
100
0 2 4 6 8 10 12 14 16 18 20
Transmitting Distance (M)
Pac
ket C
orre
nt R
ate
(%)
Figure 17. Explanation of correct transmitted rate
5 Conclusions Traditional layout rules cannot meet the exacting requirements of WSN system applications due to unstable signals and non-ideal factors. We proposed and implemented a hardware platform with a high-reliability design that circumvents this problem. First, our simulation and experimental results showed that designers can greatly reduce system development time as well as control system reliability using our method. Using the proposed procedure to design a PCB serpentine antenna for ZigBee applications (100-MHz bandwidth at a 2.54-GHz resonance frequency) resulted in a difference of less than 1 dB between the simulation and the experimental prototype results. This will quickly lead to a practical PCB serpentine antenna. Our proposed design will reduce the cost because it requires less time than the traditional design. Our experiments showed that the system transmission distance can be greater than 18 m without any loss
WSEAS TRANSACTIONS on CIRCUITS and SYSTEMS
Chiu-Ching Tuan, Hung-Li Tseng, Yuan-Jen Chang, Chin-Hsing Chen, H.-D. J. Jeong, Wen-Tzeng Huang
E-ISSN: 2224-266X 195 Issue 6, Volume 11, June 2012

of data. This proves that our method can be an effective approach to hardware design. This method will thus be quite useful to ODMs in the design of PCB platforms.
6 Acknowledgment The authors would like to thank the National Science Council of the Republic of China for financially supporting this research under Contract No. NSC 100-2221-E-166-010-, NSC 100-2218-E- 159- 001-, NSC 100-2221-E-159-016-. References: [1] Ferrari P., Flammini A., Marioli D., Sisinni E.,
and Taroni A., A Bluetooth-Based Sensor Network with Web Interface. IEEE Transactions on Instrumentation and Measurement, Vol. 54, No. 6, 2005, pp.2363–2359.
[2] Lee R. G., Hsiao C. C., Chen C.C., and Liu M.S., A Mobile-care System Integrated with Bluetooth. Information Technology in Biomedicine, Vol. 4, No.1, 2000, pp.44–37.
[3] Lee RG, Chen HS, Lin CC, Chang KC, and Chen JH. Home Telecare System Using Cable Television Plants—An Experimental Field Trial. IEEE Transactions on Consumer Electronics, Vol. 49, No. 4, 2003, pp.1097−1090.
[4] Hwang KI, In J, Park NK, Eom DS. A Design and Implementation of Wireless Sensor Gateway for Efficient Querying and Managing through World Wide Web. IEEE Transactions on Consumer Electronics, Vol. 49, No. 4, 2003, pp.1097–1090.
[5] Brzozowski M, Piotrowski K, and Langendoerfer P. A Cross-layer approach for data replication and gathering in decentralized long-living wireless sensor networks. International Symposium on Autonomous Decentralized Systems. 2009 March 23-25; Athens, Greece; 6–1.
[6] LeBellego G, Noury N, Virone G, Mousseau M, Demongeot J. A Model for the Measurement of Patient Activity in a Hospital Suite. IEEE Transactions on Information Technology in Biomedicine, Vol. 10, No. 1, 2006, pp.99–92.
[7] Akyildiz IF, Su W, Sankarasubramaniam Y, and Cayirci E. Wireless Sensor Networks: A Survey, Computer Networks. The International Journal of Computer and Telecommunications Networking, Vol. 38, 2002, pp.422–393.
[8] Navarro D. Du W., Mieyeville F., Carrel L. Hardware and software system-level simulator for wireless sensor networks, Procedia Engineering,Vol 5, 2010, pp.228-231.
[9] Bogatin E. Signal Integrity—Simplified. Prentice Hall; 2003.
[10] Sharawi MS. Practical Issues in High-speed PCB Design. IEEE Potentials. ,Vol.23, No. 2, 2004, pp.27–24.
[11] Endo T, Sunahara Y, Satoh S, and Katagi T. Resonant Frequency and Radiation Efficiency of Meander Line Antennas. Electronics and Communications in Japan, 2000 January 24, Japan.
[12] Wang CJ and Hsu DF. Study of the Meander-Line Antenna and the Spiral Slot Antenna. Feng-Chia University, 2003.
[13] Best SR and Morrow JD. Limitation of Inductive Circuit Model Representations of Meander Line Antennas. IEEE Antennas and Propagation Society International Symposium, Vol. 1, No. 1, 2003, pp.855–852.
[14] Cheng D K. Field and Wave Electromagnetics. Addison-Wesley Publishing Company,1989.
[15] Harrington RF. Time-Harmonic Electromagnetic Fields. McGraw-Hill International,1993.
[16] Zhao M., Ma M., Yang Y. Efficient data gathering with mobile collectors and space-division multiple access technique in wireless sensor networks, IEEE Transactions on Computers, Vol. 60, No. 3, 2011, pp.400-417.
[17] Huang W.T and Jeong H-DJ. A Novel Implementation of High-reliability Wireless Sensor Network Platform with Serpentine-Antenna Design. The 3rd International Workshop on Intelligent, Mobile and Internet Services in Ubiquitous Computing, March, 2009 March 16-19, Fukuoka, Japan, pp.583–577.
[18] Pellegrini R.M., Persia S., Volponi D., Marcone G. ZigBee sensor network propagation analysis for health-care application. 5th International Conference on Broadband and Biomedical Communications, 2010.
[19] ZigBee Alliance protocol., http://www.ZigBee.org.
[20] Texas Instruments. MSP430x16x Mixed Signal Microcontroller. Specifications,2005.
[21] Sun T, Chen LJ, Han CC, Yang G, Gerla M. Measuring Effective Capacity of IEEE 802.15.4 Beaconless Mode. IEEE Wireless Communications and Networking Conference;
WSEAS TRANSACTIONS on CIRCUITS and SYSTEMS
Chiu-Ching Tuan, Hung-Li Tseng, Yuan-Jen Chang, Chin-Hsing Chen, H.-D. J. Jeong, Wen-Tzeng Huang
E-ISSN: 2224-266X 196 Issue 6, Volume 11, June 2012

2006 June 8-10, Budapest, Hungary, pp. 498–493.
[22] Park WK, Han I, and Park KR. ZigBee based Dynamic Control Scheme for Multiple Legacy IR Controllable Digital Consumer Devices. IEEE Transactions on Consumer Electronics. Vol. 53, No.1 , 2007, pp.177–172.
[23] Liu Y, Wang C, Qiao X, Zhang Y and Yu C. An Improved Design of ZigBee Wireless Sensor Network. The 2nd IEEE International Conference on Computer Science and Information Technology; 2009 August 8-11, Beijing, China, 518–515.
[24] Hu G. Design and Implementation of Industrial Wireless Gateway Based on ZigBee Communication. The Ninth International Conference on Electronic Measurement & Instruments; 2009 August 16-19, Beijing, China, pp.688–684.
[25] Uniband Electronic Corp. UZ2400 (RF+Baseband+MAC). Specifications Rev. 0.6, 2006.
[26] NONIN. Xpod Module Specification and Technical Information. USA: NONIN Medical Inc., 2006.
WSEAS TRANSACTIONS on CIRCUITS and SYSTEMS
Chiu-Ching Tuan, Hung-Li Tseng, Yuan-Jen Chang, Chin-Hsing Chen, H.-D. J. Jeong, Wen-Tzeng Huang
E-ISSN: 2224-266X 197 Issue 6, Volume 11, June 2012