Embed Size (px)
Citation preview
S1
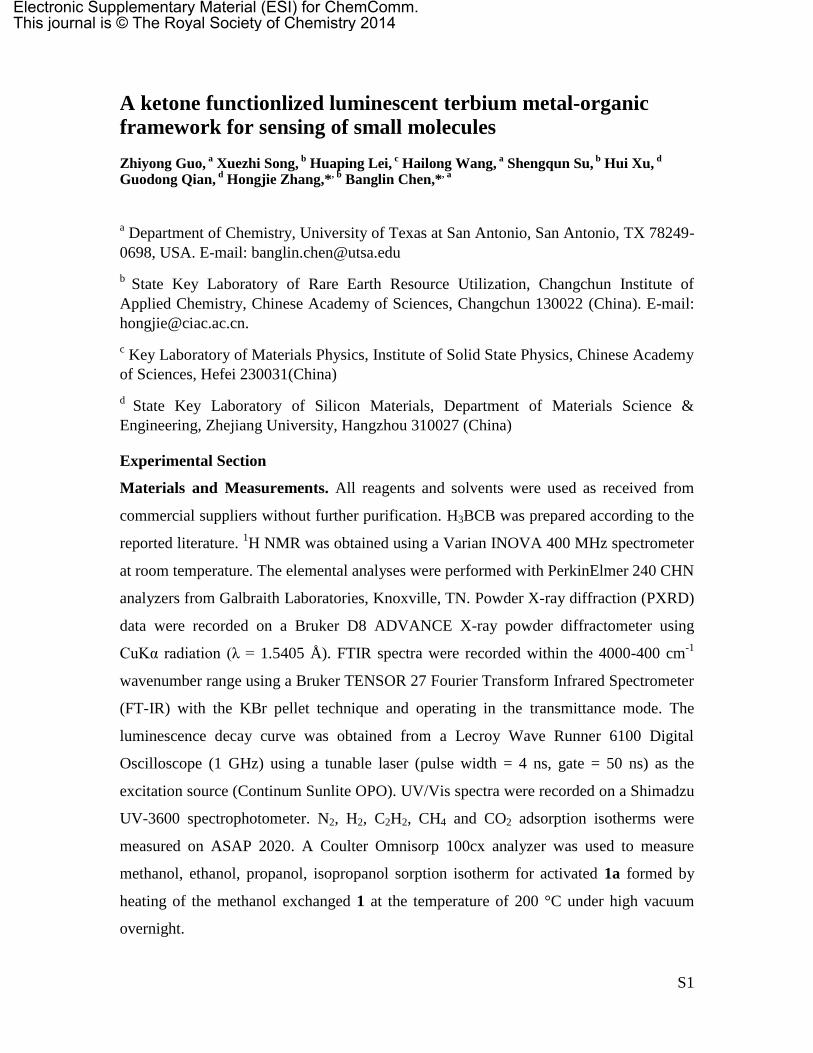
A ketone functionlized luminescent terbium metal-organic
framework for sensing of small molecules
Zhiyong Guo, a Xuezhi Song,
b Huaping Lei,
c Hailong Wang,
a Shengqun Su,
b Hui Xu,
d
Guodong Qian, d
Hongjie Zhang,*, b
Banglin Chen,*, a
a Department of Chemistry, University of Texas at San Antonio, San Antonio, TX 78249-
0698, USA. E-mail: [email protected]
b State Key Laboratory of Rare Earth Resource Utilization, Changchun Institute of
Applied Chemistry, Chinese Academy of Sciences, Changchun 130022 (China). E-mail:
c Key Laboratory of Materials Physics, Institute of Solid State Physics, Chinese Academy
of Sciences, Hefei 230031(China)
d State Key Laboratory of Silicon Materials, Department of Materials Science &
Engineering, Zhejiang University, Hangzhou 310027 (China)
Experimental Section
Materials and Measurements. All reagents and solvents were used as received from
commercial suppliers without further purification. H3BCB was prepared according to the
reported literature. 1H NMR was obtained using a Varian INOVA 400 MHz spectrometer
at room temperature. The elemental analyses were performed with PerkinElmer 240 CHN
analyzers from Galbraith Laboratories, Knoxville, TN. Powder X-ray diffraction (PXRD)
data were recorded on a Bruker D8 ADVANCE X-ray powder diffractometer using
CuKα radiation (λ = 1.5405 Å). FTIR spectra were recorded within the 4000-400 cm-1
wavenumber range using a Bruker TENSOR 27 Fourier Transform Infrared Spectrometer
(FT-IR) with the KBr pellet technique and operating in the transmittance mode. The
luminescence decay curve was obtained from a Lecroy Wave Runner 6100 Digital
Oscilloscope (1 GHz) using a tunable laser (pulse width = 4 ns, gate = 50 ns) as the
excitation source (Continum Sunlite OPO). UV/Vis spectra were recorded on a Shimadzu
UV-3600 spectrophotometer. N2, H2, C2H2, CH4 and CO2 adsorption isotherms were
measured on ASAP 2020. A Coulter Omnisorp 100cx analyzer was used to measure
methanol, ethanol, propanol, isopropanol sorption isotherm for activated 1a formed by
heating of the methanol exchanged 1 at the temperature of 200 °C under high vacuum
overnight.
Electronic Supplementary Material (ESI) for ChemComm.This journal is © The Royal Society of Chemistry 2014
S2
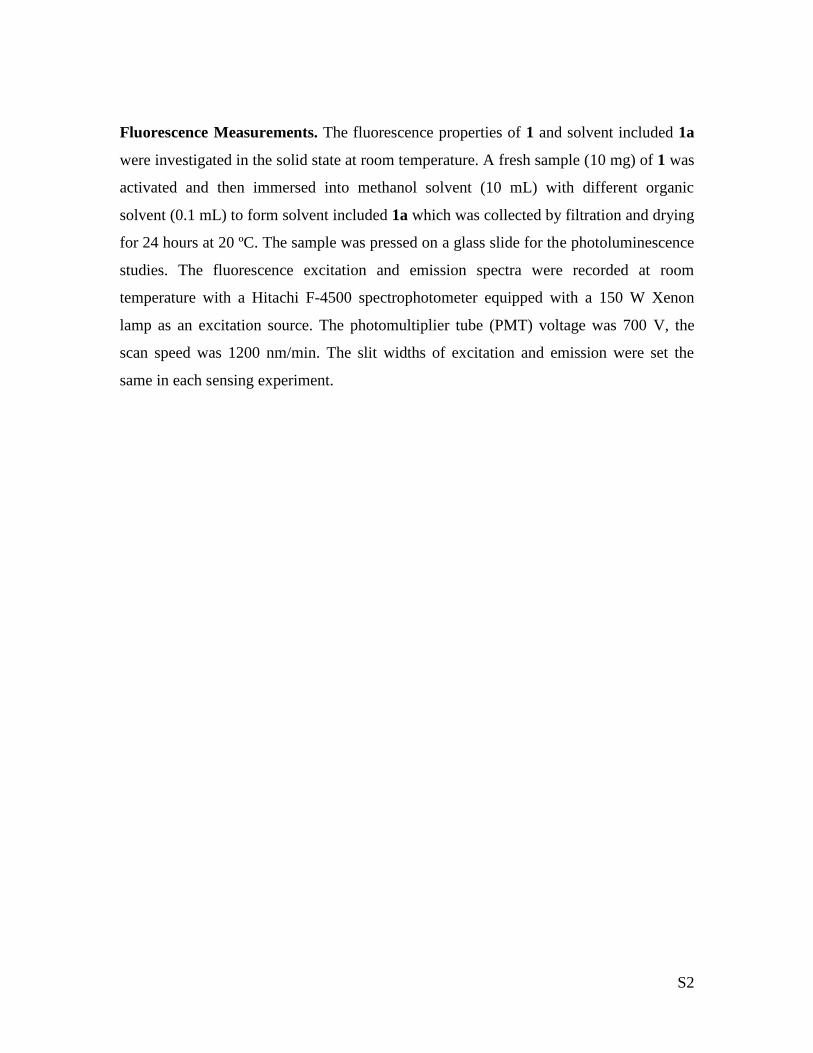
Fluorescence Measurements. The fluorescence properties of 1 and solvent included 1a
were investigated in the solid state at room temperature. A fresh sample (10 mg) of 1 was
activated and then immersed into methanol solvent (10 mL) with different organic
solvent (0.1 mL) to form solvent included 1a which was collected by filtration and drying
for 24 hours at 20 ºC. The sample was pressed on a glass slide for the photoluminescence
studies. The fluorescence excitation and emission spectra were recorded at room
temperature with a Hitachi F-4500 spectrophotometer equipped with a 150 W Xenon
lamp as an excitation source. The photomultiplier tube (PMT) voltage was 700 V, the
scan speed was 1200 nm/min. The slit widths of excitation and emission were set the
same in each sensing experiment.
S3
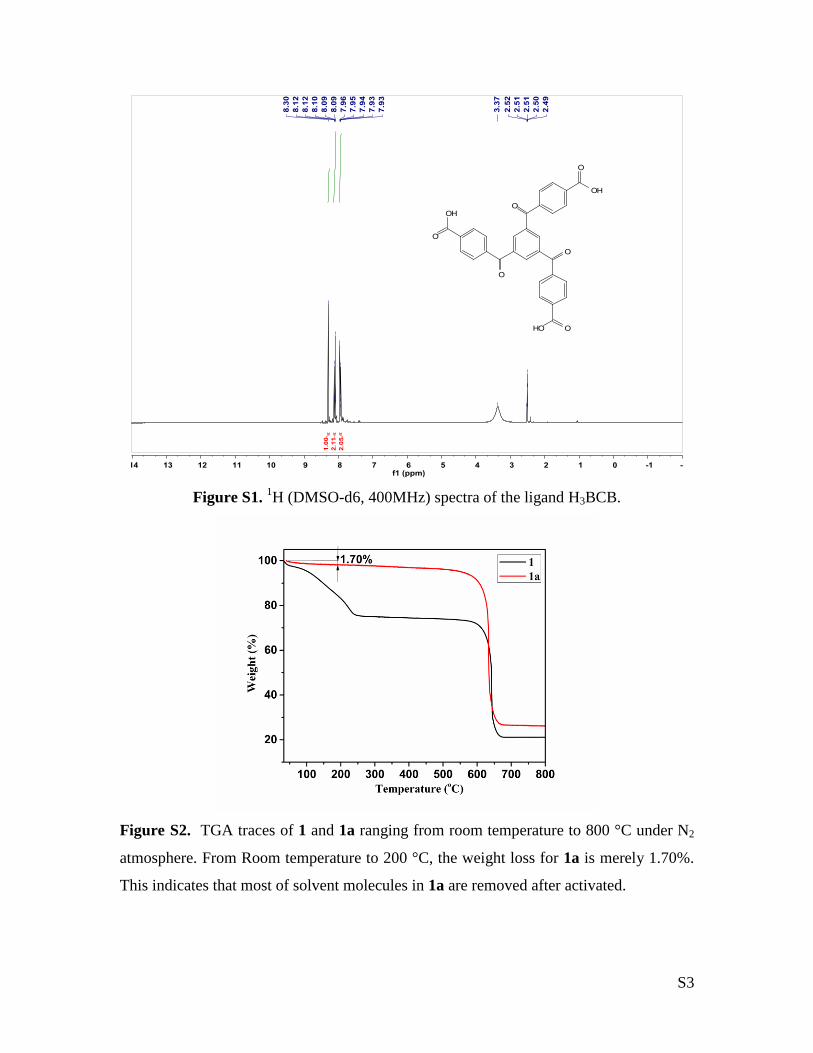
Figure S1. 1H (DMSO-d6, 400MHz) spectra of the ligand H3BCB.
Figure S2. TGA traces of 1 and 1a ranging from room temperature to 800 °C under N2
atmosphere. From Room temperature to 200 °C, the weight loss for 1a is merely 1.70%.
This indicates that most of solvent molecules in 1a are removed after activated.
S4
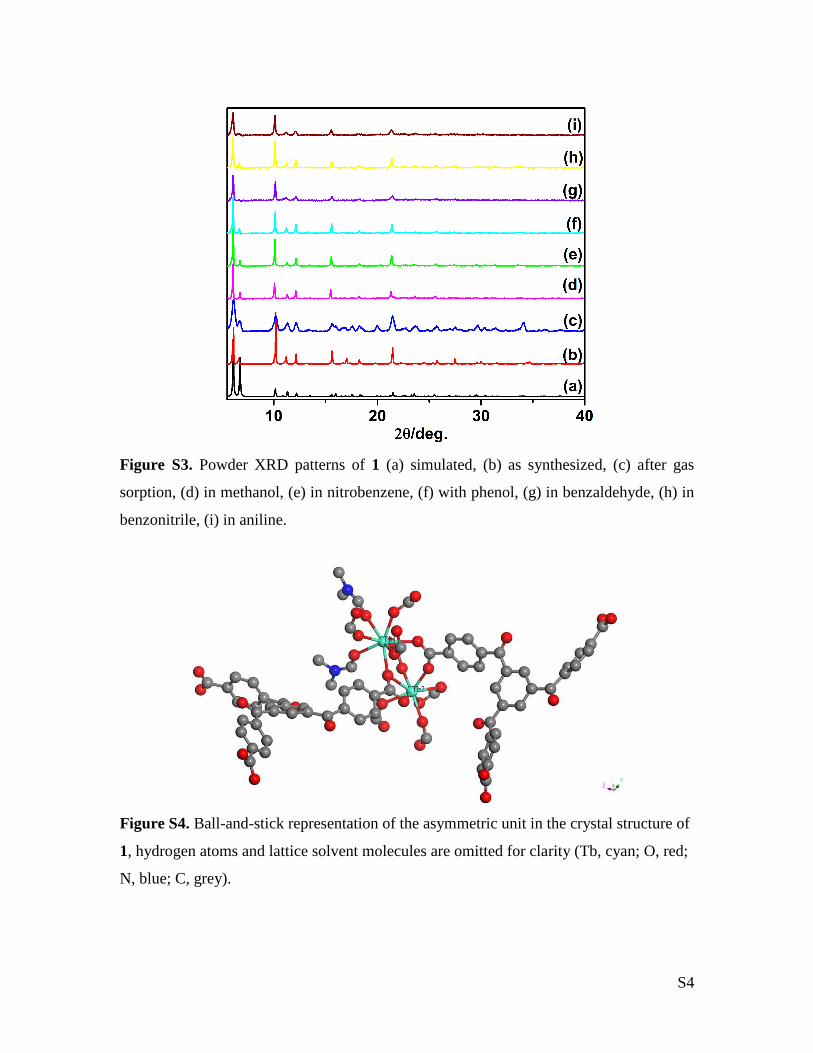
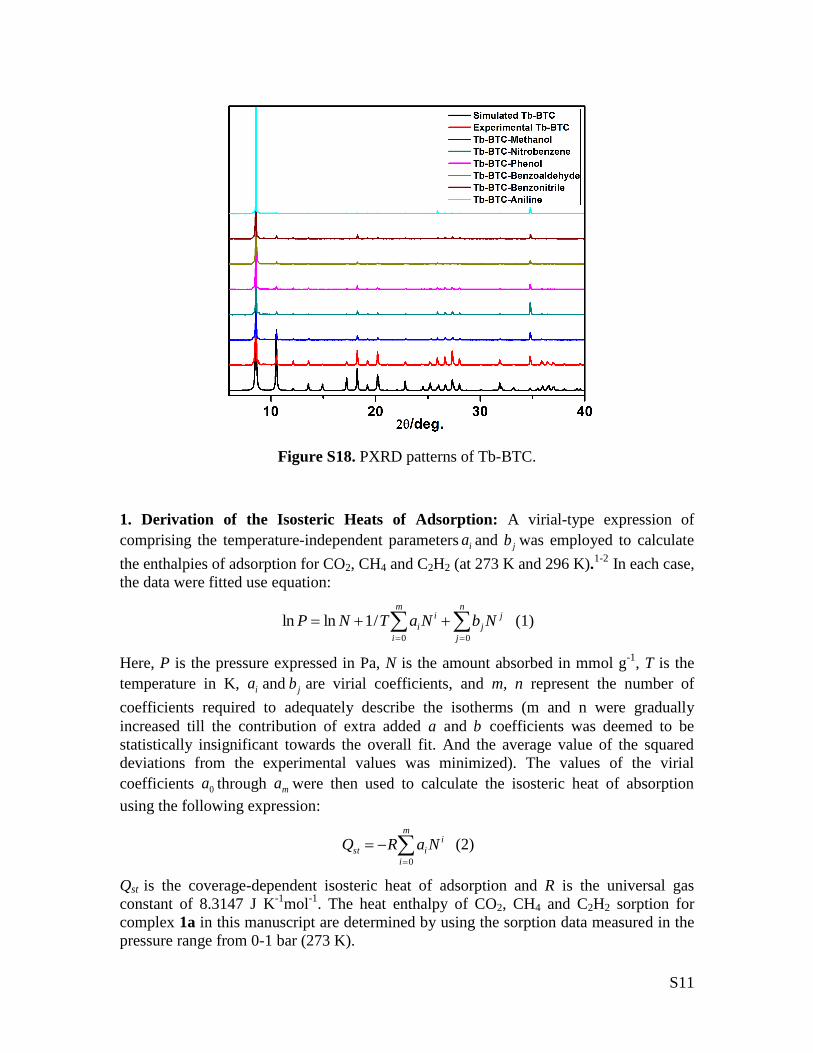
Figure S3. Powder XRD patterns of 1 (a) simulated, (b) as synthesized, (c) after gas
sorption, (d) in methanol, (e) in nitrobenzene, (f) with phenol, (g) in benzaldehyde, (h) in
benzonitrile, (i) in aniline.
Figure S4. Ball-and-stick representation of the asymmetric unit in the crystal structure of
1, hydrogen atoms and lattice solvent molecules are omitted for clarity (Tb, cyan; O, red;
N, blue; C, grey).
S5
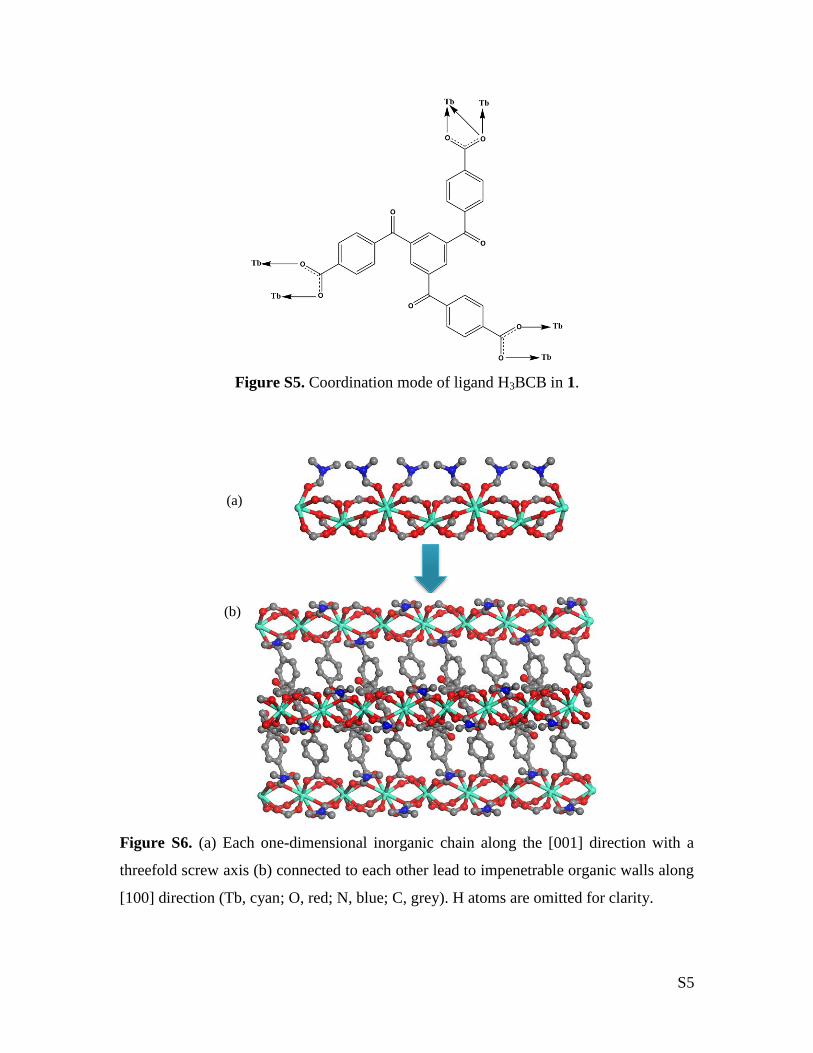
Figure S5. Coordination mode of ligand H3BCB in 1.
(a)
(b)
Figure S6. (a) Each one-dimensional inorganic chain along the [001] direction with a
threefold screw axis (b) connected to each other lead to impenetrable organic walls along
[100] direction (Tb, cyan; O, red; N, blue; C, grey). H atoms are omitted for clarity.
S6
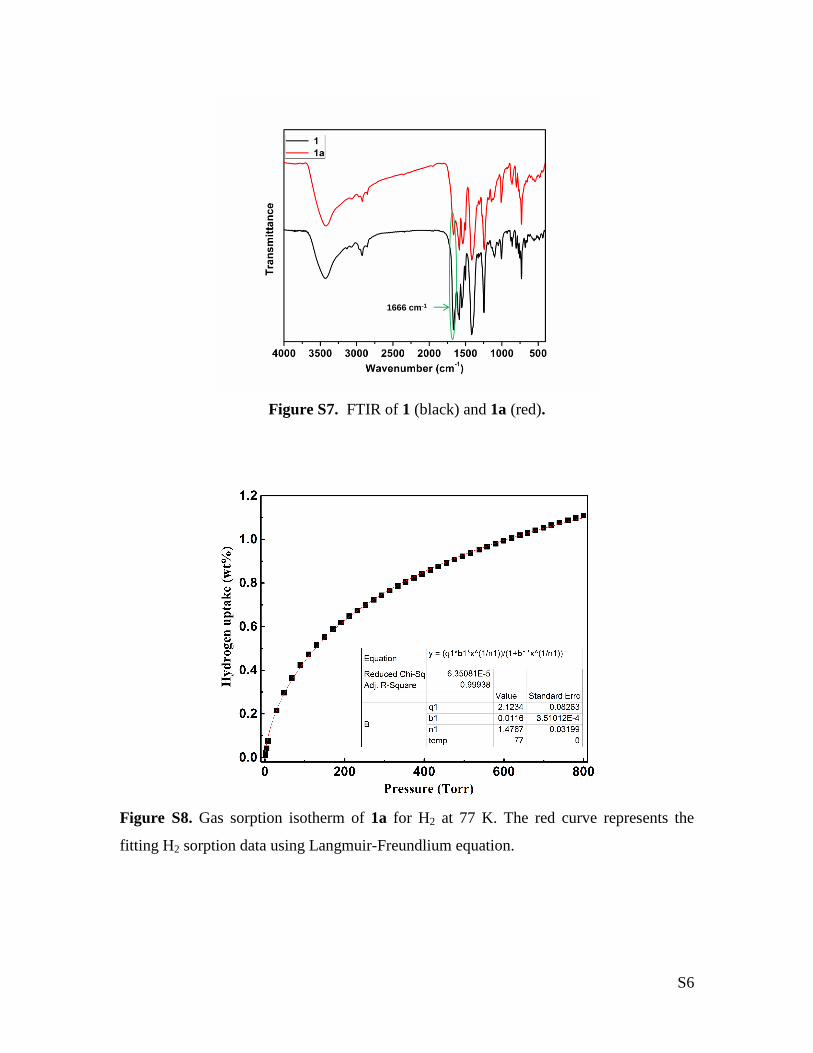
1666 cm-1
Figure S7. FTIR of 1 (black) and 1a (red).
Figure S8. Gas sorption isotherm of 1a for H2 at 77 K. The red curve represents the
fitting H2 sorption data using Langmuir-Freundlium equation.
S7
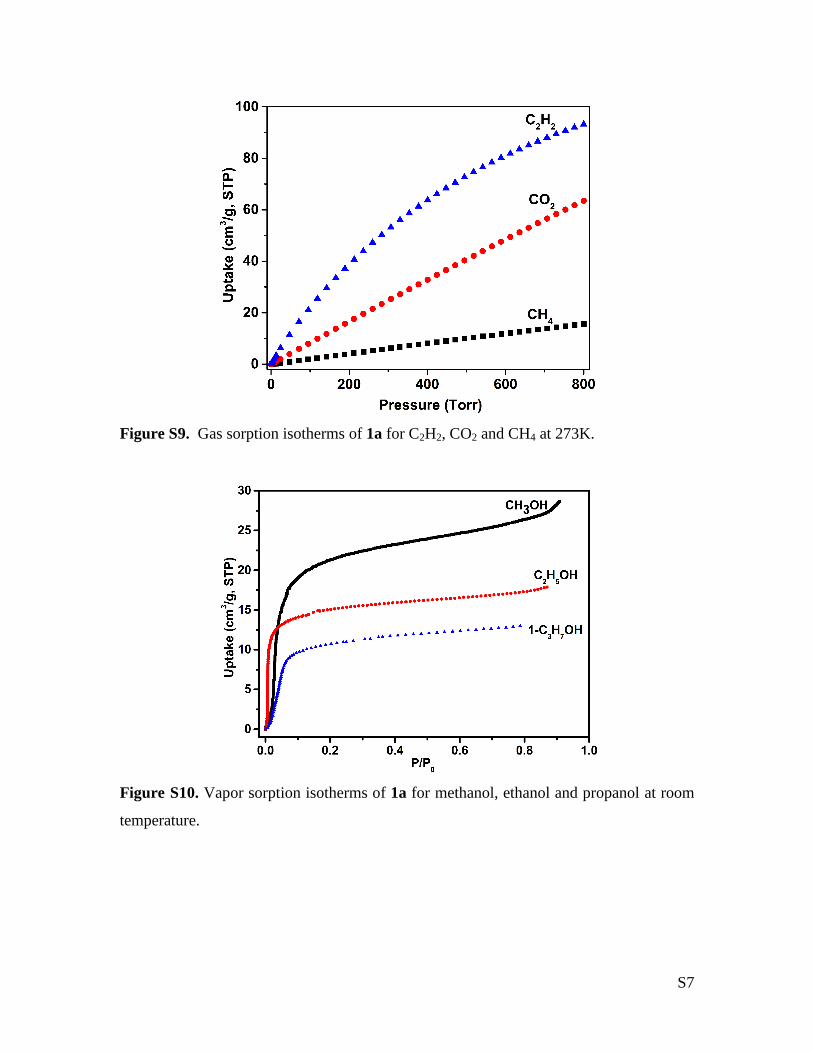
Figure S9. Gas sorption isotherms of 1a for C2H2, CO2 and CH4 at 273K.
Figure S10. Vapor sorption isotherms of 1a for methanol, ethanol and propanol at room
temperature.
S8
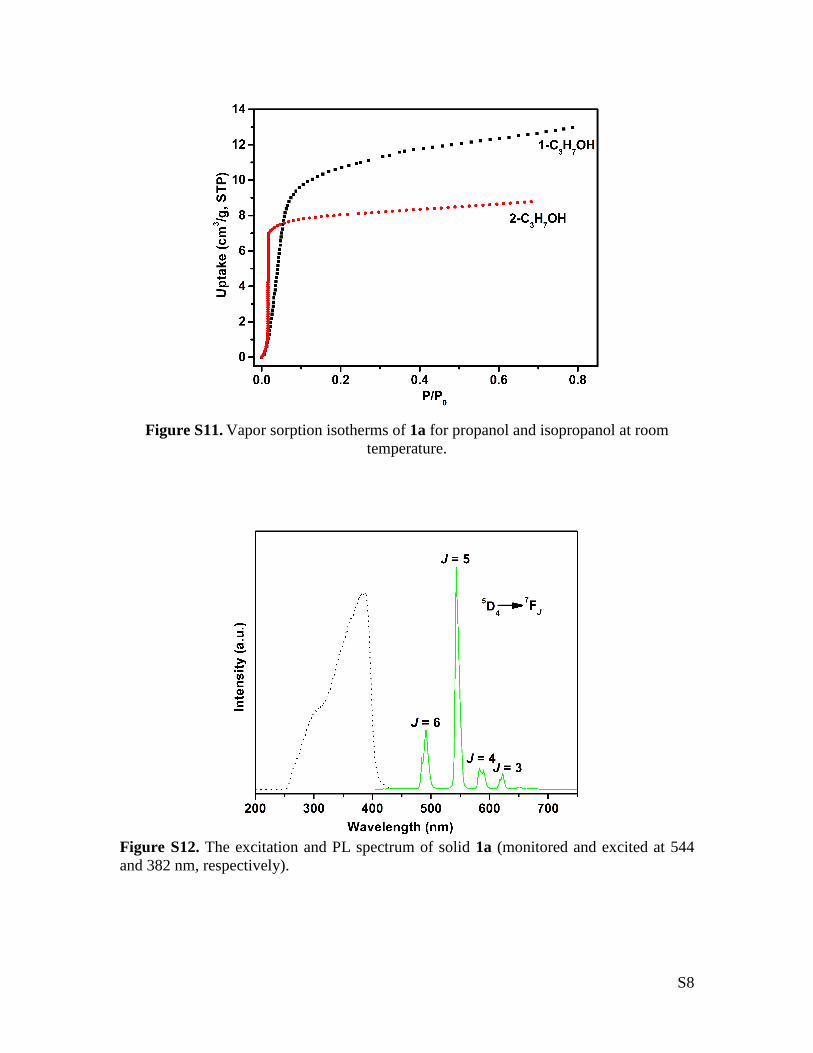
Figure S11. Vapor sorption isotherms of 1a for propanol and isopropanol at room
temperature.
Figure S12. The excitation and PL spectrum of solid 1a (monitored and excited at 544
and 382 nm, respectively).
S9
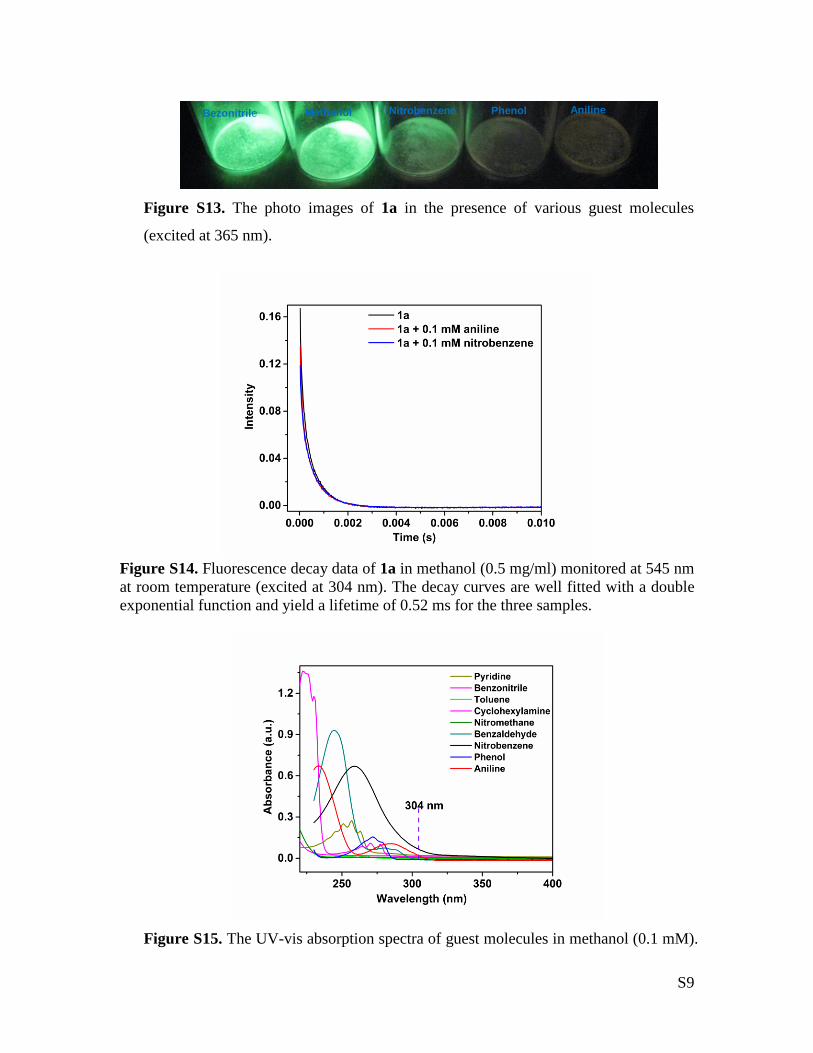
Bezonitrile AnilinePhenolNitrobenzeneMethanol
Figure S13. The photo images of 1a in the presence of various guest molecules
(excited at 365 nm).
Figure S14. Fluorescence decay data of 1a in methanol (0.5 mg/ml) monitored at 545 nm
at room temperature (excited at 304 nm). The decay curves are well fitted with a double
exponential function and yield a lifetime of 0.52 ms for the three samples.
Figure S15. The UV-vis absorption spectra of guest molecules in methanol (0.1 mM).
S10
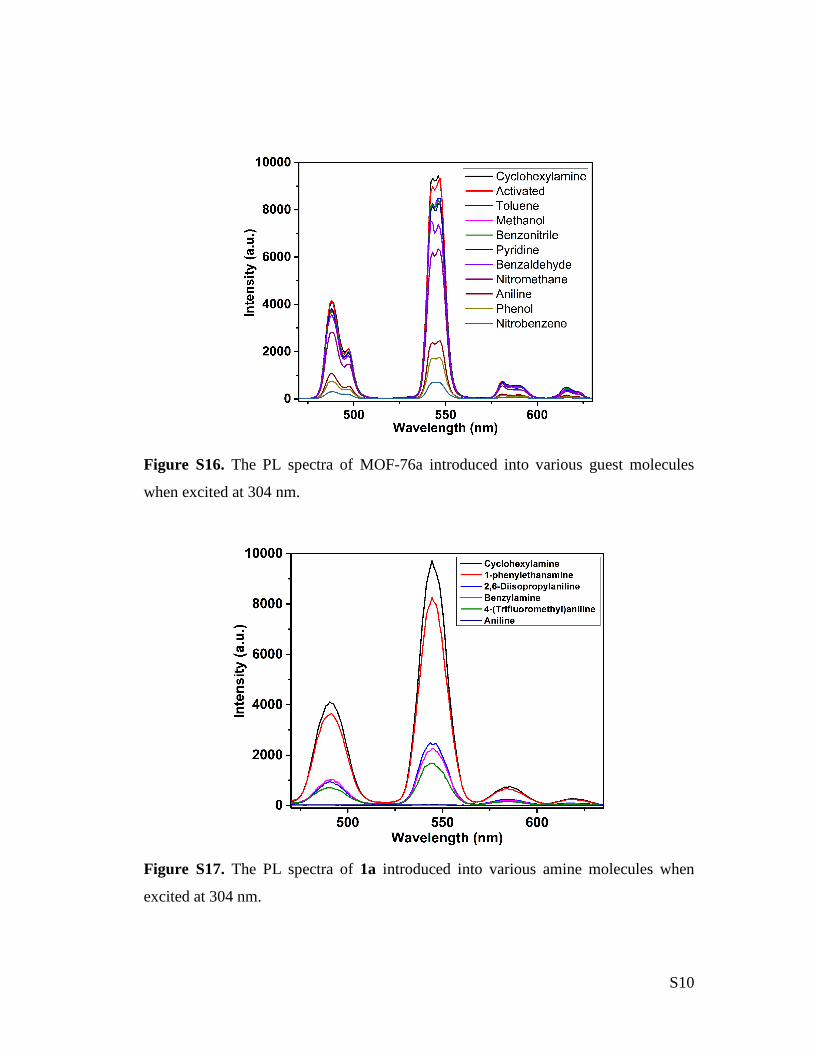
Figure S16. The PL spectra of MOF-76a introduced into various guest molecules
when excited at 304 nm.
Figure S17. The PL spectra of 1a introduced into various amine molecules when
excited at 304 nm.
S11
Figure S18. PXRD patterns of Tb-BTC.
1. Derivation of the Isosteric Heats of Adsorption: A virial-type expression of
comprising the temperature-independent parameters ia and jb was employed to calculate
the enthalpies of adsorption for CO2, CH4 and C2H2 (at 273 K and 296 K).1-2
In each case,
the data were fitted use equation:
n
j
j
j
m
i
i
i NbNaTNP00
/1lnln (1)
Here, P is the pressure expressed in Pa, N is the amount absorbed in mmol g-1
, T is the
temperature in K, ia and jb are virial coefficients, and m, n represent the number of
coefficients required to adequately describe the isotherms (m and n were gradually
increased till the contribution of extra added a and b coefficients was deemed to be
statistically insignificant towards the overall fit. And the average value of the squared
deviations from the experimental values was minimized). The values of the virial
coefficients 0a through ma were then used to calculate the isosteric heat of absorption
using the following expression:
im
i
ist NaRQ
0
(2)
Qst is the coverage-dependent isosteric heat of adsorption and R is the universal gas
constant of 8.3147 J K-1
mol-1
. The heat enthalpy of CO2, CH4 and C2H2 sorption for
complex 1a in this manuscript are determined by using the sorption data measured in the
pressure range from 0-1 bar (273 K).
S12
2. Dual Site Langmuir-Freundlich Model for C2H2/CH4, and CO2/CH4 Adsorption
Isotherms
On the basis of the Dual site Langmuir-Freundlich (DSLF) model: (I)
1/ 1 1/ 2max max1 2
1 21/ 1 1/ 2
1 21 1
n n
n n
b p b pN N N
b p b p
(I)
where p (unit: kPa) is the pressure of the bulk gas at equilibrium with the adsorbed
phase, N (unit: mol/Kg) is the adsorbed amount per mass of adsorbent, N1max
and N2max
(unit: mol/Kg) are the saturation capacities of sites 1 and 2, b1 and b2 (unit: 1/kPa) are
the affinity coefficients of sites 1 and 2, and n1 and n2 represent the deviations from an
ideal homogeneous surface. Here, the single-component C2H2, CO2, and CH4, adsorption
isotherms have been fit to enable the application of IAST in simulating the performance
of 1a under a mixed component gas. The fitting parameters of DSLF equation are listed
in Table S2. Adsorption isotherms and gas selectivities calculated by IAST for mixed
C2H2/CH4 (C2H2/CH4 = 50:50 and CO2/CH4 (CO2/CH4 = 50:50) in the 1a.
S13
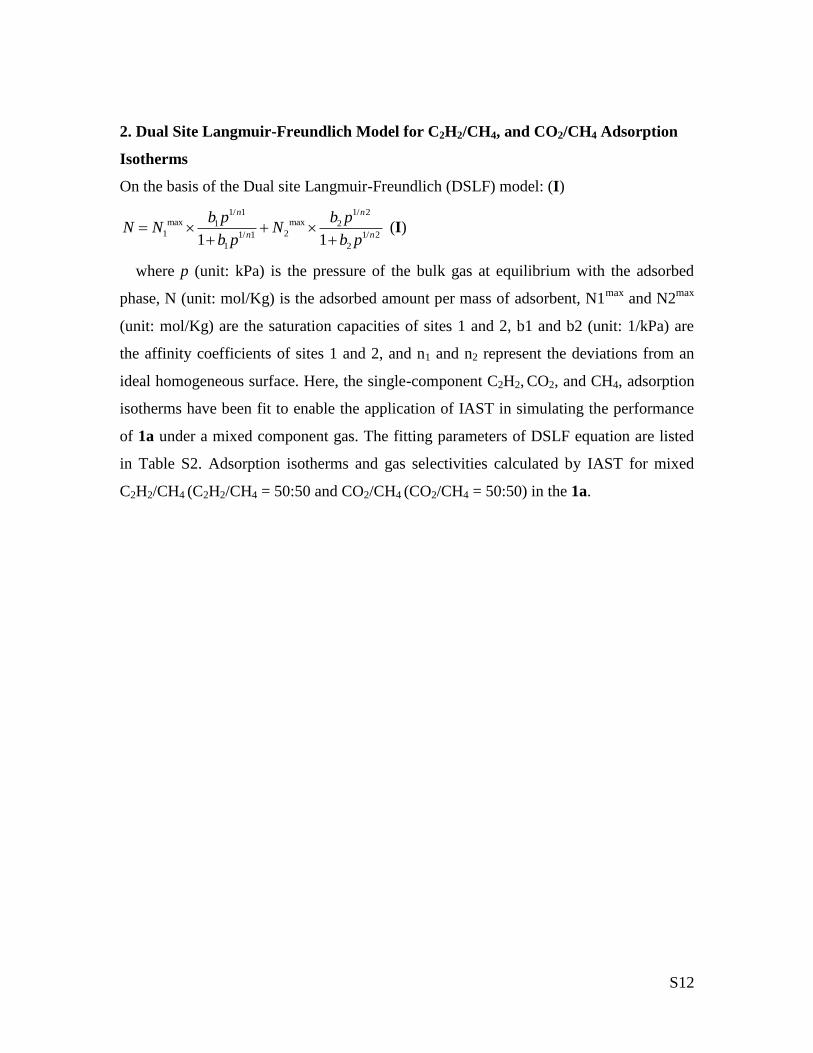
In order to confirm the excellent gas selectivities in 1a, the well-known ideal adsorbed
solution theory (IAST) calculation is also applied to estimate the C2H2/CH4 and CO2/CH4
adsorption selectivity. Mixture adsorption isotherms and the selectivities at different
pressures and temperatures calculated by IAST for mixed C2H2/CH4 (C2H2/CH4 = 50:50)
and CO2/CH4 (CO2/CH4 = 50:50) in this activated MOF as a function of total bulk
pressure are shown in Figures S17 and S18.
0 20 40 60 80 100
0
1
2
3
C2H
2
CH4
N (
mm
ol/
g)
Pressure (KPa)
10
15
20
25
Sele
cti
vit
y
0 20 40 60 80 100
0.0
0.5
1.0
1.5
C2H
2
CH4
N (
mm
ol/
g)
Pressure (KPa)
8
10
12
14
Sele
cti
vit
y
(a)
(b)
Figure S19. Mixture adsorption isotherms and adsorption selectivity predicted by IAST
of 1a for C2H2 (50%) and CH4 (50%) (a, b) at 273 and 296 K, respectively.
S14
0 20 40 60 80 100
0.0
0.2
0.4
0.6
0.8
CO2
CH4
N (
mm
ol/
g)
Pressure (KPa)
2
3
4
5
Sele
cti
vit
y
0 20 40 60 80 100
0.0
0.5
1.0
1.5
CO2
CH4
N (
mm
ol/
g)
Pressure (KPa)
3.0
3.5
4.0
4.5
5.0
Sele
cti
vit
y
(b)
(a)
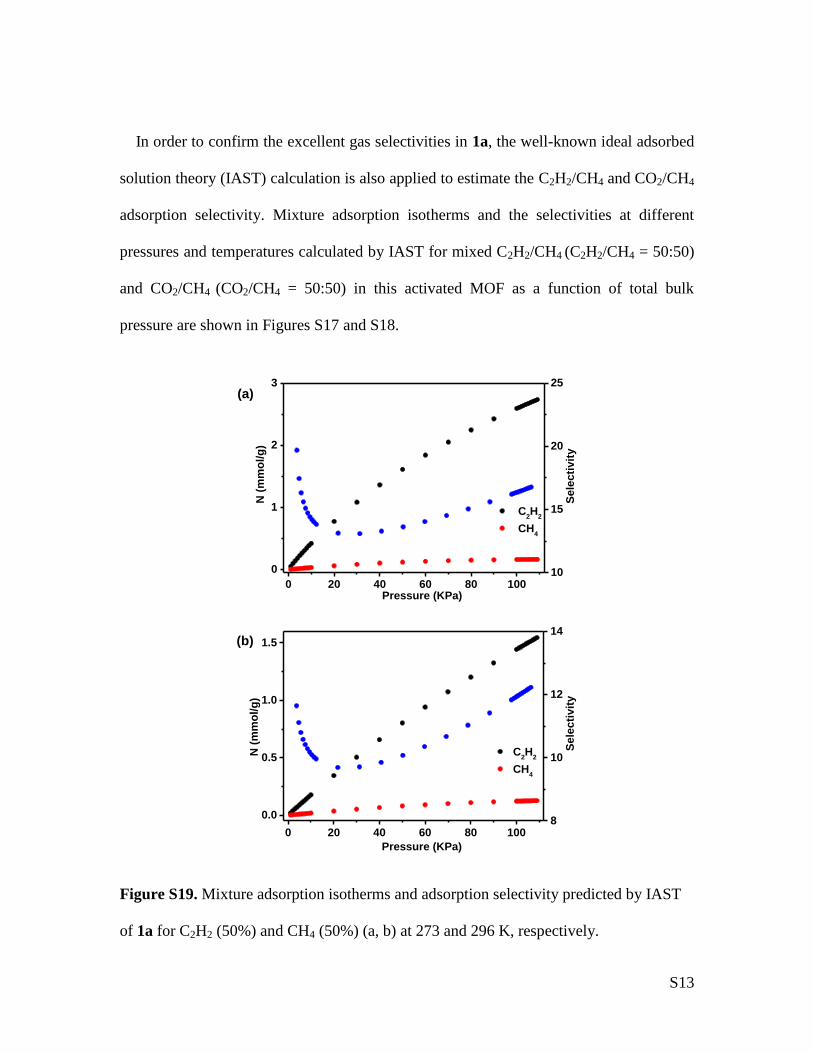
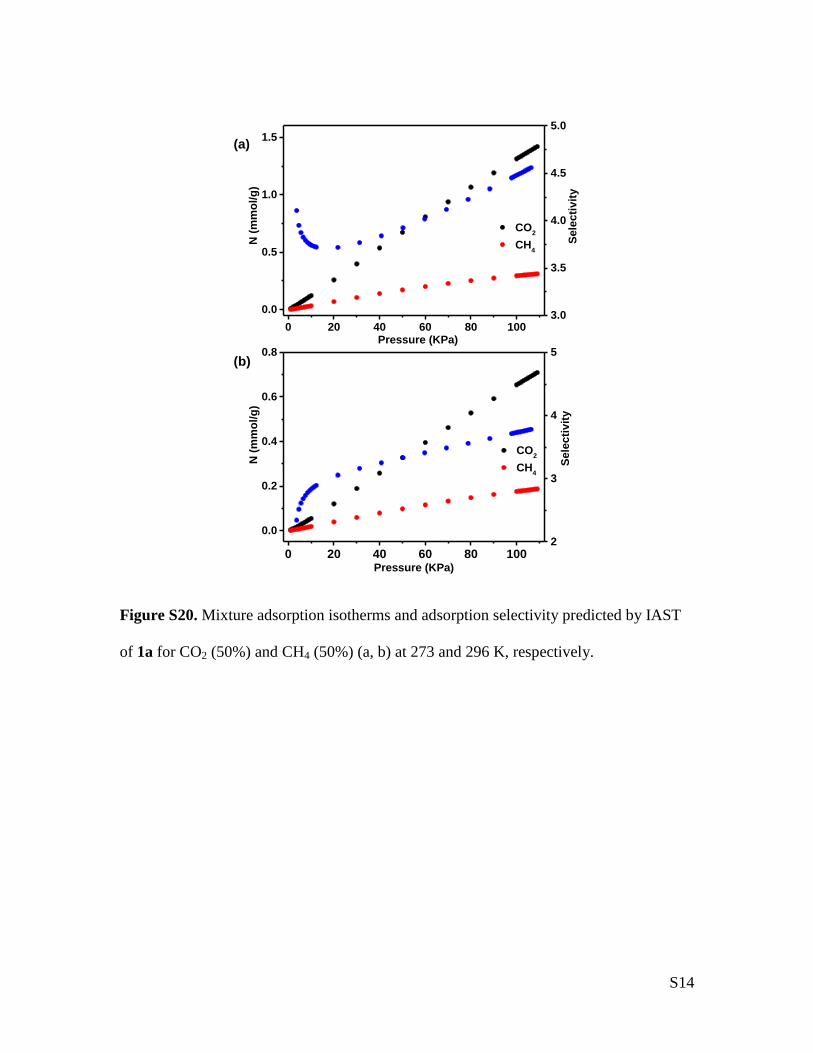
Figure S20. Mixture adsorption isotherms and adsorption selectivity predicted by IAST
of 1a for CO2 (50%) and CH4 (50%) (a, b) at 273 and 296 K, respectively.
S15
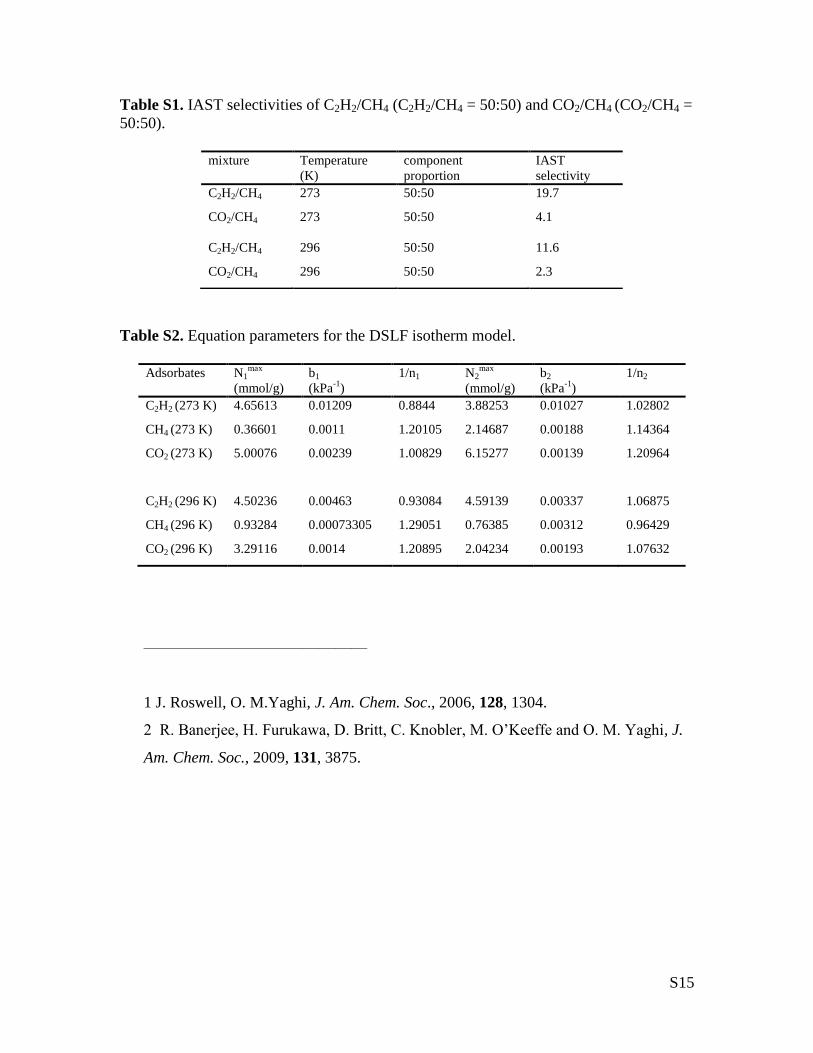
Table S1. IAST selectivities of C2H2/CH4 (C2H2/CH4 = 50:50) and CO2/CH4 (CO2/CH4 =
50:50).
Table S2. Equation parameters for the DSLF isotherm model.
——————————————
1 J. Roswell, O. M.Yaghi, J. Am. Chem. Soc., 2006, 128, 1304.
2 R. Banerjee, H. Furukawa, D. Britt, C. Knobler, M. O’Keeffe and O. M. Yaghi, J.
Am. Chem. Soc., 2009, 131, 3875.
mixture Temperature
(K)
component
proportion
IAST
selectivity
C2H2/CH4 273 50:50 19.7
CO2/CH4 273 50:50 4.1
C2H2/CH4 296 50:50 11.6
CO2/CH4 296 50:50 2.3
Adsorbates N1max
(mmol/g)
b1
(kPa-1
)
1/n1 N2max
(mmol/g)
b2
(kPa-1
)
1/n2
C2H2 (273 K) 4.65613 0.01209 0.8844 3.88253 0.01027 1.02802
CH4 (273 K) 0.36601 0.0011 1.20105 2.14687 0.00188 1.14364
CO2 (273 K) 5.00076 0.00239 1.00829 6.15277 0.00139 1.20964
C2H2 (296 K) 4.50236 0.00463 0.93084 4.59139 0.00337 1.06875
CH4 (296 K) 0.93284 0.00073305 1.29051 0.76385 0.00312 0.96429
CO2 (296 K) 3.29116 0.0014 1.20895 2.04234 0.00193 1.07632