Embed Size (px)
Citation preview
Volume 39, Number 2, 2013
A KINEMATICS' ANALYSIS AND EXPERIMENTAL EVALUATION OF THE METAL PUSH BELT CVT
Eid Mohamed 1
UDC: 621.839.72
NOMENCLATURE:
LIST OF SYMBOLS
T The band tension. (The total tension in both band packs.) (N) FI Inertia Force (N) T1, T2 Belt Tensions at ends of the Element (N) Fc Centrifugal Force (N) FF Friction force acting between band pack and segment or between
neighboring bands (N) FN Total normal force acting on the segment shoulder (N) FT The tangential friction force acting between the pulley surface and the
segment side (N) FR Radial friction force acting between the pulley surface and the segment
sides (N) Faxle Axial force acting on the segment (N) m Mass of one belt segment (Kg) V The velocity of the segment (m/s) R The rolling radius of the belt segment (m) Rsec Radius of the secondary bulley (m) Rpr Radius of the primary bulley (m) C Center distance (m)
priβ
Contact angle for primary pulley (deg)
secβ
Contact angle for secondary pulley (deg) icvt Transmission ratio of CVT (--) L Belt Length (m) Pp, Ps Primary and secondary oil pressure (N/m2) Fs, Fp Secondary and primary clamping force (N) Ap, As Primary and secondary pistons area (m2)
Pω , Sω Primary and secondary pulley velocities (rpm)
xp, xs distance of the primary and secondary pistons (m) Δx Initial distance of secondary pulley spring (m) Fspr Force of secondary pulley spring (N) Cp , Cs Primary and secondary pulleys centrifugal coefficient (--) µp , µs Primary and secondary pulley and belt traction coefficient (--)
1 Eid Mohamed, Automotive and Tractors Engineering, Faculty of Engineering, Helwan University, Cairo, Egypt. Email: [email protected]

Eid Mohamed
Volume 39, Number 2, 2013
10
LIST OF ACRONYMS:
DCV Directional Control Valve CVT Continuously Variable Transmission CV Choke Valves RMS Root Mean Square
1. INTRODUCTION
1. 1 GENERAL:
The Continuously Variable Transmission (CVT) is increasingly used in automotive applications. It has an advantage over conventional automatic transmissions, with respect to the large transmission ratio coverage and absence of comfort issues related to shifting events. This enables the engine to operate at more economic operating points. For this reason, CVT equipped cars are more economical than cars equipped with planetary gear automatic transmissions The key advantages of a CVT that interest vehicle manufacturers and customers can be summarized as:
• Higher engine efficiency. • Higher fuel economy. • Smooth acceleration without shift shocks. • Infinite gear ratios with a small number of parts. • Easy to manufacture and low cost. • Light and Compact. The basic configuration of a metal V-belt CVT consists of two variable diameter
pulleys connected by a power-transmitting device i.e. a metal V-belt. The pulley centers are a fixed distance apart. The pulley on the engine side is called the primary or the driver pulley. The other on the final drive (or the wheel side) is the secondary or the driven pulley. Since one of the sheaves on each pulley is movable, the application of an axial force on the movable pulley sheave allows the belt to move radially in the pulley groove. In addition to the radial motion, the belt also moves tangentially around the pulley under the influence of an applied torque. The metal V-belt is made of two series of thin steel bands holding together thin trapezoidal elements. The elements are connected to each other by a system of pegs and holes, a peg in the forward face of an element connected to a hole in the rear face of the element in front. Usually, an initial gap exists between the elements of the belt as they are not tightly pressed together.
Torque is transferred from the driver to the driven pulley by the pushing action of the elements. As the belt moves, an element is carried forward on the driver pulley due to the friction forces generated from the pulley. This forward motion of the element generates compressive forces as it pushes on the element ahead of it. On the driven side, the belt transfers torque to the driven pulley through friction. Due to the presence of friction between the band pack and the elements, the tensile forces in the bands also vary as the belt moves on the driver and driven pulleys. Thus, the operation of such a CVT is based on both the pulling and pushing mechanisms of the composite-structured belt.

A kinematic analysis and experimental evaluation of the metal push belt CVT
Volume 39, Number 2, 2013
11
1. 2 BACKGROUND OF CVT:
The metal V-belt, manufactured by Van Doorne’s Transmission, consists of 400 steel elements and two sets of nine stacked steel bands [1]. The system consists of a primary pulley indirectly linked to the engine through a torque converter and a secondary pulley leading to the final drive gears and wheels. Two pressures, primary and secondary, are associated with the primary and secondary pulleys, respectively. The secondary pressure is the hydraulic supply, or line pressure. The primary pressure is in part dictated by a solenoid relief valve commanded by an electronic engine controller, and is directly related to the difference in primary and secondary pressures. Therefore, our intermediate control objective will be to specify the ratio of primary to secondary pulley speed by means of primary pressure solenoid valve counts. The primary control objective will be to achieve a desired engine speed, which we consider a known function of throttle angle and vehicle speed. We will use this desired engine speed to specify the desired ratio, and then use the desired ratio to specify control input. Thus, back stepping control will be used to achieve our goal. Figue 1 illustrates the basic arrangement of a metal V-belt CVT. The band pack runs over the belt elements, whereas the belt element contacts not only the band pack, but also the pulley sheave.
Continuously variable transmissions (CVTs) are typically composed of two hydraulically actuated variable radii pulleys and a metal pushing belt, the CVTs offer a continuum of infinitely variable gear ratios by changing the location of pulley sheaves. As a result, CVTs have the potential to increase the overall vehicle efficiency and reduce the jerk usually associated with manual and automatic transmissions. One shortcoming, however, is their difficulty in transmitting high torque at low operating speeds, which so far has limited their use to small vehicles. CVT is an emerging automotive transmission technology that offers a continuum of gear ratios between high and low extremes. Today, Continuously Variable Transmissions have lured a great deal of automotive manufacturers and customers. Several car companies like Honda, Toyota, Ford, Nissan, etc., have been doing intensive research to exploit the advantages of a CVT. The chief advantage of a CVT is its ability to offer an infinite range of gear ratios with fewer moving parts, and consequently this influences engine efficiency, fuel economy, and cost.
A sundry of research is available on different aspects of a CVT, e.g. performance, slip behavior, efficiency, configuration design, loss mechanisms, vibrations, etc. Literature pertaining to the slip behavior of a belt CVT will be discussed subsequently. [2] Presented a unified slip theory based on the contributions of creep, compliance, shear deflection, and flexural rigidity of a rubber V-belt. Finite Element Analysis was used to calculate shear deflections in the belt and also to determine the stick-slip conditions on the belt. Incorporated the elastohydrodynamic lubrication theory to model friction between the metal belt and the pulley and also studied, both theoretically and experimentally, the influence of elemental gaps on the slip behavior of belt. The equilibrium conditions were assumed to develop a speed ratio-torque load-axial force relationship. The friction between the band and the elemental block was neglected. It was observed that the gross slip points depend on the torque transmission capacity of the driven side. Performance-based analyses of a metal V-belt drive and obtained a set of equations to describe the belt behavior based on quasi-static equilibrium. Coulomb friction model was used to model friction for all surfaces i.e. among individual bands, band element, and element-pulley. He also studied the deformation and creep of bands and blocks under the influence of torques and forces.
Eid Mohamed
Volume 39, Number 2, 2013
12
Historically slip in a CVT was regarded as destructive. The reason for this was that slip was not controllable and since it is unstable always resulted in damage to the variator. Recent publications suggest that limited amounts of slip in a push-belt type variator can be allowed [3]. This opens the door to other strategies for lowering the power consumption of CVT’s. Not only can slip be used for optimizing variator efficiency actuation efficiency can also be greatly improved. If the safety margin is eliminated, the clamping force can be reduced by more than 25%. This can be directly translated into a 25% decrease in actuation power. Shifting behaviour is also influenced by slip [4]. This effect can be used to greatly reduce the power needed for fast shifting during emergency stopping, tip-shifting and kick down actions. Using this strategy the force needed for shifting is reduced, and with it the power needed from the actuation system is reduced. This has not only effects on the power consumed by the actuation system of the CVT, which is by itself a significant factor in the variator efficiency, but also has some implications on the design of the CVT. If actuation forces are smaller, the actuation system can be smaller and cheaper, and the CVT itself will be lighter. Furthermore, other actuation systems than hydraulics can be considered, for example electromechanical actuation, to further enhance the controllability and efficiency of the actuation system. In this paper, measurements are shown for shifting behaviour of the CVT and a relation will be given with slip in the system. The results are used to model the transient behaviour of the CVT. References [5, 6] analysed the shifting dynamics of a metal V-belt CVT under creep and sliding phases. They proposed a viscoplastic friction model to describe CVT dynamics in creep mode. They also studied the influence of clearance between the elements on the slip behaviour of the belt.
Figure 1: Pulley arrangement
The bands-segment interaction and the inertial effects of the belt were not modeled
in detail. Non-dimensional equations were defined to encompass different loading scenarios. [7] Investigated elastic creep velocity of V-belt analytically and experimentally. The belt creep velocity depends not only on the structural characteristics of the belt, but also on the operational characteristics of the CVT. It was observed that the belt creep velocity was a function of transmitted power. The belt dynamics was modeled using quasi-static equilibrium concepts. [8] Investigated the torque transmitting capacity of a metal pushing V-

A kinematic analysis and experimental evaluation of the metal push belt CVT
Volume 39, Number 2, 2013
13
belt CVT under no load condition on the driven pulley. Their research focused on the microslip behavior of the V-belt due to the redistribution of elemental gaps in the belt. [9, 10] Developed a detailed dynamic model to understand the transient behavior and torque transmitting capacity of a metal V-belt CVT. The inertial coupling due to the radial and tangential motions of the belt was modeled in detail. Flexural effects were neglected and the contact between the belt and the pulley was modeled using continuous Coulomb friction theory. Their work illustrated the importance of belt inertial effects on the torque transmitting capacity of the metal V-belt CVT. They also emphasized on the significance of providing a feasible set of initial operating conditions to the CVT model in order to initiate torque transmission.
2. STEADY STATE MODEL OF A METAL V-BELT CVT
2. 3 KINETICS OF PUSH BELT CVT
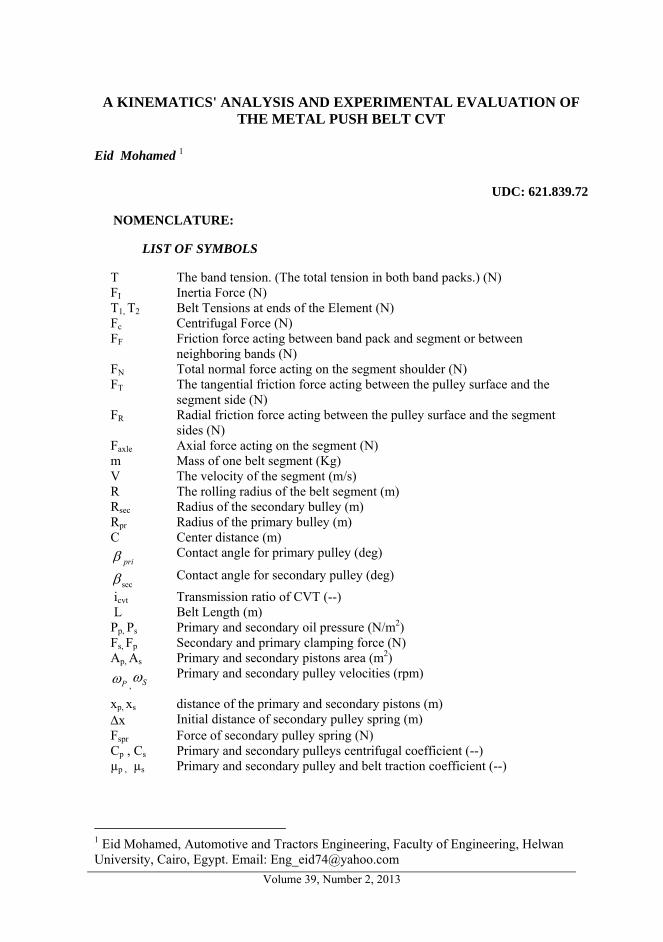
The CVT system runs at a steady state condition i.e. constant transmission ratio. The driver and driven pulleys run at constant angular velocities and are subjected to loading conditions of torques and axial forces. The belt inertial effects have been neglected, except for the terms arising from the centripetal acceleration of the belt. Figure 2 shows the geometry of the one part of the belt and pulley moves, the tangential slip is modelled on the basis of gap redistribution between the belt elements [11, 12]. Simple geometry gives an expression for the length of the belt as:
( ) ( )secsec2
sec2
214 ββ ddddCL pripripri ++−−= , (1)
Since the length of the belt L is known as is the distance between pulley centres C the equation above can be implemented in an iterative program to find corresponding values of primary and second pulley diameters Rpri and Rsec and
priβ and secβ for any value of belt ratio icvt, in this work the belt ratio is defined in geometric terms, as output radius over input radius, as:
pricvt R
Ri sec= = Transmission ratio, (2)
( )⎥⎦⎤
⎢⎣
⎡ −−=⎟⎟⎠
⎞⎜⎜⎝
⎛ −−= −−
cvtpri
pri iC
dC
dd15.0sin2
2sin2 sec1sec1 ππβ ,
( )⎥⎦⎤
⎢⎣
⎡ −−=⎟⎟⎠
⎞⎜⎜⎝
⎛ −−= −−
cvtpri
pri iC
dC
dd15.0sin2
2sin2 sec1sec1 ππβ ,
(3)
( )⎥⎦⎤
⎢⎣
⎡ −+=⎟⎟⎠
⎞⎜⎜⎝
⎛ −+= −−
cvtpri i
Cd
Cdd
15.0sin22
sin2 sec1sec1sec ππβ , (4)
Eid Mohamed
Volume 39, Number 2, 2013
14
Figure 2 Geometry of the push belt
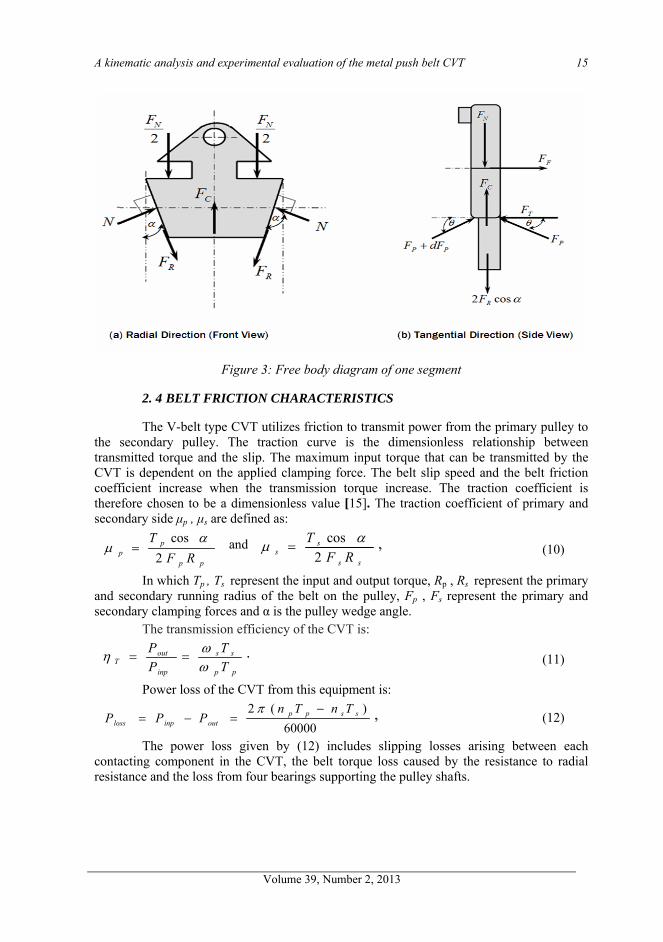
Figure 3 shows the force acting on the band pack around of belt segments while
travelling around a pulley wrap angle:
∑ = 0F in X direction θθ coscos)( TFdTT F +=+ ,
θθθ coscoscos TFdTT F +=+ . (5)
Since θ is very small, cosθ =1 and sinθ =θ, which may be simplified to: θcosdTF F = . (6)
∑ = 0F , in Y-direction
NFTdTT =++ θθ sinsin)( , θsin)2( dTTF N +=
(7)
∑ = 0F , -in tangential-direction
FPPPT FdFFFF ++=+ θθ cos)(cos .
Which may be simplified to:
FPT FdFF += θcos , (8)
∑ = 0F , in radial-direction αθα sin2sin)2(cos2 NdFFFFF PPCRN +++=+ , (9)
Where:RvmF C
2
=
A kinematic analysis and experimental evaluation of the metal push belt CVT
Volume 39, Number 2, 2013
15
Figure 3: Free body diagram of one segment
2. 4 BELT FRICTION CHARACTERISTICS
The V-belt type CVT utilizes friction to transmit power from the primary pulley to the secondary pulley. The traction curve is the dimensionless relationship between transmitted torque and the slip. The maximum input torque that can be transmitted by the CVT is dependent on the applied clamping force. The belt slip speed and the belt friction coefficient increase when the transmission torque increase. The traction coefficient is therefore chosen to be a dimensionless value [15]. The traction coefficient of primary and secondary side μp , μs are defined as:
pp
pp RF
T2
cos αμ = and
ss
ss RF
T2
cos αμ = , (10)
In which Tp , Ts represent the input and output torque, Rp , Rs represent the primary and secondary running radius of the belt on the pulley, Fp , Fs represent the primary and secondary clamping forces and α is the pulley wedge angle.
The transmission efficiency of the CVT is:
pp
ss
inp
outT T
TPP
ωωη == . (11)
Power loss of the CVT from this equipment is:
60000)(2 sspp
outinploss
TnTnPPP
−=−=
π , (12)
The power loss given by (12) includes slipping losses arising between each contacting component in the CVT, the belt torque loss caused by the resistance to radial resistance and the loss from four bearings supporting the pulley shafts.

Eid Mohamed
Volume 39, Number 2, 2013
16
3. EXPERIMENTAL WORK
3. 1 TEST STAND SETUP
Figure 4 shows the test stand setup for measuring performance of the push belt CVT considered. The experimental work consists of a 18.387 kW (25 Hp), 3000 min-1 induction motor drawing power and driving a CVT belt system of Mitsubishi lancer GLX vehicle gearbox, a separate hydraulic brake that is couple to the output shaft of the CVT. The schematic diagram of the experimental set up with instrumentation details is shown in Figure 5. The motor, hydraulic disc brake, CVT gearbox and hydraulic shift system are hard mounted and aligned on a bedplate. The bedplate is mounted using isolation feet to prevent vibration transmission to the floor. The shafts are connected with both flexible and rigid couplings.
Figure 4: Photograph of the test rig layout
3. 2 HYDRAULIC CIRCUIT AND MEASURING
The measurement methodology used induction (1.103 kW, 1450 min-1) motor drawing power through a electrical source and driving hydraulic pump, the hydraulic shift system characteristics are as follows in table 1. The hydraulic part of the CVT essentially consists of a gear pump directly connected to the driving electrical motor, the Directional Control Valve (DCV), choke valves and a pressure cylinder of the moveable pulley sheaves. The volume between the pump and the chock valves including the secondary pulley cylinder is referred to as the secondary circuit, the volume directly connected to and plus the primary pulley cylinder is the primary circuit. Excessive flow in the secondary circuit bleeds off towards the accessories, whereas the primary circuit can blow off towards the drain. Pressures are defined relative to the atmospheric drain pressure pT. The Directional Control Valve (DCV) directs the pressurized fluid to either primary or secondary pulley as set to position A or B. In neutral position the DCV returns the fluid to the tank. The Choke Valves (CV), the throttle choke valve allows the pressure flow normally in the forward direction, and restricts (choke) the flow in the return direction. It is used here to maintain the pressure level in the pulley after shifting the pressure direction to the other pulley, the connection and operation of hydraulic shift system shows in Fig. 6. As the model will only be used to determine the hydraulic system constraints needed for the feed forward control, the following assumptions have been made:

A kinematic analysis and experimental evaluation of the metal push belt CVT
Volume 39, Number 2, 2013
17
- The compressibility of the oil is neglected - The oil temperature is constant and all leakage flows are negligible.
Figure 5: Test stand layout Figure 6: Schematic diagram of
hydraulic control circuit The clamping forces FP and Fs are realized mainly by the hydraulic cylinders on
the moveable sheaves. Since the cylinders are an integral part of the pulleys, they rotate with an often very high speed, so centrifugal effects have to be taken into account and the pressure in the cylinders will not be homogeneous. Therefore, the clamping forces will also depend on the pulley speeds iPrω and Secω .Furthermore, a prestressed linear elastic spring with stiffness Ks is attached to the moveable secondary sheave. This spring has to guarantee a minimal clamping force when the hydraulic system fails. Together this results in the following relations for the clamping forces:
2** prippPp CAPF ω+= . (13)
Here, Ap is the primary piston area, Cp a centrifugal coefficient and Pp the oil pressure in the primary circuit.
issssS FxKCAPF +Δ++= 2sec** ω . (14)
Likewise, the secondary pulley clamping force Fs consists of a direct pressure term ss AP * and a centrifugal force, with As the secondary piston surface, CS the centrifugal
coefficient and Ps the secondary pressure. Moreover, in Fs there is a contribution of the secondary spring Fspr that has to warrant a minimal clamping force under all circumstances. Fi is the force in the spring if the secondary moveable sheave is at position xΔ = 0. The oil flow from the (DCV) to the primary circuit, by use the law of mass conservation, applied to the primary circuit:
)()(2
** psps
ppfpDCV ppsignpp
xACQ −−
=→ ρ, (15)
where Cf is a constant flow coefficient and ρ is the oil density. The equivalent valve opening area Asp depends on the primary valve stem position xp. The oil flow from the primary circuit to the drain

Eid Mohamed
Volume 39, Number 2, 2013
18
ρ)(2
** pppdfdp
pxACQ =→
, (16)
Apd is the equivalent opening area of the primary valve for the flow from primary circuit to the drain.
Table 1: Hydraulic system characteristics
The oil flow from the (DCV) to the secondary circuit, by use the law of mass conservation, applied to the secondary circuit
)()(2
** spsp
ssfSDCV ppsignpp
xACQ −−
=→ ρ, (17)
Application of the law of mass conservation to the hydraulic circuit yields, the flow rate of oil pump is written as:
dppDCVSDCVpump QQQQ →→→ ++= , (18)
Root mean square is a kind of average of pressure and clamping force signal, for discrete signals, the RMS value is defined as:
2
1))((1 ∑
=
−=N
nxnx
NRMS ,
∑=
=N
nnx
Nx
1)(1 .
(19)
where N is the number of samples taken within the signal and x(n) the time domain signal and x is the mean value of all the amplitudes.
4. RESULTS AND DISCUSSIONS
4. 1 MODELLING RESULTS
The simulations were conducted on MATLAB platform. The model required the input of design or configuration parameters. The characteristics of the metal belt CVT that influence its response to the loading conditions numerous simulations were done for different loading conditions in order to understand the dynamics of CVT under steady-state conditions. The impending motion in the model is such that the belt starts to move downwards in the driver pulley sheave and upwards in the driven pulley sheave. The transmission ratio for the model is defined as the ratio of belt pitch radius on driver pulley to
A kinematic analysis and experimental evaluation of the metal push belt CVT
Volume 39, Number 2, 2013
19
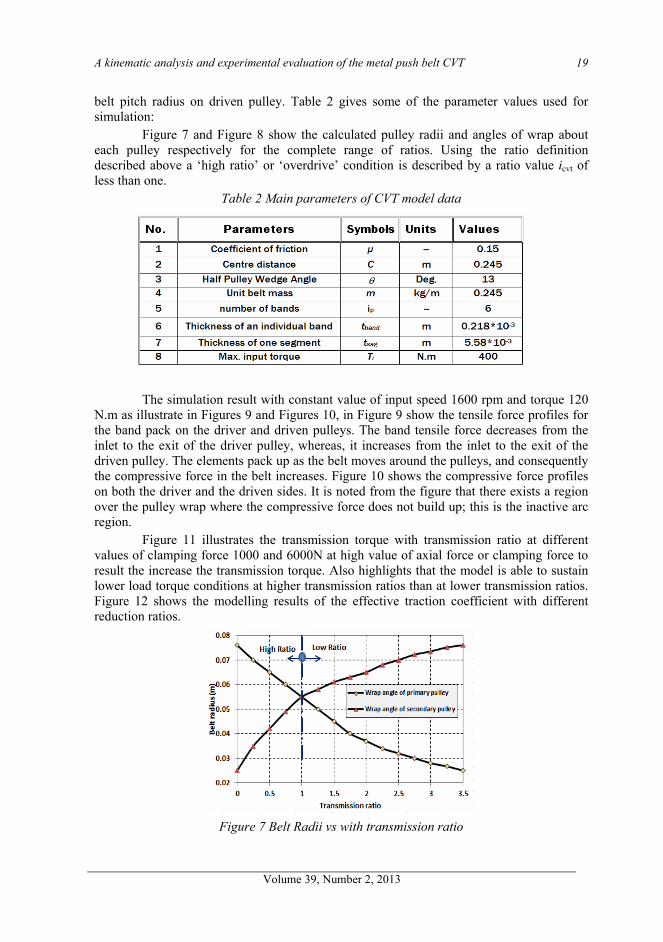
belt pitch radius on driven pulley. Table 2 gives some of the parameter values used for simulation:
Figure 7 and Figure 8 show the calculated pulley radii and angles of wrap about each pulley respectively for the complete range of ratios. Using the ratio definition described above a ‘high ratio’ or ‘overdrive’ condition is described by a ratio value icvt of less than one.
Table 2 Main parameters of CVT model data
The simulation result with constant value of input speed 1600 rpm and torque 120
N.m as illustrate in Figures 9 and Figures 10, in Figure 9 show the tensile force profiles for the band pack on the driver and driven pulleys. The band tensile force decreases from the inlet to the exit of the driver pulley, whereas, it increases from the inlet to the exit of the driven pulley. The elements pack up as the belt moves around the pulleys, and consequently the compressive force in the belt increases. Figure 10 shows the compressive force profiles on both the driver and the driven sides. It is noted from the figure that there exists a region over the pulley wrap where the compressive force does not build up; this is the inactive arc region.
Figure 11 illustrates the transmission torque with transmission ratio at different values of clamping force 1000 and 6000N at high value of axial force or clamping force to result the increase the transmission torque. Also highlights that the model is able to sustain lower load torque conditions at higher transmission ratios than at lower transmission ratios. Figure 12 shows the modelling results of the effective traction coefficient with different reduction ratios.
Figure 7 Belt Radii vs with transmission ratio

Eid Mohamed
Volume 39, Number 2, 2013
20
Figure 8 Variator Wrap Angles vs transmission rati
Figure 9 Band pack tensile force on the driver and driven pulleys
Figure 10 Belt element compressive force on the driver and driven pulleys

A kinematic analysis and experimental evaluation of the metal push belt CVT
Volume 39, Number 2, 2013
21
Figure 11 Transmission torque with transmission ratio vs with transmission ratio
Figure 12 Traction coefficient vs slip ratio at different reduction ratios
4. 2 PRACTICAL RESULTS
This section will present the results obtained from the tests carried on the push belt CVT system in the laboratory. The results will be discussed to determining the performance and response of push belt include different oil pressure and transmission ratio. A National Instruments LabVIEW™ program version 7.1 was used to create the desire software program to perform the tests required. The speed variation can be accomplished by varying the frequency to the motor with a AC inverter unit. The motor shaft speed from 800 rpm to 2400 rpm; and the load variation values by hydraulic brake system from zero to 75 N.m.
Figure 13 and figure 14 show the samples from the translation primary and secondary pressure responses in terms of time-domain, with different input speed 800 and 2400 rpm. Figure 15 and figure 16 show the samples from the translation primary and secondary clamping responses in terms of time-domain. The other results show in the section comparison of result. The maximum oil pressure acting on secondary pulley piston is 48 bars at input speed 800 rpm and decease to 45 bars at increased the input speed to 2400 rpm.

Eid Mohamed
Volume 39, Number 2, 2013
22
Figure 13 Translation primary and secondary pressure responses at Pω =800rpm
Figure 14 Translation primary and secondary pressure
Figure15 The primary and secondary clamping force responses at Pω =800rpm
A kinematic analysis and experimental evaluation of the metal push belt CVT
Volume 39, Number 2, 2013
23
Figure16 The primary and secondary clamping force responses at Pω =2400rpm
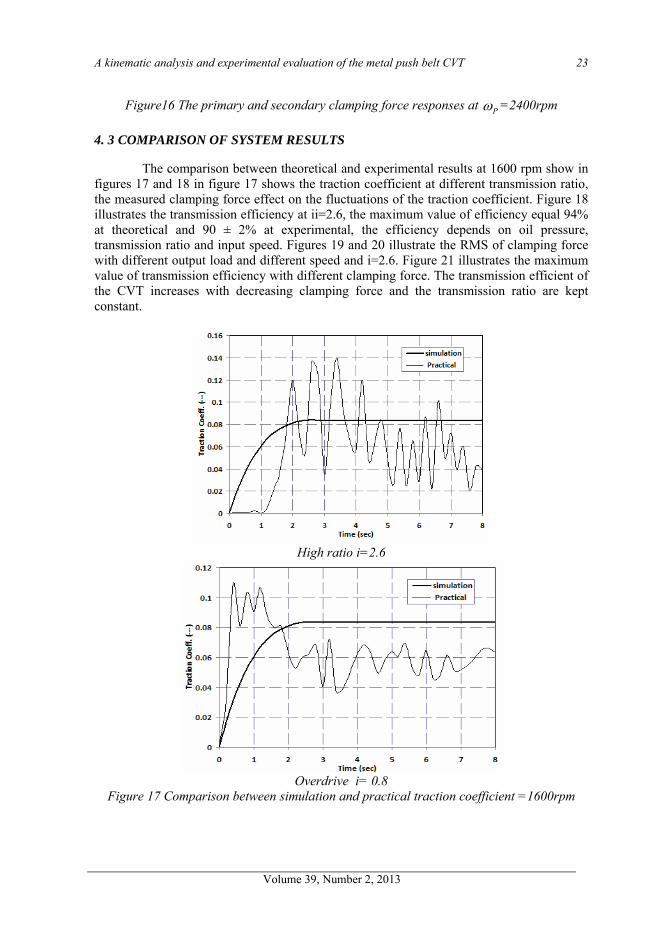
4. 3 COMPARISON OF SYSTEM RESULTS
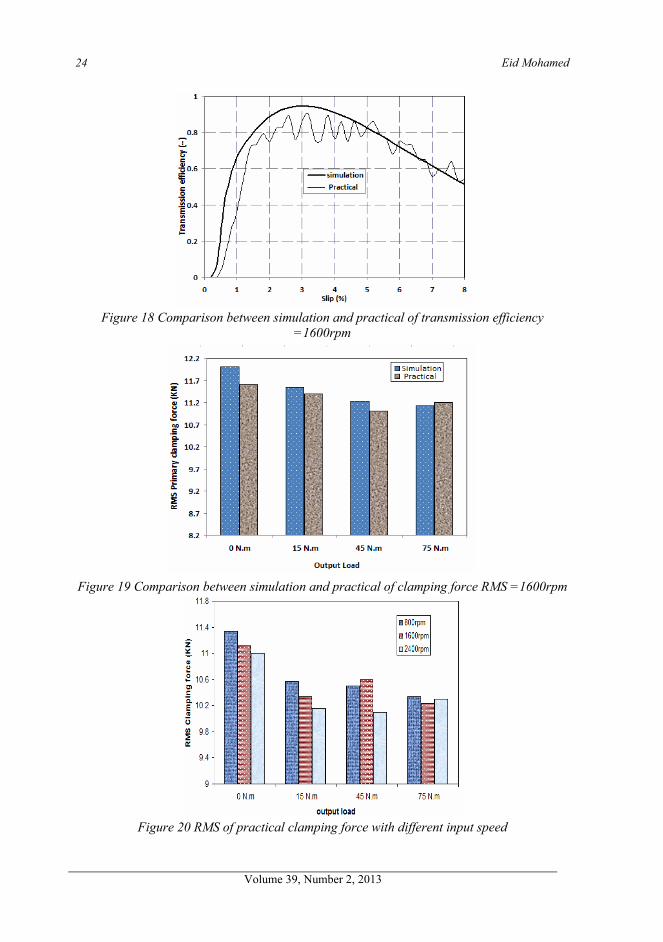
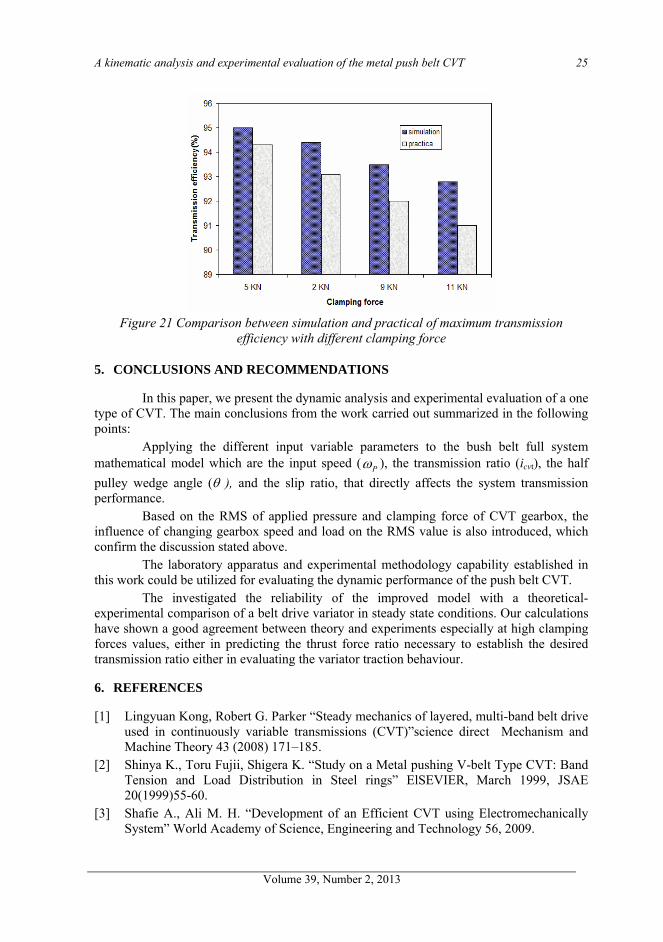
The comparison between theoretical and experimental results at 1600 rpm show in figures 17 and 18 in figure 17 shows the traction coefficient at different transmission ratio, the measured clamping force effect on the fluctuations of the traction coefficient. Figure 18 illustrates the transmission efficiency at ii=2.6, the maximum value of efficiency equal 94% at theoretical and 90 ± 2% at experimental, the efficiency depends on oil pressure, transmission ratio and input speed. Figures 19 and 20 illustrate the RMS of clamping force with different output load and different speed and i=2.6. Figure 21 illustrates the maximum value of transmission efficiency with different clamping force. The transmission efficient of the CVT increases with decreasing clamping force and the transmission ratio are kept constant.
High ratio i=2.6
Overdrive i= 0.8
Figure 17 Comparison between simulation and practical traction coefficient =1600rpm
Eid Mohamed
Volume 39, Number 2, 2013
24
Figure 18 Comparison between simulation and practical of transmission efficiency
=1600rpm
Figure 19 Comparison between simulation and practical of clamping force RMS =1600rpm
Figure 20 RMS of practical clamping force with different input speed
A kinematic analysis and experimental evaluation of the metal push belt CVT
Volume 39, Number 2, 2013
25
Figure 21 Comparison between simulation and practical of maximum transmission
efficiency with different clamping force
5. CONCLUSIONS AND RECOMMENDATIONS
In this paper, we present the dynamic analysis and experimental evaluation of a one type of CVT. The main conclusions from the work carried out summarized in the following points:
Applying the different input variable parameters to the bush belt full system mathematical model which are the input speed ( Pω ), the transmission ratio (icvt), the half pulley wedge angle (θ ), and the slip ratio, that directly affects the system transmission performance.
Based on the RMS of applied pressure and clamping force of CVT gearbox, the influence of changing gearbox speed and load on the RMS value is also introduced, which confirm the discussion stated above.
The laboratory apparatus and experimental methodology capability established in this work could be utilized for evaluating the dynamic performance of the push belt CVT.
The investigated the reliability of the improved model with a theoretical-experimental comparison of a belt drive variator in steady state conditions. Our calculations have shown a good agreement between theory and experiments especially at high clamping forces values, either in predicting the thrust force ratio necessary to establish the desired transmission ratio either in evaluating the variator traction behaviour.
6. REFERENCES
[1] Lingyuan Kong, Robert G. Parker “Steady mechanics of layered, multi-band belt drive used in continuously variable transmissions (CVT)”science direct Mechanism and Machine Theory 43 (2008) 171–185.
[2] Shinya K., Toru Fujii, Shigera K. “Study on a Metal pushing V-belt Type CVT: Band Tension and Load Distribution in Steel rings” ElSEVIER, March 1999, JSAE 20(1999)55-60.
[3] Shafie A., Ali M. H. “Development of an Efficient CVT using Electromechanically System” World Academy of Science, Engineering and Technology 56, 2009.
Eid Mohamed
Volume 39, Number 2, 2013
26
[4] Mohan Gangadurl, Harikrishnan B., Sreekumar H. ” Development of an Analytical Design Concept of Mechanical Controlled continuously Variable Transmission” SAE, 2005-26-069.
[5] Bonsen B., Klaassen T.W.G.L., K.G.O. van de Meerakker” Modeling Slip- and Creep-mode Shift Speed Characteristics of a Push-belt Type Continuously Variable Transmission” 04CVT-3
[6] Allen, Mark and LeMaster, Robert. “A Hybrid Transmission for SAE Mini Baja Vehicles”. SAE Publication 2003-32-0045.
[7] Micklem J. D., Longmore D. K., Burrows C. R., “Modeling of the Steel Pushing V-belt Continuously Variable Transmission”, Proceedings Inst. Mech. Engineers Vol. 208 Part C: pp. 13-27.
[8] Shimizu H., Kobayashi D., Kawashima J., Kato Y., “Development of 3-D Simulation for Analyzing the Dynamic Behavior of a Metal Pushing V-Belt for CVTs”, SAE Paper, 2000-01-0828, SAE special publication (SP-1522), transmission and driveline synposium 2000, pp. 31-36.
[9] Kurosawa M., Kobayashi M. and Tominaga M. “Development of a High Torque Capacity Belt Derive CVT with a Torque Converter” ElSEVIER, July 1998, JSAE 20(1999)281-287.
[10] Pennings B., Mark van D., Arjen B., Erik van G. and Marlène L. “Van Doorne CVT Fluid Test: A Test Method on Belt-Pulley Level to Select Fluids for Push Belt CVT. Applications” 2003 SAE International P.N 2003-01-3253.
[11] Christopher R. W. “A Kinematic Analysis and Design of a Continuously Variable Transmission” Master of Science in Mechanical Engineering, 19 January 2006.
[12] Zhijian Lu “Acceleration Simulation of a Vehicle with a Continuously Variable Power Split Transmission” Master of Science in Mechanical Engineering, July 29, 1998