Embed Size (px)
Citation preview

Louisiana State UniversityLSU Digital Commons
LSU Historical Dissertations and Theses Graduate School
1998
A Knowledge-Based System for Reliability-Centered Maintenance in the Chemical Industry.Daniel Jesus FonsecaLouisiana State University and Agricultural & Mechanical College
Follow this and additional works at: https://digitalcommons.lsu.edu/gradschool_disstheses
This Dissertation is brought to you for free and open access by the Graduate School at LSU Digital Commons. It has been accepted for inclusion inLSU Historical Dissertations and Theses by an authorized administrator of LSU Digital Commons. For more information, please [email protected].
Recommended CitationFonseca, Daniel Jesus, "A Knowledge-Based System for Reliability-Centered Maintenance in the Chemical Industry." (1998). LSUHistorical Dissertations and Theses. 6671.https://digitalcommons.lsu.edu/gradschool_disstheses/6671

INFORMATION TO USERS
This manuscript has been reproduced from the microfilm master. UMI
films the text directly from the original or copy submitted. Thus, some
thesis and dissertation copies are in typewriter face, while others may be
from any type of computer printer.
The quality of this reproduction is dependent upon the quality of the
copy submitted. Broken or indistinct print, colored or poor quality
illustrations and photographs, print bleedthrough, substandard margins,
and improper alignment can adversely afreet reproduction.
In the unlikely event that the author did not send UMI a complete
manuscript and there are missing pages, these will be noted. Also, if
unauthorized copyright material had to be removed, a note will indicate
the deletion.
Oversize materials (e.g., maps, drawings, charts) are reproduced by
sectioning the original, beginning at the upper left-hand comer and
continuing from left to right in equal sections with small overlaps. Each
original is also photographed in one exposure and is included in reduced
form at the back o f the book.
Photographs included in the original manuscript have been reproduced
xerographically in this copy. Higher quality 6” x 9” black and white
photographic prints are available for any photographs or illustrations
appearing in this copy for an additional charge. Contact UMI directly to
order.
UMIA Bell & Howell Information Company
300 North Zeeb Road, Ann Arbor MI 48106-1346 USA 313/761-4700 800/521-0600
Reproduced with permission of the copyright owner. Further reproduction prohibited without permission.

Reproduced with permission of the copyright owner. Further reproduction prohibited without permission.

A KNOWLEDGE BASED SYSTEM FOR RELIABILITY CENTERED MAINTENANCE IN THE CHEMICAL INDUSTRY
A Dissertation
Submitted to the Graduate Faculty of the Louisiana State University and
Agricultural and Mechanical College in partial fulfillment of the
requirements for the degree of Doctor of Philosophy
in
The Interdepartmental Program in Engineering Science
byDaniel J. Fonseca
B.S., The University of Alabama, Tuscaloosa, Al., 1992 M.S., The University of Alabama, Tuscaloosa, AL, 1994
M.S., Louisiana State University, Baton Rouge, La., 1997May 1998
Reproduced with permission of the copyright owner. Further reproduction prohibited without permission.

UMI Number: 9836871
UMI Microform 9836871 Copyright 1998, by UMI Company. All rights reserved.
This microform edition is protected against unauthorized copying under Title 17, United States Code.
UMI300 North Zeeb Road Ann Arbor, MI 48103
Reproduced with permission of the copyright owner. Further reproduction prohibited without permission.

To Jose and Lilia, my parents, for teaching me always to strive for the best;
to Jesus, my Lord, for leading me to the best;
and to Lucy and David, my wife and son, for being the best...
ii
Reproduced with permission of the copyright owner. Further reproduction prohibited without permission.

ACKNOWLEDGMENTS
I would like to express my most sincere gratitude to my chairman, Dr. Gerald M. Knapp
for his constant guidance and help throughout my program of study. His invaluable
assistance was deeply appreciated. I also thank Dr. Ye-Sho Chen, Dr. Lawrence Mann,
Jr., Dr. Aiichiro Nakano, Dr. Ralph Pike, Jr., and Dr. Dennis Webster for their time and
efforts while serving as committee members.
My special thanks to Dr. Dennis B. Webster for inviting me to be a part of the
student body of the Department of Industrial and Manufacturing System Engineering, and
providing me with the financial support needed for my academic aspirations here at
Louisiana State University and at the University of Alabama.
I also want to express my gratitude to Mr. Marco Araya for his extensive
contribution to the knowledge acquisition and validation phases of this project.
Finally, without the multiple sacrifices made by my wife, Lucia, this work would
have been impossible. She has been the driving force of my life, and her love has
provided me with the most precious gift of all, my son David.
iii
Reproduced with permission of the copyright owner. Further reproduction prohibited without permission.
TABLE OF CONTENTS
ACKNOWLEDGMENTS....................................................................................................iii
LIST OF TABLES...............................................................................................................vii
LIST OF FIGURES............................................................................................................viii
ABSTRACT...........................................................................................................................x
CHAPTER1. INTRODUCTION.......................................................................................................... 1
1.1 Background.................................................................................................................11.2 Problem Statement.....................................................................................................61.3 Objective of the Research........................................................................................ 10
2. LITERATURE REVIEW.............................................................................................112.1 The Need for Integrated Management to Improve Maintenance Tasks.................112.2 The RCM Methodology........................................................................................... 12
2.2.1 System Analysis..............................................................................................122.2.2 Failure Mode and Effect Analysis (FMEA)...................................................182.2.3 Prioritization of Failure Modes......................................................................202.2.4 Selection of Maintenance Strategies for Individual Com ponents...............20
2.3 The Quantitative Approach to Reliability Management........................................ 212.3.1 The Notion of Reliability............................................................................... 222.3.2 Replacement and Overhaul/Repair Decisions Modeling.............................. 242.3.3 Inspection Decisions in Reliability Management..........................................25
2.4 Approximate Reasoning in Reliability Management............................................. 262.4.1 Fuzzy Set Theory............................................................................................272.4.2 Fuzzy Expert Systems.................................................................................... 282.4.3 The Fuzzy Approach to Equipment Reliability and Maintainability . . . . 30
2.5 Intelligent Computer Systems and RCM................................................................322.6 Expert Systems Applications in Reliability Management......................................33
2.6.1 Automated Cable Expertise (ACE)................................................................362.6.2 The SRI Program............................................................................................362.6.3 An Expert System for FMECA......................................................................382.6.4 IMOS...............................................................................................................39
2.7 Literature Search Summary.....................................................................................40
3. METHODOLOGY AND SCOPE................................................................................423.1 Overview...................................................................................................................423.2 Scope of the Research..............................................................................................42
3.2.1 The Chemical Process Industry..................................................................... 433.2.2 The New RCM Framework............................................................................45
iv
Reproduced with permission of the copyright owner. Further reproduction prohibited without permission.

3.3 Knowledge Engineering Phase............................................................................... 483.3.1 Process Selection............................................................................................48
3.3.1.1 Sulfuric Acid; H2S04....................................................................... 483.3.1.2 Nitrogen and Oxygen; N2, 0 2...........................................................503.3.1.3 Ethylene and Propylene.................................................................. 503.3.1.4 Calcium Oxide or Lime; CaO......................................................... 513.3.1.5 Ammonia; NH3................................................................................513.3.1.6 Phosphoric Acid; H3P04 ................................................................. 523.3.1.7 Caustic Soda and Clorine; NaOH, CL2...........................................523.3.1.8 Sodium Carbonate or Soda Ash; Na2C 03 .......................................523.3.1.9 Nitric Acid; HN03.......................................................................... 533.3.1.10 Ammonium Nitrate; NH4N03.......................................................... 53
3.3.2 The Pieces of Equipment Considered in this Study...................................... 543.3.2.1 Burner..............................................................................................553.3.2.2 Centrifugal Blower..........................................................................553.3.2.3 Centrifugal Pump............................................................................553.3.2.4 Compressor..................................................................................... 563.3.2.5 Converter.........................................................................................563.3.2.6 Distillation Tower........................................................................... 593.3.2.7 Evaporator.......................................................................................593.3.2.8 Heat Exchanger...............................................................................623.3.2.9 Pipeline............................................................................................623.3.2.10 Reactor............................................................................................ 643.3.2.11 Waste Heat Boiler...........................................................................64
3.3.3 Data Recollection on Failure Modes............................................................ 673.3.3.1 Failure Modes Effects and Controls............................................... 673.3.3.2 Factors Responsible for Failure Modes Precipitation..................68
3.4 The Mathematical Formulation of the System........................................................693.4.1 Failure Mode Screening................................................................................. 693.4.2 Prioritization of Failure Modes...................................................................... 77
3.4.2.1 The Likelihood Index..................................................................... 793.4.2.2 The Local and Product Effects Indices............................................793.4.2.3 The Secondary Failure Index......................................................... 80
4. DESIGN AND DEVELOPMENT OF THE EXPERT SYSTEM............................... 834.1 Knowledge Representation Paradigm..................................................................... 834.2 Software and Hardware Platform............................................................................844.3 System Architecture.................................................................................................874.4 Expert Analysis Procedure...................................................................................... 89
4.4.1 ASPEN Plus Interface.................................................................................... 894.4.2 System Processing..........................................................................................904.4.3 System Output................................................................................................ 95
4.5 Validation of the System........................................................................................1004.5.1 Face Validation............................................................................................ 101
v
Reproduced with permission of the copyright owner. Further reproduction prohibited without permission.

5. CONCLUSIONS AND FUTURE RESEARCH......................................................... 1045.1 Comments on this Research....................................................................................1045.2 Key Contributions................................................................................................... 1055.3 Recommendations for Future Research................................................................. 106
REFERENCES....................................................................................................................109
APPENDIXESA. IDENTIFIED PROCESS EQUIPMENT AND THEIR FAILURE MODES . . . . 118
B. FAILURE MODES EFFECTS AND SUGGESTED CONTROLS...........................128
C. PRECIPITATING FACTORS....................................................................................... 157
D. FAILURE MODES LOCAL AND PRODUCT EFFECTS........................................ 178
E. FAILURE MODES NMS, DMS. NES, AND DES VALUES.................................... 187
F. SYSTEM OUTPUT SAMPLE REPORT..................................................................... 209
G. VALIDATION RESULTS............................................................................................ 214
VITA....................................................................................................................................216
vi
Reproduced with permission of the copyright owner. Further reproduction prohibited without permission.

LIST OF TABLES
2.1 Computer Software Applications to Maintenance...................................................... 13
4.1 System Nomenclature.................................................................................................. 92
vii
Reproduced with permission of the copyright owner. Further reproduction prohibited without permission.

LIST OF FIGURES
1.1 The Bathtub Curve........................................................................................................ 3
1.2 Expert System Components..........................................................................................5
1.3 RCM Cost/Benefit per Major Power Plant................................................................... 8
2.1 A Typical Functional Block Diagram........................................................................ 17
2.2 A Simple FMEA..........................................................................................................19
2.3 Failure Mode Occurrence Ranked As Low ..............................................................34
2.4 Severity of Failure Ranked As High........................................................................... 34
2.5 Failure Detectability Ranked Somewhat Moderate and Somewhat L ow ..................35
2.6 Model Selection Rulebase for Prototype IMOS.........................................................41
3.1 A Proposed Industrial Equipment Reliability Management Environment............... 47
3.2 A Simple Availability Structure Model......................................................................49
3.3 Burner...........................................................................................................................57
3.4 Centrifugal Blower.......................................................................................................57
3.5 Centrifugal Pump......................................................................................................... 58
3.6 Multistage Compressor................................................................................................58
3.7 Converter......................................................................................................................60
3.8 Distillation Tower........................................................................................................ 61
3.9 Forced Circulation Evaporator.................................................................................... 63
3 .10 Tubular Heat Exchanger.............................................................................................. 63
3.11 Fluid and Gas Pipeline.................................................................................................65
3.12 Closed Vat Reactor...................................................................................................... 65
3.13 Waste Heat Boiler........................................................................................................ 66
viii
Reproduced with permission of the copyright owner. Further reproduction prohibited without permission.

3.14 Fuzzification of Factor “a” ...........................................................................................73
3.15 Fuzzification of Factor “b” .......................................................................................... 73
3.16 Fuzzification of Factor “c?’ ...........................................................................................74
4.1 System Architecture..................................................................................................... 88
4.2 ASPEN Plus Sample Report........................................................................................91
4.3 Equipment Identification Screen................................................................................. 93
4.4 Help Screen...................................................................................................................94
4.5 Open File Window....................................................................................................... 96
4.6 Query Screen................................................................................................................ 97
4.7 Equipment Characteristics Information Screen...........................................................98
4.8 Conclusion Screen........................................................................................................99
ix
Reproduced with permission of the copyright owner. Further reproduction prohibited without permission.

ABSTRACT
An innovative new framework for the implementation of reliability centered maintenance
(RCM) in industrial settings was developed and implemented during this study. Fuzzy
reasoning algorithms were designed to evaluate and assess the likelihood of equipment
failure mode precipitation and aggravation. Furthermore, an alternative to the traditional
RCM decision tree for prioritizing equipment failure modes was defined through the
development of an approximate reasoning scheme. This priority scheme not only takes
into account the relevancy of failure modes on local and product effects, but also their
possibility of occurrence, as well as associated negative consequences on adjacent
machinery.
The new RCM approach was implemented through an objected-oriented expert
system built to perform reliability centered maintenance analysis on industrial chemical
processes. The developed expert system reads the process flowsheet generated by
ASPEN Plus, a chemical process simulation package, and, based on relevant machine
operating data, it provides the user with the final process RCM availability structure
diagram. This availability diagram consists of a listing of all critical machine failure
modes likely to occur, prioritized according to their overall negative impact on the
process, as well as important information on their corresponding local and system effects,
and suggested controls for their detection.
Although the chemical process industry was selected as the application domain
for this research, the developed RCM framework was designed to be extensible across the
entire maintenance activity spectrum, regardless of the type of industry associated.
x
Reproduced with permission of the copyright owner. Further reproduction prohibited without permission.

The prototype knowledge based system was constructed and delivered on an IBM
compatible Personal Computer through an object oriented computer shell, LEVEL 5
Object.
xi
Reproduced with permission of the copyright owner. Further reproduction prohibited without permission.

CHAPTER 1
INTRODUCTION
1.1 Background
During the last decades, the need for identifying cost-effective maintenance programs for
production plants and manufacturing facilities has generated a proliferation of global
analysis methodologies oriented to the development of competent reliability management
policies. Among these analytical methods, Reliability Centered Maintenance (RCM),
which was first introduced by the civil aviation industry in the 1960’s, is not only the
most frequently used but also the technique that has proven to be the most effective
worldwide.
The RCM methodology provides a practical and structured approach for arriving
at a satisfactory maintenance strategy for each component of a given system. In choosing
a strategy, the methodology takes into account safety requirements, maintenance costs,
and costs of lost production (107). In essence, RCM can be defined as a technique for
organizing maintenance activities to be cost-effective. Its central objective is to
determine the actions required to ensure that all physical assets continue to fulfill their
intended functions in their current operating environments.
RCM carries out its analysis by asking the following three questions:
1. What is the item’s function?
2. How can these functions fail?
3. What are the consequences of its failure?
1
Reproduced with permission of the copyright owner. Further reproduction prohibited without permission.

The maintenance program for each individual item is then developed based on the facts
obtained from this query process. Usually, these programs cover three levels of
maintenance actions. The first level has to do with leaving the item in service until it
fails; at that moment, the item is either repaired or replaced. For the second type of
maintenance, a schedule depicting the times at which each item has to be replaced or
overhauled is developed to ensure that components will not enter the wear-out phase due
to old age (see Figure 1.1). The last level of maintenance involves a periodic or
continuous check of items to detect specific symptoms that a failure is upcoming (94,
100).
During the last years, several different frameworks have been adopted by
industrial practitioners in order to accommodate the RCM’s principles to their increasing
equipment maintenance demands. As will be discussed in Chapter 2, the development of
computer software packages which embed either mathematical optimizing algorithms or
managerial rules of thumb or heuristics represent the most recent efforts in the area of
reliability management modeling. However, most of these computer programs fail in
providing a comprehensive tool for fully taking advantage of the benefits resulting from
an effective RCM plan. From the available published literature, it is clear that the major
shortcoming of newly developed maintenance software is its inability of conciliating the
traditional RCM methodology with other heuristic approaches. That is, no one of the
reported reliability management packages properly combines the use o f optimizing
algorithms such as linear and nonlinear models with non-optimizing techniques such as
fuzzy or approximate reasoning methodologies and qualitative rules of thumb. Thus, the
enormous economical and technical benefits of implementing such an integrating RCM
2
Reproduced with permission of the copyright owner. Further reproduction prohibited without permission.

CONDITIONALFAILUREPROBABILITYIrifantMdrtdltty-
(wear-in) v
TIME
Figure 1.1 The Bathtub Curve
3
Reproduced with permission of the copyright owner. Further reproduction prohibited without permission.

approach remains unknown to industrial entrepreneurs. The design of a computer
program that can accomplish this objective would involve the creation of a intelligent
system or expert system.
Expert systems have been defined as consulting systems that simulate the
problem-solving ability of human experts through the use of expertise drawn from an
information base and specific rules employed to interpret such knowledge (38).
There are several paradigms used to represent knowledge in an expert system.
Knowledge can be expressed in rules, frames, networks, and logical predicates. Rules
represent the most popular of all representation schemes. They are If-Then statements
which generate conclusions once the validity of specific facts (premises) has been
verified (6). A frame consists of a set o f slots that contains a group of specifications
describing an object, action, or event (38). Semantic networks represent a group of nodes
linked to form object relationships. Predicate logic is a kind of formal logic which is
used to make generalizations about propositions based on specific relationships (6).
Expert systems are structured in three distinct components (Figure 1.2). The
knowledge base is a set of rules about the problem domain, supplied by the expert or
obtained through in-depth research. The working memory carries out the tracking of
what has been concluded or learned at any stage of a particular consultation. The
inference engine evaluates what is true at any given time in the working memory and the
knowledge base, resolving conflicts when necessary (38).
A computerized system can substantially improve the information handling
methods of the RCM methodology by integrating the subsystems in charge of (a)
4
Reproduced with permission of the copyright owner. Further reproduction prohibited without permission.

KNOWLEDGEBASE
INFERENCEENGINE
WORKINGMEMORY
Figure 1.2 Expert System Components
5
Reproduced with permission of the copyright owner. Further reproduction prohibited without permission.

managing the statistical parameters required for analyzing the characteristics of the
different component failure modes, (b) estimating the system/component failure modes
through the assessment of the failure mode effects (FME) and criticality analysis (CA),
and (c) determining the priority of preventive maintenance (PM) improvement plans (88).
In addition to this, the unification of Artificial Intelligence (Al) techniques with
conventional probabilistic methods and fuzzy measure approaches can incorporate
understanding of the fundamental dynamics among system components so that the RCM
analysis can provide appropriate and conclusive maintenance policies (105).
Expert systems have received the most attention of all Al techniques. They
emphasize the mathematical and statistical capabilities of the computer by using dialogue
and logic to determine viable courses of action or outcomes (110). Thus, it is possible to
enhance and improve the process of selecting and recommending reliability management
procedures by encapsulating the knowledge of human experts and proven mathematical
models with a versatile knowledge based system.
1.2 Problem Statement
A crucial element in successful operations is an effective plant maintenance function. In
a competitive world, the only means for companies to survive is through minimization of
their production costs without sacrificing the quality of their goods or services. For
example, it has been estimated that manufacturing companies in industrialized countries
such as the United Kingdom can save between 8% and 30% in operating costs through
improvement in maintenance policies (36). In the United States, the introduction of RCM
methodologies has proven very beneficial. For instance, the application of the RCM
approach to the nuclear power industry since the mid 80’s has generated long-term
6
Reproduced with permission of the copyright owner. Further reproduction prohibited without permission.

benefits in reliability and safety improvements. Although the RCM benefits can not be
immediately appreciated, Figure 1.3 shows how, the nuclear power industry has
experienced annual maintenance man-hour and administrative savings of $108,000 per
plant, and an average reduction of 24% in the number of corrective maintenance actions
(26, 113).
Nevertheless, most of the reliability management programs followed by industries
across the nation still present considerable deficiencies which undermine their potential
benefits. For instance, nuclear plants in the U.S. spend about $2 billion per year on
reliability management programs. Among these programs, only a small fraction are
based on a clear understanding of the relative importance of different reliability
management tasks and component failure modes (113). The need for an improved RCM
approach originates from the fact that the conventional failure mode effects and criticality
analysis (FMECA) method concentrates its effort only on the evaluation of the relevance
of the failure effects, without giving any importance to the analysis of the failure
environment (failure characteristics and detectability) whose control and study results are
critical in generating assertive corrective and preventive maintenance policies. (88).
Traditional RCM analysis first encompasses the identification of critical
components from a risk and economics perspective. Usually, a probabilistic safety
assessment is carried out to establish the relative importance of the system’s components
from a risk perspective. Moreover, appropriate risk measures are devised and used to
effectively rank the different element failure modes which allow the determination of the
individual component criticality. Once the selection of component criticality is
7
Reproduced with permission of the copyright owner. Further reproduction prohibited without permission.

One-time costs for RCM Cumulative maintenanceman-hour savings
After 4 years
After 3 years
After 2 years
After 1 years
Cost Cost Trend in in
1988 1991
$ISO,0004---- 4 yeans p tqp *qff
$100,000
$50,000
Figure 1.3 RCM Cost/Benefit per Major Power Plant (113)
8
Reproduced with permission of the copyright owner. Further reproduction prohibited without permission.

completed, applicable and efficient tasks are identified to prevent each component from
developing its dominant failure causes (62). This identification of the optimal set of tasks
required to cope with all of the dominant failure causes represents the major endeavor not
yet adequately addressed by traditional RCM frameworks.
Computer-based decision support systems for Reliability Centered Maintenance
can be thought as the most assertive way to deal with such an issue. According to
Kobbacy (1992), the introduction o f intelligent decision support systems (IDSS) can
greatly benefit the problem of maintenance optimization if such systems are designed to
accomplish the following main functional features (49):
1. access the history data from a company’s maintenance database;
2. check the quality of data;
3. recognize data patterns;
4. query the user for additional information, judgment, criterion, etc.;
5. select the most suitable model for the analysis of the data;
6. estimate model parameters;
7. select and optimize the model to provide an evaluation o f the current and
proposed optimal maintenance policy;
8. present the results in a flexible format, including a recommendation for the
future maintenance policy and a comparison with current practice;
9. respond to user inquiries, perform ‘what if?’ modeling and provide
explanations of decisions; and,
10. self-leam and enhance the knowledge base.
9
Reproduced with permission of the copyright owner. Further reproduction prohibited without permission.

1.3 Objectives of the Research
The main purpose of this research was the development of a knowledge based system
which could provide a new, more efficient RCM framework. The developed system was
intended to be intelligent in the sense that it fulfilled some of the main functional features
described in Section 1.2. Therefore, the specific objectives of the current research can be
summarized as follows:
1. Identify the most commonly used equipment items within a specific
process industry, and catalog their functions and significant failure modes.
2. Identify and catalog most common human failure modes.
3. Develop a rulebase for automating the conversion of system schematics (in
a CAD-type software) to a functional system specification.
4. Develop a rulebase for identifying individual failure modes and system
failure modes relevant to the functional system specification.
10
Reproduced with permission of the copyright owner. Further reproduction prohibited without permission.

CHAPTER 2
LITERATURE REVIEW
Computer and manual search of the literature revealed the existence of dozens of journal
articles related to computer systems for maintenance applications. However, the
literature referring to the use of expert systems for assisting reliability management
functions is very limited. The literature on the development of supporting maintenance
software such as knowledge-based systems for RCM and other PM functions is reviewed
here to illustrate the nature of the progress made in this field during the last decades.
Literature on the techniques and methodologies to be employed in the development of the
proposed system is discussed in Chapter 3.
2.1 The Need for Integrated Management to Improve Maintenance Tasks
Most of the software recently developed to support maintenance operations have come as
a response to the increasing urge that industrial managers have for integrating equipment
reliability and process safety management programs with preventive maintenance and
probabilistic risk analysis methods to minimize the occurrence of unscheduled
shutdowns. According to Ian S. Sutton (1995) from Fluor Daniel Inc.. through the
integration of preventive/reliability maintenance methodologies, such as RCM. and
process safety management programs with probabilistic risk assessment, managers can
improve their facilities’ uptime. This integrated model provides a means for eliminating
duplicated systems, coordinating reliability revisions, and ranking projects according to
risk reduction criteria, which leads to reliability/safety programs that cost-effectively
meet the organization’s safety, environmental and operability goals (100).
11
Reproduced with permission of the copyright owner. Further reproduction prohibited without permission.

The development of such integrated programs in large industrial organizations
implies inherent difficulties in the execution of individual PM functions or subsystems
that must handle massive amounts of history data and computations, and whose results
must be evaluated, grouped and reconciled to produce an integrated effort. As a response
to this difficulty, several distinct conventional computer software packages have been
recently developed to facilitate the maintenance management processes. Table 2.1
depicts a summary of commonly used computer maintenance packages, presented at the
1993 Maintenance Information Systems Survey.
2.2 The RCM Methodology
RCM has been in practice for almost four decades; however, the available literature on
RCM applications and breakthroughs show that its basic framework and implementation
methodology has remained unchanged through the years, focusing most of the new
developments on the design of computer software that can facilitate its introduction to
distinct operational settings (26, 35, 57, 93, 95, 112).
According to the literature, the RCM approach can be considered as a process
consisting of four major steps: (a) analysis and definition of the system’s functions and
particularities, (b) failure mode and effects analysis (FMEA), (c) prioritization of failure
modes, and (d) selection of suitable maintenance strategies for individual failure modes.
2.2.1 Systems Analysis
The main difference between RCM and other reliability management techniques is the
fact that RCM recognizes that the most important aspect of the maintenance effort is the
preservation of a system’s function, not the condition of the equipment (95). Therefore,
12
Reproduced with permission of the copyright owner. Further reproduction prohibited without permission.

Table 2.1
Computer Software Applications to Maintenance
Software Name Developer Functionality
MANTRA BMS Technology A package for handling plannedand unplanned work such as safety checks, quality routines, periodic maintenance, and equipment calibration. Moreover, it calculates breakdown and records history.
COMPASS Bonner & Moore Real-time system which integratesmaterial inventory control, maintenance planning and scheduling, equipment record history, preventive maintenance, purchasing, and manpower accounting.
PEMICS CGRAM Software An integrated system which catersfor a company’s buildings, plant and equipment maintenance. Among others, it includes: breakdown and corrective maintenance, capacity planning and scheduling, planned preventive maintenance and condition monitoring.
EASE COMAC Systems A package designed to maximizeequipment reliability and to minimize maintenance. It features plant availability statistics, on-line downtime monitoring, systems integration, fault analysis with full RCM functionality, real-time condition monitoring, statistical process control, and maintenance management.
(table con’d.)
13
Reproduced with permission of the copyright owner. Further reproduction prohibited without permission.

Software Name Developer Functionality
MAIN/TRACKER
RCM Analyst
MAIMMAN
MLS
ELfCE Corporation A fully integrated maintenance management, cost tracking, parts inventory and purchasing system which provides management control for equipment and facilities environments.
GasTops Ltd. A software tool for RCM analysisand data management. It handles a wide variety of problems from the failure modes, effects, and criticality analysis of a particular machine system to the redesign of maintenance programs for an entire plant. The program uses a standard RCM logic tree to categorized failure effects, and select appropriate maintenance tasks.
Hatton Parkinson Sys. A computerized maintenance management system which includes scheduling of inspections at irregular intervals, a warning where scheduled maintenance is planned on items which have recently been repaired, and identification of items that are incurring the most maintenance cost.
Largotim Business Solutions An integral environment formaintenance planning, job control, stores management, asset history and cost analysis.
(table con’d.)
14
Reproduced with permission of the copyright owner. Further reproduction prohibited without permission.

Software Name Developer Functionality
IMPACT Matrix Resource Ltd. A software package which handles a wide variety of planned and unplanned maintenance work. It produces a complete plant history through reports and graphs on activities, cost and performance fault analysis.
MAP OSPREY Computer Services A system designed to assist in planning and scheduling regular and repetitive maintenance along with breakdowns. The system provides statistics on performance, failures, reliability for analysis.
MAXIMO PSDI Ltd. A maintenance support package that includes asset register, condition monitoring, failure analysis, inventory control, labor resource, and calendars.
15
Reproduced with permission of the copyright owner. Further reproduction prohibited without permission.

the first task in implementing an efficient RCM program is the systematically
examination of the system’s components to fully understand their individual and
combined functions and functional failures. According to Anthony Smith [1993], such an
systematic analysis involves five essential items of information:
1. System description
2. Functional block diagram
3. IN/OUT interfaces
4. System work breakdown structure
5. Equipment history
A well-documented system description is needed to record an accurate baseline of
the initial condition of the system’s components in order to identify system modifications
or upgrades which may require PM revisions, as well as critical design and operational
factors that might influence the degradation or loss of the system’s functions. The
functional block diagram (see Figure 2.1), which is an illustration of the major operations
that the system performs, represents a valuable tool for assisting the analyst in visualizing
the system functional structure. The addition of all IN/OUT interfaces to the functional
block diagram helps in observing and documenting the various elements that cross the
system boundaries, which may ultimately become a part of the functions that must be
preserved. The system work breakdown structure (SWBS) is a compilation of the
components involved in each one of the functional subsystems shown on the functional
block diagram; the SWBS, along with the equipment history (a written recollection of all
component failures experienced over the past 2 or 3 years which require corrective
16
Reproduced with permission of the copyright owner. Further reproduction prohibited without permission.

AC power Natural gasAC Cl, bleed C l, tabs
Poolwater Pool
Timedflow
Timedflowstatus
Pressure to pool sweep
Fuelgas
Temp.status
Overflow Pressure Backflush drain status
H eatingPum ping
W atercondition ing
Figure 2.1 A Typical Functional Block Diagram (93)
17
Reproduced with permission of the copyright owner. Further reproduction prohibited without permission.

maintenance) represent the primary source of information for identifying the failure
modes and failure causes associated with the corresponding corrective maintenance
actions (93).
2.2.2 Failure Mode and Effects Analysis (FMEA)
The failure mode and effects analysis is a systematic method for examining all modes
through which a component failure can occur, as well as the potential effects of these
failures on the overall system, and their relative criticality in terms of safety and impact
on the normal functioning of the system (113).
In FMEA, the majority of failure modes are examined through two levels of
analysis: the system-level analysis and the component-level analysis, respectively. Such
analyses are carried out by system/component designers based on their expertise for
evaluating the component, system, and plant consequences induced by the individual
enlisted failure modes (88). The component failure modes and their effects are then
drawn up into a FMEA list as shown in Figure 2.2.
The FMEA matrix associates functional failures, and not equipment functions, to
the individual system components, since the reliability management actions devised by an
RCM program focus on avoiding potential functional failures and not on restoring a
previous equipment condition. Thus, the primary sources of information for constructing
an FMEA matrix are the equipment history file on individual component failure
occurrence, the expertise of engineers, technicians, and senior workers with hand-on
experience with the equipment, and the design diagrams or blue prints of the original
equipment manufacturer (93).
18
Reproduced with permission of the copyright owner. Further reproduction prohibited without permission.

Com ponent M ode E ffect
I. Switch A1 1.1 Fails open1.2 Fails closed
1.1 System fails1.2 None
2. Switch A2 2.1 Fails open2.2 Fails closed
2.1 System fails2.2 None
3. Light Bulb C 3.1 Open filament3.2 Shorted base
3.1 System fails3.2 System fails;
possible fire hazard
4. Battery B 4.1 Low charge
4.2 No charge4.3 Over-voltage charge
4.1 System degraded
4.2 System fails4.3 System fails
by secondary damage to Light Bulb C
Figure 2.2 A Simple FMEA
Reproduced with permission of the copyright owner. Further reproduction prohibited without permission.

2.2.3 Prioritization of Failure Modes
“Not all failure modes are created equal.” One of the most fundamental differences
between RCM and other reliability management methodologies is the understanding of
such a powerful statement. Organizations are limited in their resources, and thus,
emphasis must be devoted to each failure mode according to the potential impact of its
respective functional failures on the overall system’s performance.
The RCM process categorizes every failure mode into bins through the use of a
decision structure (93, 95). Logic tree analysis (LTA) is the name given in RCM to the
process of assessing the individual criticality rankings of failure modes. The basic LTA
uses simple yes-no questions which lead to the classification o f detected failure modes
into the following labeling bins: (a) hidden failures, (b) failure with safety-associated
consequences, (c) failures with minor to insignificant economical consequences, and (d)
failures with significant economical results. It should be noted that the traditional LTA
comprises only qualitative questions which do not involve any kind of statistical nor
mathematical evaluation (88, 93). This LTA query scheme has remained basically the
same from the time when the RCM methodology was introduced by United Airlines; and
as it will be discussed later, it might represent one of the areas with most potential for
improvement through the implementation of artificial intelligence techniques.
2.2.4 Selection of Maintenance Strategies for Individual Components
The final step in the RCM methodology is the devising of suitable maintenance strategies
or tasks for each of the examined failure modes. The selected maintenance tasks must be
both applicable and effective. By applicable it is meant that the tasks will prevent or
mitigate a recognized failure, detect an eminent one, or discover hidden equipment
20
Reproduced with permission of the copyright owner. Further reproduction prohibited without permission.

deterioration factors. By effective it is meant that the chosen tasks are the most cost-
effective alternatives among the competing candidates (93).
Thus, the preventive maintenance tasks implied by the conventional RCM
approach can be classified into the following four major categories:
1. Tasks oriented to the prevention of a potential failure.
2. Tasks aimed at detecting an eminent failure.
3. Tasks designed to protect a system’s normal functioning from hidden failure.
4. Tasks directed to the deliberate run to failure of a component due to economic
reasons.
2.3 The Quantitative Approach to Reliability Management
One of the most important objectives of an industrial reliability management program is
the development of maintenance policies or strategies that can lead to optimal decisions
regarding the following questions:
1. Where and when component replacement must take place.
2. Where and when inspection tasks are appropriate.
3. Where and when overhaul and repair actions are cost effective.
Mathematical models in the areas of operation research, statistical reliability, and
systems engineering have been developed as a response to the need for a rapid and
assertive evaluation of alternative maintenance decisions. The main purpose of such
models is to effectively assess the economic consequences of selecting one strategy over
the others, and by doing so, determine the most optimal decision (39). Furthermore,
mathematical models can maximize equipment availability through mathematical
21
Reproduced with permission of the copyright owner. Further reproduction prohibited without permission.

prediction of component failures. That is, a model can minimize equipment downtime by
(MTBF) of crucial equipment components. Such mathematical computations have their
basis on the reliability theory (60).
2.3.1 The Notion of Reliability
Reliability can be defined as the probability that a particular system or component will
operate normally, according to certain working specifications, throughout a determined
period of time (20). During the life cycle of a component (the item’s repair-to-fail
process), its time to failure cannot be exactly predicted since it represents a random
variable characterized by the stochastic properties of the population of potential failure
times. Since the item’s failure time is a stochastic process, the probability of a failure
occurring before some specified time // is defined by:
where f(t) is the component’s failure probability density function. Such an integral is
denoted by F(t) which represents the cumulative failure distribution function. It should
be clear that F(t) tends to one when t tends to infinity, which indicates that no item can
survive failure during an infinite interval of time (33).
The reliability (or survival function) is the complementary function of the
cumulative failure distribution F(t). Denoted by R(t), the reliability function represents
the probability that a component will survive at least to a determined time t, and is
defined as:
determining when to repair or replace an item based on the Mean Time Between Failures
(2 . 1)
22
Reproduced with permission of the copyright owner. Further reproduction prohibited without permission.

{/(')<* (2 -2)
Another concept originated from the reliability and failure distributions of a
particular items is its failure or hazard rate, denoted by h(t). The failure rate is defined as
the probability that a specific component will malfunction in the next interval of time
given that it has survived, without a failure, to time t. Mathematically, h(t) is determined
The importance of knowing an item’s failure distribution, and so its reliability and
hazard rate functions, originates from the fact that decisions such as when to perform
preventive maintenance on a specific piece of equipment require information about the
time when its components will reach a breakdown state. Knowing the probability that a
failed state might occur at any specific time results essential in determining the cost-
effectiveness of alternative maintenance policies.
The failure distribution of equipment is generally obtained through curve fitting,
statistical analysis, and other numerical procedures performed on failure times
observations available from historical records. However, some probability distributions
such as the Weibull, negative exponential, normal and log normal distributions seem to
efficiently describe the failure frequency patterns presented by most industrial equipment
by (33):
(2.3)
(20, 39, 60).
23
Reproduced with permission of the copyright owner. Further reproduction prohibited without permission.

2.3.2 Replacement and Overhaul/Repair Decisions Modeling
Replacement actions involve the substitution of working equipment before it reaches a
failed state at which its functioning is no longer remunerative. Since the failure time of
equipment is characterized by a stochastic process, the timing of a replacement action is
also probabilistic.
When determining the time to perform a replacement, the minimization of the
total cost (replacement and operating costs) associated with the equipment’s operation is
usually intended. However, according to Jardine [1973], reliability management actions
should be given consideration only if the following two conditions are met:
1. The total cost of the replacement increases after the failure event.
2. The equipment presents an increasing failure rate.
The second condition is especially important. If a piece of equipment presents a
constant failure rate, replacement before failure will not affect its likelihood of failing
again in the next instant; thus, its preventive replacement becomes prejudicial in
economic terms.
In general, the model formulation tries to determine the optimal interval of time
between equipment or component replacements so that its total operation and
replacement cost per unit time C(tr) is minimized, that is:
C{tr) = Total cost in interval f0.tT’)Length o f interval (2.4)
The complexity of the mathematical model varies according to the assumptions
considered in the analysis. For instance, if it is assumed that the equipment can be
24
Reproduced with permission of the copyright owner. Further reproduction prohibited without permission.

replaced with an identical unit indefinitely, and inflation discounting is ignored, the
corresponding mathematical model that results is simple. Conversely, factors such as
repairs not returning back the equipment to its “as-new state”, potential technological
improvements, equipment breakdown during replacement intervals, and inflation
considerations can greatly increase the mathematical complexity of the subsequent
model. In that case, the model’s final result may not be a deterministic interval but rather
one with a stochastic nature (48).
2.3.3 Inspection Decisions Modeling
Equipment inspection is an essential part of any comprehensive reliability management
program, including RCM. Among other purposes, equipment inspection aims at (60):
1. Evaluating components in terms of potential problems.
2. Estimating the occurrence of a breakdown.
3. Scheduling repair actions to prevent a major failure.
4. Identifying key components that may precipitate a system’s failure.
Inspection can be thought as the middle point between preventive and corrective
maintenance. It applies to both deteriorating systems and hidden failures. Through the
mathematical formulation of inspection decisions, it is intended to determine an
inspection strategy that will produce the optimal balance between the cost of periodically
inspecting the equipment, and the potential loss production cost due to complete
machinery breakdown (48). Thus, the main goal of the formulation is the minimization
of the total cost {C(tj)) involved in inspecting the equipment until either a failure is
detected or the equipment reaches the failed state. C(tj) is then defined by the following
expression:
25
Reproduced with permission of the copyright owner. Further reproduction prohibited without permission.

C(t') = Total expected cost per inspection cycleInspection cycle length (2.5)
The total expected cost per inspection cycle is actually the sum of both the cost of
performing the inspection Cs, and the cost of a system failure per unit time Cf. It should
be noted that the model deals with an expected cost since the time at which a failure
precipitates cannot be deterministically calculated; thus, Cf can only be estimated
according to the failure function f(t) characteristic of the specific piece of equipment. As
in the replacement decision process, the inspection modeling effort depends on the
variables considered in the analysis. It can vary from very simplistic models based on
perfect corrective actions and constant inspection costs assumptions to more complex
ones where, for instance, the likelihood of a safety event (an event that requires a safety
system) is taken into account for the final decision (36, 48).
2.4 Approximate Reasoning in Reliability Management
Reliability analysis, equipment condition monitoring, and maintenance task scheduling
are fundamental parts of a reliability management program. Traditional analytical
techniques developed to address issues such as mathematical and statistical models
require the knowledge of precise numerical probabilities and component functional
dependencies, information which is rarely available to industrial practitioners in real life.
The field of approximate reasoning can provide some guidelines for coping with such a
difficulty (105). Among inexact reasoning methodologies, fuzzy set theory is one of the
most widely used in describing the behavior of systems with inherent uncertainty.
26
Reproduced with permission of the copyright owner. Further reproduction prohibited without permission.

2.4.1 Fuzzy Set Theory
A fuzzy set differs from a traditional or crisp set in the sense that it does not have well-
defined boundaries. In a conventional set A, the degree of membership 1 is assigned to
those objects that fully belong to the group, while 0 is assigned to objects that are not part
of the set. For instance, if A represents the set of integer numbers which are even, the
number 24 should then receive a membership value equal to 1, while 25 should have a
membership of 0 since clearly it does not belong to A. However, when dealing with
fuzzy sets, the assignment of membership values is not so trivial.
The fuzzy set theory is concerned with those subsets in which, due to their
inherent uncertainty, the transition between full membership and no membership for
objects in the universe is gradual rather than abrupt (40). As an example, if A is now
defined as the set of large integer numbers, intuitively, the number 1 should have a
membership value of 0 while number 10" a value of 1; but what about 20, or 70, or 110?
Evidently, they should receive membership values between 0 and 1. Fuzzy set theory
deals with the development of special functions required for determining the degree of
membership for objects belonging to fuzzy sets (46, 117).
The most commonly employed notation in the literature to denote the membership
function of a fuzzy set A is pA (44); that is:
j i a: * - > [ 0, 1] (2.6)
thus, for the previous example, the numbers 20, 70, and 110 could be thought as
belonging to the fuzzy set A (the set of large integer numbers) with membership degrees
of (iA = 0.2, pA = 0.4, and |aA = 0.6 respectively.
27
Reproduced with permission of the copyright owner. Further reproduction prohibited without permission.

In fuzzy set theory, there are three standard fuzzy set operations which are of
special importance. The standard complement, ~A, of a fuzzy set A with respect to the
universe X is defined for all x<= X as:
H - a ( * ) = I-UaC*) (2-7)
moreover, given two fuzzy sets, A and B, their standard intersection, and standard
union, pA B, are defined for all x e X as:
= min[pA(x), pB(x)] (2.8)
Ha bOO = max[pA(x), pB(x)] (2.9)
where min and max denote the minimum and maximum operators, respectively (46).
For instance, if A and B are defined as (44):
A = .7 .4 0 .5 .2 I
and
B = .3 I .4 .9 0 1
then:
AnB = .3 .4 0 .5 0 t
AuB = .7 I .4 .9 .2 1
~A = .3 .6 I .5 .8 0
2.4.2 Fuzzy Expert Systems
An expert system is a computer-based program which imitates the human reasoning
process of an expert while solving a particular problem. A fundamental component of an
expert system is the inference engine, which is in charge of firing the rules contained in
28
Reproduced with permission of the copyright owner. Further reproduction prohibited without permission.

the knowledge base. In a fuzzy expert system, the inference engine makes fuzzy
inferences from a set of production rules which consist of fuzzy predicates and fuzzy
prepositions (40, 46).
According to Zadeh [1983], an expert system must be capable of coping with
three potential sources of uncertainty: the fuzziness of premises and/or conclusions of
certain domain rules, the partial match between the premise of a rule and a fact supplied
by the user during a consultation, and the presence of fuzzy quantifiers in the premise
and/or conclusion of a rule. The use of fuzzy logic as a framework for dealing with
uncertainty in knowledge based systems has proven more effective and correct than
conventional techniques such as Bayesian inferencing and confidence factor analysis (40,
116).
In classical two-valued and multi-valued logics, a proposition, p, is either true or
false, or it may have an intermediate truth value from a finite or infinite truth-value set T.
Conversely, in fuzzy logic, a proposition is allowed to have a truth value ranging over the
fuzzy subsets of T. Thus, a fuzzy implication, T, is a function of the form:
T: [0,1] x [0,1]->[0,1] (2 .10)
which defines the truth value, T(cr. b), of the conditional implication “if p, then q '\ given
that a and b are any possible truth values of the fuzzy propositions p, q, respectively.
Clearly, this function is an extension from the restricted domain (0, 1} of the classical
implication p—> q to the full domain [0, 1] of truth values in fuzzy logic.
Since the knowledge base of a fuzzy expert system consists of a collection of
fuzzy propositions representing the facts, and fuzzy conditional implications constituting
29
Reproduced with permission of the copyright owner. Further reproduction prohibited without permission.

the rules, multiple fuzzy implications are needed to assess the truth values of the encoded
heuristics. Such fuzzy implications are normally inserted into a decision table which
becomes part of the rule-based system. This fuzzy decision table provides a framework
for systematically representing and inferring information from an uncertain environment
when the expertise at hand involves imprecise rather than precise knowledge. It should
be noted that, although the mathematical formulation of a fuzzy implication should
uniquely and strictly depend on the nature of the expertise encoded in the corresponding
knowledge based system, it must be based upon well-founded and sound fuzzy set
operators. Dozens of different fuzzy logic algorithms have been developed for several
distinct applications throughout the years, and a vast number of them can be found in the
reported literature (40, 46, 116).
2.4.3 The Fuzzy Approach to Equipment Reliability and Maintainability
Although only a small number of scholars has seriously addressed the issue of how to
handle uncertainty in the area of equipment reliability and maintainability, the importance
of developing industrial reliability management programs that can cope with imprecise
equipment maintenance data can not be dismissed.
Fuzzy sets can be employed for representing equipment condition and remaining
life, predicting machine failures, performing component and risk assessment analysis, as
well as determining the frequency and timing of reliability management actions (79, 58,
84, 91, 92, 99, 105). Particularly related to this study are the efforts of representing
machine condition and system criticality through fuzzy sets. Equipment condition has
been modeled using triangular fuzzy numbers (99). If x is the fuzzy variable for the
condition of a particular machine (ie, x may vary from 0 to 10, being 0 a completely
30
Reproduced with permission of the copyright owner. Further reproduction prohibited without permission.

failed state while 10 a perfectly functioning state), then, the functional condition of
machine B can be represented by the triangular fuzzy set:
\LB (x) = tri ( a , x, P) (2.11)
which has equal spread on both sides, ie, x-a = P-x.
Moreover, Tomsovic and Baer [1996] have proposed the use of Zadeh’s fuzzy set
operations for modeling component dependencies. In RCM, for instance, it is necessary
to evaluate all the functional interrelationships among the system’s elements in order to
assess the overall effects of the distinct component failure modes. However, for large
systems, the nature of the dependencies may be unknown. Thus, fuzzy set operators,
such as conjunction and disjunction operators, may denote a natural and simple way of
representing the possibility of interdependencies among machines or pieces of equipment.
It should be noted that these fuzzy operators need to be carefully chosen or devised so
that the equipment interdependencies under scrutiny can be properly reflected in the
analysis.
Fuzzy logic has also been considered for manipulating the linguistic terms that an
analyst employs in performing a Failure Modes, Effects and Criticality Analysis
(FMECA) (79). Linguistic variables can be adopted to describe the severity, frequency of
occurrence, and detectability of failure modes. Each one of such linguistic terms can be
represented by fuzzy trapezoidal numbers, as shown in Figures 2.3, 2.4, and 2.5. The
degree of risk associated to each failure mode can then be determined by a devised
arithmetical scheme involving the membership values deduced from the corresponding
trapezoidal numbers according to the analyst’s appreciation. Finally, through a
31
Reproduced with permission of the copyright owner. Further reproduction prohibited without permission.

defuzzification method or procedure, a conclusive linguistic variable (ie, moderate,
important, very important, etc.) can be resolved to determine the risk of each component
failure mode.
2.5 Intelligent Computer Systems and RCM
The selected software tools listed in Table 2.1 are considered maintenance management
systems in the sense that they provide an integrated environment for monitoring,
controlling, and coordinating maintenance operations with all other functional activities
of an organization such as process scheduling, purchasing, storing, and others. Although
the importance of such systems in promoting an efficient and orderly execution of
functions can not be ignored, they fail in delivering the appropriate technical and
analytical means for an effective RCM implementation.
RCM bases its efforts on the monitoring of individual pieces of equipment. The
most challenging aspects of its implementation is obtaining sufficient data on equipment
performance such as correlated errors, faults, breakdowns, and others measures of
degradation. The evaluation, grouping and comparison of such a massive amount of data
cannot be efficiently handled by a general information system in which global integrating
parameters are normally given greater importance. Furthermore, in RCM, for different
types of components and machines, different types of maintenance policies are generated
which involves a variety of failures patterns. The analysis of such patterns demands
knowledge and training in using mathematical models not offered in a conventional
software. Finally, the maintenance engineer is highly challenged by the nature of the
information manipulated by an RCM. Certain specific operability details such as the
replacement of components with different specifications or maintenance policies impose
32
Reproduced with permission of the copyright owner. Further reproduction prohibited without permission.

special flexibility and versatility in the maintenance routines which makes difficult the
enhancement and evaluation of reliability management tasks by conventional integrated
computer systems (50, 57).
Nevertheless, knowledge based systems have been identified as a strong candidate
for handling systems such as RCM. According to several scholars in the field, an
intelligent decision support system composed by subsystems such as expert systems and
embedded neural networks represents the best alternative to improve the performance of
an RCM program. They claim that an intelligent supporting program can provide the tool
to integrate all RCM data and prevent decision makers from being overwhelmed by the
complexity of reliability management modeling and planning (47, 49, 50, 57, 88, 110).
Moreover, since an expert system matches human heuristic thought processes, the expert
systems methodology seems to be more acceptable to a maintenance engineer than the
solution of a computational algorithm or other analytical procedure (82).
2.6 Expert Systems Applications in Reliability Management
This section discusses the most relevant knowledge based systems developed during the
last decade for reliability management applications. Although these efforts did not yield
a system that could efficiently cover all the RCM features nor reconcile the mathematical
modeling with the heuristics aspect of reliability management, they do represent
breakthroughs in the conventional way of managing maintenance operations and confirm
the suitability of expert systems in supporting RCM functions.
33
Reproduced with permission of the copyright owner. Further reproduction prohibited without permission.

MembershipHigh Moderate Low Remote
1.00
0.65
Occurrence0.00
10 ‘ I O'2 10-5
Figure 2.3 Failure Mode Occurrence Ranked As Low (79)
MembershipModerateLow High Very-High
1.00
0.30
0.25 Severity0.00
4 6 8 10
Figure 2.4 Severity of Failure Ranked As High (79)
34
Reproduced with permission of the copyright owner. Further reproduction prohibited without permission.

MembershipHighVery-High Moderate Very-LowLow
1.00
0.85
0.55
0.004 6 8 10
_____________________________________ Detectability
Figure 2.5 Failure Detectability Ranked Somewhat Moderate AndSomewhat Low (79)
35
Reproduced with permission of the copyright owner. Further reproduction prohibited without permission.

2.6.1 Automated Cable Expertise (ACE) (67)
One of the first reported efforts in creating an expert system for corrective and, in a sense,
some preventive maintenance tasks is the Automated Cable Expertise system, known as
ACE. It was developed by the AT&T Bell Laboratories in 1985 to analyze thousands of
customer trouble reports for signs of potential outside-plant problems. ACE was
programmed using Franz Lisp and OPS4, and delivered on an AT&T 3B2/300 computer.
The systems uses two databases: CRAS, the Cable Repair Administrator System;
and TREAT, the Trouble Repair Evaluation and Administration Tool, whose analysis
guides local telephone companies’ preventive maintenance programs. The final output of
the system is a comprehensive report describing the place and nature of outside-plant
repairs that could improve the service to the customers and save the company money.
However, ACE was designed with the purpose of assisting in cable analysis only.
Its main objective is to identify the location where loop-cable analysis is needed. Thus,
ACE does not carry out any real important mathematical, or probabilistic risk analysis. It
makes its recommendations based on the encapsulated expertise of well-trained human
analyzers. Although ACE’s recommendations involves certain reliability management
strategies for improving the local cable configuration, they can be seen instead as mere
corrective actions, generated through coded human expertise without a serious
component failure mode analysis.
2.6.2 The SRI Program (88)
A Systematic Reliability Improvement (SRI) program was developed by the Toshiba
Corporation and the Tokyo Electric Power Company to support the decision-making
process of reliability management planning in nuclear power plants. The system is based
36
Reproduced with permission of the copyright owner. Further reproduction prohibited without permission.

on the Reliability Centered Maintenance methodology, and integrates the following three
subsystems:
1. The equipment part maintenance information control system (EMICS), which is
in charge of the evaluation of component reliability and aging parameters. The
maintenance management subsystem provides statistical analysis on component
failure modes.
2. The failure mode effects/criticality analysis database system (FMECA-DBS),
designed to classify the failure mode characteristics and their environment. The
FMECA database subsystem manages data on the system/component failure
modes, previously estimated by experts at the design stage.
3. The PM planning subsystem which determines the priority of PM improvement
plans. It evaluates the priority or criticality of PM actions such as improved
maintenance, design, quality, and operation for components and their parts through
an interactive logic tree analysis.
This last subsystem represents an intelligent knowledge based system designed to
provide improved maintenance guidance on PM intervals, tasks, and inspection
techniques based on the analyses yielded by the other two subsystems. However, the
system does not generate reliability management strategies based on inherent PM
expertise or mathematical models. It just upgrades the information-handling process of
traditional RCM relevant to the FMECA and logic tree analyses in order to compute the
priority for reliability improvements. The system can not make a decision by itself; it
needs the user to carry out the FME/CA ranking assessment, as well as to interpret the
final priorities given to the different PM policies. The literature is not clear about this
37
Reproduced with permission of the copyright owner. Further reproduction prohibited without permission.

point, it seems that the user follows the branches depicted in a displayed logic tree to
distinguish the most appropriate reliability improvement. Moreover, although the
proposed SRI program handles some vague terms (i.e. “‘critical”,“highly critical”, etc.) to
perform the evaluation of the failure modes and prioritization of PM strategies, the
authors do not incorporate any fuzzy or approximate reasoning scheme to any of the
system's modules, which may evidence a major incapability of the system in handling
such ambiguous variables.
2.6.3 An Expert System for FMECA (110)
Jonathan Webber from Dowty Fuel Systems has proposed and developed an expert
system to assist in failure modes, effects and criticality analysis (FMECA). Although.
FMECA is just a part of the whole structure of the RCM methodology, it is worthwhile to
discuss such an expert system here since it represents a valuable effort in proving the
effectiveness of artificial intelligence in PM functions.
According to Webber, FMECA’s primary contribution is the early identification
of potential failures so that they can be eliminated early in the design stage. However, the
traditional FMECA activity is unable to influence design since the time that it takes to
carry it out often exceeds the development phase. The FMECA methodology consists of
three major steps: the system interpretation, the failure analysis, and the numerical
analysis. Webber proposes that by automating the failure analysis through a knowledge
based system, the FMECA duration time is then reduced, which greatly improves its
effectiveness. To prove his point, he constructed an expert system for failure analysis on
a hydraulic actuation system. The developed expert system models the behavior of the
hydraulic fluid as it goes, under some specified conditions, through the diverse
38
Reproduced with permission of the copyright owner. Further reproduction prohibited without permission.

components of the actuator. Through the elicitation of relevant heuristics on the distinct
functions and failure modes of each one of the components, and the hydraulic line
between them, the expert software can know which components suffered from the effect
of an upstream failed component. The software then indicates if a normal liquid flow
between components was detected during the simulation, and provides the FMECA for
all the components of the actuator.
The results of this effort showed that the expert system carried out the failure
analysis in less than a quarter of the time previously taken by the human analyst. In
addition, the quality of the knowledge based failure analysis was superior over its human
counterpart when used with systems incorporating ten or more components.
2.6.4 IMOS (49)
IMOS, a prototype intelligent maintenance optimization system was developed to assist
in the evaluation and enhancement of maintenance routines. This system shows a very
interesting configuration where an optimization module for PM routines is combined with
a model-selection knowledge base. The main objective of the optimization module is to
determine the interval of time at which preventive maintenance is to be performed, based
on one of the following optimizing criteria: maximization of equipment availability,
minimization of maintenance cost, minimization o f maintenance costs while meeting
availability requirements, or maximization of profit. Conversely, the model-selection
knowledge base consists of nine rules (see Figure 2.6) constructed to identify the most
appropriate mathematical model to be applied according to the characteristics presented
by the particular situation. There are five basic models coded in the system: the
deterministic model, the stochastic model, the geometric model I, the geometric model II,
39
Reproduced with permission of the copyright owner. Further reproduction prohibited without permission.

and the Weibull analysis model. IMOS represents an innovative PM framework in the
sense that it attempts to reconcile maintenance-routine optimization models with PM
heuristics drawn on the expertise of experienced maintenance engineers. However, the
simplicity of the system reduces its effectiveness. A formal failure mode effects and
criticality analysis is absent from the prototype system. IMOS concentrates its efforts in
determining only the most appropriate PM interval for isolated machines or components
without evaluating the environment surrounding the failures; and even the computation of
such an interval is based on very simplistic criteria. Furthermore, the system was not
designed to consider components with variant or complex reliability functions, which
causes it lack of the flexibility and versatility required for RCM applications.
2.7 Literature Search Summary
The results of the literature search clearly show the increasing interest in the utilization of
intelligent knowledge based systems for reliability management operations. Such
systems can considerably improve the scope of reliability centered maintenance
applications.
Nevertheless, most of the reported systems fail in providing a comprehensive
RCM framework that can take full advantage of both exact optimization models, and PM
expertise recollected in the form of rules. Systems such as the SRI program and IMOS
represent a significant step to the development of the ultimate RCM software. However,
there are techniques such as fuzzy induction, and approximate or inexact reasoning that
can positively contribute to the field of reliability management but have not yet been
seriously considered by most researchers.
40
Reproduced with permission of the copyright owner. Further reproduction prohibited without permission.

RULE 1 RULE 2If Number o f PM events is large If Number o f PM events is largeand No failure events and Number o f failure events is smalland PM cycle length is not very variable and PM cycle is not very variableThen Then
Apply Geometric Model I Apply Geometric Model II
RULE 3 RULE 4If Number o f PM events is large If Number o f PM events is very smalland There are sufficient failure events and Num ber o f failure events is enoughand PM cycle length is very variable and Weib. P parameter is o f CO dist. > IThen Then
Apply Deterministic Model I Apply Weibull Model
RULE 5If Number o f PM events is very small RULE 6
and Number o f failure events is sufficient If Number o f PM events is large
and Weib. p parameter o f CO dist. not > 1 and Number o f failure events is large
Then and W eibull p parameter o f PM dist.= l
Stop any PM policy, report beta value and Weibull p parameter o f CO dist.= l Then
Apply Stochastic Model
RULE 7 RULE 8If Number o f PM events is large If Number o f PM events is largeand There are failure events and Number o f failure events is largeand Weib. p parameter o f PM dist. not = I and Weib. p parm. o f PM dist. not =1or Weib. P parameter o f CO dist. Not = 1 or Weib. P param. o f CO dist. not =1and PM cycle length is sufficiently variable and PM cycle length is not variableThen Then
Apply Deterministic Model N o model is suitable - explain
RULE 9If None o f the above rules is successfulThen
No model can be applied - explain
Figure 2.6 Model Selection Ruiebase for Prototype IMOS (49)
41
Reproduced with permission of the copyright owner. Further reproduction prohibited without permission.

CHAPTER 3
METHODOLOGY AND SCOPE
3.1 Overview
The primary objective of the developed PC-based system is to automate the
implementation of RCM through the integration of distinct techniques which have been
postulated by experts in the field as noted in the published literature. This knowledge
encapsulation process had to be carried out systematically to consider all of the different
key factors in the analysis. Therefore, the first step in addressing this problem consisted
of an exhaustive literature search to determine the most suitable mathematical and
heuristic PM approaches to be consolidated into the system. This library research also
provided valuable insights for developing fuzzy reasoning mechanisms to be included
into the inference engine of the created system. From this analysis, the initial set of
inference rules were constructed, the system architecture defined, and the user interface
requirements identified. The formal knowledge representation was then translated into
the selected development tool. The final step of the project implied the assessment and
evaluation of the system’s performance as an effective RCM management tool.
3.2 Scope of the Research
The main purpose of the completed study was the development of a computer-based
expert system to assist in RCM applications. Mainly, the system was designed to provide
the industrial practitioner with an availability structure model of his process machines,
which represents the foundation of the component risk assessment analysis.
42
Reproduced with permission of the copyright owner. Further reproduction prohibited without permission.

The success of an RCM program greatly depends on the assessment of the
multiple functional interdependencies among the individual system’s component failure
modes, as well as their corresponding criticality analyses. If the analyst lacks sufficient
expertise for uncovering such component dependencies, the resulting RCM effort will be
incapable of revealing critical factors or circumstances that if not properly considered in
the analysis, make the development of a comprehensive and effective equipment
maintenance program impossible. Nevertheless, for large industrial systems where the
degree of complexity is such that most analysts can not conceive of all the distinct
component interdependencies, an intelligent computer system with relevant knowledge
on the system’s functional characteristics would represent an important tool for
constructing the required availability structure model.
The scope of this work focused on the development of a prototype expert system
which could implement the RCM framework, using the chemical process industry as the
application area.
3.2.1 The Chemical Process Industry
Chemical processes play a critical role in human society since they represent one of the
most important manufacturing activities. The importance of this type of industry is easy
to visualize- chemical products are everywhere. According to the literature, the chemical
industry uses the greatest amount of engineering techniques and equipment among all
industrial disciplines (98); therefore, it represents an appropriate application area for
reliability management methodologies such as RCM.
The Office of Statistical Standards defines chemical and allied products as
comprising three general classes of goods (66);
43
Reproduced with permission of the copyright owner. Further reproduction prohibited without permission.

1. basic chemicals such as synthetic fibers, plastic materials, dry colors and
pigments,
2. finished chemical products to be used for ultimate consumption as drugs,
cosmetics, and soaps, and,
3. materials or supplies in other industries such as paints, fertilizers, and
explosives.
Although, the manufacturing processes followed in the production of such items
involve a wide variety of chemical procedures (ie. crystallization, evaporation,
distillation, etc.), they are usually very similar and often only few variables are altered.
Hence, since related engineering principles or techniques are usually applied, most of the
manufacturing equipment used in different chemical plants ends up being very similar, if
not identical.
Equipment maintenance is a key issue in this type of industry. Chemical
processes are characterized by tight operational specifications which are clearly
dependent upon the normal functioning of the different machines, thus, equipment
reliability becomes a crucial factor in the overall process planning function.
Chemical engineers commonly use computer aided design (CAD) software to
design, control, and monitor their industrial processes. Among such packages, ASPEN
Plus, from Aspen Tech, has been adopted by leading chemical process companies, such
as Dow, BASF, DuPont, and Exxon, as the industrial standard for the designing, and
monitoring of chemical manufacturing systems. This package aims at the improvement
of chemical operations by assisting the user in three major areas: process layout,
equipment trouble shooting, and equipment design and rating capabilities. ASPEN Plus
44
Reproduced with permission of the copyright owner. Further reproduction prohibited without permission.

is controlled through a graphical interface which allows the user to model a process by
creating a process flowsheet, and then specifying the operating conditions (temperature,
pressure, etc.) for each one of the system components. Once a base model for the process
is specified, the user can run a simulation of its functioning, and perform a what-if
sensitivity analysis to evaluate the effects of different operating scenarios. ASPEN Plus
also assists the user in equipment cost estimation, process economic evaluation, and
process optimization. This software is equipped with special modules for specific
applications such as a petroleum and distillation enhancement subsystem, and an
electrolytes expert system. At any time, the user can export the process flowsheet and
layout drawings to a design program such as AutoCAD or any other CAD package (as a
PXF file), or the equipment operating data and process simulation results to a computer
spreadsheet ( as a LOTUS file).
3.2.2 The New RCM Framework
This research was oriented to the development of a new automated RCM framework that
ultimately can be viewed as a component of a new innovative computerized equipment
maintenance environment. Figure 3.1 depicts the intended reliability management
environment, whose final goal is the generation of optimal equipment maintenance
strategies according to the type of manufacturing process and operating conditions of the
plant.
Normally, chemical processes are highly complex. Their design, development,
and control involve such a vast effort that engineers must use sophisticated computer
software. In order to facilitate and minimize the user data input and intervention, the
conceived maintenance environment directly utilizes the equipment condition and
45
Reproduced with permission of the copyright owner. Further reproduction prohibited without permission.

operational data generated by ASPEN Plus as the main input for the RCM module. This
module is embodied by the developed expert system, which generates the Availability
Structure Model to be utilized by a Statistical Data Analysis Module.
The RCM component involves the accomplishment of three major tasks. First,
the RCM module interfaces with ASPEN Plus and is able to recognize the distinct pieces
of equipment and type of chemical process under analysis. Second, it determines all the
different failure modes associated with the involved manufacturing equipment, how they
may affect each other, and how they may obstruct the normal functioning of the overall
system. Finally, the RCM module generates an availability structure model that could
serve as the basis of the risk assessment analysis needed for determining the most
beneficial equipment maintenance actions and strategies for the plant.
Figure 3.2 shows an example availability structure model. Such a model consists
of a special type of reliability diagram or network which not only depict the different
interdependencies among the system’s components, but also depicts associated
equipment maintenance times (outside the scope of this study) as well as relevant data on
how to handle possible failures of individual pieces of equipment. The main function of
an availability structure model is to provide a framework for analyzing distinct failure
scenarios via Monte Carlo simulation. Thus, a comprehensive availability structure
model should include the following:
1. What should and should not be expected when a specific component fails?
2. How is the safety and normal operation of the plant affected when the
component fails?
46
Reproduced with permission of the copyright owner. Further reproduction prohibited without permission.

PROCESS DESIGN SOFTWARE (ASPEN Plus)
A VAILABILITY STRUCTURE
MODEL
DATAANALYSISMODULE
DYNAMICMAINTENANCESCHEDULING
RISKASSESSMENT
MODULE
AVAILABILITYASSESSMENT
RCM MODULE
(Expert System)
Figure 3.1 A Proposed Industrial Equipment Reliability Management Environment
Reproduced with permission of the copyright owner. Further reproduction prohibited without permission.

3. What can and can not be done while maintenance is performed on the
component?
4. For how long can the production process remain stopped, while the
component is being repaired or replaced, without experiencing any
considerable production loss?
5. What sort of immediate actions must be taken upon the occurrence of the
failure?
3.3 The Knowledge Engineering Phase
3.3.1 Process Selection
The first step in the development of the expert system was the selection of a set of
representative industrial chemical processes that could be used for extracting the needed
equipment maintenance expertise.
Ten industrial process were selected on the basis of commercial importance.
According to the 1992 Survey of Industrial Chemistry (14), the following (presented in
order of importance) are the most produced industrial chemicals in the world; and hence,
their production processes were taken as the main sources of the expertise used in this
research.
3.3.1.1 Sulfuric Acid; H2S 0 4
Ninety nine percent of sulfuric acid is produced through the Contact Process, which was
developed in England in 1831. In a Contact plant, sulfur and oxygen are burned to SO, at
1,830" F, and then cooled to 788 "F. The SO, and 0 2 then enter a converter containing
four layers of catalyst, usually vanadium in the form of individual pellets. About 65% of
48
Reproduced with permission of the copyright owner. Further reproduction prohibited without permission.

Actions -Stop system while repairing -When leaking, replace battery with a new one -Recharge it otherwise
Actions - Maintenance Times - When Fails
Maintenance Times Inspect every 6 months
When Fails (Risk = 20%); -System Fails ;-Toxicitv hazard I
(same as A2)
............V*'
SwitchBattery
Actions -Stop system while repairing -If corroded then replaced -If blades are bent then examine motor
Maintenance Times ^ . -Replaced each year I
Fan
Switch\ When Fails (Risk = 60%) j-System fails;-Switches may be damaged ;-User can be hurt
Actions-Replace switch with a new one-Keep system working-Keep working area free of water spills
Maintenance Times ;-Inspect every 3 months ; for short circuits
When Fails (Risk = 35%) ;-Nothing if AI is functioning OK I-Small electric shock hazard
Figure 3.2 A Simple Availability Structure Model
49
Reproduced with permission of the copyright owner. Further reproduction prohibited without permission.
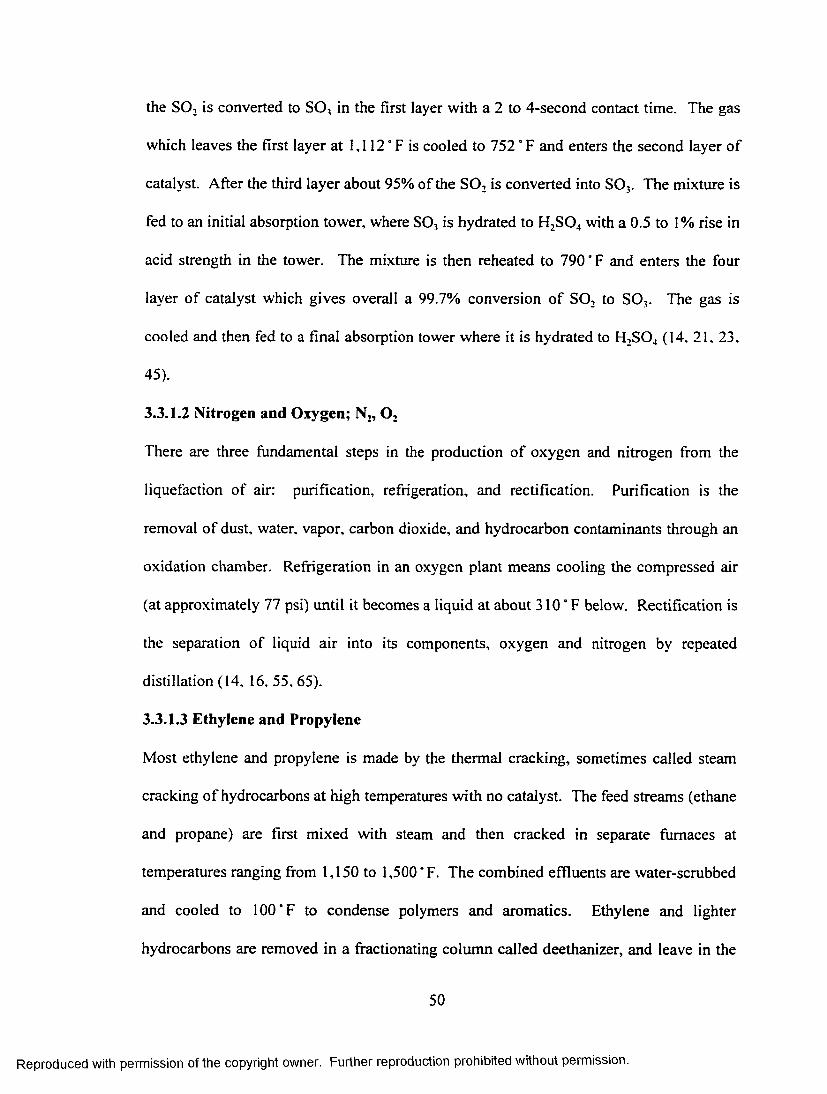
the S 02 is converted to SO, in the first layer with a 2 to 4-second contact time. The gas
which leaves the first layer at 1,112 ” F is cooled to 752 ’ F and enters the second layer of
catalyst. After the third layer about 95% of the SO, is converted into S 03. The mixture is
fed to an initial absorption tower, where S03 is hydrated to H2S 04 with a 0.5 to 1% rise in
acid strength in the tower. The mixture is then reheated to 790' F and enters the four
layer of catalyst which gives overall a 99.7% conversion of SO, to S 03. The gas is
cooled and then fed to a final absorption tower where it is hydrated to H2S 04 (14. 21, 23.
45).
3.3.1.2 Nitrogen and Oxygen; N2, 0 2
There are three fundamental steps in the production of oxygen and nitrogen from the
liquefaction of air: purification, refrigeration, and rectification. Purification is the
removal of dust, water, vapor, carbon dioxide, and hydrocarbon contaminants through an
oxidation chamber. Refrigeration in an oxygen plant means cooling the compressed air
(at approximately 77 psi) until it becomes a liquid at about 310 ’ F below. Rectification is
the separation of liquid air into its components, oxygen and nitrogen by repeated
distillation (14, 16, 55, 65).
3.3.1.3 Ethylene and Propylene
Most ethylene and propylene is made by the thermal cracking, sometimes called steam
cracking of hydrocarbons at high temperatures with no catalyst. The feed streams (ethane
and propane) are first mixed with steam and then cracked in separate furnaces at
temperatures ranging from 1,150 to 1,500 *F. The combined effluents are water-scrubbed
and cooled to 100°F to condense polymers and aromatics. Ethylene and lighter
hydrocarbons are removed in a fractionating column called deethanizer, and leave in the
50
Reproduced with permission of the copyright owner. Further reproduction prohibited without permission.

overhead product stream. The bottom stream contains propylene and higher
hydrocarbons. Recovery of the ethylene is carried out by cooling the overhead stream to
about -195 * F and treating the condensed liquid in another fractionating column called a
demethanizer. The bottom product from the demethanizer is fed to an ethylene
fractionator for purification. Recovery of the propylene involves treatment of the
bottoms from the deethanizer in a depropanizer (another fractionating column) and a
propane splitter (14, 64, 81, 89, 98).
3.3.1.4 Calcium Oxide or Lime; CaO
During the production of lime, limestone is crushed and screened to a size of
approximately 4 to 8 in. The limestone then passes through a kiln which in most cases is
a gas-fired upright kiln where the stones bum at different rates according to their sizes.
Once the lime product leaves the kiln, it is cooled in rotary air-fluidized cylinders, and
sent to a slaker if slaked (Ca(OH)2) is desired (14, 66, 85).
3.3.1.5 Ammonia; NH3
Ninety percent of ammonia plants generate the hydrogen required for the ammonia
manufacture by steam-reforming of natural gas. Desulfurized natural gas is fed with
steam to a primary reformer, where it is reacted with steam in Ni-catalyst-filled tubes.
The reformed gas and steam are then cooled to 700" F. This cooled gas-steam mixture
enters a two-stage shift converter where iron and cooper catalysts are employed to obtain
raw synthesis gas. This synthesis gas, after being purified in C02 absorbers and strippers,
is then compressed in a two-case centrifugal compressor. Interstage cooling is provided
by heat exchange with methanator feed, cooling water, and NH3 refrigerant. Anhydrous
51
Reproduced with permission of the copyright owner. Further reproduction prohibited without permission.

ammonia is catalytically synthesized in a loop in which unconverted gas is recycled for
eventual conversion to ammonia (14, 16, 55, 108).
3.3.1.6 Phosphoric Acid; H3P 0 4
By 1989, 91% of the world‘s production of phosphoric acid was made by the Wet
Process. In this process, the phosphate rock is ground and mixed with dilute H3P04 in a
mill. Then, the mixture is transferred to reactors where H2S04 is added. The reactors are
heated to around 175°F for 4 to 8 hours. Air cooling carries the HF and SiF4 side
products to an absorber tower which transforms them into H2SiF6. Filtration of the solid
gypsum (CaS04 2H20) from the reactors gives the final dilute H3P04 solution (14, 64. 65,
89).
3.3.1.7 Caustic Soda and Clorine; NaOH, CL,
In 1892 the electrolysis of brine was discovered as a method for making both sodium
hydroxide and chlorine. This rapidly grew in importance and since the 1960s it has been
the only method of manufacture. In the electrolytic process, the brine (25% NaCl
solution) is first purified, and then sent to an electrolytic cell where Cl, and H, are
precipitated. Two types of cells are commonly used, the diaphragm cell used now in 78%
of all production plants, and the mercury cell which is employed in 19% of the plants.
Evaporation and filtration of the basic solution after electrolysis yields a solid salt, which
can be recycled, and an industrially 50% caustic soda solution (14, 66, 81, 108).
3.3.1.8 Sodium Carbonate or Soda Ash; Na2CO}
Although during the last years there has been a tremendous conversion from synthetic to
natural soda ash consumption, the Solvay method for manufacturing soda is still very
popular world wide. Sodium carbonate is made from a NaCl brine that is mixed with
52
Reproduced with permission of the copyright owner. Further reproduction prohibited without permission.

ammonia in a large ammonia absorber. A line kiln is also employed as the source of
carbon dioxide, which is mixed with the salt and ammonia in carbonation towers to form
ammonium bicarbonate and finally sodium bicarbonate and ammonium chloride. After
filtration, the sodium bicarbonate is heated to 350' F in rotary dryers to produce light
soda ash. Dense soda ash, used by the glass industry, is manufactured from light ash by
adding water and drying. Normally, the ammonium chloride solution goes to an
ammonia still where the ammonia is recovered and recycled (14, 45, 64, 81, 89).
3.3.1.9 Nitric Acid; H N 03
In the latter years, nitric acid is only manufactured by direct oxidation of ammonia. A
high-pressure process is most often used where the ammonia is fed to a reactor containing
a rhodium-platinum catalyst at 1,380 to 1,690" F and 100 psi. From the reactor, a mixture
of NO and 0 2 is cooled, and transferred to an absorption tower with water and air to
oxidize the nitric oxide and hydrate it to around 65% nitric acid in water. This nitric acid
solution is later concentrated in a silicon-iron or stoneware tower containing 98% sulfuric
acid which yields, as final products, 90% nitric acid off its top and 75% sulfuric acid as
its bottoms (14, 55, 65, 89).
3.3.1.10 Ammonium Nitrate; NH4N 0 3
Although the basic reaction is the same, the manufacture of ammonium nitrate greatly
varies from plant to plant. Crystals, granules, and prills are made with the same
chemistry but different engineering. In this study, the prilling technique was adopted. In
a stainless steel reactor, a mixture of NH3 and 60% N H 03 is concentrated to 85% nitrate.
Posterior vacuum evaporation at 260 to 285 ° F further concentrates the solution to 95%.
This hot solution is then pumped to the top of a spray or prilling tower 195 to 230 feet
53
Reproduced with permission of the copyright owner. Further reproduction prohibited without permission.

high. It is discharged through a spray head and solidifies as it falls in the air to form
small spherical pellets of 0.08 in diameter. The prills are screened, further dried, and
dusted with clay to minimize sticking (14, 16, 55, 85, 89, 98).
3.3.2 The Pieces of Equipment Considered in this Study
From the previously mentioned chemical processes, sixty two different industrial process
machines were identified, and their most relevant failure modes extracted from the
pertinent literature and field experts. Appendix A shows these sixty two pieces of
equipment as well as their corresponding failure modes. Nevertheless, for the
development of the expert system, a subset of eleven of such machines was selected on
the basis of extent of use in the industrial settings. The eleven pieces of equipment
selected are the following:
• Burner
• Centrifugal Blower
• Centrifugal Pump
• Compressor
• Converter
• Distillation Tower
• Evaporator
• Heat Exchanger
• Pipeline
• Reactor
• Waste Heat Boiler
54
Reproduced with permission of the copyright owner. Further reproduction prohibited without permission.

3.3.2.1 Burner
The type of chemical burner considered in this research is a full-cone spray burner
provided with a low-pressure air-atomizing nozzle. This type of burner has a maximum
fuel atomizing capacity between 30 and 35 short tons a day, and it requires between 550
and 750 std. ft3 of air per minute at a maximum pressure of 4 psi.
As it can be seen in Figure 3.3, the burner consists of three major components; a
centrifugal pump, a centrifugal blower, and a combustion chamber. The combustion
chamber is made out of a 3/8 in. steel plate lined with 4 lA in. insulating and 9 in. fire
brick. Its internal production volume is estimated to be between 20 and 25 ft3/short ton a
day. The spray nozzle is assumed to be of carbon steel.
3.3.2.2 Centrifugal Blower
Figure 3.4 depicts the type of centrifugal blower assumed in the construction of the expert
system. It represents a centrifugal blower capable of developing pressure between 1 and
4 psi. It has a steel housing and stainless steel wheel with rubber internal seals. This type
of blower has a maximum capacity between 8,000 and 11,000 ft3 per minute, which
implies a 100 to 250 hp blowing motor.
3.3.2.3 Centrifugal Pump
Single-stage, enclosed impeller centrifugal pumps represent the type of pumps considered
by the developed expert system. This kind of pump can discharge between 100 and 300
gallons per minute with a total head (discharge head plus suction head) of 225 to 650 feet,
and a maximum speed between 3,000 and 4,500 rpm.
The common dimensions for a medium single-stage pump imply a 1 lA to 3 lA in
suction diameter, a 1 to 3 in. discharge diameter, a 5 to 7 in. impeller diameter, and a lA to
55
Reproduced with permission of the copyright owner. Further reproduction prohibited without permission.

3A in. impeller width. Their casings and impellers are most frequently made out of cast
iron, the shaft and wearing rings of stainless steel, and the mechanical seals of carbon
resin and nitrile. A single-stage, enclosed impeller pump is shown in Figure 3.5.
3.3.2.4 Compressor
The expert system was designed to handle medium-sized multistage centrifugal
compressors. As it can be seen in Figure 3.6, this type of compressor has 3 to 5 stages
made out of stainless steel impellers, shafts, and diaphragms.
The maximum inlet capacity for the type of compressors considered in this project
is between 20,000 and 30,000 ft3 of gas or air per minute, which implies a 400 to 600 hp
driving motor.
3.3.2.5 Converter
The type of gas converter covered in this project is the four-stage fluidized-bed reactor
with two internal heat exchangers for gas cooling. Such a converter consists of a single
cylindrical cast iron shell, with chrome cast-iron catalyst supporting grids, and steel heat
exchanger tubes. The catalysts here assumed to be used in this type of converter are
platinized magnesium sulfate and vanadium oxide.
A medium-size range of converters has been adopted. Thus, the inside diameter
of the studied type of converter is around 6 feet, 12 feet high, 9 to 12 in. the depth of
catalyst on each one of the four shelves, and a catalyst load averaging 1,500 lb per tray.
Moreover, the converters are assumed to be equipped with internal heat exchanger tubes
of 1 to 2 in. of inside diameters in a 6 to 7 in. steel shell. Figure 3.7 depicts a typical gas
converter configuration used in the knowledge engineering phase of this project.
56
Reproduced with permission of the copyright owner. Further reproduction prohibited without permission.

I— t
Figure 3.3 Burner (24)
Figure 3.4 Centrifugal Blower (78)
57
Reproduced with permission of the copyright owner. Further reproduction prohibited without permission.

Centrifugal Pump (78)
Figure 3.6 Multistage Compressor (78)
58
Reproduced with permission of the copyright owner. Further reproduction prohibited without permission.

33.2.6 Distillation Tower
The two-bed packed distillation tower was adopted in this research. Such a column
consists of ceramic “Raschig” rings that allow the distillation of two products at a time
inside the column. The tower is assumed to have an operational pressure ranging
between 250 and 350 lb/ft2, and its height are thought to be between 35 and 40 feet, with
an inside diameter of 4 to 6 feet.
Regarding the supporting bar grids inside the column, they were to be lA in thick
bars spaced l lA in from each other. Figure 3.8 illustrates the common structure of a
“Rashing”-ring packed distillation tower.
33.2.7 Evaporator
One of the most popular types of evaporators found in the industry is the forced-
circulation evaporator with external horizontal heating surface. This type of evaporator
consists of a centrifugal pump that circulates the fluid to be concentrated throughout the
apparatus, an external tubular heat exchanger which heats the circulating fluid with the
heat provided by hot steam running in its shell side, and a steel vapor head through which
the vapor of the solution is dissipated.
The developed expert system was designed o handle forced-circulation
evaporators with a vapor head of 10 to 15 feet of height, and 7 to 10 feet inside diameter.
Furthermore, the heating tubes were thought to have a length between 8 and 10 feet with
inside diameters ranging between 3A and 1 lA in. Figure 3.9 depicts a typical forced-
circulation evaporator.
59
Reproduced with permission of the copyright owner. Further reproduction prohibited without permission.

* ' I ' - . • k’l ' •• •» • > / . *':m ’: a \
.hy.\>’<• *.♦ • • .
Figure 3.7 Converter (21)
60
Reproduced with permission of the copyright owner. Further reproduction prohibited without permission.

iQOTMjC
£
Figure 3.8 Distillation Tower (78)
61
Reproduced with permission of the copyright owner. Further reproduction prohibited without permission.

3.3.2.8 Heat Exchanger
Figure 3.10 shows a typical shell-and-tube heat exchanger. In this project, a two-pass,
floating-head, shell-and-tube heat exchanger was chosen as the standard for the
knowledge base of the developed system. In this type of exchanger, cold liquid travels
through the inside tubes while hot fluid, gas, or steam runs throughout the cover shell.
Usually, welded steel is used as construction material for the cover shell of the apparatus,
while stainless steel is the choice for the inside tubes.
The heat exchangers have between 80 and 200 tubes of nominal diameters
between 3/4 and 1 lA in. with a 6:1 ratio of tube length to shell diameter.
3.3.2.9 Pipeline
There are literally hundreds of pipeline types employed in the chemical industry to
transport multiple kinds of fluids and gases. As it was impossible to address all of them
here; only pipelines for low pressure gas and low pressure fluid were considered in the
expert system.
For low pressure gas, it is assumed a pipeline of butt-welded wrought iron is used,
capable of standing pressures not exceeding 500 psi, and temperatures lower than 500 ° F.
Such a pipeline is lA to 3/8 in. thick and 3 to 6 in. of inside diameter, permitting a
maximum span of 15 to 21 feet between supports. For low pressure fluid, it is assumed a
ap-welded galvanized wrought iron pipeline, capable of standing a maximum pressure of
200 psi, and temperatures not higher than 450 ° F. The pipeline dimensions are the same
as the ones for the low pressure gas pipeline, although the permissible span between
supports was specified between 12 and 17 feet.
62
Reproduced with permission of the copyright owner. Further reproduction prohibited without permission.

Figure 3.9 Forced Circulation Evaporator (5)
Figure 3.10 Tubular Heat Exchanger (27)
63
Reproduced with permission of the copyright owner. Further reproduction prohibited without permission.

Regarding pipe support hardware and fittings, wrought iron brackets were
considered as roof and wall supports while brick pier support rollers as floor supports.
The pipe fittings were assumed to be screwed or flanged, made out of cast iron, and
capable of operating under pressures of up to 500 psi, and temperatures lower than
750 *F. Figure 3.11 exemplifies the types o f pipe support hardware included in the
research.
3.3.2.10 Reactor
The batch, liquid-to-liquid, closed-vat with stirrer reactor illustrated in Figure 3.12
represents the class of reactors incorporated into the knowledge base of the expert system.
ASTM AS88 grade B steel is commonly used in the manufacturing of such reactors,
which have with 2 to 4 radial-bladed paddle agitators, capable of generating 50 to 100
rpm.
The reactor size considered here are between 7 and 13 feet high, an internal vat
diameter of 6 to 10 feet, a total length of the paddle impeller between 60 and 70% of the
inside diameter of the vessel, and a blade width equal to one seventh of its length.
3.3.2.11 Waste Heat Boiler
Figure 3.13 depicts a kettle waste-heat boiler normally used in medium-sized factories for
water heating or steam generation. Such boilers consist of stationary water contained in
the kettle while a hot fluid, heated by either liquid or gas, runs inside the tubes. Stainless
steel is generally used for both the shell and tubes of the boiler, which under normal
operating conditions can generate between 30,000 and 50,000 Ih/hr of 100 to 150 psig
steam.
64
Reproduced with permission of the copyright owner. Further reproduction prohibited without permission.

Figure 3.11 Fluid and Gas Pipeline (70)
Figure 3.12 Closed Vat Reactor (78)
65
Reproduced with permission of the copyright owner. Further reproduction prohibited without permission.

Figure 3.13 Waste Heat Boiler (64)
66
Reproduced with permission of the copyright owner. Further reproduction prohibited without permission.

3.3.3 Data Recollection on Failure Modes
For each of the eleven chosen pieces of equipment, their most relevant failure modes
were obtained as explained in the previous section. Pertinent literature was reviewed, and
human experts were consulted, when needed. The library sources used for information on
the different failure modes are listed in the references.
In general, the information can be divided into two major groups. The first type
of data was that related to the impact (at the local and system levels) of the specific
failure mode. The second type deals with the possible factors generating or precipitating
the failure mode in question.
3.3.3.1 Failure Modes Effects and Controls
Appendix B contains all the information regarding the local and system effects as well as
suggested controls for each one of the eighty failure modes identified in this research.
The local effects are those consequences associated with the failure of normal
functioning of the particular piece of equipment. Such locals effects also cover the
likelihood or possibility of other failure modes (for the same machine) being precipitated
or aggravated by the failure mode in question. System effects deal with the consequences
at a global level, including the impact that the failure mode has on the functioning and
condition of nearby equipment as well as the quality of the final or intended product.
Other considerations such as noise and vibration contamination, as well as human hazards
are also included in the system effects. Finally, a list of potential preventive controls
such as visual inspection, and other specialized diagnosis tests were included in the study
to complement and enhance the final report to the user.
67
Reproduced with permission of the copyright owner. Further reproduction prohibited without permission.

The local and system effects provide informative maintenance data to the
industrial practitioner, but also are critical criteria for the development of the failure mode
prioritization essential in any RCM program.
3.3.3.2 Factors Responsible for Failure Mode Precipitation
The most important, as well as the most time consuming, endeavor during the knowledge
engineering phase of this project was the identification of the factors thought to be the
most relevant causes for the precipitation and aggravation of each one of the eighty
failure modes considered by the developed expert system.
For each of the eleven machines covered in the study, the corresponding literature
sources were examined and reviewed in detail, distinguishing for every particular failure
mode three classes of precipitating factors:
• Factors considered to have a critical effect in the development of the specific
failure mode. Those were named the “critical factors”.
• Factors considered to have an important inherence in the development of the
specific failure mode. Those were named the “important factors”.
• Factors considered to be somehow related to the development of the specific
failure mode. Those were named the “related factors”.
For any of the identified factors, critical, important, or related, proper limits were
established in order to assess the magnitude of their impact on the evolution of the
different failure modes. For instance, if for a multistage centrifugal compressor, the rotor
speed was found to be an “important” factor for the deformation of the compressor’s
thrust bearings, and lower and upper limits of 3,000 and 20,000 rpm were set
68
Reproduced with permission of the copyright owner. Further reproduction prohibited without permission.

respectively, it would then be implied that for rotor speeds below 3,000 rpm, no
significant impact on the thrust bearings should be expected while for speeds of 20,000
rpm or higher, a maximum impact on the deformation of the thrust bearings is certain.
All critical, important, and related factors identified in this research as well as
their corresponding magnitude limits are listed in Appendix C. The way in which that
information was used for predicting the likelihood of the precipitation of a particular
failure mode under determined working conditions is discussed in the following section.
3.4 The Mathematical Formulation of the System
After reading the process flow chart generated in ASPEN Plus, the expert system
performs two major tasks. It first evaluates all the failure modes involved in the different
machines of the process under scrutiny, detecting those that are likely to precipitate
according to the existing working conditions (called screening); and then prioritizes them
according to the risk that they pose to the system, the working environment, the
operators, and the product being manufactured.
3.4.1 Failure Mode Screening
The failure mode screening methodology developed during this research is based upon
the fuzzification of the effect of the precipitating factors shown in Appendix C. An
approximate reasoning algorithm, consisting of a fuzzy mathematical formulation which
relates the presence of one or more precipitating factors to the development of a specific
failure mode, was created to enable the inference mechanism of the expert system to
determine those failure modes that should be included in the final RCM analysis.
For each failure mode, three different types of precipitating factors were defined:
critical, important and related factors. A critical factor is a situation which impact on the
69
Reproduced with permission of the copyright owner. Further reproduction prohibited without permission.

development of a failure mode can be catalogued as determinant. A critical factor differs
from important and related factors in the sense that its full presence, that is when its
magnitude goes beyond its most extreme limit, guarantees the precipitation or
development of the related failure mode. An important factor is that whose contribution
in the development of the failure mode is substantial although not determinant. A related
factor, on the other hand, is a condition that has been identified with the development of a
failure mode, although its contribution can not be considered as significant.
All identified precipitating factors were expressed as trapezoidal fuzzy numbers
so that their contribution to the development of a particular failure mode of interest could
be quantified as fuzzy numbers between 0 and 1. Let f a be defined as the trapezoidal
fuzzy number representing precipitating factor a for a particular failure mode, then:
t 0 if x does not reach the magnitude limitsf a (x) = < mx + b if x lies between the magnitude limits (3.1)
1 if x lies beyond the magnitude limits
where, .r is the current numeric value of factor a, and mx + b denotes a linear equation
which increases from 0 to 1 as x goes from the less critical magnitude limit to the most
critical one.
Trapezoidal numbers of distinct shapes can be constructed from the fuzzification
of the different precipitating factors since the nature of the magnitude limits will
determine the slope of the resulting numbers. For instance, if for a tubular heat
exchanger the following precipitating factors for “plugged or fouled tubes” have been
defined:
70
Reproduced with permission of the copyright owner. Further reproduction prohibited without permission.

Factor a : High temperature of shell substance {150' F to 800 * F}
Factor b : Low cross flow velocity on shell {15 to 3 feet/second}
Factor c : Acidity or basicity of shell substance {pH: 0 to 4 or 10 to 14}
then, the corresponding fuzzy trapezoidal numbers for factors a, b, and c in accordance to
their magnitude limits would be:
{0 ifx < =150 ° F
f a (x) = ^ O.OOISx-O.23 if 150"F < x < 8 0 0 ’F (3.2)1 if x >= 800" F
{0 if x >= 15 ft/s
f b (x) = ^ -0.083x+1.25 if 15 ft/s > x > 3 ft/s (3.3)1 if x <= 3 ft/s
0.25x-2.5
if 4 <=x <= 10f c (x) = J -0.25x+l if 4 > x > 0 (3.4)
if 1 0 < x < 14 ifx = 0 orx = 4
As it can be seen in Figures 3.14, 3.15 and 3.16, the resulting trapezoidal numbers differ
in their basic shapes; however, their feasible values will always be between 0 and 1.
Having illustrated how the fuzzification of the different precipitating factors is
carried out, the approximate reasoning algorithm devised for screening a particular failure
mode according to its likelihood of development is stated as follows:
71
Reproduced with permission of the copyright owner. Further reproduction prohibited without permission.
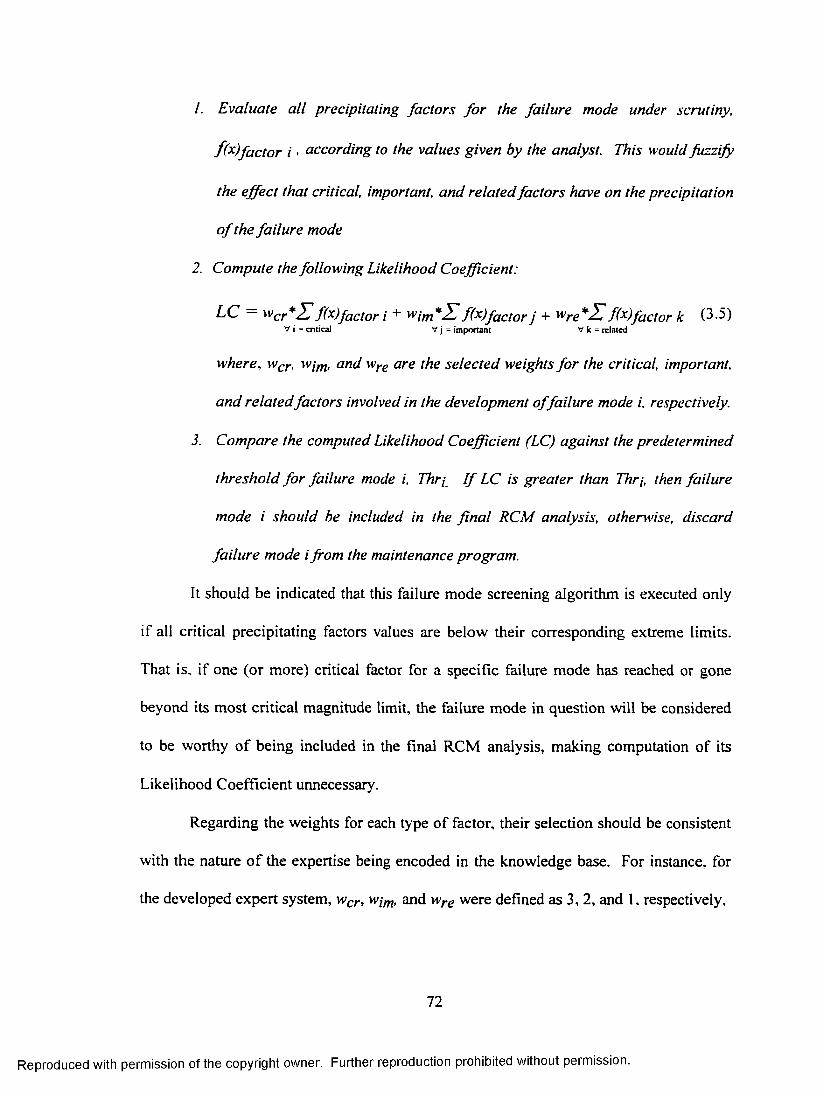
/. Evaluate all precipitating factors fo r the failure mode under scrutiny,
f ( x)factor i - according to the values given by the analyst. This would fuzzify
the effect that critical, important, and related factors have on the precipitation
o f the failure mode
2. Compute the following Likelihood Coefficient:
L C — wcr* Z f(x)factor i + wi m f(x)factor j + wr e * £ f(x)factor k (3-5)V i = critical V j = im portant V k = related
where. wcr, wim> and wre are the selected weights for the critical, important,
and relatedfactors involved in the development o f failure mode i, respectively.
3. Compare the computed Likelihood Coefficient (LC) against the predetermined
threshold for failure mode i, Thrj I f LC is greater than Thr[, then failure
mode i should be included in the final RCM analysis, otherwise, discard
failure mode i from the maintenance program.
It should be indicated that this failure mode screening algorithm is executed only
if all critical precipitating factors values are below their corresponding extreme limits.
That is, if one (or more) critical factor for a specific failure mode has reached or gone
beyond its most critical magnitude limit, the failure mode in question will be considered
to be worthy of being included in the final RCM analysis, making computation of its
Likelihood Coefficient unnecessary.
Regarding the weights for each type of factor, their selection should be consistent
with the nature of the expertise being encoded in the knowledge base. For instance, for
the developed expert system, wcr, wim, and wre were defined as 3, 2, and 1, respectively,
72
Reproduced with permission of the copyright owner. Further reproduction prohibited without permission.

fa(X)
1.00
0.00150 ‘ F 600 *F 8 0 0 'F400'F 10 0 0 'F
Figure 3.14 Fuzzification of Factor “a”
fb(x)
.00
0.003 ft/s 9 ft/s 12 ft/s6 f/s 15 ft/s
Figure 3.15 Fuzzification of Factor “b”
73
Reproduced with permission of the copyright owner. Further reproduction prohibited without permission.

1.00
0.00
Figure 3.16 Fuzzification of Factor “c”
74
Reproduced with permission of the copyright owner. Further reproduction prohibited without permission.

since a critical precipitating factor was thought to contribute 1.5 times more to the
development of a failure mode than an important factor; and an important factor was
assumed to have a failure mode precipitating impact twice as big as that of a related
factor.
The threshold value for a failure mode should represent the minimum amount of
“evidence” that the analyst is willing to accept regarding the prompt manifestation of the
failure mode. This “evidence” is directly associated with the magnitude of the impact of
distinct precipitating factors provoking the failure mode. During this research, a
threshold value of 5 was selected for all the 80 failure modes considered in the
knowledge base. This Thr value is equivalent to the evidence of a fully presented
if(x)factor = 0 critical precipitating factor, along with the full presence of an important
factor {wcr* f(x)factor / + w/m* f(x)factory = 3*1 +2*1 = 5). Although in this project
all Thri's were assigned the same value, this may not always be the case; and another
knowledge domain application may require the selection of distinct Thr values for
different failure modes.
To illustrate how this algorithm is applied by the expert system, the previous
example of the plugged or fouled tubes of a tubular heat exchanger is examined again, but
this time it is assumed that such a failure mode involves one critical precipitating factor,
two important factors, and one related factor as following defined:
Critical Factor 1: High temperature of shell substance {150' F to 800 ° F}
Important Factor 1\ Low cross flow velocity on shell {15 to 3 feet/second}
75
Reproduced with permission of the copyright owner. Further reproduction prohibited without permission.

Important Factor 2: High liquid viscosity on shell {100 to 700 SSU}
Related Factor I : Acidity or basicity of shell substance {pH: 0 to 4 or 10 to 14}
The fuzziciation of critical factor 1, important factor 1, and related factor 1 were
given in equations 3.2, 3.3, and 3.4, respectively. The fuzzy trapezoidal number for
important factor 2 is determined by the expression:
0 ifjc <= 100 SSUfmp.fact.2 (x) = ^ 0.0016x-0.16 if 100 SSU <x < 700 SSU (3.6)
1 if x >= 700 SSU
Now, if during the consultation, the shell fluid was found to be at 300" F, traveling at 12
ft/'s. with a viscosity equal to 650 SSU, and a pH of 3; then the resulting Likelihood
Coefficient of the failure mode under analysis would be:
LC = wcr*f(x)factorj + wjm *(f(x)factor l +f(x)fact0r 2) + Wre*f(x)factor 1 O-L)
LC = 3 * 0.23 + 2 * (0.25+0.92) + I * 0.25
LC = 3.28
Since the computed value of LC is lower than the threshold value of 5, this particular
failure mode would not be included in the final system recommendation. It should be
clear that had the fluid temperature been 900 * F instead of 300 ° F, the failure mode would
have automatically been included in the final RCM analysis report without any further
computation since the shell temperature had been catalogued as a critical factor and
900 * F goes way beyond the critical magnitude limit of 800' F.
76
Reproduced with permission of the copyright owner. Further reproduction prohibited without permission.

3.4.2 Prioritization of Failure Modes
As was discussed in Chapter 2, not all failure modes are created equal, and this
understanding is what distinguishes RCM from other reliability management
methodologies. The expert system carries out the prioritization of the failure modes that
pass the screening phase by assessing the overall risk involved in their precipitation. This
risk assessment analysis is not performed through the use of a decision tree as the
traditional RCM framework usually implies; rather, a fuzzy linguistic scheme was created
to combine practical expertise and possibility theory in the categorization of equipment
failure modes.
The impact of any failure mode can be evaluated from three different effect levels:
• The Local Level. At this level, the consequences of a failure mode are
examined according to the repercussions on the normal functioning of the
machine suffering from the failure, as well as the possibility that other failure
modes could result in the same piece of equipment as a result of a chain effect.
• The Product Level. At the product level, a failure mode is analyzed on the
basis of how badly the product in process is affected by its development.
Here, global effects such as system shutdowns, working environment
conditions, and safety considerations become important issues at the time of
evaluating the failure mode since they have a direct influence on the quality of
the final product.
• The Secondary Failure Level. At this level, all possible repercussions in other
pieces of equipment are analyzed and evaluated. There are two types of
77
Reproduced with permission of the copyright owner. Further reproduction prohibited without permission.
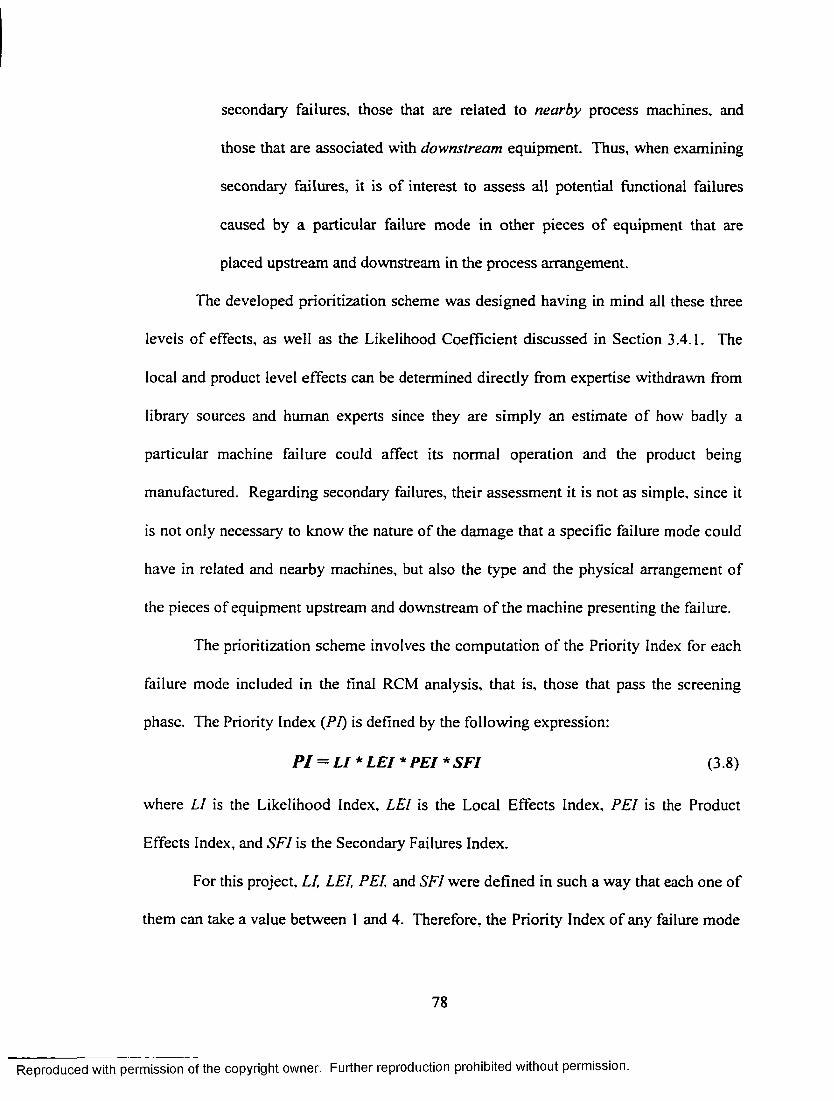
secondary failures, those that are related to nearby process machines, and
those that are associated with downstream equipment. Thus, when examining
secondary failures, it is of interest to assess all potential functional failures
caused by a particular failure mode in other pieces of equipment that are
placed upstream and downstream in the process arrangement.
The developed prioritization scheme was designed having in mind all these three
levels of effects, as well as the Likelihood Coefficient discussed in Section 3.4.1. The
local and product level effects can be determined directly from expertise withdrawn from
library sources and human experts since they are simply an estimate of how badly a
particular machine failure could affect its normal operation and the product being
manufactured. Regarding secondary failures, their assessment it is not as simple, since it
is not only necessary to know the nature of the damage that a specific failure mode could
have in related and nearby machines, but also the type and the physical arrangement of
the pieces of equipment upstream and downstream of the machine presenting the failure.
The prioritization scheme involves the computation of the Priority Index for each
failure mode included in the final RCM analysis, that is, those that pass the screening
phase. The Priority Index (PI) is defined by the following expression:
P I — LI * LEI * PEI * SFI (3.8)
where LI is the Likelihood Index, LEI is the Local Effects Index, PEI is the Product
Effects Index, and SFI is the Secondary Failures Index.
For this project, LI, LEI, PEI, and SFI were defined in such a way that each one of
them can take a value between 1 and 4. Therefore, the Priority Index of any failure mode
78
Reproduced with permission of the copyright owner. Further reproduction prohibited without permission.

can range from 1 (which would imply that the failure mode is just important enough to be
considered in the maintenance program of the plant) to 256 (which would indicate that
the failure mode is excessively critical and deserves all the possible attention and efforts
from the maintenance practitioner for its control or redesign).
3.4.2.1 The Likelihood Index
The Likelihood Index is simply a measure for comparing the threshold value {Thr) of a
particular failure mode against its Likelihood Coefficient. Thus, the Likelihood Index is
defined as:
LI = L C / Thr (3.9)
In essence, the Likelihood Index indicates how many times the Likelihood Coefficient of
a failure mode went over its pre-established threshold value during the screening phase
included in the final maintenance program. As mentioned before, for this study a Thr of
5 was chosen for each one of the eighty failure modes considered in the knowledge base,
and since the highest possible LC turned out to be 20, in this particular application LI can
only take a value between 1 and 4.
3.4.2.2 The Local and Product Effects Indices
Both the Local and Product Effects Indices are obtained directly from the sources of
expertise. They are just a measure of the impact that a failure mode could have on the
specific machine where it originates and on the product.
Such indices were defined according to the following scheme: for a particular
failure mode, a LEI of I was assigned if its potential local effects were found to be small,
79
Reproduced with permission of the copyright owner. Further reproduction prohibited without permission.

a value of 2 if they were catalogued as considerable, 3 if they were thought to be large,
and 4 if they were regarded as extremely detrimental. The same scheme applies to the
PEI.
Appendix C depicts the assigned values for LEI and PEI for all eighty equipment
failure modes covered in this research. It should be stressed again that the assignment of
such values are entirely based on the expertise drawn from relevant literature (see
references). Therefore, the accurateness and validity of such indices depend exclusively
on the quality of the knowledge engineering phase.
3.4.2.3 The Secondary Failures Index
It is important to evaluate how a machine failure mode can impact other machinery
located nearby or downstream in the process flow. The Secondary Failures Index
represents a means for doing that, by taking into consideration the given arrangement of
the production process, and the way in which the failure mode affects the involved pieces
of equipment.
In this research the SFI was defined as:
SFI = I + 1.5 * MaxNear + 1.5 * MaxDown (3.10)
where MaxNear and MaxDown are indicators of the impact that the failure mode has on
nearby and downstream machines. Both of these indicators are determined according to
two important estimators: (1) the magnitude of the nearby or downstream failure mode
effects (NMS or DMS respectively), and (2) the nearby or downstream equipment
susceptibility to the failure mode effects (NES or DES). Thus, for a specific failure mode
MaxNear and MaxDown are determined by the following expressions:
80
Reproduced with permission of the copyright owner. Further reproduction prohibited without permission.
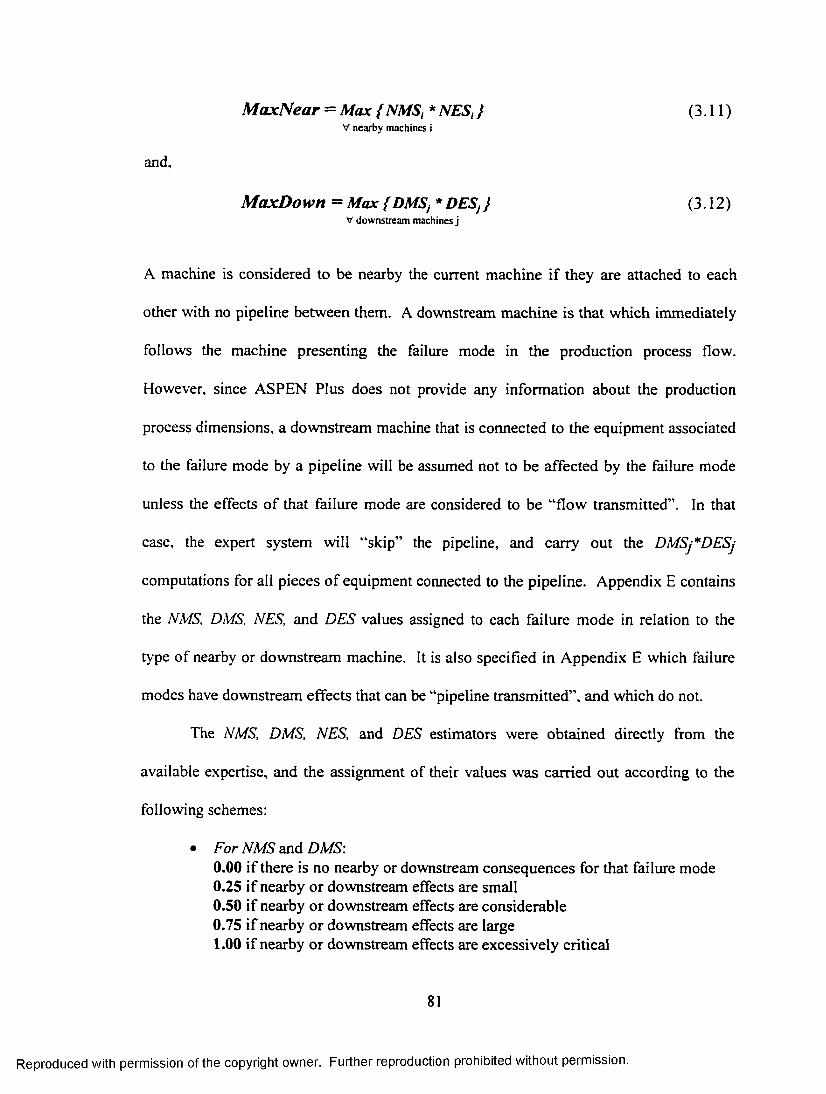
MaxNear = Max { NMS, * NESt} (3.11)V nearby machines i
and,
MaxDown = Max { DMS} * DESj} (3.12)V downstream machines j
A machine is considered to be nearby the current machine if they are attached to each
other with no pipeline between them. A downstream machine is that which immediately
follows the machine presenting the failure mode in the production process flow.
However, since ASPEN Plus does not provide any information about the production
process dimensions, a downstream machine that is connected to the equipment associated
to the failure mode by a pipeline will be assumed not to be affected by the failure mode
unless the effects of that failure mode are considered to be “flow transmitted”. In that
case, the expert system will “skip” the pipeline, and carry out the DMSj*DESj
computations for all pieces of equipment connected to the pipeline. Appendix E contains
the NMS, DMS, NES, and DES values assigned to each failure mode in relation to the
type of nearby or downstream machine. It is also specified in Appendix E which failure
modes have downstream effects that can be “pipeline transmitted”, and which do not.
The NMS, DMS, NES, and DES estimators were obtained directly from the
available expertise, and the assignment of their values was carried out according to the
following schemes:
• For NMS and DMS:0.00 if there is no nearby or downstream consequences for that failure mode0.25 if nearby or downstream effects are small0.50 if nearby or downstream effects are considerable0.75 if nearby or downstream effects are large1.00 if nearby or downstream effects are excessively critical
81
Reproduced with permission of the copyright owner. Further reproduction prohibited without permission.

• For NES and DES:0.00 if the nearby or downstream equipment is not affected by the failure
mode at all0.25 if the nearby or downstream equipment is a little affected by the failure
mode0.50 if the nearby or downstream equipment is considerably affected by the
failure mode0.75 if the nearby or downstream equipment is largely affected by the failure
mode1.00 if the nearby or downstream equipment is critically affected by the failure
mode
The next chapter discuses the engineering design and development of the
computer knowledge based system that was constructed to implement and deliver the
RCM framework here described.
82
Reproduced with permission of the copyright owner. Further reproduction prohibited without permission.

CHAPTER4
DESIGN AND DEVELOPMENT OF THE EXPERT SYSTEM
This chapter discusses the software and hardware platform used in the creation of the
RCM expert system, as well as the system design approach followed during the
implementation of the RCM framework explained in Chapter 3.
4.1 Knowledge Representation Paradigm
Once the information collected during the knowledge acquisition phase was reviewed and
logically organized according to the developed framework, it had to be represented
through the use of a paradigm embedded in the expert system. There are several
paradigms that can be used to represent knowledge. Rules, frames or objects, networks,
and logical predicates are among the most widely used. Rules represent the most popular
of all representation schemes. They are If-Then statements which generate conclusions
once the validity of specific facts (premises) has been verified (6). A frame consists of a
set of slots that contains a group of specifications describing an object, action, or event
(38). Semantic networks represent a group of nodes linked together to form object
relationships. Predicate logic is a kind of formal logic which is used to make
generalizations about propositions based on specific relationships (6).
Nevertheless, although the developer may find a wide range of options, it depends
upon the nature of the knowledge involved which representation paradigm suits best the
system specifications. The developed expert system was designed to access the
likelihood of occurrence for a predetermined set of failure modes. In essence, the system
is designed to store information associated with the precipitation of the failure modes
83
Reproduced with permission of the copyright owner. Further reproduction prohibited without permission.

involved in the process equipment under scrutiny. Once each precipitating factor is
evaluated, the failure modes are screened through the use of an approximate reasoning
scheme. It is then that the final Priority Index is computed for those failure modes found
to be critical enough to deserve consideration.
Therefore, the system does not seek a specific goal or conclusion, as in the case of
most rule-based systems where rules have specific premises designed to lead the
reasoning process to one or another course of action. It utilizes the information contained
in system classes (i.e. failure mode variables) to produce the final RCM output, which is
based upon mathematical and heuristic computations.
Since the intended application involved the processing of exhaustive information
on the relationship of equipment failure modes, causitive factors, and process
arrangement, mutually associated in a heterogeneous way, object oriented programming
was found to be the most appropriate paradigm. This does not mean that it was the only
knowledge representation mechanism that could have been applied to this project.
However, it proved to be efficient in satisfying the computing demands of this research.
4.2 Software and Hardware Platform
The constructed expert system was designed to work on a personal computer. The
following reasons determined this decision:
1. Most companies utilize personal computers as a part of their office equipment.
Thus, no extra expenses will have to be made for implementing the system.
2. The IBM compatible PC version o f ASPEN Plus, the chemical process design
software that is integrated with the developed knowledge based system, is the
most commonly used.
84
Reproduced with permission of the copyright owner. Further reproduction prohibited without permission.

3. The PC environment makes the system portable. It can be loaded onto a
Laptop or Notebook microcomputer and be taken to the floor shop or to
business strategy meetings.
4. PC-based systems can be developed in a windowing environment which made
the expert system very friendly, and increased the aesthetics of its screens.
Therefore, the prototype knowledge base system was delivered on an IBM
compatible Personal Computer with a Pentium processor, a base memory size of 16 MB,
and a hard-disk space of 16 MB.
The software used in this project was selected on the bases of availability, and
versatility in addressing the system requirements. The selected support and application
software is listed as follows:
• Microsoft Windows 95
• LEVEL 5 Object release 3.6
• Microsoft Excel release 7.0
Since objects or frames constituted the chosen knowledge representation
paradigm for this project, an object-oriented expert system shell, or conventional or
symbolic language was needed to implement the system.
An expert system shell is a computer package capable of applying knowledge to a
problem domain. Thus, a shell is a “reasoning” entity containing an empty knowledge
base. A conventional language is a programming language used in conventional
operating systems. It is designed to handle numerical operations only. On the other
85
Reproduced with permission of the copyright owner. Further reproduction prohibited without permission.

hand, a symbolic language has built-in features to aid in building expert systems. It is
primarily designed to handle symbolic processing computations (38).
In this research, a computer software shell was employed for the programming
tasks due to the following two major reasons:
1. The use of a software shell facilitates the programming process, allowing the
developer to spend more time on the knowledge engineering acquisition
phase.
2. Since the developed system represents the initial version, a rapid prototyping
approach was desired.
LEVEL 5 Object is an object-oriented tool with multiple inference strategies in a
flexible windowing environment. It can be integrated with commercial software
programs, and all conventional programming languages. It was mainly chosen because of
its relatively low price, high quality graphics, and versatility in the processing of numeric
computations. Moreover, the graphical user interface of LEVEL 5 Object allowed the
importing of scanned bit-map files required for the graphical illustration needed in the
system.
LEVEL 5 Object was interfaced with Microsoft Excel to access the process
flowsheet data generated by ASPEN Plus. An ASPEN Plus user can export his
application results as a Lotus 123 file, which can then be read by LEVEL 5 Object via
Microsoft Excel.
86
Reproduced with permission of the copyright owner. Further reproduction prohibited without permission.

4.3 System Architecture
Figure 4.1 depicts the architecture of the developed expert system. It consists of three
major components which were constructed on a modular basis: the database, the heuristic
base, and the output generator.
The database contains all the relevant information on the eleven chosen pieces of
equipment. The data included in the database cover the equipment characteristics, local
and system effects of each failure mode, their suggested controls, precipitating factors
and corresponding limits, as well as the assigned PEI, LEI, MMS, DMS, NES, and DES
values needed for carrying out the mathematical computations.
The heuristic base is in charge of compiling the input data originated from
ASPEN Plus, executing the problem-solving process of screening the identified failure
modes and prioritizing them according to their involved risk, and developing the
recommended availability structure diagram. Thus, it is provided with three different
types of heuristics:
1. Heuristics for discerning the types of chemical process equipment involved in
the ASPEN Plus output file,
2. Heuristics for screening the equipment failure modes through the computation
of the Likelihood Coefficient LC, and,
3. Heuristics for determining the final Priority Index for each screened failure
mode through the computation of the Likelihood, Local Effects, Product
Effects, and Secondary Failures Indices.
87
Reproduced with permission of the copyright owner. Further reproduction prohibited without permission.

HEURISTICSBASE
OUTPUTGENERATOR
DATABASE
Figure 4.1 System Architecture
88
Reproduced with permission of the copyright owner. Further reproduction prohibited without permission.

In essence, the heuristics database is responsible for structuring the final system
availability diagram through the firing of if-then statements constructed from drawn
expertise, and the application of pertinent fuzzy reasoning algorithms.
The output generator consists of a series of procedures that create a data file
named “report.out” with the final RCM analysis (see Section 4.4.3). Besides of being
displayed by the system, this text file can be easily edited by any word processor, or
exported to any application software that the user considers convenient.
4.4 Expert Analysis Procedure
The first task of the system is to identify the number and types of machines, as well as
their corresponding positions in the process flowsheet generated by ASPEN Plus. Then it
starts the solving-problem process by questioning the user about the operation conditions
to which such machines are subjected. Through the application of the fuzzy logic
reasoning discussed in Chapter 3, the heuristics base computes the Likelihood Coefficient
for all failure modes involved in the analysis, selecting those which have Likelihood
Coefficients higher than the pre-established threshold values. Once this screening
process its completed, the system computes the Priority Index for each selected failure
mode, and sorts them in descending order according to such indices. Finally, it opens a
data file named “report.out” where the final RCM report is saved for further analysis of
the user.
4.4.1 ASPEN Plus Interface
Figure 4.2 illustrates a typical report generated by ASPEN Plus. The developed expert
system reads the From and To rows of that report, identifying distinct pieces of
89
Reproduced with permission of the copyright owner. Further reproduction prohibited without permission.

equipment, and storing how they are arranged in the production process. That is, given a
specific machine, it identifies nearby and downstream pieces of equipment.
In order for the system to be able to do that, the ASPEN Plus user has to employ
the nomenclature depicted in Table 4.1 as embedded words in the names of his process
machinery. For example, machines HEAT_A, HEAT_B, and HEAT_C contained in the
report shown in Figure 4.2 will be considered as three distinct machines by the expert
system, while it will only recognize a single distillation tower named DIST_TWA,
although that name appears several times in the From and To rows.
Once the interface with ASPEN Plus is done, the system notifies the user the
names of the machines that it identified from ASPEN Plus as shown in Figure 4.3. The
system can handle up to 40 different pieces of equipment.
4.4.2 System Processing
The expert system interfaces with the user through a mouse-driven environment. Help
screens are available to the user. A medium-sized window is opened at the upper-right
comer of the monitor screen (see Figure 4.4) each time the user clicks on the “About”
option of the Help menu.
A consultation starts when the user selects the 123 Lotus file or Excel file
generated by ASPEN Plus where the flowsheet of the process to be analyzed has been
stored (See Figure 4.5). Then, the program begins querying the user on the identified
machines through the utilization of screens prompts. These query screens contain
relevant questions on the operating conditions to which the scrutinized pieces of
equipment are subjected. As seen in Figure 4.6, the analyst inputs the required
90
Reproduced with permission of the copyright owner. Further reproduction prohibited without permission.

Data file created by ASPEN PLUS Rel. 9.1-3 on 21:27:40 Tue Dec 23. 1997Run TD: SOUR Item: STREAM-SUM Screen: Stream- Sum.Main
Display AMMONZA BOT1 COLDFEED HOTFSSD muupn SOUR WATERProm HEAT_A DIST_TWA HEAT_C DISTJTWA HEAT_B
Format: To DISTJIWA HEAT_B DIST_TWA DISTJTWA HEAT_CMIXED LIQUID LIQUID LIQUID LIQUID VAPOR LIQUID
Substream: MIXEDMole Flow KMOL/HR
H20 1.21 3314.88 663.10 2652.42 2652.42 0 .64 3313.67NH3 4.39 4.58 0.92 3 .66 3 .66 0.00 0.18C02 0.00 0.00 0.38 1.53 1.53 1.91 0 . 00H2S 0.10 0.10 0.63 2.54 2.54 3 .06 0 .00NH4 * 0 .00 0.00 0.00 0.00 0.00 0.00 0 . 00NH2COO- 0.00 0.00 0.00 0.00 0.00 0.00 0.00HC02- 0.00 0.00 0.00 0.00 0.00 0.00 o.ooHS- 0.00 0.00 0.00 0.00 0.00 0.00 0.00OH- 0.00 0.00 0.00 0.00 0.00 0.00 0.00C03-- 0.00 0.00 0.00 0.00 0.00 0.00 0.00S- - 0.00 0.00 0.00 0.00 0.00 0.00 0.00H30* 0.00 0.00 0.00 0.00 0.00 0.00 0.00
Total Flow KMOL/HR 5.70 3319.56 665.04 2660.14 2660.14 5.61 3313.86Total Flow KG/HR 100.00 59800.00 12000.00 48000.00 48000.00 200.00 59700.00Total Flow CUM/HR 93.47 €6 .06 12.11 51.92 48 .44 32.63 60-72Temperature C 20.00 158.48 40.00 137.00 40.00 83 .91 60.00Pressure BAR 1.00 6.00 6.00 6.00 6.00 5.00 2 . 00Vapor Frac 0.60 0.00 0.00 0.00 0 . 00 1. 00 0 . 00Liquid Frac 0.32 1.00 1.00 1.00 1.00 0.00 1. 00Solid Frac 0.00 0.00 0.00 0.00 0.00 0 . 00 0 . 00Enthalpy KCAL/MOL -23.83 -65.81 -67.95 -66.19 -67.95 -40.72 -67.68Enthalpy KCAL/KG -1356.56 -3653.44 -3765.52 -3668 .00 -3765.52 -1143.17 -3756.75Enthalpy MMKCAL/HR -0.14 -218.48 -45.19 -176.07 -180.75 -0.23 -224.28Entropy CAL/MOL-K -29.89 -32.25 -30.07 -33.24 -38.07 4.84 -36.98Entropy CAL/'GM'K -1.70 -1.79 -2.11 -1.84 -2.11 0.14 -2 . 05Density KMOL/CUM 0.06 50.25 54.91 51.24 54 .91 0.17 54 .58Density KG/CUM 1.07 905.30 990.82 924.56 990.82 6.13 983.19Average MW 17.54 18.01 18.04 16.04 18.04 35.62 18 .02
Figure 4.2 ASPEN Plus Sample Report
91
Reproduced with permission of the copyright owner. Further reproduction prohibited without permission.

Table 4.1
System Nomenclature
Equipment Type Nomenclature
Burner BURNER
Centrifugal Blower BLOWER
Centrifugal Pump PUMP
Converter CONVERTER
Distillation Tower DISTTW
Evaporator EVAPORATOR
Heat Exchanger HEAT
Multistage Compressor COMPRESSOR
Pipeline PIPE
Reactor REACTOR
Waste Heat Boiler BOILER
92
Reproduced with permission of the copyright owner. Further reproduction prohibited without permission.

n HfIM I x p e i t S y s t e m
■; ’•-■ y- •.•3831. -.iME n n a
The expert system has identified the fo llow ing p ieces o f equipment from your ASPEN Plus application:
HEAT A DIST TWA HEAT C HEAT B
Figure 4.3 Equipment Identification Screen
93
Reproduced with permission of the copyright owner. Further reproduction prohibited without permission.
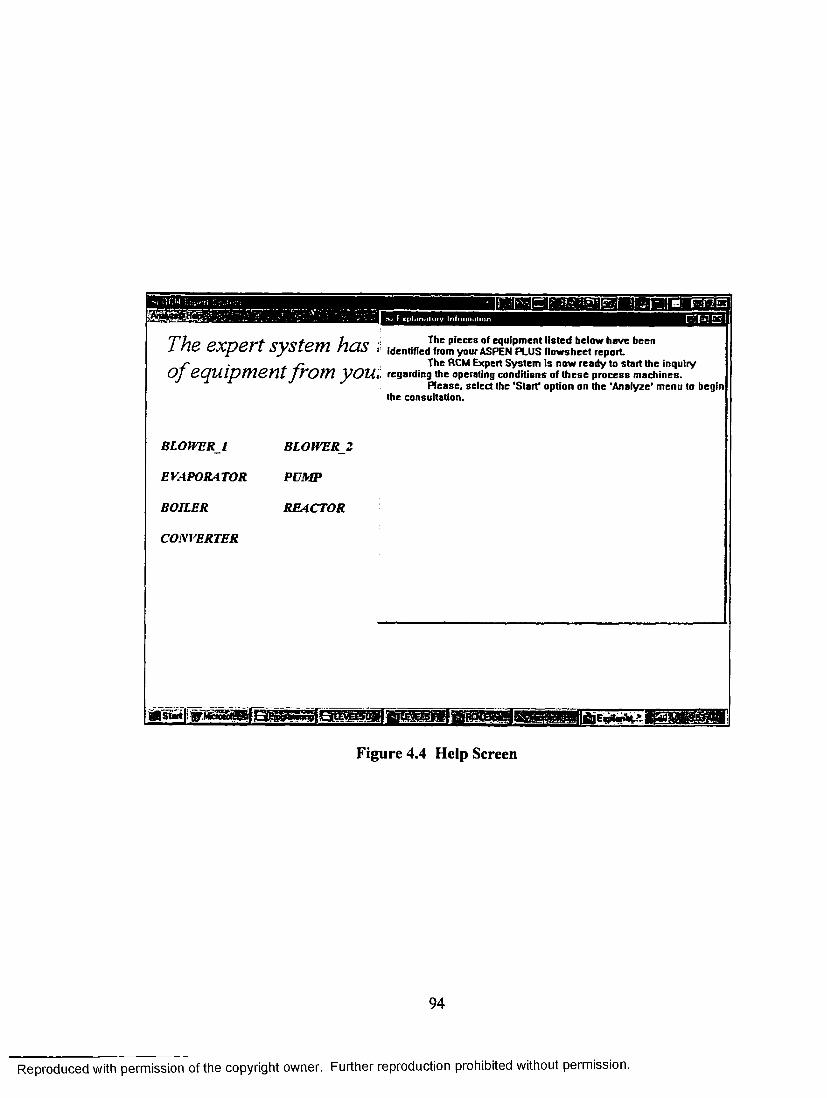
uuauiiui mBpiai WfiBWIBIBBBHBflBffllanaiEiMgqT h o o v n o r t v w t o i m h s r v The p ieces of eq u ip m en t l is te d below h a v e beenL r i e tZ J l f je r I o y z l & r r l riui> i identified from your ASPEN PLUS flo w sh e e t r e p o r t
s' . s ' T he RCM Expert S y s te m Is n o w re a d y to s ta r t th e in q u iryOJ BQlliptneni JV O Y Y l you t - regard ing th e operating co n d itio n s of th e s e p ro c e s s m a c h in e s .e p U r f Ih p 'Qfrtrf* n n f tn n n n Him 'A n a l m a 1 m a n nP le a s e , se lec t th e 'Start* op tion on th e 'Analy2 e ‘ m en u to beg in
th e consu lta tion .
BLOWER_l BLOWER_2
EVAPORATOR PUMP
BOILER REACTOR
CONVERTER
Figure 4.4 Help Screen
94
Reproduced with permission of the copyright owner. Further reproduction prohibited without permission.

information by typing a solicited numeric value in the corresponding prompt boxes. All
query screens are provided with a bit-mapped drawing of the associated machine, as well
as an explanation screen describing the equipment characteristics (see Figure 4.7). The
heuristics base performs the needed fuzzy computations as the user inputs the data, and
initiates the program routines that produce the final availability structure once all the
Priority Indices for the selected failure modes have been computed.
4.4.3 System Output
When the heuristics base has screened and prioritized the most critical failure modes to be
included in the final availability structure diagram, the system opens in the working
directory a text file named report.out, where the system's analysis results are stored. This
text file is displayed and can be printed at the end of the consultation through the
system’s conclusion module as shown in Figure 4.8.
A printout of the results generated during a typical system consultation is shown
in Appendix F. The produced report consists of two major types of information. It first
lists the names of those process machines that were considered by the expert system as
not likely to develop any failure mode. It then depicts all the failure modes found to
deserve attention, sorted in descending order according to their Priority Indices. For each
failure mode shown, the software provides the user with relevant information on the
failure mode’s local and system effects, as well as a listing of suggested controls for its
detection. It also reveals the failure modes corresponding Likelihood, Local Effects,
Product Effects, and Secondary Failures Indices values, so that the analyst can take them
into consideration while developing the process maintenance program.
95
Reproduced with permission of the copyright owner. Further reproduction prohibited without permission.

@Copyright 1997
Figure 4.5 Open File Window
96
Reproduced with permission of the copyright owner. Further reproduction prohibited without permission.

B L O W E R _ l
G as d e n s ity in Ib/cu f t :
G as a b r a s iv e n e s s in g ra in s/cu ft :
H um idity cond itions in X :
G as H 2 S 0 4 partia l p re s s u re in p s ia :
G as C 02 partial p re s su re in p s ia :
P re s s u re h ead in p s i :
In let bell tem p era tu re in F :
R otor s p e e d in rpm:
Figure 4.6 Query Screen
97
Reproduced with permission of the copyright owner. Further reproduction prohibited without permission.

-v. F x p h m - r i l o i y I n l u r m u l m n
B L O W E R _ l
G as d e n s ity in Ib/cu f t :
G as a b ra s iv e n e s s in g ra ins/cu f t :
H um idity conditions in % :
G as H 2 S 0 4 partial p re s s u re in p sia :
G as C 02 partial p re s su re in p s ia :
P re s s u re h ead in p s i :
Inlet bell tem pera tu re in F :
R otor sp e e d in rpm:
Ee:eEEEE
E
BLOWER
T ype:- Centrifugal
M axim um O perating Capacity:- B etw een 8000 and 11000 cu.ft/m in
M otor S ize :- B etw een 100 to 250 hp
C onstruction M aterials:- S tee l h ousig- S ta in le s s s te e l w heel- R u b b er s e a ls
D ev e lo p ed P re s s u re s :- B etw een 1 and 4 p si
Figure 4.7 Equipment Characteristics Information Screen
98
Reproduced with permission of the copyright owner. Further reproduction prohibited without permission.

R C M CHEMICAL PROCESS EXPERT SYSTEM
Project Name: SOURXLS
//////// CRITICAL FAILURE M ODES W.MV
Priority Index: 16 [ LL4, LEL2, PEL2, SF L l]DIST TWA <>Plugged or Corroded Distributor.
Local Effects:- Fluid contamination
Reduced tow er efficiency Poor liquid distribution Possible inappropriate column flooding
Figure 4.8 Conclusion Screen
99
Reproduced with permission of the copyright owner. Further reproduction prohibited without permission

4.5 Validation of the System
During recent years, several frameworks have been developed for the validation of
knowledge based systems. Although validation researchers have struggled to discover
the ultimate approach, there is not yet sufficient evidence to determine which approaches
are more effective, or even which ones are reliable (4).
Systems similar to the one developed here are normally validated through the
evaluation of test scenarios obtained from the available literature. The validity of such
systems are determined by comparing the systems’ results with the actual results reported
in the literature. However, the knowledge involved in this research is still unfamiliar to a
large sector of the industry since it requires the understanding of precipitating factors and
related interdependencies that are fuzzy in nature and intrinsically complex.
Therefore, the validation process employed in this project consisted of using the
same experts from whom the knowledge was gathered to evaluate the performance of the
system. As stated by Ayel and Laurent (1991), there are three advantages of using this
approach:
1. Since the expert has been a part of the project, there is no major discrepancies
between his expertise and the knowledge contained in the knowledge base.
2. Since the expert knows the kind of problems that falls within the knowledge
boundaries o f the system, he can select the appropriate scenarios to be used in
the validation process.
3. The expert is accessible.
Hence, the qualitative validation of the constructed RCM expert system was
carried out through the performance of a face validation conducted by the domain
100
Reproduced with permission of the copyright owner. Further reproduction prohibited without permission.

experts, followed by a predictive validation. The rest of this chapter is devoted to the
explanation of these validation techniques.
4.5.1 Face Validation
During a face validation, the domain expert reviews the developed system, and comments
on its performance. For a prototype system, like the one constructed during this study, a
face validation is appropriate to determine whether the system satisfies all functional
specifications, as well as to detect any possible flaws of the system.
The RCM expert system was presented to the domain experts headed by Mr.
Marco Araya, a current researcher and doctoral candidate in chemical engineering at the
University of Alabama who has more than three years of experience as a process engineer
for BASF, for their critique. Fictional cases were executed to demonstrate the system’s
performance as an analytical tool.
This validation process consisted of two major parts, the development of
individual test cases for each of the eleven pieces o f equipment considered by the system,
and the development of test cases with process flowsheets comprising at least three
different industrial machines. Regarding the individual test cases, ten to fifteen distinct
scenarios were created for each machine type. Several working conditions were
simulated, and the generated RCM analysis reports were carefully examined by the
experts. The process test cases involved the construction of fictional scenarios where
three to six machines were linked together. The main purpose of such test cases was to
assess the performance of the expert system when estimating secondary failure effects.
101
Reproduced with permission of the copyright owner. Further reproduction prohibited without permission.

Out of the ten processes discussed in Section 3.3.1, only the sulfuric acid and
nitric acid processes could be fully evaluated by the expert system during the validation
phase. The other eight chemical processes comprise equipment not included in the
knowledge base of the system. Nevertheless, the following equipment arrangements
were used during the validation of the system (the machines are listed in downstream
order):
• Burner, Waste Heat Boiler, Converter, Blower, and Heat Exchanger
• Compressor, Distillation Tower, Heat Exchanger, and Pump
• Reactor, Pipe, Pump, and Evaporator
• Blower, Pipe, Reactor, Distillation Tower, and Pump
• Centrifugal Compressor, Burner, Blower, and Waste Heat Boiler
• Converter, Pump, Burner, Blower, Pipe, and Reactor
In general, the experts gave favorable feedback (see Appendix G). The system’s
query methodology was rated by the experts as effective in capturing the most relevant
factors affecting the normal functioning of the process machinery. Moreover, the
conclusions reached at the end of most of the consultations were regarded as satisfactory.
Nevertheless, the experts expressed their concerns with the way in which factors
such as the atomizing air rate for the burner, catalyst pH for the converter, liquid feed rate
for the distillation tower, rotor speed for the reactor, and water pH for the waste heat
boiler were classified and weighted by the system. Moreover, some employed technical
terms such as distillate substance (instead of leaving liquid) and fe d liquid (instead of
feeding liquid) for the distillation tower query were catalogued as “erroneous” by the
102
Reproduced with permission of the copyright owner. Further reproduction prohibited without permission.

experts. They also objected the selection of the C 02 environment as the only corrosive
environment considered by the system for determining gas corrosivity.
In response to their criticisms, the identified precipitating factors were re
classified and their corresponding weights changed according to the experts’
expectations, the technical terms used in the different modules of the system reviewed
and modified in accordance to the technical language used in the chemistry field, and the
H2S04 corrosive environment incorporated into the system’s analytical procedure.
Finally, the prototype system was shown to Mr. Ricardo Mora, a maintenance
engineer at DSM Shessield Plastics, located in Pittsfield, Massachusetts. Mr. Mora, who
did not take part in the knowledge engineering phase of this research, utilized the expert
system to individually analyze the operating conditions of blowers, compressors, pumps,
and heat exchangers normally employed in the plant. His comments of the system’s
responses were also favorable. He indicated that the failure modes revealed by the expert
system were common, and did precipitate with a relatively high frequency in the plant.
103
Reproduced with permission of the copyright owner. Further reproduction prohibited without permission.

CHAPTER 5
CONCLUSIONS AND FUTURE RESEARCH
5.1 Comments on This Research
This work has focused on the development of a innovative new framework for the
implementation of reliability centered maintenance in industrial settings. The main
means used for reaching such a goal was the creation of a computer expert system that
successfully embodied both relevant maintenance and equipment expertise, and efficient
approximate reasoning techniques. Thus, the final product of this study was a versatile
knowledge-based system for the application of RCM in the chemical industry. Although
the chemical process industry was selected as the application domain for this research, the
developed RCM framework postulated here was designed to be implemented in all the
maintenance activity spectrum regardless of the type of industry. Therefore, it is
encouraged to use this RCM methodology in other manufacturing areas such as the
automotive, metallurgic, power, and aviation industries among others.
This work represents a pioneer effort in automating the implementation of RCM
via an intelligent computer system. This study has also incorporated a technique that has
proven successful in other areas of knowledge, fuzzy reasoning, in the evaluation and
assessment of equipment failure modes. Finally, an alternative to the traditional RCM
decision tree for prioritizing failure modes was presented through the development of the
Priority Index, which not only takes into account the relevancy of the failure modes local
and product effects, but also their likelihood of occurring as well as associated negative
consequences on adjacent machinery.
104
Reproduced with permission of the copyright owner. Further reproduction prohibited without permission.

5.2 Key Contributions
The completed research substantially contributes to the area of equipment maintenance
management. First, it provided industrial practitioners with a versatile tool for estimating
possible machine failure occurrences. This tool enables them to better comprehend the
complexity of failure mode interdependencies and devise appropriate reliability
maintenance strategies. Second, the study produced an innovative new framework for
Reliability Centered Maintenance, which can be characterized by the flexibility typical of
computer based knowledge systems. Finally, the utilization of approximate reasoning in
both the screening and prioritization of distinct equipment failure modes represents an
extension of the available knowledge in reliability management. It brings a better
understanding of the mechanics involved in equipment reliability and maintainability
through a new technique for failure mode analysis and functional interdependency
assessment.
With respect to the chemical process industry, a new chapter in the analysis and
evaluation of failure mode precipitating factors was written through the quantification
and fuzzification of critical, important, and related factors for each one of the eighty
failure modes under scrutiny. However, the most important benefit resulting from this
research is the eventual implementation o f prototype expert systems built according to the
methodology here developed, which will lead to the propagation of equipment
maintenance expertise to industrial settings. Process engineers will be able to reduce
production losses by properly detecting and addressing potential failures of key pieces of
equipment early in the production process designing stages, or as a complementary
105
Reproduced with permission of the copyright owner. Further reproduction prohibited without permission.

reliability centered maintenance tool to their conventional maintenance management
strategies when historical records of machinery malfunctions are available.
5.3 Recommendations for Future Research
This work can be extended through the implementation of any or all of the following
recommendations:
• The developed expert system could be provided with a learning capability to
improve the accuracy of its final output. When discrepancies exist, the user
should be allowed to indicate what specific failure modes he was expecting to
see in the final availability structure diagram. Then, the system’s learning
engine should alter the corresponding precipitating factors weights and
magnitude limits in such a way that the output of the failure mode screening
phase could meet the expert’s expectations.
• More research is needed to develop a more realistic precipitating factor
fuzzification process. During this study, linear fuzzification was assumed
since, according to the available literature, it is a widely used practice that has
shown to yield acceptable results. Nevertheless, there is no guarantee that the
effect of a particular failure mode linearly increases as its critical limits are
reached. An exponential, logarithm, or normal distribution, just to give
examples, may describe more accurately the behavior of this factor effect-limit
relationship.
• While determining the different failure mode Priority Indices, the dimensions
of the production process should be taken into account in the analysis. In this
106
Reproduced with permission of the copyright owner. Further reproduction prohibited without permission.
study, only adjacent pieces of equipment were considered when assessing
secondary failure effects. However, this should be a function of the distances
between the machine presenting the failure mode, and all other process
equipment.
• Regarding the assignment of threshold values for failure mode screening, such
values could be defined as varying terms associated to the factors precipitating
the failure modes. Hence, instead of a fixed threshold value as the one
assumed in this research, a mathematical model or function should be defined
for determining such failure mode threshold values according to the number of
precipitating factors involved, and their corresponding weights and magnitude
limits.
• A back propagation neural network could be embedded into the system to
assist the experts in the classification of precipitating factors, and in the
assignment of their associated weights, so that more accurate knowledge can
be added to the system. Three types of precipitating factors were defined in
this study: critical, important, and related factors; however, for other
applications, such a classification may be inappropriate. Thus, if machine
failure records exist where operational conditions have been registered, a
neural network model could be employed to help in the clustering of identified
precipitating factors, and in the assessment of the magnitude which such
factors influence the precipitation of the distinct equipment failure modes.
107
Reproduced with permission of the copyright owner. Further reproduction prohibited without permission.

• Finally, crisp magnitude limits were adopted here for each one of the
identified failure mode precipitating factors. However, there may be some
cases where fuzzy rather than crisp limits might be more appropriate and
realistic. When fuzzy limits are assumed for a particular precipitating factor,
its resulting trapezoidal number will differ from the ones defined in this
research since there will be not any abrupt rise or fall of the factor-effect
function once the limits are encountered. Instead, a smooth curve should
characterize the fuzzified function.
108
Reproduced with permission of the copyright owner. Further reproduction prohibited without permission.

REFERENCES
1. AIChE Equipment Testing Procedure, 1990, Packed Columns: A Guide To Performance Evaluation (New York: American Institute of Chemical Engineers).
2. ASME Boiler and Pressure Vessel Code Section VII, 1971, Recommended Rules For Care o f Power Boilers (New York: The American Society of Mechanical Engineers).
3. "ASPEN PLUS”. 1994. http:// www.aspentec.com/products/sofitware/aspenplus.html October 1996).
4. Ayel, M., and Laurent, J. P., 1991, Validation, Verification and Test o f Knowledge- Based Systems (England: John Wiley & Sons).
5. Badger, W.L., and Seavoy, G.E., 1945, Heat Transfer and Crystallization (Harvey, Illinois: Swenson Evaporator Company).
6. Badiru, A., 1992, Expert Systems Applications in Engineering in Manufacturing (New Jersey: Prentice Hall).
7. Barcons I Ribes, C., 1991, “Equipment Characterisation”, In Safety o f Chemical Batch Reactors and Storage Tanks (Brussels: Kluwer Academic Publishers), 99-124.
8. Bloch, H.P., 1994, "How and Why Centrifugal Pumps Continue to Fail”, Chemical Engineering, 101, 122-125.
9. Bloch, H.P., and Geitner, F.K., 1985, Major Process Equipment Maintenance and Repair (Houston: Gulf Publishing Company).
10. Boyce, M.P., 1981, “Centrifugal Compressors”, In Air Movement and Vacuum Devices (Westport, Connecticut: Technomic Publishing Co.), 88-173.
11. Brown, R.N., 1986, Compressors: Selection & Sizing (Houston: Gulf Publishing Company).
12. “Calibration of an Integrated Model for Prediction of Corrosivity of C 02/H2S Environments”. 1996. http://www.intercorr.com/intercorr/techsess/papers/session7 /abstracts/vamshi.html (25 November 1997).
13. Campos, M.C., and Rodrigues, P.S., 1990, “Program Finds Centrifugal Compressor Operating Point”, Hydrocarbon Processing, September, 47-48.
14. Chenier, P.J., 1992, Survey o f Industrial Chemistry 2n<- (Eau Claire, Wisconsin: VCH Publishers, Inc.).
109
Reproduced with permission of the copyright owner. Further reproduction prohibited without permission.

15. Clark, E., and Littlefield, D., 1994, “Maximize Centrifugal Pump Reliability”. Chemical Engineering, 101, 90-94.
16. Considine, D.M., 1974, Chemical and Processes Technology Encyclopedia (New York: McGraw-Hill, Inc.).
17. “Evaluation of Geothermal Production for Sulfide Stress Cracking and Stress Corrosion Cracking”. 1996. http://www.intercorr.com/intercorr/techsess/papers /session6/abstracts/rdkssc.html (25 November 1997).
18. Dahlberg, S., 1996, “Software for Reliability Centered Maintenance Analysis”, Maintenance Technology, June, 42.
19. Deitz, D., 1995, “Expert Systems for More Efficient Power Plants”, Mechanical Engineering, 117:3,28.
20. Dhillon, B., Reiche, H., 1985, Reliability and Maintainability Management (New York: Van Nostrand Reinhold).
21. Duecker, W.W., and West, J. R., 1959, The Manufacture o f Sulfuric Acid (New York: Reinhold Publishing Corporation).
22. "Corrosivity Prediction and Assessment for C 02/H,S Production Environments”. April 1997. http://www.intercorr.eom/l 1 prev/crsvt.htm (25 November 1997).
23. Fairlie, A.M., 1936, Sulfiiric Acid Manufacture (New York: Reinhold Publishing Corporation).
24. Faulkner, E.A., 1987, Guide to Efficient Burner Operation: Gas, Oil, and Dual Fuel (Lilbum, Georgia: The Fairmont Press, Inc.).
25. Field, E.M., 1969, Oil Burners (Indianapolis, Indiana: Theodore Audel & Co.).
26. Fox, B.H., Snyder, M.G., and Smith, A.M., 1994, “Reliability-Centered Maintenance Improves Operations at TMI Nuclear Plant”, Power Engineering, November, 75-78.
27. Fraas, A.P., 1989, Heat Exchanger Design, 2n< edition (New York: John Wiley & Sons Inc.).
28. Frankel, M., 1996, Facility Piping Systems Handbook (New York: McGraw-Hill, Inc.).
29. Garret-Price, B.A., et al., 1985, Fouling o f Heat Exchangers: Characteristics, Costs, Prevention, Control, and Removal (New Jersey: Noyes Publications).
110
Reproduced with permission of the copyright owner. Further reproduction prohibited without permission.

30. Godse, A.G., 1995, “Improve Reliability of Liquid Film Shaft Seals”, Hydrocarbon Processing, August, 143-149.
31. “HAZARD COMMUNICATION”. 1996. http://www.chemreport.com/demo.htmI. July 1997).
32. Heintzelman, J.E., 1976, The Complete Handbook o f Maintenance Management (New Jersey: Prentice Hall).
33. Henley, E., and Kumamoto, H., 1981, Reliability Engineering and Risk Assessment (New Jersey: Prentice Hall).
34. Higgins, L.R., 1988, Maintenance Engineering Handbook, 4nc edition (New York: McGraw-Hill Inc.).
35. Hipkin, I.B., and Lockett, A.G., 1995, “A Study of Maintenance Technology Implementation”, International Journal o f Management Science, 23:1, 79-88.
36. Humphrey, D.E., 1990, “Maintenance Systems and Maintenance Audits”, Salford University Maintenance Research University Seminar.
37. Idhammar, C., 1995, “Developing Your Maintenance Organization Toward World- Class, VI”, Pulp and Paper, 69:3, 41.
38. Ignizio, J.P., 1992, Expert Systems Applications in Engineering in Manufacturing (New Jersey: Prentice Hall).
39. Jardine, A.K.S., 1973, Maintenance, Replacement, and Reliability (New York: John Wiley and Sons Inc.).
40. Kandel, A., 1986, Fuzzy Mathematical Techniques with Applications (California: Addison-Wesley Publishing Co.).
41. Karassik, I.J., et al., 1986, Pump Handbook, 2nd edition (New York: McGraw-Hill, Inc.).
42. Karassik, I.J., 1981, Centrifugal Pump Clinic (New York: Marcel Dekker, Inc.).
43. Karwowski, W., and Mital, A., 1986, “Potential Applications of Fuzzy Sets in Industrial Safety Engineering”, Fuzzy Sets and Systems, 19, 105-120.
44. Kaufmann, A., and Gupta, M.M., 1988, Fuzzy Mathematical Models in Engineering and Management Science (The Netherlands: North-Holland).
I l l
Reproduced with permission of the copyright owner. Further reproduction prohibited without permission.

45. Kent. J.A., 1974, Riegal’s Handbook o f Industrial Chemistry (New York: Ban Nostrand Reinhold).
46. Klir, G., and Yuan, B., 1995, Fuzzy Sets and Fuzzy Logic (New Jersey: Prentice Hall).
47. Klein, R., and Klopp, G.T., 1992, “The Human Factors Impact of an Expert System Based Reliability Centered Maintenance Program”, Proceedings o f the IEEE Fifth Conference on Human Factors and Power Plants, 241 -244.
48. Knapp, G.M., 1995, I.E.7490 Advanced Engineering Maintenance Management: Class Notes (Louisiana State University), Fall.
49. Kobbacy, K.A.H., Proudlove, N.C., and Harper, M.A., 1995, "Towards An Intelligent Maintenance Optimization System”, Journal o f the Operation Research Society, 46, 831-853.
50. Kobbacy, K.A.H., 1992, “The Use of Knowledge-Based Systems in Evaluation and Enhancement of Maintenance Routines”, international Journal o f Production Economics, 24, 243-248.
51.Kunii, D., and Levenspiel, O., 1969, Fluidization Engineering (New York: John Wiley & Sons, Inc.).
52. Labath, N., 1991, “Risk Assessment Methodologies”, In Safety o f Chemical Batch Reactors and Storage Tanks (Brussels: Kluwer Academic Publishers), 147-160.
53. Lieberman, N.P., and Lieberman, E.T., 1997, A Working Guide to Process Equipment (New York: McGraw-Hill, Inc.).
54. Lieberman, N.P., 1983, Process Design for Reliable Operations (Houston: Gulf Publishing Company).
55. Liu, Y.A., et al., 1987, Recent Developments in Chemical Process and Plant Design (New York: John Wiley and Sons Inc.).
56. MacDougal, I., and Elder, R.L., 1983, “Simulation of Centrifugal Compressor Transient Performance for Process Plant Applications”, Journal o f Engineering for Power, 105, 885-890.
57. MacGregor, D.G., 1993, “Workstations Designs for Reliability Centered Maintenance Decision Support”, Proceedings on the Fifth International Conference on Human- Computer Interaction, 1, 80-85.
112
Reproduced with permission of the copyright owner. Further reproduction prohibited without permission.

58. Malfaro, W.J., 1993, “Using Fuzzy Logic to Estimate Remaining Life and Evaluate Renovation Options for Distribution Substation Equipment”, Proceedings o f the International Conference and Exhibition for the Electrical Power Research Institute,18.
59. Mamdani, E.H., and Gaines, B.R., 1981, Fuzzy Reasoning and Its Applications (New York: Academic Press).
60. Mann, L., 1983, Maintenance Management (Massachusetts: Lexington Books).
61. Marlow, R.E., 1981, “Inspection of Heat Exchangers in the Field”, In Shell and Tube Heat Exchangers (Metal Park, Ohio: American Society for Metals), 207-224.
62. Martorell, S., Munoz, A., and Serradell, V., 1995, “An Approach to Integrating Surveillance and maintenance Tasks to Prevent the Dominant Failure causes of Critical Components”, Reliability Engineering and System Safety, 50, 179-187.
63. McCabe, W.L., and Smith, J.C., 1956, Unit Operations of Chemical Engineering (New York: McGraw-Hill, Inc.).
64. Mead, W.J., 1964, The Encyclopedia o f Chemical Process Equipment (New York: Reinhold Publishing Corporation).
65. Meisner, H.P., 1981, Process and Systems in Industrial Chemistry (New Jersey: Prentice Hall).
66. Meyers, R.A., 1986, Handbook o f Chemicals Production Processes (New York: McGraw-Hill, Inc.).
67. Miller, F.D., Rowland, J.R., and Siegfried, E.M., 1986, “ACE: An Expert System for Preventive Maintenance Operations”, Record, January, 20-25.
68. Minton, P.E., 1986, Handbook o f Evaporation Technology (New Jersey, Noyes Publications).
69. Misra, K.B., Weber, G.G., 1990, “Use of Fuzzy Set Theory for Level-1 Studies in Probabilistic Risk Assessment”, Fuzzy Sets and Systems, 37, 139-160.
70. Molloy, E., 1941, Pipes and Valves (Brooklyn: Chemical Publishing Company, Inc.).
71. Morrow, L.C., 1966, Maintenance Engineering Handbook (New York: The Macmillan Company).
72. Moussas, C. 1991, “Control Techniques”, In Safety o f Chemical Batch Reactors and Storage Tanks (Brussels: Kluwer Academic Publishers), 160-200.
113
Reproduced with permission of the copyright owner. Further reproduction prohibited without permission.
73. Muhlbauer, W.K., 1996, Pipeline Risk: Management Manual, 2n< edition (Houston: Gulf Publishing Company).
74. Nepa, W.A., and Urwin, R.J., 1993, "‘Centrifugal Pump Failure Analysis”, Plant Engineering, 47, 56-58.
75. Nisenfeld, A.E., and Seemann, R.C., 1981, Distillation Columns (North Carolina: Instrument Society of America).
76. Owen, J.V., 1994, “Next Generation R&M”, Manufacturing Engineering, April, 45-50.
77. Panesar, K.S., 1981, “Fans and Blowers”, In Air Movement and Vacuum Devices (Westport, Connecticut: Technomic Publishing Co.), 1-38.
78. Paruit, B.H., 1982, Illustrated Glossary o f Process Equipment (Houston: Gulf Publishing Company).
79. Pelaez, E., Bowles, J., 1994, “Using Fuzzy Logic for Systems Criticality Analysis”, Proceedings o f the 1994 Reliability and Maintainability Symposium, 449-455.
80. “Petrochemical Processes ‘ 97: A Special Report”, Hydrocarbon Processing, 76:3, March, 103-166.
81. Perry, R.H., and Chilton, C.H., 1973, Chemical Engineer's Handbook, 51 edition (New York: McGraw-Hill, Inc.).
82. Protopapas, C.A., Kaminaris, S.D., Machias, A.V., and Papadias, B.C., 1990, “An Expert System for Fault Repairing and Maintenance of Electric Machines”, IEEE Transactions on Energy Conversions, 5:1, January, 79-83.
83. Puyear, R.B., 1981, “Materials Selection Criteria for Shell and Tube Heat Exchangers for Use in the Process Industries”, In Shell and Tube Heat Exchangers (Metal Park, Ohio: American Society for Metals), 95-100.
84. Raghavan, R., 1993, “Advanced Plant Maintenance and Surveillance System for the Nuclear Power Plants of the Next Century”, Proceedings o f the 2ne ASME JSME Nuclear Engineering Joint Conference, 2, 693-697.
85. Reigel, E.R., 1974, Riegel's Handbook o f Industrial Chemistry (New York: Van Nostrand Reinhold Co.).
86. Reigel. E.R., 1953, Chemical Process Machinery (New York: Reinhold Publishing Corporation).
114
Reproduced with permission of the copyright owner. Further reproduction prohibited without permission.

87. Ross, T.J., 1995, Fuzzy Logic With Engineering Applications (New York: McGraw- Hill, Inc.).
88. Shimizu, S., Sugawara, M., Sakurai, S., Mori, T., and Saikawa, K., 1993, “Decision- Making Support Systems for Reliability-Centered Maintenance”, Journal o f Nuclear Science and Technology, 30:6, 505-515.
89. Shreve, R.N., 1956, The Chemical Process Industries (New York: McGraw-Hill, Inc.).
90. Shvartz, G.L., and Kristal, M.M., 1959, Corrosion o f Chemical Apparatus (New York: Consultants Bureau, Inc.).
91. Simpson, P., 1995, “Fuzzy Neural Network Machine Prognosis”, Proceedings o f the SPIE-The International Society for Optical Engineering, 2493, 21-27.
92. Slany. W., 1994, “Fuzzy Expert System for Maintenance Interval Prediction”, Computers and Chemical Engineering, 18, S155-S159.
93. Smith, A.M., 1993, Reliability-Centered Maintenance (Toronto: McGraw-Hill, Inc.).
94. Smith, P.R., and Van Laan T.J., 1987, Piping and Pipe Support Systems (New York: McGraw-Hill, Inc.).
95. Smock, R.W., 1993, “A Comprehensive Look at Reliability-Centered Maintenance”, Power Engineering, October, 12.
96. Snee, T.J., 1991, “Runaway Reactions: A Case Study”, In Safety o f Chemical Batch Reactors and Storage Tanks (Brussels: Kluwer Academic Publishers), 371-390.
97. Steibly, R.L., 1995, “Development of PM and RCM Programs”, AIPE Facilities, 22:4,31-33.
98. Stocchi, E., 1990, Industrial Chemistry (Chichester, England: Ellis Horwood Limited).
99. Suresh, P.V., 1994, “Fuzzy Set Approach to Select Maintenance Strategies for Multistate Equipment”, IEEE Transactions on Reliability, 43:3, 451-456.
100. Sutton, S., 1995, “Integrated Management Systems Improve Plant Reliability”, Hydrocarbon Processing, January, 63-66.
101. Tarhan, M.O., 1983, Catalytic Reactor Design (New York: McGraw-Hill, Inc.).
102. The 1993 Maintenance Information Systems Survey, Maintenance, 8:3, 18-35.
115
Reproduced with permission of the copyright owner. Further reproduction prohibited without permission.
103. Thielsch, H., 1966, Defects and Failures in Pressure Vessels and Piping (New York: Reinhold Publishing Corporation).
104. Tomic, B., 1993, “Risk Based Optimization of Maintenance-Methods and Approaches”, Proceedings o f the 1993 European Safety and Reliability Conference on Safety and Reliability Assessment, Amsterdam, 17, 135-143.
105. Tomsovic, K., and Baer, B., 1996, “Methods of Approximate Reasoning for Power System Equipment Condition and Reliability Analysis”, Proceedings o f the International Conference on Intelligent Systems Applications to Power Systems, 1:476,310-315.
106. Tomsovic, K., 1994, “On Refining Equipment Condition Monitoring Using Fuzzy Sets and Artificial Neural Nets”, Proceedings o f the International Conference on Intelligent System Application to Power Systems, 1, 363-370.
107. Vnat, J., Hokstad, P., and Bodsberg, L., 1996, “An Overall Model for Maintenance Operation”, Reliability Engineering & System Safety, 51:3, 241-57.
108. Van Den Berg, P.J., and deJong, W.A., 1980, Introduction to Chemical Process Technology (Dordrecht Holland: D. Riedel Publishing Co.).
109. Wade, C.F., 1954, Industrial Boiler-House Efficiency {London: Crosby Lockwood and Son, Ltd.).
110. Webber, J„ 1993, “The Application of Expert Systems for Failure Modes, Effects and Criticality Analysis”, Proceedings Advances in Logistics International Symposium, July, A2-A12.
111. Westerterp, K.R., van Swaaij, W.P.M., and Beenackers, A.A.C.M., 1984, Chemical Reactor Design and Operation (The Netherlands: John Wiley & Sons Ltd.).
112. Worledge, D., 1993, “A Breakthrough in reducing RCM Costs”, Nuclear News, 36, 41-45.
113. Worledge, D., 1993, “Nuclear Industry Embraces Reliability-Centered Maintenance”, Power Engineering, July, 25-28.
114. Yuan, Y., 1991, “Criteria for Evaluating Fuzzy Rankings Methods”, Fuzzy Sets and Systems, 43, 139-157.
115. Zadeh, L.A., 1987, Fuzzy Sets and Applications: Selected Papers by L.A. Zadeh (New York: John Wiley & Sons).
116
Reproduced with permission of the copyright owner. Further reproduction prohibited without permission.

116. Zadeh, L.A., 1983, “The Role of Fuzzy Logic in the Management of Uncertainty Expert Systems”, Fuzzy Sets and Systems, 11:3, 199-228.
117. Zadeh, L.A., 1965, “Fuzzy Sets”, Information and Control, 8, 29-44.
117
Reproduced with permission of the copyright owner. Further reproduction prohibited without permission.

APPENDIX A
IDENTIFIED PROCESS EQUIPMENT AND THEIR FAILURE MODES
The following pieces of equipment and their corresponding failure modes were obtained
from the ten chemical processes discussed in Section 3.3.1. The literature sources used in
this analysis are listed in the references [9, 16, 17, 30, 45, 53, 55, 63, 64, 65, 66. 78, 81,
86, 89. 90, 98].
ACID TANK1. cracked or damaged shell 2. clogged roof drain 3. defective porcelain plug valve 4. corroded tank shell 5. damaged outside painting 6. damaged discharge nozzle seal 7. corroded tank vent 8. damaged roof support 9. leaking drain trap 10. stuck safety valve
AIR FILTER1. corroded screens 2. deformed screens 3. stuck screen curtains gears 4. clogged screens 5. material deposits inside motor 6. empty rinsing oil cleaning receptacle 7. broken curtain travel band 8. defective sludge scraper
BLOWERI. obstructed inlet and outlet ducts 2. cracked inlet box 3. misalign wheel bearings 4. cracked wheel 5. damaged shaft seals 6. expanded shaft 7. worn wheel blades 8. misalign couplings and inlet bells 9. worn scroll and housing liners
BRINE PURIFIER1. damaged heating coils 2. faulty in-flow valves 3. clogged tank outlets 4. worn stirrer bearings 5. non-lubricated drive bearings and gears 7. damaged nozzle seals
BUBBLE-CAP TOWER1. leaking liquid draw-off nozzle 2. clogged liquid draw-off outlet 3. corroded bubble
118
Reproduced with permission of the copyright owner. Further reproduction prohibited without permission.

caps 4. bent trusses 5. wrapped capscracked trays 6. deformed cap riser 7. obstructed vapor outlet 8. defective vapor flow valve
BURNER1. obstructed inlet and outlet ducts of blower 2. cracked inlet box of blower 3. misalign wheel bearings of blower 4. cracked wheel of blower 5. damaged shaft seals of blower6. expanded shaft of blower 7. worn wheel blades of blower 8. misalign couplings inlet bells of blower 9. worn scroll and housing liners of blower 10. damaged mechanical seals in stuffing box of pump 11. worn impeller of pump 12. faulty thrust bearing of pump 13. deformed shaft of pump 14. leaking casing of pump 15. faulty shaft couplings of pump 16. faulty impeller wear ring of pump 17. plugged spray nozzle in combustion chamber 18. carbonaceous matter formation in combustion chamber
CALCINER1. deformed lifting bars 2. stuck scraper chain 3. leaking gas seals 4. dirty burner tips 5. worn motor drive and bearings 6. clogged discharge chute 7. defective water sprays 8. cracked pan burners
CARBONATING TOWER1. blinded plate apertures 2. cracked cooling coils 3. corroded or plugged inlet/outlet nozzles 3. deformed plate convex caps 4. plugged baffles and cooling pipes 5. obstructed magma outlet 6. damaged C 02 inlet nozzle
C 0 2 ABSORBER1. deformed rings 2. unevenly spaced support grid bars 3. unleveled acid distributor 4. crushed intermediate packing layers 5. deformed vapor distributor hats 6. unattached hold down grid 7. blown off chimney tray pan hats 8. defective liquid draw-off nozzle
C 0 2 STRIPPER1. deformed rings 2. unevenly spaced support grid bars 3. unleveled acid distributor 4. crushed intermediate packing layers 5. deformed vapor distributor hats 6. unattached hold down grid 7. blown off chimney tray pan hats 8. defective liquid draw-off nozzle
119
Reproduced with permission of the copyright owner. Further reproduction prohibited without permission.

COMPRESSOR1. deformed thrust bearings 2. plugged stationary elements 3. eroded impeller exit tips 4. damaged shaft and inter-stage seals 5. misalign shaft
CONDENSER1. broken expansion joints 2. cracked tubes 3. deformed impingement plate 4. loose bell head 5. tom loose tubes 6. dirty tubes 7. corroded exchanger surfaces
CONVERTER1. damaged supporting grids 2. corroded or cracked supporting flanges 3. plugged vessel walls and ducts 4. fouled heat exchanger tubes
CRUSHER1. bent eccentric shaft 2. worn jaws 3. clogged discharge opening 4. non-lubricated shaft bearings 5. damaged belts 6. loose stationary jaw
CRYSTALLIZER1. leaking storage pan 2. defective heating device 3. defective screw drive shaft 4. corroded piping 5. defective gates
CYLINDRICAL COOLERI. clogged discharge duct 2. non-lubricated shaft bearings 3. worn wheel blades 4. worn toothed band 5. broken rotation band 6. dirty motor 7. misalign shaft bearings
DEBUTANIZER1. deformed rings 2. unevenly spaced support grid bars 3. unleveled acid distributor 4. crushed intermediate packing layers 5. deformed vapor distributor hats 6. unattached hold down grid 7. blown off chimney tray pan hats 8. defective liquid draw-off nozzle
120
Reproduced with permission of the copyright owner. Further reproduction prohibited without permission.

DEETHANIZER1. deformed rings 2. unevenly spaced support grid bars 3. unleveled acid distributor 4. crushed intermediate packing layers 5. deformed vapor distributor hats 6. unattached hold down grid 7. blown off chimney tray pan hats 8. defective liquid draw-off nozzle
D EMETHANIZER1. deformed rings 2. unevenly spaced support grid bars 3. unleveled acid distributor 4. crushed intermediate packing layers 5. deformed vapor distributor hats 6. unattached hold down grid 7. blown off chimney tray pan hats 8. defective liquid draw-off nozzle
DEPROPANIZER1. deformed rings 2. unevenly spaced support grid bars 3. unleveled acid distributor 4. crushed intermediate packing layers 5. deformed vapor distributor hats 6. unattached hold down grid 7. blown off chimney tray pan hats 8. defective liquid draw-off nozzle
DIAPHRAGM CELL1. worn titanium anodes 2. plugged diaphragm pores 3. dirty diaphragm surface 4. corroded or defective lead casting 5. clogged overflow pipe
DIGESTOR1. worn stirrer bearings 2. non-lubricated drive bearings and gears 3. corroded tank walls 4. damaged discharge nozzle seal 5. defective heating coils 6. corroded or plugged inlets and outlets
DISTILLATION TOWER1. deformed or broken rings 2. unleveled liquid distributor 3. plugged or corroded distributor 4. fouled column packing or internals
DRIER1. clogged discharge duct 2. non-lubricated shaft bearings 3. worn wheel blades 5. worn toothed band 6. broken rotation band 7. dirty motor 8. misalign shaft bearings
121
Reproduced with permission of the copyright owner. Further reproduction prohibited without permission.

DRUM FILTERI. blinded cloth 2. faulty automatic control valve 3. worn rotating and stationary surfaces 4. damaged stub spring 5. clogged internal compartment pipes 6. deformed or worn doctor blade 7. defective water sprays 8. worn drum bearings and shaft 9. clogged discharge outlet
DRYING TOWER1. deformed rings 2. unevenly spaced support grid bars 3. unleveled acid distributor 4. crushed intermediate packing layers 5. deformed vapor distributor hats 6. unattached hold down grid 7. blown off chimney tray pan hats 8. defective liquid draw-off nozzle
ECONOMIZER1. broken expansion joints 2. cracked tubes 3. deformed impingement plate 4. loose bell head 5. tom loose tubes 6. dirty tubes 7. corroded exchanger surfaces
EVAPORATOR1. damaged mechanical seals in stuffing box of pump 2. worn impeller of pump 3. faulty thrust bearings of pump 4. deformed shaft of pump 5. leaking casing of pump 5. faulty shaft couplings of pump 7. faulty impeller wear ring of pump 8. broken tube support baffles of heat exchanger 9. cracked tubes of heat exchanger 10. deformed impingement plate of heat exchanger 11. fouled tubes of heat exchanger 12. corroded exchanger and kettle surfaces 13. plugged or corroded vapor heads walls 14. leaking circulation pipe joints 15. plugged tube inlets
FRACTIONATOR1. deformed rings 2. unevenly spaced support grid bars 3. unleveled acid distributor 4. crushed intermediate packing layers 5. deformed vapor distributor hats 6. unattached hold down grid 7. blown off chimney tray pan hats 8. defective liquid draw-off nozzle
FURNACE1. leaking convective gas section 2. dirty or corroded tube interior 3. bulged tubes 4. thermally cracked tubes 5. damaged diffusion baffle tile system 6. cracked side-wall banks 7. damaged fuel-flow control valve
122
Reproduced with permission of the copyright owner. Further reproduction prohibited without permission.

GAS MIXER1. obstructed inlet and outlet ducts 2. cracked inlet box 3. misalign wheel bearings 4. cracked wheel 5. damaged shaft seals 6. expanded shaft 7. worn wheel blades 8. misalign couplings and inlet bells 9. worn scroll and housing liners 10. dirty motor unbalanced wheel 11. defective automatic suction valve 12. defective cylinder inlet/outlet nozzles
g a s -h 2o s e p a r a t o r1. faulty gas-flow control valve 2. cracked tube sheet 3. dirty fiber packing 4. damaged separator seals 5. broken tubes 6. bad-mounted tubes 7. perforated packing or vanes
H20-COOLED COOLER1. clogged discharge duct 2. non-lubricated shaft bearings 3. defective water sprays 4. wom toothed band 5. broken rotation band 6. dirty motor 7. misalign shaft bearings 8. cracked water pipe
HEAT EXCHANGER1. broken tube support baffles 2. cracked tubes 3. deformed impingement plate 4. fouled tubes 5. corroded exchanger and kettle surfaces
HEATER1. clogged air flow intake 2. leaking convective section 3. material deposits in tube interior 4. bulged tubes 5. defective automatic steam inlet valves 6. thermally cracked tubes 7. dirty burner tips 8. inadequate tube spacing 9. clogged liquid distributor 10. damaged automatic flow-control valve
HUMIDIFIER1. dirty damper 2. corroded fan blades 3. plugged spray chambers 4. dirty diffuser 5. non-lubricated motor bearings 6. tom seals
HYDROGENATOR1. contaminated catalyst 2. cracked vessel shell 3. faulty hydrogen flow control valve 4. faulty internal heat exchanger 5. faulty reactant gas control valve
123
Reproduced with permission of the copyright owner. Further reproduction prohibited without permission.

KILN1. leaking kiln roof 2. clogged upright duct 3. dirty burner tips 4. clogged coal feeder 5. clogged air flow nozzles 6. cracked pan burners 7. dirty fire and ducts zones 8. stuck hoist
METHANATOR1. contaminated catalyst 2. cracked vessel shell 3. faulty hydrogen flow control valve 4. faulty internal heat exchanger 5. faulty reactant gas control valve
OXIDATION CHAMBER1. deformed rings 2. unevenly spaced support grid bars 3. unleveled acid distributor 4. crushed intermediate packing layers 5. deformed vapor distributor hats 6. unattached hold down grid 7. blown off chimney tray pan hats 8. defective liquid draw-off nozzle
PADDLE MIXER1. worn agitator bearings 2. non- lubricated drive bearings and gears 3 corroded tank walls 4. damaged discharge nozzle seals
PIPE1. leaking fittings or joints 2. cracked pipe wall 3. plugged inner section 4. bent pipe 5. corroded or eroded inner wall
PRILLING TOWER1. clogged spray nozzles 2. faulty liquid inlets 3. faulty liquid distributor 4. defective hot air valve
PRILLS TANK1. cracked floor 2. damaged shell 3. splintered tank material 4. damaged drain outlet 5. broken roof support 6. clogged vent
124
Reproduced with permission of the copyright owner. Further reproduction prohibited without permission.

PUMP1. damaged mechanical seals in stuffing box 2. worn impeller 3. faulty thrust bearings4. deformed shaft 5. leaking casing 6. faulty shaft couplings 7. faulty impeller wear ring
QUENCH TOWER1. deformed rings 2. unevenly spaced support grid bars 3. unleveled acid distributor 4. crushed intermediate packing layers 5. deformed vapor distributor hats 6. unattached hold down grid 7. blown off chimney tray pan hats 8. defective liquid draw-off nozzle
REACTOR1. worn or faulty stirrer couplings 2. non-lubricated drive bearings and gears 3. damaged discharge nozzle seals 4. defective heating coils
REBOILER1. corroded internal elements 2. leaking tower bottom tray 3. damaged seal pan 4. damaged draw-off pan 5. partially plugged reboiler 6. restricted reboiler feed line 7. submerged reboiler vapor return nozzle 8. leaking housing tower 9. clogged reboiler outlet line
RECIPROCATING COMPRESSOR1. worn pistons, liners, packing and rods 2. dirty packing caps 3. broken valves 4. damaged cylinder seat 5. incorrectly spaced piston 6. loose piston nut 7. misalign cylinder 8. faulty piston rings 9. burned or leaky valves 10. worn valve operating gear
REFORMER1. defective steam inlet valves 2. dirty or corroded tube interior 3. bulged tubes 4. thermally cracked tubes 5. contaminated catalyst 6. cracked cylinder shell 7. defective reactant gas flow valve 8. deformed catalyst packing
125
Reproduced with permission of the copyright owner. Further reproduction prohibited without permission.

SATURATOR1. blinded efflux holes 2. faulty or clogged overflow device 3. cracked cooling coil 4. corroded or plugged inlet/outlet nozzles 5. deformed bottom grill
SETTLING TANK1. leaking outlet seals 2. leaking bottom outlet seal 3. corroded tank shell
SLAKER1. clogged discharge duct 2. non-lubricated shaft bearings 3. defective or clogged water pipe nozzle 4. worn toothed band 5. broken rotation band 6. dirty motor 7. misalign shaft bearings 8. corroded drum walls
STIRRED MILL1. corroded grinder body 2. worn grinding vanes 3. plugged armature rotating base 4. defective armature base seals 5. worn armature bearings 6. non-lubricated drive bearings and gears
TILTING PAN FILTER1. blinded cloth 2. clogged or corroded distributor tubes 3. defective wash sprays 4. worn filter medium 5. stuck or corroded pan rotating axis 6. faulty automatic vacuum valve 7. worn roller bearings or gears 8. defective pan inverting mechanism
TREATMENT TANK1. worn stirrer bearings 2. non-lubricated drive bearings and gears 3. corroded tank walls4. damaged discharge nozzle seal 5. defective heating coils 6. corroded or plugged inlets and outlets
TROMMEL1. faulty speed controller 2. blinded screens 3. worn spur-girt gear 4. obstructed structural members 5. deflected central shaft
126
Reproduced with permission of the copyright owner. Further reproduction prohibited without permission.

TUBULAR COOLER1. broken expansion joints 2. cracked tubes 3. damaged bell head seals 4. plugged tubes5. tom loose tubes 6. corroded surfaces
TURBINE1. worn flexible coupling teeth 2. non-lubricated bearings 3. sticky pipe or pedestal 4. misalign shaft 5. sticky valve stems 6. leaking valves 7. damaged sleeves 8. leaking glands
TURBO EXPANDER1. leaking oil bearings 2. obstructed seal gas 3. leaking heat barrier wall 4. frozen rotor5. overloaded flange pipes 6. misalign shaft coupling 7. over-pressured bearing thrust face 8. clogged oil lines 9. deteriorated rotor back seals 10. crushed filter cartridge 11. contaminated filter cartridge 12. flooded oil reservoir
VESSEL1. cracked vessel shell 2. faulty valves 3. corroded shell 4. damaged drain outlet 5. defective pressure controller
WASTE HEAT BOILER1. broken expansion joints 2. fouled tubes 3. deformed demister mesh pad 4. cracked boiler drum shell
127
Reproduced with permission of the copyright owner. Further reproduction prohibited without permission.

APPENDIX B
FAILURE MODES EFFECTS AND SUGGESTED CONTROLS
The information presented in this appendix was obtained from relevant equipment
maintenance literature shown in the references.
BURNER Ref. [9, 21, 23, 24, 25, 53,63, 86, 108]
A. Obstructed Inlet or Outlet Ducts of Blower.Local Effects:
- Diminished gas flow delivered by blower- Possible overloading of blower motor- May precipitate blower seals damage
System Effects:- Electrical power supply to other equipment may be affected if blower motor overloads
- Explosion hazard- A considerable amount of atmospheric pollutants may be released by
burnerSuggested Controls:
- Visual inspection- Protective screens test
B. Cracked Inlet Box of Blower.Local Effects:
- Flow pressure loss in blower- Overloading of the fan motor- Gas/air leakage- Eventual loss of air flow
System Effects:- Electrical power supply to other equipment may be
affected if blower motor overloads- Contamination hazard- Possible corrosive effect on nearby equipment- Explosion hazard- Increase in atmospheric pollutants
Suggested Controls:- Gas detector- Visual inspection- Dye penetrant inspection
128
Reproduced with permission of the copyright owner. Further reproduction prohibited without permission.

C. Misaligned Wheel Bearings of Blower.Local Effects:
- Fan motor overloaded- Possible bending of blower's shaft- Extreme blower vibration and noise- Blowing power loss- Eventual decrease in air flow to combustion chamber- Burner efficiency reduced
System Effects:- Electrical power supply to other equipment may be
affected if blower motor overloads- Nearby equipment may be atrophied due to transmitted
vibrationSuggested Control:
- Mechanical running test- Visual inspection- Vibration analysis- Rotor stability test
D. Cracked Wheel of Blower.Local Effects:
- Total loss of blower operation- Impeller may fall off- Possible severe damage to fan motor- Eventually, burner operation must be shut down
System Effects:- Electrical power supply to other equipment may be affected if blower motor overloads
- Explosion Hazard Suggested Controls:
- Dye penetrant inspection- Fluorescent (Zyglo) inspection
E. Damaged Shaft Seals of Blower.Local Effects:
- Gas/air leakage around shaft- Loss of blower pressure and efficiency- Possible corrosion of other elements in blower- Low combustion efficiency
System Effects- Electrical power supply to other equipment may be
affected if blower motor overloads- Contamination hazard- Possible corrosive effect on nearby equipment- Increase in atmospheric pollutants
129
Reproduced with permission of the copyright owner. Further reproduction prohibited without permission.

- Explosion hazard Suggested Controls:
- Static gas test- Visual inspection- Temperature detectors (thermocouples & electrical resistance detectors)
F. Expanded Shaft of Blower.Local Effects:
- Extreme blower vibration upon startup- Eventual failure of blower bearings- Possible blower seals damage- Reduction in air flow to combustion chamber
System Effects:- Temperature in the area may get out of control and nearby equipment nozzles and pipes can be damaged
- Nearby equipment may be affected by transmitted vibration
- Explosion hazard- Increase in air pollutants originated from combustion
Suggested Controls:- Mechanical running test- Vibration analysis- Temperature detectors (thermocouples & electrical resistance detectors)
G. Worn Wheel Blades of Blower.Local Effects:
- Diminished delivered air/gas flow- Possible unbalance of blower shaft- Combustion efficiency reduced
System Effects:- Increase in atmospheric pollutants originated from combustion
Suggested Controls:- Visual inspection- Rotor stability test
H. Misaligned Couplings Inlet Bells of Blower.Local Effects:
- Overheating of blower bearings and motor- Bearing failure- Increase of bearing dust seals wear- Air flow to combustion chamber possibly reduced- Combustion efficiency affected
System Effects:- Electrical power supply to other equipment may be
affected if blower motor overloads
130
Reproduced with permission of the copyright owner. Further reproduction prohibited without permission.

Suggested Controls:- Temperature detectors (thermocouples & electrical resistance detectors)- Mechanical test- Visual inspection
I. Worn Scroll and Housing Liners of Blower.Local Effects:
- Damaged blower liners can break free- Eventual damage to blower wheel- If wheel breaks, air flow to combustion chamber will cease- Burner operation eventually must be shut down
System Effects:- Explosion hazard- Liners debris may be blown away and cause major problems to connected equipment such as compressors, converters, heaters, etc.
- Nearby equipment may get affected by transmitted vibration
Suggested Controls:- Visual inspection- Magnetic particle inspection- Mechanical running test
J. Damaged Mechanical Seals in Stuffing Box of Pump.Local Effects:
- Pump's capacity severely reduced- Increase in pump vibration- Combustion greatly affected- Burner efficiency greatly reduced
System Effects:- Contamination hazard- Transmitted vibration may damage close machinery- Corrosion problems may prevail in adjacent areas
Suggested Controls:- Hydrostatic pressure test- Visual inspection
K. Worn Impeller of Pump.Local Effects:
- Pump's capacity severely reduced- Increase in pump vibration- Reduction in suction power- Combustion reduced- Burner gas quality greatly affected
131
Reproduced with permission of the copyright owner. Further reproduction prohibited without permission.

System Effects:- Upstream ducts may get clogged- Transmitted vibration may damage attached
pipes or equipment- Associated compressors and turbines may overload
Suggested Controls:- Hydrostatic pressure test- Flow analysis- Visual inspection
L. Faulty Thrust Bearings of Pump.Local Effects:
- Excessive pump vibration- Pump motor may overload and run hot- Possible shaft/gear misalignment- Increase in shaft radial movement- Eventual pump shut down- Burner operation may have to be stopped
System Effects:- Destructive equipment vibration- If motor overloads, nearby equipment may experience electrical problems
- If pump ceases working, related equipment detriment should be expected
Suggested Controls:- Pressure pulsation (piezoelectric pressure) test- Visual inspection- Vibration analysis- Bearing temperature control
M. Deformed Shaft of Pump.Local Effects:
- Pumping efficiency greatly reduced- Excessive pump vibration- Increase in shaft radial movement- Possible pump bearings damage- Possible pump seals damage- Eventual pump couplings failure- Burner gas quality greatly affected- Burner may have to be shut down
System Effects:- Destructive equipment vibration- Possible clogging of attached pipes
132
Reproduced with permission of the copyright owner. Further reproduction prohibited without permission.

- Fluid leakage around shaft may increase, which could lead to contamination problems
Suggested Controls:- Visual inspection- Tensile stress analysis- Pressure pulsation (piezoelectric pressure) test- Vibration analysis
N. Leaking Casing of Pump.Local Effects:
- Reduced pumping rate- Possible corrosion effects on pump elements- Combustion efficiency reduced- Burner gas quality greatly affected
System Effects:- Contamination hazard- Explosion hazard- Corrosion problems in nearby machinery
Suggested Controls:- Visual inspection- Hydrostatic pressure test- Flow analysis
O. Faulty Shaft Couplings of Pump.Local Effects:
- Pump shaft misalignment- Atrophied shaft movement- Loss of pumping efficiency- Increase in pump noise and vibration- Possible pump seals damage- Eventually, pump total shut down- Burner gas quality greatly reduced- Eventually, burner may have to be shut down
System Effects:- Destructive equipment vibration- If pump ceases working, related equipment detriment should be expected
- Possible clogging of attached pipes- Fluid leakage around shaft may increase, which could lead to contamination problems
Suggested Controls:- Visual inspection- Vibration analysis- Pressure pulsation (piezoelectric pressure) test
133
Reproduced with permission of the copyright owner. Further reproduction prohibited without permission.

P. Faulty Impeller Wear Ring of Pump.Local Effects:
- Internal liquid leakage from the pump discharge back the pump suction
- Eminent pump impeller wear- Potential corrosion effect on pump's internals- Pump's capacity greatly reduced- Combustion efficiency greatly reduced
System Effects:- Contamination hazard- Possible clogging of attached pipes- Downstream equipment may be detrimentally affected
Suggested Controls:- Visual inspection- Flow analysis- Venturi analysis- Hydrostatic pressure test
Q. Plugged Spray Nozzle in Combustion Chamber.Local Effects:
- Poor air flow stream- Increase in atmospheric pollutants originated from the combustion- Burner capacity greatly reduced
System Effects:- Explosion hazard
Suggested Effects:- Pollutant detector- Visual inspection- Venturi analysis
R. Carbonaceous Matter Formation in Combustion Chamber.Local Effects:
- Combustion interference- Vaporization unsteady
System Effects:- No major effects on downstream equipment expected
Suggested Controls:- Visual inspection
134
Reproduced with permission of the copyright owner. Further reproduction prohibited without permission.

CENTRIFUGAL BLOWER Ref. [10, 16, 77, 53, 64, 78]
A. Obstructed Inlet or Outlet Ducts.Local Effects:
- Diminished gas/air flow delivered by blower- Possible overloading of blower motor- May precipitate seals damage
System Effects:- If blower used for cooling, system components
or product temperature may get out of control- Electrical power supply to other equipment may be
affected if blower motor overloadsSuggested Controls:
- Visual inspection- Protective screens test
B. Cracked Inlet Box.Local Effects:
- Flow pressure loss- Overloading of the fan motor- Gas/air leakage- Eventual loss of equipment's function
System Effects:- If blower used for cooling, system components
or product temperature will get out o f control- Electrical power supply to other equipment may be
affected if blower motor overloads- If handling gas, contamination hazard- Possible corrosive effect on nearby equipment
Suggested Controls:- Gas detector- Visual inspection- Dye penetrant inspection
C. Misaligned Wheel Bearings.Local Effects:
- Motor overloaded- Possible bending of shaft- Extreme equipment vibration and noise- Blowing power loss
System Effects:- If blower used for cooling, system components or product temperature may get out of control
- Electrical power supply to other equipment may be affected if blower motor overloads
135
Reproduced with permission of the copyright owner. Further reproduction prohibited without permission.
- Nearby equipment may be atrophied due to transmitted vibration
Suggested Control:- Mechanical running test- Visual inspection- Vibration analysis- Rotor stability test
D. Cracked Wheel.Local Effects:
- Total loss of equipment operation- Impeller may fall off- Possible severe damage to fan motor
System Effects:- If blower used for cooling, system components
or product temperature will get out of control- Electrical power supply to other equipment may be
affected if blower motor overloadsSuggested Controls:
- Dye penetrant inspection- Fluorescent (Zyglo) inspection
E. Damaged Shaft Seals.Local Effects:
- Gas/air leakage around shaft- Loss of blower pressure and efficiency- Possible corrosion of other elements
System Effects:- If blower used for cooling, system components
or product temperature will get out of control- Electrical power supply to other equipment may be
affected if blower motor overloads- If handling gas, contamination hazard- Possible corrosive effect on nearby equipment
Suggested Controls:- Static gas test- Visual inspection- Temperature detectors (thermocouples & electrical resistance detectors)
F. Expanded Shaft.Local Effects:
- Extreme vibration upon startup- Eventual failure of bearings- Possible seals damage
136
Reproduced with permission of the copyright owner. Further reproduction prohibited without permission.

System Effects:- If blower used for cooling, system components or product temperature may get out o f control
- Nearby equipment may be affected by transmitted vibration
Suggested Controls:- Mechanical running test- Vibration analysis- Temperature detectors (thermocouples & electrical resistance detectors)
G. Worn Wheel Blades.Local Effects:
- Diminished delivered air/gas flow- Possible unbalance of shaft
System Effects:- If blower used for cooling, system components or product temperature may get out o f control
Suggested Controls:- Visual inspection- Rotor stability test
H. Misaligned Couplings Inlet Bells.Local Effects:
- Overheating of bearings and motor- Bearing failure- Increase of bearing dust seals wear
System Effects:- Electrical power supply to other equipment may be affected if blower motor overloads
Suggested Controls:- Temperature detectors (thermocouples & electrical resistance detectors)- Mechanical test- Visual inspection
I. Worn Scroll and Housing Liners.Local Effects:
- Damaged liners can break free- Eventual damage to wheel- No immediate loss of efficiency expected
System Effects:- Liners debris may be blown away and
cause major problems to connected equipment such as compressors, converters, heaters, etc.
- Nearby equipment may get affected by transmitted vibration
137
Reproduced with permission of the copyright owner. Further reproduction prohibited without permission.

Suggested Controls:- Visual inspection- Magnetic particle inspection- Mechanical running test
CENTRIFUGAL PUMP Ref. [8, 15, 41, 42, 74, 86, 89, 108]
A. Damaged Mechanical Seals in Stuffing Box.Local Effects:
- Pump's capacity severely reduced- Increase in equipment vibration- Possible fluid leakage
System Effects:- If pumping fluid is toxic, contamination hazard- Transmitted vibration may damage close machinery- Corrosion problems may prevail in adjacent areas
Suggested Controls:- Hydrostatic pressure test- Visual inspection
B. Worn Impeller.Local Effects:
- Pump's capacity severely reduced- Increase in machine vibration- Reduction in suction power
System Effects:- Upstream ducts may get clogged- Transmitted vibration may damage attached pipes or equipment- Associated compressors and turbines may overload
Suggested Controls:- Hydrostatic pressure test- Flow analysis- Visual inspection
C. Faulty Thrust Bearings.Local Effects:
- Excessive pump vibration- Motor may overload and run hot- Possible shaft/gear misalignment- Increase in shaft radial movement- Eventual pump shut down
System Effects:- Destructive equipment vibration- If motor overloads, nearby equipment may
138
Reproduced with permission of the copyright owner. Further reproduction prohibited without permission.

experience electrical problems- If pump ceases working, related equipment detriment should be expected
Suggested Controls:- Pressure pulsation (piezoelectric pressure) test- Visual inspection- Vibration analysis- Bearing temperature control
D. Deformed Shaft.Local Effects:
- Pumping efficiency greatly reduced- Excessive pump vibration- Increase in shaft radial movement- Possible bearings damage- Possible seals damage- Eventual couplings failure
System Effects:- Destructive equipment vibration- Possible clogging of attached pipes- Fluid leakage around shaft may increase, which could lead to contamination problems
Suggested Controls:- Visual inspection- Tensile stress analysis- Pressure pulsation (piezoelectric pressure) test- Vibration analysis
E. Leaking Casing.Local Effects:
- Reduced pumping rate- Possible corrosion effects on pump's components and attachments
System Effects:- If pumping fluid is toxic, contamination hazard
Suggested Controls:- Visual inspection- Hydrostatic pressure test- Flow analysis
F. Faulty Shaft Couplings.Local Effects:
- Shaft misalignment- Atrophied shaft movement- Loss of pumping efficiency
139
Reproduced with permission of the copyright owner. Further reproduction prohibited without permission.

- Increase in pump noise and vibration- Possible seals damage- Eventually, pump total shut down
System Effects:- Destructive equipment vibration- If pump ceases working, related equipment detriment should be expected
- Possible clogging of attached pipes- Fluid leakage around shaft may increase, which could lead to contamination problems
Suggested Controls:- Visual inspection- Vibration analysis- Pressure pulsation (piezoelectric pressure) test
G. Faulty Impeller Wear Ring.Local Effects:
- Internal liquid leakage from the pump discharge back the pump suction
- Eminent impeller wear- Potential corrosion effect on pump's internals- Pump's capacity greatly reduced
System Effects:- Contamination hazard- Possible clogging of attached pipes- Downstream equipment may be detrimentally affected
Suggested Controls:- Visual inspection- Flow analysis- Venturi analysis- Hydrostatic pressure test
CONVERTER Ref. [21, 23, 45, 51, 63, 64]
A. Damaged Supporting Grids.Local Effects:
- Potential catalyst loss- Catalyst bed disarrangement- Eventual loss of reaction efficiency
System Effects:- Batch of material in process may have to be wasted- Catalyst debris may obstruct attached ducts
Suggested Controls:- Visual inspection
140
Reproduced with permission of the copyright owner. Further reproduction prohibited without permission.

B. Corroded or Cracked Supporting Flanges.Local Effects:
- Diminished conversion efficiency- Possible catalyst contamination- Weakening of converter structure
System Effects:- Besides the loss in the quality of the reaction no
major effects on nearby equipment should be expectedSuggested Controls:
- Visual inspection- Dye penetrant inspection
C. Plugged Vessel Walls and Ducts.Local Effects:
- Unequal gas distribution- Poor conversion efficiency- Potential cracking of shell
System Effects:- If shell cracks, contamination hazard- Wall scum may affect nearby compressors and pumps
Suggested Controls:- Visual inspection- Ultrasonic inspection
D. Fouled Heat Exchanger Tubes.Local Effects:
- Converter efficiency greatly reduced- Increase in internal gas temperature- Possible damage o f flanges and support grids- Reaction heat out of control- Eventually, total loss of function
System Effects:- Extremely high gas temperatures can damage circulating pipes and downstream machines' seals
- If converter ceases working, the whole process will probably have to be shut down
Suggested Controls:- Dye penetrant inspection- Fluorescent (Zyglo) inspection- Differential temperature control
141
Reproduced with permission of the copyright owner. Further reproduction prohibited without permission.

DISTILLATION TOWER Ref. [1, 9, 16, 21,45, 53, 63, 75]
A. Deformed or Broken Rings.Local Effects:
- Ring migration- Rings may get caught in gate and control valve inlets- Equipment efficiency greatly reduced- Eventually, column will have to be shut down
System Effects:- Other associated equipment like centrifugal pumps, and
heaters may be seriously damaged by ring particles- Eventually, overall system will have to be shut down
Suggested Controls:- Visual inspection- Material flow analysis
B. Unleveled Liquid Distributor.Local Effects:
- Poor liquid distribution- Very low tower efficiency
System Effects:- Poor distillate quality- No major impact expected
Suggested Controls:- Visual inspection
C. Plugged or Corroded Distributor.Local Effects:
- Fluid contamination- Reduced tower efficiency- Poor liquid distribution- Possible inappropriate column flooding
System Effects:- Poor distillate quality- Pumps or compressors handling distillate
may be slightly affectedSuggested Controls:
- Visual inspection- Column differential pressure analysis
D. Fouled Column Packing or Internals.Local Effects:
- Premature or inappropriate column flooding- Deficient vapor flow
142
Reproduced with permission of the copyright owner. Further reproduction prohibited without permission.

- Possible liquid drainage through chimneys- Column efficiency greatly reduced
System Effects:- Contamination hazard- Fluid spillage may affect the normal functioning of nearby equipment
- Associated pumps and compressors may fail Suggested Controls:
- Visual inspection- Material flow analysis- Column differential pressure analysis
EVAPORATOR Ref. [5, 63, 64, 68, 81, 90, 108]
A. Damaged Mechanical Seals in Stuffing Box of Pump.
Local Effects:- Pump's capacity severely reduced- Increase in pump vibration- Contamination hazard- Poor liquid circulation- Heat exchanger tubes may get fouled- Evaporator efficiency reduced
System Effects:- If pumping fluid is toxic, contamination hazard- Transmitted vibration may damage nearby machinery- Corrosion problems may prevail in adjacent areas
Suggested Controls:- Hydrostatic pressure test- Visual inspection
B. Worn Impeller of Pump.Local Effects:
- Pump's capacity severely reduced- Increase in pump vibration- Reduction in suction power- Poor liquid circulation- Heat exchanger tubes may get fouled- Evaporator efficiency reduced
System Effects:- Upstream ducts may get clogged- Transmitted vibration may damage attached pipes or equipment
- Associated compressors and turbines may overload
143
Reproduced with permission of the copyright owner. Further reproduction prohibited without permission.

Suggested Controls:- Hydrostatic pressure test- Flow analysis- Visual inspection
C. Faulty Thrust Bearings of Pump.Local Effects:
- Excessive pump vibration- Pump motor may overload and run hot- Possible shaft/gear misalignment- Increase in shaft radial movement- Eventual pump shut down- Heat exchanger may get severely damaged- Eventual system shut down
System Effects:- Destructive equipment vibration- If motor overloads, nearby equipment may
experience electrical problems- If pump ceases working, related equipment detriment
should be expectedSuggested Controls:
- Pressure pulsation (piezoelectric pressure) test- Visual inspection- Vibration analysis- Bearing temperature control
D. Deformed Shaft of Pump.Local Effects:
- Pumping efficiency greatly reduced- Excessive pump vibration- Increase in shaft radial movement- Possible pump bearings damage- Possible pump seals damage- Eventual pump couplings failure- Circulation pipes may result deformed or bent- Probable poor liquid flow through heating tubes- Evaporator efficiency greatly affected
System Effects:- Destructive equipment vibration- Possible clogging of attached pipes- Fluid leakage around shaft may increase, which could lead to contamination problems
Suggested Controls:- Visual inspection- Tensile stress analysis
144
Reproduced with permission of the copyright owner. Further reproduction prohibited without permission.

- Pressure pulsation (piezoelectric pressure) test- Vibration analysis
E. Leaking Casing of Pump.Local Effects:
- Reduced pumping rate- Contamination hazard- Possible corrosion effects on pump elements- Liquid loss- Heat exchanger tubes may get fouled- If leak persists, eventual evaporator shut down
System Effects:- If pumping fluid is toxic, contamination hazard- Auxiliary heating subsystem may get atrophied
Suggested Controls:- Visual inspection- Hydrostatic pressure test- Flow analysis
F. Faulty Shaft Couplings of Pump.Local Effects:
- Pump shaft misalignment- Atrophied shaft movement- Loss of pumping efficiency- Increase in pump noise and vibration- Possible pump seals damage- Eventually, pump total shut down- Circulation pipes may be deformed or bent- Possible leaking of liquid from pipe joints- Eventually, evaporator may have to be shut down
System Effects:- Destructive equipment vibration- If pump ceases working, related equipment detriment should be expected
- Possible clogging of attached pipes- Fluid leakage around shaft may increase, which could lead to contamination problems
Suggested Controls:- Visual inspection- Vibration analysis- Pressure pulsation (piezoelectric pressure) test
G. Faulty Impeller Wear Ring of Pump.Local Effects:
- Internal liquid leakage from the pump discharge back the pump suction
145
Reproduced with permission of the copyright owner. Further reproduction prohibited without permission.
- Eminent pump impeller wear- Potential corrosion effect on pump's internals- Pump's capacity greatly reduced- If liquid circulation is affected, evaporator efficiency reduced
System Effects:- Contamination hazard- Possible clogging of attached pipes- Downstream equipment may be detrimentally affected
Suggested Controls:- Visual inspection- Flow analysis- Venturi analysis- Hydrostatic pressure test
H. Broken Tube Support Baffles of Heat Exchanger.Local Effects:
- May lead to tube breakage- Liquid leakage to shell- Liquid contamination- Heat exchanger efficiency greatly reduced- Eventual evaporator shut down
System Effects:- If tube-side fluid is toxic, contamination hazard- Process temperature may go out of control- Related equipment such as pumps and compressors may be affected
Suggested Controls:- Visual inspection
I. Cracked Tubes of Heat Exchanger.Local Effects:
- Liquid leakage to shell- Liquid contamination- Heat exchanger efficiency greatly reduced- Pump surge may occur- Evaporator's elements may get completely wrecked
System Effects:- If tube-side fluid is toxic, contamination hazard- Process temperature may go out of control- Related equipment such as pumps and compressors may be affected
Suggested Controls:- Hydrostatic test- Dye penetrant inspection- Fluorescent (Zyglo) inspection
146
Reproduced with permission of the copyright owner. Further reproduction prohibited without permission.
J. Deformed Impingement Plate of Heat Exchanger.Local Effects:
- Potential erosive effect on tubes- Evaporator efficiency should not be affected
System Effects:- No major impact on downstream machines
should be expectedSuggested Controls:
- Visual inspection
K. Fouled Tubes o f Heat Exchanger Local Effects:
- Potential cracking of tubes- Poor heat transfer efficiency- Possible damage to support baffles- Liquid evaporation efficiency reduced- If tubes crack, possible system wreck
System Effects:- If tube-side fluid is toxic and tubes crack, contamination hazard- Process temperature may go out of control- Related equipment such as pumps and compressors
may be affectedSuggested Controls:
- Eddy current inspection- Ultrasonic inspection
L. Corroded Exchanger and Kettle Surfaces.Local Effects:
- Apparatus efficiency greatly reduced- Liquid contamination- Liquid evaporation efficiency reduced
System Effects:- Process temperature may go out of control- Kettle scum may atrophy attached pipes and pumps
Suggested Controls:- Visual inspection- Eddy current inspection
M. Plugged or Corroded Vapor Heads Walls.Local Effects:
- Vapor entrairunent- Loss of evaporation efficiency
System Effects:- Attached vents and ducts can be damaged- No major effects on process should be expected
147
Reproduced with permission of the copyright owner. Further reproduction prohibited without permission.

Suggested Controls:- Visual inspection- Ultrasonic inspection
N. Leaking Circulation Pipe Joints.Local Effects:
- Damage to external heat exchanger- Potential pump surge- Eventual evaporator shut down
System Effects:- Contamination hazard- Flow pressure loss may affect the normal operation of downstream pumps, compressors or distillation columns
- If evaporator ceases working, overall process may have to be shut down
Suggested Controls:- Visual inspection- Radioactive isotope injection
O. Plugged Tube Inlets.Local Effects:
- Liquid contamination- Possible fouling of heat exchanger tubes- Evaporator efficiency greatly reduced
System Effects:- Contamination hazard- Clogged inlets may affect the normal operation of
downstream pumps, compressors or distillation towers- If evaporator ceases working, overall process may
have to be shut downSuggested Controls:
- Visual inspection- Ultrasonic inspection
HEAT EXCHANGER Ref. [16, 27, 29, 53, 61, 83]
A. Broken Tube Support Baffles.Local Effects:
- May lead to tube breakage- Cooling medium leakage to shell- Substance contamination- Heat exchanger efficiency greatly reduced- Eventual equipment shut down
148
Reproduced with permission of the copyright owner. Further reproduction prohibited without permission.
System Effects:- If tube-side fluid is toxic, contamination hazard- Process temperature may go out of control- Related equipment such as pumps and compressors may be affected
Suggested Controls:- Visual inspection
B. Cracked Tubes.Local Effects:
- Cooling medium leakage to shell- Substance contamination- Heat exchanger efficiency greatly reduced- Apparatus may get completely wrecked
System Effects:- If tube-side fluid is toxic, contamination hazard- Process temperature may go out of control- Related equipment such as pumps and compressors
may be affected- If exchanger stops working, entire process may have to
be shut downSuggested Controls:
- Hydrostatic Test- Dye penetrant inspection- Fluorescent (Zyglo) inspection
C. Deformed Impingement Plate.Local Effects:
- Potential erosive effect on tubes System Effects:
- No major impact on downstream machines should be expected
Suggested Controls:- Visual inspection
D. Fouled Tubes.Local Effects:
- Potential cracking of tubes- Poor heat transfer efficiency- Possible damage to support baffles
System Effects:- If tube-side fluid is toxic and tubes crack, contamination hazard- Process temperature may go out of control- Related equipment such as pumps and compressors may be affected
149
Reproduced with permission of the copyright owner. Further reproduction prohibited without permission.
Suggested Controls:- Eddy current inspection- Ultrasonic inspection
E. Corroded Exchanger and Kettle Surfaces.Local Effects:
- Apparatus efficiency greatly reduced- Substance contamination
System Effects:- Process temperature may go out of control- Kettle scum may atrophy attached pipes and pumps
Suggested Controls:- Visual inspection- Eddy current inspection
MULTISTAGE COMPRESSOR Ref. [10, 13, 56, 63, 77, 78]
A. Deformed Thrust Bearings.Local Effects:
- Increase of axial rotor movement- Spinning wheel may touch a stationary element- Compressor internals may wreck
System Effects:- Wheel pieces may tear through case and cause
human injuries- Wheel debris may damage downstream equipment
Suggested Controls:- Visual inspection- Vibration analysis- Mechanical running test
B. Plugged Stationary Elements.Local Effects:
- Loss of gas compression efficiency- Increase in discharge temperature- Motor amp load may go down- Possible unbalance of the rotor
System Effects:- Inefficient gas compression may lead to abnormal performance of downstream equipment
- Increase in discharge temperature may damage attached equipment nozzles and seals
150
Reproduced with permission of the copyright owner. Further reproduction prohibited without permission.

Suggested Controls:- Visual inspection- Ultrasonic inspection
C. Eroded Impellers Exit Tips.Local Effects:
- Loss of compression efficiency- May cause shaft unbalance- Increase in equipment vibration
System Effects:- Transmitted vibration may damage nearby equipment- Inefficient gas compression may lead to abnormal performance of downstream equipment
Suggested Controls:- Visual inspection- Eddy current inspection
D. Damaged Shaft and Interstage (Labyrinth) Seals.Local Effects:
- Gas compression efficiency greatly reduced- Gas leakage- Possible increase in element corrosion- Possible diaphragms deformation
System Effects:- Inefficient gas compression may lead to abnormal performance of downstream equipment
- If compressed gas is toxic or corrosive, contamination or corrosion problems may developed in nearby machine areas
Suggested Controls:- Static gas test- Dye penetrant inspection- Fluorescent (Zyglo) inspection
E. Misaligned Shaft.Local Effects:
- Excessive equipment vibration and noise- Eventually, total loss o f compression function- Possible damage to labyrinth seals- Compressor internals most likely to wreck
System Effects:- Transmitted vibration may damage nearby equipment- Inefficient gas compression may lead to abnormal performance of downstream equipment
Suggested Controls:- Vibration analysis
151
Reproduced with permission of the copyright owner. Further reproduction prohibited without permission.

- Visual inspection- Ultrasonic inspection- Mechanical running test
PIPE Ref. [28, 70, 73, 94, 103]
A. Leaking Fittings or Joints.Local Effects:
- Pressure loss- Possible corrosion effect on outer wall and fittings
System Effects:- Contamination hazard- Possible damage to attached equipment- Depending on process, downstream machines may be seriously affected
Suggested Controls:- Visual inspection- Radioactive isotope injection- Gas detector
B. Cracked Pipe Due To Over-stress.Local Effects:
- Potential fluid leakage- Pressure and temperature loss
System Effects:- Contamination hazard- Connected equipment may be greatly damaged- Possible corrosion problems in the area- If leakage is considerable, overall system may be stopped
Suggested Controls:- Eddy current inspection- Radioactive isotope injection- Tensile stress test
C. Plugged Inner Section.Local Effects:
- Obstructed flow- Eventual cracking of pipe
System Effects:- Connected equipment may be damaged- If obstruction is considerable or cracking precipitates, entire process may have to be shut down
152
Reproduced with permission of the copyright owner. Further reproduction prohibited without permission.

Suggested Controls:- Ultrasonic inspection- Flow pressure analysis
D. Bent Pipe.Local Effects:
- Possible cracking of pipe- Damage to support hardware- Possible resulting leakage at fitting locations
System Effects:- Eminent damage to attached equipment
Suggested Controls:- Visual inspection
E. Corroded or Eroded Inner Wall.Local Effects:
- Development of "hot spots" on piping wall- Eventual pipe fracture- Fluid contamination
System Effects:- Contaminated fluid may affect the normal functioning
of downstream machinerySuggested Controls:
- Ultrasonic inspection- Eddy current inspection
REACTOR Ref. [7, 64, 65, 96, 101, 111]
A. Worn or faulty Stirrer Couplings.Local Effects:
- Possible excessive vibration- Loss of mixing efficiency- Poor reaction process
System Effects:- Nearby equipment may be affected by transmitted vibration
- Possible bending of attached piping Suggested Controls:
- Visual inspection- Magnetic particle inspection
B. Non-lubricated Drive Bearings and Gears.Local Effects:
- Increase in equipment vibration
153
Reproduced with permission of the copyright owner. Further reproduction prohibited without permission.

- Possible gear misalignment- Eventual overheating of stirrer motor- May lead to reactor shut down
System Effects:- If reactor functioning does not stop, no major
impact on overall system should be expectedSuggested Controls:
- Visual inspection- Lubrication records- Moisture tests
C. Damaged Discharged Nozzle Seals.Local Effects:
- Internal pressure loss- Reactor efficiency reduced- Liquid leakage- Reaction quality affected
System Effects:- Contamination hazard- Associated pumps, heating system, and pipes are likely to fail
- If liquid is toxic, overall system must be shut down Suggested Controls:
- Visual inspection- Vessel pressure control
D. Defective Heating Coils.Local Effects:
- Inappropriate heating of mixture- Poor or failed reaction
System Effects:- If reaction failed, entire processed material
batch is most likely to be lost- No major impact on nearby machines' functioning
should be expectedSuggested Controls:
- Temperature detectors (thermocouples & electrical resistance detectors)- Visual inspection- Amps meter
154
Reproduced with permission of the copyright owner. Further reproduction prohibited without permission.

WASTE HEAT BOILER Ref. [2, 9, 16, 45, 63, 78, 109]
A. Broken Expansion Joints.Local Effects:
- Tube deformation- Possible heating medium leakage into water- Substance contamination- Equipment efficiency greatly reduced
System Effects:- Product quality greatly affected- If water is circulated, major equipment damage and
contamination should be expected in nearby areas- Heating sub-system components may get wrecked
Suggested Controls:- Visual inspection- Hydrostatic test
B. Fouled Tubes.Local Effects:
- Heating medium leakage into boiling water- Substance contamination- Equipment efficiency greatly reduced
System Effects:- Product quality greatly affected- If water is circulated, major equipment damage and contamination should be expected in nearby areas
- Heating sub-system components may get wrecked Suggested Controls:
- Ultrasonic inspection- Differential temperature analysis- Magnetic particle inspection- Eddy current inspection
C. Deformed Demister Mesh Pad.Local Effects:
- Poor steam quality- Small droplets of water in steam
System Effects:- Increased corrosion in steam ducts- If steam turbines attached, their efficiency will be affected
Suggested Controls:- Visual inspection
155
Reproduced with permission of the copyright owner. Further reproduction prohibited without permission.

D. Cracked Boiler Drum Shell.Local Effects:
- Total loss of equipment function- Water leakage from shell- Eventual fouling of tubes
System Effects:- Product quality greatly affected- If water is circulated, major equipment damage and contamination should be expected in nearby areas
- Heating sub-system components may get wrecked- Spilled water may damage nearby equipment such as motors, screens, and gears
- Overall system shut down very likely Suggested Controls:
- Hydrostatic test- Dye penetrant inspection- Fluorescent (Zyglo) inspection- Eddy current inspection
156
Reproduced with permission of the copyright owner. Further reproduction prohibited without permission.

APPENDIX C
PRECIPITATING FACTORS
The information included in this appendix was obtained by series of interviews conducted
with doctoral students of the department of Chemical Engineering at the University of
Alabama. Specialized equipment maintenance literature was also consulted.
BURNER Ref. [9, 21, 23, 24, 25, 53, 63, 86, 108]
A. Obstructed Inlet or Outlet Ducts of Blower.Critical Factors:a. Abrasive substances like dust, fly ash, and sand in gas [0.005 to 20 grains/ft3)Important Factors:a. Gas density [0.1 to 0.6 lb/ft3]Related Factors: a. Humidity [50 to 100%]
B. Cracked Inlet Box of Blower.Critical Factors:a. Gas temperature [300 to 600 ° F]b. High pressure head [1.5 to 8 psi]Important Factors:a. High rotor speed [2000 to 3500 rpm]b. H;S04 partial pressure [0.15 to 75 psi]c. C 02 partial pressure [1.5 to 150 psi]Related Factors:a. Humidity [50 to 100%]
C. Misaligned Wheel Bearings of Blower.Critical Factors:a. High pressure head [1.5 to 6 psi]b. High rotor speed [2000 to 4500 rmp]Important Factors:a. Gas temperature [200 to 500 ’ F]Related Factors:a. Gas density [0.08 to 0.5 lb/ft3]
D. Cracked Wheel of Blower.Critical Factors:
157
Reproduced with permission of the copyright owner. Further reproduction prohibited without permission.

a. High pressure head [1.5 to 6 psi]Important Factors:a. Gas temperature [600 to 850 * F]b. H2S04 partial pressure [0.15 to 75 psi]c. C02 partial pressure [1.5 to 150 psi]Related Factors:a. Humidity [50 to 100%]
E. Damaged Shaft Seals of Blower.Critical Factors:a. Abrasive substances like sand, fly ash, dust, etc, in gas [0.005 to 20 grains/ft3]b. Gas temperature [200 to 500 ” F]Important Factors:a. High rotor speed [2000 to 4500 rmp]b. H2S04 partial pressure [0.15 to 75 psi]c. C 02 partial pressure [1.5 to 150 psi]Related Factors:a. Humidity [50 to 100%]
F. Expanded Shaft of Blower.Critical Factors:a. Gas temperature [300 to 700 ° F]Important Factors:a. High rotor speed [1500 to 4000]b. High head pressure [2 to 5 psi]
G. Worn Wheel Blades of Blower.Critical Factors:a. Abrasive substances like sand, fly ash, dust, etc, in gas [0.005 to 20 grains/ft3] Important Factors:a. High rotor speed [2000 to 4500 rmp]b. H2S04 partial pressure [0.15 to 75 psi]c. C 02 partial pressure [1.5 to 150 psi]d. Gas temperature [300 to 500 ° F]Related Factors:a. Gas density [0.1 to 0.6 lb/ft3]
H. Misaligned Couplings Inlet Bells of Blower.Critical Factors:a. High rotor speed [3000 to 5000 rpm]Important Factors:a. High head pressure [2 to 5 psi]b. Gas temperature [300 to 500 ° F]Related Factors:a. Gas density [0.08 to 0.5 lb/ft3]
158
Reproduced with permission of the copyright owner. Further reproduction prohibited without permission.
I. Worn Scroll and Housing Liners of Blower.Critical Factors:a. Abrasive substances like sand, fly ash, dust, etc, in gas [0.005 to 20 grains/ft3] Important Factors:a. H2S04 partial pressure [0.15 to 75 psi]b. C 02 partial pressure [1.5 to 150 psi]c. Gas temperature [200 to 600 * F]Related Factors:a. Gas density [0.08 to 0.5 lb/ft3]b. Humidity [50 to 100%]
J. Damaged Mechanical Seals in Stuffing Box of Pump.Critical Factors:a. Abrasive fluid [1 to 10% solids by weight]b. PV factor [35000 to 70000 psi * ft/min]Important Factors:a. Fluid temperature [100 to 750 * F] b Fluid pH [ 4 to 0 and 10 to 14]Related Factors:a. Impeller speed [3000 to 6000 rpm]b. Fluid viscosity [150 to 1000 SSU]
K. Worn Impeller of Pump.Critical Factors:a. Abrasive fluid [1 to 8 % solids by weight]Important Factors:a. Fluid temperature [200 to 400 ° F]b. Fluid pH [ 4 to 0 and 10 to 14]Related Factors:a. Impeller speed [1200 to 5000 rpm]b. Fluid viscosity [150 to 800 SSU]
L. Faulty Thrust Bearings of Pump.Critical Factors:a. Combined stress on bearings [1000 to 5000 psi]Important Factors:a. Fluid temperature [120 to 300" F or 40 to 0 “ F]b. Impeller speed [1500 to 5000 rpm]Related Factors:a. Humidity [60 to 100%]
M. Deformed Shaft of Pump.Critical Factors:a. Impeller speed [1000 to 4500 rpm]b. Combined stress on shaft [1500 to 6000 psi]
159
Reproduced with permission of the copyright owner. Further reproduction prohibited without permission.

Important Factors:a. Fluid temperature [300 to 650 * F or 20 to 0 * F]Related Factors:a. Suction pressure [10 to 30 psi]b. Fluid pH [4 to 0 and 10 to 14]c. Fluid viscosity [100 to 1000 SSU]
N. Leaking Casing of Pump.Critical Factors:a. PV factor [4000 to 70000 psi * ft/min]Important Factors:a. Fluid temperature [150 to 400 * F]b. Fluid pH [4 to 0 and 10 to 14]Related Factors:a. Suction pressure [15 to 50 psi]
O. Faulty Shaft Couplings of Pump.Critical Factors:a. Combined stress on shaft [2000 to 7000 psi]Important Factors:a. Impeller speed [1000 to 5000 rpm]b. Fluid temperature [150 to 700 'F]Related Factors:a. Humidity [80 to 100%]b. Fluid viscosity [100 to 1000 SSU]
P. Faulty Impeller Wear Ring of Pump.Critical Factors:a. Abrasive fluid [1 to 10 % solids by weight]Important Factors:a. Impeller speed [3000 to 4500 rpm or 1500 to 700 rpm]Related Factors:a. Fluid temperature [200 to 500 ° F]b. Fluid viscosity [200 to 1000 SSU]
Q. Plugged Spray Nozzle in Combustion Chamber.Critical Factors:a. Abrasive substances in air [0.05 to 20 grains/ft3]b. Abrasive substances in liquid fuel [0.1 to 2% solids by weight] Important Factors:a. Low air rate [750 to 550 fF/min]b. Flame temperature [1200 to 1700 *F]Related Factors:a. Low atomizing pressure [4 to 2 psi]b. Low operating liquid rate [30 to 15 short tons/day]
160
Reproduced with permission of the copyright owner. Further reproduction prohibited without permission.

R. Carbonaceous Matter Formation in Combustion Chamber.Critical Factors:a. Ash content in liquid fuel [0.05 to 0.1% solids by weight]b. Carbon dioxide content in burner gas [0.27 to 0.8% of total volume]c. Carbon content in liquid fuel [0.5 to 1% solids by weight]Important Factors:a. Abrasive substances in air [0.05 to 20 grains/ft3]Related Factors:a. High air rate [550 to 750 ftVmin]b. High operating liquid rate [15 to 30 short tons/day]
CENTRIFUGAL BLOWER Ref. [10, 16, 77, 53, 64. 78]
A. Obstructed Inlet or Outlet Ducts.Critical Factors:a. Abrasive substances like dust, fly ash, and sand in gas [0.005 to 20 grains/ft3)Important Factors:a. Gas density [0.1 to 0.6 lb/ft3]Related Factors: a. Humidity [50 to 100%]
B. Cracked Inlet Box.Critical Factors:a. Gas temperature [300 to 600 * F]b. High pressure head [1.5 to 8 psi]Important Factors:a. High rotor speed [2000 to 3500 rpm]b. H,S04 partial pressure [0.15 to 75 psi]c. CO, partial pressure [1.5 to 150 psi]Related Factors:a. Humidity [50 to 100%]
C. Misaligned Wheel Bearings.Critical Factors:a. High pressure head [1.5 to 6 psi]b. High rotor speed [2000 to 4500 rmp]Important Factors:a. Gas temperature [200 to 500 ° F]Related Factors:a. Gas density [0.08 to 0.5 lb/ft3]
D. Cracked Wheel.Critical Factors:a. High pressure head [1.5 to 6 psi]
161
Reproduced with permission of the copyright owner. Further reproduction prohibited without permission.
Important Factors:a. Gas temperature [600 to 850 ' F]b. H2S04 partial pressure [0.15 to 75 psi]c. C 02 partial pressure [1.5 to 150 psi]Related Factors:a. Humidity [50 to 100%]
E. Damaged Shaft Seals.Critical Factors:a. Abrasive substances like sand, fly ash, dust, etc, in gas [0.005 to 20 grains/fit3]b. Gas temperature [200 to 500 ” F]Important Factors:a. High rotor speed [2000 to 4500 rmp]b. H2S04 partial pressure [0.15 to 75 psi]c. CO, partial pressure [1.5 to 150 psi]Related Factors:a. Humidity [50 to 100%]
F. Expanded Shaft.Critical Factors:a. Gas temperature [300 to 700 ° F]Important Factors:a. High rotor speed [1500 to 4000]b. High head pressure [2 to 5 psi]
G. Worn Wheel Blades.Critical Factors:a. Abrasive substances like sand, fly ash, dust, etc, in gas [0.005 to 20 grains/ft3] Important Factors:a. High rotor speed [2000 to 4500 rmp]b. H2S04 partial pressure [0.15 to 75 psi]c. C 02 partial pressure [1.5 to 150 psi]d. Gas temperature [300 to 500 ’ F]Related Factors:a. Gas density [0.1 to 0.6 lb/ft3]
H. Misaligned Couplings Inlet Bells.Critical Factors:a. High rotor speed [3000 to 5000 rpm]Important Factors:a. High head pressure [2 to 5 psi]b. Gas temperature [300 to 500 ’ F]Related Factors:a. Gas density [0.08 to 0.5 lb/ft3]
162
Reproduced with permission of the copyright owner. Further reproduction prohibited without permission.

I. Worn Scroll and Housing Liners.Critical Factors:a. Abrasive substances like sand, fly ash, dust, etc, in gas [0.005 to 20 grains/ft3] Important Factors:a. H2S04 partial pressure [0.15 to 75 psi]b. C 02 partial pressure [1.5 to 150 psi]c. Gas temperature [200 to 600 * F]Related Factors:a. Gas density [0.08 to 0.5 lb/ft3]b. Humidity [50 to 100%]
CENTRIFUGAL PUMP Ref. [8, 15,41, 42, 74, 86, 89, 108]
A. Damaged Mechanical Seals in Stuffing Box.Critical Factors:a. Abrasive fluid [ 1 to 10% solids by weight]b. PV factor [35000 to 70000 psi * ft/min]Important Factors:a. Fluid temperature [100 to 750 ' F] b Fluid pH [ 4 to 0 and 10 to 14]Related Factors:a. Impeller speed [3000 to 6000 rpm]b. Fluid viscosity [150 to 1000 SSU]
B. Worn Impeller.Critical Factors:a. Abrasive fluid [1 to 8 % solids by weight]Important Factors:a. Fluid temperature [200 to 400 ° F]b Fluid pH [ 4 to 0 and 10 to 14]Related Factors:a. Impeller speed [1200 to 5000 rpm]b. Fluid viscosity [150 to 800 SSU]
C. Faulty Thrust Bearings.Critical Factors:a. Combined stress on bearings [1000 to 5000 psi]Important Factors:a. Fluid temperature [120 to 3000 F or 40 to 0 * F]b. Impeller speed [1500 to 5000 rpm]Related Factors:a. Humidity [60 to 100%]
163
Reproduced with permission of the copyright owner. Further reproduction prohibited without permission.

D. Deformed Shaft.Critical Factors:a. Impeller speed [1000 to 4500 rpm]b. Combined stress on shaft [1500 to 6000 psi] Important Factors:a. Fluid temperature [300 to 650 * F or 20 to 0 ’ F] Related Factors:a. Suction pressure [10 to 30 psi]b. Fluid pH [4 to 0 and 10 to 14]c. Fluid viscosity [100 to 1000 SSU]
E. Leaking Casing.Critical Factors:a. PV factor [4000 to 70000 psi * ft/min]Important Factors:a. Fluid temperature [150 to 400 * F]b Fluid pH [4 to 0 and 10 to 14]Related Factors:a. Suction pressure [15 to 50 psi]
F. Faulty Shaft Couplings.Critical Factors:a. Combined stress on shaft [2000 to 7000 psi]Important Factors:a. Impeller speed [1000 to 5000 rpm]b. Fluid temperature [150 to 700 * F]Related Factors:a. Humidity [80 to 100%]b. Fluid viscosity [100 to 1000 SSU]
G. Faulty Impeller Wear Ring.Critical Factors:a. Abrasive fluid [1 to 10 % solids by weight]Important Factors:a. Impeller speed [3000 to 4500 rpm or 1500 to 700 rpm] Related Factors:a. Fluid temperature [200 to 500 * F]b. Fluid viscosity [200 to 1000 SSU]
CONVERTER Ref. [21, 23, 45, 51, 63, 64]
A. Damaged Supporting Grids.Critical Factors:a. Gas temperature [700 to 1000 " F]
164
Reproduced with permission of the copyright owner. Further reproduction prohibited without permission.

b. Catalyst weight [500 to 3000 lb]Important Factors:a. Abrasive substances like sand, fly ash, dust, etc, in gas [0.2 to 10 grains/ft3] Related Factors:a. Catalyst pH [4 to 0 and 10 to 14]b. H2S04 partial pressure [0.15 to 75 psi]c. C 02 partial pressure [1.5 to 150 psi]
B. Corroded or Cracked Supporting Flanges.Critical Factors:a. Abrasive substances like sand, fly ash, dust, etc, in gas [0.1 to 8 grains/ft3]b. Catalyst weight [1000 to 2000 lb]Important Factors:a. Gas temperature [500 to 1000 * F]b. H2S04 partial pressure [0.15 to 75 psi]c. C 02 partial pressure [1.5 to 150 psi Related Factors:a. Gas density [0.15 to 0.7 lb/ft3]
C. Plugged Vessel Walls and Ducts.Critical Factors:a. Abrasive substances like sand, fly ash, dust, etc., in gas [0.1 to 8 grains/ft3] Important Factors:a. Gas temperature [700 to 1000 ’ F]b. H2S04 partial pressure [0.15 to 75 psi]c. C 02 partial pressure [1.5 to 150 psid. Averaged total gas mass velocity [60 to 100 fit3/ min/ft2]Related Factors:a. Gas density [0.08 to 0.6 lb/ft3]b. Humidity [75 to 100%]
D. Fouled Heat Exchanger Tubes.Critical Factors:a. Abrasive substances like sand, fly ash, dust, etc., in gas [0.1 to 10 grains/ft3]b. Gas velocity inside heat exchanger tubes [80 to 40 ft3/ min/fit2]Important Factors:a. Gas temperature [300 to 900 * F]b. H2S04 partial pressure [0.15 to 75 psi]c. C 02 partial pressure [1.5 to 150 psi Related Factors:a. Gas density [0.1 to 0.7 lb/ft3]
165
Reproduced with permission of the copyright owner. Further reproduction prohibited without permission.

DISTILLATION TOWER Ref. [1, 9, 16, 21, 45, 53, 63, 75]
A. Deformed or Broken Rings.Critical Factors:a. High column holdup [10 to 30%]Important Factors:a. Average tower top pressure drop [10 to 20%]Related Factors:a. Leaving liquid temperature [20 to -20 “ F or 150 to 300 " F]
B. Unleveled Liquid Distributor.Critical Factors:a. Start-up pressure surge [0.5 to 1 psi]Important Factors:a. Fed liquid rate [3000 to 10000 lb/ftr per hr]Related Factors:a. Fed liquid viscosity [800 to 3000 SSU]
C. Plugged or Corroded Distributor.Critical Factors:a. Low fed liquid rate [2000 to 500 lb/ft2 per hr]b. Abrasive substances (slurry) in liquid [5 to 20% solids by weight]Important Factors:a. Liquid pH [4 to 0 or 10 to 14]Related Factors:a. Fed liquid viscosity [800 to 3000 SSU]
D. Fouled Column Packing or Internals.Critical Factors:a. Abrasive substances (slurry) in liquid input mixture [5 to 20% solids by weight] Important Factors:a. Fed liquid pH [4 to 0 or 10 to 14]b. H2S04 partial pressure in leaving gas [0.15 to 75 psi]c. C 02 partial pressure in leaving gas [1.5 to 150 psi Related Factors:a. Fed liquid viscosity [500 to 2500 SSU]
EVAPORATOR Ref. [5, 63, 64,68, 81, 90, 108]
A. Damaged Mechanical Seals in Stuffing Box of Pump.Critical Factors:a. Abrasive fluid [1 to 10% solids by weight]b. PV factor [35000 to 70000 psi * ft/min]
166
Reproduced with permission of the copyright owner. Further reproduction prohibited without permission.

Important Factors:a. Fluid temperature [100 to 750 ' F]b Fluid pH [ 4 to 0 and 10 to 14]Related Factors:a. Impeller speed [3000 to 6000 rpm]b. Fluid viscosity [150 to 1000 SSU]
B. Worn Impeller of Pump.Critical Factors:a. Abrasive fluid [1 to 8 % solids by weight] Important Factors:a. Fluid temperature [200 to 400 ‘ F]b. Fluid pH [ 4 to 0 and 10 to 14]Related Factors:a. Impeller speed [1200 to 5000 rpm]b. Fluid viscosity [150 to 800 SSU]
C. Faulty Thrust Bearings of Pump.Critical Factors:a. Combined stress on bearings [1000 to 5000 psi] Important Factors:a. Fluid temperature [120 to 300 ” F or 40 to 0 ' F]b. Impeller speed [1500 to 5000 rpm]Related Factors:a. Humidity [60 to 100%]
D. Deformed Shaft of Pump.Critical Factors:a. Impeller speed [1000 to 4500 rpm]b. Combined stress on shaft [1500 to 6000 psi] Important Factors:a. Fluid temperature [300 to 650 * F or 20 to 0 ° F] Related Factors:a. Suction pressure [10 to 30 psi]b. Fluid pH [4 to 0 and 10 to 14]c. Fluid viscosity [100 to 1000 SSU]
E. Leaking Casing of Pump.Critical Factors:a. PV factor [4000 to 70000 psi * ft/min] Important Factors:a. Fluid temperature [150 to 400 " F]b. Fluid pH [4 to 0 and 10 to 14]Related Factors:a. Suction pressure [15 to 50 psi]
167
Reproduced with permission of the copyright owner. Further reproduction prohibited without permission.

F. Faulty Shaft Couplings of Pump.Critical Factors:a. Combined stress on shaft [2000 to 7000 psi]Important Factors:a. Impeller speed [1000 to 5000 rpm]b. Fluid temperature [150 to 700 ’ F]Related Factors:a. Humidity [80 to 100%]b. Fluid viscosity [100 to 1000 SSU]
G. Faulty Impeller Wear Ring of Pump.Critical Factors:a. Abrasive fluid [1 to 10 % solids by weight]Important Factors:a. Impeller speed [3000 to 4500 rpm or 1500 to 700 rpm]Related Factors:a. Fluid temperature [200 to 500 * F]b. Fluid viscosity [200 to 1000 SSU]
H. Broken Tube Support Baffles of Heat Exchanger.Critical Factors:a. Shell-side liquid or gas temperature [250 to 500 " F]Important Factors:a. Shell-side liquid cross flow velocity [8 to 12 ft/s]b. Shell-side gas pressure [50 to 500 psi]c. Shell-side gas H2S04 partial pressure [0.15 to 75 psi]d. Shell-side gas C 02 partial pressure [1.5 to 150 psi]Related Factors:a. Shell-side fluid viscosity [150 to 800 SSU]b. Shell-side gas density [0.1 to 0.6 lb/ft3]
I Cracked Tubes of Heat Exchanger.Critical Factors:a. Tube-side temperature [30 to -100 * F]b. Shell-side temperature [300 to 500 ° F]Important Factors:a. Tube-side fluid cross flow velocity [7 to 15 ft/s]b. Abrasive substances in shell-side gas [0.1 to 20 grains/ft3]c. Abrasive substances in shell-side fluid [2 to 10% solids by weight]d. Abrasive substances in tube-side fluid [2 to 10% solids by weight] Related Factors:a. Shell-side fluid cross flow velocity [9 to 15 ft/s]b. Shell-side gas pressure [50 to 500 psi]
168
Reproduced with permission of the copyright owner. Further reproduction prohibited without permission.

J Deformed Impingement Plate o f Heat Exchanger.Critical Factors:a. Shell-side fluid cross flow velocity [9 to 15 ft/s]b. Shell-side gas pressure [50 to 500 psi]Important Factors:a. Shell-side temperature [150 to 800 * F]b. Abrasive substances in shell-side gas [0.1 to 20 grains/ft3]c. Abrasive substances in shell-side fluid [2 to 10% solids by weight] Related Factors:a. Shell-side fluid cross flow velocity [9 to 15 ft/s]b. Shell-side gas pressure [50 to 500 psi]
K Fouled Tubes of Heat Exchanger.Critical Factors:a. Shell-side liquid or gas temperature [150 to 800 ° F]b. Abrasive substdnces in shell-side gas [0.1 to 20 grains/ft3]c. Abrasive substances in shell-side fluid [1 to 8% solids by weight] Important Factors:a. Low shell-side liquid cross flow velocity [15 to 3 ft/s]b. Tube-side fluid pH [4 to 0 or 10 to 14]c. Shell-side gas H2S04 partial pressure [0.15 to 75 psi]d. Shell-side gas C 02 partial pressure [1.5 to 150 psi]Related Factors:a. Shell-side fluid viscosity [100 to 700 SSU]b. Tube-side fluid viscosity [100 to 700 SSU]c. Shell-side gas density [0.1 to 0.5 lb/fit3]
L. Corroded Exchanger and Kettle Surfaces.Critical Factors:a. Tube-side fluid pH [4 to 0 or 10 to 14]b. Shell-side gas H2S04 partial pressure [0.15 to 75 psi]c. Shell-side gas C 02 partial pressure [1.5 to 150 psi]Important Factors:a. Shell-side liquid cross flow velocity [7 to 13 ft/s]b. Atmospheric humidity [80 to 100%]Related Factors:a. Shell-side fluid viscosity [100 to 500 SSU]b. Tube-side fluid viscosity [100 to 500 SSU]c. Shell-side gas density [0.1 to 0.5 lb/ft3]
M. Plugged or Corroded Vapor Heads Walls.Critical Factors:a. Abrasive substance in final liquor [1 to 8% solids by weight]Important Factors:a. Liquor pH [4 to 0 and 10 to 14]
169
Reproduced with permission of the copyright owner. Further reproduction prohibited without permission.

b. Liquor temperature [100 to 350 " F]Related Factors:a. Final liquor viscosity [800 to 3000 SSU]
N. Leaking Circulation Pipe Joints.Critical Factors:a. Liquor temperature [200 to 750 “ F]b. Average fluid pressure in circulation pipe [100 to 500 psi] Important Factors:a. Average fluid cross flow velocity in pipe [10 to 20 ft/s]Related Factors:a. Liquor pH [4 to 0 or 10 to 14]
O. Plugged Tube Inlets.Critical Factors:a. Abrasive substance in final liquor [3 to 10% solids by weight] Important Factors:a. Average temperature in circulation pipe [150 to 300 ’ F]b. Average cross flow velocity in circulation pipe [9 to 5 ft/s] Related Factors:a. Final liquor viscosity [800 to 3000 SSU]
HEAT EXCHANGER Ref. [16,27, 29, 53, 61, 83]
A. Broken Tube Support Baffles.Critical Factors:a. Shell-side liquid or gas temperature [250 to 500 * F] Important Factors:a. Shell-side liquid cross flow velocity [8 to 12 ft/s]b. Shell-side gas pressure [50 to 500 psi]c. Shell-side fluid pH [4 to 0 or 10 to 14]d. Shell-side gas H2S04 partial pressure [0.15 to 75 psi]e. Shell-side gas CO, partial pressure [1.5 to 150 psi]Related Factors:a. Shell-side fluid viscosity [150 to 800 SSU]b. Shell-side gas density [0.1 to 0.6 lb/ft3]
B. Cracked Tubes.Critical Factors:a. Tube-side temperature [30 to -100 ’ F]b. Shell-side temperature [300 to 500 * F]Important Factors:a. Tube-side fluid cross flow velocity [7 to 15 fit/s]b. Abrasive substances in shell-side gas [0.1 to 20 grains/ft3]
170
Reproduced with permission of the copyright owner. Further reproduction prohibited without permission.

c. Abrasive substances in shell-side fluid [2 to 10% solids by weight]d. Abrasive substances in tube-side fluid [2 to 10% solids by weight] Related Factors:a. Shell-side fluid cross flow velocity [9 to 15 ft/s]b. Shell-side gas pressure [50 to 500 psi]
C. Deformed Impingement Plate.Critical Factors:a. Shell-side fluid cross flow velocity [9 to 15 ft/s]b. Shell-side gas pressure [50 to 500 psi]Important Factors:a. Shell-side temperature [150 to 800 ’ F]b. Abrasive substances in shell-side gas [0.1 to 20 grains/ft3]c. Abrasive substances in shell-side fluid [2 to 10% solids by weight] Related Factors:a. Shell-side fluid cross flow velocity [9 to 15 ft/s]b. Shell-side gas pressure [50 to 500 psi]
D. Fouled Tubes.Critical Factors:a. Shell-side liquid or gas temperature [150 to 800 ° F]b. Abrasive substances in shell-side gas [0.1 to 20 grains/ft3]c. Abrasive substances in shell-side fluid [1 to 8% solids by weight] Important Factors:a. Low shell-side liquid cross flow velocity [15 to 3 ft/s]b. Tube-side fluid pH [4 to 0 or 10 to 14]c. Shell-side fluid pH [4 to 0 or 10 to 14]d. Shell-side gas H2S04 partial pressure [0.15 to 75 psi]e. Shell-side gas C 02 partial pressure [1.5 to 150 psi]Related Factors:a. Shell-side fluid viscosity [100 to 700 SSU]b. Tube-side fluid viscosity [100 to 700 SSU]c. Shell-side gas density [0.1 to 0.5 lb/ft3]
E. Corroded Exchanger and Kettle Surfaces.Critical Factors:a. Tube-side fluid pH [4 to 0 or 10 to 14]b. Shell-side fluid pH [4 to 0 or 10 to 14]c. Shell-side gas H2S04 partial pressure [0.15 to 75 psi]d. Shell-side gas C 02 partial pressure [1.5 to 150 psi]Important Factors:a. Shell-side liquid cross flow velocity [7 to 13 ft/s]b. Atmospheric humidity [80 to 100%]Related Factors:a. Shell-side fluid viscosity [100 to 500 SSU]
171
Reproduced with permission of the copyright owner. Further reproduction prohibited without permission.

b. Tube-side fluid viscosity [100 to 500 SSU]c. Shell-side gas density [0.1 to 0.5 lb/ft3]
MULTISTAGE COMPRESSOR Ref. [16, 27, 29, 53, 61, 83]
A. Deformed Thrust Bearings.Critical Factors:a. Loads on thrust bearings [150 to 500 psi]Important Factors:a. Rotor speed [3000 to 20000 rpm]Related Factors:a. Atmospheric humidity [60 to 100%]
B. Plugged Stationary Elements.Critical Factors:a. Abrasive substances in gas [0.01 to 20 grains/ft3]Important Factors:a. Gas H2S04 partial pressure [0.15 to 75 psia]b. Gas C 02 partial pressure [1.5 to 150 psia]Related Factors:a. Gas density [0.1 to 0.6 lb/ft3]
C. Eroded Impellers Exit Tips.Critical Factors:a. Abrasive substances in gas [0.05 to 10 grains/ft3]Important Factors:a. Inlet capacity [25000 to 30000 ft3]b. Rotor speed [3000 to 20000 rpm]Related Factors:a. Gas density [0.15 to 0.7 lb/ft3]
D. Damaged Shaft and Interstage (Labyrinth) Seals.Critical Factors:a. Gas temperature [200 to 500 * F]Important Factors:a. Abrasive substances in gas [0.01 to 20 grains/fit3]b. Discharge pressure [ 10 to 20 psi]Related Factors:a. Gas density [0.08 to 0.5 lb/ft3]b. Atmospheric humidity [60 to 100%]
E. Misaligned Shaft.Critical Factors:a. Rotor speed [3000 to 10000 rpm]
172
Reproduced with permission of the copyright owner. Further reproduction prohibited without permission.

Important Factors:a. Gas temperature [300 to 600 ‘ F]Related Factors:a. Gas density [0.15 to 0.7 lb/ft3]b. Atmospheric humidity [80 to 100%]
PIPE (low pressure gas) Ref. [28, 70, 73, 94, 103]
A. Leaking Fittings or Joints.Critical Factors:a. Gas pressure [250 to 500 psi]b. Gas temperature [400 to 750 ‘ F]Important Factors:a. Abrasive substances in gas [0.8 to 15 grains/ft3]b. Gas H2S04 partial pressure [0.15 to 75 psia]c. Gas C 02 partial pressure [1.5 to 150 psia]Related Factors:a. Gas density [0.15 to 0.6 lb/fit3]
B. Cracked Pipe Due To Over-stress.Critical Factors:a. Pressure surges between 30 to 50% of MAOP (maximum allowable operating pressure) Important Factors:a. Gas pressure [200 to 500 psi]b. Gas temperature [400 to 500 * F]Related Factors:a. Gas H2S04 partial pressure [0.15 to 75 psia]b. Gas C 02 partial pressure [1.5 to 150 psia]
C. Plugged Inner Section.a. Abrasive substances in gas [0.8 to 15 grains/ft3]Important Factors:a. Gas temperature [200 to 500 ° F]b. Gas H2S04 partial pressure [0.15 to 75 psia]c. Gas CO, partial pressure [1.5 to 150 psia]Related Factors:a. Gas density [0.15 to 0.6 lb/ft3]
D. Bent Pipe.Critical Factors:a. Average span between supports [10 to 17 ft]b. Gas temperature [350 to 600 “ F or -10 to -20 ' F]Important Factors:a. Gas pressure [350 to 600 psi]
173
Reproduced with permission of the copyright owner. Further reproduction prohibited without permission.

Related Factors:a. Abrasive substances in gas [0.8 to 15 grains/ft3]
E. Corroded or Eroded Inner Wall.Critical Factors:a. Gas H2S 04 partial pressure [0.15 to 75 psia]b. Gas C 02 partial pressure [1.5 to 150 psia]Important Factors:a. Abrasive substances in gas [0.8 to 15 grains/ft3]b. Gas temperature [200 to 500 ' F]Related Factors:a. Atmospheric humidity [70 to 100%]
PIPE (low pressure fluid) Ref. [28, 70, 73, 94, 103]
A. Leaking Fittings or Joints.Critical Factors:a. Fluid pressure [250 to 500 psi]b. Fluid temperature [400 to 750 ’ F]Important Factors:a. Abrasive substances in fluid [3 to 10% solids by weight]b. Fluid pH [4 to 0 or 10 to 14]Related Factors:a. Fluid viscosity [500 to 3000 SSU]
B. Cracked Pipe Due To Over-stress.Critical Factors:a. Pressure surges between 10 to 20% of MAOP (maximum allowable operating pressure) Important Factors:a. Fluid pressure [100 to 150 psi]b. Fluid temperature [300 to 450 ” F]c. Fluid cross flow velocity [12 to 22 fit/s]Related Factors:a. Fluid pH [4 to 0 or 10 to 14]
C. Plugged Inner Section.a. Abrasive substances in fluid [5 to 10% solids by weight]Important Factors:a. Fluid temperature [150 to 300 ’F]b. Fluid pH [4 to 0 or 10 to 14]c. Low fluid cross flow velocity [8 to 3 ft/s]Related Factors:a. Fluid viscosity [800 to 3500 SSU]
174
Reproduced with permission of the copyright owner. Further reproduction prohibited without permission.

D. Bent Pipe.Critical Factors:a. Average span between supports [8 to 14 ft]b. Gas temperature [350 to 600 * F or -20 to -30 ' F] Important Factors:a. Fluid pressure [100 to 200 psi]Related Factors:a. Abrasive substances in fluid [5 to 10% solids by weight]
E. Corroded or Eroded Inner Wall.Critical Factors:a. Fluid pH [4 to 0 or 10 to 14]Important Factors:a. Abrasive substances in fluid [5 to 15% solids by weight]b. Fluid temperature [100 to 400 ° F]c. Fluid cross flow velocity [10 to 20 ft/s]Related Factors:a. Atmospheric humidity [70 to 100%]
REACTOR Ref. [7, 64, 65, 96, 101, 111]
A. Worn or faulty Stirrer Couplings.Critical Factors:a. Reaction temperature [200 to 800 ° F]Important Factors:a. Mixture viscosity [500 to 3000 SSU]b. Stirrer velocity [50 to 100 rpm]Related Factors:a. Solution pH [4 to 0 or 10 to 14]
B. Non-Iubricated Drive Bearings and Gears.Critical Factors:a. Atmospheric humidity [60 to 100%]Important Factors:a. Reaction temperature [150 to 700 ° F]Related Factors:a. Stirrer velocity [60 to 100 rpm]
C. Damaged Discharged Nozzle Seals.Critical Factors:a. Reaction temperature [200 to 600 * F]Important Factors:a. Vessel pressure [14.7 to 29.4 psi]
175
Reproduced with permission of the copyright owner. Further reproduction prohibited without permission.

Related Factors:a. Mixture viscosity [300 to 2500 SSU]
D. Defective Heating Coils.Important Factors:a. Atmospheric humidity [80 to 100%]b. Reaction temperature [200 to 700 * F]
WASTE HEAT BOILER Ref. [2, 9, 16, 45, 63, 78, 109]
A. Broken Expansion Joints.Critical Factors:a. Heating medium temperature [300 to 800 * F]Important Factors:a. Kettle pressure [50 to 150 psig]b. Low heating medium cross-flow velocity [10 to 3 ft/s]Related Factors:a. Abrasive substances in kettle water [1 to 10% solids by weight]
B. Fouled Tubes.Critical Factors:a. Abrasive substances in kettle water [2 to 10% solids by weight]b. Abrasive substances in heating medium [2 to 10% solids by weight] Important Factors:a. Heating medium temperature [200 to 800 * F]b. Low heating medium cross-flow velocity [15 to 3 ft/s]c. Heating medium and “water” pH [4 to 0 or 10 to 14]Related Factors:a. Heating medium viscosity [200 to 1000 SSU]b. Kettle pressure [80 to 150 psig]
C. Deformed Demister Mesh Pad.Critical Factors:a. Steam pressure [50 to 150 psi]Important Factors:a. Kettle temperature [100 to 400 ” F]Related Factors:a. Kettle “water” pH [4 to 0 or 10 to 14]
D. Cracked Boiler Drum Shell.Critical Factors:a. Kettle temperature [250 to 800 * F]b. Kettle pressure [100 to 150 psig]
176
Reproduced with permission of the copyright owner. Further reproduction prohibited without permission.

Important Factors:a. Abrasive substances in water [1 to 8% solids by weight] Related Factors:a. Kettle “water” pH [4 to 0 or 10 to 14]
177
Reproduced with permission of the copyright owner. Further reproduction prohibited without permission.
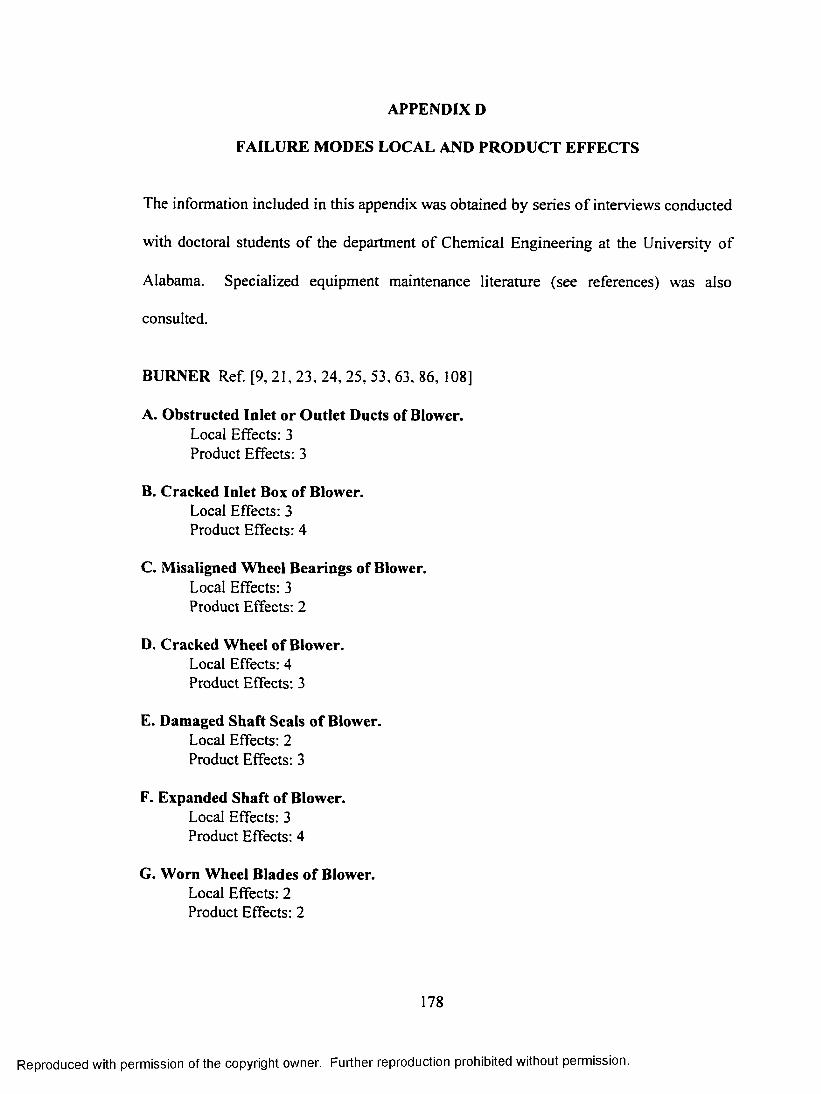
APPENDIX D
FAILURE MODES LOCAL AND PRODUCT EFFECTS
The information included in this appendix was obtained by series of interviews conducted
with doctoral students of the department of Chemical Engineering at the University of
Alabama. Specialized equipment maintenance literature (see references) was also
consulted.
BURNER Ref. [9, 21, 23, 24, 25, 53, 63, 86, 108]
A. Obstructed Inlet or Outlet Ducts of Blower.Local Effects: 3 Product Effects: 3
B. Cracked Inlet Box of Blower.Local Effects: 3 Product Effects: 4
C. Misaligned Wheel Bearings of Blower.Local Effects: 3 Product Effects: 2
D. Cracked Wheel of Blower.Local Effects: 4 Product Effects: 3
E. Damaged Shaft Seals of Blower.Local Effects: 2 Product Effects: 3
F. Expanded Shaft of Blower.Local Effects: 3 Product Effects: 4
G. Worn Wheel Blades o f Blower.Local Effects: 2 Product Effects: 2
178
Reproduced with permission of the copyright owner. Further reproduction prohibited without permission.

H. Misaligned Couplings Inlet Bells of Blower.Local Effects: 3 Product Effects: 2
I. Worn Scroll and Housing Liners of Blower.Local Effects: 4 Product Effects: 3
J. Damaged Mechanical Seals in Stuffing Box of Pump.Local Effects: 2 Product Effects: 4
K. Worn Impeller of Pump.Local Effects: 2 Product Effects: 3
L. Faulty Thrust Bearings of Pump.Local Effects: 4 Product Effects: 3
M. Deformed Shaft of Pump.Local Effects: 4 Product Effects: 4
N. Leaking Casing of Pump.Local Effects: 2 Product Effects: 3
O. Faulty Shaft Couplings of Pump.Local Effects: 4 Product Effects: 4
P. Faulty Impeller Wear Ring of Pump.Local Effects: 4 Product Effects: 2
Q. Plugged Spray Nozzle in Combustion Chamber.Local Effects: 2 Product Effects: 2
R. Carbonaceous Matter Formation in Combustion Chamber.Local Effects: 2 Product Effects: 1
179
Reproduced with permission of the copyright owner. Further reproduction prohibited without permission.

CENTRIFUGAL BLOWER Ref. [10, 16, 77, 53, 64, 78]
A. Obstructed Inlet or Outlet Ducts.Local Effects: 3 Product Effects: 2
B. Cracked Inlet Box.Local Effects: 3 Product Effects: 3
C. Misaligned Wheel Bearings.Local Effects: 3 Product Effects: 2
D. Cracked Wheel.Local Effects: 4 Product Effects: 2
E. Damaged Shaft Seals.Local Effects: 2 Product Effects: 2
F. Expanded Shaft.Local Effects: 3 Product Effects: 3
G. Worn Wheel Blades.Local Effects: 2 Product Effects: 1
H. Misaligned Couplings Inlet Bells.Local Effects: 3 Product Effects: 2
I. Worn Scroll and Housing Liners.Local Effects: 3 Product Effects: 2
CENTRIFUGAL PUMP Ref. [8, 15, 41, 42, 74, 86, 89, 108]
A. Damaged Mechanical Seals in Stuffing Box.Local Effects: 2 Product Effects: 3
180
Reproduced with permission of the copyright owner. Further reproduction prohibited without permission.

B. Worn ImpellerLocal Effects: 2 Product Effects: 2
C. Faulty Thrust Bearings.Local Effects: 4 Product Effects: 2
D. Deformed Shaft.Local Effects: 4 Product Effects: 3
E. Leaking Casing.Local Effects: 2 Product Effects: 2
F. Faulty Shaft Couplings.Local Effects: 4 Product Effects: 3
G. Faulty Impeller Wear Ring.Local Effects: 4 Product Effects: 2
CONVERTER Ref. [21, 23.45, 51. 63, 64]
A. Damaged Supporting Grids.Local Effects: 2 Product Effects: 3
B. Corroded or Cracked Supporting Flanges.Local Effects: 3 Product Effects: 1
C. Plugged Vessel Walls and Ducts.Local Effects: 2 Product Effects: 2
D. Fouled Heat Exchanger Tubes.Local Effects: 4 Product Effects: 4
181
Reproduced with permission of the copyright owner. Further reproduction prohibited without permission.

DISTILLATION TOWER Ref. [1, 9, 16, 21, 45, 53, 63, 75]
A. Deformed or Broken Rings.Local Effects: 3 Product Effects: 3
B. Unleveled Liquid Distributor.Local Effects: 2 Product Effects: 1
C. Plugged or Corroded Distributor.Local Effects: 2 Product Effects: 2
D. Fouled Column Packing or Internals.Local Effects: 3 Product Effects: 4
EVAPORATOR Ref. [5, 63, 64, 68, 81, 90, 108]
A. Damaged Mechanical Seals in Stuffing Box of Pump.Local Effects: 3 Product Effects: 3
B. Worn Impeller of Pump.Local Effects: 3 Product Effects: 3
C. Faulty Thrust Bearings of Pump.Local Effects: 4 Product Effects: 3
D. Deformed Shaft of Pump.Local Effects: 4 Product Effects: 3
E. Leaking Casing of Pump.Local Effects: 3 Product Effects: 2
F. Faulty Shaft Couplings of Pump.Local Effects: 4 Product Effects: 4
182
Reproduced with permission of the copyright owner. Further reproduction prohibited without permission.

G. Faulty Impeller Wear Ring of Pump.Local Effects: 4 Product Effects: 2
H. Broken Tube Support Baffles of Heat Exchanger.Local Effects: 4 Product Effects: 3
I. Cracked Tubes of Heat Exchanger.Local Effects: 4 Product Effects: 4
J. Deformed Impingement Plate of Heat Exchanger.Local Effects: 1 Product Effects: 1
K. Fouled Tubes of Heat Exchanger.Local Effects: 4 Product Effects: 3
L. Corroded Exchanger and Kettle Surfaces.Local Effects: 2 Product Effects: 2
M. Plugged or Corroded Vapor Heads Walls.Local Effects: 1 Product Effects: 2
N. Leaking Circulation Pipe Joints.Local Effects: 3 Product Effects: 3
O. Plugged Tube Inlets.Local Effects: 2 Product Effects: 3
HEAT EXCHANGER Ref. [16, 27, 29, 53, 61, 83]
A. Broken Tube Support Baffles.Local Effects: 4 Product Effects: 3
183
Reproduced with permission of the copyright owner. Further reproduction prohibited without permission.

B. Cracked Tubes.Local Effects: 4 Product Effects: 4
C. Deformed Impingement Plate.Local Effects: 1 Product Effects: 1
D. Fouled Tubes.Local Effects: 4 Product Effects: 3
E. Corroded Exchanger and Kettle Surfaces.Local Effects: 2 Product Effects: 2
MULTISTAGE COMPRESSOR Ref. [16, 27, 29, 53, 61, 83]
A. Deformed Thrust Bearings.Local Effects: 3 Product Effects: 4
B. Plugged Stationary Elements.Local Effects: 3 Product Effects: 3
C. Eroded Impellers Exit Tips.Local Effects: 2 Product Effects: 2
D. Damaged Shaft and Interstage (Labyrinth) Seals.Local Effects: 3 Product Effects: 3
E. Misaligned Shaft.Local Effects: 4 Product Effects: 3
PIPE Ref. [28, 70, 73, 94, 103]
A. Leaking Fittings or Joints.Local Effects: 1 Product Effects: 3
184
Reproduced with permission of the copyright owner. Further reproduction prohibited without permission.

B. Cracked Pipe Due To Over-stress.Local Effects: 1 Product Effects: 3
C. Plugged Inner Section.Local Effects: 2 Product Effects: 3
D. Bent Pipe.Local Effects: 2 Product Effects: 2
E. Corroded or Eroded Inner Wall.Local Effects: 2 Product Effects: 2
REACTOR Ref. [7, 64, 65, 96, 101, 111]
A. Worn or faulty Stirrer Couplings.Local Effects: 2 Product Effects: 2
B. Non-lubricated Drive Bearings and Gears.Local Effects: 3 Product Effects: 2
C. Damaged Discharged Nozzle Seals.Local Effects: 2 Product Effects: 3
D. Defective Heating Coils.Local Effects: 2 Product Effects: 3
WASTE HEAT BOILER Ref [2, 9, 16, 45, 63, 78, 109]
A. Broken Expansion Joints.Local Effects: 3 Product Effects: 3
B. Fouled Tubes.Local Effects: 3 Product Effects: 3
185
Reproduced with permission of the copyright owner. Further reproduction prohibited without permission.

C. Deformed Demister Mesh Pad.Local Effects: 1 Product Effects: 2
D. Cracked Boiler Drum Shell.Local Effects: 4 Product Effects: 4
186
Reproduced with permission of the copyright owner. Further reproduction prohibited without permission.

APPENDIX E
FAILURE MODES NMS, DMS, NES, AND DES VALUES
The NMS, DMS, NES, and DES values depicted in this appendix were obtained by series
of interviews conducted with doctoral students of the department of Chemical
Engineering at the University of Alabama. Specialized equipment maintenance literature
(see references) was also consulted.
BURNER Ref. [9, 21, 23, 24, 25, 53, 63, 86, 108]
A. Obstructed Inlet or Outlet Ducts of Blower.NMS = 0.25DMS = 0.00 not pipe transmitted
NES DESCentrifugal Blower 0.25 0.00Centrifugal Pump 0.25 0.00Converter 0.00 0.00Distillation Tower 0.00 0.00Heat Exchanger 0.00 0.00Evaporator 0.25 0.00Multistage Compressor 0.25 0.00Pipe 0.00 0.00Reactor 0.00 0.00Waste Heat Boiler 0.00 0.00
B. Cracked Inlet Box of Blower.NMS = 0.25DMS = 0.00 not pipe transmitted
NES DESCentrifugal Blower 0.25 0.00Centrifugal Pump 0.25 0.00Converter 0.00 0.00Distillation Tower 0.00 0.00Heat Exchanger 0.00 0.00Evaporator 0.25 0.00Multistage Compressor 0.25 0.00Pipe 0.00 0.00
187
Reproduced with permission of the copyright owner. Further reproduction prohibited without permission.

Reactor 0.00 0.00Waste Heat Boiler 0.00 0.00
C. Misaligned Wheel Bearings of Blower.NMS = 0.50DMS = 0.00 not pipe transmitted
NES DESCentrifugal Pump 0.00 0.00Converter 0.25 0.00Distillation Tower 0.25 0.00Evaporator 0.25 0.00Centrifugal Blower 0.25 0.00Heat Exchanger 0.00 0.00Multistage Compressor 0.25 0.00Pipe 0.00 0.00Reactor 0.00 0.00Waste Heat Boiler 0.00 0.00
D. Cracked Wheel of Blower.NMS = 0.25DMS = 0.00 not pipe transmitted
NES DESCentrifugal Blower 0.25 0.00Centrifugal Pump 0.25 0.00Converter 0.00 0.00Distillation Tower 0.00 0.00Heat Exchanger 0.00 0.00Evaporator 0.25 0.00Multistage Compressor 0.25 0.00Pipe 0.00 0.00Reactor 0.00 0.00Waste Heat Boiler 0.00 0.00
E. Damaged Shaft Seals of Blower.NMS = 0.25DMS = 0.00 not pipe transmitted
NES DESCentrifugal Blower 0.25 0.00Centrifugal Pump 0.25 0.00Converter 0.00 0.00Distillation Tower 0.00 0.00Heat Exchanger 0.00 0.00Evaporator 0.25 0.00Multistage Compressor 0.25 0.00Pipe 0.00 0.00
188
Reproduced with permission of the copyright owner. Further reproduction prohibited without permission.

ReactorWaste Heat Boiler
0.000.00
0.000.00
F. Expanded Shaft of Blower.NMS = 0.50DMS = 0.00 not pipe transmitted
NES DESCentrifugal Pump 0.00 0.00Converter 0.25 0.00Distillation Tower 0.25 0.00Evaporator 0.25 0.00Centrifugal Blower 0.25 0.00Heat Exchanger 0.00 0.00Multistage Compressor 0.25 0.00Pipe 0.00 0.00Reactor 0.00 0.00Waste Heat Boiler 0.00 0.00
G. Worn Wheel Blades of Blower.NMS = 0.00DMS = 0.00 not pipe transmitted
H. Misaligned Couplings Inlet Bells of Blower.NMS = 0.25DMS = 0.00 not pipe transmitted
NES DESCentrifugal Blower 0.25 0.00Centrifugal Pump 0.25 0.00Converter 0.00 0.00Distillation Tower 0.00 0.00Heat Exchanger 0.00 0.00Evaporator 0.25 0.00Multistage Compressor 0.25 0.00Pipe 0.00 0.00Reactor 0.00 0.00Waste Heat Boiler 0.00 0.00
I. Worn Scroll and Housing Liners of Blower.NMS = 0.50DMS = 0.00 not pipe transmitted
NES DESCentrifugal Pump 0.00 0.00Converter 0.25 0.00Distillation Tower 0.25 0.00Evaporator 0.25 0.00
189
Reproduced with permission of the copyright owner. Further reproduction prohibited without permission.

Centrifugal Blower 0.25 0.00Heat Exchanger 0.00 0.00Multistage Compressor 0.25 0.00Pipe 0.00 0.00Reactor 0.00 0.00Waste Heat Boiler 0.00 0.00
J. Damaged Mechanical Seals in Stuffing Box of Pump.NMS = 0.25DMS = 0.00 not pipe transmitted
NES DESCentrifugal Blower 0.00 0.00Converter 0.00 0.00Distillation Tower 0.25 0.00Evaporator 0.25 0.00Centrifugal Pump 0.25 0.00Heat Exchanger 0.25 0.00Multistage Compressor 0.25 0.00Pipe 0.00 0.00Reactor 0.25 0.00Waste Heat Boiler 0.25 0.00
K. Worn Impeller of Pump.NMS = 0.25DMS = 0.00 not pipe transmitted
NES DESCentrifugal Blower 0.00 0.00Converter 0.00 0.00Distillation Tower 0.25 0.00Evaporator 0.25 0.00Centrifugal Pump 0.25 0.00Heat Exchanger 0.25 0.00Multistage Compressor 0.25 0.00Pipe 0.00 0.00Reactor 0.25 0.00Waste Heat Boiler 0.25 0.00
L. Faulty Thrust Bearings of Pump.NMS = 0.75DMS = 0.00 not pipe transmitted
NES DESCentrifugal Blower 0.00 0.00Converter 0.00 0.00Distillation Tower 0.25 0.00Evaporator 0.25 0.00
190
Reproduced with permission of the copyright owner. Further reproduction prohibited without permission.
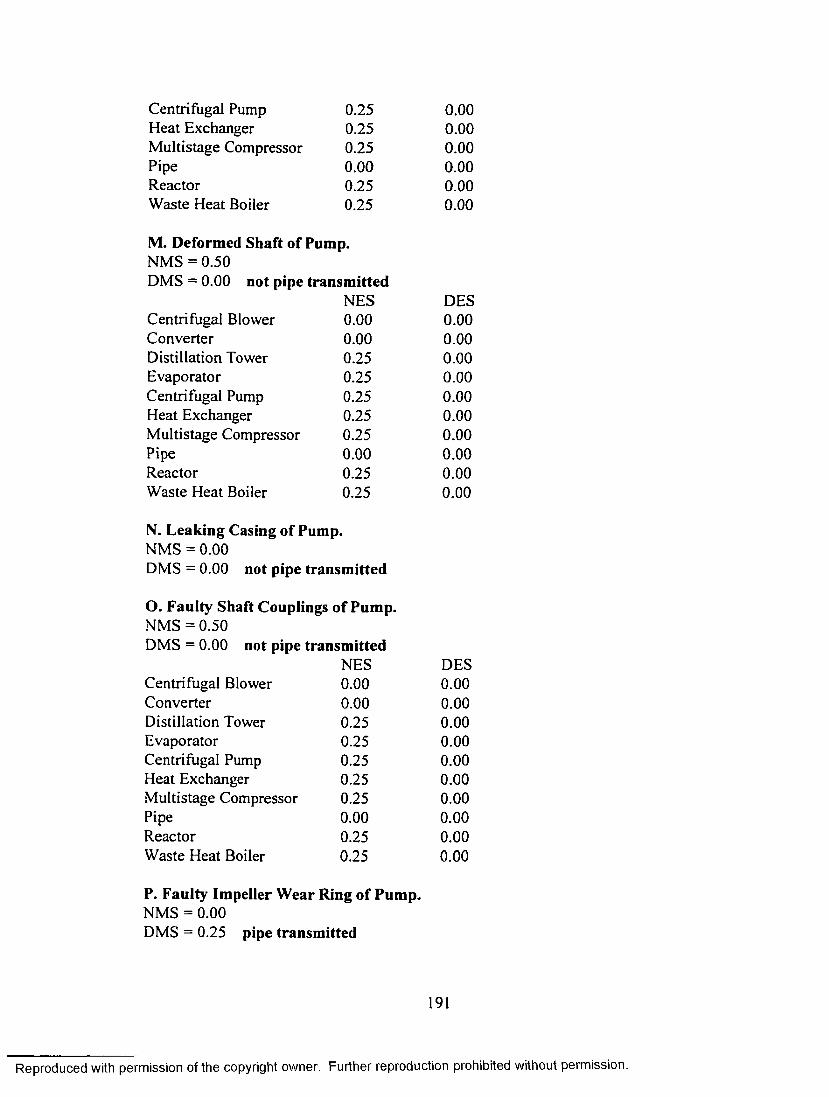
Centrifugal Pump 0.25 0.00Heat Exchanger 0.25 0.00Multistage Compressor 0.25 0.00Pipe 0.00 0.00Reactor 0.25 0.00Waste Heat Boiler 0.25 0.00
M. Deformed Shaft of Pump.NMS = 0.50DMS = 0.00 not pipe transmitted
NES DESCentrifugal Blower 0.00 0.00Converter 0.00 0.00Distillation Tower 0.25 0.00Evaporator 0.25 0.00Centrifugal Pump 0.25 0.00Heat Exchanger 0.25 0.00Multistage Compressor 0.25 0.00Pipe 0.00 0.00Reactor 0.25 0.00Waste Heat Boiler 0.25 0.00
N. Leaking Casing of Pump.NMS = 0.00DMS = 0.00 not pipe transmitted
O. Faulty Shaft Couplings of Pump.NMS = 0.50DMS = 0.00 not pipe transmitted
NES DESCentrifugal Blower 0.00 0.00Converter 0.00 0.00Distillation Tower 0.25 0.00Evaporator 0.25 0.00Centrifugal Pump 0.25 0.00Heat Exchanger 0.25 0.00Multistage Compressor 0.25 0.00Pipe 0.00 0.00Reactor 0.25 0.00Waste Heat Boiler 0.25 0.00
P. Faulty Impeller Wear Ring of Pump.NMS = 0.00DMS = 0.25 pipe transmitted
191
Reproduced with permission of the copyright owner. Further reproduction prohibited without permission.

NES DESCentrifugal Blower 0.00 0.00Converter 0.00 0.00Distillation Tower 0.00 0.50Evaporator 0.00 0.50Centrifugal Pump 0.00 0.25Heat Exchanger 0.00 0.50Multistage Compressor 0.00 0.50Pipe 0.00 0.00Reactor 0.00 0.25Waste Heat Boiler 0.00 0.25
Q. Plugged Spray Nozzle in Combustion Chamber.NMS = 0.00DMS = 0.00 not pipe transmitted
R. Carbonaceous Matter Formation in Combustion Chamber.NMS = 0.00DMS = 0.00 not pipe transmitted
CENTRIFUGAL BLOWER Ref. [10, 16, 77, 53,64, 78]
A. Obstructed Inlet or Outlet Ducts.NMS = 0.25DMS = 0.00 not pipe transmitted
NES DESBurner 0.25 0.00Centrifugal Pump 0.00 0.00Converter 0.00 0.00Distillation Tower 0.00 0.00Evaporator 0.25 0.00Heat Exchanger 0.00 0.00Multistage Compressor 0.25 0.00Pipe 0.00 0.00Reactor 0.00 0.00Waste Heat Boiler 0.00 0.00
B. Cracked Inlet Box.NMS = 0.25DMS = 0.00 not pipe transmitted
NES DESBurner 0.25 0.00Centrifugal Pump 0.00 0.00Converter 0.00 0.00
192
Reproduced with permission of the copyright owner. Further reproduction prohibited without permission.

Distillation Tower 0.00 0.00Evaporator 0.25 0.00Heat Exchanger 0.00 0.00Multistage Compressor 0.25 0.00Pipe 0.00 0.00Reactor 0.00 0.00Waste Heat Boiler 0.00 0.00
C. Misaligned Wheel Bearings.NMS = 0.50DMS = 0.00 not pipe transmitted
NES DESBurner 0.25 0.00Centrifugal Pump 0.00 0.00Converter 0.25 0.00Distillation Tower 0.25 0.00Evaporator 0.25 0.00Heat Exchanger 0.00 0.00Multistage Compressor 0.25 0.00Pipe 0.00 0.00Reactor 0.00 0.00Waste Heat Boiler 0.00 0.00
D. Cracked Wheel.NMS = 0.25DMS = 0.00 not pipe transmitted
NES DESBurner 0.25 0.00Centrifugal Pump 0.00 0.00Converter 0.00 0.00Distillation Tower 0.00 0.00Evaporator 0.25 0.00Heat Exchanger 0.00 0.00Multistage Compressor 0.25 0.00Pipe 0.00 0.00Reactor 0.00 0.00Waste Heat Boiler 0.00 0.00
E. Damaged Shaft Seals.NMS = 0.25DMS = 0.00 not pipe transmitted
NES DESBurner 0.25 0.00Centrifugal Pump 0.00 0.00Converter 0.00 0.00
193
Reproduced with permission of the copyright owner. Further reproduction prohibited without permission.
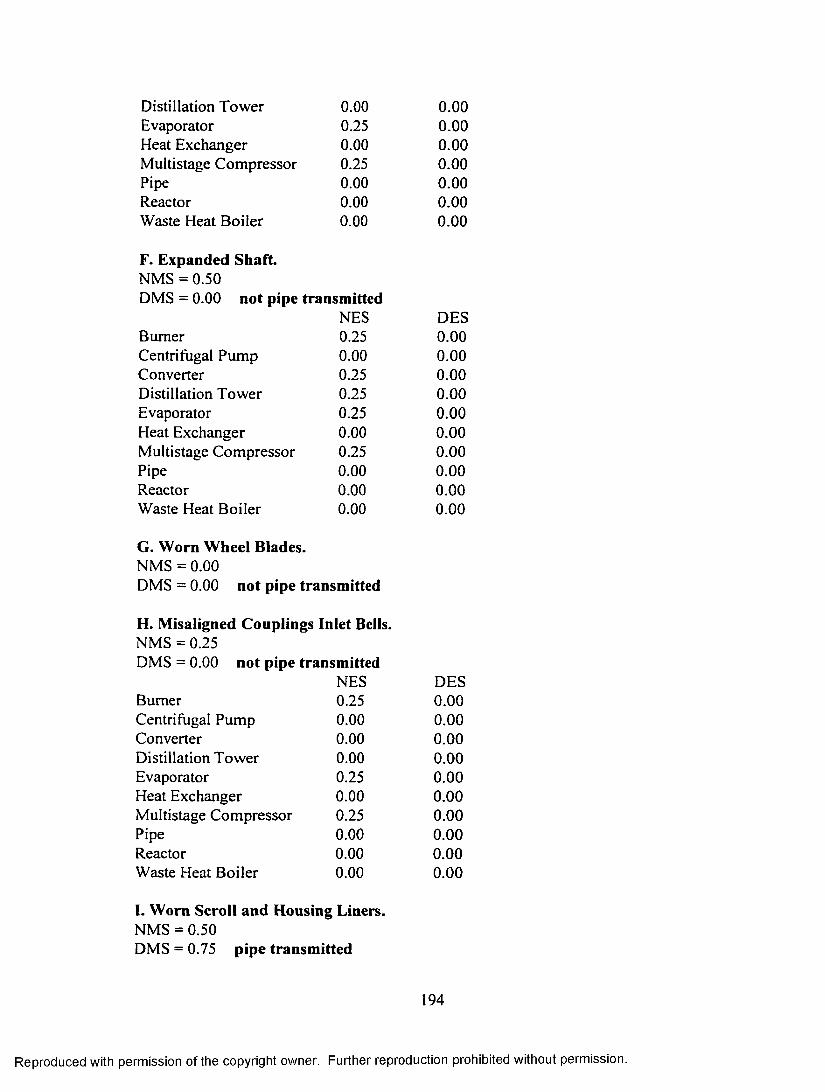
Distillation Tower 0.00 0.00Evaporator 0.25 0.00Heat Exchanger 0.00 0.00Multistage Compressor 0.25 0.00Pipe 0.00 0.00Reactor 0.00 0.00Waste Heat Boiler 0.00 0.00
F. Expanded Shaft.NMS = 0.50DMS = 0.00 not pipe transmitted
NES DESBurner 0.25 0.00Centrifugal Pump 0.00 0.00Converter 0.25 0.00Distillation Tower 0.25 0.00Evaporator 0.25 0.00Heat Exchanger 0.00 0.00Multistage Compressor 0.25 0.00Pipe 0.00 0.00Reactor 0.00 0.00Waste Heat Boiler 0.00 0.00
G. Worn Wheel Blades.NMS = 0.00DMS = 0.00 not pipe transmitted
H. Misaligned Couplings Inlet Bells.NMS = 0.25DMS = 0.00 not pipe transmitted
NES DESBurner 0.25 0.00Centrifugal Pump 0.00 0.00Converter 0.00 0.00Distillation Tower 0.00 0.00Evaporator 0.25 0.00Heat Exchanger 0.00 0.00Multistage Compressor 0.25 0.00Pipe 0.00 0.00Reactor 0.00 0.00Waste Heat Boiler 0.00 0.00
I. Worn Scroll and Housing Liners.NMS = 0.50DMS = 0.75 pipe transmitted
Reproduced with permission of the copyright owner. Further reproduction prohibited without permission.
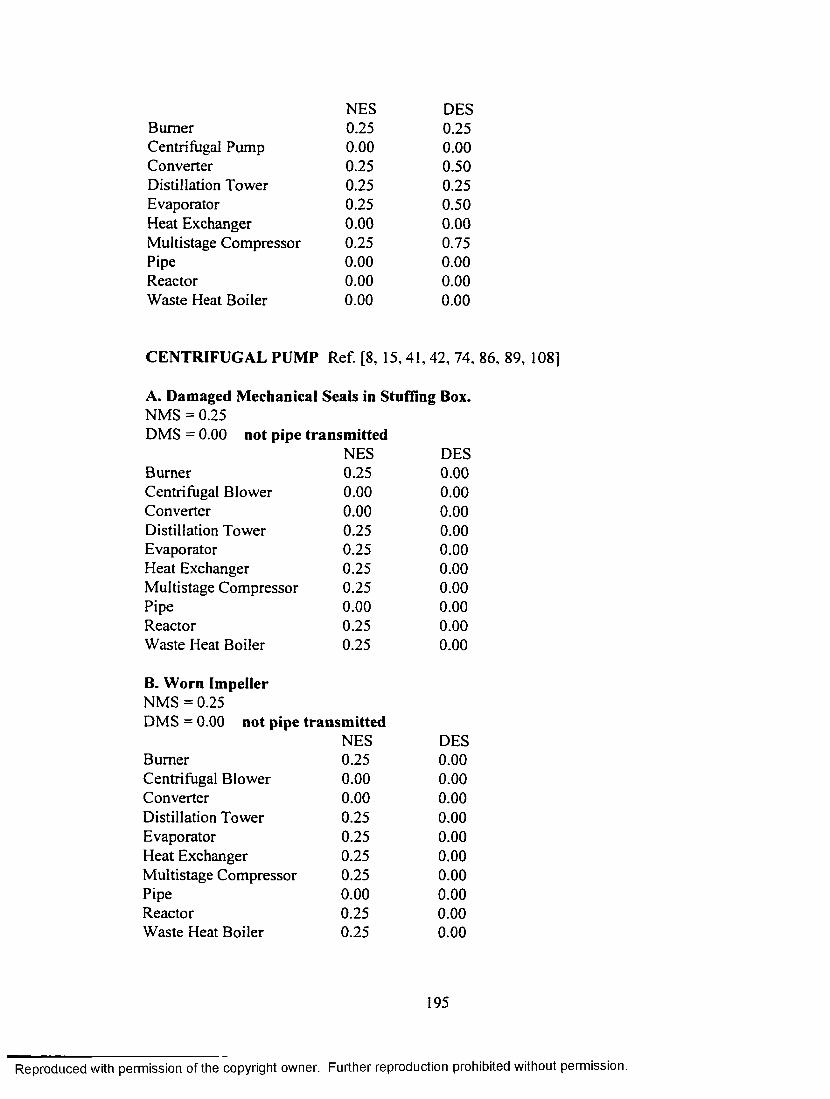
NES DESBurner 0.25 0.25Centrifugal Pump 0.00 0.00Converter 0.25 0.50Distillation Tower 0.25 0.25Evaporator 0.25 0.50Heat Exchanger 0.00 0.00Multistage Compressor 0.25 0.75Pipe 0.00 0.00Reactor 0.00 0.00Waste Heat Boiler 0.00 0.00
CENTRIFUGAL PUMP Ref. [8, 15,41,42, 74.
A. Damaged Mechanical Seals in Stuffing Box.NMS = 0.25DMS = 0.00 not pipe transmitted
NES DESBurner 0.25 0.00Centrifugal Blower 0.00 0.00Converter 0.00 0.00Distillation Tower 0.25 0.00Evaporator 0.25 0.00Heat Exchanger 0.25 0.00Multistage Compressor 0.25 0.00Pipe 0.00 0.00Reactor 0.25 0.00Waste Heat Boiler 0.25 0.00
B. Worn ImpellerNMS = 0.25DMS = 0.00 not pipe transmitted
NES DESBurner 0.25 0.00Centrifugal Blower 0.00 0.00Converter 0.00 0.00Distillation Tower 0.25 0.00Evaporator 0.25 0.00Heat Exchanger 0.25 0.00Multistage Compressor 0.25 0.00Pipe 0.00 0.00Reactor 0.25 0.00Waste Heat Boiler 0.25 0.00
Reproduced with permission of the copyright owner. Further reproduction prohibited without permission.

C. Faulty Thrust Bearings.NMS = 0.75DMS = 0.00 not pipe transmitted
NESBurner 0.25Centrifugal Blower 0.00Converter 0.00Distillation Tower 0.25Evaporator 0.50Heat Exchanger 0.25Multistage Compressor 0.50Pipe 0.00Reactor 0.50Waste Heat Boiler 0.25
D. Deformed Shaft.NMS = 0.50DMS = 0.00 not pipe transmitted
NESBurner 0.25Centrifugal Blower 0.00Converter 0.00Distillation Tower 0.25Evaporator 0.25Heat Exchanger 0.25Multistage Compressor 0.25Pipe 0.00Reactor 0.25Waste Heat Boiler 0.25
E. Leaking Casing.NMS = 0.00DMS = 0.00 not pipe transmitted
F. Faulty Shaft Couplings.NMS = 0.50DMS = 0.00 not pipe transmitted
NESBurner 0.25Centrifugal Blower 0.00Converter 0.00Distillation Tower 0.25Evaporator 0.25Heat Exchanger 0.25Multistage Compressor 0.25
DES0.000.000.000.000.000.000.000.000.000.00
DES0.000.000.000.000.000.000.000.000.000.00
DES0.000.000.000.000.000.000.00
196
Reproduced with permission of the copyright owner. Further reproduction prohibited without permission.

Pipe 0.00 0.00Reactor 0.25 0.00Waste Heat Boiler 0.25 0.00
G. Faulty Impeller Wear Ring.NMS = 0.00DMS = 0.25 pipe transmitted
NES DESBurner 0.00 0.25Centrifugal Blower 0.00 0.00Converter 0.00 0.00Distillation Tower 0.00 0.50Evaporator 0.00 0.50Heat Exchanger 0.00 0.50Multistage Compressor 0.00 0.50Pipe 0.00 0.00Reactor 0.00 0.25Waste Heat Boiler 0.00 0.25
CONVERTER Ref. [21, 23, 45, 51, 63, 64]
A. Damaged Supporting Grids.NMS = 0.00DMS = 0.00 not pipe transmitted
B. Corroded or Cracked Supporting Flanges.NMS = 0.00DMS = 0.00 not pipe transmitted
C. Plugged Vessel Walls and Ducts.NMS = 0.00DMS = 0.25 pipe transmitted
NES DESBurner 0.00 0.00Centrifugal Blower 0.00 0.00Centrifugal Pump 0.00 0.25Distillation Tower 0.00 0.00Evaporator 0.00 0.00Heat Exchanger 0.00 0.00Multistage Compressor 0.00 0.50Pipe 0.00 0.00Reactor 0.00 0.00Waste Heat Boiler 0.00 0.00
197
Reproduced with permission of the copyright owner. Further reproduction prohibited without permission.

D. Fouled Heat Exchanger Tubes.NMS = 0.00DMS = 0.75 not pipe transmitted
NES DESBurner 0.00 0.00Centrifugal Blower 0.00 0.75Centrifugal Pump 0.00 0.00Distillation Tower 0.00 0.25Evaporator 0.00 0.00Heat Exchanger 0.00 0.00Multistage Compressor 0.00 0.50Pipe 0.00 0.00Reactor 0.00 0.00Waste Heat Boiler 0.00 0.00
DISTILLATION TOWER Ref. [1,9, 16,21,45.
A. Deformed or Broken Rings.NMS = 0.00DMS = 1.00 pipe transmitted
NES DESBurner 0.00 0.00Centrifugal Blower 0.00 0.00Centrifugal Pump 0.00 1.00Converter 0.00 0.00Evaporator 0.00 1.00Heat Exchanger 0.00 0.75Multistage Compressor 0.00 1.00Pipe 0.00 0.00Reactor 0.00 0.75Waste Heat Boiler 0.00 0.00
B. Unleveled Liquid Distributor.NMS = 0.00DMS = 0.00 not pipe transmitted
C. Plugged or Corroded Distributor.NMS = 0.00DMS = 0.50 pipe transmitted
NES DESBurner 0.00 0.00Centrifugal Blower 0.00 0.00Centrifugal Pump 0.00 0.75Converter 0.00 0.00
198
Reproduced with permission of the copyright owner. Further reproduction prohibited without permission.

Evaporator 0.00 0.00Heat Exchanger 0.00 0.00Multistage Compressor 0.00 0.75Pipe 0.00 0.00Reactor 0.00 0.00Waste Heat Boiler 0.00 0.00
D. Fouled Column Packing or Internals.NMS = 0.50DMS = 0.50 not pipe transmitted
NES DESBurner 0.00 0.00Centrifugal Blower 0.25 0.00Centrifugal Pump 0.25 0.50Converter 0.00 0.00Evaporator 0.50 0.00Heat Exchanger 0.25 0.00Multistage Compressor 0.25 0.50Pipe 0.00 0.00Reactor 0.00 0.00Waste Heat Boiler 0.50 0.00
EVAPORATOR Ref. [5, 63, 64, 68, 81, 90, 108]
A. Damaged Mechanical Seals in Stuffing Box of Pump.NMS = 0.25DMS = 0.00 not pipe transmitted
NES DESBurner 0.25 0.00Centrifugal Blower 0.00 0.00Converter 0.00 0.00Distillation Tower 0.25 0.00Centrifugal Pump 0.25 0.00Heat Exchanger 0.25 0.00Multistage Compressor 0.25 0.00Pipe 0.00 0.00Reactor 0.25 0.00Waste Heat Boiler 0.25 0.00
B. Worn Impeller of PumpNMS = 0.25DMS = 0.00 not pipe transmitted
NES DESBurner 0.25 0.00
199
Reproduced with permission of the copyright owner. Further reproduction prohibited without permission.

Centrifugal Blower 0.00 0.00Converter 0.00 0.00Distillation Tower 0.25 0.00Centrifugal Pump 0.25 0.00Heat Exchanger 0.25 0.00Multistage Compressor 0.25 0.00Pipe 0.00 0.00Reactor 0.25 0.00Waste Heat Boiler 0.25 0.00
C. Faulty Thrust Bearings of Pump.NMS = 0.75DMS = 0.00 not pipe transmitted
NES DESBurner 0.25 0.00Centrifugal Blower 0.00 0.00Converter 0.00 0.00Distillation Tower 0.25 0.00Centrifugal Pump 0.25 0.00Heat Exchanger 0.25 0.00Multistage Compressor 0.25 0.00Pipe 0.00 0.00Reactor 0.25 0.00Waste Heat Boiler 0.25 0.00
D. Deformed Shaft of Pump.NMS = 0.50DMS = 0.00 not pipe transmitted
NES DESBurner 0.25 0.00Centrifugal Blower 0.00 0.00Converter 0.00 0.00Distillation Tower 0.25 0.00Centrifugal Pump 0.25 0.00Heat Exchanger 0.25 0.00Multistage Compressor 0.25 0.00Pipe 0.00 0.00Reactor 0.25 0.00Waste Heat Boiler 0.25 0.00
E. Leaking Casing of Pump.NMS = 0.00DMS = 0.00 not pipe transmitted
200
Reproduced with permission of the copyright owner. Further reproduction prohibited without permission.

F. Faulty Shaft Couplings o f Pump.NMS = 0.50DMS = 0.00 not pipe transmitted
NES DESBurner 0.25 0.00Centrifugal Blower 0.00 0.00Converter 0.00 0.00Distillation Tower 0.25 0.00Centrifugal Pump 0.25 0.00Heat Exchanger 0.25 0.00Multistage Compressor 0.25 0.00Pipe 0.00 0.00Reactor 0.25 0.00Waste Heat Boiler 0.25 0.00
G. Faulty Impeller WearNMS = 0.00
Ring of Pump.
DMS = 0.25 pipe transmittedNES DES
Burner 0.00 0.25Centrifugal Blower 0.00 0.00Converter 0.00 0.00Distillation Tower 0.00 0.50Centrifugal Pump 0.00 0.50Heat Exchanger 0.00 0.50Multistage Compressor 0.00 0.50Pipe 0.00 0.00Reactor 0.00 0.25Waste Heat Boiler 0.00 0.25
H. Broken Tube SupportNMS = 0.00
Baffles of Heat Exchai
DMS = 0.00 not pipe transmitted
I. Cracked Tubes of Heat Exchanger.NMS = 0.00DMS = 0.25 pipe transmitted
NES DESBurner 0.00 0.00Centrifugal Blower 0.00 0.00Centrifugal Pump 0.00 0.25Converter 0.00 0.00Distillation Tower 0.00 0.00Heat Exchanger 0.00 0.00Multistage Compressor 0.00 0.50
201
Reproduced with permission of the copyright owner. Further reproduction prohibited without permission.

Pipe 0.00 0.00Reactor 0.00 0.00Waste Heat Boiler 0.00 0.00
J. Deformed Impingement Plate of Heat ExchangerNMS = 0.00DMS = 0.00 not pipe transmitted
K. Fouled Tubes of Heat Exchanger.NMS = 0.00DMS = 0.25 pipe transmitted
NES DESBurner 0.00 0.00Centrifugal Blower 0.00 0.00Centrifugal Pump 0.00 0.25Converter 0.00 0.00Distillation Tower 0.00 0.00Heat Exchanger 0.00 0.00Multistage Compressor 0.00 0.25Pipe 0.00 0.00Reactor 0.00 0.00Waste Heat Boiler 0.00 0.00
L. Corroded Exchanger and Kettle Surfaces.NMS = 0.00DMS = 0.25 pipe transmitted
NES DESBurner 0.00 0.00Centrifugal Blower 0.00 0.00Centrifugal Pump 0.00 0.25Converter 0.00 0.00Distillation Tower 0.00 0.00Heat Exchanger 0.00 0.00Multistage Compressor 0.00 0.00Pipe 0.00 0.00Reactor 0.00 0.00Waste Heat Boiler 0.00 0.00
M. Plugged or Corroded Vapor Heads Walls.NMS = 0.00DMS = 0.00 not pipe transmitted
N. Leaking Circulation Pipe Joints.NMS = 0.00DMS = 0.25 pipe transmitted
Reproduced with permission of the copyright owner. Further reproduction prohibited without permission.
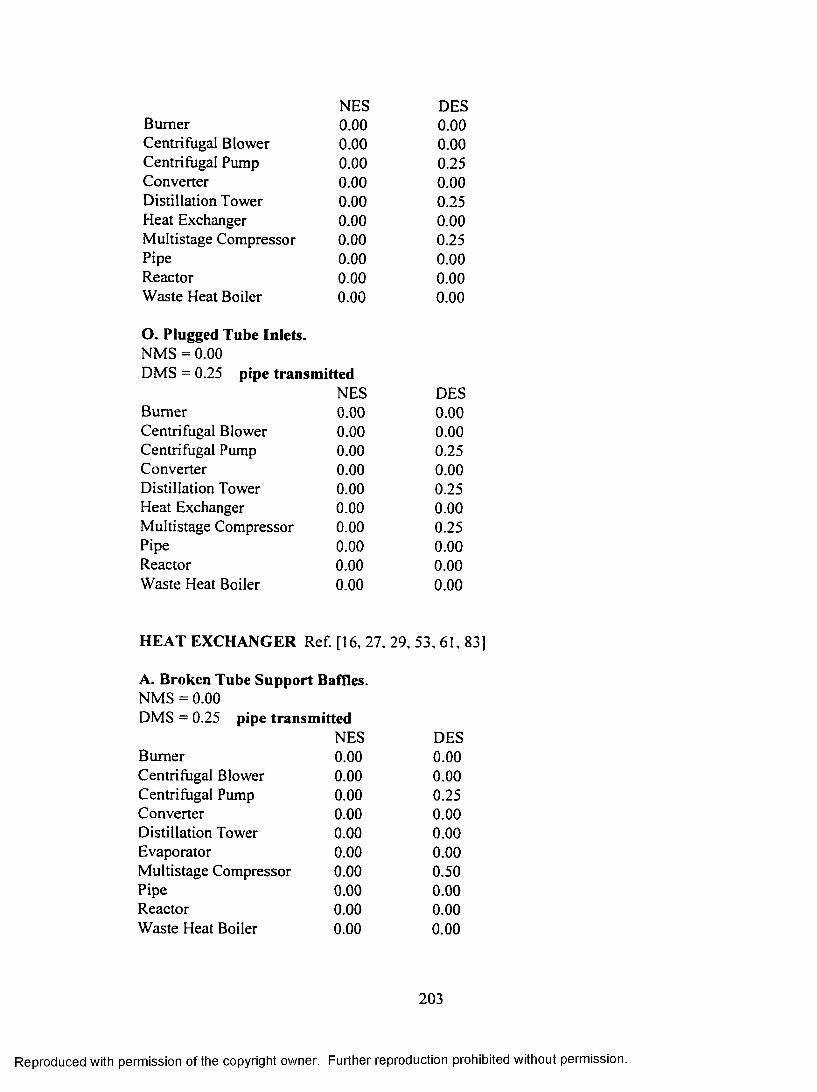
NES DESBurner 0.00 0.00Centrifugal Blower 0.00 0.00Centrifugal Pump 0.00 0.25Converter 0.00 0.00Distillation Tower 0.00 0.25Heat Exchanger 0.00 0.00Multistage Compressor 0.00 0.25Pipe 0.00 0.00Reactor 0.00 0.00Waste Heat Boiler 0.00 0.00
O. Plugged Tube Inlets.NMS = 0.00DMS = 0.25 pipe transmitted
NES DESBurner 0.00 0.00Centrifugal Blower 0.00 0.00Centrifugal Pump 0.00 0.25Converter 0.00 0.00Distillation Tower 0.00 0.25Heat Exchanger 0.00 0.00Multistage Compressor 0.00 0.25Pipe 0.00 0.00Reactor 0.00 0.00Waste Heat Boiler 0.00 0.00
HEAT EXCHANGER Ref. [16, 27, 29, 53, 61, 83]
A. Broken Tube Support Baffles.NMS = 0.00DMS = 0.25 pipe transmitted
NES DESBurner 0.00 0.00Centrifugal Blower 0.00 0.00Centrifugal Pump 0.00 0.25Converter 0.00 0.00Distillation Tower 0.00 0.00Evaporator 0.00 0.00Multistage Compressor 0.00 0.50Pipe 0.00 0.00Reactor 0.00 0.00Waste Heat Boiler 0.00 0.00
Reproduced with permission of the copyright owner. Further reproduction prohibited without permission.

B. Cracked Tubes.NMS = 0.00DMS = 0.25 pipe transmitted
NES DESBurner 0.00 0.00Centrifugal Blower 0.00 0.00Centrifugal Pump 0.00 0.25Converter 0.00 0.00Distillation Tower 0.00 0.00Evaporator 0.00 0.00Multistage Compressor 0.00 0.50Pipe 0.00 0.00Reactor 0.00 0.00Waste Heat Boiler 0.00 0.00
C. Deformed Impingement Plate.NMS = 0.00DMS = 0.00 pipe transmitted
D. Fouled Tubes.NMS = 0.00DMS = 0.25 pipe transmitted
NES DESBurner 0.00 0.00Centrifugal Blower 0.00 0.00Centrifugal Pump 0.00 0.25Converter 0.00 0.00Distillation Tower 0.00 0.00Evaporator 0.00 0.00Multistage Compressor 0.00 0.25Pipe 0.00 0.00Reactor 0.00 0.00Waste Heat Boiler 0.00 0.00
E. Corroded Exchanger and Kettle Surfaces.NMS = 0.00DMS = 0.25 pipe transmitted
NES DESBurner 0.00 0.00Centrifugal Blower 0.00 0.00Centrifugal Pump 0.00 0.25Converter 0.00 0.00Distillation Tower 0.00 0.00Evaporator 0.00 0.00Multistage Compressor 0.00 0.00
204
Reproduced with permission of the copyright owner. Further reproduction prohibited without permission.

PipeReactorWaste Heat Boiler
0.000.000.00
0.000.000.00
MULTISTAGE COMPRESSOR Ref. [16, 27, 29. 53. 61, 83]
A. Deformed Thrust Bearings.NMS = 0.00DMS = 0.50 pipe transmitted
NES DESBurner 0.00 0.25Centrifugal Blower 0.00 0.00Centrifugal Pump 0.00 0.00Converter 0.00 0.25Distillation Tower 0.00 0.00Evaporator 0.00 0.00Heat Exchanger 0.00 0.25Pipe 0.00 0.00Reactor 0.00 0.50Waste Heat Boiler 0.00 0.00
B. Plugged Stationary Elements.NMS = 0.00DMS = 0.25 pipe transmitted
NES DESBurner 0.00 0.25Centrifugal Blower 0.00 0.00Centrifugal Pump 0.00 0.00Converter 0.00 0.25Distillation Tower 0.00 0.00Evaporator 0.00 0.00Heat Exchanger 0.00 0.25Pipe 0.00 0.00Reactor 0.00 0.25Waste Heat Boiler 0.00 0.00
C. Eroded Impellers Exit Tips.NMS = 0.25DMS = 0.25 pipe transmitted
NES DESBurner 0.25 0.25Centrifugal Blower 0.00 0.00Centrifugal Pump 0.00 0.00Converter 0.25 0.25
205
Reproduced with permission of the copyright owner. Further reproduction prohibited without permission.

Distillation Tower 0.00 0.00Evaporator 0.00 0.00Heat Exchanger 0.25 0.25Pipe 0.00 0.00Reactor 0.25 0.25Waste Heat Boiler 0.00 0.00
D. Damaged Shaft and Interstage (Labyrinth)!NMS = 0.00DMS = 0.25 pipe transmitted
NES DESBurner 0.00 0.25Centrifugal Blower 0.00 0.00Centrifugal Pump 0.00 0.00Converter 0.00 0.25Distillation Tower 0.00 0.00Evaporator 0.00 0.00Heat Exchanger 0.00 0.25Pipe 0.00 0.00Reactor 0.00 0.25Waste Heat Boiler 0.00 0.00
E. Misaligned Shaft.NMS = 0.25DMS = 0.25 pipe transmitted
NES DESBurner 0.25 0.25Centrifugal Blower 0.00 0.00Centrifugal Pump 0.00 0.00Converter 0.25 0.25Distillation Tower 0.00 0.00Evaporator 0.00 0.00Heat Exchanger 0.25 0.25Pipe 0.00 0.00Reactor 0.25 0.25Waste Heat Boiler 0.00 0.00
PIPE Ref. [28, 70, 73, 94, 103]
A. Leaking Fittings or Joints.NMS = 0.00 DMS = 0.00
Reproduced with permission of the copyright owner. Further reproduction prohibited without permission.

B. Cracked Pipe Due To Over-stress.NMS = 0.00 DMS = 0.00
C. Plugged Inner Section.NMS = 0.00 DMS = 0.00
D. Bent Pipe.NMS = 0.00 DMS = 0.00E. Corroded or Eroded Inner Wall.NMS = 0.00 DMS = 0.00
REACTOR Ref. [7, 64, 65, 96, 101, 111]
A. Worn or faulty Stirrer Couplings.NMS =0.75DMS = 0.00 not pipe transmitted
NES DESBurner 0.25 0.00Centrifugal Blower 0.50 0.00Centrifugal Pump 0.50 0.00Converter 0.00 0.00Distillation Tower 0.00 0.00Evaporator 0.50 0.00Heat Exchanger 0.50 0.00Multistage Compressor 0.50 0.00Pipe 0.00 0.00Waste Heat Boiler 0.50 0.00
B. Non-lubricated Drive Bearings and Gears.NMS = 0.00 DMS = 0.00
C. Damaged Discharged Nozzle Seals.NMS = 0.00DMS = 0.50 not pipe transmitted
NES DESBurner 0.00 0.00Centrifugal Blower 0.00 0.00Centrifugal Pump 0.00 0.25
207
Reproduced with permission of the copyright owner. Further reproduction prohibited without permission.

Converter Distillation Tower Evaporator Heat Exchanger Multistage Compressor PipeWaste Heat Boiler
0.000.000.000.000.000.000.00
0.000.000.000.000.000.000.00
D. Defective Heating Coils.NMS = 0.00 DMS = 0.00
WASTE HEAT BOILER Ref. [2, 9, 16, 45, 63, 78. 109]
A. Broken Expansion Joints.NMS = 0.00DMS = 0.00 not pipe transmitted
B. Fouled Tubes.NMS = 0.00DMS = 0.00 not pipe transmitted
C. Deformed Demister Mesh Pad.NMS = 0.00DMS = 0.00 not pipe transmitted
D. Cracked Boiler Drum Shell.NMS = 0.25DMS = 0.00 not pipe transmitted
BurnerCentrifugal BlowerCentrifugal PumpConverterDistillation TowerEvaporatorHeat ExchangerMultistage CompressorPipeReactor
NES0.250.250.000.000.000.250.250.250.000.25
DES0.000.000.000.000.000.000.000.000.000.00
208
Reproduced with permission of the copyright owner. Further reproduction prohibited without permission.

APPENDIX F
SYSTEM OUTPUT SAMPLE REPORT
************* RCM CHEMICAL PROCESS EXPERT SYSTEM ***************
Project Name: SOLID.XLS
BL0WER2No specific failure mode is of concern for this machine BURNER_2No specific failure mode is of concern for this machine COMPRESSORNo specific failure mode is of concern for this machine HEAT_2No specific failure mode is of concern for this machine PUMPNo specific failure mode is of concern for this machine REACTORNo specific failure mode is of concern for this machine
//////// CRITICAL FAILURE MODES WWWW
Priority Index:64 [ LI:4, LEI:4, PEI:4, SFI:1]*CONVERTER oFouled Heat Exchanger Tubes.
Local Effects:- Converter efficiency greatly reduced- Increase in internal gas temperature- Possible damage of flanges and support grids- Reaction heat out of control- Eventually, total loss of function
System Effects:- Extremely high gas temperatures can damage
circulating pipes and downstream machines' seals- If converter ceases working, the whole process will
probably have to be shut down
209
Reproduced with permission of the copyright owner. Further reproduction prohibited without permission.

Suggested Controls:- Dye penetrant inspection- Fluorescent (Zyglo) inspection- Differential temperature control
Priority Index:36 [ LI:4, LEI:3, PEI:3, SFI: 1]*BLOWER_l oCracked Inlet Box.
Local Effects:- Flow pressure loss- Overloading of the fan motor- Gas/air leakage- Eventual loss of equipment's function
System Effects:- If blower used for cooling, system components or product temperature will get out of control
- Electrical power supply to other equipment may be affected if blower motor overloads
- If handling gas, contamination hazard- Possible corrosive effect on nearby equipment
Suggested Controls:- Gas detector- Visual inspection- Dye penetrant inspection
Priority Index:26.25 [ LI:4, LEI:2, PEI:3, SFI: 1.09375]* EVAPORATOR oPlugged Tube Inlets.
Local Effects:- Liquid contamination- Possible fouling of heat exchanger tubes- Evaporator efficiency greatly reduced
System Effects:- Contamination hazard- Clogged inlets may affect the normal operation of
downstream pumps, compressors or distillation towers- If evaporator ceases working, overall process may
have to be shut downSuggested Controls:
- Visual inspection- Ultrasonic inspection
Priority Index:24 [ LI:4, LEI:3, PEI:2, SFI:1]*BLOWER_l oMisaligned Wheel Bearings.
Local Effects:- Motor overloaded- Possible bending of shaft
210
Reproduced with permission of the copyright owner. Further reproduction prohibited without permission.

- Extreme equipment vibration and noise- Blowing power loss
System Effects:- If blower used for cooling, system components or product temperature may get out of control
- Electrical power supply to other equipment may be affected if blower motor overloads
- Nearby equipment may be atrophied due to transmitted vibration
Suggested Control:- Mechanical running test- Visual inspection- Vibration analysis- Rotor stability test
Priority Index:24 [ LI:4, LEI:3, PEI:2, SFI: 1]*BLOWER_l oM isaligned Couplings Inlet Bells.
Local Effects:- Overheating of bearings and motor- Bearing failure- Increase of bearing dust seals wear
System Effects:- Electrical power supply to other equipment may be affected if blower motor overloads
Suggested Controls:- Temperature detectors (thermocouples & electrical resistance detectors)- Mechanical test- Visual inspection
Priority Index: 17.5 [ LI:4, LEI:2, PEI:2, SFI: 1.09375]*EVAPORATOR oCorroded Exchanger and Kettle Surfaces.
Local Effects:- Apparatus efficiency greatly reduced- Liquid contamination- Liquid evaporation efficiency reduced
System Effects:- Process temperature may go out of control- Kettle scum may atrophy attached pipes and pumps
Suggested Controls:- Visual inspection- Eddy current inspection
211
Reproduced with permission of the copyright owner. Further reproduction prohibited without permission.

Priority Index: 16 [ LI:4, LEI:2, PEI:2, SFI:1]*DIST_TW4 oPlugged or Corroded Distributor.
Local Effects:- Fluid contamination- Reduced tower efficiency- Poor liquid distribution- Possible inappropriate column flooding
System Effects:- Poor distillate quality- Pumps or compressors handling distillate may be slightly affected
Suggested Controls:- Visual inspection- Column differential pressure analysis
Priority Index: 16 [ LI:4, LEI:2, PEI:2, SFI:1]*BLOWER_l oDam aged Shaft Seals.
Local Effects:- Gas/air leakage around shaft- Loss of blower pressure and efficiency- Possible corrosion of other elements
System Effects:- If blower used for cooling, system components
or product temperature will get out of control- Electrical power supply to other equipment may be
affected if blower motor overloads- If handling gas, contamination hazard- Possible corrosive effect on nearby equipment
Suggested Controls:- Static gas test- Visual inspection- Temperature detectors (thermocouples & electrical resistance detectors)
Priority Index: 16 [ LI:4, LEI:2, PEI:2, SFI:1]*PIPE oCorroded or Eroded Inner Wall.
Local Effects:- Development of "hot spots" on piping wall- Eventual pipe fracture- Fluid contamination
System Effects:- Contaminated fluid may affect the normal functioning
of downstream machinery
212
Reproduced with permission of the copyright owner. Further reproduction prohibited without permission.

Suggested Controls:- Ultrasonic inspection- Eddy current inspection
Priority Index: 11.86798493 [ LI: 1.31866499, LEI:3, PEI:3, SFI:1] *BOILER oFouIed Tubes.
Local Effects:- Heating medium leakage into boiling water- Substance contamination- Equipment efficiency greatly reduced
System Effects:- Product quality greatly affected- If water is circulated, major equipment damage and contamination should be expected in nearby areas
- Heating sub-system components may get wrecked Suggested Controls:
- Ultrasonic inspection- Differential temperature analysis- Magnetic particle inspection- Eddy current inspection
Priority Index:8 [ LI:4, LEI:1, PEI:2, SFI:1]*EVAPORATOR oPlugged or Corroded Vapor Heads Walls.
Local Effects:- Vapor entrainment- Loss of evaporation efficiency
System Effects:- Attached vents and ducts can be damaged- No major effects on process should be expected
Suggested Controls:- Visual inspection- Ultrasonic inspection
213
Reproduced with permission of the copyright owner. Further reproduction prohibited without permission.

APPENDIX G
VALIDATION RESULTS
This appendix contains the main comments expressed by the experts after evaluating the
results generated by the program during the validation phase. The comments are sorted
by operation unit.
BURNERThe vast majority (85%) of the failure modes in the final RCM reports are frequently encountered in industrial settings. The atomizing air rate should have a larger contribution to the final failure mode screening. Failure modes associated with the combustion chamber do not appear in the system’ final report as frequently as expected.
CENTRIFUGAL BLOWERAlthough the system was very efficient detecting common failure modes for centrifugal blowers, there were two, worn scroll and cracked inlet box, that rarely appeared in the RCM analysis.
CENTRIFUGAL PUMPThis was one of the equipment units where the performance of the system was at its best. Basically, all expected failure modes were properly detected and prioritized by the expert system.
CONVERTERFailure modes associated to the catalyst properties (weight, pH, etc.) were rarely presented in the system’s final reports. All other failure modes were detected as expected.
DISTILLATION TOWERThis should be renamed as “packed tower” since the system allows the user to employ it as an absorbing or stripping unit. The impact of the liquid feed rate on the final results was not as expected. All other factors were properly considered by the logic embedded in the program.
214
Reproduced with permission of the copyright owner. Further reproduction prohibited without permission.

EVAPORATORAll generated RCM analyses during the validation process yielded the expected results. More failure modes for the vapor head component should be included in the knowledge base.
HEAT EXCHANGERThe solutions obtained when liquid was assumed as tube-side substance were more satisfactory than for the cases where gas was adopted as tube-side substance. This may be a result of the way in which the system handles the gas density property when screening the failure modes.
MULTISTAGE COMPRESSORAll expected failure modes were correctly considered by the system during the validation trials. However, the failure mode “plugged stationary elements” appeared in the final reports twice as much as expected.
PIPELINEAll the system’s reports regarding gas and liquid pipelines were consistent with what was expected.
REACTORMore safety-related failure modes should be considered by the system. Also, failure modes related to the reactor shaft should appear more in the system’s conclusion as it was noticed in the validation process.
WASTE HEAT BOILERA more precise parameter than the water pH should be used for accessing the effects of “hard water” in the kettle walls of the apparatus. Nevertheless, the analyses given by the system were very satisfactory , and consistent with what was expected.
215
Reproduced with permission of the copyright owner. Further reproduction prohibited without permission.

VITA
Daniel J. Fonseca was bom in 1969 in San Jose, Costa Rica. He received a bachelor of
science and a master of science degrees in Industrial Engineering from the University of
Alabama, and a master of science degree in Engineering Science from Louisiana State
University in 1997.
Prior to attending L.S.U., Mr. Fonseca was as an assistant professor in the
Department of Industrial Engineering, at the Monterrey Institute of Technology in
Mexico City, where he was involved with the design and improvement of manufacturing
and services systems in medium to large scale companies. He also served as Industrial
Products Sales Manager for Kimberly Clark of Costa Rica. In May of 1998 he will
receive the degree of Doctor of Philosophy.
216
Reproduced with permission of the copyright owner. Further reproduction prohibited without permission.

DOCTORAL EXAMINATION AND DISSERTATION REPORT
Candidates Daniel J. Fonseca
Major Field: Engineering Science
Title of Dissertation: A Knowledge Based System for Reliability CenteredMaintenance in the Chemical Industry
Approved:
Major Professor and
Graduate SchoolDean
EXAMINING COMMITTEE:
J). 6.
j .
Date of Examination:
2 / 2 7 / 9 8
Reproduced with permission of the copyright owner. Further reproduction prohibited without permission.

IMAGE EVALUATIONTEST TARGET (Q A -3 )
1.0
l.l
1.25
1 3.2
1162.2
- II
1.8
1.4 1.6
150mm
I IW IG E .In c1653 East Main Street Rochester. NY 14609 USA Phone: 716/482-0300 Fax: 716/288-5989
O 1993. Applied Image. Inc.. All Rights Reserved
Reproduced with permission of the copyright owner. Further reproduction prohibited without permission.