Embed Size (px)
Citation preview
Abstract—This paper describes an automatic detection and
recognition system of leukocytes on a given microscopic image.
The developed system detects the locations of leukocytes from a
blood cell image. After the automatic detection, the system
classifies each leukocyte in one of the five categories
(neutrophils, eosinophils, basophils, lymphocytes, and
monocytes). The system processes an input image with the Scale
Invariant Feature Transform (SIFT) algorithm for leukocyte
detection. Meanwhile, two different recognition methods, i.e.
the Euclidean distance and the Co-occurrence matrix methods
are applied for automatic recognition. The combination of
detection and recognition approaches provides the optimal
recognition accuracies for almost all leukocyte types.
Index Terms—Leukocyte detection, leukocyte recognition,
microscopic image, scale invariant feature transform.
I. INTRODUCTION
Blood is a bodily fluid that delivers nutrients and oxygen to
cells. The analysis of blood cells can be used to detect blood
disorder or to determine the presence of infectious diseases in
human body. In order to identify the hematopoietic system
disorders, hematologists need to perform the blood cells
identification and counting for every blood elements, such as
the erythrocytes (red cells), leukocytes (white cells), and
platelets [1]. Since the task is very tedious and really time
consuming, an automaticblood detection, recognition, and
counting system is necessary and helpful.
Several researchers have proposed various methods
todetect and recognize the blood cells, such as the work by
Markiewicz using the Support Vector Machine method [2],
Colunga with EMalgorithm [3], and Neural Network-based
classifiers [4], [5]. However, the detection and recognition
systems have not been tested for blood cells that were
influenced by rotation or illumination effects after the
segmentation process.
In this paper, an automatic leukocyte detection system that
can detect the white blood cell locations from microscopic
images is developed. The proposed system works based on
the Scale Invariant Feature Transform (SIFT) method. First,
the system detects the white blood cells locations using the
SIFT method, then the system crops the images which
contains the region of interest. After the automatic detection
Manuscript received August 7, 2014; revised November 13, 2014. This
work was supported in part by the Indonesian Directorate General of Higher
Education under Hibah Penelitian Unggulan Perguruan Tinggi Tahun
Anggaran 2014.
Lina A. Chris, B. Mulyawan, and A. B. Dharmawan are with the
Computer Science Department, Faculty of Information Technology,
Tarumanagara University, Jl. Letjen. S. Parman 1, Jakarta 11440, Indonesia
(e-mail: [email protected]).
and cropping, the system will recognize the leukocyte type
using two different recognition methods: 1) the distance
based recognition system using the Euclidean distance
method, and 2) the color based recognition system using the
co-occurrence matrix method.
The remainder of this paper is organized as follows. In
Section II, the proposed leukocyte detection system based on
SIFT algorithmis explained. Section III presents the
leukocyte recognition system, while Section IV describes the
experimental setup and results. Finally, the conclusion is
presented in Section V.
II. LEUKOCYTE DETECTION SYSTEM
In the proposed system, the Scale Invariant Feature
Transform (SIFT) method is applied to detect the leukocytes
from the captured microscopic images. The SIFT algorithm,
developed by Lowe [6]-[8] is an algorithm for image features
generation which are invariant to image translation, scaling,
rotation and partially invariant to illumination changes and
affine projection [9]. The steps for defining the SIFT image
features are as follows: 1) Scale space construction, 2)
Keypoint localization, 3) Orientation assignment, 4)
Keypoint descriptor.
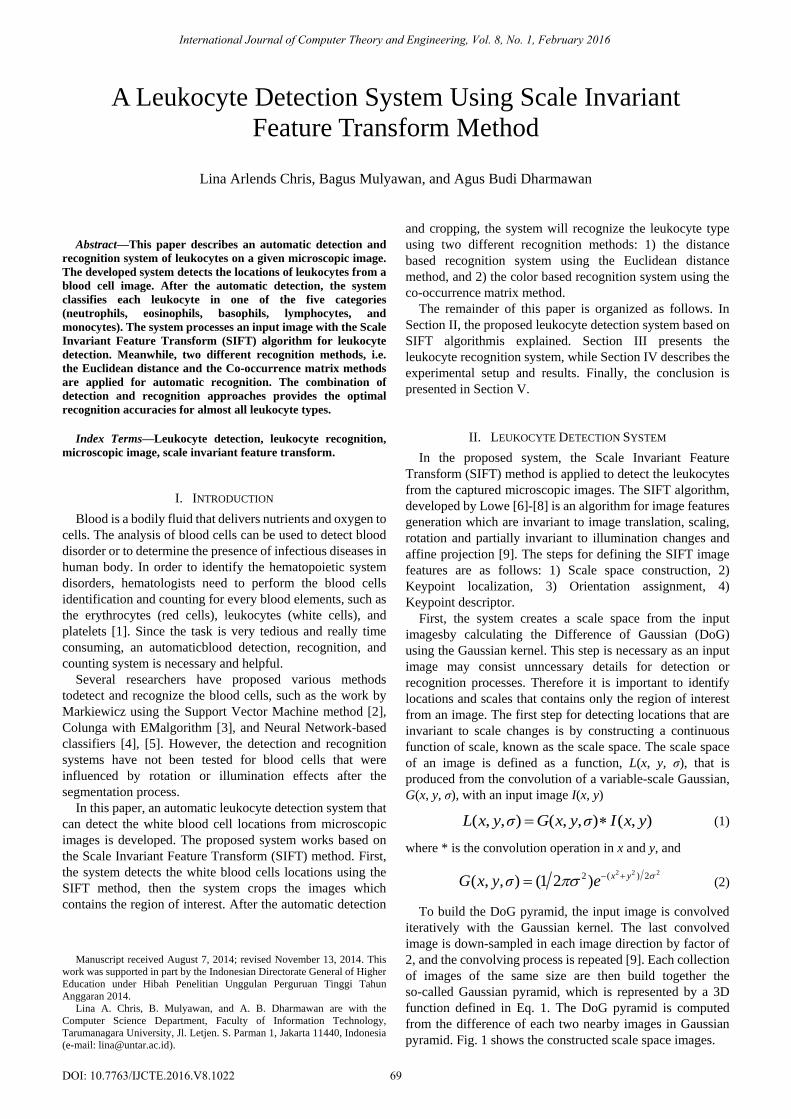
First, the system creates a scale space from the input
imagesby calculating the Difference of Gaussian (DoG)
using the Gaussian kernel. This step is necessary as an input
image may consist unncessary details for detection or
recognition processes. Therefore it is important to identify
locations and scales that contains only the region of interest
from an image. The first step for detecting locations that are
invariant to scale changes is by constructing a continuous
function of scale, known as the scale space. The scale space
of an image is defined as a function, L(x, y, σ), that is
produced from the convolution of a variable-scale Gaussian,
G(x, y, σ), with an input image I(x, y)
( , , ) ( , , ) ( , ) L x y σ G x y σ I x y (1)
where * is the convolution operation in x and y, and
2 2 22 ( ) 2( , , ) (1 2 ) x yG x y σ e (2)
To build the DoG pyramid, the input image is convolved
iteratively with the Gaussian kernel. The last convolved
image is down-sampled in each image direction by factor of
2, and the convolving process is repeated [9]. Each collection
of images of the same size are then build together the
so-called Gaussian pyramid, which is represented by a 3D
function defined in Eq. 1. The DoG pyramid is computed
from the difference of each two nearby images in Gaussian
pyramid. Fig. 1 shows the constructed scale space images.
A Leukocyte Detection System Using Scale Invariant
Feature Transform Method
Lina Arlends Chris, Bagus Mulyawan, and Agus Budi Dharmawan
International Journal of Computer Theory and Engineering, Vol. 8, No. 1, February 2016
69DOI: 10.7763/IJCTE.2016.V8.1022
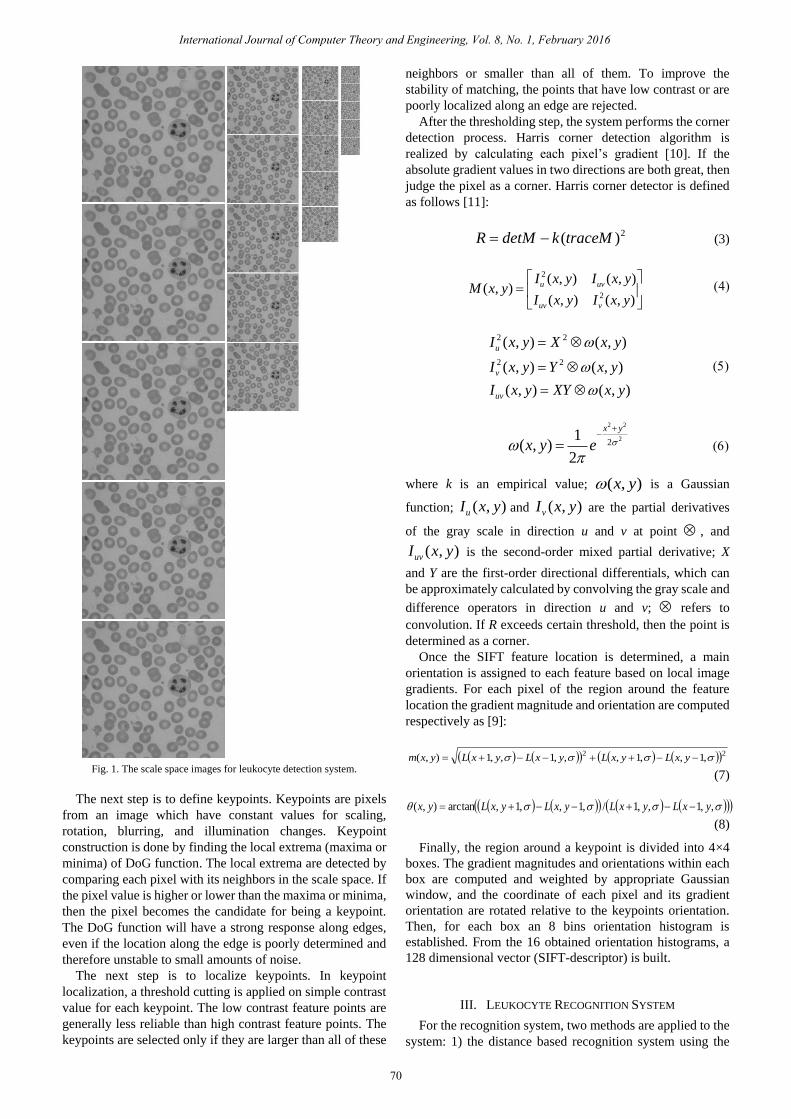
Fig. 1. The scale space images for leukocyte detection system.
The next step is to define keypoints. Keypoints are pixels
from an image which have constant values for scaling,
rotation, blurring, and illumination changes. Keypoint
construction is done by finding the local extrema (maxima or
minima) of DoG function. The local extrema are detected by
comparing each pixel with its neighbors in the scale space. If
the pixel value is higher or lower than the maxima or minima,
then the pixel becomes the candidate for being a keypoint.
The DoG function will have a strong response along edges,
even if the location along the edge is poorly determined and
therefore unstable to small amounts of noise.
The next step is to localize keypoints. In keypoint
localization, a threshold cutting is applied on simple contrast
value for each keypoint. The low contrast feature points are
generally less reliable than high contrast feature points. The
keypoints are selected only if they are larger than all of these
neighbors or smaller than all of them. To improve the
stability of matching, the points that have low contrast or are
poorly localized along an edge are rejected.
After the thresholding step, the system performs the corner
detection process. Harris corner detection algorithm is
realized by calculating each pixel’s gradient [10]. If the
absolute gradient values in two directions are both great, then
judge the pixel as a corner. Harris corner detector is defined
as follows [11]:
2( ) R detM k traceM (3)
2
2
( , ) ( , )( , )
( , ) ( , )
u uv
uv v
I x y I x yM x y
I x y I x y
2 2
2 2
( , ) ( , )
( , ) ( , )
( , ) ( , )
u
v
uv
I x y X x y
I x y Y x y
I x y XY x y
2 2
221
( , )2
x y
x y e
where k is an empirical value; ( , ) x y is a Gaussian
function; ( , )uI x y and ( , )vI x y are the partial derivatives
of the gray scale in direction u and v at point , and
( , )uvI x y is the second-order mixed partial derivative; X
and Y are the first-order directional differentials, which can
be approximately calculated by convolving the gray scale and
difference operators in direction u and v; refers to
convolution. If R exceeds certain threshold, then the point is
determined as a corner.
Once the SIFT feature location is determined, a main
orientation is assigned to each feature based on local image
gradients. For each pixel of the region around the feature
location the gradient magnitude and orientation are computed
respectively as [9]:
22,1,,1,,,1,,1),( yxLyxLyxLyxLyxm
(7)
,,1,,1/,1,,1,arctan),( yxLyxLyxLyxLyx
(8)
Finally, the region around a keypoint is divided into 4×4
boxes. The gradient magnitudes and orientations within each
box are computed and weighted by appropriate Gaussian
window, and the coordinate of each pixel and its gradient
orientation are rotated relative to the keypoints orientation.
Then, for each box an 8 bins orientation histogram is
established. From the 16 obtained orientation histograms, a
128 dimensional vector (SIFT-descriptor) is built.
III. LEUKOCYTE RECOGNITION SYSTEM
For the recognition system, two methods are applied to the
system: 1) the distance based recognition system using the
International Journal of Computer Theory and Engineering, Vol. 8, No. 1, February 2016
70
Euclidean distance method, and 2) the color based
recognition system using the co-occurrence matrix method.
In the Euclidean distance based recognition system, the
dissimilarities between the testing and training feature
vectors are calculated using the Euclidean distance
measurement [12], [13]:
r = |||| wx (7)
With r is the Euclidean distance between x as the testing
feature vector and w as the training feature vector. A small r
value indicates a high similarity of two images.
Meanwhile, in the color based recognition system using the
co-occurrence matrix method, the co-occurrence matrix is
constructed by clustering the gray-scale values of an image.
Such matrix is derived from the angular relationship between
the neighboring pixels as well as the distances between them.
The higher the color intensity of an image, the larger size of
co-occurrence matrix can be obtained. First, the probability
value p(i, j) of the color frequency f(i, j) of index pair i and j is
calculated by [12], [13]:
......................
.....),(),(
.....,,
),(
1),( jifjif
jifjif
jifjip
(8)
Next, obtainthe Haralick features by processing the
probability values of the co-occurrence matrix. Five
characteristic features are processed in the proposed system,
i.e. entropy, contrast, homogeneity, energy, and correlation.
Entropy is used to measure the randomness of intensity
distributions. The entropy value is calculated by:
I
i
J
j
jipjipEntropy0 0
,log, (9)
For taking into account the power of intensity differences
in an image, the contrast characteristic is evaluated. The
contrast value is calculated by:
I
i
J
j
jipjiContrast0 0
2 , (10)
The homogeneity which calculates the uniformity of
intensity variations in an image, is the contrary of the image
contrast. Below is the equation for calculating the
homogeneity:
I
i
J
j ji
jipyHomogeneit
0 0 1
, (11)
Next, energy, as the fourth features, is used to measure the
texture uniformity. The energy value is calculated by:
I
i
J
j
jiPEnergy0 0
2,
(12)
Finally, the correlation value is used to describe the
relations between each pixel value with its neighbors. The
correlation value is calculated by:
yx
yxjipijnCorrelatio
ii
jj
0 0 )],()[(
(13)
IV. EXPERIMENTS
This section describes the experiments conducted for the
proposed leukocyte detection and recognition system using
the Scale Invariant Feature Transform method. We developed
our own database, called the FTI-Untar blood cells database.
The FTI-Untar blood cells database consists of a total of 183
blood cell images with 112 neutrophils images, 37
lymphocytes images, 21 monocytes images, 10eosinophils
images, and 3 basophils images. The images were taken using
a digital camera with 1600×1200 pixels that was attached to a
microscope. Fig. 2 shows the sample of a blood cell image
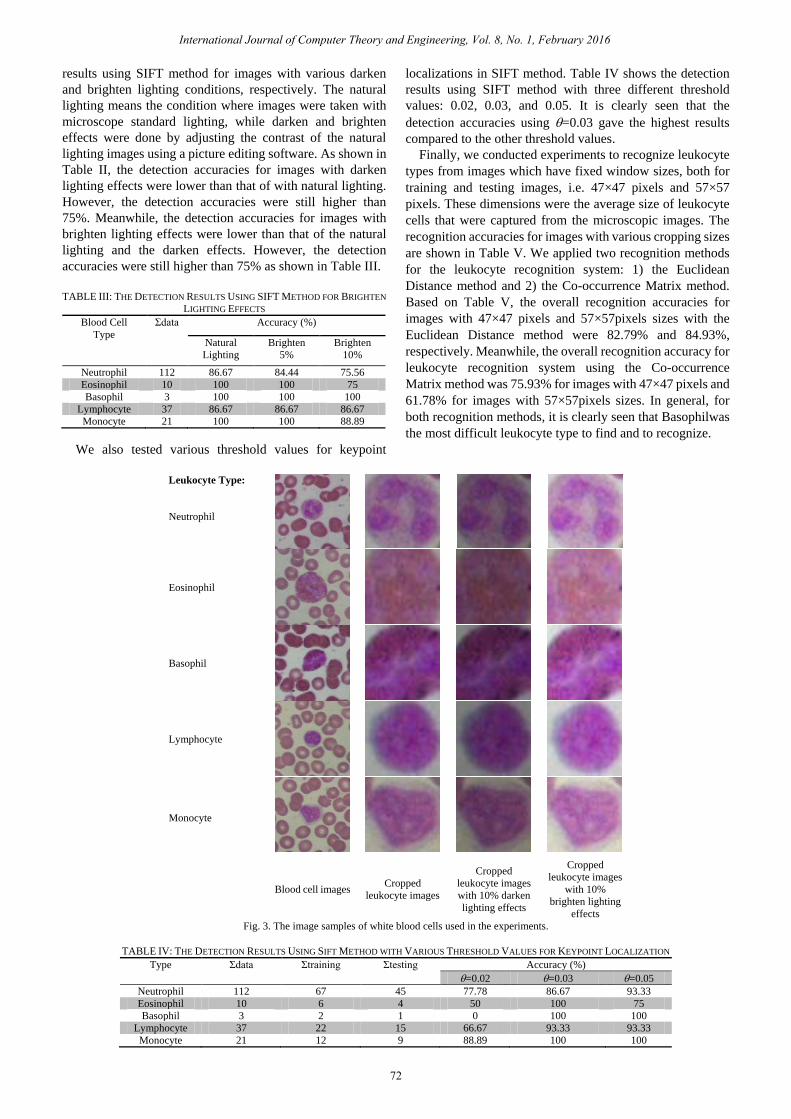
that is used in the experiment, whileFig. 3 shows the samples
of blood cell images, the cropped leukocyte images, the
cropped leukocyte images with 10% darken lighting effects,
and the cropped leukocyte images with 10% brighten lighting
effects.
Fig. 2. The sample of a blood cell image for leukocyte detection system.
We have conducted various experiments with various
targets for the proposed leukocyte detection and recognition
system. First, we evaluated the performance of the SIFT
method for detecting the white blood cells. Table I shows the
detection results using SIFT method. It is shown in Table I
that the proposed system was able to detect white blood cells
with more than 86.67% accuracy.
TABLE I: THE DETECTION RESULTS USING SIFT METHOD
Blood Cell
Type
Σdata Σtraining Σ
testing
Accuracy
(%)
Neutrophil 112 67 45 86.67
Eosinophil 10 6 4 100
Basophil 3 2 1 100
Lymphocyte 37 22 15 86.67
Monocyte 21 12 9 100
TABLE II: THE DETECTION RESULTS USING SIFT METHOD FOR DARKEN
LIGHTING EFFECTS
Blood Cell
Type
Σdata Accuracy (%)
Natural
Lighting
Darken
5%
Darken
10%
Neutrophil 112 86.67 82.22 80
Eosinophil 10 100 100 75
Basophil 3 100 100 100
Lymphocyte 37 86.67 86.67 80
Monocyte 21 100 100 88.89
In the next experiments, we tested the system with various
lighting conditions. Table II and Table III show the detection
International Journal of Computer Theory and Engineering, Vol. 8, No. 1, February 2016
71
results using SIFT method for images with various darken
and brighten lighting conditions, respectively. The natural
lighting means the condition where images were taken with
microscope standard lighting, while darken and brighten
effects were done by adjusting the contrast of the natural
lighting images using a picture editing software. As shown in
Table II, the detection accuracies for images with darken
lighting effects were lower than that of with natural lighting.
However, the detection accuracies were still higher than
75%. Meanwhile, the detection accuracies for images with
brighten lighting effects were lower than that of the natural
lighting and the darken effects. However, the detection
accuracies were still higher than 75% as shown in Table III.
TABLE III: THE DETECTION RESULTS USING SIFT METHOD FOR BRIGHTEN
LIGHTING EFFECTS
Blood Cell
Type
Σdata Accuracy (%)
Natural
Lighting
Brighten
5%
Brighten
10%
Neutrophil 112 86.67 84.44 75.56
Eosinophil 10 100 100 75
Basophil 3 100 100 100
Lymphocyte 37 86.67 86.67 86.67
Monocyte 21 100 100 88.89
We also tested various threshold values for keypoint
localizations in SIFT method. Table IV shows the detection
results using SIFT method with three different threshold
values: 0.02, 0.03, and 0.05. It is clearly seen that the
detection accuracies using =0.03 gave the highest results
compared to the other threshold values.
Finally, we conducted experiments to recognize leukocyte
types from images which have fixed window sizes, both for
training and testing images, i.e. 47×47 pixels and 57×57
pixels. These dimensions were the average size of leukocyte
cells that were captured from the microscopic images. The
recognition accuracies for images with various cropping sizes
are shown in Table V. We applied two recognition methods
for the leukocyte recognition system: 1) the Euclidean
Distance method and 2) the Co-occurrence Matrix method.
Based on Table V, the overall recognition accuracies for
images with 47×47 pixels and 57×57pixels sizes with the
Euclidean Distance method were 82.79% and 84.93%,
respectively. Meanwhile, the overall recognition accuracy for
leukocyte recognition system using the Co-occurrence
Matrix method was 75.93% for images with 47×47 pixels and
61.78% for images with 57×57pixels sizes. In general, for
both recognition methods, it is clearly seen that Basophilwas
the most difficult leukocyte type to find and to recognize.
Leukocyte Type:
Neutrophil
Eosinophil
Basophil
Lymphocyte
Monocyte
Blood cell images Cropped
leukocyte images
Cropped
leukocyte images
with 10% darken
lighting effects
Cropped
leukocyte images
with 10%
brighten lighting
effects
Fig. 3. The image samples of white blood cells used in the experiments.
TABLE IV: THE DETECTION RESULTS USING SIFT METHOD WITH VARIOUS THRESHOLD VALUES FOR KEYPOINT LOCALIZATION
Type Σdata Σtraining Σtesting Accuracy (%)
=0.02 =0.03 =0.05
Neutrophil 112 67 45 77.78 86.67 93.33
Eosinophil 10 6 4 50 100 75
Basophil 3 2 1 0 100 100
Lymphocyte 37 22 15 66.67 93.33 93.33
Monocyte 21 12 9 88.89 100 100
International Journal of Computer Theory and Engineering, Vol. 8, No. 1, February 2016
72
TABLE V: THE RECOGNITION RESULTS FOR LEUKOCYTE IMAGES WITH VARIOUS CROPPING SIZES
Type Σtraining Σtesting
Accuracy (%)
Image size 47×47 pixels Image size 57×57 pixels
Euclidean
Distance
Co-occurrence
Matrix
Euclidean
Distance
Co-occurrence
Matrix
Neutrophil 213 53 90.62 73.58 96.88 90.56
Eosinophil 100 22 83.33 63.63 77.78 59.09
Basophil 74 20 40 55 50 30
Lymphocyte 10 3 100 66.67 100 100
Monocyte 3 2 100 50 100 100
V. CONCLUSION
We have presented the Scale Invariant Feature Transform
method to automatically detect leukocyte areas and recognize
the leukocyte types from microscopic images. The detection
results of the leukocyte images using SIFT method are highly
dependent on the threshold value of keypoint localization.
Other parameters such as lighting condition and window size
also give significant effects on the accuracy of the system.
For the recognition system, the Euclidean Distance method
gives a slightly better result than that of the color based
recognition, i.e. the Co-occurrence Matrix method.
In the future, we consider to develop a dynamic window
model for detecting the leukocyte area, the use of other color
domains, i.e. Hue, Saturation, and Value (HSV) for
improving the system’s accuracy.
REFERENCES
[1] L. A. Chris and B. Mulyawan, “Focused color intersection for
leukocyte detection and recognition system,” International Journal of
Information and Electronics Engineering, vol. 3, no. 5, pp. 498-501,
Sep. 2013.
[2] T. Markiewicz, “Data mining techniques for feature selection in blood
cell recognition,” in Proc. European Symposium on Artificial Neural
Networks, 2006, pp. 407-412.
[3] M. C. Colunga, O. S. Siordia, and S. J. Maybank, “Leukocyte
Recognition using EM-algorithm,” in Proc. 8th Mexican International
Conference on Artificial Intelligence, 2009, pp. 545-555.
[4] N. T. Umpon and P. D. Gader, “Training neural networks to count
white blood cells via a minimum counting error objective function,” in
Proc. International Conference on Pattern Recognition, 2000, pp.
2299-2302.
[5] M. Beksac, M. S. Beksac, V. B. Tipi, H. A. Duru, M. U. Karakas, and
A. Cakar, “An artificial intelligent diagnostic system on differential
recognition of hematopoietic cells from microsopic images”,
Cytometry, vol. 30, pp. 145-150, Jun. 1997.
[6] D. G. Lowe, “Object Recognition from Local Scale-Invariant
Features,” in Proc. International Conference on Computer Vision,
1999, pp. 1150-1157.
[7] D. G. Lowe, “Local Feature View Clustering for 3D Object
Recognition,” in Proc. IEEE Conference on Computer Vision and
Pattern Recognition, 2001, pp. 682-688.
[8] D. G. Lowe, “Distinctive image features from scale-invariant
key-points,” International Journal of Computer Vision, vol. 60, no. 2,
pp. 91-110, Feb. 2004.
[9] F. Alhwarin, C. Wang, D. R-Durrant, A. Graser, “Improved
SIFT-Features Matching for Object Recognition,” in Proc. BCS
International Academic Conference, 2008, pp. 179-190.
[10] C. Harris and M. Stephens, “A combined corner and edge detector,” in
Proc. the 4th Alvey Vision Conference, 1988, pp. 147-151.
[11] J. Chen, L-H. Zou, and L-H. Dou, “The comparison and application of
corner detection algorithms,” Journal of Multimedia, vol. 4, no. 6, pp.
435-441, Dec. 2009.
[12] L. A. Chris and B. Mulyawan, “A combination of feature selection and
co-occurrence matrix methods for leukocyte recognition system,”
Journal of Software Engineering and Applications, vol. 5, no. 12B, pp.
101-106, Dec. 2012.
[13] A. Chris, S. Sugiharto, and Lina, “Detection of Abnormalities of
Lymph Node Tissues using Image Texture Analysis,” in Proc.
International Conference on Information Technology and Applied
Mathematics, 2012, pp. 30-32.
Arlends Chris was born in Bogor, West Java,
Indonesia on March 21, 1977. He got his medical
doctor degree from the Faculty of Medicine from
Tarumanagara University, Indonesia, in 2005. Later, he
obtained his master degree in educational psychology
from Tarumanagara University in 2009. Now, he is
working as a lecturer at the Faculty of Medicine,
Tarumanagara University. He is also a member of the
Indonesian Medical Association.
Bagus Mulyawan was born in Yogyakarta, Central
Java, Indonesia in 1962. He got his bachelor degree
from the Computer Engineering Department,
Gunadarma University, Indonesia in 1992. He
obtained his master degree in information system
management from Budi Luhur University, Jakarta,
Indonesia in 2008. Now, he is working as a lecturer at
the Faculty of Information Technology, Tarumanagara
University.
Agus Budi Dharmawan received the MSc degree from
the Department of Electrical Engineering, Fachbereich
EIT, University of Applied Sciences Hochschule
Darmstadt(hda) Germany in 2011 and the MT degree
from the Department of Electrical Engineering, ITS
Surabaya, Indonesia in 2011. He has been with the
Tarumanagara University, Jakarta, Indonesia since
2008. His research interests include robotics, computer
vision, machine learning, and pattern recognition
. 、
International Journal of Computer Theory and Engineering, Vol. 8, No. 1, February 2016
73
Lina Arlends Chris was born in Padang, West
Sumatera, Indonesia in 1979. She received a B.Eng.
degree in computer science from Tarumanagara
University, Indonesia in 2001, and a M.Sc. degree in
computer science from the University of Indonesia in
2004. In 2005, she received the Japanese government
scholarship as a research student at the Graduate
School of Information Science, Nagoya University,
Japan. Later she continued her graduate study and got
her doctoral degree from Nagoya University, Japan in 2009. Currently she is
working as a lecturer at Tarumanagara University, Indonesia. Her research
interest is in pattern recognition and computer vision field. She is also a
member of IEEE and IEICE.