Embed Size (px)
Citation preview
A National Statistics publication
National Statistics are produced to high professional
standards set out in the National Statistics Code of
Practice. They undergo regular quality assurance reviews
to ensure that they meet customer needs. They are
produced free from any political interference.
Statistical First Release
A level and other level 3 results (revised): 2013/14
Reference SFR 03/2015
Date 29 January 2015
Coverage England
Theme 16 to 19 attainment
Issued by Department for Education, Sanctuary Buildings, Great Smith Street, London SW1P 3BT
Press office 020 7925 6789
Public enquiries 0370 000 2288
Statistician Moira Nelson
Email [email protected]
Internet 16 to 19 attainment
This statistical first release (SFR) shows results in level 3 qualifications for students aged 16-
18 at the end of advanced level study in 2013/14.
This release contains overall achievements for students across all approved level 3
qualifications. In addition, it presents these separately for three cohorts of students following
programmes of different qualification types: ‘A level’, ‘academic’ (includes A level students),
and ‘vocational'. To be included in a cohort, a student needs to have been entered for at least
one substantial qualification (defined as the size of an A level) in one or more of the
qualification types listed below, in the current academic year (2013/14). Students following
programmes of mixed qualification types may belong to more than one cohort.
● A level – A levels, AS levels and applied A and AS levels. Following GCSEs, students following
an academic pathway may progress to A levels, undertaking an AS level initially, continuing to
the full A level in their second year of study.
● Academic – Academic qualifications include AS and A levels (including applied qualifications)
and other academic qualifications such as Cambridge Pre-U, advanced extension award and
the International Baccalaureate. The A level cohort is therefore a sub-set of the academic
cohort.
● Vocational – includes all other regulated qualifications. These generally focus on developing
knowledge and skills in a work related context.
SFR 03/2015: A level and other level 3 results (revised), issued 29 January 2015
Page 2 of 31
Contents
Headline results ......................................................................................................................................... 3
1. Introduction ....................................................................................................................................... 4
2. Changes which impact this year’s release ......................................................................................... 5
Changes to A level assessments ................................................................................................. 5 2.1.
Automatic add-back of students ................................................................................................ 5 2.2.
Changes to SFR tables ................................................................................................................ 6 2.3.
3. Students entered into level 3 qualifications by cohort type .............................................................. 7
4. Performance Measures by Cohort ................................................................................................... 10
A level cohort results (Tables 1a and 1d) ................................................................................. 11 4.1.
4.1.1. Average point score per entry ......................................................................................... 11
4.1.2. Students achieving 3 A*-A grades by gender ................................................................... 12
4.1.3. AAB measures by gender ................................................................................................. 12
Vocational cohort results ......................................................................................................... 14 4.2.
4.2.1. Average point score per entry ......................................................................................... 14
4.2.2. Results by gender ............................................................................................................. 14
4.2.3. Results by subject sector .................................................................................................. 15
Performance measures by type of institution ......................................................................... 17 4.3.
5. Annual A level exam results ............................................................................................................. 19
Top grades and pass rate ......................................................................................................... 19 5.1.
Trends in facilitating subject uptake ........................................................................................ 20 5.2.
Mathematics and English annual A level uptake ..................................................................... 22 5.3.
6. Mathematics and science participation by gender (Tables 18, 19, 20) ........................................... 23
7. List of tables ..................................................................................................................................... 25
8. Coverage of the data ........................................................................................................................ 27
9. Disclosure control ............................................................................................................................ 28
10. Want more? ................................................................................................................................. 29
11. Future changes ............................................................................................................................. 30
12. Got a query? Like to give feedback? ........................................................................................... 30
SFR 03/2015: A level and other level 3 results (revised), issued 29 January 2015
Page 3 of 31
Headline results
400,290 students at end of level 3 study. This has increased by 1.2 per cent since
last year and 13.6 per cent from 2008/09.
173,637 students in the vocational cohort. This is up by 73.0 per cent from
2008/09. The sizes of the A level and academic cohorts have remained
stable over the same time frame (table S1).
Grade C+ is the average grade per entry for the A level cohort. This has been
relatively steady for the past four years, fluctuating at the border of a C
and C+ grade. In the provisional release this was reported as a C grade.
Distinction- is the average grade per entry for the vocational cohort. This grade has
remained the same for the last three years, although the average point
score has risen from 211.6 to 216.6.
15.0 per cent of A level students at end of 16-18 study achieved grades AAB at least
two of which were in facilitating subjects. This has dropped from 15.3
per cent last year.
12.7 per cent of male A level students at end of 16-18 study achieved three A* and A
grades, compared to 11.4 per cent of female students. Levels have fallen
for both genders but at a faster rate for females, by 1.4 percentage points
compared to 0.7 percentage points for males since the peak in 2010/11.
98.6 per cent of A levels were passed this year. This rate has remained stable over
the past four years (fluctuating between 98.5 and 98.7 per cent).
26.7 per cent of A levels resulted in A* or A grades this year. This is the same rate as
last year, but has seen a gradual decline from 27.2 per cent in 2010/11.
26.8 per cent of A levels taken by females resulted in A* and A grades this year.
This has fallen for the third year in a row from 27.7 per cent in 2010/11.
The gender gap in attainment of A* and A grades has nearly
disappeared as levels for males have risen slightly over the past three
years to 26.6 per cent in 2013/14.
SFR 03/2015: A level and other level 3 results (revised), issued 29 January 2015
Page 4 of 31
1. Introduction
This statistical first release (SFR) shows revised 2013/14 A level and other level 3 results in
England at national, regional, local authority level and, for some tables, institution level. The
data covers students aged 16-18 at the start of the 2013/14 academic year.
The data has been collated for the 2014 school and college performance tables. These are
published at the same time as this release on the performance tables website.
This release provides an update to the provisional figures released in October 2014 in SFR
42/2014. The revised figures take account of checking by schools and colleges. A number of
figures will have changed between the two releases; this is expected and occurs every year.
It is usual for student numbers to drop between the two releases; for example, this year the
number of level 3 students decreased from 415,315 to 400,290. In contrast, performance
measures tend to improve but generally changes are not substantial and where relevant these
have been highlighted. For more information on these changes, please see the quality and
methodology document published alongside this SFR.
Level 3 qualifications:
Each qualification regulated by Ofqual has a level between entry level and level eight.
Qualifications which are at the same level are judged to be of a similar difficulty. This SFR only
includes qualifications classified as level 3 and approved for the 16-18 age group under section
96 of the Learning and Skills Act (2000). More information can be found on the GOV.UK
website (Ofqual - what different qualification levels mean).
16-18 age range:
The cohort of students included in this release is based on academic age. This refers to
students aged 16, 17 or 18 on 31 August 2013.
SFR 03/2015: A level and other level 3 results (revised), issued 29 January 2015
Page 5 of 31
2. Changes which impact this year’s release
Changes to A level assessments 2.1.
In 2010, the government set out its education policy aims in the white paper, The Importance
of Teaching (see Section 4.49 - The Importance of Teaching - The Schools White Paper 2010).
One of these was the reform of A level qualifications and, in particular, course structures so
that examinations are taken at the end of the course, as opposed to a modular approach. As
an interim measure, from September 2013 students in England were no longer able to sit AS
and A level exams in January.
January 2013 was, therefore, the last opportunity for students to take an exam at this time of
year. In 2012/13, only 2.1 per cent (16,504 entries) of A level entries and 7.6 per cent (101,918
entries) of AS level entries were taken in January 2013. The majority of these entries (61.0 per
cent for A levels and 71.0 per cent for AS levels) were not repeated during the summer,
suggesting the January exam session was primarily used to ease the summer exam load, or
used for resits to improve results from the previous summer.
Of those that did repeat the same exam in the summer, most resulted in the same grade (53.8
per cent of A level entries, and 57.5 per cent of AS level entries). For the remainder, 46.1 per
cent of A level exams and 42.1 per cent of AS level exams resulted in an improved grade; and
only 0.1 per cent of A levels and 0.4 per cent of AS levels resulted in a lower grade.
Automatic add-back of students 2.2.
As part of the performance tables checking exercise, the department shares student level
attainment data with schools and colleges. Institutions are able to request that their students’
results are deferred from the performance tables by one year if they have not reached the end
of 16-18 study. The following year, these students should be added back into institution
figures to count towards that year’s results, regardless of whether they have achieved any
further results.
This is the first year that students have been added back automatically. This will become
standard practice from now on. In addition, from this year a student cannot be deferred at
academic age 18 as they will be outside the scope of performance tables the following year.
This is consistent with key stage 4 performance tables policy.
Analysis shows that this change has had little impact on level 3 attainment at a national level.
The average point score per entry across all level 3 qualifications is 214.6 (table 1a); when the
add-back students are removed the average point score per entry is 214.7. The majority (75.8
per cent) of add back students were in the Further Education (FE) sector (excluding sixth form
colleges), of which 89.0 per cent were on a vocational programme. The adding-back of
students deferred last year has lowered the average point score per entry across all level 3
qualifications for the FE sector by 0.2 points, from 206.1 to 205.9.
SFR 03/2015: A level and other level 3 results (revised), issued 29 January 2015
Page 6 of 31
Changes to SFR tables 2.3.
Last year’s SFR introduced performance data for students in the academic and vocational
cohorts to reflect changes to the 16-18 performance tables. In this SFR, a time series of cohort
numbers and average point score per entry for the academic and vocational cohorts from
2007/08 has been included to show trends over time (table S1).
Information on science and mathematics A level uptake by gender was first published in the
revised 2012/13 ‘A level and other level 3 results’ SFR (tables 18 and 19 - Mathematics and
science entries). This data was provided at national, regional, local authority and institution
level.
These tables have been updated for 2013/14 and a new national time series on subject uptake
by gender from 2009/10 to 2013/14 (table 20) has been included. See Section 6 for an analysis
of this data.
SFR 03/2015: A level and other level 3 results (revised), issued 29 January 2015
Page 7 of 31
3. Students entered into level 3 qualifications by cohort type
Students can be reported in one or more cohort: A level, academic and vocational, depending
on the types of qualifications taken. To be included in a cohort the student must have been
entered for at least one substantial qualification in one or more of the qualification types. This
is defined as at least the size of an A level (180 guided learning hours per year)1.
Academic and A level cohorts
The academic and A level cohorts show very similar trends in size and attainment as the
majority of academic students take A level programmes. For this reason, in the analysis below,
the academic cohort is omitted for clarity. Data for the academic cohort can be found in table
1d and table S1.
There has been a continued rise in the total number of students entering at least one
substantial level 3 qualification; a rise of 1.2 per cent since last year and 13.6 per cent since
2008/09. To explore whether this is a real increase in level 3 participation or simply due to
more students finishing key stage 4, in figure 1 we have compared level 3 exam entries with
numbers of students completing key stage 4 two years previously. This provides an estimate
for the number of students that could be at the end of 16-18 study (potential 16-18 cohort).
Since there is no established estimate for the 16-18 cohort, this baseline is considered
preferable to actual population figures which are based on age, since students start and finish
key stage 4 and 16-18 study at different times.
The chart below shows that in 2013/14, 64.5 per cent continued with level 3 qualifications
compared to 53.8 per cent in 2008/09, suggesting that level 3 participation is increasing.
Participation at level 3 is unlikely to reach 100 per cent as some students at the end of key
stage 4 will continue with qualifications below level 3, enter training and/or employment, or
study on a part-time basis. This is not covered in this SFR.
Using the key stage 4 cohort
We have used the 2011/12 key stage 4 cohort (GCSE and equivalent results in England: 2013
to 2014 (revised)) as a proxy for the number of students that could be at the end of 16-18
study two years later. This is based on the assumption that most students complete level 3
qualifications (i.e. A levels) in two years.
1 Ofqual - what's the deal with guided learning hours
SFR 03/2015: A level and other level 3 results (revised), issued 29 January 2015
Page 8 of 31
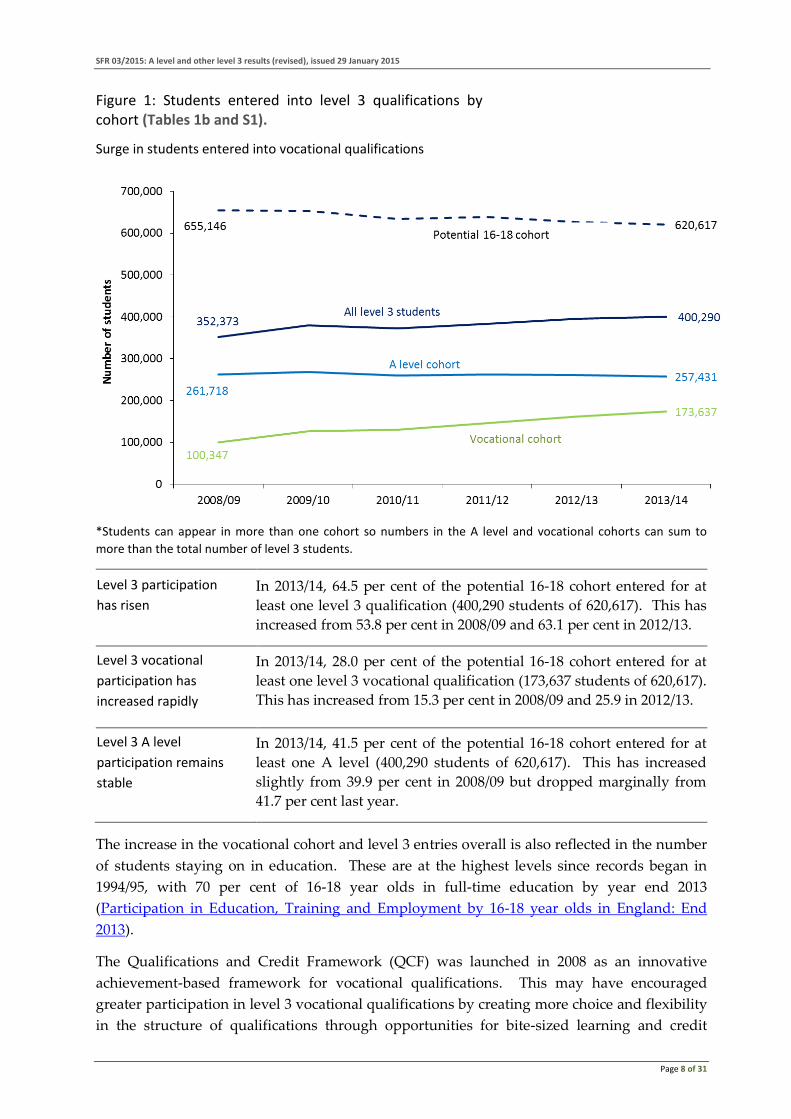
Figure 1: Students entered into level 3 qualifications by cohort (Tables 1b and S1).
Surge in students entered into vocational qualifications
*Students can appear in more than one cohort so numbers in the A level and vocational cohorts can sum to
more than the total number of level 3 students.
Level 3 participation
has risen
In 2013/14, 64.5 per cent of the potential 16-18 cohort entered for at
least one level 3 qualification (400,290 students of 620,617). This has
increased from 53.8 per cent in 2008/09 and 63.1 per cent in 2012/13.
Level 3 vocational
participation has
increased rapidly
In 2013/14, 28.0 per cent of the potential 16-18 cohort entered for at
least one level 3 vocational qualification (173,637 students of 620,617).
This has increased from 15.3 per cent in 2008/09 and 25.9 in 2012/13.
Level 3 A level
participation remains
stable
In 2013/14, 41.5 per cent of the potential 16-18 cohort entered for at
least one A level (400,290 students of 620,617). This has increased
slightly from 39.9 per cent in 2008/09 but dropped marginally from
41.7 per cent last year.
The increase in the vocational cohort and level 3 entries overall is also reflected in the number
of students staying on in education. These are at the highest levels since records began in
1994/95, with 70 per cent of 16-18 year olds in full-time education by year end 2013
(Participation in Education, Training and Employment by 16-18 year olds in England: End
2013).
The Qualifications and Credit Framework (QCF) was launched in 2008 as an innovative
achievement-based framework for vocational qualifications. This may have encouraged
greater participation in level 3 vocational qualifications by creating more choice and flexibility
in the structure of qualifications through opportunities for bite-sized learning and credit
SFR 03/2015: A level and other level 3 results (revised), issued 29 January 2015
Page 9 of 31
transfer. For example, students were able to take smaller qualifications and build up their
achievements to larger qualifications.
It is too early to assess the impact of Raising the Participation Age (Increasing opportunities
for young people and helping them to achieve their potential) on post-16 level 3 participation
since it only took effect in 2013/14. However, this is likely to affect trends going forward. The
new legislation means that students who left year 11 in summer 2013 had to continue in
education or training for at least another year until June 2014; and students who left year 11 in
summer 2014 or later will have to continue until at least their 18th birthday. Eligible
education or training includes apprenticeships and part-time education or training in
combination with employment which are not currently covered by the performance tables.
SFR 03/2015: A level and other level 3 results (revised), issued 29 January 2015
Page 10 of 31
4. Performance Measures by Cohort
Performance measures by cohort show cumulative results over two years for all students at
the end of advanced level study who entered a substantial level 3 qualification in 2013/14.
Depending on the qualifications taken (see box on front page), a student may be included in
one or more cohort.
Since similar trends in attainment are seen in the A level and academic cohort (the majority of
academic students take A level programmes); only trends for the A level and vocational
cohorts are shown here. For more information on academic attainment please see table 1d.
Performance across the academic and vocational cohorts should not be compared for the
following reasons:
Vocational students take fewer qualifications: Table 1d shows 65.6 per cent of the vocational
cohort achieved at least two substantial level 3 qualifications compared to 92.4 per cent for
A level students. One reason for this could be that vocational students are more likely to take
qualifications below level 3 alongside their level 3 qualifications, and this data is not included
in this SFR. Therefore, vocational students may be more likely to achieve a lower average
point score per full-time equivalent (FTE) student as shown in Table 1d. Average point score
per entry should be used for comparisons across institution types.
Part-time students may be included in further education college data: The average point
score per FTE student may appear lower if part-time students are included in this release.
Further Education colleges are required to remove part-time students as part of the
performance tables checking exercise. However, it is possible that some of these students are
not removed.
Different grading structure: A levels are graded A* to E, a 6 grade scale, whereas vocational
qualifications have a variety of grading structures. For the purposes of vocational average
grade measures, these have been standardised to a 4 grade scale (Distinction*, Distinction,
Merit and Pass). In addition, more points can be achieved for top grades in academic
qualifications than vocational qualifications (300 for an A* in A level compared to 270 for
Distinction* in vocational qualifications).
SFR 03/2015: A level and other level 3 results (revised), issued 29 January 2015
Page 11 of 31
A level cohort results (Tables 1a and 1d) 4.1.
4.1.1. Average point score per entry
The average point score per entry was first published for the A level cohort in the 2012
performance tables. A time series has been made available in table S1 for comparative
purposes. This time series is not available by gender before 2012/13.
Average point score per entry
The average point score per entry is one of the main headline measures for the 16-18
performance tables and will become the only key attainment measure by 2016. This measure
gives an indication of the average result achieved per qualification taken which enables us to
compare achievement over time regardless of the volume of qualifications taken.
Average point score per entry results are also presented as equivalent grades in both the
performance tables and in this SFR. A table of these grades can be found in Annex C of the
Quality and Methodology document accompanying this release.
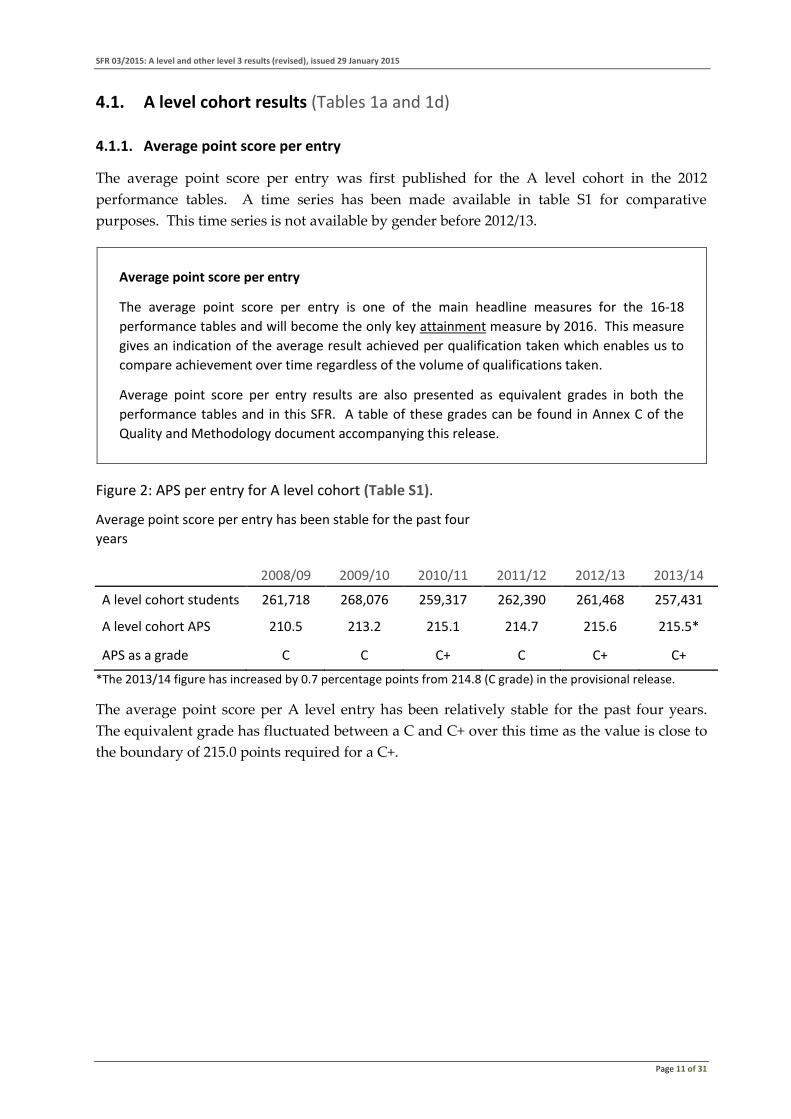
Figure 2: APS per entry for A level cohort (Table S1).
Average point score per entry has been stable for the past four
years
2008/09 2009/10 2010/11 2011/12 2012/13 2013/14
A level cohort students 261,718 268,076 259,317 262,390 261,468 257,431
A level cohort APS 210.5 213.2 215.1 214.7 215.6 215.5*
APS as a grade C C C+ C C+ C+
*The 2013/14 figure has increased by 0.7 percentage points from 214.8 (C grade) in the provisional release.
The average point score per A level entry has been relatively stable for the past four years.
The equivalent grade has fluctuated between a C and C+ over this time as the value is close to
the boundary of 215.0 points required for a C+.
SFR 03/2015: A level and other level 3 results (revised), issued 29 January 2015
Page 12 of 31
4.1.2. Students achieving 3 A*-A grades by gender
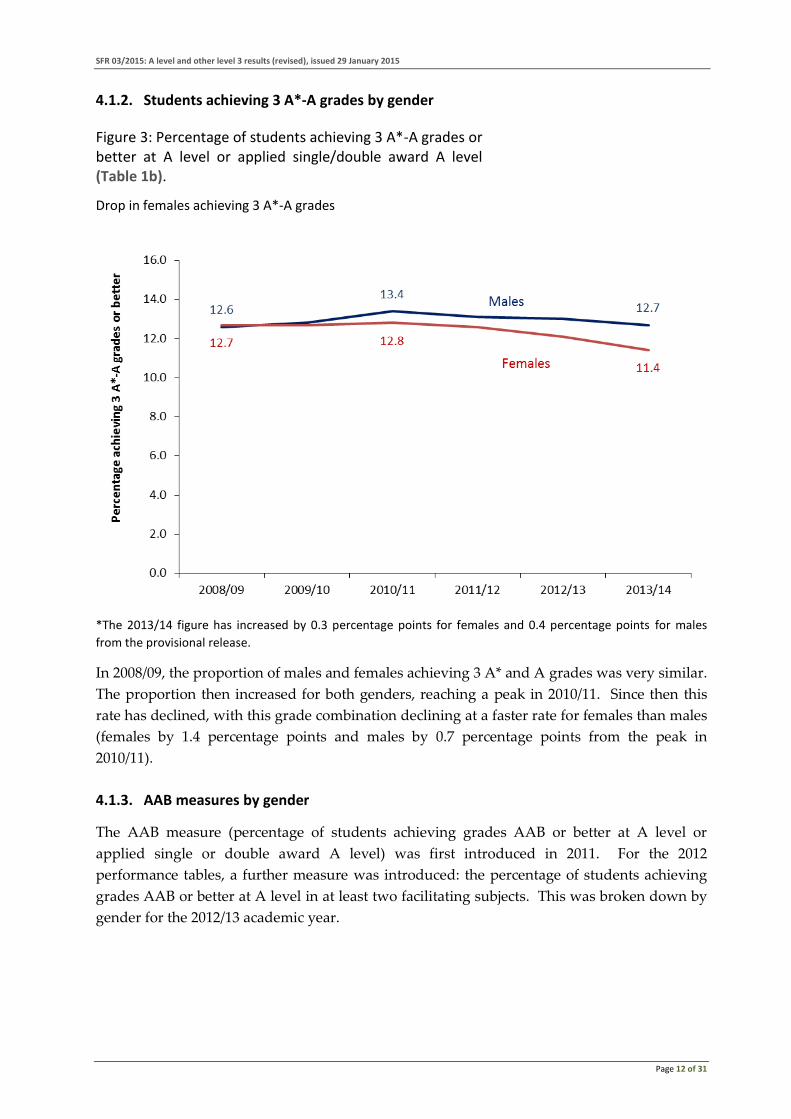
Figure 3: Percentage of students achieving 3 A*-A grades or better at A level or applied single/double award A level (Table 1b).
Drop in females achieving 3 A*-A grades
*The 2013/14 figure has increased by 0.3 percentage points for females and 0.4 percentage points for males
from the provisional release.
In 2008/09, the proportion of males and females achieving 3 A* and A grades was very similar.
The proportion then increased for both genders, reaching a peak in 2010/11. Since then this
rate has declined, with this grade combination declining at a faster rate for females than males
(females by 1.4 percentage points and males by 0.7 percentage points from the peak in
2010/11).
4.1.3. AAB measures by gender
The AAB measure (percentage of students achieving grades AAB or better at A level or
applied single or double award A level) was first introduced in 2011. For the 2012
performance tables, a further measure was introduced: the percentage of students achieving
grades AAB or better at A level in at least two facilitating subjects. This was broken down by
gender for the 2012/13 academic year.
SFR 03/2015: A level and other level 3 results (revised), issued 29 January 2015
Page 13 of 31
Facilitating subjects
The list of ‘facilitating subjects’ (identified by the Russell Group of universities) is: mathematics
and further mathematics; English (literature); physics; biology; chemistry; geography; history;
languages (modern and classical). These are A level subjects that are most often required by
universities and help to keep a student’s options open if they are unsure about what course to
study.
There are two A level facilitating subject measures reported in this SFR. The first shows the
percentage of students achieving three A levels at grades AAB or higher in at least two
facilitating subjects highlighted in figure 4 below. The second shows the percentage achieving
these grades in three facilitating subjects. The second measure will not be reported in the
performance tables from this year but the figures can be found in Table 1a.
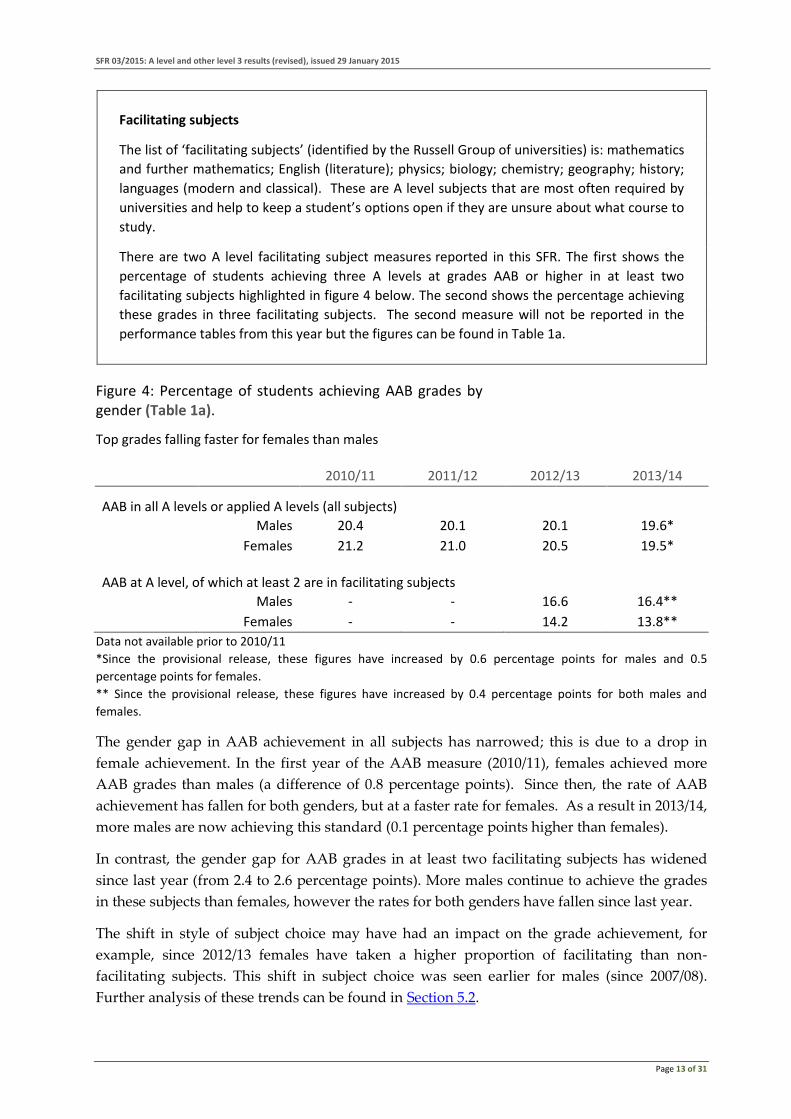
Figure 4: Percentage of students achieving AAB grades by gender (Table 1a).
Top grades falling faster for females than males
2010/11 2011/12 2012/13 2013/14
AAB in all A levels or applied A levels (all subjects)
Males 20.4 20.1 20.1 19.6*
Females 21.2 21.0 20.5 19.5*
AAB at A level, of which at least 2 are in facilitating subjects
Males - - 16.6 16.4**
Females - - 14.2 13.8**
Data not available prior to 2010/11
*Since the provisional release, these figures have increased by 0.6 percentage points for males and 0.5
percentage points for females.
** Since the provisional release, these figures have increased by 0.4 percentage points for both males and
females.
The gender gap in AAB achievement in all subjects has narrowed; this is due to a drop in
female achievement. In the first year of the AAB measure (2010/11), females achieved more
AAB grades than males (a difference of 0.8 percentage points). Since then, the rate of AAB
achievement has fallen for both genders, but at a faster rate for females. As a result in 2013/14,
more males are now achieving this standard (0.1 percentage points higher than females).
In contrast, the gender gap for AAB grades in at least two facilitating subjects has widened
since last year (from 2.4 to 2.6 percentage points). More males continue to achieve the grades
in these subjects than females, however the rates for both genders have fallen since last year.
The shift in style of subject choice may have had an impact on the grade achievement, for
example, since 2012/13 females have taken a higher proportion of facilitating than non-
facilitating subjects. This shift in subject choice was seen earlier for males (since 2007/08).
Further analysis of these trends can be found in Section 5.2.
SFR 03/2015: A level and other level 3 results (revised), issued 29 January 2015
Page 14 of 31
Vocational cohort results 4.2.
4.2.1. Average point score per entry
The average point score per entry was first published for the vocational cohort in the 2013
performance tables. A time series of this measure has been made available in table S1 for
comparative purposes (this time series is not available by gender).
Figure 5: APS per entry for vocational cohort (Table S1).
Rise in average point score per vocational entry
2008/09 2009/10 2010/11 2011/12 2012/13 2013/14
Vocational cohort students
100,347 126,347 130,639 145,937 162,326 173,637
Vocational cohort APS
220.0 222.5 224.0 211.6 213.7 216.6
APS as a grade Distinction Distinction Distinction Distinction- Distinction- Distinction-
After a sharp fall in 2011/12, the average point score per vocational entry has risen steadily
and is now closer to the 220 points required for a Distinction, similar to levels seen prior to
2011/12. The drop in 2011/12 could be due to a number of factors, for example, a shift in
subject choices or towards qualifications with different grading structures.
4.2.2. Results by gender
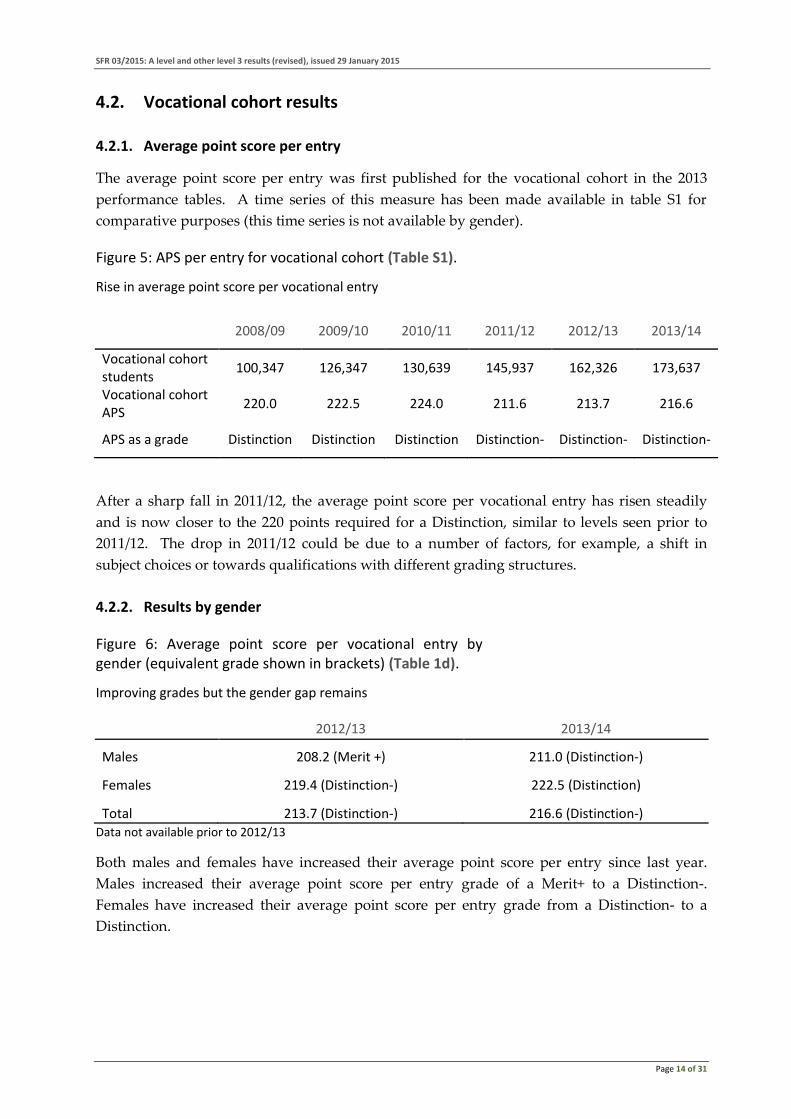
Figure 6: Average point score per vocational entry by gender (equivalent grade shown in brackets) (Table 1d).
Improving grades but the gender gap remains
2012/13 2013/14
Males 208.2 (Merit +) 211.0 (Distinction-)
Females 219.4 (Distinction-) 222.5 (Distinction)
Total 213.7 (Distinction-) 216.6 (Distinction-) Data not available prior to 2012/13
Both males and females have increased their average point score per entry since last year.
Males increased their average point score per entry grade of a Merit+ to a Distinction-.
Females have increased their average point score per entry grade from a Distinction- to a
Distinction.
SFR 03/2015: A level and other level 3 results (revised), issued 29 January 2015
Page 15 of 31
4.2.3. Results by subject sector
Vocational subjects are classified by Subject Sector Area (see Section 3 - Qualification
descriptions - sector subject areas). These are set by Ofqual and chosen by the qualifications’
awarding organisation. The results for the vocational cohort in the chart below have been
presented by subject sector area for 2008/09 and 2013/14 to assess changes in subject choice
over this period.
Please note that the range of qualifications available to 16-18 students will have changed
between 2008/09 and 2013/14, as could the subject sector area classification of qualifications, so
changes in uptake of a particular sector may not be a direct result of student behaviour.
However, the chart provides an overall picture of current and previous participation at post-
16 for the most popular student choices (subject sector areas with small numbers have been
omitted for clarity).
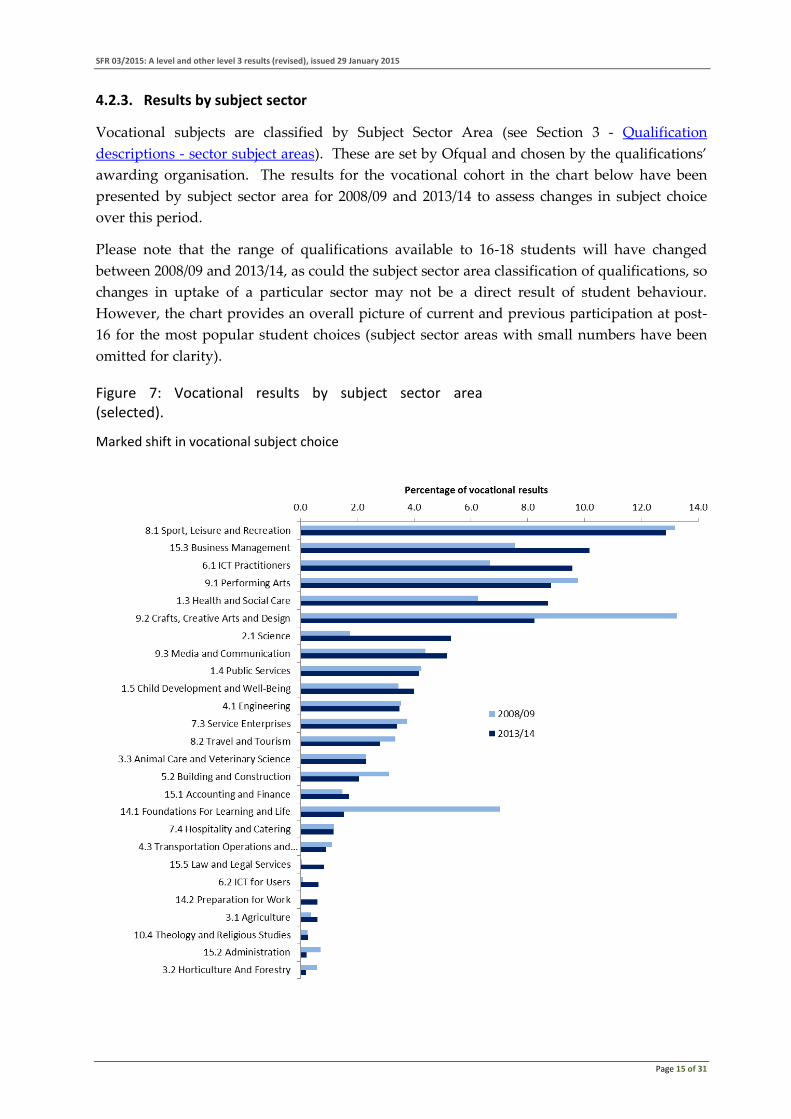
Figure 7: Vocational results by subject sector area (selected).
Marked shift in vocational subject choice
SFR 03/2015: A level and other level 3 results (revised), issued 29 January 2015
Page 16 of 31
Sport, Leisure and Recreation most popular subject sector
Sport, Leisure and Recreation was one of the two most popular
subject sectors in 2008/09. In 2013/14 this was still the most popular,
although the percentage decreased slightly (13.2 per cent to 12.9 per
cent of vocational qualifications).
Proportion of results in Creative Arts declined
In 2008/09, Crafts, Creative Arts and Design was one of the most
popular subject sectors (13.2 per cent of all vocational qualifications).
However, in 2013/14 this had dropped to the sixth most popular (8.2
per cent).
Four subjects show marked increase
Science, ICT Practitioners, Business Management and Health and
Social Care have shown the biggest increases in the percentage of all
vocational qualifications since 2008/09 (3.5, 2.9, 2.6 and 2.5 percentage
points, respectively).
Two subjects show marked decrease
Foundations for Learning and Life and Crafts, Creative Arts and
Design show the biggest decreases in the percentage of all vocational
qualifications since 2008/09 (5.5 and 5.0 percentage points,
respectively).
SFR 03/2015: A level and other level 3 results (revised), issued 29 January 2015
Page 17 of 31
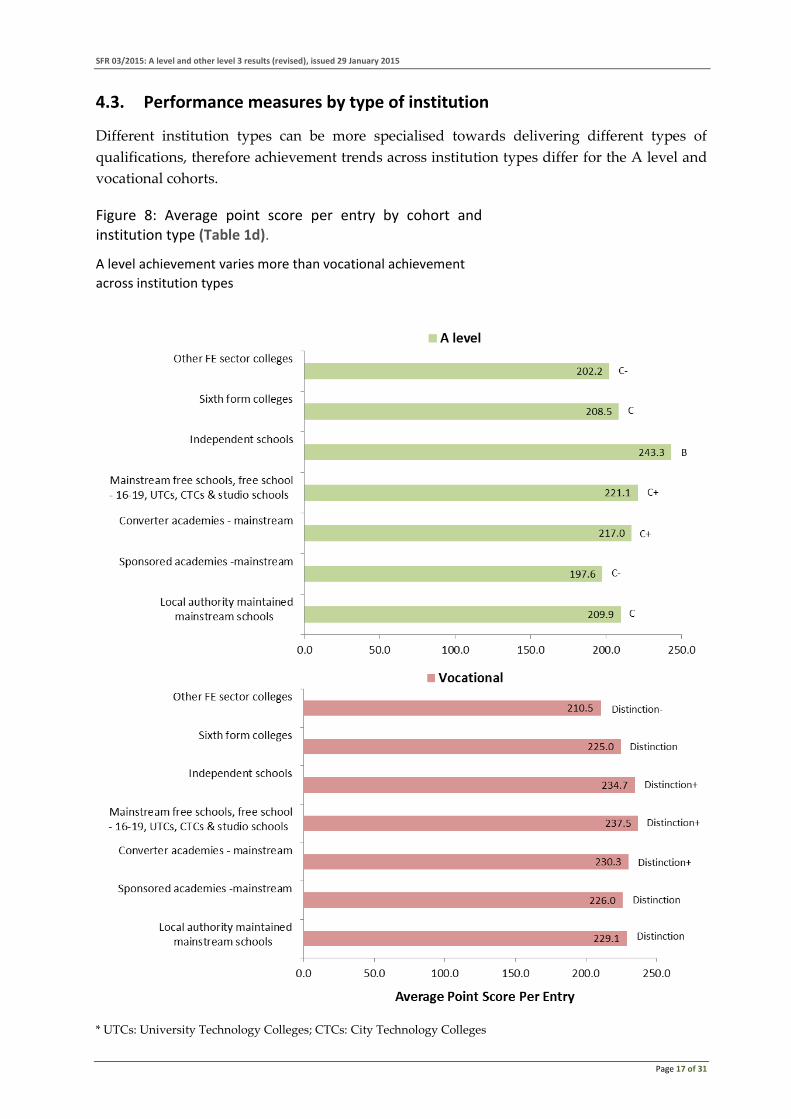
Performance measures by type of institution 4.3.
Different institution types can be more specialised towards delivering different types of
qualifications, therefore achievement trends across institution types differ for the A level and
vocational cohorts.
Figure 8: Average point score per entry by cohort and institution type (Table 1d).
A level achievement varies more than vocational achievement
across institution types
* UTCs: University Technology Colleges; CTCs: City Technology Colleges
SFR 03/2015: A level and other level 3 results (revised), issued 29 January 2015
Page 18 of 31
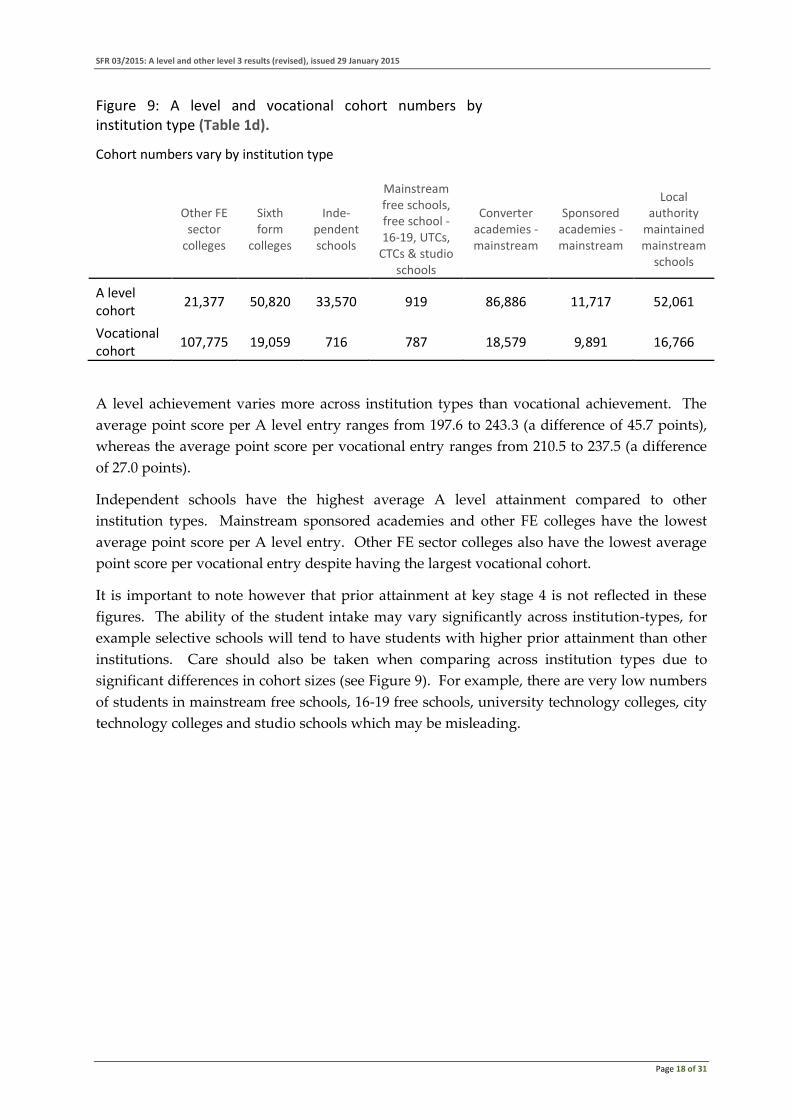
Figure 9: A level and vocational cohort numbers by institution type (Table 1d).
Cohort numbers vary by institution type
Other FE sector
colleges
Sixth form
colleges
Inde-pendent schools
Mainstream free schools, free school - 16-19, UTCs,
CTCs & studio schools
Converter academies - mainstream
Sponsored academies -mainstream
Local authority
maintained mainstream
schools
A level cohort
21,377 50,820 33,570 919 86,886 11,717 52,061
Vocational cohort
107,775 19,059 716 787 18,579 9,891 16,766
A level achievement varies more across institution types than vocational achievement. The
average point score per A level entry ranges from 197.6 to 243.3 (a difference of 45.7 points),
whereas the average point score per vocational entry ranges from 210.5 to 237.5 (a difference
of 27.0 points).
Independent schools have the highest average A level attainment compared to other
institution types. Mainstream sponsored academies and other FE colleges have the lowest
average point score per A level entry. Other FE sector colleges also have the lowest average
point score per vocational entry despite having the largest vocational cohort.
It is important to note however that prior attainment at key stage 4 is not reflected in these
figures. The ability of the student intake may vary significantly across institution-types, for
example selective schools will tend to have students with higher prior attainment than other
institutions. Care should also be taken when comparing across institution types due to
significant differences in cohort sizes (see Figure 9). For example, there are very low numbers
of students in mainstream free schools, 16-19 free schools, university technology colleges, city
technology colleges and studio schools which may be misleading.
SFR 03/2015: A level and other level 3 results (revised), issued 29 January 2015
Page 19 of 31
5. Annual A level exam results
The A level cohort information outlined above (shown in Section 4.1) is based on cumulative
results for students at the end of their 16-18 study. This is the data that is published in the
performance tables. In contrast, the data in this section which is only available in this release
is based on the results of a single academic year.
Top grades and pass rate 5.1.
The provisional data showed that the total proportion of top grades (A* and A) had dropped
by 0.1 percentage points for males and by 0.4 percentage points for females. The revised data
shows that there has been no change in the overall achievement of top grades on last year;
males have increased by 0.1 percentage points and females have decreased by 0.2 percentage
points.
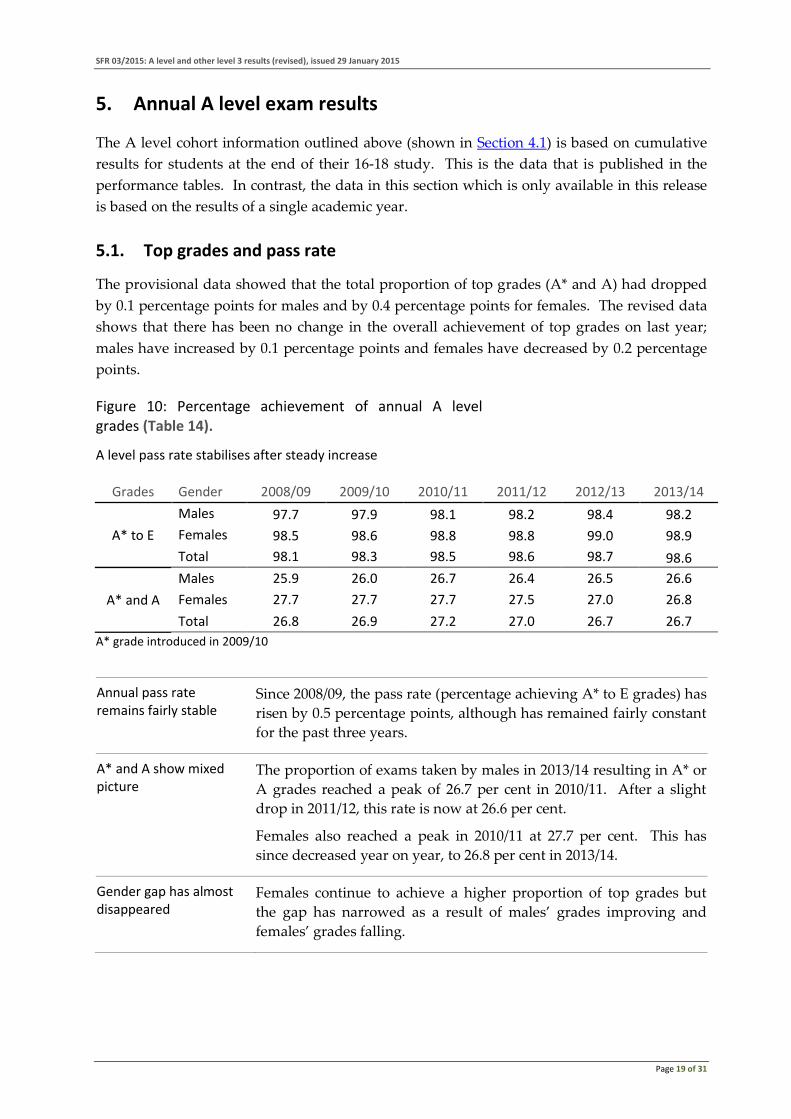
Figure 10: Percentage achievement of annual A level grades (Table 14).
A level pass rate stabilises after steady increase
Grades Gender 2008/09 2009/10 2010/11 2011/12 2012/13 2013/14
A* to E
Males 97.7 97.9 98.1 98.2 98.4 98.2
Females 98.5 98.6 98.8 98.8 99.0 98.9
Total 98.1 98.3 98.5 98.6 98.7 98.6
A* and A
Males 25.9 26.0 26.7 26.4 26.5 26.6
Females 27.7 27.7 27.7 27.5 27.0 26.8
Total 26.8 26.9 27.2 27.0 26.7 26.7
A* grade introduced in 2009/10
Annual pass rate remains fairly stable
Since 2008/09, the pass rate (percentage achieving A* to E grades) has
risen by 0.5 percentage points, although has remained fairly constant
for the past three years.
A* and A show mixed picture
The proportion of exams taken by males in 2013/14 resulting in A* or
A grades reached a peak of 26.7 per cent in 2010/11. After a slight
drop in 2011/12, this rate is now at 26.6 per cent.
Females also reached a peak in 2010/11 at 27.7 per cent. This has
since decreased year on year, to 26.8 per cent in 2013/14.
Gender gap has almost disappeared
Females continue to achieve a higher proportion of top grades but
the gap has narrowed as a result of males’ grades improving and
females’ grades falling.
SFR 03/2015: A level and other level 3 results (revised), issued 29 January 2015
Page 20 of 31
Trends in facilitating subject uptake 5.2.
The facilitating subjects AAB measure was first introduced in the 2012 16-18 performance
tables. These subjects include mathematics and further mathematics; English (literature);
physics; biology; chemistry; geography; history; languages (modern and classical). This
followed the introduction of a similar measure in 2010 at key stage 4, the English
Baccalaureate (EBacc), which covers the same subjects at GCSE.
English Baccalaureate (EBacc) measure
The EBacc measure introduced in 2009/10 (English Baccalaureate: information for schools) is
reported in the key stage 4 performance tables. The measure counts achievements in English,
mathematics, history or geography, the sciences and a language. To achieve the EBacc, at
least a C grade (or equivalent) must be achieved in each component. Key stage 4 attainment
data is available in GCSE and equivalent results in England: 2013 to 2014 (revised).
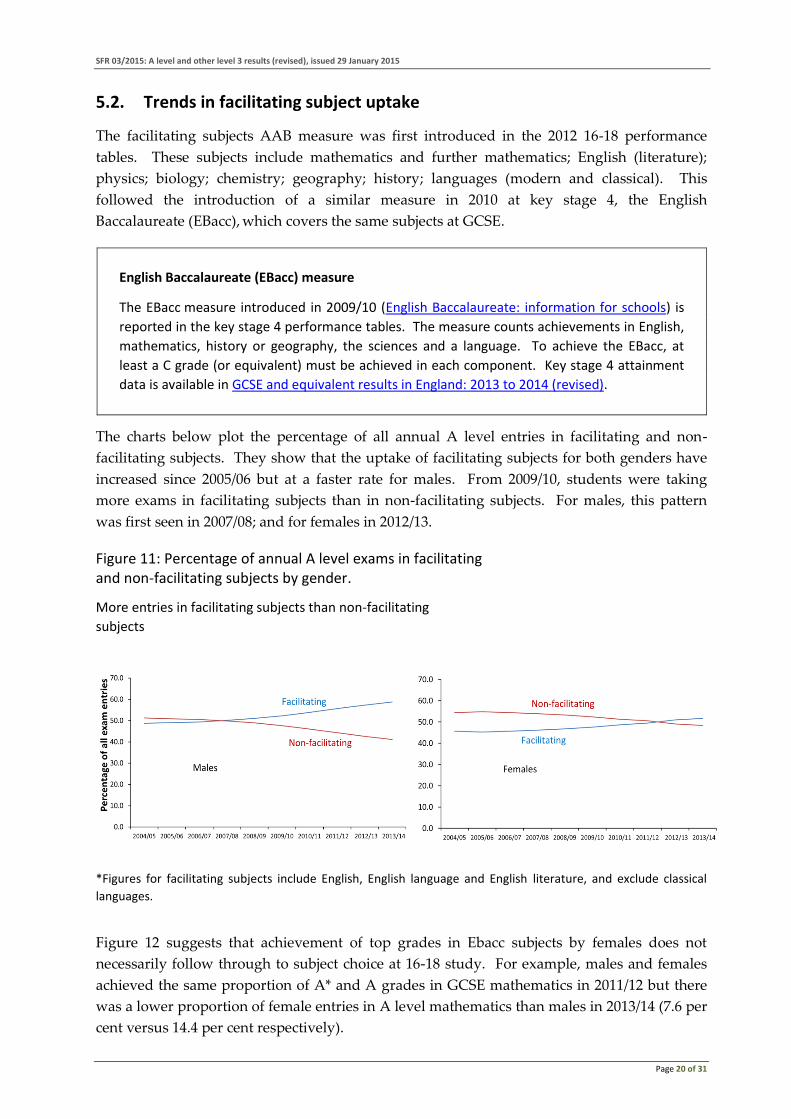
The charts below plot the percentage of all annual A level entries in facilitating and non-
facilitating subjects. They show that the uptake of facilitating subjects for both genders have
increased since 2005/06 but at a faster rate for males. From 2009/10, students were taking
more exams in facilitating subjects than in non-facilitating subjects. For males, this pattern
was first seen in 2007/08; and for females in 2012/13.
Figure 11: Percentage of annual A level exams in facilitating and non-facilitating subjects by gender.
More entries in facilitating subjects than non-facilitating
subjects
*Figures for facilitating subjects include English, English language and English literature, and exclude classical
languages.
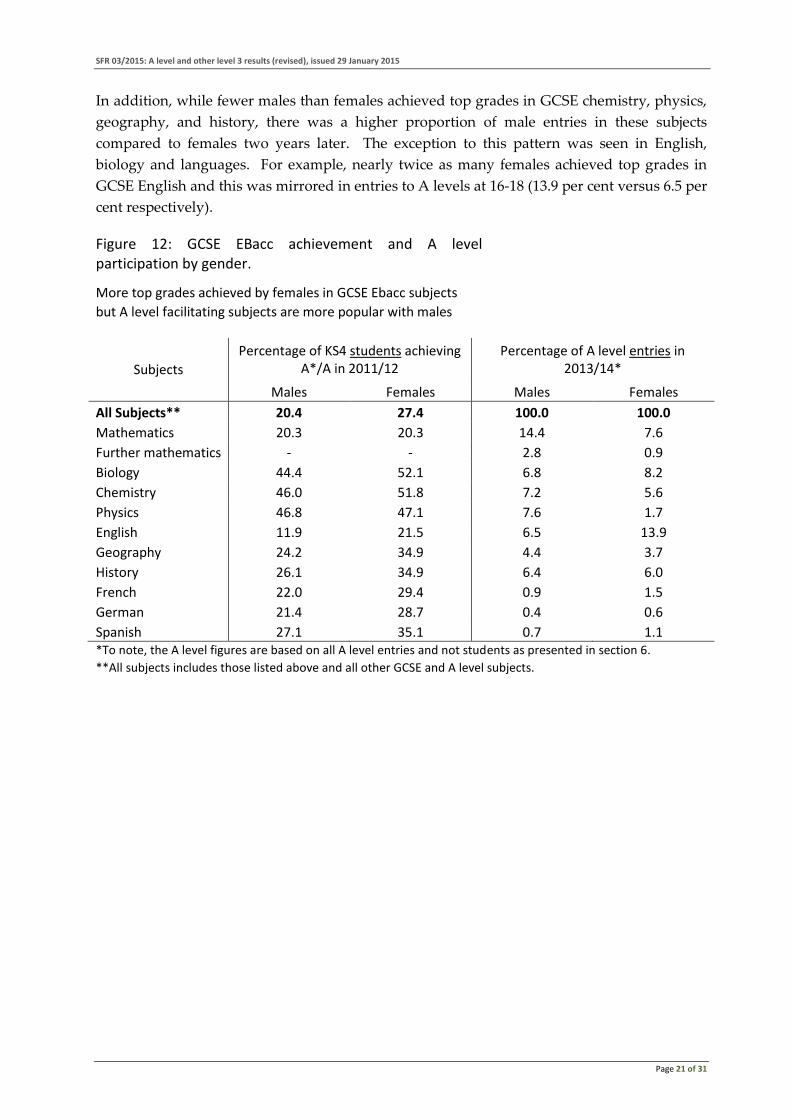
Figure 12 suggests that achievement of top grades in Ebacc subjects by females does not
necessarily follow through to subject choice at 16-18 study. For example, males and females
achieved the same proportion of A* and A grades in GCSE mathematics in 2011/12 but there
was a lower proportion of female entries in A level mathematics than males in 2013/14 (7.6 per
cent versus 14.4 per cent respectively).
SFR 03/2015: A level and other level 3 results (revised), issued 29 January 2015
Page 21 of 31
In addition, while fewer males than females achieved top grades in GCSE chemistry, physics,
geography, and history, there was a higher proportion of male entries in these subjects
compared to females two years later. The exception to this pattern was seen in English,
biology and languages. For example, nearly twice as many females achieved top grades in
GCSE English and this was mirrored in entries to A levels at 16-18 (13.9 per cent versus 6.5 per
cent respectively).
Figure 12: GCSE EBacc achievement and A level participation by gender.
More top grades achieved by females in GCSE Ebacc subjects
but A level facilitating subjects are more popular with males
Subjects
Percentage of KS4 students achieving A*/A in 2011/12
Percentage of A level entries in 2013/14*
Males Females Males Females
All Subjects** 20.4 27.4 100.0 100.0
Mathematics 20.3 20.3 14.4 7.6
Further mathematics - - 2.8 0.9
Biology 44.4 52.1 6.8 8.2
Chemistry 46.0 51.8 7.2 5.6
Physics 46.8 47.1 7.6 1.7
English 11.9 21.5 6.5 13.9
Geography 24.2 34.9 4.4 3.7
History 26.1 34.9 6.4 6.0
French 22.0 29.4 0.9 1.5
German 21.4 28.7 0.4 0.6
Spanish 27.1 35.1 0.7 1.1 *To note, the A level figures are based on all A level entries and not students as presented in section 6.
**All subjects includes those listed above and all other GCSE and A level subjects.
SFR 03/2015: A level and other level 3 results (revised), issued 29 January 2015
Page 22 of 31
Mathematics and English annual A level uptake 5.3.
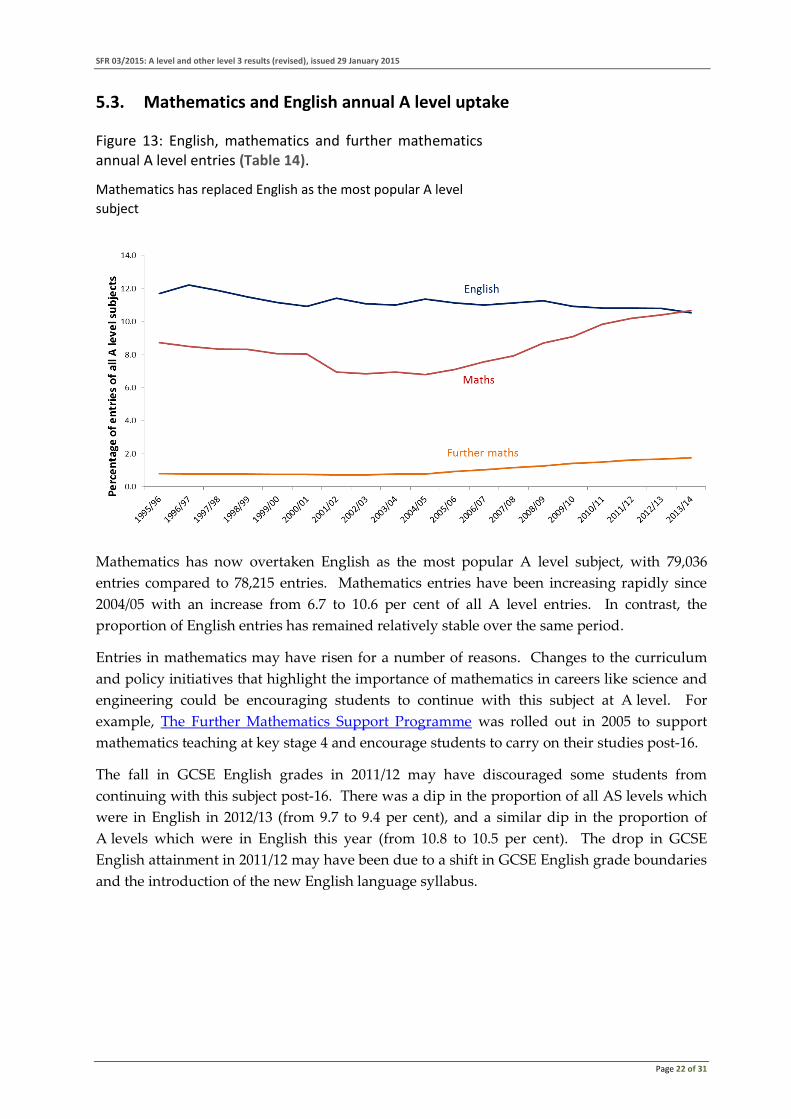
Figure 13: English, mathematics and further mathematics annual A level entries (Table 14).
Mathematics has replaced English as the most popular A level
subject
Mathematics has now overtaken English as the most popular A level subject, with 79,036
entries compared to 78,215 entries. Mathematics entries have been increasing rapidly since
2004/05 with an increase from 6.7 to 10.6 per cent of all A level entries. In contrast, the
proportion of English entries has remained relatively stable over the same period.
Entries in mathematics may have risen for a number of reasons. Changes to the curriculum
and policy initiatives that highlight the importance of mathematics in careers like science and
engineering could be encouraging students to continue with this subject at A level. For
example, The Further Mathematics Support Programme was rolled out in 2005 to support
mathematics teaching at key stage 4 and encourage students to carry on their studies post-16.
The fall in GCSE English grades in 2011/12 may have discouraged some students from
continuing with this subject post-16. There was a dip in the proportion of all AS levels which
were in English in 2012/13 (from 9.7 to 9.4 per cent), and a similar dip in the proportion of
A levels which were in English this year (from 10.8 to 10.5 per cent). The drop in GCSE
English attainment in 2011/12 may have been due to a shift in GCSE English grade boundaries
and the introduction of the new English language syllabus.
SFR 03/2015: A level and other level 3 results (revised), issued 29 January 2015
Page 23 of 31
6. Mathematics and science participation by gender (Tables 18, 19, 20)
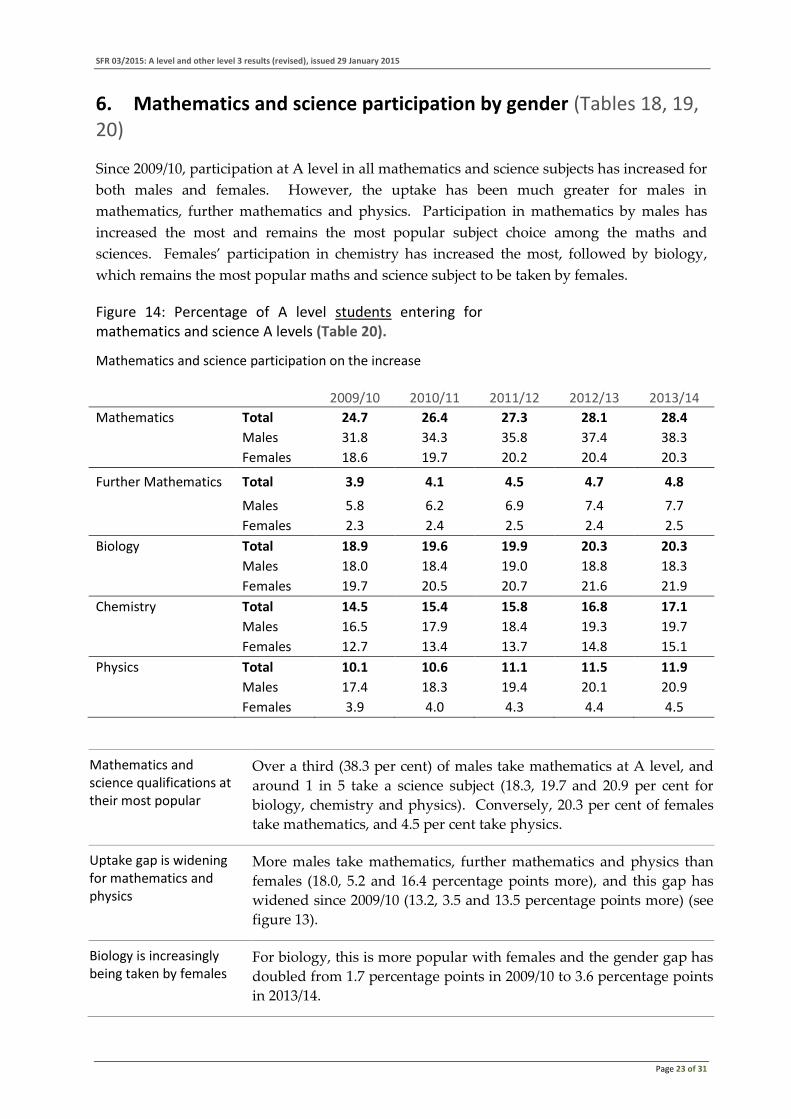
Since 2009/10, participation at A level in all mathematics and science subjects has increased for
both males and females. However, the uptake has been much greater for males in
mathematics, further mathematics and physics. Participation in mathematics by males has
increased the most and remains the most popular subject choice among the maths and
sciences. Females’ participation in chemistry has increased the most, followed by biology,
which remains the most popular maths and science subject to be taken by females.
Figure 14: Percentage of A level students entering for mathematics and science A levels (Table 20).
Mathematics and science participation on the increase
2009/10 2010/11 2011/12 2012/13 2013/14
Mathematics Total 24.7 26.4 27.3 28.1 28.4
Males 31.8 34.3 35.8 37.4 38.3
Females 18.6 19.7 20.2 20.4 20.3
Further Mathematics Total 3.9 4.1 4.5 4.7 4.8
Males 5.8 6.2 6.9 7.4 7.7
Females 2.3 2.4 2.5 2.4 2.5
Biology Total 18.9 19.6 19.9 20.3 20.3
Males 18.0 18.4 19.0 18.8 18.3
Females 19.7 20.5 20.7 21.6 21.9
Chemistry Total 14.5 15.4 15.8 16.8 17.1
Males 16.5 17.9 18.4 19.3 19.7
Females 12.7 13.4 13.7 14.8 15.1
Physics Total 10.1 10.6 11.1 11.5 11.9
Males 17.4 18.3 19.4 20.1 20.9
Females 3.9 4.0 4.3 4.4 4.5
Mathematics and science qualifications at their most popular
Over a third (38.3 per cent) of males take mathematics at A level, and
around 1 in 5 take a science subject (18.3, 19.7 and 20.9 per cent for
biology, chemistry and physics). Conversely, 20.3 per cent of females
take mathematics, and 4.5 per cent take physics.
Uptake gap is widening for mathematics and physics
More males take mathematics, further mathematics and physics than
females (18.0, 5.2 and 16.4 percentage points more), and this gap has
widened since 2009/10 (13.2, 3.5 and 13.5 percentage points more) (see
figure 13).
Biology is increasingly being taken by females
For biology, this is more popular with females and the gender gap has
doubled from 1.7 percentage points in 2009/10 to 3.6 percentage points
in 2013/14.
SFR 03/2015: A level and other level 3 results (revised), issued 29 January 2015
Page 24 of 31
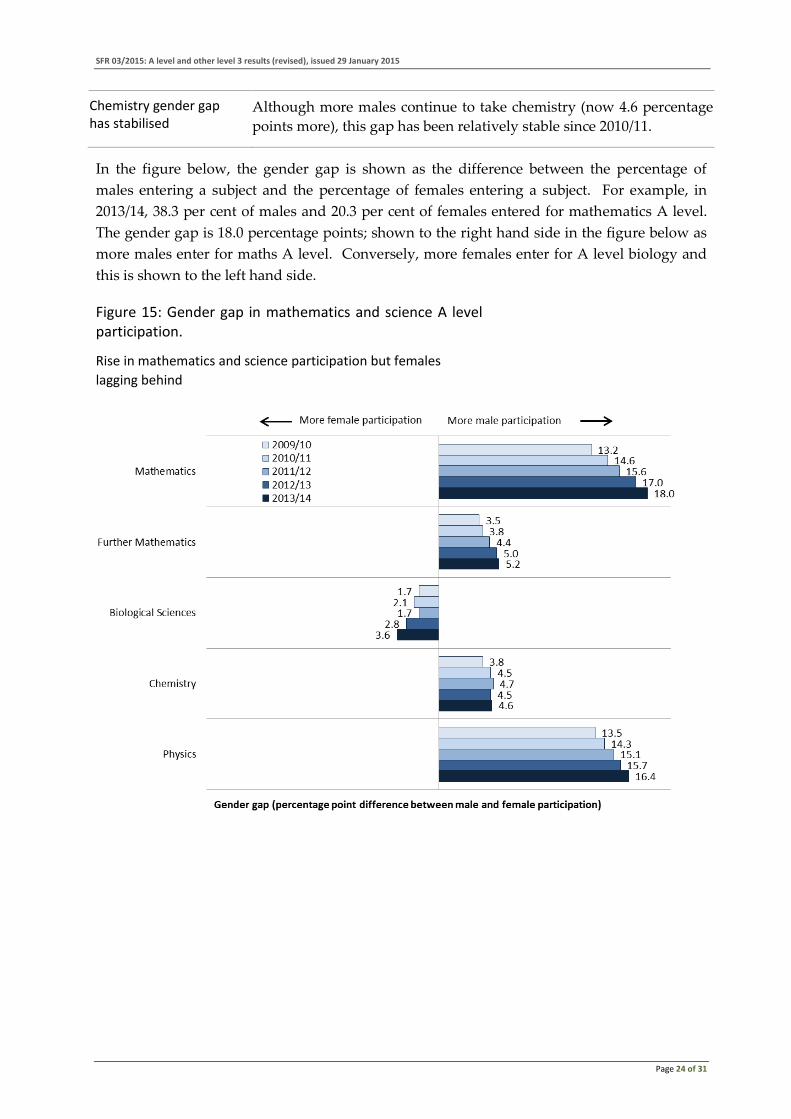
Chemistry gender gap has stabilised
Although more males continue to take chemistry (now 4.6 percentage
points more), this gap has been relatively stable since 2010/11.
In the figure below, the gender gap is shown as the difference between the percentage of
males entering a subject and the percentage of females entering a subject. For example, in
2013/14, 38.3 per cent of males and 20.3 per cent of females entered for mathematics A level.
The gender gap is 18.0 percentage points; shown to the right hand side in the figure below as
more males enter for maths A level. Conversely, more females enter for A level biology and
this is shown to the left hand side.
Figure 15: Gender gap in mathematics and science A level participation.
Rise in mathematics and science participation but females
lagging behind
SFR 03/2015: A level and other level 3 results (revised), issued 29 January 2015
Page 25 of 31
7. List of tables
The following tables are available on GOV.UK - attainment at 19 years
Student level results:
1a A level and level 3 results by institution type and gender
1b Time series of A level and level 3 results by gender
1c A level and level 3 results of state-funded school students by admissions basis and gender
1d Level 3 results by cohort, institution type and gender
Examination A level results:
2 A level results of all students by subject and grade
2m A level results of male students by subject and grade
2f A level results of female students by subject and grade
Examination AS level results:
3 AS level results of all students by subject and grade
3m AS level results of male students by subject and grade
3f AS level results of female students by subject and grade
4 2013 AS level results of all current Year 13 students by subject and grade
4m 2013 AS level results of current Year 13 male students by subject and grade
4f 2013 AS level results of current Year 13 female students by subject and grade
Examination Applied A/AS level:
5 Applied single A level results by gender, subject and grade
6 Applied single AS level results by gender, subject and grade
7 Applied double A level results by gender, subject and grade
8 Applied double AS level results by gender, subject and grade
Examination A level results by institution type:
9 A level results of students by institution type, gender and grade
10 A level results of state-funded school students by admission basis, gender and grade
11a A level results of state-funded school students by subject and grade
11b A level results of independent school students by subject and grade
11c A level results of all further education sector college students by subject and grade
11d A level results of sixth form college students by subject and grade
Local authority tables:
12a A level and level 3 results of state-funded students by gender, local authority and region
12b A level and level results of state-funded school students by gender, local authority and region
13a Number of A level examination entries by state-funded students by subject, local authority and region
13b Number of A level A* and A grades achieved by state-funded students by subject, local authority and region
13c Number of A level A* to E grades achieved by state-funded students by subject, local authority and region
Subject time series:
14 A level results by subject, grade and gender
15 AS level results by subject, grade and gender
School and college location tables:
16 A level and level 3 results by degree of rurality of school location and region
17 A level and level 3 results by local authority district of school location and region
Students entered for mathematics and science A levels:
18 A level students entered for mathematics and science A levels by gender and institution
19 State-funded A level students entered for mathematics and science A levels by gender, local authority and region
SFR 03/2015: A level and other level 3 results (revised), issued 29 January 2015
Page 26 of 31
20 Time series of A level students entered for mathematics and science A levels by gender
Time series for A level, academic and vocational cohort
S1 Average point score per entry for A level, academic and vocational cohorts
Maps:
M1 A level cohort average point score per entry by local authority
M2 Vocational cohort average point score per entry by local authority
SFR 03/2015: A level and other level 3 results (revised), issued 29 January 2015
Page 27 of 31
8. Coverage of the data
16 to 18 year old students included only
16 to 18 year old students at the end of their final year of study
typically lasting two years are included within the scope of this SFR
The criteria we use to include students
Students will be included if they meet the following criteria:
1. Were aged 16, 17 or 18 on 31 August 2013
2. Were on roll in January 2014
3. Were in, or deemed to be in, Year 13
4. Completed their advanced studies in the 2013/14 academic year
5. Entered for at least one substantial level 3 qualification
Applies to schools in England
The Welsh Assembly has published the results of external
examinations taken by pupils aged 15 or 17 in 2012/13, available at:
Welsh assembly statistics and research
The Department for Education Northern Ireland (DENI) have
published AS and A level headline statistics for 2013, available at:
Department for Education Northern Ireland (DENI)
The publication, ‘Summary statistics for attainment, leaver
destinations and healthy living, No. 4: 2014 Edition’, is published by
the Scottish Government and is available at: The Scottish
Government website
How we avoid double counting subjects
To avoid double counting results, qualification discounting is applied
where, for example, if a student achieves an AS en route to achieving
an A level in the same subject, only the A level pass is included.
Approved qualifications only
The range of qualifications reported in this SFR covers all level 3
qualifications approved under Section 96 of the Learning and Skills
Act (2000).
Approved qualifications at level 3 and their point scores can be found
at Ofqual Register website
Want more information?
Please view our quality and methodology document which provides
further information.
This can be found at GOV.UK - attainment at 19 years
SFR 03/2015: A level and other level 3 results (revised), issued 29 January 2015
Page 28 of 31
9. Disclosure control
We preserve confidentiality
The Code of Practice for Official Statistics requires us to take
reasonable steps to ensure that our published or disseminated
statistics protect confidentiality.
The Department has a set of statistical policies in line with the Code
of Practice for Official Statistics: Standards for official statistics
published by the Department for Education
so we suppress some figures,
Any numbers less than three (1 to 2 inclusive) have been suppressed
and have been replaced by an ‘x’. An ‘x’ has also been used where
secondary suppression has been applied.
Percentages have been shown to one decimal place but where the
numerator is between 1 and 2 inclusive, they have been suppressed.
Where a number as shown as zero (0), the original figure submitted
was zero.
adopt symbols to help identify this
Symbols are used in the tables as follows:
. not applicable
x publication of that figure would be disclosive
and round percentages Percentages in this SFR are given to one decimal place. Totals may
not add to 100% due to rounding.
SFR 03/2015: A level and other level 3 results (revised), issued 29 January 2015
Page 29 of 31
10. Want more?
Subject detail We publish A levels and AS levels subject time series. This can be
found within the subject time series spreadsheet (tables 14 and 15) at
GOV.UK - attainment at 19 years.
Local authority data We publish more information by local authorities. This can be found
within the LA tables (tables 12 and 13) at GOV.UK - attainment at 19
years.
Want previously published statistics
The A level and other level 3 results SFRs for previous years can be
found at GOV.UK - attainment at 19 years.
Performance tables Data for institutions can be seen within the school and college
performance tables. This was updated on 29 January 2015 with
2013/14 data.
Key stage 4 GCSE and equivalent results for key stage 4 can be found at GOV.UK
- Statistics: GCSEs (key stage 4).
Key stage 2 Statistics on national curriculum assessments and review outcomes at
key stage 2 (KS2), including measures of progress between KS1 and
KS2 can be found at GOV.UK - Statistics: key stage 2.
Key stage 1 Statistics on national curriculum assessments at key stage 1 and
phonics screening check results can be found at GOV.UK - Statistics:
key stage 1.
Destination measures Statistics on educational or employment destinations of key stage 4
and key stage 5 students can be found at GOV.UK - Statistics:
destinations of key stage 4 and key stage 5 pupils.
Level 2 and 3 attainment at 16-18
Statistics on the attainment of young people aged 19, based on
matched administrative data can be found at GOV.UK – attainment at
19 years.
Level 1 and 2 attainment in English and maths at 16-18
Experimental statistics on level 1 and 2 English and maths by
students aged 16 to 18 who failed to achieve A* to C by the end of key
stage 4 GOV.UK - attainment at 19 years.

SFR 03/2015: A level and other level 3 results (revised), issued 29 January 2015
Page 30 of 31
11. Future changes
New vocational cohorts The 2016 performance tables will further disaggregate the level 3
vocational cohort into students taking approved applied general and
tech level qualifications. This is to reflect the differing content,
assessment and grading arrangements within these qualifications.
The scope of this SFR will be reviewed as the coverage of
performance tables expands (as announced in the government’s
response to the 16-19 accountability consultation).
The approved qualifications can be found here: Vocational
qualifications for 14- to 19-year-olds
Want more information
For more information on the upcoming reforms to the performance
tables, please see the 16 to 19 accountability headline measures:
technical guide.
12. Got a query? Like to give feedback?
If from the media Press Office News Desk, Department for Education, Sanctuary
Buildings, Great Smith Street, London SW1P 3BT. 020 7925 6789
If non-media Moira Nelson, School Performance Data Unit, Education Data
Division, Sanctuary Buildings, 20 Great Smith St, London SW1P 3BT
SFR 03/2015: A level and other level 3 results (revised), issued 29 January 2015
Page 31 of 31
© Crown copyright 2015
You may re-use this information (excluding logos) free of charge in
any format or medium, under the terms of the Open Government
Licence. To view this licence, visit Open Government Licence or
email: [email protected].
Where we have identified any third party copyright information
you will need to obtain permission from the copyright holders
concerned.
Any enquiries regarding this publication should be sent to us at:
This document is also available from our website at :
https://www.gov.uk/government/organisations/department-for-
education


![Revised Financial Results for March 31, 2016 [Result]](https://img.pdfslide.net/doc/110x75/577c7c231a28abe054997305/revised-financial-results-for-march-31-2016-result-577fbe2a2d932.jpg)


![Revised Financial Results for March 31, 2015 [Result]](https://img.pdfslide.net/doc/110x75/577c77461a28abe0548b6e55/revised-financial-results-for-march-31-2015-result.jpg)


![Revised Financial Results for 31 March, 2016 [Result]](https://img.pdfslide.net/doc/110x75/577c79751a28abe05492b80b/revised-financial-results-for-31-march-2016-result.jpg)