Embed Size (px)
Citation preview
Contact: Email: [email protected] Press office: 020 7783 8300 Public enquiries: 0370 000 2288
Revised A level and other level 3 results in
England, 2014/ 2015
SFR 03/2016, 21 January 2016
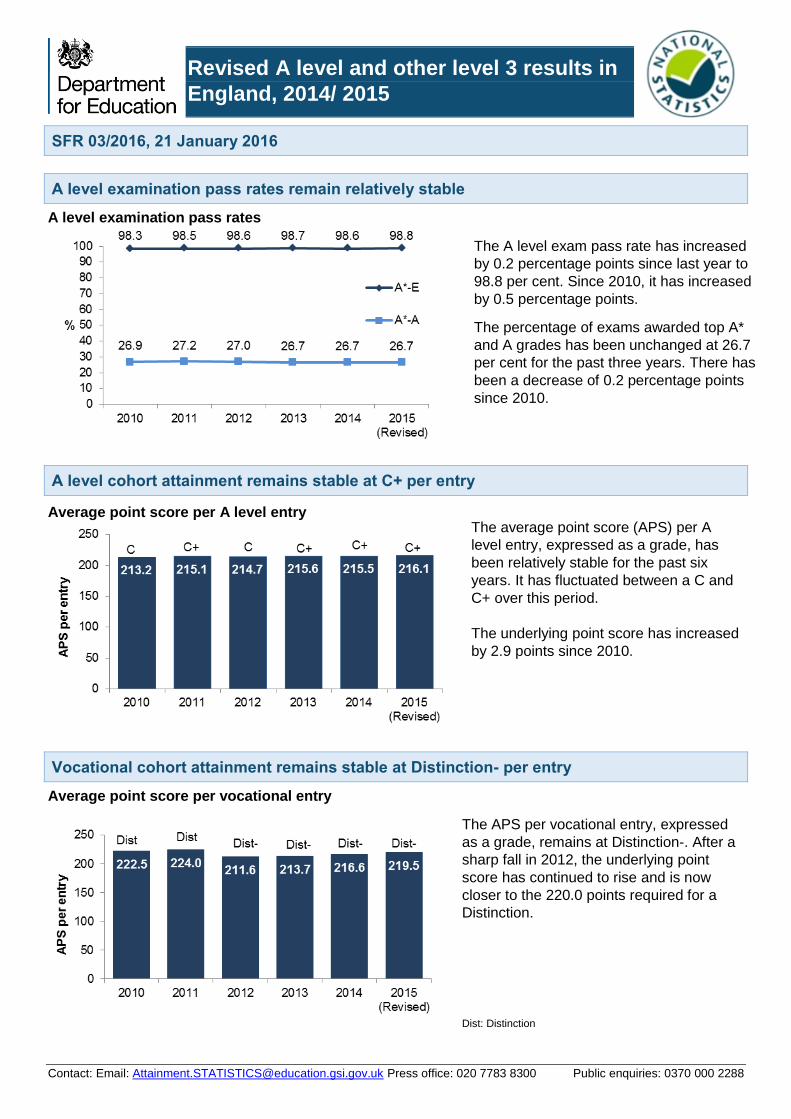
A level examination pass rates remain relatively stable
A level examination pass rates
The A level exam pass rate has increased
by 0.2 percentage points since last year to
98.8 per cent. Since 2010, it has increased
by 0.5 percentage points.
The percentage of exams awarded top A*
and A grades has been unchanged at 26.7
per cent for the past three years. There has
been a decrease of 0.2 percentage points
since 2010.
A level cohort attainment remains stable at C+ per entry
Average point score per A level entry
The average point score (APS) per A
level entry, expressed as a grade, has
been relatively stable for the past six
years. It has fluctuated between a C and
C+ over this period.
The underlying point score has increased
by 2.9 points since 2010.
Vocational cohort attainment remains stable at Distinction- per entry
Average point score per vocational entry
The APS per vocational entry, expressed
as a grade, remains at Distinction-. After a
sharp fall in 2012, the underlying point
score has continued to rise and is now
closer to the 220.0 points required for a
Distinction.
Dist: Distinction
Contact: Email: [email protected] Press office: 020 7783 8300 Public enquiries: 0370 000 2288
Contents
1. Introduction......................................................................................................................................................... 3
2. Level 3 participation ........................................................................................................................................... 3
3. Attainment by cohort .......................................................................................................................................... 4
4. Attainment by type of institution ......................................................................................................................... 9
5. A level cohort attainment by local authority ..................................................................................................... 11
6. A level examination results within a single academic year .............................................................................. 12
7. Accompanying tables ....................................................................................................................................... 14
8. Further information is available ........................................................................................................................ 16
9. National Statistics ............................................................................................................................................. 17
10. Technical Information ....................................................................................................................................... 17
11. Get in touch ...................................................................................................................................................... 17
Note on revised results
This release provides an update to the provisional figures published in October 2015 in SFR 38/2015. The revised figures incorporate the small proportion of amendments that awarding organisations, schools or colleges and local authorities submitted to the department after August 2015. A number of figures will have changed between the two releases; this is expected and occurs every year.
It is usual for student numbers to drop between the provisional and revised releases; for example, this year the number of level 3 students decreased from 416,676 to 404,100. In contrast, performance measures tend to improve but generally changes are not substantial and where relevant these have been highlighted. This is due to the combined effect of removals of students that should not be included and due to the outcomes of enquiries about results and the submission of late results by Awarding Organisations.
In this publication
The following excel files are published alongside the SFR text:
• national tables (excel .xls) • local authority tables (excel .xls)
• time series tables (excel .xls) • School location tables (excel .xls)
• School location tables (excel .xls) • Maths and sciences tables(excel .xls)
• local authority maps (pdf)
A full list of the tables include in these files is shown on page 14.
The accompanying quality and methodology information document, provides information on the data sources, their coverage and quality and explains the methodology used in producing the data.
Feedback
We are changing how our releases look and welcome feedback on any aspect of this document at [email protected]
Page 3 of 18
Introduction 1.
This statistical first release (SFR) shows results in level 3 qualifications for students aged 16-18 at the end
of advanced level study in 2014/15 as well as A and AS level examination results in a single academic
year. In addition, it reports results separately for three cohorts of students depending on the types of
qualifications taken: A level, academic and vocational. The range of qualifications reported in this SFR
covers all level 3 qualifications approved under Section 96 of the Learning and Skills Act (2000).
To be included in a cohort or overall level 3 results, a student must have been entered for at least one
substantial qualification (defined as at least the size of an A level, ie.180 guided learning hours per year) in
one or more of the qualification types listed below, in the reporting academic year (2014/15).
Since similar trends are seen in the A level and academic cohort (the overwhelming majority of academic
students take A level programmes), information for the A level and vocational cohorts only is shown here.
Data for the academic cohort can be found in table 1d and table S1.
A level: A level or applied A level.
Academic qualifications: includes A level or applied A level. In addition it includes Pre-U, International Baccalaureate, Advanced Extension Award (AEA), Free Standing Mathematics and Extended Project (Diploma) qualifications.
Vocational qualifications: includes all other regulated qualifications.
Level 3 participation 2.
Level 3 students There has been a continued rise in the total number of students completing advanced level study. In 2015,
404,100 students entered at least one substantial level 3 qualification and completed their studies, a rise of
1.0 per cent since last year and 6.4 per cent since 2010.
Figure 1: Level 3 students by cohort1
England, 2010 to 2015
Source: 16-18 attainment data
1. All the A level cohort figures shown in figure 1 are based on the methodology introduced in the 2013 performance tables. Therefore,
figures for earlier years may not match those shown in table 1b.
2. The potential 16-18 cohort is the number of students who completed key stage 4 two years previously.
Page 4 of 18
The proportion of the potential 16-18 cohort completing level 3 study has increased from 58.1 per cent in
2010 to 63.9 per cent (404,100 out of 632,676 students) in 2015. Until 2014, the rise in level 3 participation
was sustained by growth in the number of vocational students, whereas partcipation in A levels remained
relatively stable. This year, however, there has been an increase in the number of A level students by 3.4
per cent compared to 2014 and a small fall in the number of vocational students by 0.6 per cent.
Level 3 students by gender More female students participate in level 3 study than males. In 2015, 53.1 per cent of the level 3 cohort
were female, a ratio which has remain stable since 2010.
Considering participation in the A level cohort, female students are more likely to enter A level study than
males. In 2015, 55.5 per cent of the A level cohort were females, up from 54.0 per cent in 2010. In contrast,
about half of vocational students were females and this pattern has been relatively consistent since 2010.
Figure 2: Number of students by cohort and gender (Table 1d)
England, 2010 to 2015
Source: 16-18 attainment data
Attainment by cohort 3.
The department publishes attainment measures for the A level, academic and vocational cohorts of
students. These measures show the results that students achieved by the end of advanced level study.
They take into account any results achieved in both the final year of study and the year prior to this.
Performance measures across A level and vocational qualifications should not be compared since vocational students take fewer qualifications and there are differences in grading structures between qualification types.
A level cohort results To be included in the A level cohort a student needs to have been entered for at least one A level or
applied A level in the reporting year. The A level cohort covers A and AS level, and applied A and AS level
qualifications.
Average point score per entry
The average point score (APS) per entry is one of the main headline measures for the 16-18 performance
tables. From 2016 onwards, this will become the only APS measure as the department will no longer
publish any ‘per student’ measures. APS per entry gives an indication of the average result achieved per
Page 5 of 18
qualification taken and provides a comparison of achievement over time, regardless of the volume of
qualifications taken.
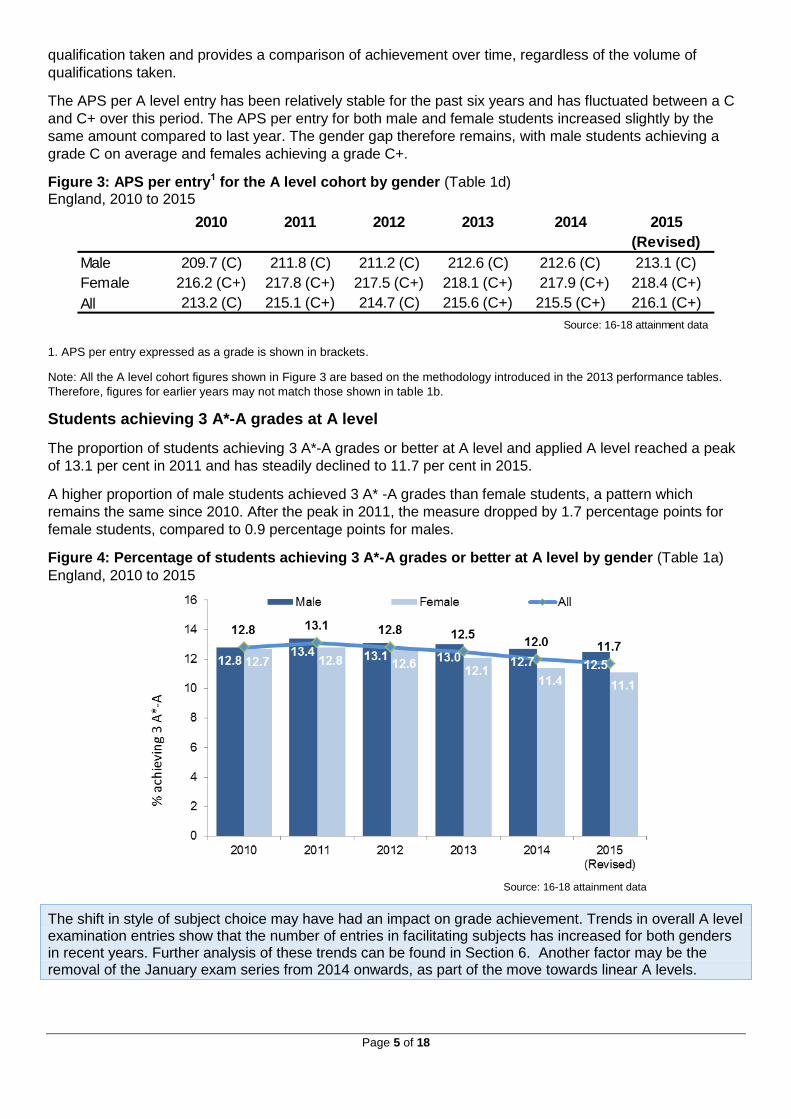
The APS per A level entry has been relatively stable for the past six years and has fluctuated between a C
and C+ over this period. The APS per entry for both male and female students increased slightly by the
same amount compared to last year. The gender gap therefore remains, with male students achieving a
grade C on average and females achieving a grade C+.
Figure 3: APS per entry1 for the A level cohort by gender (Table 1d) England, 2010 to 2015
1. APS per entry expressed as a grade is shown in brackets.
Note: All the A level cohort figures shown in Figure 3 are based on the methodology introduced in the 2013 performance tables.
Therefore, figures for earlier years may not match those shown in table 1b.
Students achieving 3 A*-A grades at A level
The proportion of students achieving 3 A*-A grades or better at A level and applied A level reached a peak
of 13.1 per cent in 2011 and has steadily declined to 11.7 per cent in 2015.
A higher proportion of male students achieved 3 A* -A grades than female students, a pattern which
remains the same since 2010. After the peak in 2011, the measure dropped by 1.7 percentage points for
female students, compared to 0.9 percentage points for males.
Figure 4: Percentage of students achieving 3 A*-A grades or better at A level by gender (Table 1a)
England, 2010 to 2015
Source: 16-18 attainment data
The shift in style of subject choice may have had an impact on grade achievement. Trends in overall A level examination entries show that the number of entries in facilitating subjects has increased for both genders in recent years. Further analysis of these trends can be found in Section 6. Another factor may be the removal of the January exam series from 2014 onwards, as part of the move towards linear A levels.
2010 2011 2012 2013 2014 2015
(Revised)
Male 209.7 (C) 211.8 (C) 211.2 (C) 212.6 (C) 212.6 (C) 213.1 (C)
Female 216.2 (C+) 217.8 (C+) 217.5 (C+) 218.1 (C+) 217.9 (C+) 218.4 (C+)
All 213.2 (C) 215.1 (C+) 214.7 (C) 215.6 (C+) 215.5 (C+) 216.1 (C+)
Source: 16-18 attainment data
Page 6 of 18
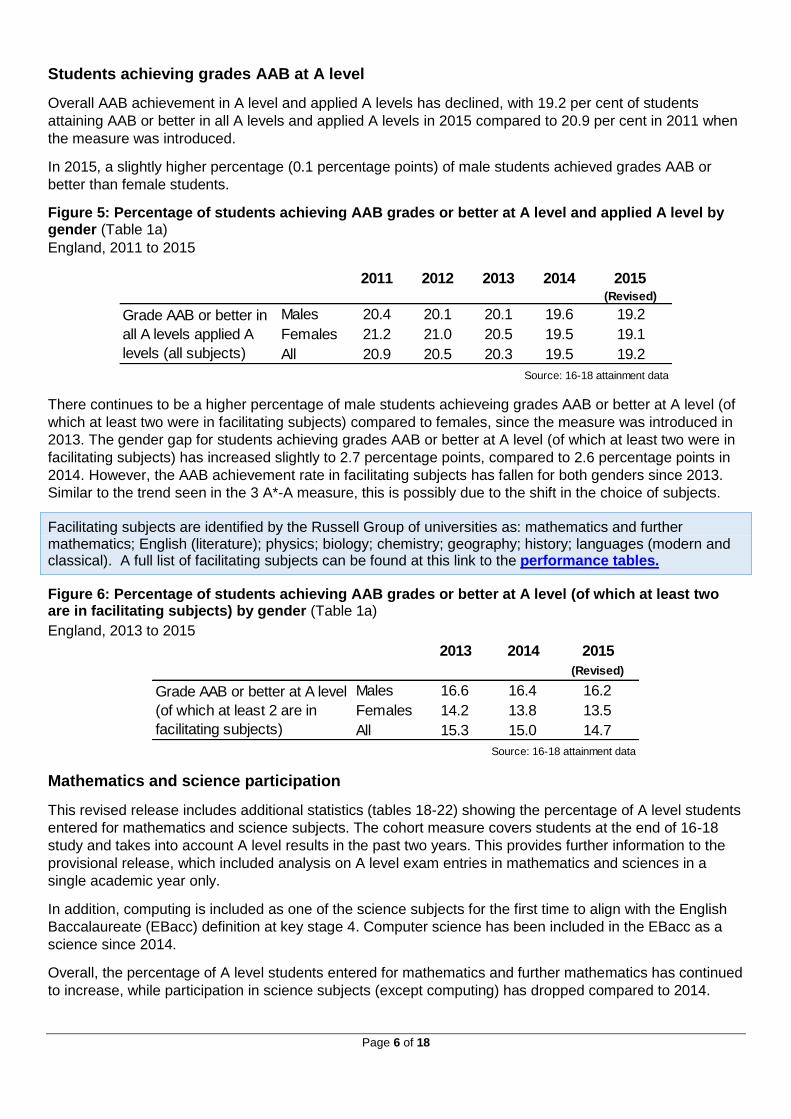
Students achieving grades AAB at A level
Overall AAB achievement in A level and applied A levels has declined, with 19.2 per cent of students
attaining AAB or better in all A levels and applied A levels in 2015 compared to 20.9 per cent in 2011 when
the measure was introduced.
In 2015, a slightly higher percentage (0.1 percentage points) of male students achieved grades AAB or
better than female students.
Figure 5: Percentage of students achieving AAB grades or better at A level and applied A level by gender (Table 1a)
England, 2011 to 2015
There continues to be a higher percentage of male students achieveing grades AAB or better at A level (of
which at least two were in facilitating subjects) compared to females, since the measure was introduced in
2013. The gender gap for students achieving grades AAB or better at A level (of which at least two were in
facilitating subjects) has increased slightly to 2.7 percentage points, compared to 2.6 percentage points in
2014. However, the AAB achievement rate in facilitating subjects has fallen for both genders since 2013.
Similar to the trend seen in the 3 A*-A measure, this is possibly due to the shift in the choice of subjects.
Facilitating subjects are identified by the Russell Group of universities as: mathematics and further mathematics; English (literature); physics; biology; chemistry; geography; history; languages (modern and classical). A full list of facilitating subjects can be found at this link to the performance tables.
Figure 6: Percentage of students achieving AAB grades or better at A level (of which at least two are in facilitating subjects) by gender (Table 1a)
England, 2013 to 2015
Mathematics and science participation
This revised release includes additional statistics (tables 18-22) showing the percentage of A level students
entered for mathematics and science subjects. The cohort measure covers students at the end of 16-18
study and takes into account A level results in the past two years. This provides further information to the
provisional release, which included analysis on A level exam entries in mathematics and sciences in a
single academic year only.
In addition, computing is included as one of the science subjects for the first time to align with the English
Baccalaureate (EBacc) definition at key stage 4. Computer science has been included in the EBacc as a
science since 2014.
Overall, the percentage of A level students entered for mathematics and further mathematics has continued
to increase, while participation in science subjects (except computing) has dropped compared to 2014.
2011 2012 2013 2014 2015(Revised)
Males 20.4 20.1 20.1 19.6 19.2
Females 21.2 21.0 20.5 19.5 19.1
All 20.9 20.5 20.3 19.5 19.2
Source: 16-18 attainment data
Grade AAB or better in
all A levels applied A
levels (all subjects)
2013 2014 2015
(Revised)
Males 16.6 16.4 16.2
Females 14.2 13.8 13.5
All 15.3 15.0 14.7
Source: 16-18 attainment data
Grade AAB or better at A level
(of which at least 2 are in
facilitating subjects)
Page 7 of 18
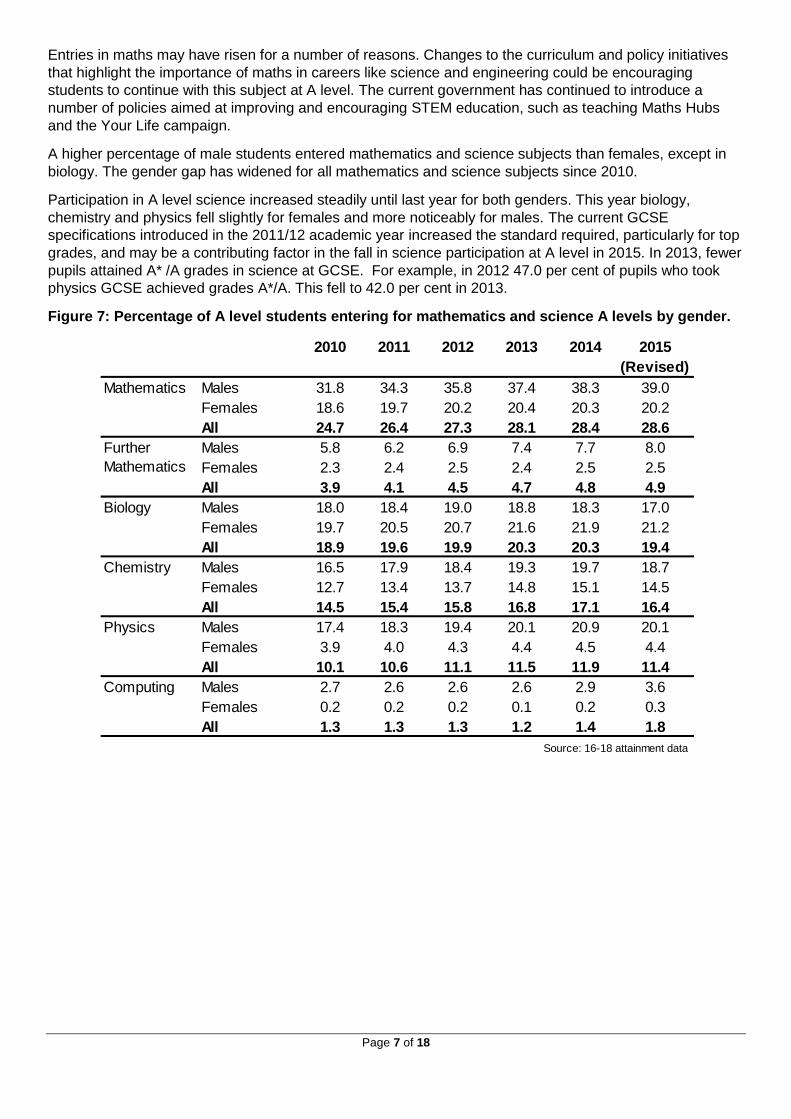
Entries in maths may have risen for a number of reasons. Changes to the curriculum and policy initiatives
that highlight the importance of maths in careers like science and engineering could be encouraging
students to continue with this subject at A level. The current government has continued to introduce a
number of policies aimed at improving and encouraging STEM education, such as teaching Maths Hubs
and the Your Life campaign.
A higher percentage of male students entered mathematics and science subjects than females, except in
biology. The gender gap has widened for all mathematics and science subjects since 2010.
Participation in A level science increased steadily until last year for both genders. This year biology,
chemistry and physics fell slightly for females and more noticeably for males. The current GCSE
specifications introduced in the 2011/12 academic year increased the standard required, particularly for top
grades, and may be a contributing factor in the fall in science participation at A level in 2015. In 2013, fewer
pupils attained A* /A grades in science at GCSE. For example, in 2012 47.0 per cent of pupils who took
physics GCSE achieved grades A*/A. This fell to 42.0 per cent in 2013.
Figure 7: Percentage of A level students entering for mathematics and science A levels by gender.
2010 2011 2012 2013 2014 2015
(Revised)
Mathematics Males 31.8 34.3 35.8 37.4 38.3 39.0
Females 18.6 19.7 20.2 20.4 20.3 20.2
All 24.7 26.4 27.3 28.1 28.4 28.6
Males 5.8 6.2 6.9 7.4 7.7 8.0
Females 2.3 2.4 2.5 2.4 2.5 2.5
All 3.9 4.1 4.5 4.7 4.8 4.9
Biology Males 18.0 18.4 19.0 18.8 18.3 17.0
Females 19.7 20.5 20.7 21.6 21.9 21.2
All 18.9 19.6 19.9 20.3 20.3 19.4
Chemistry Males 16.5 17.9 18.4 19.3 19.7 18.7
Females 12.7 13.4 13.7 14.8 15.1 14.5
All 14.5 15.4 15.8 16.8 17.1 16.4
Physics Males 17.4 18.3 19.4 20.1 20.9 20.1
Females 3.9 4.0 4.3 4.4 4.5 4.4
All 10.1 10.6 11.1 11.5 11.9 11.4
Computing Males 2.7 2.6 2.6 2.6 2.9 3.6
Females 0.2 0.2 0.2 0.1 0.2 0.3
All 1.3 1.3 1.3 1.2 1.4 1.8
Source: 16-18 attainment data
Further
Mathematics
Page 8 of 18
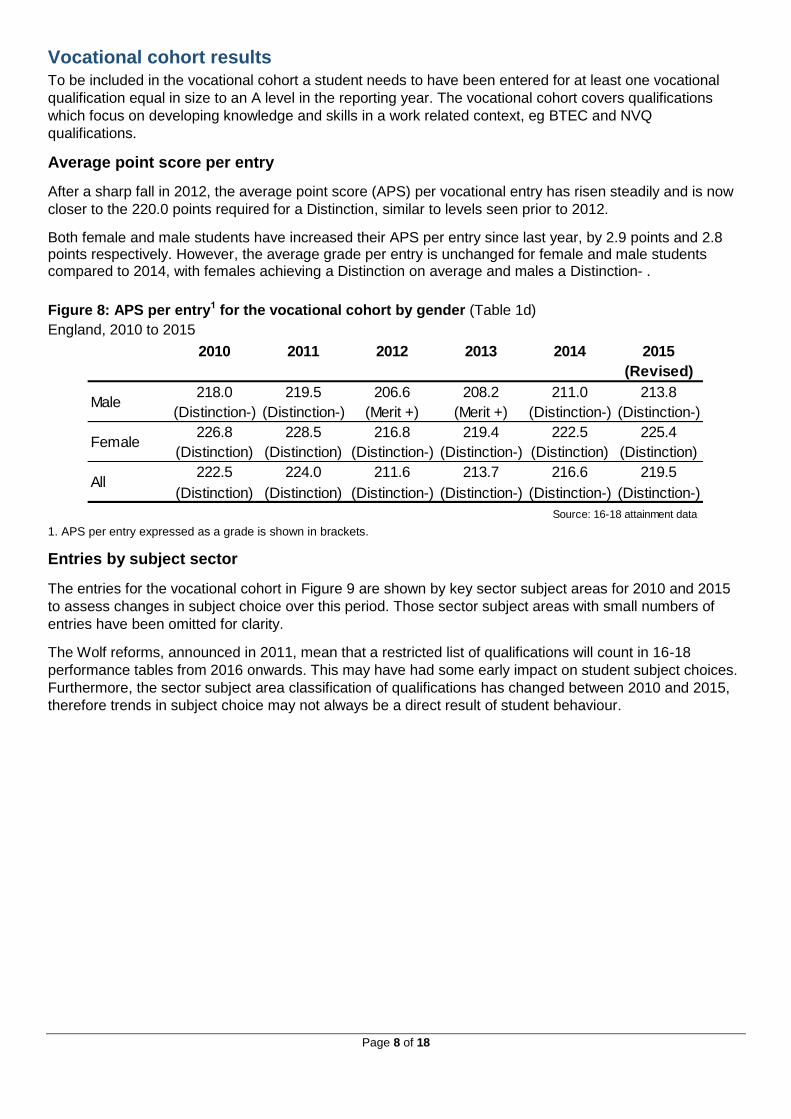
Vocational cohort results To be included in the vocational cohort a student needs to have been entered for at least one vocational
qualification equal in size to an A level in the reporting year. The vocational cohort covers qualifications
which focus on developing knowledge and skills in a work related context, eg BTEC and NVQ
qualifications.
Average point score per entry
After a sharp fall in 2012, the average point score (APS) per vocational entry has risen steadily and is now
closer to the 220.0 points required for a Distinction, similar to levels seen prior to 2012.
Both female and male students have increased their APS per entry since last year, by 2.9 points and 2.8 points respectively. However, the average grade per entry is unchanged for female and male students compared to 2014, with females achieving a Distinction on average and males a Distinction- .
Figure 8: APS per entry1 for the vocational cohort by gender (Table 1d)
England, 2010 to 2015
1. APS per entry expressed as a grade is shown in brackets.
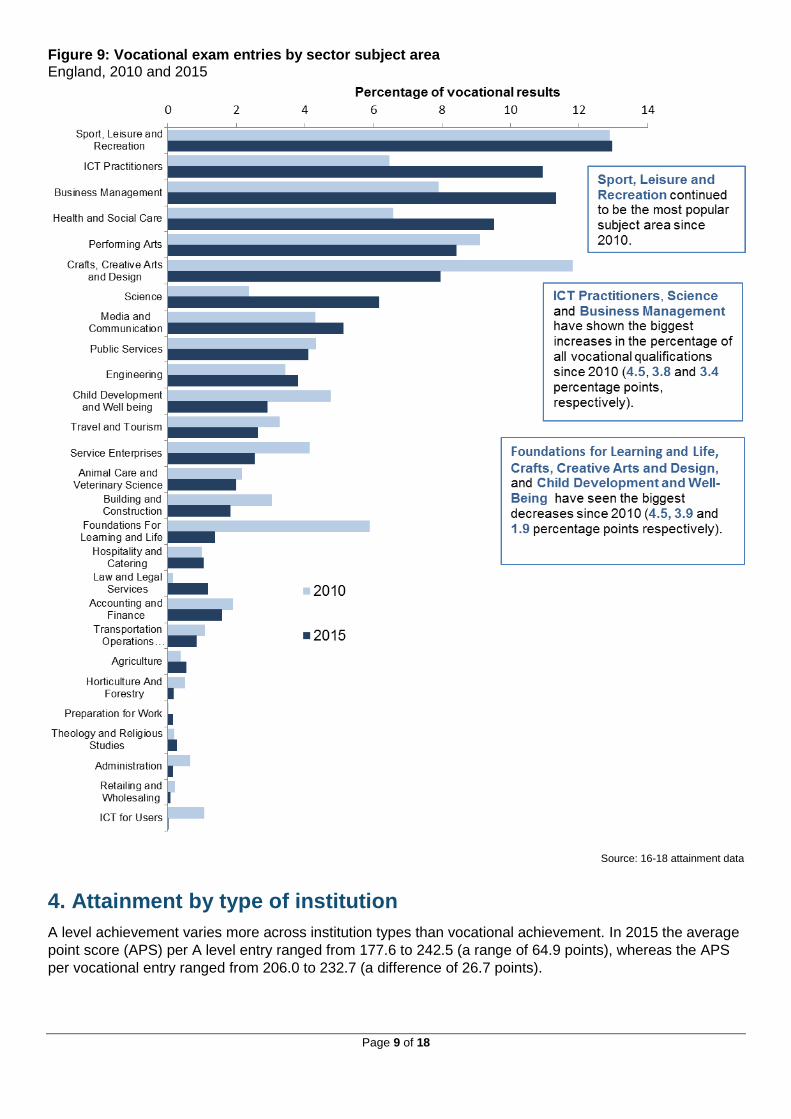
Entries by subject sector
The entries for the vocational cohort in Figure 9 are shown by key sector subject areas for 2010 and 2015
to assess changes in subject choice over this period. Those sector subject areas with small numbers of
entries have been omitted for clarity.
The Wolf reforms, announced in 2011, mean that a restricted list of qualifications will count in 16-18
performance tables from 2016 onwards. This may have had some early impact on student subject choices.
Furthermore, the sector subject area classification of qualifications has changed between 2010 and 2015,
therefore trends in subject choice may not always be a direct result of student behaviour.
2010 2011 2012 2013 2014 2015
(Revised)
218.0 219.5 206.6 208.2 211.0 213.8
(Distinction-) (Distinction-) (Merit +) (Merit +) (Distinction-) (Distinction-)
226.8 228.5 216.8 219.4 222.5 225.4
(Distinction) (Distinction) (Distinction-) (Distinction-) (Distinction) (Distinction)
222.5 224.0 211.6 213.7 216.6 219.5
(Distinction) (Distinction) (Distinction-) (Distinction-) (Distinction-) (Distinction-)
Source: 16-18 attainment data
Female
All
Male
Page 9 of 18
Figure 9: Vocational exam entries by sector subject area England, 2010 and 2015
Source: 16-18 attainment data
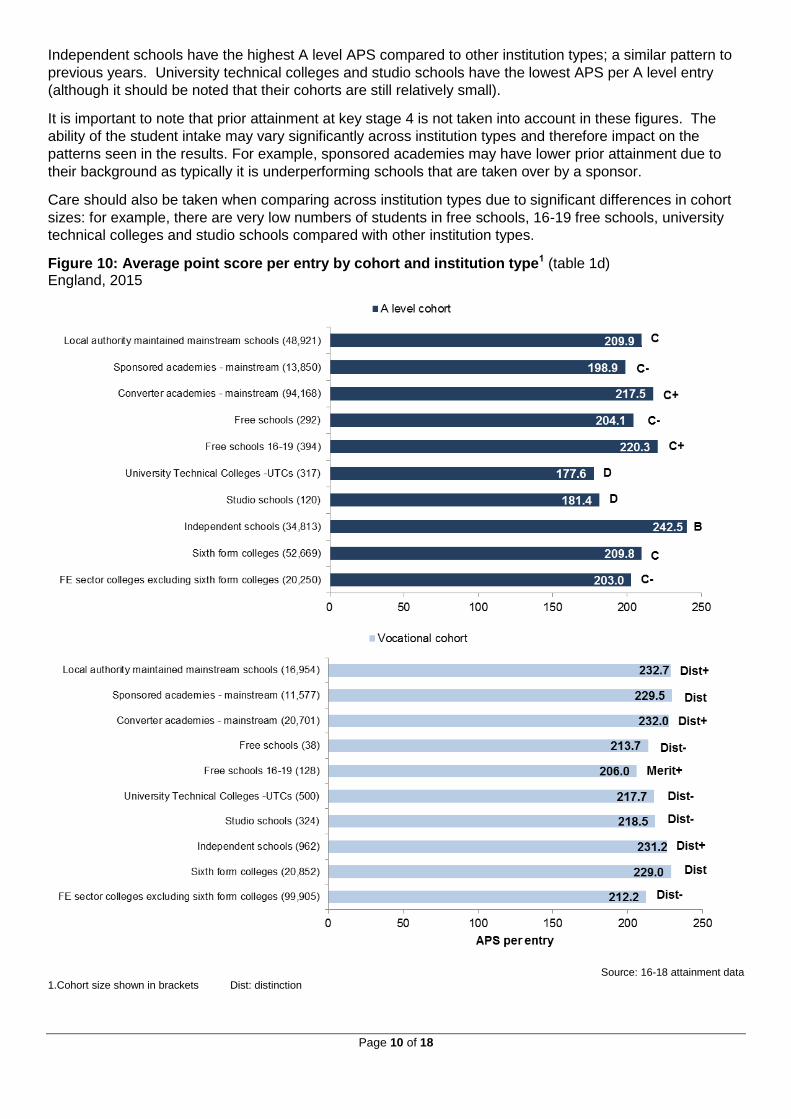
Attainment by type of institution 4.
A level achievement varies more across institution types than vocational achievement. In 2015 the average
point score (APS) per A level entry ranged from 177.6 to 242.5 (a range of 64.9 points), whereas the APS
per vocational entry ranged from 206.0 to 232.7 (a difference of 26.7 points).
Page 10 of 18
Independent schools have the highest A level APS compared to other institution types; a similar pattern to
previous years. University technical colleges and studio schools have the lowest APS per A level entry
(although it should be noted that their cohorts are still relatively small).
It is important to note that prior attainment at key stage 4 is not taken into account in these figures. The
ability of the student intake may vary significantly across institution types and therefore impact on the
patterns seen in the results. For example, sponsored academies may have lower prior attainment due to
their background as typically it is underperforming schools that are taken over by a sponsor.
Care should also be taken when comparing across institution types due to significant differences in cohort
sizes: for example, there are very low numbers of students in free schools, 16-19 free schools, university
technical colleges and studio schools compared with other institution types.
Figure 10: Average point score per entry by cohort and institution type1 (table 1d) England, 2015
Source: 16-18 attainment data
1.Cohort size shown in brackets Dist: distinction
Page 11 of 18
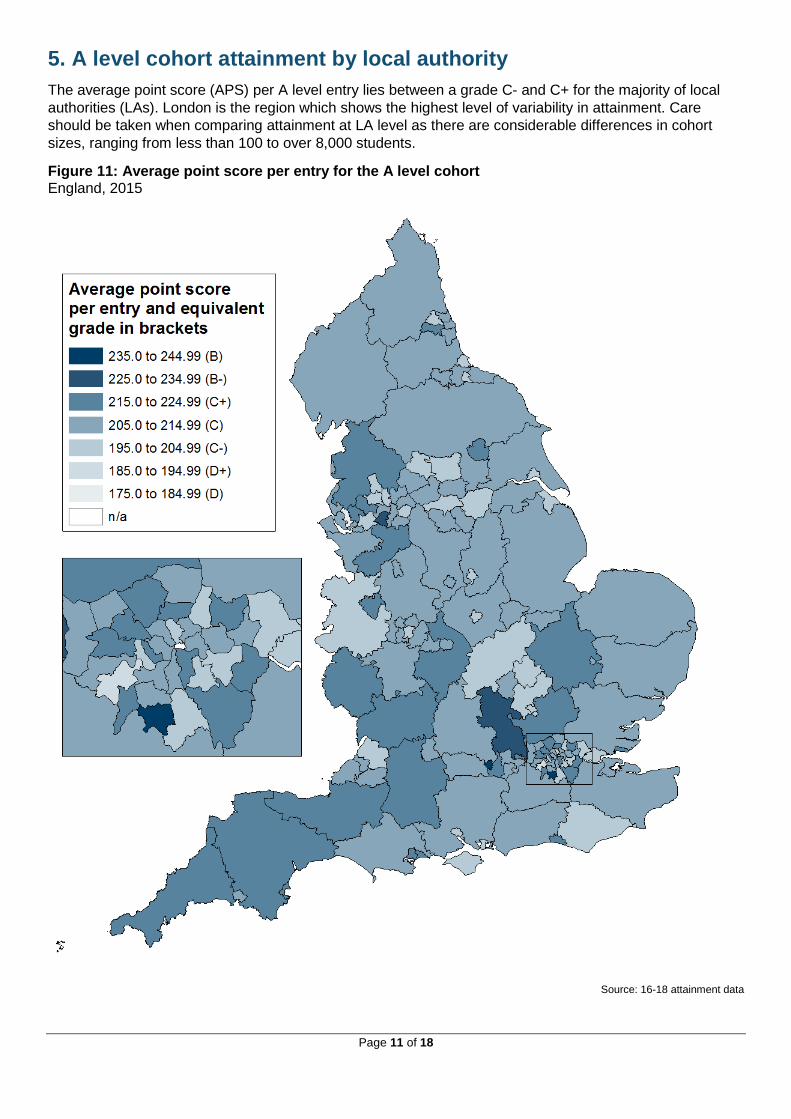
A level cohort attainment by local authority 5.
The average point score (APS) per A level entry lies between a grade C- and C+ for the majority of local
authorities (LAs). London is the region which shows the highest level of variability in attainment. Care
should be taken when comparing attainment at LA level as there are considerable differences in cohort
sizes, ranging from less than 100 to over 8,000 students.
Figure 11: Average point score per entry for the A level cohort England, 2015
Source: 16-18 attainment data
Page 12 of 18
A level examination results within a single academic year 6.
The A level cohort performance measures shown in sections 2 to 5 are based on the results for students at
the end of their 16-18 study. They include qualifications taken in both the final year of study and the year
prior to this. In contrast, all the data in this section, which is only available in this SFR release, is based on
all A level (excludes applied single and double award A level) results in a single academic year only.
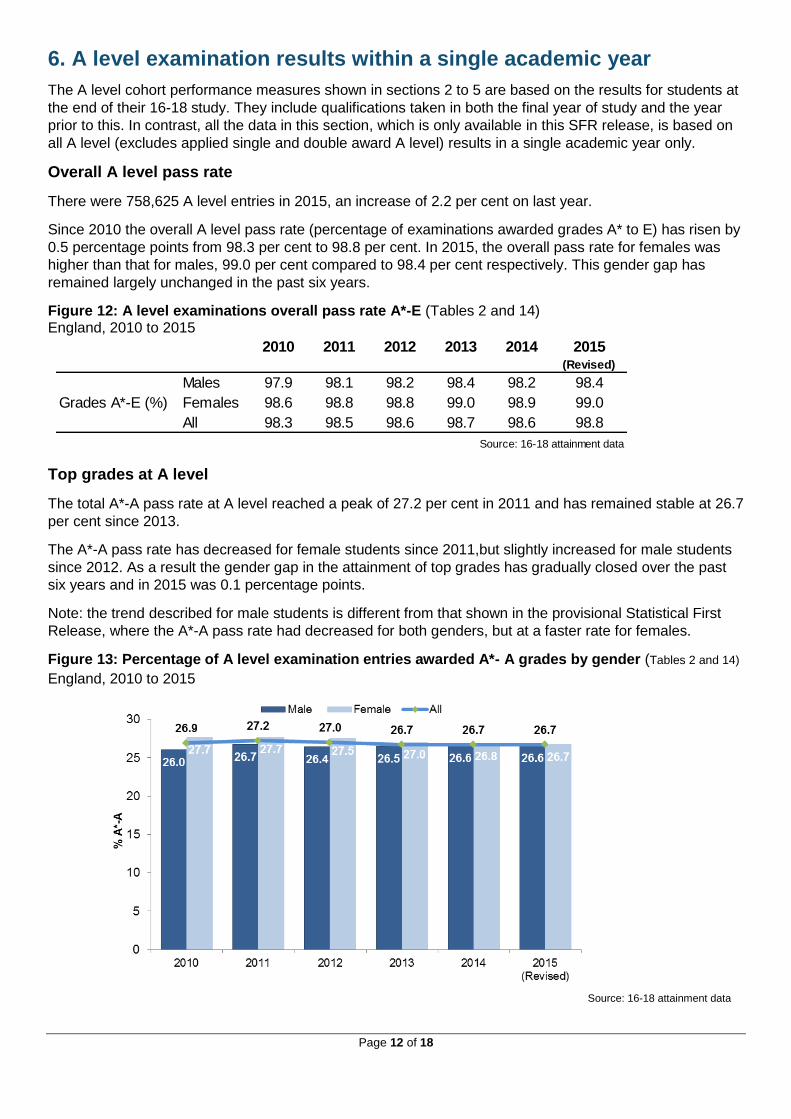
Overall A level pass rate
There were 758,625 A level entries in 2015, an increase of 2.2 per cent on last year.
Since 2010 the overall A level pass rate (percentage of examinations awarded grades A* to E) has risen by
0.5 percentage points from 98.3 per cent to 98.8 per cent. In 2015, the overall pass rate for females was
higher than that for males, 99.0 per cent compared to 98.4 per cent respectively. This gender gap has
remained largely unchanged in the past six years.
Figure 12: A level examinations overall pass rate A*-E (Tables 2 and 14) England, 2010 to 2015
Top grades at A level
The total A*-A pass rate at A level reached a peak of 27.2 per cent in 2011 and has remained stable at 26.7
per cent since 2013.
The A*-A pass rate has decreased for female students since 2011,but slightly increased for male students
since 2012. As a result the gender gap in the attainment of top grades has gradually closed over the past
six years and in 2015 was 0.1 percentage points.
Note: the trend described for male students is different from that shown in the provisional Statistical First
Release, where the A*-A pass rate had decreased for both genders, but at a faster rate for females.
Figure 13: Percentage of A level examination entries awarded A*- A grades by gender (Tables 2 and 14)
England, 2010 to 2015
Source: 16-18 attainment data
2010 2011 2012 2013 2014 2015(Revised)
Males 97.9 98.1 98.2 98.4 98.2 98.4
Grades A*-E (%) Females 98.6 98.8 98.8 99.0 98.9 99.0
All 98.3 98.5 98.6 98.7 98.6 98.8
Source: 16-18 attainment data
Page 13 of 18
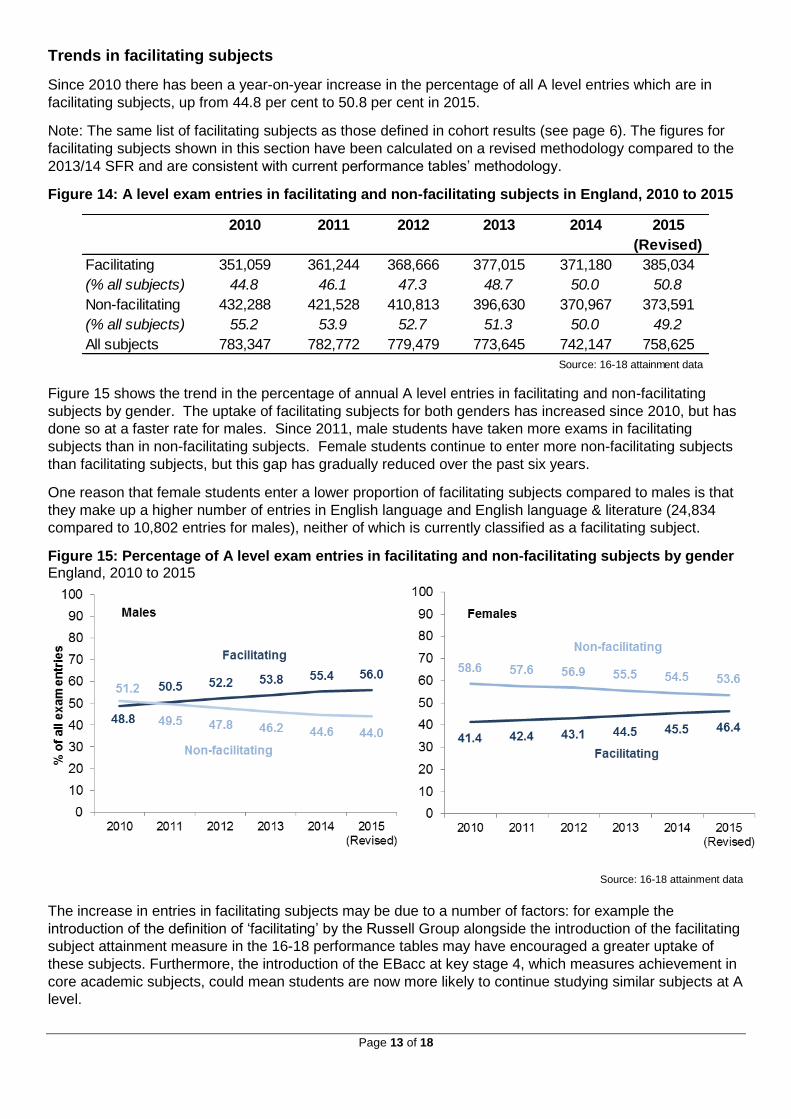
Trends in facilitating subjects
Since 2010 there has been a year-on-year increase in the percentage of all A level entries which are in
facilitating subjects, up from 44.8 per cent to 50.8 per cent in 2015.
Note: The same list of facilitating subjects as those defined in cohort results (see page 6). The figures for
facilitating subjects shown in this section have been calculated on a revised methodology compared to the
2013/14 SFR and are consistent with current performance tables’ methodology.
Figure 14: A level exam entries in facilitating and non-facilitating subjects in England, 2010 to 2015
Figure 15 shows the trend in the percentage of annual A level entries in facilitating and non-facilitating
subjects by gender. The uptake of facilitating subjects for both genders has increased since 2010, but has
done so at a faster rate for males. Since 2011, male students have taken more exams in facilitating
subjects than in non-facilitating subjects. Female students continue to enter more non-facilitating subjects
than facilitating subjects, but this gap has gradually reduced over the past six years.
One reason that female students enter a lower proportion of facilitating subjects compared to males is that
they make up a higher number of entries in English language and English language & literature (24,834
compared to 10,802 entries for males), neither of which is currently classified as a facilitating subject.
Figure 15: Percentage of A level exam entries in facilitating and non-facilitating subjects by gender England, 2010 to 2015
Source: 16-18 attainment data
The increase in entries in facilitating subjects may be due to a number of factors: for example the
introduction of the definition of ‘facilitating’ by the Russell Group alongside the introduction of the facilitating
subject attainment measure in the 16-18 performance tables may have encouraged a greater uptake of
these subjects. Furthermore, the introduction of the EBacc at key stage 4, which measures achievement in
core academic subjects, could mean students are now more likely to continue studying similar subjects at A
level.
2010 2011 2012 2013 2014 2015
(Revised)
Facilitating 351,059 361,244 368,666 377,015 371,180 385,034
(% all subjects) 44.8 46.1 47.3 48.7 50.0 50.8
Non-facilitating 432,288 421,528 410,813 396,630 370,967 373,591
(% all subjects) 55.2 53.9 52.7 51.3 50.0 49.2
All subjects 783,347 782,772 779,479 773,645 742,147 758,625
Source: 16-18 attainment data
Page 14 of 18
Accompanying tables 7.
The following tables are available in Excel format on the department’s statistics website.
National tables:
Student level results
1a A level and level 3 results by institution type and gender
1b Time series of A level and level 3 results by gender
1c A level and level 3 results of state-funded school students by admissions basis and gender
1d Level 3 results by cohort, institution type and gender
A level examination results
2 A level results of all students by subject and grade
2m A level results of male students by subject and grade
2f A level results of female students by subject and grade
AS level examination results
3 AS level results of all students by subject and grade
3m AS level results of male students by subject and grade
3f AS level results of female students by subject and grade
4 Discounted AS level results of all students by subject and grade
4m Discounted AS level results of male students by subject and grade
4f Discounted AS level results of female students by subject and grade
Applied A/AS level examination results
5 Applied single A level results by gender, subject and grade
6 Applied single AS level results by gender, subject and grade
7 Applied double A level results by gender, subject and grade
8 Applied double AS level results by gender, subject and grade
A level examination results by institution type
9 A level results of students by institution type, gender and grade
10 A level results of state-funded school students by admission basis, gender and grade
11a A level results of state-funded school students by subject and grade
11b A level results of independent school students by subject and grade
11c A level results of all further education sector college students by subject and grade
11d A level results of sixth form college students by subject and grade
Local authority tables
12a A level and level 3 results of state-funded students by gender, local authority and region
12b A level and level results of state-funded school students by gender, local authority and region
12c Average point score per exam entry of state-funded2 students by cohort, gender, local authority and region
12d Average point score per exam entry of state-funded school2 students by cohort, gender, local authority and region
13a Number of A level examination entries by state-funded students by subject, local authority and region
13b Number of A level A* and A grades achieved by state-funded students by subject, local authority and region
13c Number of A level A* to E grades achieved by state-funded students by subject, local authority and region
Subject time series
14 A level results by subject, grade and gender
15 AS level results by subject, grade and gender
16 A level and level 3 results by degree of rurality of school or college location and region
17 A level and level 3 results by local authority district of school or college location and region
Page 15 of 18
Mathematics and sciences tables
18 Students entered for mathematics and science A level subjects by gender and institution
19 State-funded students entered for mathematics and science A level subjects by gender, local authority and region
20 Time series of students entered for mathematics and science A level subjects by gender
21 Time series of students entered for mathematics and science A level subjects by number of subjects and gender
22 Number of A level students by subject combination for science and maths and gender
Supplementary
S1 Average point score per entry for A level, academic and vocational cohorts
Maps (pdf format)
Average point score per entry for the A level cohort
Average point score per entry for the vocational
cohort
When reviewing the tables, please note that:
The criteria we use to
include students
(tables 1a-d, 12a-b)
Students will be included if they meet the following criteria:
1. Were aged 16, 17 or 18 on 31 August 2014
2. Were on roll in January 2015
3. Were in, or deemed to be in, Year 13
4. Completed their advanced studies in the 2014/15 academic year
5. Entered for at least one substantial level 3 qualification in the
2014/15 academic year
Approved qualifications only The range of qualifications reported in this SFR covers all level 3 qualifications approved under Section 96 of the Learning and Skills Act (2000).
Approved qualifications at level 3 and their point scores can be found at Ofqual Register website
How we avoid double
counting subjects
To avoid double counting results, qualification discounting is applied
where, for example, if a student achieves an AS en route to achieving an
A level in the same subject, only the A level pass is included.
We preserve confidentiality The Code of Practice for Official Statistics requires us to take reasonable
steps to ensure that our published or disseminated statistics protect
confidentiality.
The Department has a set of statistical policies in line with the Code of
Practice for Official Statistics: Standards for official statistics published by
the Department for Education
so we suppress some
figures,
Any numbers less than three (1 to 2 inclusive) have been suppressed and
have been replaced by an ‘x’. An ‘x’ has also been used where secondary
suppression has been applied.
Percentages have been shown to one decimal place but where the
numerator is between 1 and 2 inclusive, they have been suppressed.
Where a number is shown as zero (0), the original figure submitted was
zero.
Page 16 of 18
adopt symbols to help
identify this
Symbols are used in the tables as follows:
. not applicable
x publication of that figure would be disclosive
and round percentages Percentages in this SFR are given to one decimal place. Totals may not
add to 100% due to rounding.
Further information is available 8.
Performance tables Data for institutions can be seen within the school and college
performance tables. The 16-18 performance tables will be updated with
2014/15 data in January 2016.
Key stage 4 GCSE and equivalent results for key stage 4 can be found at GOV.UK -
Statistics: GCSEs (key stage 4).
Key stage 2 Statistics on national curriculum assessments and review outcomes at key
stage 2 (KS2), including measures of progress between KS1 and KS2,
can be found at GOV.UK - Statistics: key stage 2.
Key stage 1 Statistics on national curriculum assessments at key stage 1 and phonics
screening check results can be found at GOV.UK - Statistics: key stage 1
Destination measures Statistics on educational or employment destinations of key stage 4 and
key stage 5 students can be found at GOV.UK - Statistics: destinations of
key stage 4 and key stage 5 pupils.
Level 2 and 3 attainment at
16-18
Statistics on the attainment of young people aged 19, based on matched
administrative data can be found at GOV.UK – attainment at 19 years.
Level 1 and 2 attainment in
English and maths at 16-18
Experimental statistics on level 1 and 2 English and maths by students
aged 16 to 18 who failed to achieve A* to C by the end of key stage 4 can
be found at GOV.UK - attainment at 19 years.
Results for the rest of the UK The Welsh Assembly has published the results of external examinations taken by pupils aged 15 or 17 in 2014/15, available at: Welsh assembly statistics and research
The Department for Education Northern Ireland (DENI) have published AS and A level headline statistics for 2014, available at: Department for Education Northern Ireland (DENI)
The publication ‘Summary statistics for attainment, leaver destinations and healthy living, No. 5: 2015 Edition’ is published by the Scottish Government and is available at: The Scottish Government website
Future changes The 2016 performance tables will further disaggregate the level 3 vocational cohort into students taking approved applied general and tech level qualifications. This is to reflect the differing content, assessment and grading arrangements within these qualifications. The scope of this SFR will
Page 17 of 18
be reviewed as the coverage of performance tables expands (as announced in the government’s response to the 16-19 accountability consultation).
The approved qualifications can be found here: Vocational qualifications for 14- to 19-year-olds
For more information on the upcoming reforms to the performance tables, please see the 16 to 19 accountability headline measures: technical guide.
National Statistics 9.
The United Kingdom Statistics Authority has designated these statistics as National Statistics, in
accordance with the Statistics and Registration Service Act 2007 and signifying compliance with the Code
of Practice for Official Statistics.
Designation can be broadly interpreted to mean that the statistics:
meet identified user needs;
are well explained and readily accessible;
are produced according to sound methods, and
are managed impartially and objectively in the public interest.
Once statistics have been designated as National Statistics it is a statutory requirement that the Code of
Practice shall continue to be observed.
The Department has a set of statistical policies in line with the Code of Practice for Official Statistics.
Technical Information 10.
A quality and methodology information document accompanies this SFR. This provides further information
on the data sources, their coverage and quality, and explains the methodology used in producing the data,
including how it is validated and processed.
Get in touch 11.
Media enquiries
Press Office News Desk, Department for Education, Sanctuary Buildings, Great Smith Street, London
SW1P 3BT.
Tel: 020 7783 8300
Other enquiries/feedback
Tingting Shu, Education Data Division, Department for Education, 53-55 Butts Road, Coventry, CV1 3BH
Tel: 020 7340 7712 Email: [email protected]
© Crown copyright 2016
This publication (not including logos) is licensed under the terms of the
Open Government Licence v3.0 except where otherwise stated. Where
we have identified any third party copyright information you will need to
obtain permission from the copyright holders concerned.
To view this licence:
visit www.nationalarchives.gov.uk/doc/open-government-licence/version/3
email [email protected]
write to Information Policy Team, The National Archives, Kew, London, TW9 4DU
About this publication:
enquiries Tingting Shu, Education Data Division, Department for Education,
53-55 Butts Road, Coventry, CV1 3BH
Tel: 020 7340 7712 Email: [email protected]
download Statistics: 16 to 19 attainment
Reference: SFR 03/2016
Follow us on Twitter: @educationgovuk
Like us on Facebook: facebook.com/educationgovuk