Embed Size (px)
Citation preview
A LONGITUDINAL STUDY OFTHE GROWTH AND DEVELOPMENT OF
PREMATURELY AND MATURELY BORN CHILDRENPART VII: MENTAL DEVELOPMENT 2-5 YEARS
BY
CECIL MARY DRILLIENFrom the Department of Child Life and Health, University of Edinburgh
(RECEIVED FOR PUBLICATION AUGUST 17, 1960)
This paper describes the mental developmentbetween the ages of 2 and 4 years of singletons andtwins of different birth weight. The children, whowere born in the years 1953 to 1955, are included ina longitudinal study of growth and development,now in its seventh year. Details of selection andprocedure are given elsewhere (Drillien, 1958). Ofthe 600 children originally enrolled, 92% of sur-viving children remained in the survey at 3 years,and 90% at 4 years. The children have beenexamined at home at six-monthly intervals up to theage of 2, and yearly thereafter. Children whoappeared to be retarded at 2 years, or who havea physical defect affecting development, have beenseen every six months up to 4 years. Others whowere uncooperative in mental testing at 3 or 4 yearswere re-examined six months later.
MethodMental Testing Employed. A selection of tests based
on the Gesell scale (Gesell and Amatruda, 1941; Gesell,1940) with some items from the Terman-Merrill L formscale (Terman and Merrill, 1937) have been used. Inaddition, a full developmental history has been takenfrom the mother at each visit.
In selecting or rejecting certain standard test items,it was necessary not only to consider which tests wereacceptable to the child and easily applied in the home,but also which tests were acceptable to the mother. Thecontinued co-operation of the mother was thoughtto be of more importance than the application of a fullstandard scale, in cases where she appeared to resenta too obvious probing into her child's ability. Forthis reason it was considered diplomatic to avoid testswhere absolute failure was evident to the mother (e.g.digit and sentence repetition, picture and object memory)and utilize those tests where some degree of success wasto be expected, and where a qualitative as well as aquantitative assessment could be made. The develop-mental age was assessed not only on test response, but
also on the mother's history, and on observation of thechild's behaviour and speech throughout the interview.In assessing verbal responses and the history of speechand social development allowance was made for thetype of home, amount of opportunity, and the type ofspeech which the child heard at home.For statistical purposes the estimated D.Q. (Develop-
mental Quotient) has been recorded as an exact number,but it is considered that pre-school testing can do nomore than allot the child to certain broad groups, withsome inevitable overlapping between groups, as follows:
(1) D.Q. <60 = gross defect.(2) 60-69 = mental retardation: ineducable in normal
school.(3) 70-79 border-line defect.(4) 80-89 dull.(5) 90-99 = low average.(6) 100-109 = average or good average.(7) 110 and over = superior.A brief description of points elicited in taking the
history and tests used at 3 and 4 years is given below,with responses expected for the child of average ability.Retarded children were tested at a lower level, as des-cribed in a previous paper (Drillien, 1959). It was notpossible to test children of superior intelligence throughthe full range of their ability, except in a few cases wherethe mother was sufficiently interested to allow the testto be done alone with the child.
History*(1) Locomotion. At 3 years the child is reported to
run well without stumbling, pedal and steer a tricycle,jump on both feet off a low step, and walk up and downstairs independently. He usually walks up alternatingfeet to consecutive treads, and down bringing bothfeet to the same tread and holding on to the wall or rail.At 4 years he runs up and down stairs alternating feet,and will jump the last two or three steps.
* As expected for a child of average ability.
233
copyright. on M
arch 24, 2022 by guest. Protected by
http://adc.bmj.com
/A
rch Dis C
hild: first published as 10.1136/adc.36.187.233 on 1 June 1961. Dow
nloaded from

ARCHIVES OF DISEASE IN CHILDHOOD
(2) Speech. At 3 years he is reported as speaking inshort complete sentences, with only minor defects ofconstruction (e.g. 'me' for 'I'). Pronunciation may notbe perfect, but the child is comprehensible to strangers.With some prompting at beginnings of lines he canrepeat a few rhymes, songs or commercials from thetelevision. By 4 years he is able to use quite long, wellconstructed sentences, and repeats rhymes with little help.
(3) SocialFeeding. At 3 years the child feeds himself with
little spilling, using a spoon and fork. He holds hiscup by the handle, and pours from a jug. At 4 years,if allowed, he can use a knife.
Dressing. At 3 years he pulls off shoes, socks, andpants, undoes accessible buttons, and can put on shoes(not always on the correct feet). At 4 years he can dressand undress with little assistance, can fasten buttons andbuckle his shoes.
Toilet. By 3 years he is reliable by day, and will go
to the toilet alone, but still needs help with wiping, andadjusting clothes. He is usually dry at night withoutlifting by 3j years, and at 4 years will take full respon-sibility for his toilet needs.
Testing Procedure(1) Speech
(a) 18 coloured pictures of common objects: at3 years he names 12+, and at 4 years 16+.
(b) Six action pictures (e.g. a boy throwing a ball,a girl pouring tea): in answer to the question 'what isthe boy doing?' the 3-year-old will give some indicationof action in three or more pictures (e.g. 'playing','getting tea') and names objects freely. At 4 yearsactions are described for five or six at a more advancedlevel (e.g. 'he's throwing the ball up in the sky', 'she'spouring tea for her dollies').
(c) Comprehension questions: uses of five commonobjects (penny, matches, spoon, ball, pencil). In answerto the question 'what do we use this for?' the 3-year-oldresponds to 3 + at a simple level (e.g. 'sweeties', 'smokeit') and the 4-year-old to all five, at a more advancedlevel (e.g. 'to buy a lollipop', 'light the gas'). In answerto the questions 'what must you do when you are hungry?tired? cold?' the average 4-year-old will respond cor-rectly to at least two, and to the questions 'why dowe have books? houses ?' to at least one.
(2) Adaptive(a) Block building: he will build a tower of nine
to 10 at 3 years. A bridge is imitated at 3 + years, andcopied from a model at 4 years. Blocks are also usedfor colour and counting.
(b) Drawing: most 3-year-olds will hold the pencilcorrectly. At this age they can copy a circle and imitatea cross. At 4 the child will copy a cross, may attempta square, and score 1+ on the incomplete man test.
(c) Colour forms: a score of 3+ is expected at3 years; a demonstration of the circle may be needed.
(d) Geometric forms: the 4-year-old scores 8+.
Correlation between Pre-school Testing andIntelligence Testing in School
A full analysis of the predictive value of earlydevelopmental testing in children of different birthweight from different types of home will be carriedout when the necessary data have been obtained forthe whole group. It is also hoped to relate schoolperformance to observed pre-school and early schoolability in children from different types of environ-ment. However, it was thought useful to examinebriefly here the findings in those children born in1953 and 1954 who have already been tested inschool.To date 206 children who were adequately tested
at 3 and/or 4 years have been given the Terman-Merrill L form test. The biggest disparity in scoreswas found in 18 cases who were considered superior(i.e. D.Q. 110 to 120) at 3 to 4 years, and scored125 to 140 on the T.M.L. test. After excludingthese cases, 68% of the remainder showed a dis-parity of eight points or less between the averageof the 3 and 4 year tests and the T.M.L. test (Table 1).In all, 60 children showed a disparity of more thaneight points. Of these, 33 stayed in the same broadgrouping or moved up or down one group, therebeing no change in expected school disposal. Inthese cases the difference in scores was betweennine and 14 points. Twenty-seven children (13%)showed a disparity of 15 points or more. Sevenchildren scored higher in the pre-school period;of these, six are under supervision at a child guidanceclinic for behaviour problems in school, and theseventh suffered a major domestic upheaval shortlybefore school entrance. It seems likely that theT.M.L. score is an underestimate in these cases.Twenty children scored 15 points or more lower at3 to 4 years. Of these, five had suffered markeddeprivation in the pre-school period (e.g. death ordesertion of the mother, gross neglect, or attendancein a day or residential nursery since birth). Fiveshowed slow development in speech, and weresaying practically nothing at 3 years, althoughaverage in other respects, or had speech defectsrendering them incomprehensible at 4 years. One
TABLE 1DIFFERENCE BETWEEN AVERAGE OF D.Q. SCORES AT3 AND 4 YEARS AND T.M.L. SCORE AT 5 PLUS YEARS
Points No. of CumulativeDifference Cases %
0- 4 78 41 415- 8 50 27 689-12 22 12 8013-16 20 11 9017-20 11 6 9621 and over 7 4 100
234copyright.
on March 24, 2022 by guest. P
rotected byhttp://adc.bm
j.com/
Arch D
is Child: first published as 10.1136/adc.36.187.233 on 1 June 1961. D
ownloaded from

GROWTH AND DEVELOPMENT OFPREMATURE AND MATURE CHILDREN 235
small premature from a good home showed steadyimprovement from 6 months. Her scores at1, 2, 4, and 5½ years were 61, 94, 100, and 120respectively. Seven children (3 4%) who weretested adequately at 3 and 4 years, and appearedto be definitely slow, in the absence of unfavourableenvironmental influences which might affect develop-ment, were considered to be average or good averagein school.
Correlation coefficients between pre-school testsat different ages and T.M.L. testing in school aregiven in Table 2. Considering that more than halfof the children tested were premature infants, manyof whom tended to improve between 6 months and4 years, and also the inability to carry out fulltesting on children of superior ability, the correla-tions obtained are remarkably high. The correla-tion for test-retest on the Terman-Merrill L againstM form at the same age is given as 0 88 in the ageperiod 2 to 6 years (Terman and Merrill, 1937).The agreement at the lower end of the scale is
very close, as shown in Fig. 1. Sixteen childrenare considered to be ineducable in normal school(T.M.L. <70); of these, 12 were assessed at thislevel at 6 months and at every examination there-after; no child scored higher than very dull on anytest at any age. Sixteen children are consideredborder-line defective in school (T.M.L. 70-79);12 of these were rated at this level or lower from6 months; no child scored higher than very dull atany examination after 2 years. Fourteen childrenare rated as very dull and will need adjustment helpor retardation in class; at 6 months 10 scored atthis level or lower; only two children were consideredto have a D.Q. above 95 at 3 and 4 years.
T.M.L.5-6 years
<70 I.Q.Ineducable
TABLE 2CORRELATION COEFFICIENTS BETWEEN T.M.L. SCORES
AND D.Q. SCORES AT DIFFERENT AGES
CorrelationAge Coefficient No. of Cases
6 months 0 54 2371 year 0 57 2402 years 0-66 2343 years 0 78 1924 years 0 82 171
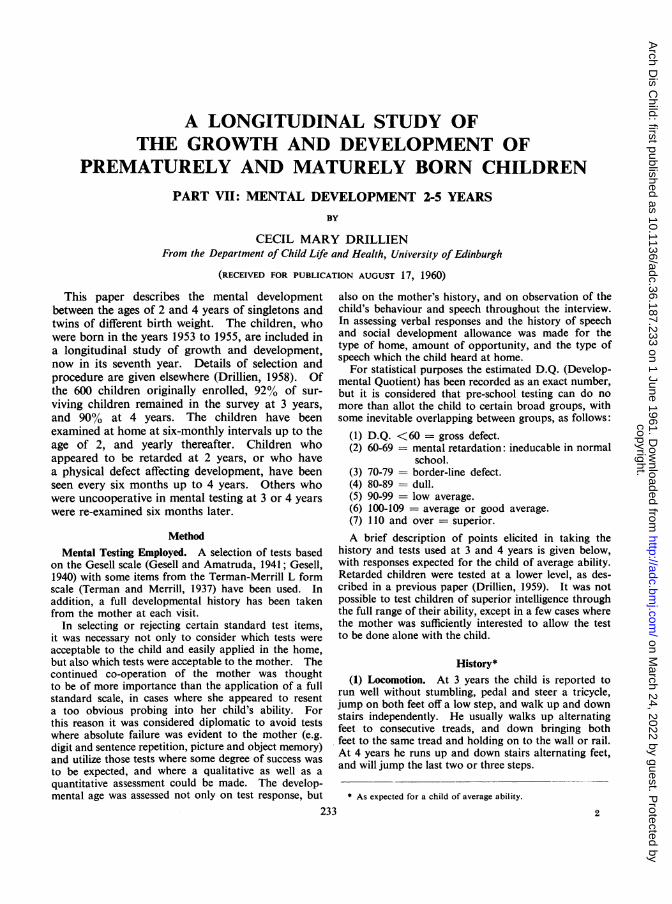
All authorities agree that the early assessment ofsuperior ability is much less accurate. To date,60 children have scored 115 or higher on the T.M.L.test. Of these, 11 were 4½ lb. or less at birth,14 between 4½and 5½lb., and 35 over 5½lb. Fig. 2shows pre-school assessments for these superiorchildren at ages from 6 months to 4 years, by birthweight. In the smallest birth weight group over60% were rated as low average or below at 6 months.Some of them were considered quite markedlyretarded, but at each subsequent examination thenumber of below average children decreased. At4 years one child was considered average and 10above average. Most of these children came frommiddle-class homes, and the rest from superiorworking-class homes. In the mature control groupone-half of the children were rated as above averageat 6 months, and three-quarters by 3 years. At3 and 4 years three children were considered belowaverage on test responses, all of them coming fromvery poor homes with restricted opportunities.
In attempting to predict future ability in the pre-school period it is necessary to take full cognisance ofbirth weight, degree of opportunity available to thechild, and any handicapping features in the environ-
70-79 I.Q.Border-line
80-89 I.Q.Dull
2 2 3 4 2 3 42 i I 4
Age of developmental testing in years
FIG. 1.-Pre-school assessments on developmental testing in children considered ineducable, border-line defective, and dull in the first year
in school.
100 -
80-
60 -
40 -
20 -
0O
rz
copyright. on M
arch 24, 2022 by guest. Protected by
http://adc.bmj.com
/A
rch Dis C
hild: first published as 10.1136/adc.36.187.233 on 1 June 1961. Dow
nloaded from
ARCHIVES OF DISEASE IN CHILDHOOD
Fio. 2.-Pre-school test results in children who are considered ofsuperior ability in school.
Birth weight (lb. oz.).)/
100so
80-
60-
40
20-
0-
4.8 and under
t1 2 3 4
I9-5 *8
4
Age at developmental testing in years
ment. Experience from this group indicates thatretarded children who will later prove to be in-educable in normal school should be recognizableby 1 year, and nearly all border-line or very dullchildren by 2 years. A number of children, mainlysmall prematures, who subsequently proved to beof average or superior ability in school, were ratedat equally low levels at 6 months, and came underclose observation for this reason. Nearly all showedobvious improvement at 1 year, and all showedprogressive improvement after this age. In cases
of suspected retardation the trend of developmentis of greater importance than the actual score at anyone age. The early detection of mental retardationis the most important function of developmentaltesting, the prediction of average or above averageability being mainly of academic interest. Never-theless, if those factors in the child's life experiencewhich may affect development are known, it shouldbe possible to reach a quite high degree of accuracyin predicting future ability in fairly broad groupingsby the age of 2 or 3 years.A comprehensive commentary on the recent
literature about the predictive value of early develop-mental testing is given by Illingworth (1960) in a
recent book. He stresses the importance of con-
sidering the child and his environment as a whole,of assessing not only the child's ability to performa certain act but the maturity of his response, andthe danger of relying on a single examinationinstead of assessing rate of development. Illing-worth concludes that early developmental testingis of great value in the detection of mental retarda-tion and neurological conditions with a considerabledegree of certainty, though he has found littleevidence that mental superiority can be detected ininfancy.
Developmental Ability in Different BirthWeight Groups
Tables 3 and 4 give figures for mean D.Q. atages 3 and 4 years, and mean score at 5 plus years
on the T.M.L. test for singletons and twins in fourbirth weight groups.
Testing was inadequate, and no score allottedfor 17% of singletons at 3 years and 26% at 4 years,
and for 37% of twins at both ages. In 10% ofsingletons and 19% of twins no score was allotted ateither 3 or 4 years. This was as often due to theattitude of the mother as it was to lack of co-opera-
tion from the child. Failure to make an accurateassessment was more common for mature controls,
D.Q.
108 and over
95-107
94 and under
5 9 and over
3 4
236
9--
2 3I I 1?' 2
copyright. on M
arch 24, 2022 by guest. Protected by
http://adc.bmj.com
/A
rch Dis C
hild: first published as 10.1136/adc.36.187.233 on 1 June 1961. Dow
nloaded from
GROWTH AND DEVELOPMENT OFPREMATURE AND MATURE CHILDREN 237and in the poorest homes; but from results ofT.M.L. testing in school it appears that there islittle difference between mean scores of childrenof like birth weight and social grade who were orwere not tested at 3 to 4 years.As at 2 years there is still an obvious difference
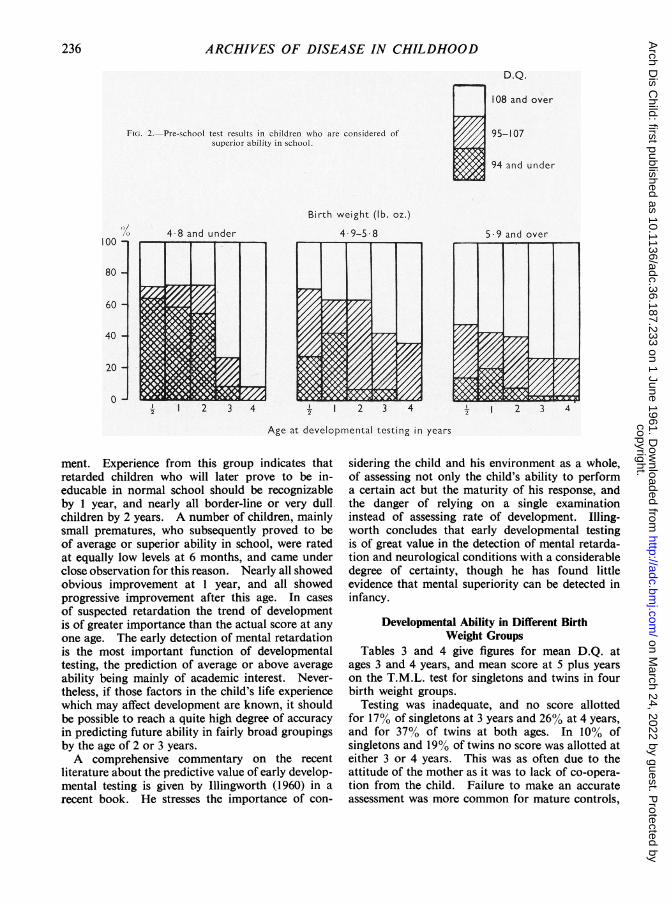
in mean score between the premature groups and themature control group. The difference by birthweight is approximately the same as it was at 2 years.Again, twins score lower than singletons of likebirth weight at each age. Fig. 3 shows the propor-tion of children in the four birth weight groups whocome into the broader categories given above. Theincrease in dull, retarded and defective children asbirth weight decreases is still very obvious at 4 years.
Developmental Ability by Birth Weight andMaternal Grade
In the 2-year analysis it was found that develop-mental ability was related both to birth weight andgrade of mother, the difference between childrenfrom the best and worst homes being greatest forthose who were smallest at birth. This differenceby social grade is still obvious at 3, 4, and 5 plusyears, as shown in Table 5. The difference in meanD.Q. at 4 years for children from the best and worsthomes is 32 points for those who were 3½ lb. orless at birth (the difference was 17 points at 2 years)and nine points for those who were over 5½lb. atbirth. The mean score at 3 to 4 years for the maturecontrols in the best maternal grade group is likelyto be an underestimate, owing to the difficulty
3 9-4 8
3 8 and under
I I I
-70 70 80 90 100-79 -89 -99 -109
D.Q. at 4 years
FIG. 3.-D.Q. groups at 4 years by birth weight.
TABLE 3MEAN SCORES ON INTELLIGENCE TESTING BY BIRTH WEIGHT (SINGLETONS)
3 years 4 years 5+ yearsBirthWeight No. of No. Mean No. of No. Mean No. of Mean
Cases Tested D.Q. Cases Tested D.Q. Cases I.Q.
(1) 3 lb. 8 oz. and under .. 38 34 84-5 36 30 825 17 76-9(2) 3 lb. 9 oz.-4 lb. 8 oz. .. 57 52 95 3 57 52 972 23 1008(3) 4 lb. 9 oz.-5 lb. 8 oz... 136 109 99-6 133 89 100.1 78 102-1(4) 5 lb. 9 oz. and over .. 111 90 106-8 108 77 108-7 59 113-1
Difference 4-1 .. .. 3 262 362
TABLE 4MEAN SCORES ON INTELLIGENCE TESTING BY BIRTH WEIGHT (TWINS)
3 years 4 years 5 + yearsBirthWeight No. of No. Mean No. of No. Mean No. of Mean
Cases Tested D.Q. Cases Tested D.Q. Cases I.Q.(1) 3 lb. 8 oz. and under .. 12 9 74-2 12 10 73-3 9 73-4(2) 3 lb. 9 oz.-4 lb. 8 oz... 41 29 93-2 41 25 95 -9 22 99.1(3) 4 lb. 9 oz.-5 lb. 8 oz. .. 58 36 959 57 34 970 14 99-2(4) 5 lb. 9 oz. and over . 78 45 102-6 78 49 103-5 23 106-3
Difference 4-1 .... 28 4 30.2 32.9
-100 100+
Birth weight(lb. oz.)
5 8 and over
4.9-5 8
I I
109 +
a
,__r -.
I
I I
s I I I -I
copyright. on M
arch 24, 2022 by guest. Protected by
http://adc.bmj.com
/A
rch Dis C
hild: first published as 10.1136/adc.36.187.233 on 1 June 1961. Dow
nloaded from

ARCHIVES OF DISEASE IN CHILDHOODTABLE 5
MEAN SCORES ON INTELLIGENCE TESTING AT DIFFERENT AGES BY BIRTH WEIGHTAND MATERNAL GRADE
previously mentioned of assessing children ofsuperior ability. On T.M.L. scores there is a meandifference of 45 points of I.Q. between children fromthe best and worst homes who were 3- lb. or lessat birth, and 23 points for those who were maturecontrols.
Within each maternal grade group mean D.Q.increases with increasing birth weight, but the effectof small birth weight is much more marked in those
D.Q. 100 and over
I I I 1 I 1
5.9 and over
3.9-4 8
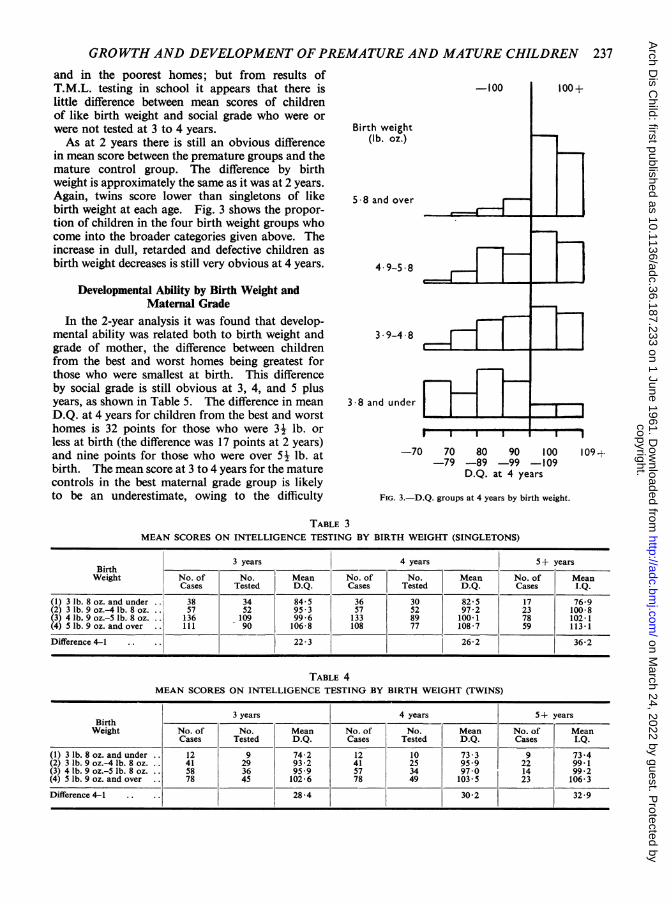
from the poorest homes. In maternal gradegroups 3 and 4 there is little difference in meanscore between those prematures who were over 41 lb.at birth and the mature controls. Many of theseso-called prematures are small babies born at ornear term to small mothers, often of poor physique.Children from the best homes who were this weightat birth do score significantly lower. More of thesechildren were premature by gestation time as wellas by birth weight. Fig. 4 shows the same dataarranged in a different way, for children from thebest homes, and gives the proportion, by birthweight at 4 years, who were considered (1) defective(D.Q. <70); (2) border-line (D.Q. 70-79); (3) dull(D.Q. 80-89); (4) low average (D.Q. 90-99);(5) average or good average (D.Q. 100-109), and(6) superior (D.Q. 110 and over). Even in the bestenvironment the proportion of children consideredbelow average at 4 years increases markedly withdecreasing birth weight although there are very fewdull and retarded children in this group as com-pared with those of like birth weight from poorerhomes. However, it should be remembered that anI.Q. of 100 in a child from a professional home withparents of superior ability may indicate as markeda degree of retardation as an I.Q. of 75 in a childfrom a poor home with parents of low intelligence.In a statistical analysis the former is considerednormal, while the latter rates as a border-linedefective.
Discussion
From the close personal observation of thisgroup of children, their homes and families over4 to 5 years, it appears that mental development,so far as this is measurable by developmentalhistory, intelligence testing, and observed behaviour,is affected by birth weight, genetic endowment, andenvironment of upbringing.
Prematurely born children from the best homeswith parents of above average intelligence show
D.Q. < 1001
.,
80
60 -
40 -
20 -
80 -
60 -
40 -
20 -
4-9-5 8
3 8 and under
Birth weight (lb. oz.)FIG. 4.-Developmental gradings by birth weight-maternal grades
1 and 2.
238
5 6-- 1
copyright. on M
arch 24, 2022 by guest. Protected by
http://adc.bmj.com
/A
rch Dis C
hild: first published as 10.1136/adc.36.187.233 on 1 June 1961. Dow
nloaded from
GROWTH AND DEVELOPMENT OFPREMATURE AND MATURE CHILDREN 239
a steady improvement from 6 months, which ismost marked in the first two years of life. Childrenfrom the poorest homes show a lesser improvementon average up to 18 months or 2 years, and there-after those who appear to be retarded tend todeteriorate further. A number of longitudinalstudies of development in children of differentbirth weight are at present in progress. In thiscountry the most comprehensive is the inquiry intolater development of a representative group ofpremature children and full-term matched controlsprovided by the Maternity Survey of 1946 (RoyalCollege of Obstetricians and Gynaecologists and thePopulation Investigation Committee, 1948).These children have now passed into secondaryschool. An assessment of mental ability was madeat 24 years (Douglas, 1956b), at 8 years (Douglas,1956a), and at 11 years 3 months (Douglas, 1960).Although Douglas states in his most recent paper(1960) that the apparent retardation in walkingand talking amongst prematures could be satis-factorily explained when the ages of both prematuresand matures were calculated from conception, littleweight can be attached to an assessment of earlyability based on a brief history given to a healthvisitor when the child was 21 years old. However,at 8 years over 80% of surviving children completeda series of standardized tests. The average scorefor prematures was between 1 7 and 3 0 pointslower than that for controls, on a test with a meanfor the whole group of 50 and standard deviationof 10. At 8 years environmental differences wereconsidered minimal because of the matching ofcontrols, and were not thought to account fordifferences in mental ability. At 11 years biggerdifferences were found on test scores, ranging from3-0 to 4-2 points. Moreover, only 9.7% of pre-matures gained entrance to grammar school, ascompared with 22.0% of controls. A reappraisalof environment revealed that certain differencesexisted between the premature and control groupswhich had hitherto been disregarded, particularlyin the social and educational background of parents,and in their interest in and standards of care oftheir children. In conclusion, Douglas states:'In a national study of the mental ability and primaryschool progress of premature children a numberof striking handicaps were found, which were latershown to be of environmental origin, rather thanthe result of low birth weight per se.' One wouldnot expect to find big differences between pre-matures and controls in Douglas's sample. Themajority of the children selected were between44 and 54 lb. at birth, and many of these were smallbabies born at or near term. Less than 10% of the
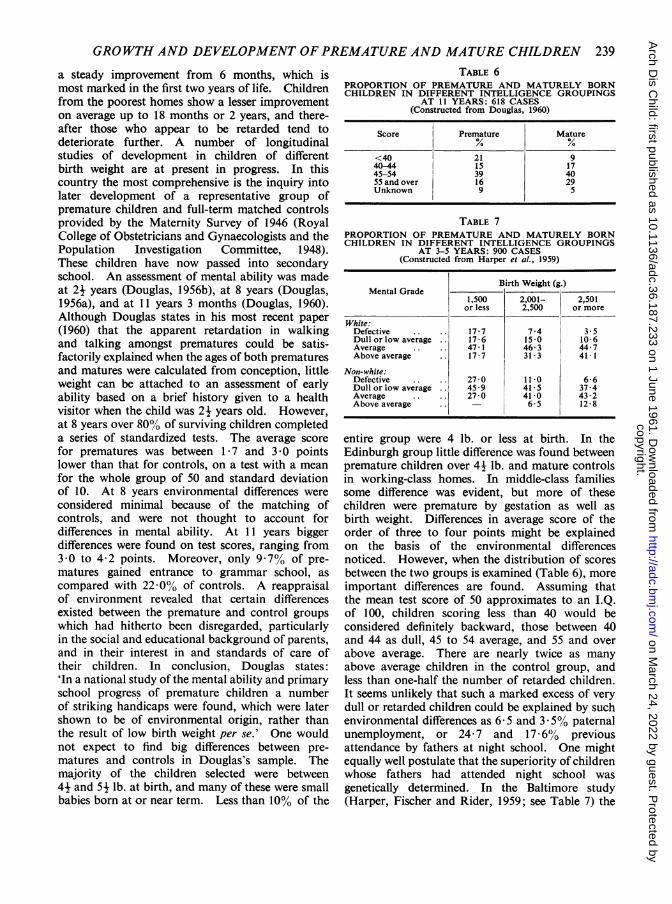
TABLE 6PROPORTION OF PREMATURE AND MATURELY BORNCHILDREN IN DIFFERENT INTELLIGENCE GROUPINGS
AT 11 YEARS: 618 CASES(Constructed from Douglas, 1960)
Score Premature Mature% %<40 21 940-44 15 1745-54 39 4055 and over 16 29Unknown 9 5
TABLE 7PROPORTION OF PREMATURE AND MATURELY BORNCHILDREN IN DIFFERENT INTELLIGENCE GROUPINGS
AT 3-5 YEARS: 900 CASES(Constructed from Harper et al., 1959)
Birth Weight (g.)Mental Grade
1,500 2,001- 2,501or less 2,500 or more
White:Defective .. .. 17 7 7-4 3.5Dull or low average .. 17-6 15-0 10-6Average .. .. 47-1 46-3 44-7Above average .. 17-7 31.3 41 1
Non-white:Defective .. 2770 11 0 6-6Dullorlowaverage .. 459 41-5 37-4Average .. .. 27.0 41.0 43.2Above average .. - 6- 5 12-8
entire group were 4 lb. or less at birth. In theEdinburgh group little difference was found betweenpremature children over 44 lb. and mature controlsin working-class homes. In middle-class familiessome difference was evident, but more of thesechildren were premature by gestation as well asbirth weight. Differences in average score of theorder of three to four points might be explainedon the basis of the environmental differencesnoticed. However, when the distribution of scoresbetween the two groups is examined (Table 6), moreimportant differences are found. Assuming thatthe mean test score of 50 approximates to an I.Q.of 100, children scoring less than 40 would beconsidered definitely backward, those between 40and 44 as dull, 45 to 54 average, and 55 and overabove average. There are nearly twice as manyabove average children in the control group, andless than one-half the number of retarded children.It seems unlikely that such a marked excess of verydull or retarded children could be explained by suchenvironmental differences as 6 5 and 3 -5% paternalunemployment, or 24.7 and 17 6% previousattendance by fathers at night school. One mightequally well postulate that the superiority of childrenwhose fathers had attended night school wasgenetically determined. In the Baltimore study(Harper, Fischer and Rider, 1959; see Table 7) the
copyright. on M
arch 24, 2022 by guest. Protected by
http://adc.bmj.com
/A
rch Dis C
hild: first published as 10.1136/adc.36.187.233 on 1 June 1961. Dow
nloaded from

240 ARCHIVES OF DISEASE IN CHILDHOODincidence of defective children is over four times ashigh in the smallest premature group as in thematched control group. In this study more detailedsocial indices were employed in matching than inDouglas's group, including some details of theparents' social background before marriage. Thoughthere may still be some residual differences in en-vironment between the two groups, it is unlikelythat this could account for more than a small partof the differences in mental level observed.
SummaryThe mental development of a group of over 500
singletons and twins of different birth weight hasbeen studied at 3 and 4 years. About half thegroup have entered school, and results of intelligencetesting between 5 and 6 years are available. Thefollowing conclusions were reached.As at 2 years mean scores on intelligence testing
fall steadily with decreasing birth weight at 3, 4 and5 years. Twins show consistently lower scores thansingletons of like birth weight. At 4 and 5 yearsthere is a striking excess in the smaller prematuregroups (i.e. 4J lb. or less) of children who areineducable in normal school, or will need specialeducational treatment within the normal school.
Mental development is related to the apparentintelligence of the mother and to the type of home.Differences between social grades appear to begreater at 4 and 5 years than at 2 years. In averageand poor working-class homes there is little differ-ence in mental ability between those prematureswho were over 44- lb. at birth and mature controls.In superior working-class and middle-class homes
the child who was between 41 and 5j lb. at birth isstill at a disadvantage. Most of these children werepremature by gestation as well as by birth weight.The predictive value of early developmental
testing is discussed, and correlations given betweenD.Q. scores at ages 6 months to 4 years, and scoreon the Terman-Merrill L form test at 5 to 6 years.The expected response to pre-school developmentaltests is affected by birth weight, environment andopportunity. Early developmental testing is ofmost value in the detection of children who laterprove to be dull, retarded or defective.
I am indebted to Miss A. T. Paterson, PrincipalEducational Psychologist, and her Staff at the EdinburghCorporation Education Department Child GuidanceCentre, who have undertaken the intelligence testing ofchildren in Edinburgh Corporation Schools; and alsoto Professor R. W. B. Ellis for his interest and encourage-ment throughout.
REFERENCESDouglas, J. W. B. (1956a). Mental ability and school achievement
of premature children at 8 years of age. Brit. med. J., 1, 1210.(1956b). The age at which premature children walk. Med.
Offr, 95, 33.(1960). 'Premature' children at primary schools. Brit. med. J.,1, 1008.
Drillien, C. M. (1958). A longitudinal study of the growth anddevelopment of prematurely and maturely born children. Part 1:Introduction. Arch. Dis. Childh., 33, 417.(1959). A longitudinal study of the growth and developmentof prematurely and maturely born children. Part III: Mentaldevelopment. Ibid., 34, 37.
Gesell, A. (1940). The First Five Years of Life. Methuen, London.and Amatruda, C. S. (1941). Developmental Diagnosis.
Hoeber, New York.Harper, P. A., Fischer, L. K. and Rider, R. V. (1959). Neurological
and intellectual status of prematures at three to five years of age.J. Pediat., 55, 679.
Illingworth, R. S. (1960). The Development of the Infant and YoungChild Normal and Abnormal. Livingstone, Edinburgh.
Royal College of Obstetricians and Gynaecologists and the Popula-tion Investigation Committee (1948). Maternity in GreatBritain. Oxford University Press, London.
Terman, L. M. and Merrill, M. A. (1937). Measuring Intelligence.Harrap, London.
copyright. on M
arch 24, 2022 by guest. Protected by
http://adc.bmj.com
/A
rch Dis C
hild: first published as 10.1136/adc.36.187.233 on 1 June 1961. Dow
nloaded from