Embed Size (px)
Citation preview
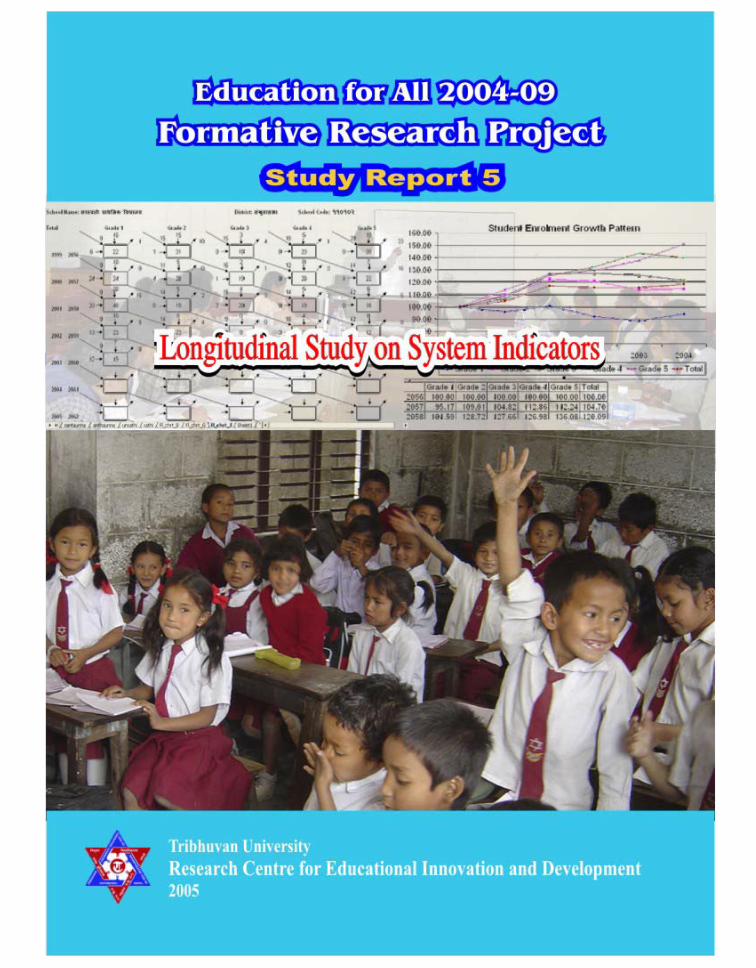
Longitudinal Study on System Indicators i


Education for All 2004-09 Formative Research Project
Study Report 5
Longitudinal Study on System Indicators
Tribhuvan University
Research Centre for Educational Innovation and Development Balkhu, Kathmandu, Nepal
2005
FRP Report ii
Research Team Dr. Roshan Chitrakar, Research Mr. Raju Manandhar, Associate Researcher Mr. Rom Prasad Bhattarai, Associate Researcher Prof. Ajaya Bikram Sthapit, Resource Person Prof. Purusottam Singh, Resource Person Dr. Shreeram Prasad Lamichhane , Resource Person Mr. Sailendra Sigdel, Resource Person Mr. Hari Lamsal, Resource Person Mr. Sugam Bajracharya, Resource Person Mr. Yogendra Prasad Lekhak, Research Assistant Mr. Prabhakar Dhungel, Research Assistant Mr. Kamal Adhikari, Research Assistant Mr. Arjun Kumar Pandey, Research Assistant Mrs. Prativa Pradhan, Research Assistant Mrs. Anjana Rajbhandari,Research Assistant Mr. Amul Uprety, Research Assistant Mr. Kashilal Chaudhari, Research Assistant Mr. Himal Kumar Uprety, Research Assistant Mrs. Chandra Badana Rai, Research Assistant Ms. Saraswoti Parajuli, Research Assistant Mr. Mithu Ram Poudel, Research Assistant
Language Editor Prof. Purush Ratna Bajracharya
Cover Design & Layout Gautam Manandhar
Cover Photo Mr. Raju Manandhar
Secretarial Support Mr. Bhakta Bahadur Shrestha
Formative Research Project, CERID
Project Coordinator: Dr. Kishore Shrestha Project Advisors: Prof. Dr. Hridaya R. Bajracharya Associate Researcher: Mr. Rom Prasad Bhattarai Dr. Shreeram P. Lamichhane

Longitudinal Study on System Indicators iii
Acronyms and Abbreviations ADA Average Daily Attendance BPEP Basic and Primary Education Programme BS Bikram Sambat CDC Curriculum Development Centre CERID Research Centre for Educational Innovation and Development DDC District Development Committee DEO District Education Office(r) DEP District Education Plan DOE Department of Education ECD Early Childhood Development EFA Education For All EMIS Education Management Information System ETC Education Training Centre FRP Formative Research Project GER Gross Enrolment Rate GIR Gross Intake Rate ID Identity INGO International Non-Governmental Organization MOES Ministry of Education and Sports NCED National Centre for Education Development NER Net Enrolment Rate NGO Non-Governmental Organization NIR Net Intake Rate PRD Promotion, Repetition and Dropout PTA Parent Teacher Association RED Regional Education Directorate RP Resource Person SIP School Improvement Plan SLC School Leaving Certificate SMC School Management Committee SS School Supervisor STR Student Teacher Ratio TG Teacher’s Guide TMIS Teacher Management Information System VDC Village Development Committee VEP Village Education Plan
FRP Report iv
Executive Summary
The Longitudinal Study on System Indicators of the Formative Research Project on Education for All has been providing research-based information on performance indicators since the time of BPEP II. The study has reviewed and revised the indicators to suit the monitoring needs in the more advanced context of EFA and has continued collecting and analyzing the primary school data from the usual sample of 62 schools of 16 districts. This report presents the analysis, findings and recommendations based on the annual statistical information of the period between 1999 and 2004. It has also highlighted the lessons learned and how a revised approach has evolved in the process of data collection. Therefore, the findings and recommendations are based on both the pattern of changes observed in the system indicators and revised research process adapted to by the study in the five year period between 1999 and 2004.
The Process
There has been a major shift in the approach to data collection. Instead of sending enumerators to schools to extract data from the scattered source of school record, schools representatives themselves have been entrusted to consolidate the data. For this purpose data collection workshops have been organized at the level of 7 school clusters. The workshops which were facilitated by CERID researchers were participated by representatives of the sampled schools, secretaries of the municipality-wards and VDCs where the sampled schools were located, representatives of relevant DEOs, REDs, DOE and MOES. The guiding principle of this data-quality-assurance-process is that the reliability and validity of data is directly related to the extent to which the schools take ownership of the process itself. For the purpose of individual school’s record and use the data provided were sent back in the form of school-specific compilation of computer printouts.
As of 2004 the relevant municipality-wards and VDCs were asked to bring specific educational information of their constituencies in the data collection workshops. As expected, though, none brought such information and monitoring of progress on EFA indicators obviously was not their priority. In the workshop, however, the secretaries expressed that such task do fall within the scope of the local governance process. They also stressed that the engagement of the VDC/municipalities in such a task is all the more important in the context of the current mandate of translating the spirit of LSGA into practice. Despite this enthusiasm, for various reasons and practical difficulties, only 8 VDCs have thus far managed to submit the information (collected from secondary source) that the study had sought. It will, therefore, take few more years before the study will be able to analyze and present the data on some of the key indicators such as the trends and patterns of change in NER/GER, literacy, ECD centres in the school catchments areas.
Findings and Recommendations
The study’s findings and recommendations are summarized categorically in five of the six EFA components. Because of the inability of the VDCs/municipalities to supply the study with literacy data, the study’s recommendation does not include this component.

Longitudinal Study on System Indicators v
Expansion of ECD
To realize the EFA targets related to this component, the growth in the percent of new entrants in grade one with ECD needs to be more drastic as does the number of schools with pre-school programs. VDCs and municipalities should monitor the progress on ECD-related development indicators—e.g., number of ECD age children in and out of ECD/pre-school programs, number of ECD/pre-school trained teachers/facilitators. VDCs should mobilize resources to fund ECD/pre-school programs along with supporting private initiatives. Municipalities, however, should focus on promoting private sector operation and management of ECD/pre-school programs with clear and informed regulations and monitoring system. The pattern of change in the ECD-related indicators should be reflected upon and discussed among the local stakeholders—the platforms in events like social audit or public hearing should be utilized for such a purpose. The issues generated from such a process should feed information to the concerned unit of DOE which will be helpful to commission appropriate research study or make meaningful policy responses. This study’s analysis of ECD related data demands that ECD/pre-school programs should be aggressively targeted for Muslim children. However, further in-depth inquiry would be necessary to decide on more critical aspects of such programs for Muslim children.
Access of All Children to Education
The issue of access to education has been addressed to some extent through the provision of incentives (dalit/girls scholarships) to girls or children coming from specific social groups. Enrolment of girls and Dalit children has increased. But Muslim children are lagging behind in terms of their enrolment in primary school—more so in the case of Muslim girls. The special focus group incentive program which is supposed to attract Muslim children apparently does not seem to work for this group. Scholarships for disabled students might have contributed to bring more such children to school but very few would make it up to the 5th grade. Neither the VDCs/municipalities nor the schools have kept the record of the number of primary school age disabled children or those belonging to different social groups residing in the school catchments area but not coming to the school. VDC-school coordination and communication is nonexistent which proves that EFA is not the local agenda.
This scenario of varying enrolment pattern of children belonging to different social groups or with different physical/mental conditions suggests that the government’s targeting of special focus group and special need children for improved access to primary education should be further intensified but the agenda and the planning process must be strategically localized. The spirit of SIP process needs to be internalized by the local stakeholders. They should be allowed to map out if and how children with disability or representing certain social groups are systematically excluded from accessing school education. The SIP should clearly reflect the understanding of the stakeholders about the access issue and their own targets, strategies and plans to respond to the issue. The school supervisor and the resource person should play the facilitating or catalytic role to help the stakeholders to analyze the context and articulate the issue.
Meeting the Learning Needs of All Children
Despite the improvement in the availability of learning resources, libraries, and trained teachers, the children attending the sampled primary schools have not

FRP Report vi
improved their learning achievements. The budget allocation for non-salary recurrent cost has gone down which is an indication that the schools are not encouraged to be creatively engaged in innovative pedagogical processes. The decreasing trend in the average annual attendance of students also tells that schools have to do more to make learning process interesting and relevant. Much of these issues are linked with what actually goes on inside the classroom and how the pedagogical process is managed by the teacher. There are seemingly minor but very critical and practically possible steps that the teacher can initiate to make teaching and learning more meaningful and result oriented.
Every primary school teacher should analyze the mid and end of the session progress of students of at least one class in terms of their learning achievements. The analysis should be obviously gender, caste, ethnicity and disability disaggregated. The teachers should draw issues affecting the learning achievements, set the disaggregated targets of improvements and develop plans and strategies to achieve the targets. The head teacher should consolidate all the grade specific plans of teachers to prepare the overall SIP to be presented and endorsed in the SMC meeting. Teacher training programs of NCED should integrate this practically oriented reflective learning exercise. The SIP developed with such a systematic process should be treated sensitively (must not be subjected to arbitrary judgement) and judiciously by the central level authority and resources demanded by the plan should be made available.
Eliminating Gender and Social Disparities
The gender parity among the students has been achieved in the 62 sampled schools. There are also more female teachers working in those schools but their distribution across the schools is quite uneven and scattered. For example, all the 16 primary level teachers in a single school from Lalitpur municipality are women and there are schools, especially in the isolated areas, where there is fewer or no female teacher. This is how gender parity of teacher has been achieved. Representation of Dalit, Janajati and Muslim in the student and teacher population of the 62 schools too is very low.
The pedagogical significance of the presence of female teachers and teachers belonging to local cultural group speaking the local language needs to be felt and acknowledged by SMCs not only in the urban areas but most importantly in the rural and isolated areas. The local civil society organizations should be mobilized with necessary resource support to play the advocacy role to sensitize the SMCs and local communities in this regard. The outcomes, e.g. action plans, strategies, roles and responsibilities intended specifically for equity in schooling and teaching, of such a collaboration should be made explicit by the local actors themselves. The viability of the local action plans should be sensitively reviewed and supported with necessary resources by the concerned authorities (DEO, DOE).
At the macro level, special measures should be taken to motivate female teachers to move to schools in rural and isolated areas. Location specific special incentives should be made available to such teachers with conditions that the expected and tangible results would be demonstrated, e.g. improved gender and caste/ethnicity specific NER and learning achievements. The teachers should utilize the occasions of social audits to publicise the progress made on such indicators. Teachers producing outstanding results should be rewarded appropriately. Schools should collaborate

Longitudinal Study on System Indicators vii
with the local civil society organization(s) to analyze the social context in relation to the indicators in question and to optimize the effectiveness of the initiatives.
Quality of Education
The increased number of trained primary teachers and the improved learning resource base including availability of libraries in schools are some of the positive findings of the study. However, they are yet to make an impact on student learning achievement although some incremental improvements are experienced in the internal efficiency of the primary education system—nominal improvements in promotion rate and primary cycle completion of girls. The trend of students’ performance scores in key primary subjects is rather disappointing. They have barely crossed the officially required pass mark. This raises the question against the massive investment on teacher training and the value it has added to student learning. The improvement of girls’ primary cycle completion rate is not complemented by similar trend in terms of the rate of transition to lower secondary school. The impact of the incentive program, therefore, seems short-term in nature.
The relevance and use of learning resource base are yet to be ensured. Textbooks which students are most passionate about are not distributed on time. The poor student learning achievement also raises the question against the effectiveness of the efforts made, if any, to translate the curricular flexibility of including up to 20% local content and using local language as the medium of instruction.
The blame also goes to the physical conditions of schools, e.g., the abnormally high student teacher ratio particularly in the case of Terai schools. The classrooms in average schools are made more spacious in the recent years, which is an encouraging factor, but it is not sure if the prevailing pedagogical practices have made best use of such facilities. There is also an issue of the demands of certain number of schools to improve classrooms’ physical conditions through construction and/or rehabilitation not being fully responded with the support of funds required.
Much of the above findings seek improvement in the way teachers are trained not only to be effective in delivering the curricular contents but also to be socially responsible pedagogues. The teacher training programs need to acknowledge the multifaceted roles of the teacher. Generic teacher training programs, although have their importance, are not sufficient to help teachers address the context specific pedagogical problems. The recurrent training programs have the potential to address these problems but unfortunately they have not been of high priority. The recurrent training opportunities should be expanded and made a regular activity of ETCs and RCs. Teachers should be allowed to be engaged in action research and encouraged to be reflective practitioners.
The other aspect, which is also a cross-cutting issue, is the need to build the foundation of strong decentralized management system right from the school level with effective devolution of authorities to the frontline stakeholders, even if it might mean to take some risks in relation to financial mismanagement. Capacity building training for them should not be detached from such real-life experience. Social audit aspect needs to be systematically strengthened, e.g. through participatory identification of indicators of success and of public interests and regularization of hearing sessions to publicly assess the periodic status.
FRP Report viii
Acknowledgements This is the fifth consecutive year that the Longitudinal Study on System Indicators has been furnishing the Formative Research Project with statistical information related to periodic progress on specific EFA program indicators. The study has brought forth quantitative information relevant to the Ministry of Education and Sports of Government of Nepal to facilitate its process of planning, implementing, monitoring and managing EFA programs as outlined in the EFA Core Document 2004-09. The study findings have also provided the basis for carrying out more in-depth qualitative studies on pertinent issues under the FRP.
The study team acknowledges cooperation from all the head teachers, teachers, and representatives from related VDC/Municipalities of the sample schools covered by this study for their valuable support in furnishing necessary data of their respective schools. The team is also grateful to the representatives of Regional Education Directorates, and District Education Offices, School Supervisors and Resource Persons of the sample districts for their continuous support in undertaking the field work. Thanks are also due to all the field researchers who conducted cluster level data collection workshops and visited districts and schools for the collection of data.
The team is thankful to CERID Executive Director Professor Dr. Hridaya Ratna Bajracharya, FRP Coordinator Dr. Kishor Shrestha and Advisor Dr. Shreeram Lammichhane for their continuous support both on technical and administrative fronts that has made this study pursue its goal despite the occasional glitches it has encountered specially in the course of collecting data from the schools. The challenging task of logistic management involved in the study particularly due to its national coverage has so far been successfully handled by CERID administrative staff members whose contributions are highly appreciated. The study team thanks them all for their unceasing support. Last but not the least; thanks are also due to the study’s Resource Persons for their valuable comments and technical support.
Dr. Roshan Chitrakar Researcher July 2005
Longitudinal Study on System Indicators ix
TABLE OF CONTENT
Executive Summary ................................................................................................. iv The Process............................................................................................................. iv Findings and Recommendations ........................................................................ iv
Expansion of ECD .................................................................................................v Access of All Children to Education ......................................................................v Meeting the Learning Needs of All Children ........................................................v Eliminating Gender and Social Disparities ..........................................................vi Quality of Education ...........................................................................................vii
CHAPTER I INTRODUCTION ..............................................................................1 Context......................................................................................................................1 Objectives .................................................................................................................1
CHAPTER II STUDY DESIGN ...............................................................................3 Indicators..................................................................................................................3 Sample ......................................................................................................................4 Study Tools ..............................................................................................................5 Procedure .................................................................................................................5
Clusters ..................................................................................................................6 Capacity Building Workshop.................................................................................7
Scope and Delimitations ........................................................................................8 CHAPTER III PRESENTATION AND ANALYSIS OF DATA: STATUS OF INDICATORS ..................................................................................10
Primary School Completion Rate .......................................................................10 Transition Rate (from Primary to Lower Secondary) ......................................10 Number of school with ECD or Pre-School Program ......................................11 Percentage of New Entrants with ECD in Grade 1 ..........................................11 Student-Teacher Ratio ..........................................................................................13 Promotion, Repetition and Dropout Rates........................................................14 Promotion Rates ....................................................................................................15 Repetition Rates.....................................................................................................15 Dropout Rates........................................................................................................16 Internal Efficiency .................................................................................................16 Per Student Classroom Space..............................................................................16 Incentive Program and Beneficiaries .................................................................17 Student Enrolment ................................................................................................17 Enrolment Growth Pattern (1999-2004) .............................................................20 Representation of Women and Minority Groups in Teaching Profession ...20 Details of Grade 1 Cohort—Student Tracking..................................................22 Learning and Achievement .................................................................................22 Teachers’ Qualification.........................................................................................23 Teachers’ Training Status.....................................................................................24 Teachers’ Attendance of Recurrent Teacher Training Program(s) ................25 Temporary and Permanent License of Teaching..............................................25 Per Student Expenditure ......................................................................................26

FRP Report x
Expenditure on Major Headings ........................................................................26 Schools’ Income and Sources ..............................................................................27 Textbooks Availability .........................................................................................27 Availability of Teaching Resources ....................................................................27 Availability of Library ..........................................................................................28 Books and the Library ..........................................................................................28 Preparation of SIP .................................................................................................28 Classroom Conditions ..........................................................................................28 Teachers’ Attendance ...........................................................................................29 Daily Attendance of Students .............................................................................30 Retention of Staff in Key Positions—Head Teacher ........................................31 Formation and Training of SMC.........................................................................31 School Visit by RPs, SSs and DEOs ....................................................................31
SUMMARY OF THE FINDINGS .........................................................................33 Expanding Early Childhood Development.......................................................33 Ensuring Access to Education for All Children................................................34 Meeting the learning needs of all children including indigenous people and linguistic minorities ..............................................................................................35 Eliminating Gender and Social Disparities .......................................................36 Improving All Aspects of Quality of Education...............................................37
Teacher .................................................................................................................37 Textbook and Learning Materials........................................................................38 Learning Environment ........................................................................................38 School Improvement ............................................................................................39 Management and Capacity Building...................................................................40
RECOMMENDATIONS ........................................................................................42 Quality of Data and Study Process.....................................................................42 Study of Progress on Key EFA Indicators .........................................................42 Cooperation and Coordination ...........................................................................42
Suggested Action Steps ..........................................................................................45 Classroom Level ....................................................................................................45 School Level ...........................................................................................................45 VDC Level ..............................................................................................................45 District Level..........................................................................................................45 Region Level ..........................................................................................................46 Central Level..........................................................................................................46
Appendix 1 Study Tools .........................................................................................47 Appendix 2 Summary Report of the Capacity Building and Data Collection Workshops ...................................................................................48 Appendix 3 Additional Tables ..............................................................................51 Appendix 4 Cohort Flow Model............................................................................54
Longitudinal Study on System Indicators xi
List of Tables
Table 1: No. of schools by district and cluster ........................................................6 Table 2: Primary school completion rate ...............................................................10 Table 3: Transition Rate (from Primary to Lower Secondary) ...........................11 Table 4: New entrants with ECD in Grade 1 by sex and ethnicity (2004).........12 Table 5: Student Teacher Ratio................................................................................13 Table 6: Promotion rates by grade, year and gender ...........................................15 Table 7: Repetition rates by grade, year and gender ...........................................15 Table 8: Dropout Rates by Grade, Year and Sex...................................................16 Table 9: Internal Efficiency of Primary .................................................................16 Table 10: Per Student Classroom Space (in Square Feet) ....................................16 Table 11: Number of students by incentive program (2001- 2004) ....................17 Table 12: Student enrolment by ethnicity and caste (2002-2004) .......................18 Table 13: Student enrolment by special needs type (2002-2004) ........................19 Table 14: Gender parity index of teachers (2004) .................................................21 Table 15: Ethnic/caste representation in teaching profession (%).....................21 Table 16: Representation of caste/ethnicity of head teachers (in %).................21 Table 17: Percentage of achievement score in various primary subjects
by grade and gender................................................................................22 Table 18: Percentage of teachers with qualification .............................................23 Table 19: Percentage of teachers with qualification in education (in %) ..........23 Table 20: Percentage of teachers with teacher training certificate .....................24 Table 21: Teachers with full training (in %) ..........................................................24 Table 22: Female teachers in various training programs ....................................25 Table 23: Teachers attending refresher training ...................................................25 Table 24: Teachers with permanent license...........................................................26 Table 25: Proportion of expenditure on major headings.....................................26 Table 26: Proportion of income by different sources ...........................................27 Table 27: Availability of different teaching aids (% of schools) .........................27 Table 28: Availability of library and reading space .............................................28 Table 29: Types of books available in the library (%) ..........................................28 Table 30: Construction and rehabilitation of classrooms ....................................28 Table 31: Average annual attendance of teachers ................................................29 Table 32: Average daily attendance of teachers by month (in %)......................30 Table 33: Average of Yearly Attendance of Students ..........................................30 Table 34: Head teacher turnover in 5 years (2000-2004)......................................31 Table 35: SMC formed and trained.........................................................................31 Table 36: Frequency of visits ...................................................................................31 Table 37: Learning Achievement by subject and grade in 2001 .........................51 Table 38: Learning Achievement by subject and grade in 2002 .........................51 Table 39: Learning Achievement by subject and grade in 2003 .........................51 Table 40: Learning Achievement by subject and grade in 2004 .........................51 Table 41: Percentage of Daily Attendance of Students in 2001 ..........................52 Table 42: Percentage of Daily Attendance of Students in 2002 ..........................52 Table 43: Percentage of Daily Attendance of Students in 2003 ..........................52 Table 44: Percentage of Daily Attendance of Students in 2004 ..........................52

FRP Report xii
List of Figures
Figure 1: Percentage of new entrants with ECD in Grade 1 ...............................12 Figure 2: STR frequency distribution compared with normal curve ................13 Figure 3: Enrolment growth pattern ......................................................................20 Figure 4: Gender parity index of students of primary grade .............................20 Figure 5: Percentage of teachers with teacher training certificate .....................24 Figure 6: Percentage of daily attendance of Teachers..........................................29 Figure 7: Student attendance by grade ..................................................................30

Longitudinal Study on System Indicators 1
CHAPTER I
INTRODUCTION
Context
Longitudinal Study on System Indicators is one of the two key components of the Formative Research Project on Education for All 2004-09 (FRP II)—the other component being the case studies. This study has been designed to supplement the project with statistical information on periodic progress of, as the title suggests, specific indicators of EFA programs. It is an important component of FRP II which aims to bring forth information relevant to the Ministry of Education and Sports (MOES), Nepal on planning, implementation, monitoring and management of EFA 2004-09.
The information generated through the overall project activities of FRP II has provided reference for regular monitoring of the planning and policy implementation as well as provide insights/details regarding the issues and problems faced in the implementation process. It is important for FRP II to provide MOES with two distinct kinds of research-based information—(i) key issues and questions pertaining to planning, implementation and management of EFA 2004-09 and (ii) regular periodic information on system indicators.
It is in this context that the Longitudinal Study on System Indicators plays specific role, as the other in-depth qualitative studies do. The system indicators study basically seeks information that focuses on the “WHAT” aspects of program activities by using the selected indicators, where as the in-depth studies focus on the “WHY”. In this sense, the former, by and large, generates key research questions for the latter.
As in the first phase of FRP for BPEP II, the Longitudinal Study on System Indicators has continued providing MOES periodic information on attainment of targets pertaining to EFA 2004-09. The in-depth studies, on the other hand, have continued providing qualitative information to support the findings of the System Indicators Study. The system indicator information also serves the purpose of monitoring progress of EFA programs.
Objectives
The overall concept of the Longitudinal Study on System Indicators is to measure periodically the progress on six program components of EFA 2004-09 as reflected by the changes in the 43 indicators.1 Also, wherever possible, this study provides necessary qualitative supporting evidence corresponding to some indicators by linking the analysis with the on-going in-depth studies. The specific objectives for this study are as follows:
1. To review and determine basic system indicators related to basic and primary education II and EFA 2004-09.
2. To collect data on the basic system indicators as well as related information periodically.
1 The study has modified the original 40 indicators that were identified to suit the analysis need of BPEP II.
FRP Report 2
3. To make progress analysis on six major areas and related indicators of EFA 2004-09.
4. To provide research-based information on Basic Indicators of EFA 2004-09 and others which are necessary on a periodic basis to MOES for attainment of targets pertaining to EFA 2004 -09
5. To help evolve improved data keeping system in schools and local level by building capacity for the improvement of EMIS at school/local level
6. To suggest on reviewing program implementation strategies,

Longitudinal Study on System Indicators 3
CHAPTER II
STUDY DESIGN
The longitudinal study on system indicators which was started during the time of Basic and Primary Education Project had, in 2002, entered into a new policy environment guided by the Education for All National Action Plan. The original study purpose was to (a) support the MOES/DOE with research based information and action points for achieving BPEP goals and (b) identify critical areas for in-depth research to feed into the government system. The study has continued collecting and analyzing the information from the 62 sampled schools. However, the focus now is on supporting the government in its effort to achieving the goals and objectives of EFA national action plan.
Indicators
The original set of 40 system indicators developed through the rigorous consultation process required re-adjustment to suit the EFA national framework of action and targets. Accordingly the indicators have been revised in consultation with the MOES/DOE and other relevant stakeholders. It was also felt necessary to include indicators that sought community level information (e.g. number of school-aged children in the school catchments or related VDC). The revised set of 43 indicators is listed below.
1. Number of 3-5 years aged children per ECD Centre
2. Number of classrooms rehabilitated
3. Number of new classrooms constructed
4. Primary school completion rate (school data)
5. Transition rate (from Primary to Lower Secondary)
6. Percentage of new entrants with ECD in Grade 1 and their performance in school examinations.
7. Student-teacher Ratio (STR)
8. Promotion, Repetition and Dropout Rates (including ECD experienced)
9. Number (or %) of students by Incentive Programmes2
10. No. of teachers trained for special education (STR)
11. Enrolment of disabled and special focus group children in primary schools
12. Enrolment pattern (by topography, gender, ethnicity, caste)
13. Details of Cohort-student tracking through out the study period (including achievement)
14. Learning achievement--based on school exams
15. Percentage of teachers with qualification
16. Percentage of teachers with full training
2 Record of incentive receivers will be maintained (including achievement if possible)

FRP Report 4
17. Number of teachers who have attended recurrent teacher training program(s)
18. Percentage of teachers with permanent tenure
19. Per student expenditure (non-salary recurrent cost)
20. Proportion of expenditure on major headings (salary, capital and non-salary recurrent costs) and also by source
21. Proportion of income by source
22. Timing of textbooks availability for students (ideally they should reach within one week of start of the school year)
23. Availability of Curriculum, textbooks, TGs, supplementary books and other curricular materials
24. Availability of library (including reading space).
25. Number of school days
26. Daily attendance (ADA) of teachers
27. Average daily attendance (ADA) of students.
28. Teacher deployment-employment status of teachers; teachers' ethnicity; gender; turnover,
29. Qualification, training, and retention of head teacher
30. SMC/PTA formed/trained and number of times SMC/PTA meet in one academic year
31. Number of school visit by RPs/SSs and DEOs during the last 6 months.
32. Number of schools that have implemented at least 50% mentioned in SIP
33. Percentage of literate 6+
34. Percentage of literate 15+
35. Gender parity in literacy (15+ years)
36. GER of ECD
37. NER of ECD
38. GER - primary
39. NER - primary
40. Gross Intake rate -GIR
41. Net Intake rate NIR
42. Percentage of schools that are providing primary education in mother tongue (where half of the students mother tongue in not Nepali)
43. Percentage of schools that are providing textbooks in mother tongue (where half of the students mother tongue in not Nepali)
Sample
The study’s sampling design remained unchanged from how it was postulated during the time of BPEP II. Accordingly the 62 sampled schools from 16 districts
Longitudinal Study on System Indicators 5
from across the country have been continuously visited for collecting data (the sampling design is included in FRP Study Report nos. 15 and 29).
Study Tools
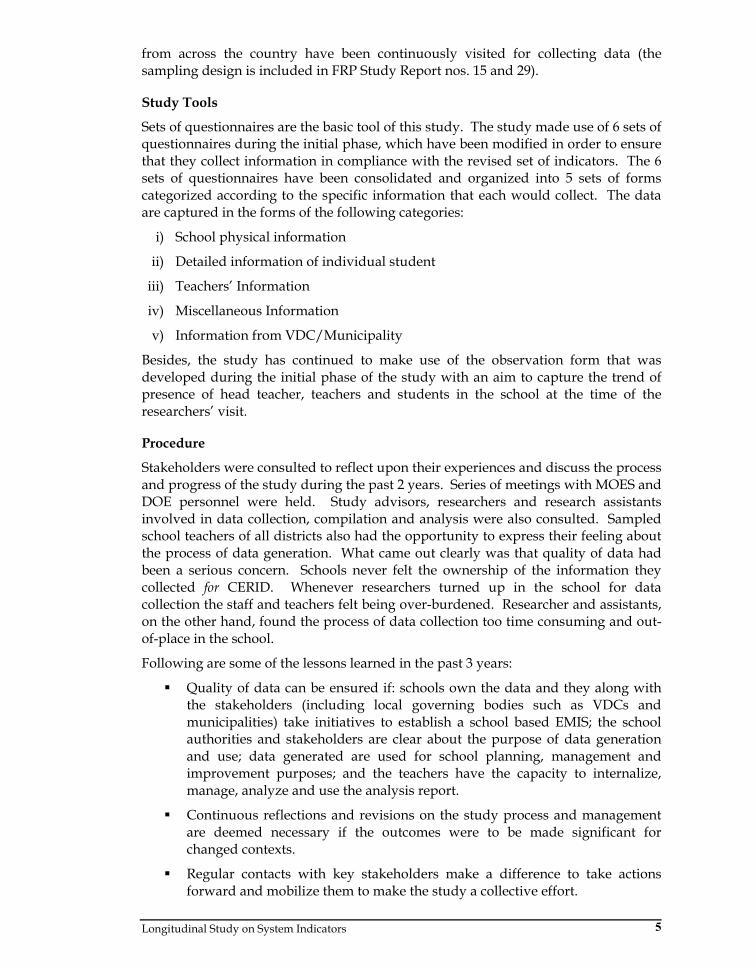
Sets of questionnaires are the basic tool of this study. The study made use of 6 sets of questionnaires during the initial phase, which have been modified in order to ensure that they collect information in compliance with the revised set of indicators. The 6 sets of questionnaires have been consolidated and organized into 5 sets of forms categorized according to the specific information that each would collect. The data are captured in the forms of the following categories:
i) School physical information
ii) Detailed information of individual student
iii) Teachers’ Information
iv) Miscellaneous Information
v) Information from VDC/Municipality
Besides, the study has continued to make use of the observation form that was developed during the initial phase of the study with an aim to capture the trend of presence of head teacher, teachers and students in the school at the time of the researchers’ visit.
Procedure
Stakeholders were consulted to reflect upon their experiences and discuss the process and progress of the study during the past 2 years. Series of meetings with MOES and DOE personnel were held. Study advisors, researchers and research assistants involved in data collection, compilation and analysis were also consulted. Sampled school teachers of all districts also had the opportunity to express their feeling about the process of data generation. What came out clearly was that quality of data had been a serious concern. Schools never felt the ownership of the information they collected for CERID. Whenever researchers turned up in the school for data collection the staff and teachers felt being over-burdened. Researcher and assistants, on the other hand, found the process of data collection too time consuming and out-of-place in the school.
Following are some of the lessons learned in the past 3 years:
Quality of data can be ensured if: schools own the data and they along with the stakeholders (including local governing bodies such as VDCs and municipalities) take initiatives to establish a school based EMIS; the school authorities and stakeholders are clear about the purpose of data generation and use; data generated are used for school planning, management and improvement purposes; and the teachers have the capacity to internalize, manage, analyze and use the analysis report.
Continuous reflections and revisions on the study process and management are deemed necessary if the outcomes were to be made significant for changed contexts.
Regular contacts with key stakeholders make a difference to take actions forward and mobilize them to make the study a collective effort.

FRP Report 6
Data collection activity should be made school’s regular work to ensure efficiency and quality.
These lessons led to the careful revision of the strategies to collect, consolidate and analyze the data on the identified system indicators. The effort now has been to help the sampled schools establish their own information systems and rely more on those systems while collecting the data for the study. Workshops of schools in 7 clusters across the country have been organized to help them establish their information systems by involving the school representatives to organize the available school data in the five data forms (see the summary report of the cluster level workshops in Appendix 2).
With the changed strategy, therefore, the schools are increasingly taking the ownership of generating, managing and making use of the information. As a consequence, the analysis of the trend and pattern of change in the indicators over time has shown incremental improvements. However, to help schools to bring about the transformation in their existing seemingly ad-hoc approach to keeping school records is a highly challenging and time consuming task for the study team. Nonetheless, experiences in the workshops have been encouraging and indicative that a system of improved school based information will evolve after about 2-3 rounds of workshops in the successive years.
Clusters
The 62 sampled schools belonging to 16 districts have been categorized into 7 clusters—two clusters in Morang and one each in Lalitpur, Chitwan, Kaski, Banke and Kailali. Each cluster catered for 7 to 16 schools belonging to 2 to 3 districts. Accessibility and convenience of the participants was taken into consideration while determining the clusters. The 62 schools are located in 29 VDCs and 25 wards in the 16 districts.
Table 1: No. of schools by district and cluster
Cluster District No. of School Morang 1 Dhankuta
Sankhuwashabha 3 4
Morang 2 Ilam Morang
4 5
Lalitpur Rasuwa Kabhre Lalitpur
3 5 4
Chitwan Chitwan Kapilvastu
4 4
Kaski Kaski Syangja
5 4
Banke Banke Surkhet
3 4
Kailali Kailali Dadeldhura Darchula
4 3 3

Longitudinal Study on System Indicators 7
Capacity Building Workshop3
As already mentioned above, workshops have been organized for relevant school teachers, VDC/Municipality representatives, District Education Officers and DEO representatives, Regional Education Directorate representative at the cluster level. The Department of Education and concerned District Education Office took necessary measures to communicate with the schools and local bodies to bring-in appropriate participants along with school and community data to the workshop as well as to determine the workshop venue and time.
A pilot workshop was first organized in Kaski (May 17-20, 2005) which was participated in by representatives of 9 schools (5 from Syangja and 4 from Kaski districts) and the respective VDCs/Municipalities. The main purpose of the workshop was to provide an opportunity to the concerned schools representatives and local bodies to assess the importance of establishing a school or local body based information system for effective planning, management and implementation of educational activities and school system. The workshop also provided a technically charged forum for them to consolidate specific information as sought by the FRP Longitudinal Study. The key idea behind organizing the workshop was that the quality of data to be used for the Longitudinal Study or (any other study for that matter) could be ensured only if the schools and community body took the ownership of their own data and also be able to use them for planning, managing and financing school improvement activities.
The pilot workshop was perceived as an effective initiative by the participants, local authorities and the central team. Henceforth, workshops of the same format and content were replicated in the rest of the 5 clusters. First round of these workshops have been completed in all the clusters. The researchers who were involved in the workshops continued visiting schools to follow up on the action plans that the school representatives developed during the workshop particularly to complete the data compilation task. While the improvement process with respect to the school-based EMIS will continue in the days to come, all 62 schools have completed the data compilation for the school year 2004-05 and sent them to CERID through either the visiting field researchers or postage/courier.
Almost all the workshops were participated by District Education Offices of the concerned districts, representatives of the Regional Education Directorates and representatives of the local bodies (29 VDCs and 25 Municipalities). The pilot workshop was facilitated by the Longitudinal Study Principal Researcher with the support of the Associate Researchers. The Executive Director of CERID and a representative of DOE had served as resource persons of specific sessions during the pilot workshop. A second workshop which was organized in Lalitpur for schools representing Rasuwa, Kabhre and Lalitpur was also participated by the CERID Executive Director, FRP Coordinator and Advisor, Central Region Education Director and the DEOs of all the three districts. The two initial workshops allowed the Associate Researchers, Research Assistants and support staff to be familiar with the workshop process and develop skill to organize similar workshops in other clusters.
The workshops have set the stage for the successive activities of the study. More importantly, the study has now progressed towards helping the 62 sample schools establish their own EMIS. 3 The workshop details are attached as Appendix 2.

FRP Report 8
The Longitudinal Study’s revised approach to the identification of indicators and data collection is summarized in the following bullet points:
Strategies of data collection have been clarified to suit the changed context (BPEP II to EFA) among the stakeholders, researchers and the data providers (schools).
Indicators have been consolidated in consultation with MOES, DOE, resource persons and advisors. Attempts are made to ensure the continuity of the study’s original idea particularly by retaining as many initial indicators as possible and keeping track of the changes over time in such indicators.
The process of continuous interaction and consultation has been ensured.
Tools have been revisited and revised to make them relevant and school-friendly.
Development of data entry software contracted to a local consultant
The 62 sampled schools have been categorized into 6 clusters of districts (of 7 to 16 schools in each cluster) based on their geographical location.
Cluster-wise data collection workshop strategy and plans developed. Workshops in all 6 clusters completed and data collected.
Relevant representatives of the MOES and DOE have taken part as resource persons or participants in the cluster level data generating workshops that helped omni-directional capacity building.
Researchers have been mobilized to enter the data in MS Excel.
Researchers have also been mobilized to computerize the pending data collected in the previous years (BS 2059 and 2060).
The problem of tracking individual children’s progress in the successive years for “cohort” analysis has been resolved to some extent by manually assigning temporary identification numbers.
Hard-copies of data files of 2004-05 school year and analysis of some pertinent indicators of all the sampled schools have been compiled and relevant files sent to individual schools for their record, verification as well as use and updating.
The promotion, repetition and dropout number of students (separate for boys, girls and total) were placed in cohort flow model and sent to all the sampled schools for the schools to have the know-how about the possible error and measures to correct them (see Appendix 4).
Scope and Delimitations
The strategy of linking the system indicator study and in-depth qualitative case studies has not been successfully translated into reality. The problem seems to lie on the complexity aroused from management and planning of the study activities and the time lapse to start the longitudinal study during the initial two years.
The study’s attempt to build capacity of schools in the school-based EMIS may raise question as to where its scope should limit. Is the current strategy of data collection appropriate? Will the 62 schools continue being representative of the overall national context? Nevertheless, it is assumed that the debate around the accurate

Longitudinal Study on System Indicators 9
representation of the school sample is less important compared to the results that the analysis would yield. Important trends and statistical patterns among the 62 schools would be demonstrated which could form the basis for the government to manoeuvre its policies and strategies and appropriate them according to the EFA needs.
Concern may also be raised about the appropriateness of the study’s intervention for capacity building and the impact it may have on school management (and expecting the process to be systematically adopted in the 62 schools). Again the question is will the sampled schools continue representing the national system?
Selection of the 62 schools raised issues of appropriateness and representation. They were selected from areas close to road-heads. The scenario from less accessible schools has not been taken into consideration.
FRP Report 10
CHAPTER III
PRESENTATION AND ANALYSIS OF DATA: STATUS OF
INDICATORS
The study has so far compiled the school based statistics of the 62 sampled schools for the six successive years with the data of the academic year 1999 as the base year. In the case of some indicators, data have been collected only since 2001 or 2002. As there has been a shift of focus from BPEP II to EFA since 2004, trend analysis has been presented accordingly. As well, the information required or sought for some indicators, e.g. primary school age children in the school catchments compared with school going children were not available at the schools, VDCs or municipality wards. Hence, they are left unreported. Similarly, the process of analyzing and reporting the student cohort data encountered problem due to the incomplete reporting of key information by almost 50% sampled schools. While the cohort analysis of available children is being carried out and the result will be available in due course, comparative figures on some indicators specific to the 6 program components of EFA are available for interpretation.
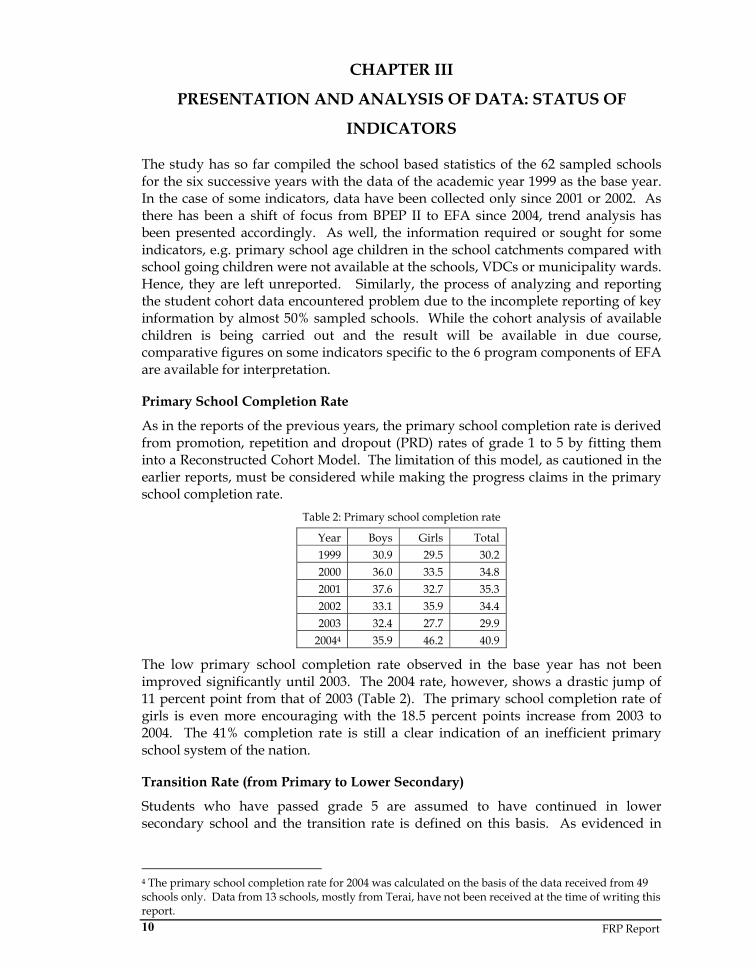
Primary School Completion Rate
As in the reports of the previous years, the primary school completion rate is derived from promotion, repetition and dropout (PRD) rates of grade 1 to 5 by fitting them into a Reconstructed Cohort Model. The limitation of this model, as cautioned in the earlier reports, must be considered while making the progress claims in the primary school completion rate.
Table 2: Primary school completion rate
Year Boys Girls Total 1999 30.9 29.5 30.2 2000 36.0 33.5 34.8 2001 37.6 32.7 35.3 2002 33.1 35.9 34.4 2003 32.4 27.7 29.9
20044 35.9 46.2 40.9
The low primary school completion rate observed in the base year has not been improved significantly until 2003. The 2004 rate, however, shows a drastic jump of 11 percent point from that of 2003 (Table 2). The primary school completion rate of girls is even more encouraging with the 18.5 percent points increase from 2003 to 2004. The 41% completion rate is still a clear indication of an inefficient primary school system of the nation.
Transition Rate (from Primary to Lower Secondary)
Students who have passed grade 5 are assumed to have continued in lower secondary school and the transition rate is defined on this basis. As evidenced in
4 The primary school completion rate for 2004 was calculated on the basis of the data received from 49 schools only. Data from 13 schools, mostly from Terai, have not been received at the time of writing this report.
Longitudinal Study on System Indicators 11
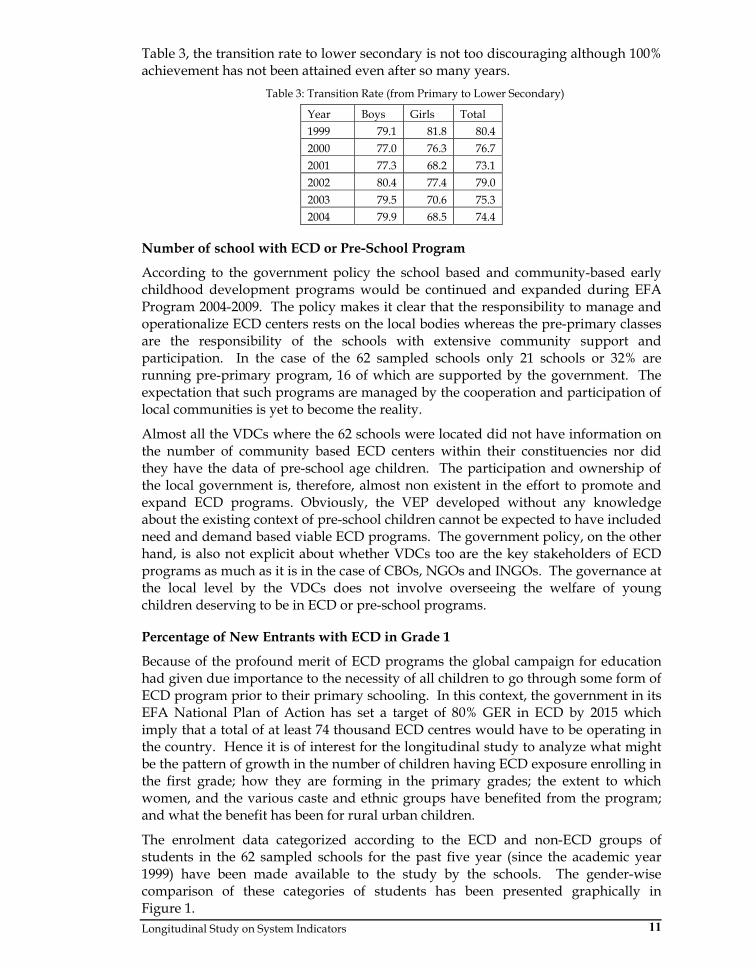
Table 3, the transition rate to lower secondary is not too discouraging although 100% achievement has not been attained even after so many years. Table 3: Transition Rate (from Primary to Lower Secondary)
Year Boys Girls Total 1999 79.1 81.8 80.4 2000 77.0 76.3 76.7 2001 77.3 68.2 73.1 2002 80.4 77.4 79.0 2003 79.5 70.6 75.3 2004 79.9 68.5 74.4
Number of school with ECD or Pre-School Program
According to the government policy the school based and community-based early childhood development programs would be continued and expanded during EFA Program 2004-2009. The policy makes it clear that the responsibility to manage and operationalize ECD centers rests on the local bodies whereas the pre-primary classes are the responsibility of the schools with extensive community support and participation. In the case of the 62 sampled schools only 21 schools or 32% are running pre-primary program, 16 of which are supported by the government. The expectation that such programs are managed by the cooperation and participation of local communities is yet to become the reality.
Almost all the VDCs where the 62 schools were located did not have information on the number of community based ECD centers within their constituencies nor did they have the data of pre-school age children. The participation and ownership of the local government is, therefore, almost non existent in the effort to promote and expand ECD programs. Obviously, the VEP developed without any knowledge about the existing context of pre-school children cannot be expected to have included need and demand based viable ECD programs. The government policy, on the other hand, is also not explicit about whether VDCs too are the key stakeholders of ECD programs as much as it is in the case of CBOs, NGOs and INGOs. The governance at the local level by the VDCs does not involve overseeing the welfare of young children deserving to be in ECD or pre-school programs.
Percentage of New Entrants with ECD in Grade 1
Because of the profound merit of ECD programs the global campaign for education had given due importance to the necessity of all children to go through some form of ECD program prior to their primary schooling. In this context, the government in its EFA National Plan of Action has set a target of 80% GER in ECD by 2015 which imply that a total of at least 74 thousand ECD centres would have to be operating in the country. Hence it is of interest for the longitudinal study to analyze what might be the pattern of growth in the number of children having ECD exposure enrolling in the first grade; how they are forming in the primary grades; the extent to which women, and the various caste and ethnic groups have benefited from the program; and what the benefit has been for rural urban children.
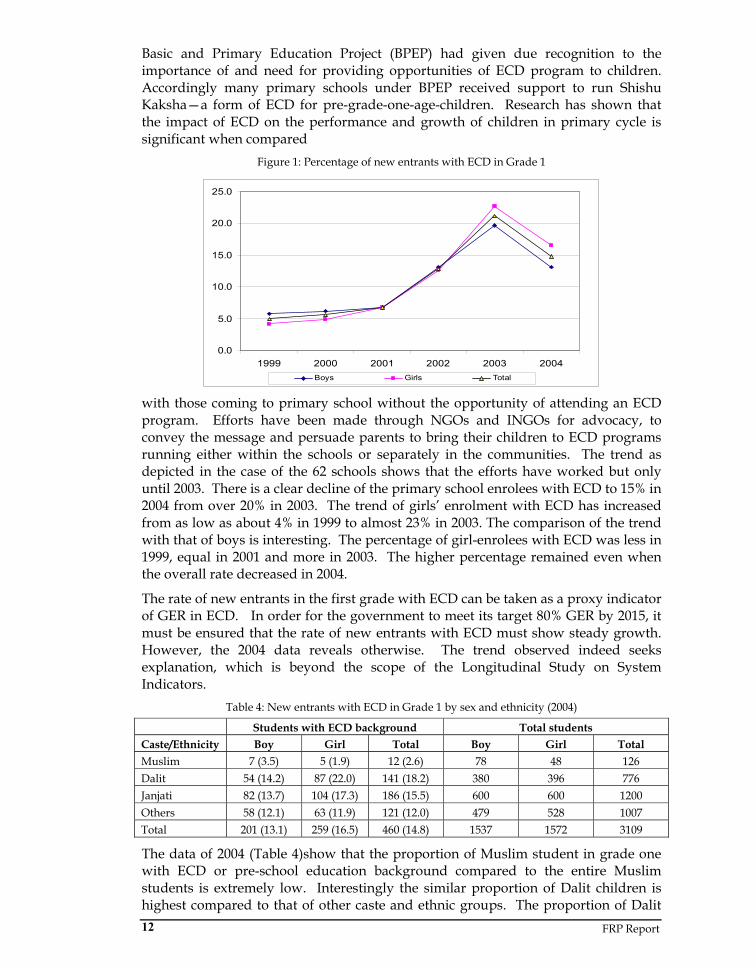
The enrolment data categorized according to the ECD and non-ECD groups of students in the 62 sampled schools for the past five year (since the academic year 1999) have been made available to the study by the schools. The gender-wise comparison of these categories of students has been presented graphically in Figure 1.
FRP Report 12
0.0
5.0
10.0
15.0
20.0
25.0
1999 2000 2001 2002 2003 2004Boys Girls Total
Basic and Primary Education Project (BPEP) had given due recognition to the importance of and need for providing opportunities of ECD program to children. Accordingly many primary schools under BPEP received support to run Shishu Kaksha—a form of ECD for pre-grade-one-age-children. Research has shown that the impact of ECD on the performance and growth of children in primary cycle is significant when compared
Figure 1: Percentage of new entrants with ECD in Grade 1
with those coming to primary school without the opportunity of attending an ECD program. Efforts have been made through NGOs and INGOs for advocacy, to convey the message and persuade parents to bring their children to ECD programs running either within the schools or separately in the communities. The trend as depicted in the case of the 62 schools shows that the efforts have worked but only until 2003. There is a clear decline of the primary school enrolees with ECD to 15% in 2004 from over 20% in 2003. The trend of girls’ enrolment with ECD has increased from as low as about 4% in 1999 to almost 23% in 2003. The comparison of the trend with that of boys is interesting. The percentage of girl-enrolees with ECD was less in 1999, equal in 2001 and more in 2003. The higher percentage remained even when the overall rate decreased in 2004.
The rate of new entrants in the first grade with ECD can be taken as a proxy indicator of GER in ECD. In order for the government to meet its target 80% GER by 2015, it must be ensured that the rate of new entrants with ECD must show steady growth. However, the 2004 data reveals otherwise. The trend observed indeed seeks explanation, which is beyond the scope of the Longitudinal Study on System Indicators.
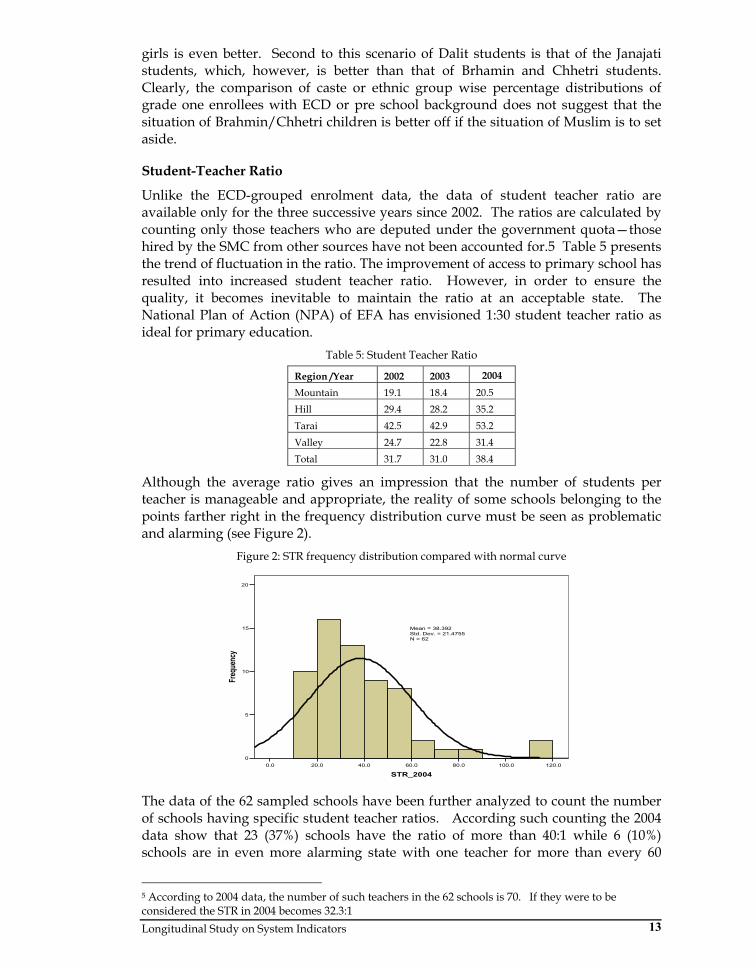
Table 4: New entrants with ECD in Grade 1 by sex and ethnicity (2004)
The data of 2004 (Table 4)show that the proportion of Muslim student in grade one with ECD or pre-school education background compared to the entire Muslim students is extremely low. Interestingly the similar proportion of Dalit children is highest compared to that of other caste and ethnic groups. The proportion of Dalit
Students with ECD background Total students Caste/Ethnicity Boy Girl Total Boy Girl Total Muslim 7 (3.5) 5 (1.9) 12 (2.6) 78 48 126 Dalit 54 (14.2) 87 (22.0) 141 (18.2) 380 396 776 Janjati 82 (13.7) 104 (17.3) 186 (15.5) 600 600 1200 Others 58 (12.1) 63 (11.9) 121 (12.0) 479 528 1007 Total 201 (13.1) 259 (16.5) 460 (14.8) 1537 1572 3109
Longitudinal Study on System Indicators 13
girls is even better. Second to this scenario of Dalit students is that of the Janajati students, which, however, is better than that of Brhamin and Chhetri students. Clearly, the comparison of caste or ethnic group wise percentage distributions of grade one enrollees with ECD or pre school background does not suggest that the situation of Brahmin/Chhetri children is better off if the situation of Muslim is to set aside.
Student-Teacher Ratio
Unlike the ECD-grouped enrolment data, the data of student teacher ratio are available only for the three successive years since 2002. The ratios are calculated by counting only those teachers who are deputed under the government quota—those hired by the SMC from other sources have not been accounted for.5 Table 5 presents the trend of fluctuation in the ratio. The improvement of access to primary school has resulted into increased student teacher ratio. However, in order to ensure the quality, it becomes inevitable to maintain the ratio at an acceptable state. The National Plan of Action (NPA) of EFA has envisioned 1:30 student teacher ratio as ideal for primary education.
Table 5: Student Teacher Ratio
Region /Year 2002 2003 2004
Mountain 19.1 18.4 20.5 Hill 29.4 28.2 35.2 Tarai 42.5 42.9 53.2 Valley 24.7 22.8 31.4 Total 31.7 31.0 38.4
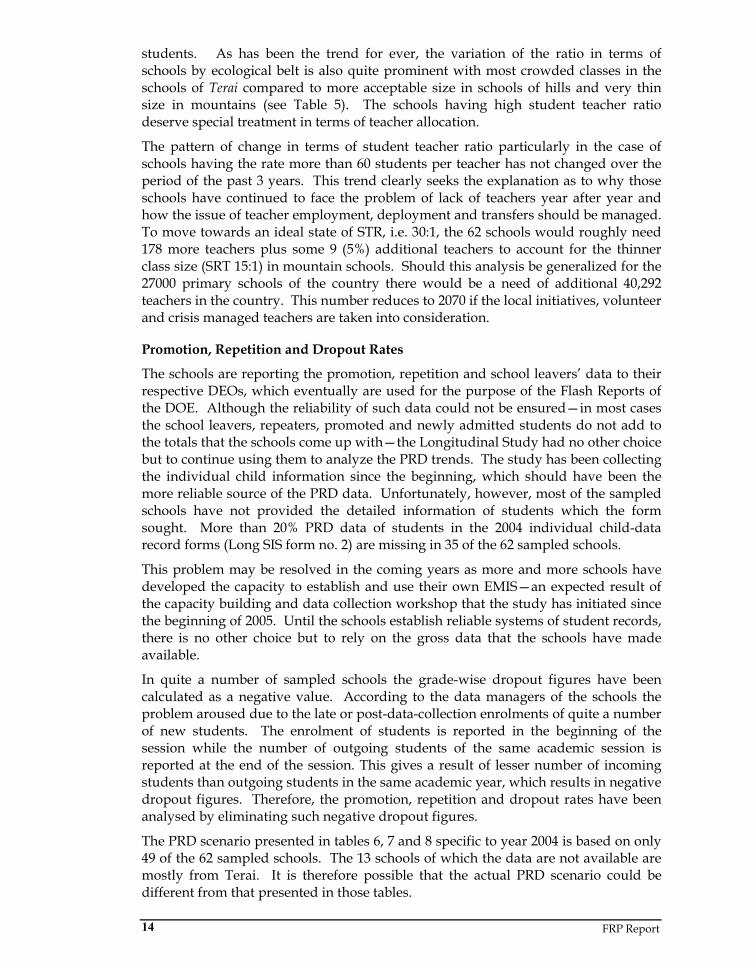
Although the average ratio gives an impression that the number of students per teacher is manageable and appropriate, the reality of some schools belonging to the points farther right in the frequency distribution curve must be seen as problematic and alarming (see Figure 2).
Figure 2: STR frequency distribution compared with normal curve
120.0100.080.060.040.020.00.0
STR_2004
20
15
10
5
0
Freq
uenc
y
Mean = 38.392Std. Dev. = 21.4755N = 62
The data of the 62 sampled schools have been further analyzed to count the number of schools having specific student teacher ratios. According such counting the 2004 data show that 23 (37%) schools have the ratio of more than 40:1 while 6 (10%) schools are in even more alarming state with one teacher for more than every 60
5 According to 2004 data, the number of such teachers in the 62 schools is 70. If they were to be considered the STR in 2004 becomes 32.3:1
FRP Report 14
students. As has been the trend for ever, the variation of the ratio in terms of schools by ecological belt is also quite prominent with most crowded classes in the schools of Terai compared to more acceptable size in schools of hills and very thin size in mountains (see Table 5). The schools having high student teacher ratio deserve special treatment in terms of teacher allocation.
The pattern of change in terms of student teacher ratio particularly in the case of schools having the rate more than 60 students per teacher has not changed over the period of the past 3 years. This trend clearly seeks the explanation as to why those schools have continued to face the problem of lack of teachers year after year and how the issue of teacher employment, deployment and transfers should be managed. To move towards an ideal state of STR, i.e. 30:1, the 62 schools would roughly need 178 more teachers plus some 9 (5%) additional teachers to account for the thinner class size (SRT 15:1) in mountain schools. Should this analysis be generalized for the 27000 primary schools of the country there would be a need of additional 40,292 teachers in the country. This number reduces to 2070 if the local initiatives, volunteer and crisis managed teachers are taken into consideration.
Promotion, Repetition and Dropout Rates
The schools are reporting the promotion, repetition and school leavers’ data to their respective DEOs, which eventually are used for the purpose of the Flash Reports of the DOE. Although the reliability of such data could not be ensured—in most cases the school leavers, repeaters, promoted and newly admitted students do not add to the totals that the schools come up with—the Longitudinal Study had no other choice but to continue using them to analyze the PRD trends. The study has been collecting the individual child information since the beginning, which should have been the more reliable source of the PRD data. Unfortunately, however, most of the sampled schools have not provided the detailed information of students which the form sought. More than 20% PRD data of students in the 2004 individual child-data record forms (Long SIS form no. 2) are missing in 35 of the 62 sampled schools.
This problem may be resolved in the coming years as more and more schools have developed the capacity to establish and use their own EMIS—an expected result of the capacity building and data collection workshop that the study has initiated since the beginning of 2005. Until the schools establish reliable systems of student records, there is no other choice but to rely on the gross data that the schools have made available.
In quite a number of sampled schools the grade-wise dropout figures have been calculated as a negative value. According to the data managers of the schools the problem aroused due to the late or post-data-collection enrolments of quite a number of new students. The enrolment of students is reported in the beginning of the session while the number of outgoing students of the same academic session is reported at the end of the session. This gives a result of lesser number of incoming students than outgoing students in the same academic year, which results in negative dropout figures. Therefore, the promotion, repetition and dropout rates have been analysed by eliminating such negative dropout figures.
The PRD scenario presented in tables 6, 7 and 8 specific to year 2004 is based on only 49 of the 62 sampled schools. The 13 schools of which the data are not available are mostly from Terai. It is therefore possible that the actual PRD scenario could be different from that presented in those tables.
Longitudinal Study on System Indicators 15
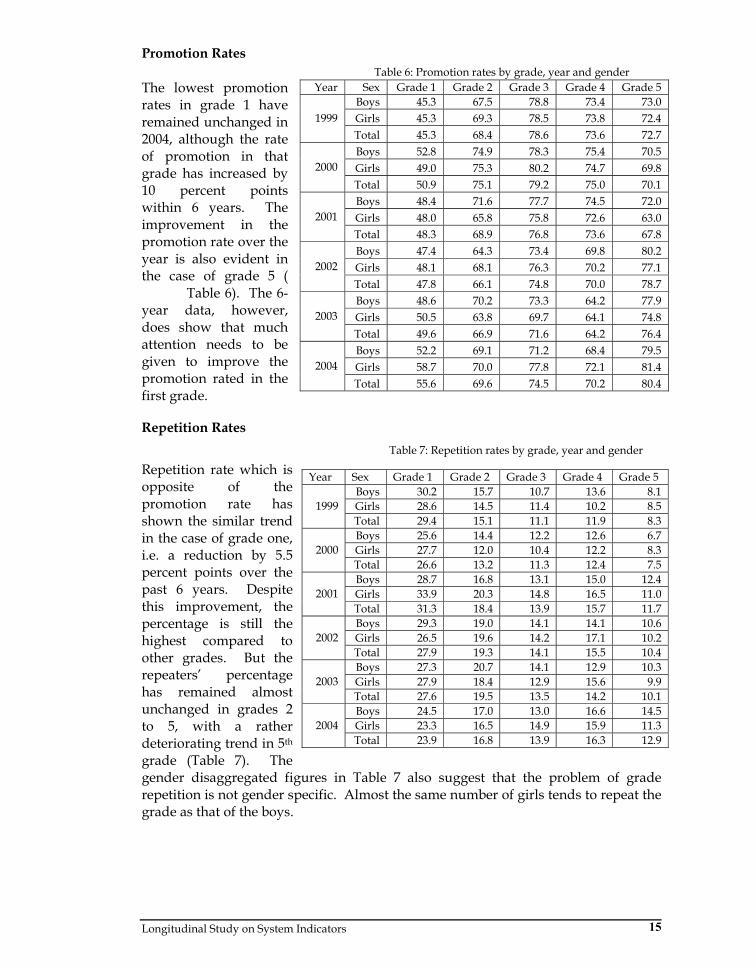
Promotion Rates Table 6: Promotion rates by grade, year and gender The lowest promotion rates in grade 1 have remained unchanged in 2004, although the rate of promotion in that grade has increased by 10 percent points within 6 years. The improvement in the promotion rate over the year is also evident in the case of grade 5 ( Table 6). The 6-year data, however, does show that much attention needs to be given to improve the promotion rated in the first grade.
Repetition Rates Table 7: Repetition rates by grade, year and gender
Repetition rate which is opposite of the promotion rate has shown the similar trend in the case of grade one, i.e. a reduction by 5.5 percent points over the past 6 years. Despite this improvement, the percentage is still the highest compared to other grades. But the repeaters’ percentage has remained almost unchanged in grades 2 to 5, with a rather deteriorating trend in 5th grade (Table 7). The gender disaggregated figures in Table 7 also suggest that the problem of grade repetition is not gender specific. Almost the same number of girls tends to repeat the grade as that of the boys.
Year Sex Grade 1 Grade 2 Grade 3 Grade 4 Grade 5 Boys 45.3 67.5 78.8 73.4 73.0 Girls 45.3 69.3 78.5 73.8 72.4 1999 Total 45.3 68.4 78.6 73.6 72.7 Boys 52.8 74.9 78.3 75.4 70.5 Girls 49.0 75.3 80.2 74.7 69.8 2000 Total 50.9 75.1 79.2 75.0 70.1 Boys 48.4 71.6 77.7 74.5 72.0 Girls 48.0 65.8 75.8 72.6 63.0 2001 Total 48.3 68.9 76.8 73.6 67.8 Boys 47.4 64.3 73.4 69.8 80.2 Girls 48.1 68.1 76.3 70.2 77.1 2002 Total 47.8 66.1 74.8 70.0 78.7 Boys 48.6 70.2 73.3 64.2 77.9 Girls 50.5 63.8 69.7 64.1 74.8 2003 Total 49.6 66.9 71.6 64.2 76.4 Boys 52.2 69.1 71.2 68.4 79.5 Girls 58.7 70.0 77.8 72.1 81.4 2004 Total 55.6 69.6 74.5 70.2 80.4
Year Sex Grade 1 Grade 2 Grade 3 Grade 4 Grade 5 Boys 30.2 15.7 10.7 13.6 8.1 Girls 28.6 14.5 11.4 10.2 8.5 1999 Total 29.4 15.1 11.1 11.9 8.3 Boys 25.6 14.4 12.2 12.6 6.7 Girls 27.7 12.0 10.4 12.2 8.3 2000 Total 26.6 13.2 11.3 12.4 7.5 Boys 28.7 16.8 13.1 15.0 12.4 Girls 33.9 20.3 14.8 16.5 11.0 2001 Total 31.3 18.4 13.9 15.7 11.7 Boys 29.3 19.0 14.1 14.1 10.6 Girls 26.5 19.6 14.2 17.1 10.2 2002 Total 27.9 19.3 14.1 15.5 10.4 Boys 27.3 20.7 14.1 12.9 10.3 Girls 27.9 18.4 12.9 15.6 9.9 2003 Total 27.6 19.5 13.5 14.2 10.1 Boys 24.5 17.0 13.0 16.6 14.5 Girls 23.3 16.5 14.9 15.9 11.3 2004 Total 23.9 16.8 13.9 16.3 12.9
FRP Report 16
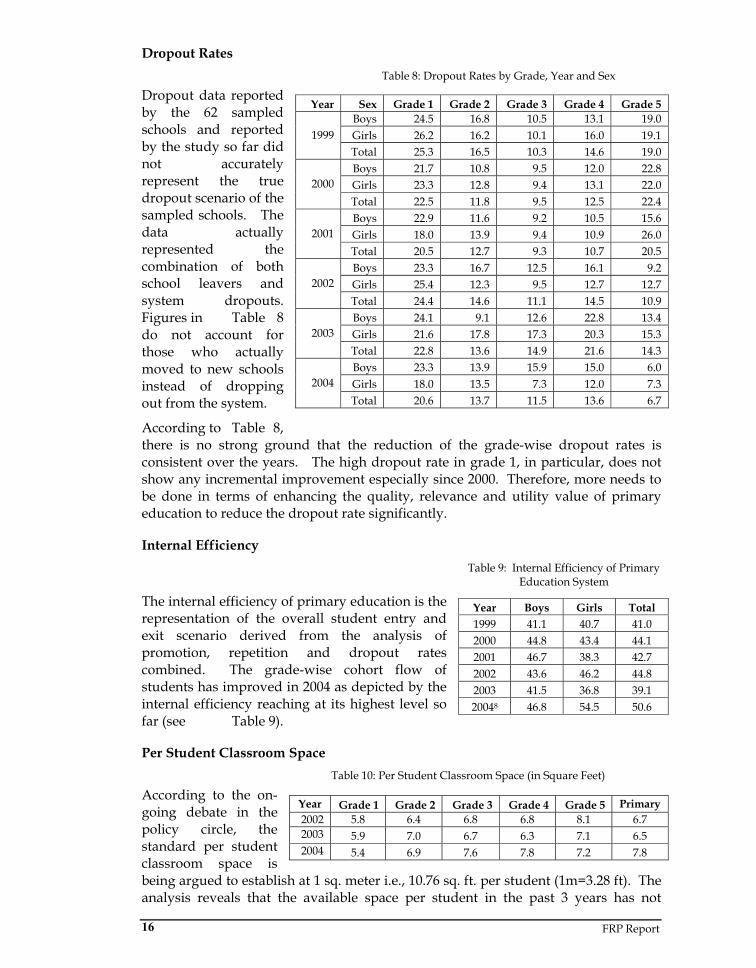
Dropout Rates Table 8: Dropout Rates by Grade, Year and Sex
Dropout data reported by the 62 sampled schools and reported by the study so far did not accurately represent the true dropout scenario of the sampled schools. The data actually represented the combination of both school leavers and system dropouts. Figures in Table 8 do not account for those who actually moved to new schools instead of dropping out from the system.
According to Table 8, there is no strong ground that the reduction of the grade-wise dropout rates is consistent over the years. The high dropout rate in grade 1, in particular, does not show any incremental improvement especially since 2000. Therefore, more needs to be done in terms of enhancing the quality, relevance and utility value of primary education to reduce the dropout rate significantly.
Internal Efficiency Table 9: Internal Efficiency of Primary Education System
The internal efficiency of primary education is the representation of the overall student entry and exit scenario derived from the analysis of promotion, repetition and dropout rates combined. The grade-wise cohort flow of students has improved in 2004 as depicted by the internal efficiency reaching at its highest level so far (see Table 9).
Per Student Classroom Space Table 10: Per Student Classroom Space (in Square Feet)
According to the on-going debate in the policy circle, the standard per student classroom space is being argued to establish at 1 sq. meter i.e., 10.76 sq. ft. per student (1m=3.28 ft). The analysis reveals that the available space per student in the past 3 years has not
Year Sex Grade 1 Grade 2 Grade 3 Grade 4 Grade 5 Boys 24.5 16.8 10.5 13.1 19.0 Girls 26.2 16.2 10.1 16.0 19.1 1999 Total 25.3 16.5 10.3 14.6 19.0 Boys 21.7 10.8 9.5 12.0 22.8 Girls 23.3 12.8 9.4 13.1 22.0 2000 Total 22.5 11.8 9.5 12.5 22.4 Boys 22.9 11.6 9.2 10.5 15.6 Girls 18.0 13.9 9.4 10.9 26.0 2001 Total 20.5 12.7 9.3 10.7 20.5 Boys 23.3 16.7 12.5 16.1 9.2 Girls 25.4 12.3 9.5 12.7 12.7 2002 Total 24.4 14.6 11.1 14.5 10.9 Boys 24.1 9.1 12.6 22.8 13.4 Girls 21.6 17.8 17.3 20.3 15.3 2003 Total 22.8 13.6 14.9 21.6 14.3 Boys 23.3 13.9 15.9 15.0 6.0 Girls 18.0 13.5 7.3 12.0 7.3 2004 Total 20.6 13.7 11.5 13.6 6.7
Year Boys Girls Total 1999 41.1 40.7 41.0 2000 44.8 43.4 44.1 2001 46.7 38.3 42.7 2002 43.6 46.2 44.8 2003 41.5 36.8 39.1 20048 46.8 54.5 50.6
Year Grade 1 Grade 2 Grade 3 Grade 4 Grade 5 Primary 2002 5.8 6.4 6.8 6.8 8.1 6.7 2003 5.9 7.0 6.7 6.3 7.1 6.5 2004 5.4 6.9 7.6 7.8 7.2 7.8

Longitudinal Study on System Indicators 17
improved to match the newly envisaged standard (see Table 10). Students in grade one, in particular, are continued to be neglected with the available space for them reduced to almost half this standard.
Incentive Program and Beneficiaries
In Table 11, the recent data (of 2004) clearly show that the number of scholarship recipients has substantially increased over the years (except in 2003). The increase in the number of Dalits and girls receiving the scholarship is encouraging. The recent data (of 2004) clearly show that the number of scholarship recipients has substantially increased over the years (except in 2003).
Table 11: Number of students by incentive program (2001- 2004) Scholarship type
Dalit Primary Learning Materials
Dress Poor and Intelligent
Disabled (others)
Special focus group
Total
Grades\Year Boy Girl
Girls
Boy Girl Boy Girl Boy Girl Boy Girl Boy Girl Boy Girl Boy Girl Grade 1
2001 2002 2003 2004
56 74 22
231
37 80 26
232
59 21
1 181
2 2 - -
3 8 - -
- 2 - 7
1 2 - 2
- 4 -
36
- 6 -
33
1 2 - 4
2 5 3
38
- - -
10
- - -
20
- - - 1
- 4 -
20
59 84 22
815
102 126
30 1399
Grade 2 2001 2002 2003 2004
48 44 16
173
41 75 16
138
32 21
- 199
1 3 - -
6
18 1 -
- 1 - 6
- 2 -
18
- 2 -
30
1 9 -
32
1 - -
11
10
5 3
15
- - - 1
- - - 2
- - - -
- 4
46
50 50 16
221
90
134 20
452 Grade 3
2001 2002 2003 2004
32 51 13
130
31 54 10
125
28 22
- 199
1 4 - -
8
13 1 -
- 3 - 8
- 1 -
15
- 4 -
12
- 3 -
23
1 2 -
10
6
10 2
29
- - - 2
1 - - 8
- - - -
- 4
24
34 64 13
162
74
107 13
416 Grade 4
2001 2002 2003 2004
39 42 13
142
20 40
8 116
34 24
1 181
2 4 - -
11
5 - -
- 1 -
16
- 2
11
- 3 -
20
- - -
22
2 1 -
28
3 2 2
29
- - - 1
2 - - 6
- - - -
- 4 -
24
43 51 13
207
79 77 11
389 Grade 5
2001 2002 2003 2004
30 38 12
100
22 29 13
104
25 13
1 134
- 4
3 3 1
- 3
2
- 2
12
- 3
34
- 3
35
- 2 1 8
5 3 2
23
- -
- -
6
- -
- 4
20
30 50 13
146
55 57 17
344 Total 2001 2002 2003 2004
205 249 76
776
160 278
73 715
178 101
3 894
6
17 - -
31 47
3 -
-
10 -
39
1 9 -
58
-
16 -
132
1
21 -
145
5 7 1
61
26 25 12
134
- - -
14
3 - -
42
- - - 1
-
20 -
134
216 299 77
1551
400 501
91 3000
The challenge for the schools now is to demonstrate that students, particularly from Dalit and ethnic minority communities including girls, are not only retained throughout the primary education cycle but also are regularly attending the school, performing better and continuing to pursue education in upper grades. However, it is clear that the number has not increased (see Table 12), nor is there any significant improvement in the learning achievement—in fact, the average scores of grade 1 Nepali and Math have gone down (see Table 17).
Student Enrolment
The GER and NER in the contexts of the catchments of the 62 sampled schools have remained unknown as the concerned VDCs/municipality wards have not carried out the mapping of the school aged children’s population and their educational attainment status in their respective communities. The mapping exercise has not taken place in those VDCs and municipality wards even after their representatives

FRP Report 18
started attending the cluster level data collection workshops organized by the Longitudinal Study for the past 2 years. Without the VDCs/municipalities taking initiatives to map the key educational scenario in their respective constituencies and becoming familiar with the critical educational issues they could not be expected to have genuinely engaged in the development of VEPs.
The enrolment of Dalits in all five primary grades has not increased in the past 3 years (Table 12). But on the other hand, the enrolment of Muslim children, notably that of the girls as well, has doubled in the same period. However, due to the lack of information (data) from community level (VDC/Municipality) on the actual population of Muslim in the area, it is difficult to estimate the real out-of-school children belonging to this caste group.
Table 12: Student enrolment by ethnicity and caste (2002-2004) Grade 1 Grade 2 Grade 3 Grade 4 Grade 5 Total
Boy Girl Boy Girl Boy Girl Boy Girl Boy Girl Boy Girl Total Dalit 2002 373 389 257 218 209 184 208 181 160 155 1207 1127 2334 2003 468 358 272 259 225 195 219 193 203 182 1367 1187 2554 2004 380 396 240 222 186 200 199 180 146 151 1151 1149 2300
Muslim 2002 22 23 29 14 13 9 23 7 8 4 95 57 152 2003 56 38 40 31 39 30 28 18 31 28 194 145 339 2004 78 48 35 23 27 21 24 19 20 10 184 121 305
Ethnic1 2002 - - - - - - - - - - - - - 2003 - - - - - - - - - - - - - 2004 600 600 465 502 426 504 491 488 483 459 2465 2553 5018
Others1 2002 - - - - - - - - - - - - - 2003 - - - - - - - - - - - - - 2004 479 528 343 414 345 388 438 451 433 439 2038 2220 4258 Total 2002 1699 1784 1377 1292 1281 1152 1302 1173 1090 996 6749 6397 13146 2003 1705 1655 1206 1306 1235 1173 1429 1254 1170 1044 6745 6432 13177 2004 1537 1572 1083 1161 984 1113 1152 1138 1082 1059 5838 6043 11881
1 Disaggregated data of 2002 and 2003 according to ethnic and other caste groups are available except those of grade 1 in 2002 and grades 1 and 2 in 2003.
According to the census 2001 data, Muslims primary school age (5-9 years) children constitute 5% of the total national primary school age population. The number of Muslim students in the 62 sampled schools, however, is only 305 which constitute only 2.6% of the total students in 2004 (Table 12). Dalit children enrolled in the 62 schools, primary school age children of which constitute 20% (source??) of the total national primary school age population, however, represent 19.3% of the total students, which is quite encouraging. This shows that the affirmative measures and strategies (e.g. Dalit scholarships) taken to bring Dalit children to primary school is paying off. The enrolment scenario of Muslim children, however, is a rough indication that higher proportion of Muslim children are still out of primary school compared to that of those belonging to other caste groups. The scenario also begs an explanation as to how the government’s strategy of targeting the special focus groups and poor families is translated into practice; how the strategy of supporting the parents has been implemented; and if the strategy, as envisaged, has helped
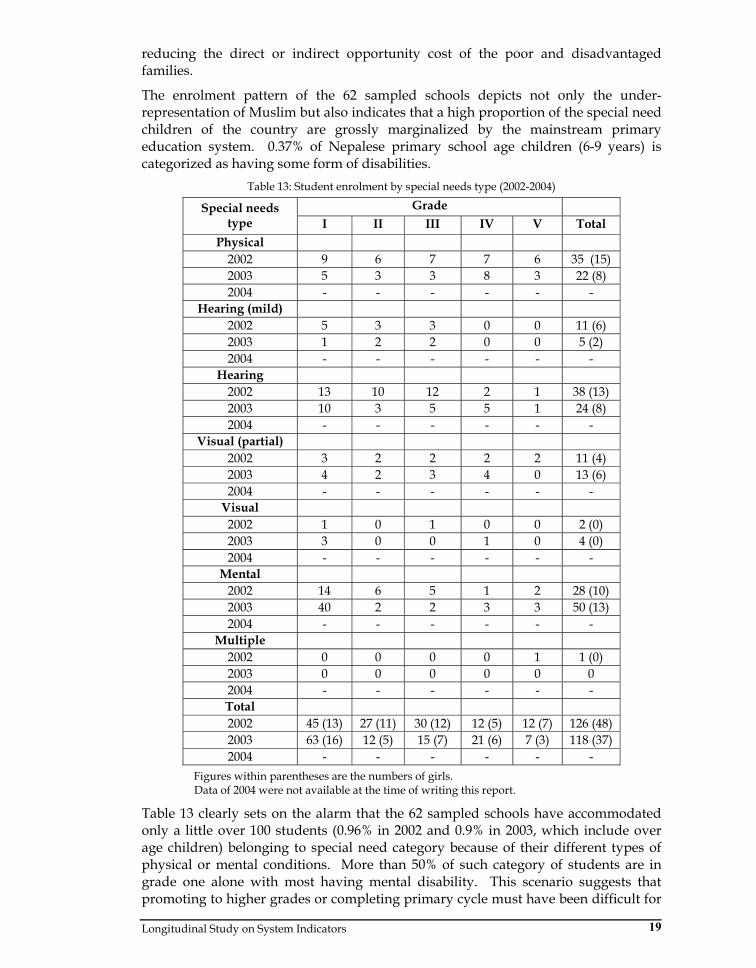
Longitudinal Study on System Indicators 19
reducing the direct or indirect opportunity cost of the poor and disadvantaged families.
The enrolment pattern of the 62 sampled schools depicts not only the under-representation of Muslim but also indicates that a high proportion of the special need children of the country are grossly marginalized by the mainstream primary education system. 0.37% of Nepalese primary school age children (6-9 years) is categorized as having some form of disabilities.
Table 13: Student enrolment by special needs type (2002-2004)
Grade Special needs type I II III IV V Total
Physical 2002 9 6 7 7 6 35 (15) 2003 5 3 3 8 3 22 (8) 2004 - - - - - -
Hearing (mild) 2002 5 3 3 0 0 11 (6) 2003 1 2 2 0 0 5 (2) 2004 - - - - - -
Hearing 2002 13 10 12 2 1 38 (13) 2003 10 3 5 5 1 24 (8) 2004 - - - - - -
Visual (partial) 2002 3 2 2 2 2 11 (4) 2003 4 2 3 4 0 13 (6) 2004 - - - - - -
Visual 2002 1 0 1 0 0 2 (0) 2003 3 0 0 1 0 4 (0) 2004 - - - - - -
Mental 2002 14 6 5 1 2 28 (10) 2003 40 2 2 3 3 50 (13) 2004 - - - - - -
Multiple 2002 0 0 0 0 1 1 (0) 2003 0 0 0 0 0 0 2004 - - - - - - Total 2002 45 (13) 27 (11) 30 (12) 12 (5) 12 (7) 126 (48) 2003 63 (16) 12 (5) 15 (7) 21 (6) 7 (3) 118 (37) 2004 - - - - - -
Figures within parentheses are the numbers of girls. Data of 2004 were not available at the time of writing this report.
Table 13 clearly sets on the alarm that the 62 sampled schools have accommodated only a little over 100 students (0.96% in 2002 and 0.9% in 2003, which include over age children) belonging to special need category because of their different types of physical or mental conditions. More than 50% of such category of students are in grade one alone with most having mental disability. This scenario suggests that promoting to higher grades or completing primary cycle must have been difficult for

FRP Report 20
a large number of special need children. Unless schools make conscious and individualized effort to fulfil their educational needs the problem of equity with regards to them is likely to remain unresolved. The policy and strategies of inclusive education is, therefore, far from being realized at the implementation level when it comes to integrating and including the differently able but requiring special educational needs school-age-children of the country in the mainstream primary education system.
Enrolment Growth Pattern (1999-2004)
According to Figure 3 the growth of student enrolment is prominent in 4th and 5th grades. The number of children in grade 5 has increased by 50% from what it was 5 years ago. That of grade 4 is 40%.
Figure 3: Enrolment growth pattern
70.00
80.00
90.00
100.00
110.00
120.00
130.00
140.00
150.00
160.00
1999 2000 2001 2002 2003 2004
Grade 1 Grade 2 Grade 3 Grade 4 Grade 5 Total
Representation of Women and Minority Groups in Teaching Profession
Gender parity and representation of minority groups in the student enrolment, teachers’ composition and in the management and leadership roles are some of the important aspects to be examined in order to monitor how the policy of ensuring access of all children to education and making it all inclusive.
The gender parity of the students of primary grade has shown a positive growth in the year 2004 compared to previous years (Figure 4).
Figure 4: Gender parity index of students of primary grade
Gender Parity
0.80
0.85
0.90
0.95
1.00
1.05
1999 2000 2001 2002 2003 2004
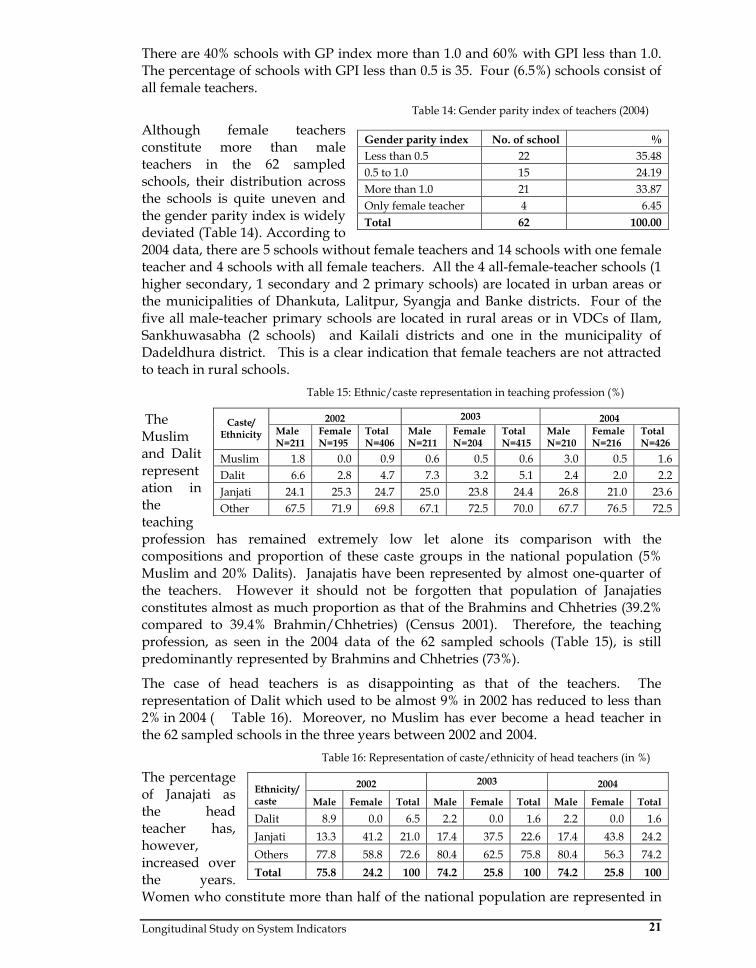
Longitudinal Study on System Indicators 21
There are 40% schools with GP index more than 1.0 and 60% with GPI less than 1.0. The percentage of schools with GPI less than 0.5 is 35. Four (6.5%) schools consist of all female teachers. Table 14: Gender parity index of teachers (2004)
Although female teachers constitute more than male teachers in the 62 sampled schools, their distribution across the schools is quite uneven and the gender parity index is widely deviated (Table 14). According to 2004 data, there are 5 schools without female teachers and 14 schools with one female teacher and 4 schools with all female teachers. All the 4 all-female-teacher schools (1 higher secondary, 1 secondary and 2 primary schools) are located in urban areas or the municipalities of Dhankuta, Lalitpur, Syangja and Banke districts. Four of the five all male-teacher primary schools are located in rural areas or in VDCs of Ilam, Sankhuwasabha (2 schools) and Kailali districts and one in the municipality of Dadeldhura district. This is a clear indication that female teachers are not attracted to teach in rural schools. Table 15: Ethnic/caste representation in teaching profession (%)
The Muslim and Dalit representation in the teaching profession has remained extremely low let alone its comparison with the compositions and proportion of these caste groups in the national population (5% Muslim and 20% Dalits). Janajatis have been represented by almost one-quarter of the teachers. However it should not be forgotten that population of Janajaties constitutes almost as much proportion as that of the Brahmins and Chhetries (39.2% compared to 39.4% Brahmin/Chhetries) (Census 2001). Therefore, the teaching profession, as seen in the 2004 data of the 62 sampled schools (Table 15), is still predominantly represented by Brahmins and Chhetries (73%).
The case of head teachers is as disappointing as that of the teachers. The representation of Dalit which used to be almost 9% in 2002 has reduced to less than 2% in 2004 ( Table 16). Moreover, no Muslim has ever become a head teacher in the 62 sampled schools in the three years between 2002 and 2004. Table 16: Representation of caste/ethnicity of head teachers (in %)
The percentage of Janajati as the head teacher has, however, increased over the years. Women who constitute more than half of the national population are represented in
Gender parity index No. of school % Less than 0.5 22 35.48 0.5 to 1.0 15 24.19 More than 1.0 21 33.87 Only female teacher 4 6.45 Total 62 100.00
2002 2003 2004 Caste/ Ethnicity Male
N=211 Female N=195
Total N=406
Male N=211
Female N=204
Total N=415
Male N=210
Female N=216
Total N=426
Muslim 1.8 0.0 0.9 0.6 0.5 0.6 3.0 0.5 1.6 Dalit 6.6 2.8 4.7 7.3 3.2 5.1 2.4 2.0 2.2 Janjati 24.1 25.3 24.7 25.0 23.8 24.4 26.8 21.0 23.6 Other 67.5 71.9 69.8 67.1 72.5 70.0 67.7 76.5 72.5
2002 2003 2004 Ethnicity/ caste Male Female Total Male Female Total Male Female Total
Dalit 8.9 0.0 6.5 2.2 0.0 1.6 2.2 0.0 1.6 Janjati 13.3 41.2 21.0 17.4 37.5 22.6 17.4 43.8 24.2 Others 77.8 58.8 72.6 80.4 62.5 75.8 80.4 56.3 74.2 Total 75.8 24.2 100 74.2 25.8 100 74.2 25.8 100

FRP Report 22
the leadership role at the primary level by only around one quarter. This proportion remained almost stagnant in the years 2002 through to 2004. On the whole, Table 16 clearly reveals that the representations of women, Dalit, Muslim and Janajati in the primary school leadership is far too short from being proportionate to the population composition of the nation.
Details of Grade 1 Cohort—Student Tracking
The 3-year cohort analysis by tracking individual children of the 62 sampled schools is on-going—100% coverage is not possible as systematic official identification number of primary school children is not available that has caused tracking difficulty in the successive academic years. The DOE has been working on assigning such number to every primary school child which the study is supposed to use. Since the process has taken longer time than expected, we have now assigned a 10-digit ID number to each student. Because of the absence of such ID in the previous years, there has been difficulty tracking more than 50% children listed in the base year. It is expected that with the establishment of the school based EMIS this problem will be resolved in the coming years.
The other problem encountered in analyzing the cohort data is that crucial data e.g. of promotion, repetition, dropout, and learning achievement of more than 50% students are left unreported in the questionnaire forms. As already mentioned in the earlier section, more than 20% PRD data of students in the 2004 individual child-data record forms (Long SIS form no. 2) are missing in 35 of the 62 sampled schools. It is a clear indication of the lack of schools’ ownership of the school data. Research assistants’ visit to schools for the purpose of collecting the data does not prove effective, especially when they are required to make regular and frequent visits.
This raises a serious question of reliability and validity of the data provided by the schools. In view of this, it is agreed among the key stakeholders of the FRP, that a more institutionalized approach to data generation, analysis and reporting should be initiated by the Longitudinal Study. This led the study to plan and organize data collection and capacity building workshops on school-base EMIS for school representatives and other local stakeholders. This new strategy that the study has taken as of 2004 is expected to address the problem of data quality.
Learning and Achievement
As usual the examination score in key primary subjects have been analyzed to make a sense about the extent to which children’s learning achievements have progressed over the years. The achievement scores of Nepali and Mathematics of Grade 1 and 3 and also English and Environment and Health of Grade 5 is analysed in the study.
Table 17: Percentage of achievement score in various primary subjects by grade and gender
Grade 1 Grade 3 Grade 5 Nepali Math Nepali Math Nepali Math English Env.& Health Year
Boys Girls Boys Girls Boys Girls Boys Girls Boys Girls Boys Girls Boys Girls Boys Girls 2001 35.0 34.6 38.4 36.1 38.2 37.4 38.4 35.3 26.9 28.0 23.1 22.5 25.6 25.8 28.4 29.3 2002 39.6 41.2 39.2 39.1 43.1 42.7 38.9 37.4 30.6 31.1 26.8 24.9 28.7 27.9 32.6 30.9 2003 34.8 35.5 35.9 35.1 39.8 40.8 37.4 36.0 30.6 31.6 27.1 25.7 30.2 29.8 32.8 32.6 2004 32.3 33.0 33.7 32.8 38.5 40.7 36.5 35.4 31.5 32.7 28.3 26.9 32.1 31.7 33.9 34.3
Table 17 depicts that achievement scores across all the subjects have not shown tangible progress over the years. Similarly scores of boys and girls also do not show any interesting gender-wise variation in all the subjects in the past 4 years. The
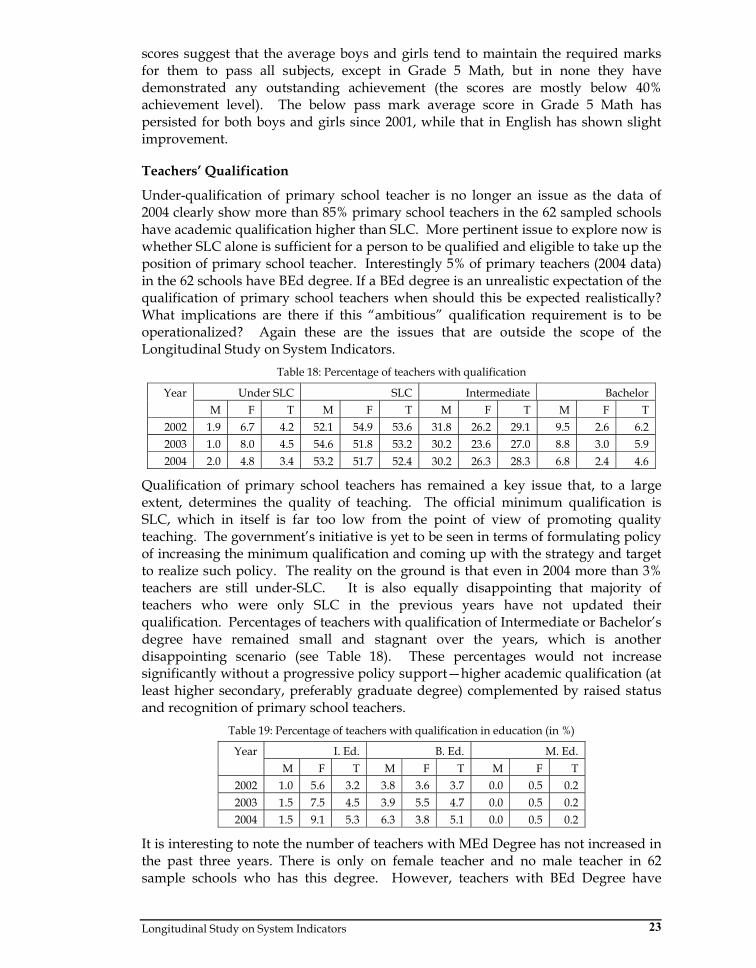
Longitudinal Study on System Indicators 23
scores suggest that the average boys and girls tend to maintain the required marks for them to pass all subjects, except in Grade 5 Math, but in none they have demonstrated any outstanding achievement (the scores are mostly below 40% achievement level). The below pass mark average score in Grade 5 Math has persisted for both boys and girls since 2001, while that in English has shown slight improvement.
Teachers’ Qualification
Under-qualification of primary school teacher is no longer an issue as the data of 2004 clearly show more than 85% primary school teachers in the 62 sampled schools have academic qualification higher than SLC. More pertinent issue to explore now is whether SLC alone is sufficient for a person to be qualified and eligible to take up the position of primary school teacher. Interestingly 5% of primary teachers (2004 data) in the 62 schools have BEd degree. If a BEd degree is an unrealistic expectation of the qualification of primary school teachers when should this be expected realistically? What implications are there if this “ambitious” qualification requirement is to be operationalized? Again these are the issues that are outside the scope of the Longitudinal Study on System Indicators.
Table 18: Percentage of teachers with qualification
Under SLC SLC Intermediate Bachelor Year M F T M F T M F T M F T
2002 1.9 6.7 4.2 52.1 54.9 53.6 31.8 26.2 29.1 9.5 2.6 6.2 2003 1.0 8.0 4.5 54.6 51.8 53.2 30.2 23.6 27.0 8.8 3.0 5.9 2004 2.0 4.8 3.4 53.2 51.7 52.4 30.2 26.3 28.3 6.8 2.4 4.6
Qualification of primary school teachers has remained a key issue that, to a large extent, determines the quality of teaching. The official minimum qualification is SLC, which in itself is far too low from the point of view of promoting quality teaching. The government’s initiative is yet to be seen in terms of formulating policy of increasing the minimum qualification and coming up with the strategy and target to realize such policy. The reality on the ground is that even in 2004 more than 3% teachers are still under-SLC. It is also equally disappointing that majority of teachers who were only SLC in the previous years have not updated their qualification. Percentages of teachers with qualification of Intermediate or Bachelor’s degree have remained small and stagnant over the years, which is another disappointing scenario (see Table 18). These percentages would not increase significantly without a progressive policy support—higher academic qualification (at least higher secondary, preferably graduate degree) complemented by raised status and recognition of primary school teachers.
Table 19: Percentage of teachers with qualification in education (in %)
I. Ed. B. Ed. M. Ed. Year M F T M F T M F T
2002 1.0 5.6 3.2 3.8 3.6 3.7 0.0 0.5 0.2 2003 1.5 7.5 4.5 3.9 5.5 4.7 0.0 0.5 0.2 2004 1.5 9.1 5.3 6.3 3.8 5.1 0.0 0.5 0.2
It is interesting to note the number of teachers with MEd Degree has not increased in the past three years. There is only on female teacher and no male teacher in 62 sample schools who has this degree. However, teachers with BEd Degree have

FRP Report 24
increased from 3.7% in 2002 to 5.1% in 2004. The increase in female percent which had been drastic in 2003 has been out numbered by male in 2004 (see Table 19).
Teachers’ Training Status
The National Centre for Education Development (NCED) is the responsible government department to ensure that all the primary school teachers are fully trained. Training plays critical role in all professions. In the case of the Nepalese primary school teachers, majority of whom have a maximum of SLC level of academic qualification, it is all the more important for them to invest adequate time to learn how to teach. NCED offers a 10-month training program packaged into 3 phased multiple modes modules— 1st phase of 2.5 months through face-to-face mode, 2nd phase of 5 months through distance mode and 3rd phase of 2.5 months through face-to-face mode. Teachers are certified after the completion of each phase of the training program.
Table 20: Percentage of teachers with teacher training certificate Year Male Female Total 2002 41.6 44.4 43.0 2003 60.0 56.1 58.1 2004 90.6 91.0 91.0
A clear progress is depicted in the number of primary teachers in the 62 sampled schools who have been through part or all of the 10-month training program offered by NCED. The change in the percentage of primary school teachers with teaching certificate is very drastic in the year 2004 with a jump of more than 30% point within one year (see
Figure 5). The percent of this category of teachers had reached 58% in 2003 from 43% in 2002 and 91% in 2004 (see Table 20). The 2004 data reveal that the difference in the proportions of male and female teachers having the certificate is extremely low compared to the former years. The rapid rise in the trend of teacher-percentage having the certificate in the three years since 2002 could be due to the government policy of mandatory teaching certificate for primary school teachers. The rapidly increasing trend of certified primary school teacher suggests that the government plan of achieving 99% licensed teachers by the end of 2009 would be fulfilled conveniently.
Table 21: Teachers with full training (in %)
Figure 5: Percentage of teachers with teacher training certificate
Percentage of Teachers with Teacher Training Certificate
43.0
58.1
91.0
0.010.020.030.040.050.060.070.080.090.0
100.0
2002 2003 2004
Year Male Female Total
2002 22.8 35.9 29.1
2003 35.7 42.9 39.3
2004 41.9 52.3 47.2
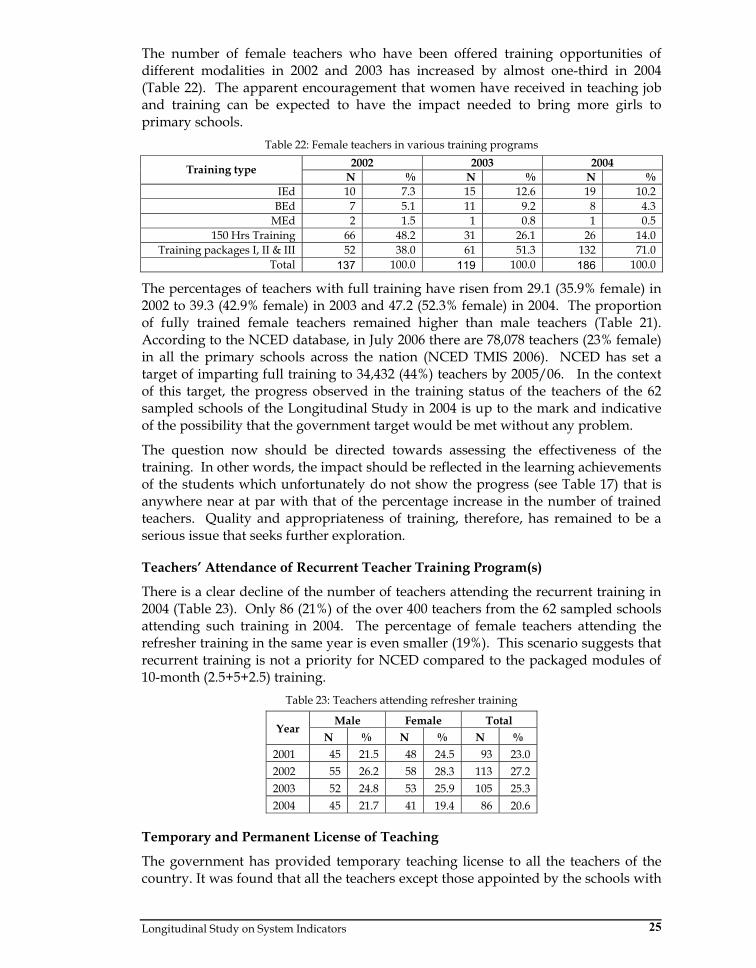
Longitudinal Study on System Indicators 25
The number of female teachers who have been offered training opportunities of different modalities in 2002 and 2003 has increased by almost one-third in 2004 (Table 22). The apparent encouragement that women have received in teaching job and training can be expected to have the impact needed to bring more girls to primary schools.
Table 22: Female teachers in various training programs 2002 2003 2004 Training type N % N % N %
IEd 10 7.3 15 12.6 19 10.2 BEd 7 5.1 11 9.2 8 4.3
MEd 2 1.5 1 0.8 1 0.5 150 Hrs Training 66 48.2 31 26.1 26 14.0
Training packages I, II & III 52 38.0 61 51.3 132 71.0 Total 137 100.0 119 100.0 186 100.0
The percentages of teachers with full training have risen from 29.1 (35.9% female) in 2002 to 39.3 (42.9% female) in 2003 and 47.2 (52.3% female) in 2004. The proportion of fully trained female teachers remained higher than male teachers (Table 21). According to the NCED database, in July 2006 there are 78,078 teachers (23% female) in all the primary schools across the nation (NCED TMIS 2006). NCED has set a target of imparting full training to 34,432 (44%) teachers by 2005/06. In the context of this target, the progress observed in the training status of the teachers of the 62 sampled schools of the Longitudinal Study in 2004 is up to the mark and indicative of the possibility that the government target would be met without any problem.
The question now should be directed towards assessing the effectiveness of the training. In other words, the impact should be reflected in the learning achievements of the students which unfortunately do not show the progress (see Table 17) that is anywhere near at par with that of the percentage increase in the number of trained teachers. Quality and appropriateness of training, therefore, has remained to be a serious issue that seeks further exploration.
Teachers’ Attendance of Recurrent Teacher Training Program(s)
There is a clear decline of the number of teachers attending the recurrent training in 2004 (Table 23). Only 86 (21%) of the over 400 teachers from the 62 sampled schools attending such training in 2004. The percentage of female teachers attending the refresher training in the same year is even smaller (19%). This scenario suggests that recurrent training is not a priority for NCED compared to the packaged modules of 10-month (2.5+5+2.5) training.
Table 23: Teachers attending refresher training
Male Female Total Year
N % N % N % 2001 45 21.5 48 24.5 93 23.0 2002 55 26.2 58 28.3 113 27.2 2003 52 24.8 53 25.9 105 25.3 2004 45 21.7 41 19.4 86 20.6
Temporary and Permanent License of Teaching
The government has provided temporary teaching license to all the teachers of the country. It was found that all the teachers except those appointed by the schools with
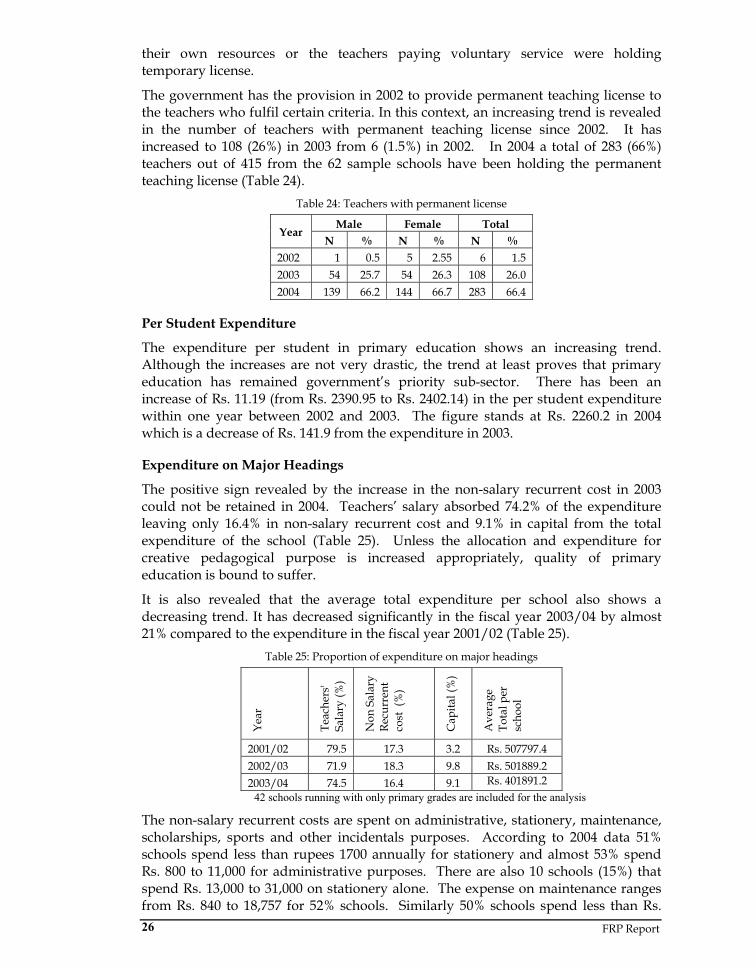
FRP Report 26
their own resources or the teachers paying voluntary service were holding temporary license.
The government has the provision in 2002 to provide permanent teaching license to the teachers who fulfil certain criteria. In this context, an increasing trend is revealed in the number of teachers with permanent teaching license since 2002. It has increased to 108 (26%) in 2003 from 6 (1.5%) in 2002. In 2004 a total of 283 (66%) teachers out of 415 from the 62 sample schools have been holding the permanent teaching license (Table 24).
Table 24: Teachers with permanent license
Male Female Total Year
N % N % N % 2002 1 0.5 5 2.55 6 1.5 2003 54 25.7 54 26.3 108 26.0 2004 139 66.2 144 66.7 283 66.4
Per Student Expenditure
The expenditure per student in primary education shows an increasing trend. Although the increases are not very drastic, the trend at least proves that primary education has remained government’s priority sub-sector. There has been an increase of Rs. 11.19 (from Rs. 2390.95 to Rs. 2402.14) in the per student expenditure within one year between 2002 and 2003. The figure stands at Rs. 2260.2 in 2004 which is a decrease of Rs. 141.9 from the expenditure in 2003.
Expenditure on Major Headings
The positive sign revealed by the increase in the non-salary recurrent cost in 2003 could not be retained in 2004. Teachers’ salary absorbed 74.2% of the expenditure leaving only 16.4% in non-salary recurrent cost and 9.1% in capital from the total expenditure of the school (Table 25). Unless the allocation and expenditure for creative pedagogical purpose is increased appropriately, quality of primary education is bound to suffer.
It is also revealed that the average total expenditure per school also shows a decreasing trend. It has decreased significantly in the fiscal year 2003/04 by almost 21% compared to the expenditure in the fiscal year 2001/02 (Table 25).
Table 25: Proportion of expenditure on major headings
Year
Teac
hers
' Sa
lary
(%)
Non
Sal
ary
Recu
rren
t co
st (
%)
Cap
ital (
%)
Ave
rage
To
tal p
er
scho
ol
2001/02 79.5 17.3 3.2 Rs. 507797.4 2002/03 71.9 18.3 9.8 Rs. 501889.2 2003/04 74.5 16.4 9.1 Rs. 401891.2
42 schools running with only primary grades are included for the analysis
The non-salary recurrent costs are spent on administrative, stationery, maintenance, scholarships, sports and other incidentals purposes. According to 2004 data 51% schools spend less than rupees 1700 annually for stationery and almost 53% spend Rs. 800 to 11,000 for administrative purposes. There are also 10 schools (15%) that spend Rs. 13,000 to 31,000 on stationery alone. The expense on maintenance ranges from Rs. 840 to 18,757 for 52% schools. Similarly 50% schools spend less than Rs.

Longitudinal Study on System Indicators 27
10,000 (ranging from 250) per annum for scholarships, which is an increase from Rs. 1900 only in 2002, and the same proportion of school spend less than Rs. 1800 in the entire year on sports.
Schools’ Income and Sources
The sources of income for the schools have not changed drastically in 2004, except that the government has taken increased financial responsibility—an increase of almost 11% point increase from the previous year. The share of income from local bodies (VDC/DDC/Municipalities) has reduced to 0.5% from 2.8% in 2003 and 5.8 in 2002, which is not a good sign in terms of the widely accepted view that management and ownership of primary schools be localized. With the growing expectation that the village education plan forms the main basis for funds allocation to primary schools, the DDC/VDC or municipality should have been the proper channel of fund flow to school, meaning that the share of income from the local body should have been the major source.
Table 26: Proportion of income by different sources
Year
Gov
t. A
id
DD
C/V
DC
/Mun
icip
ality
Aid
by
Oth
er
Org
anis
atio
n
Ow
n So
urce
of
Scho
ol
Con
trib
utio
n by
Lo
cal
Com
mun
ity
Pare
ntal
Sup
port
(S
tude
nt F
ees)
Oth
ers
2002 67.1 5.8 1.2 3.2 4.1 13.0 5.8 2003 78.9 2.8 1.0 1.5 1.3 6.7 7.7 2004 89.8 2.3 2.2 1.2 1.6 0.5 2.4
The percentage of income as aid by other non-governmental organisations has however increased to 2.2% in 2004 from 1.2 in 2002 and the contributions from individuals has decreased from 7.7% in 2003 to 2.4% in 2004. It is also interesting to note that student’s fee contributed 13% of total income of a school in 2002 which has a significant decline in the preceding years to 0.5% in 2004 (Table 27Table 26).
The contribution of Local community towards school and school’s own source in the income of the schools has also has a significant declination in the years.
Textbooks Availability
It has been revealed that the problem of weak textbook delivery mechanism in 2002 and 2003 has persisted in 2004 as only 37.8% of students received the textbooks in 2 weeks after the academic session began. The government’s policy of involving the private sector in the production and distribution of textbooks is yet to be effectively implemented.
Availability of Teaching Resources Table 27: Availability of different teaching aids (% of schools)
Year Curriculum
Subject Elaboration
Curriculum Directives
Teacher's Guide
Reference Books
2002 98.3 96.7 95.0 98.3 95.0 2003 96.6 94.8 94.8 94.8 93.1 2004 96.8 91.0 80.6 90.2 91.9
The remarkable trend observed in 2002 and 2003 in terms of the availability of various teaching aids has continued in 2004. More than 90% schools have not

FRP Report 28
experienced any problem of availability of the various teaching aids in the school, except the curriculum directives.
Availability of Library
More and more schools are setting up libraries and reading rooms available for students. As a result, in 2004, 56.5% of the 62 sampled schools have the library facility, a rise from 51.6% in 2003 and 35.5% in 2002. Over the years, more schools are also making effort to provide separate rooms either for the purpose of library or reading room for students.
Table 28: Availability of library and reading space
2002 2003 2004 Facilities
Number % Number % Number % Total Number of Schools 62 100.0 62 100.0 62 100.0 Number of Libraries 22 35.5 32 51.6 35 56.5 Library Rooms 8 12.9 11 17.7 13 21.0 Reading Space 8 12.9 11 17.7 10 16.1
Books and the Library
It is interesting to see greater percent of schools collecting materials other than textbook and teachers’ materials in 2004. The school libraries are found to have different types of books for the students as well as for teachers including textbooks and reference materials (Table 29).
Table 29: Types of books available in the library (%)
Type 2002 2003 2004 Textbooks 23.3 34.2 29.7 Reference Books 55.3 31.5 22.5 Others 13.0 28.4 47.8 Materials for Teachers 8.4 6.2 0 Total 100.0 100.0 100.0
Preparation of SIP
In 2004, out of the 62 sampled schools 60 have responded to the question whether they have prepared the SIP. Of the 60 schools 56 (93%) reported to have prepared SIPs and 4 did not. 52 (92%) schools claimed that the SIPs were implemented as planned.
Classroom Conditions Table 30: Construction and rehabilitation of classrooms
No. of rooms Year Plans for classroom
No. of schools
(Ref. SIP) Planned Progress
Construction 12 37 21 (56.8) 2002
Rehabilitation 13 36 19 (52.8)
Construction 9 24 5 (20.8) 2003
Rehabilitation 15 40 38 (95.0)
Construction 17 36 28 (77.8) 2004
Rehabilitation 20 58 34 (58.6)
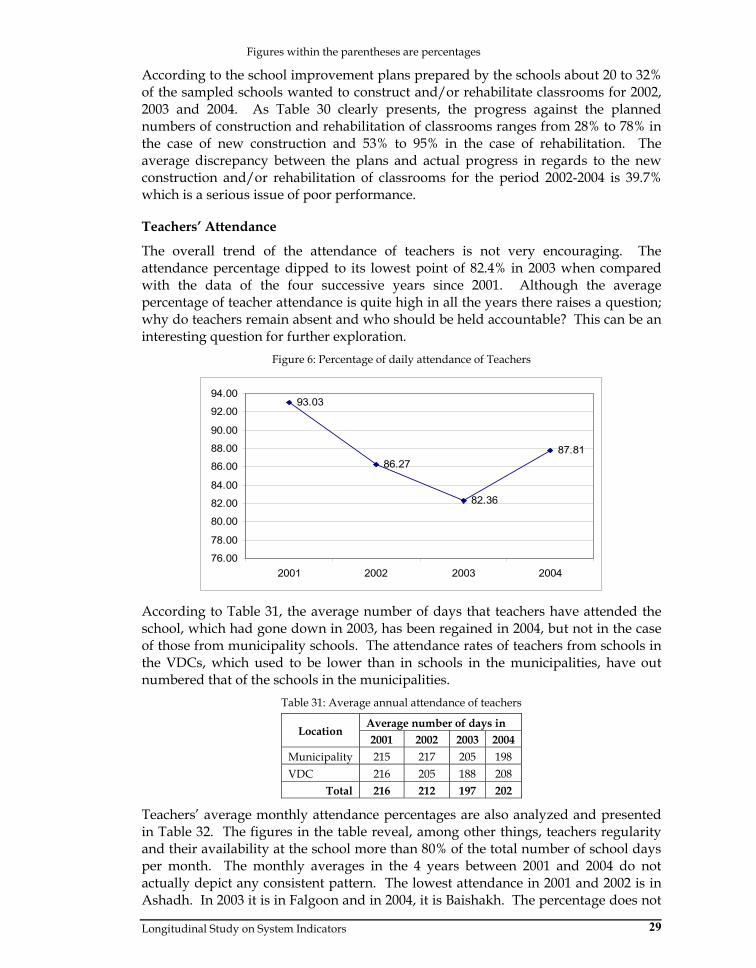
Longitudinal Study on System Indicators 29
Figures within the parentheses are percentages
According to the school improvement plans prepared by the schools about 20 to 32% of the sampled schools wanted to construct and/or rehabilitate classrooms for 2002, 2003 and 2004. As Table 30 clearly presents, the progress against the planned numbers of construction and rehabilitation of classrooms ranges from 28% to 78% in the case of new construction and 53% to 95% in the case of rehabilitation. The average discrepancy between the plans and actual progress in regards to the new construction and/or rehabilitation of classrooms for the period 2002-2004 is 39.7% which is a serious issue of poor performance.
Teachers’ Attendance
The overall trend of the attendance of teachers is not very encouraging. The attendance percentage dipped to its lowest point of 82.4% in 2003 when compared with the data of the four successive years since 2001. Although the average percentage of teacher attendance is quite high in all the years there raises a question; why do teachers remain absent and who should be held accountable? This can be an interesting question for further exploration.
Figure 6: Percentage of daily attendance of Teachers
93.03
86.27
82.36
87.81
76.00
78.00
80.00
82.00
84.00
86.00
88.00
90.00
92.00
94.00
2001 2002 2003 2004
According to Table 31, the average number of days that teachers have attended the school, which had gone down in 2003, has been regained in 2004, but not in the case of those from municipality schools. The attendance rates of teachers from schools in the VDCs, which used to be lower than in schools in the municipalities, have out numbered that of the schools in the municipalities.
Table 31: Average annual attendance of teachers
Average number of days in Location
2001 2002 2003 2004 Municipality 215 217 205 198 VDC 216 205 188 208
Total 216 212 197 202
Teachers’ average monthly attendance percentages are also analyzed and presented in Table 32. The figures in the table reveal, among other things, teachers regularity and their availability at the school more than 80% of the total number of school days per month. The monthly averages in the 4 years between 2001 and 2004 do not actually depict any consistent pattern. The lowest attendance in 2001 and 2002 is in Ashadh. In 2003 it is in Falgoon and in 2004, it is Baishakh. The percentage does not
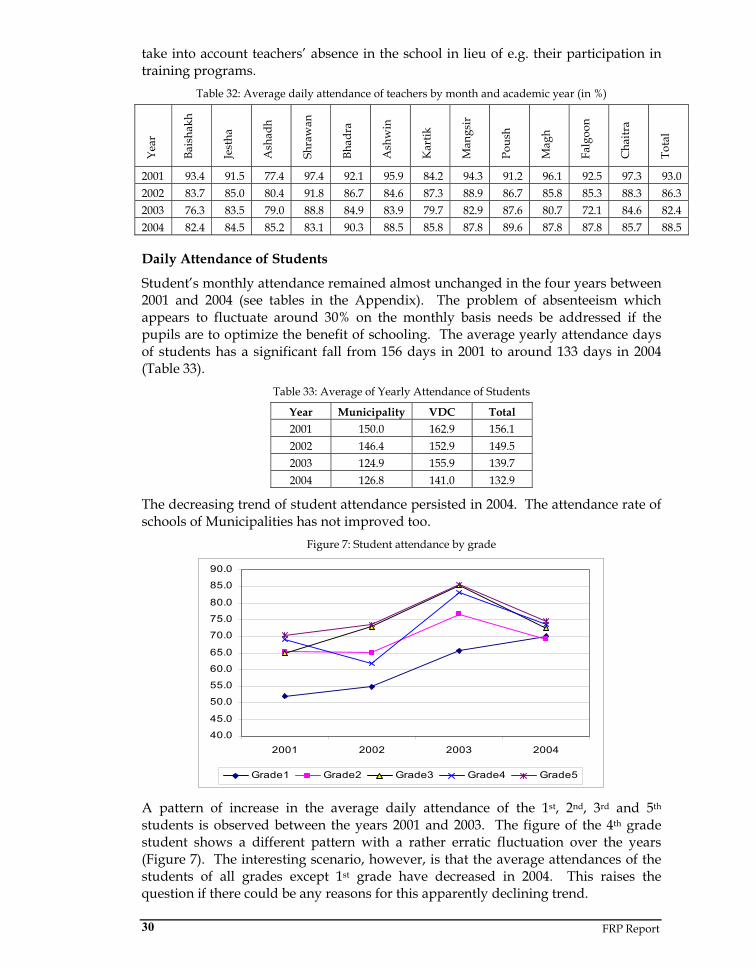
FRP Report 30
take into account teachers’ absence in the school in lieu of e.g. their participation in training programs.
Table 32: Average daily attendance of teachers by month and academic year (in %)
Year
Bais
hakh
Jest
ha
Ash
adh
Shra
wan
Bhad
ra
Ash
win
Kar
tik
Man
gsir
Pous
h
Mag
h
Falg
oon
Cha
itra
Tota
l
2001 93.4 91.5 77.4 97.4 92.1 95.9 84.2 94.3 91.2 96.1 92.5 97.3 93.0 2002 83.7 85.0 80.4 91.8 86.7 84.6 87.3 88.9 86.7 85.8 85.3 88.3 86.3 2003 76.3 83.5 79.0 88.8 84.9 83.9 79.7 82.9 87.6 80.7 72.1 84.6 82.4 2004 82.4 84.5 85.2 83.1 90.3 88.5 85.8 87.8 89.6 87.8 87.8 85.7 88.5
Daily Attendance of Students
Student’s monthly attendance remained almost unchanged in the four years between 2001 and 2004 (see tables in the Appendix). The problem of absenteeism which appears to fluctuate around 30% on the monthly basis needs be addressed if the pupils are to optimize the benefit of schooling. The average yearly attendance days of students has a significant fall from 156 days in 2001 to around 133 days in 2004 (Table 33).
Table 33: Average of Yearly Attendance of Students
Year Municipality VDC Total 2001 150.0 162.9 156.1 2002 146.4 152.9 149.5 2003 124.9 155.9 139.7 2004 126.8 141.0 132.9
The decreasing trend of student attendance persisted in 2004. The attendance rate of schools of Municipalities has not improved too.
Figure 7: Student attendance by grade
40.0
45.0
50.0
55.0
60.0
65.0
70.0
75.0
80.0
85.0
90.0
2001 2002 2003 2004
Grade1 Grade2 Grade3 Grade4 Grade5
A pattern of increase in the average daily attendance of the 1st, 2nd, 3rd and 5th students is observed between the years 2001 and 2003. The figure of the 4th grade student shows a different pattern with a rather erratic fluctuation over the years (Figure 7). The interesting scenario, however, is that the average attendances of the students of all grades except 1st grade have decreased in 2004. This raises the question if there could be any reasons for this apparently declining trend.
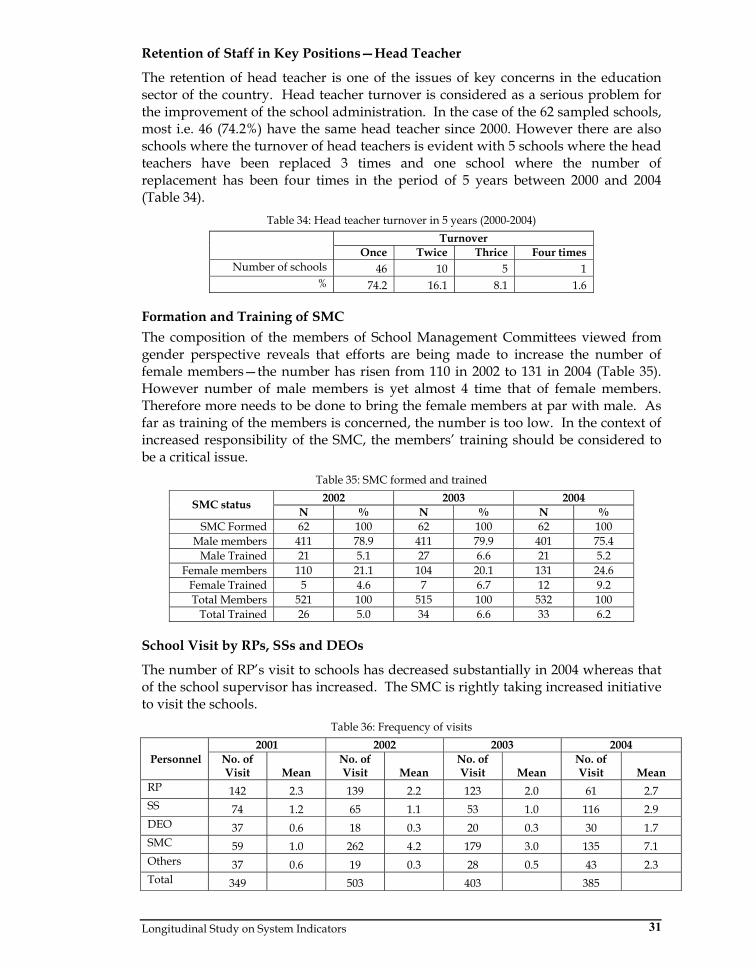
Longitudinal Study on System Indicators 31
Retention of Staff in Key Positions—Head Teacher
The retention of head teacher is one of the issues of key concerns in the education sector of the country. Head teacher turnover is considered as a serious problem for the improvement of the school administration. In the case of the 62 sampled schools, most i.e. 46 (74.2%) have the same head teacher since 2000. However there are also schools where the turnover of head teachers is evident with 5 schools where the head teachers have been replaced 3 times and one school where the number of replacement has been four times in the period of 5 years between 2000 and 2004 (Table 34).
Table 34: Head teacher turnover in 5 years (2000-2004) Turnover
Once Twice Thrice Four times Number of schools 46 10 5 1
% 74.2 16.1 8.1 1.6
Formation and Training of SMC The composition of the members of School Management Committees viewed from gender perspective reveals that efforts are being made to increase the number of female members—the number has risen from 110 in 2002 to 131 in 2004 (Table 35). However number of male members is yet almost 4 time that of female members. Therefore more needs to be done to bring the female members at par with male. As far as training of the members is concerned, the number is too low. In the context of increased responsibility of the SMC, the members’ training should be considered to be a critical issue.
Table 35: SMC formed and trained 2002 2003 2004 SMC status N % N % N %
SMC Formed 62 100 62 100 62 100 Male members 411 78.9 411 79.9 401 75.4
Male Trained 21 5.1 27 6.6 21 5.2 Female members 110 21.1 104 20.1 131 24.6
Female Trained 5 4.6 7 6.7 12 9.2 Total Members 521 100 515 100 532 100
Total Trained 26 5.0 34 6.6 33 6.2
School Visit by RPs, SSs and DEOs
The number of RP’s visit to schools has decreased substantially in 2004 whereas that of the school supervisor has increased. The SMC is rightly taking increased initiative to visit the schools.
Table 36: Frequency of visits 2001 2002 2003 2004
Personnel No. of Visit Mean
No. of Visit Mean
No. of Visit Mean
No. of Visit Mean
RP 142 2.3 139 2.2 123 2.0 61 2.7 SS 74 1.2 65 1.1 53 1.0 116 2.9 DEO 37 0.6 18 0.3 20 0.3 30 1.7 SMC 59 1.0 262 4.2 179 3.0 135 7.1 Others 37 0.6 19 0.3 28 0.5 43 2.3 Total 349 503 403 385
FRP Report 32
According to Table 36, the total frequency of the visits by different personnel in 2002 is the highest among the four consecutive years. The mean number of visits by Resource Persons, School Supervisors has increased significantly. The visits by SMC members has increased up to the average of 7 times in an academic year, this could be because of school handing over to the community.
Longitudinal Study on System Indicators 33
SUMMARY OF THE FINDINGS
The Longitudinal Study on System Indicators has been through interesting phases in the past five years from its inception, design and start of implementation period during the time of BPEP II to making major adjustments in the changed context of EFA. The changed contexts from BPEP II to EFA required the study to make some adjustments in the set of the system indicators considered for the study purpose. Similarly, the persistence of the poor quality of school supplied data led the study to take a different approach to collecting them. One of the lessons the study learnt over the years is that the problem of poor quality of data persists unless schools themselves take the ownership of both the process and management of data. Therefore, with the new data collection strategy in place, the study organized series of workshops both at the central and local cluster levels for the sampled schools to examine their own data records and organize them in the categories and formats designed by the study. The workshop process not only allowed collection of more complete and reliable data for the study but also helped the 62 sampled schools to start establishing their own EMIS.
The study, however, has continued its struggle to make the older database clean and some backlog data complete. Therefore, the results presented in this report are based on the data collected through two distinct approaches. The data in the archive dating prior to 2004 were collected by the research enumerators directly from the schools, who reported to have experienced a clear lack of motivation and ownership on the part of the data providers, the schools. Since December 2004, the 62 school representatives attended cluster level workshops to examine, process and consolidate school information and fill the forms with required data in the workshop itself. Any incomplete data would have been sent later. They have, nevertheless, unfolded a trend that depicts the way the system of educational management, delivery and quality has changed over the past 3 to 5 years.
The study’s effort to persuade relevant VDCs to collect and update education data on key EFA indicators is yet to be proved effective. Coordination among VDC, DDC and DEO which was found almost non existent needed to be formalized in order to convert the effort into an institutionalized information system not only to support monitoring the progress on EFA but also for the VDCs and DDCs to be effective in their involvement in developing VEP and DEP.
The summary of the findings based on the analysis of selected system indicators are categorized according to five of the six program components of EFA—the one on reducing illiteracy has not been considered as it was not practical for the study to collect the literacy data.
Expanding Early Childhood Development
The percentage of new entrants with ECD in Grade one has grown to 17.5 in 2003 from 4.8% in 1999, however the growth rate has declined slightly to 14.8% in 2004.
Only one-third (21) of the sampled schools has ECD or Pre-school program. 16 such schools are run with the government sources and 5 with schools’ own resources. The VDCs where the sampled schools are located did not have systematic information-base on community operated ECDs which made it

FRP Report 34
difficult to judge whether the access of pre-school children to ECD had not been a problem and whether it was acceptable for so many schools not to operate ECD or pre-school education.
The percentage of girls enrolled in grade one with pre-school/ECD experience is 3.4% higher than boys.
The percentages of dalit and ethnic students enrolled in grade 1 with ECD experience are higher than other children.
The MOES EFA Core Document 2001 has set the targets of 56% GER in early childhood or pre-school education for 2008/09 – up from 13% in 2001. Although data are not available for the Longitudinal Study to analyze such GER, the above four indicators present a proxy of that. The core document has also set an ambitious 2008/09 target of 60% new entrants in grade one who would have attended ECD or pre-school compared to the baseline of 8% in 2001. However, the longitudinal study finding on this indicator does not show a satisfactory progress in 2004 that raises questions against the efforts made towards achieving the targets set. Nevertheless, it still is encouraging to note that grade one girls and children belonging to dalit and ethnic groups have not suffered from discrimination in terms of the opportunity to attend ECD program or pre-school education. Muslim children, however, are deprived of similar opportunity.
Ensuring Access to Education for All Children
The proportion of Muslim children in the primary grades of the 62 sampled schools is lower than the population proportion of that social group in the national population census of 2001 indicating that the problem of access of Muslims to education has persisted. This scenario suggests that government’s strategy of targeting the special focus social groups with incentive packages such as scholarship programs is either not sufficient or has not been effectively implemented.
In the case of Dalit group, however, the proportion (19.3%) to total student is quite encouraging which suggests that the MOES’s affirmative measures and strategies (e.g. Dalit scholarships) have produced results.
Number of special need children (physically, visually, cognitively or hearing impaired) has not increased in the sampled schools. In 2002 and 2003 the 62 sampled schools have accommodated a little less than 1% special need children in the schools. More than half of them are in grade one alone with most having mental disability. The 1% special need children in the school does seem right proportion compared to that of such children of age between 5-9 years in the country which stands at 0.37% (Census 2001). But the fact that the number has reduced drastically in the higher grades of primary level suggests that completing primary cycle must have been difficult for a large number of special need children. It can also be concluded that the schools lack capacity to address the educational needs of such children.
Preparation of SIP does not seem to take heed of the access issue of socially deprived groups like Muslim and special need children. The fact that the VDCs and the municipality wards where the sampled schools are located do not collect and analyze the data of school age population of various social groups is in itself an indication that the SIPs hardly take into account any actions related to the educational needs of those children from the catchments

Longitudinal Study on System Indicators 35
area who are currently not in the school. Therefore, the school management committees are yet to understand the social context of school catchments area, take the ownership of developing the SIP by closely working with the VDC/municipality and be informed of the social context and be socially responsible.
The “Education for All” is yet to be the agenda (in its true sense) of the schools. The very fact that the SIPs developed by schools do not take into account the situation of primary school age children in the school catchments area is in itself a testimony that the schools are still indifferent about the EFA goals. They are least concerned about being strategic and proactive to bring all children (particularly the poor and deprived, Muslims, girls and special need children) to school from the catchments area and retain them throughout the primary education cycle. Schools obviously lack management capacity, particularly to plan short and long term school activities by mapping and analyzing the social context and by being responsive to the needs unfolded in the social milieu. Because of their lack of such capacity and inability to establish school-based EMIS, the SIPs that they have somehow been developing are not more than being a product of a mere ritualistic and supply driven activity. Linkage between schools and VDCs, particularly to generate and share information for planning and managing EFA programs, has not been established. Therefore, it can be concluded that the problem of ensuring primary education for all children lie fundamentally in the weak management information systems at the school and community level.
Meeting the learning needs of all children including indigenous people and linguistic minorities
All the schools have their SMCs formed and the data of 2004 have shown that a little more than a quarter of their members are female. However, the fact that less than 7% members are trained raises the issue of SMC’s capacity to effectively manage the schools and ensure that they are assessing the learning needs of all children and responding accordingly.
There has been a decreasing trend in the average school attendance of students during the years between 2001 and 2004, which is an indication of students’ learning needs not being effectively met.
Not only are more school libraries available in 2004 compared to previous years but also the libraries have diversified the range of books and reading materials from being more reference and textbook dominated in 2002 to making available more of the other category books in 2004. However, the mechanism of delivering textbooks to children has not improved over the years that must have had a negative effect on student learning.
The non-salary recurrent cost has been reduced over the years which means that the schools have not been able to draw more resources for the purpose of diversifying their pedagogical process and making learning more responsive to the needs of the children.
Despite attaining almost 50% achievement in terms of the number of fully trained teachers (NCED target for 2005/06 is 44%) by the sampled schools, the learning achievements in major subjects of grades I, III and V are quite disappointing—barely above the pass mark in all subjects and worst in grade V mathematics in which the average score is below the pass mark.

FRP Report 36
The only indicator that rates positively on the schools’ effort to meet the learning needs of all children is the increase in the number of school libraries and the diversified materials there. However, rest four indicators suggest that the schools are not really operating according to what the students need to learn. The resource available for non salary recurrent cost is too low for the schools to be innovative and creative in its pedagogical process. The resulting scenario has been one of not only the poor student performances in the key primary subjects but also the decrease in the average number of days students attend the school annually. Therefore, it would not be appropriate to expect that the learning needs of all children are being met as effectively as envisaged by the EFA Core document. The SMCs, on the other hand, are extremely under-trained, hence lack the capacity necessary to manage and lead the schools to be capable to reorient the pedagogical processes in order to meet the learning needs of all children.
Eliminating Gender and Social Disparities
Although the number of Muslim students in the 62 sampled schools has doubled in 2003 and 2004 compared to the figure of 2002, the proportion of Muslim students is still very low (2.6%).
The number and proportion of girls in the 62 schools has remained almost unchanged in the 3 year period between 2002 and 2004. The gender parity indexes for the students of the 62 schools stand at 0.948, 0.954, 1.036 respectively in 2002, 2003 and 2004.
According to 2004 data, the gender parity index for teacher is more than 1.0 in 25 (40.3%) sample schools. The GP Index is less than 0.5 in 35.5% schools and more than 1.0 in 40% schools.
Female teachers constitute more than male teachers in the 62 sampled schools. However, the distribution of female teachers across the schools is scattered. There are 5 schools without female teachers and 14 schools with only one female teacher and 4 schools with all female teachers. The five schools without any or with only one female teacher are from relatively isolated and remote communities of Kailali and Shankhuwasabha whereas the 4 schools with all female teachers are from the schools located at the district headquarters or urban centres of Dhankuta, Lalitpur, Syangja and Banke districts .
Percentage of Muslim teachers is 1.6 in 2004 which is an increase from 0.9 in 2002 and 0.6 in 2003. The figures of Dalit and Janajati in 2004 are 2.2 and 23.6, which actually are less than those in the previous two years. Brahmins and Chhetries have ever been the predominant head-teachers.
Number of female head-teachers has slightly increased from 24.2% in 2002 to 25.8% in 2003 which remained same in 2004. Percent of female head teachers representing Janajati has always been more than that of male.
Percent of Muslim head-teacher is nil and that of Dalit is only 1.6 in 2003 and 2004 which is a decrease from 6.5% in 2002. Percentage of Janajati head teacher has slightly increased over the three year period which is 24.2% in 2004.
Although gender parities are attained at the student and teacher’s level in the 62 schools, the number of Dalit, Janajati and Muslim students as well as teachers

Longitudinal Study on System Indicators 37
remained disproportionate compared to that of the other caste groups. Similarly, the evidence that the schools in more isolated communities have fewer or no female teacher points to the situation that female teachers are not encouraged with special incentive package to move to such schools. This situation is also reiterated by the finding of the NCED’s tracer study of the female and DAG scholarship awardees of pre-service teacher training that less than 10% such awardees have actually joined the teaching profession (NCED 2006). Hence, the focus emphasized in the EFA Core Document on capacity building alone of women (not taking into consideration other measures such as special incentives for female teachers) does not serve the purpose of fulfilling female teachers in the schools of remote areas. The government strategy of taking appropriate affirmative action to recruit female teacher does not seem to have translated into the reality of rural schools. At the leadership level of the schools as well as in the school management committees representations of women, Dalits, Janajaties and Muslims are still dismal. There is an average of 33% female members in the SMCs of 2004 compared to around 25% in those of 2002 and 2003, which does appear to be an encouraging increase, yet it is far too short in terms of attaining gender parity.
Improving All Aspects of Quality of Education
Teacher
In 2004, 91% teachers in the 62 sampled schools are trained in at least one of the three phases of the 10-month training program and are certified, which is an increase from 58% in 2003 and 43% in 2002.
The percent of fully trained teacher in 2004 is 47 (the NCED target for 2009 is 44%) which also is an increase from 29% in 2002 and 39% in 2003.
In both the above two categories of trained teachers, percentages increase in female teachers over the years are higher than those of male.
Majority of teachers have the officially required minimum qualification of SLC while about one quarter is intermediate or 12th grade graduates. Very few (3.4%) are under-SLC.
Although the average student teacher ratio in 2004 is 38:1 which in itself is higher than the official standard (i.e., 30:1), there are still 10% schools where the average ratio is 60:1 and 37% schools where it is 40:1.
Although almost all of the primary school teachers in the 62 schools have the officially required minimum qualification and the number of trained teachers ever increasing, there is virtually no impact on the learning achievements of children. The student learning of key primary school subjects as demonstrated by the average marks is appalling. In most of the subjects students have barely passed and in key subjects like mathematics especially at 5th grade the average scores remained below the pass mark over the past 3 years. This raises issues related to the appropriateness of the currently required minimum qualification of primary teachers as well as those related to the quality and relevance of the teacher training program being offered. The issues become even more complex if the current context of student teacher ratio is taken into consideration. The qualification and the quality of training would hardly matter if the teacher confronts exceptionally large size class.

FRP Report 38
Textbook and Learning Materials
More than 90% schools are equipped with various learning resources (teachers guide, curriculum and its directives, reference materials, subject elaborated reference).
56% schools have library in 2004 which is an increase of 20% points from that in 2002 and 4% points from that in 2003.
Only 38% students could receive textbooks within 2 weeks after the beginning of the new academic sessions. Clearly the problem of managing the printing and distribution of textbooks has persisted.
According to the available school records almost all the sampled schools are equipped with some sort of learning materials. More than half of the sampled schools also have library facility. However, regarding the distribution of textbooks to students on time the concerned institution is yet to prove its capacity because nearly two third students do not get the textbooks at the beginning of the new academic session. Textbooks are critically important and possibly the only learning resource on which the rural Nepalese students, particularly those at the primary level, depend upon. It is also important to note that availability of learning resources may be a necessary condition but not a sufficient one to ensure quality delivery of education. Relevance and use of such resources are equally, if not more, critical factors. Unless they are adapted to the local situation and made meaningful to the students who come from diverse cultural and linguistic backgrounds even the abundance of resource materials makes very little sense. The primary education curriculum allows flexibility both in terms of the choice of up to the 20% content and the language of instruction to suit the local needs and aspiration. However, the analysis of the school examination scores of students does not support the argument that the schools have optimized the use of such a curricular flexibility and adapted the available learning resources to enhance student learning.
Learning Environment
The classroom space per student has improved to 7.8 sq. ft. in the year 2004 compared to 6.7 sq. ft. and 6.5 sq. ft. in the years 2002 and 2003 respectively.
The student teacher ratio has increased to 38.4:1 in 2004 compared to previous two years i.e., 31.7 and 31.0 in the years 2002 and 2003 respectively. The standard deviation of 21.5 in the distribution of student teacher ratio across the schools shows that there are some schools with extremely crowded classrooms. In order to optimize the STR the additional teacher need calculated for the 62 sampled schools has been extrapolated for the whole nation. Accordingly, it seems that the public schools of Nepal would need 40,298 additional regular primary teachers in order to make the class size manageable for individual teachers.
Teacher attendance has improved compared to last two years; however it is less than that of the year 2001 which was 93.0%.
Most schools (76%) have had the leadership of the same head-teacher in the past 5 years and all 62 schools have the School Management Committees formed with a slight increase of the female members in 2004 compared to the previous years.

Longitudinal Study on System Indicators 39
Ideally the improved classroom space per student should contribute to making the learning environment more child-friendly and teaching more child-centred. However, the collection and analysis of the data on these pedagogical aspects are beyond the scope of this study, hence it is not known whether teachers have actually made use of the improved classroom space to make their teaching more effective. But the study’s analysis of the achievement score data which has revealed poor student learning suggest just the opposite. The improvement in the learning environment is, therefore, a necessary but not sufficient condition to optimize student learning. For example teachers’ regularity and head-teacher’s sustained deployment alone cannot be expected to contribute to enhancing student learning unless the attitudes and behaviours of teachers and head-teachers are also attuned with pedagogical thoughtfulness, which often comes from both the opportunities of participating in well crafted training programs and consciously engaging in reflective practice of teaching and administering/managing its process.
School Improvement
Almost 93% schools have prepared SIPs of which 92% have reported to have implemented the plans.
The average annual expenditure per school has decreased over the years. It has shown a significant down fall in the year 2004 compared to the previous two years. The expenditure on non-salary recurrent cost has also decreased over the years taking only 16% of the total share of the school budget.
Increasingly the schools are depending more on government financial support to run the school. Schools’ internal source, VDC, community and parental shares have decreased in the three year period since 2002.
For 2002, 2003 and 2004, the annual numbers of schools that need new classroom construction are 12, 9 and 17 and classroom rehabilitation are 13, 15 and 20 respectively. The progress in the construction of classrooms in 2003 shows the worst scenario of only 21% in compared to 57% in 2001 and 78% in 2004. However, in terms of rehabilitating classrooms the data of 2003 show the best result with 95% progress in compared to 53% and 59% in 2002 and 2004. The average discrepancy of 39.7% between the plans and actual progress for the period 2002-2004 raises a serious issue of poor performance especially when the achievement of the EFA goals within the stipulated time frame is so much important and a matter of high priority. This scenario is also indicative of the situation that the SIPs are either unrealistically developed by the schools or are arbitrarily adjusted by the concerned authority prior to disbursing the requested resources primarily by adhering to administrative expediency, e.g. in the name of ensuring “balanced” distribution of resources divide them into fixed quota rather than responding to the demands.
The promotion rate of the students of all grades (1-5) has not improved significantly since 1999 and no significant difference is found between the performance of boys and girls.
The primary school completion rate in 2004 has remained low (40.9%). However, girls have outperformed the boys by 10% points and the completion rate of girls is 46.2% in 2004 which is a jump from 27.7 in 2003. This improved performance of girls can be considered as an evidence of the
FRP Report 40
government’s positive discrimination in its policy of e.g. distribution of scholarship, improving school environment to suit the needs of girls and preferences given to women in teaching job.
According to 2004 data, a little more than a quarter of the students promoted from primary education preferred to stay away from school—more so in the case of girls (31.5%) than boys (by more than 10% points). Girls’ transition rate, which has by and large remained stagnant in the past 5 years, suggests that the positively discriminatory policy in favour of girls has not actually had a sustained impact on girls’ situation to pursue education at higher levels. As long as the gap between the rates of girls and boys remains wide, the system would continue facing the problem of attaining gender equality in education.
The repetition rate of grade one, despite being a perennial problem, has shown some improved reduction in 2004 compared to the previous years. The emphasis that was laid to ECD and pre-school education since the time of BPEP might have started showing the impact.
The slight improvement in promotion rate and decrease in repetition rate have resulted in an improved internal efficiency of the primary education system. Obviously the better performance outputs of girls’ than that of boys is also demonstrated by the better internal efficiency of primary education system with respect to the investment on the education of girls.
The all round efforts have produced the incremental improvements as seen in some of the key indicators. There is a clear indication that the policies of making positive discrimination regarding scholarships distribution focusing on the special-focus-social-groups and girls, recruiting more female teachers have been instrumental to improve the primary education system incrementally over the years. Some outputs which are of short term in nature are evident in the primary education sub sector—increased proportion of girls completing primary cycle, improved internal efficiency. The results achieved in the sub sector too are short term in nature—the improved primary cycle completion rate of girls, e.g., is not complemented by the same kind of improvement in the rate of transition to lower secondary grades. The inputs on EFA program that are supposed to bring about improvements in all aspects of primary education fall short of making lasting impact on the very process of planning. Decentralized planning which has been so much an aspired transformation celebrated so vividly in the policy documents has not taken its root by way of it becoming an internalized cultural process. The identification of the construction and/or rehabilitation needs of classrooms and the resource demands for such needs being axed by the central authority is a classical example of the EFA’s overarching framework of decentralization confining into being a wishful concept. Concrete actions are still lacking to translate the policies of LSGA into cultural action.
Management and Capacity Building
The number of visits by different personnel to the schools has decreased compared to last two years in 2004.
The head teacher turnover is not a problem in 46 (74.2%) sampled schools. There are 16 schools where the head teachers have been replaced by new ones in the years between 2000 and 2004.

Longitudinal Study on System Indicators 41
Schools have not been able to obtain the resources they demanded through SIP for construction and/or rehabilitation of classrooms. This raises the issue of the extent to which the SIPs are developed rationally and realistically with a genuine participation of all the concerned stakeholders. There is also rooms to assume that the resources are distributed evenly to schools rather than taking into account the authenticity of the demands made.
Lack of local capacity is an issue that has made the central level authority reluctant to devolve the authority for decentralized decision making and resource mobilization to the bottom end of the line ministry. This gave birth to a catch-twenty-two situation. Because of the lack of local capacity the need for centrally controlled governance has been argued strongly. But, unless the local stakeholders are entrusted with necessary authorities involving risks, their capacity to operate according to the spirit of LSGA would not be developed. Unfortunately, contractions are evident between what is envisaged by LSGA and how the primary education system is being governed.
FRP Report 42
RECOMMENDATIONS
The study was not confined only on collecting and analyzing data on key indicators. It has also drawn findings related to the study process as well as the cooperation, involvement and participation of stakeholders at the MOES, RED, DEO, VDC/municipality ward and school levels. Therefore, the recommendations have touched upon all three of these aspects.
Quality of Data and Study Process
The challenges faced and lessons learned in this study suggest that, in a complex school system of Nepal, a quantitative study involving the survey of large number of public schools and students can be a futile effort if the realities of the schools are not carefully considered and the complexities associated with the school operating systems compounded by the requirement for them to generate school data for e.g. Flash reports and research purposes are not deeply understood. Ensuring the quality of data, their reliability and validity are not straight forward conceptual and methodological matters. To rely on the dominant and mostly taken-for-granted approach to collecting data from schools by involving teams of surveyors and researchers proved to be a gross mistake in this study.
Study of Progress on Key EFA Indicators
Despite being confronted with the issue of quality of data and the process of collecting them, the study has managed to gather and consolidate reliable and valid data on some key indicators and arrive at interesting findings. The data of 2004 in particular are more reliable and valid as the school representatives had the opportunity to do one level of analysis during the cluster level workshops organized to consolidate and collect school data.
Cooperation and Coordination
EFA program is primarily guided by the overarching framework of decentralization and policies of LSGA. Even the research activities of the Formative Research Project and its Longitudinal Study could not be an exception. Important lessons have been learned by the Longitudinal Study team from its initial approach to the inquiry process. Although, the importance of the involvement and participation of the stakeholders at all levels was emphasized from the very beginning, inadvertently the study process sometime has drifted towards becoming top-down and isolated. However, the periodic review meetings of stakeholders and the study team prevented the process from going too far in that direction. Study tools and identification of monitoring indicators have been revised along with the improvements in the coordination and cooperation mechanism. Much still needs to be done to realize that the central level organizations (e.g. DOE, NCED, CDC, NFEC, COE) along with the regions, districts, VDCs, schools and communities taking appropriate stakes in the study process.
The above three aspects have been blended in the policies, strategies, actions and processes recommended by this study in the following section.
Longitudinal Study on System Indicators 43
School based EMIS. One of the key recommendations of this study, which is not so much based on the school data and their analysis but on the research process itself is for the Department of Education through its line agencies to be massively involved in helping all schools establish their own database and information systems (preferably computerized). Capacities of school stakeholders and local authorities should be empowered to undertake this responsibility as well as to make sure that school-related decisions and plans are made by analyzing and utilizing the school-generated database. A model depicting the possibility of such a system is being developed in the course of proceeding with the processes of the Longitudinal Study by CERID. Gradually the DOE’s EMIS should be an apex part (not the sole authority) of the national network of school based information systems. (Action point: collaboration of the DOE, NCED and CERID to workout the plans, strategies, procedures along with the details of material, human and financial resources necessary to equip and build capacities of REDs, ETCs, DEOs, RCs and schools)
Context mapping, analysis and participatory planning. Local bodies and stakeholders should be encouraged to map out the social and educational contexts of the relevant constituencies and critically analyze the context to identify educational issues, set educational development targets and identify resources (human, finance, materials and infrastructure) required. Such exercise should start at the school and its catchments area level with the participation of community representatives, SMC, PTA and teachers. The locally generated knowledge and information base through such exercise should be the basis of developing SIPs. Once SIPs are developed through a meaningful process of involvement and participation, and also on the basis of information generated through informed exercise of community mapping on key educational indicators, they provide the basis for the VDC level stakeholders to develop the VEP with clearly articulated foundation and information base.
Need based capacity building. Stakeholder capacity building training/workshop should be organized in order to address the capacity needs demanded by the tasks outlined by the stakeholders during their own involvement in mapping and analyzing their own social and educational context and identifying issues to be addressed in the planning exercises. Training /workshops should also be organized to build stakeholders’ capacity to do these very tasks and critically understand the steps involved in the process of developing SIP, VEP and DEP. The important issue that needs to be consciously considered while designing and organizing such capacity building program is to ensure that the effort is not drifted towards becoming yet another rhetoric and ritualistic endeavour.
Social responsibility of the school. Important EFA indicators such as GER, NER in primary schools and literacy status of various age groups are yet to become the local and schools’ agenda. Because of such an indifferent outlook on those indicators schools, local bodies and SMCs are yet to show interest on how they as the frontline stakeholders are contributing to bring about positive changes on those indicators. This issue has to be addressed at the systemic level. Along with the capacity enhancement of the local stakeholders and schools specifically on participatory context mapping and planning, the local education committees (e.g. SMCs, village and district education committees) should be devolved authority to formulate locally relevant policies to formally expand schools’ role to cater to defined catchments area. Through such an expansion of role schools will have to demonstrate time bound improvements in key social and educational indicators in reference to their own targets. Local civil society organizations are best placed to collaborate with schools
FRP Report 44
and SMCs, especially to build VDC and school relationships, carry out the educational survey of school catchments areas, establish benchmarks on key indicators, set targets of improvement, contribute to the process of developing SIP and monitoring progress. Appropriate financial support to the collaborating civil society organizations, which should be viewed as a worthwhile investment, must be ensured. The continuity of the collaboration should be determined on the basis of the quality of results produced—measured preferably in terms of output/outcome against targets.
Coordinated collection and use of data for research. CERID and NCED need to develop institutional linkage to mutually share and use data from each other’s database (between NCED’s TMIS and CERID’s Longitudinal Study database). The duplication of information collection and research activities needs to be identified and avoided through necessary coordination. NCED in particular should make use of the achievement scores of the 62 Longitudinal Study schools to assess the impact of the teacher education programs of NCED delivered through the ETCs. Similarly the Longitudinal Study, instead of collecting teacher related information on its own, should start using the detailed data of individual teachers that NCED has stored and updated in its TMIS.
Longitudinal Study on System Indicators 45
Suggested Action Steps
Governance of the primary education sub-sector should be decentralized using the policy mandate allowed by LSGA. In this context, every individual VDC and the cluster of schools (with active involvement of respective SMCs) within the VDC should form the smallest unit of the national institutional network of educational management information system. As the political constituency of schools widens (e.g. to district, regional and national levels), wider political institutions are included in the network (e.g. DDC, DEO, ETC, RED and the central level line ministries such as MOES, MLD, MOH). Within this backdrop of network institutions specific tasks should be carried out at all levels of the education system.
Classroom Level
Develop individual child progress profile. Carry out individual grade’s context mapping and analysis (collection, systematization and analysis of grade specific data on key success indicators) with respect to: a) gender, caste, ethnicity disaggregated enrolment data); b) disaggregated students’ learning achievement data. Responsibility for this activity should be on one-teacher-one-grade basis. The logic of enforcing such a regulation is that keeping the detailed record of up to 50 children should not be an act of overburdening the responsible teacher; c) identification of grade specific activities to be included in the SIP (informed grade specific planning based on hard information and justifications backed by the analysis and demanding required resources).
School Level
One-head teacher has only 5 grades to manage (10 at the most if each class has 2 sections). Along with this precise scope of work, the head teacher should be made clear about her/his role of ensuring effectiveness in the task of leading the school team. Some specific key tasks that the head teacher should be clear about and carry out effectively are: using the teachers’ report of classroom context as the unit of her/his own analysis of the school context;
VDC Level
The head teachers of all the primary schools belonging to one particular VDC should meet periodically to: analyse the context of primary education specific to individual school’s catchments area; communicate and cooperate with VDC to keep gender, caste, ethnicity and religion disaggregated records of pre-primary and primary school age children (discuss and agree on specific indicators on which the progress would be monitored by the VDC) and assign child-identification number in standard format which would be used by schools to register students in school record (such ID would facilitate child and student tracking); and develop the VEP collaboratively. Every students should retain the VDC-assigned ID all through his/her schooling no matter how frequently he/she changes schools.
District Level
The DEO should use the reports of head teachers as the unit of analysis to prepare the district primary education profile. The statistics and reports submitted by the head teachers and the VEPs developed at the VDC level should allow the DEO to

FRP Report 46
work with DDC to: determine the status of school-age children (both schooled and unschooled); monitor the progress on key primary education and literacy indicators; and prepare the DEP.
Region Level
The RED will prepare the profile of the entire region based on the consolidated and analyzed information of the DEOs. The profile should indicate the topographic, social and linguistic diversities needing policy and budgetary consideration within the region. Districts needs to be categorized into clusters based on the enormity and similarity of educational and social issues.
Central Level
The MOES and DOE should utilize the locally built, analyzed and used information base as the basis to establish and upgrade the central level EMIS. The Flash Report should no longer be an isolated task of the DOE but should be a consolidated report generated out of the school, VDC, DDC, development region levels micro and mini Flash Reports.
Longitudinal Study on System Indicators 47
Appendix 1
Study Tools
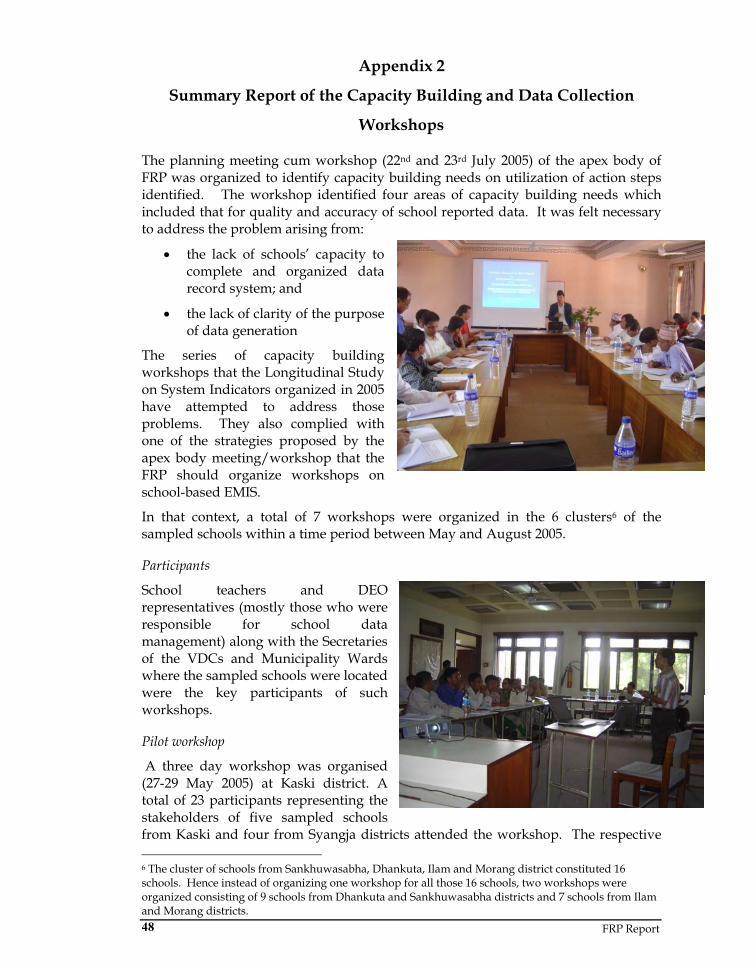
FRP Report 48
Appendix 2
Summary Report of the Capacity Building and Data Collection
Workshops
The planning meeting cum workshop (22nd and 23rd July 2005) of the apex body of FRP was organized to identify capacity building needs on utilization of action steps identified. The workshop identified four areas of capacity building needs which included that for quality and accuracy of school reported data. It was felt necessary to address the problem arising from:
• the lack of schools’ capacity to complete and organized data record system; and
• the lack of clarity of the purpose of data generation
The series of capacity building workshops that the Longitudinal Study on System Indicators organized in 2005 have attempted to address those problems. They also complied with one of the strategies proposed by the apex body meeting/workshop that the FRP should organize workshops on school-based EMIS.
In that context, a total of 7 workshops were organized in the 6 clusters6 of the sampled schools within a time period between May and August 2005.
Participants
School teachers and DEO representatives (mostly those who were responsible for school data management) along with the Secretaries of the VDCs and Municipality Wards where the sampled schools were located were the key participants of such workshops.
Pilot workshop
A three day workshop was organised (27-29 May 2005) at Kaski district. A total of 23 participants representing the stakeholders of five sampled schools from Kaski and four from Syangja districts attended the workshop. The respective 6 The cluster of schools from Sankhuwasabha, Dhankuta, Ilam and Morang district constituted 16 schools. Hence instead of organizing one workshop for all those 16 schools, two workshops were organized consisting of 9 schools from Dhankuta and Sankhuwasabha districts and 7 schools from Ilam and Morang districts.
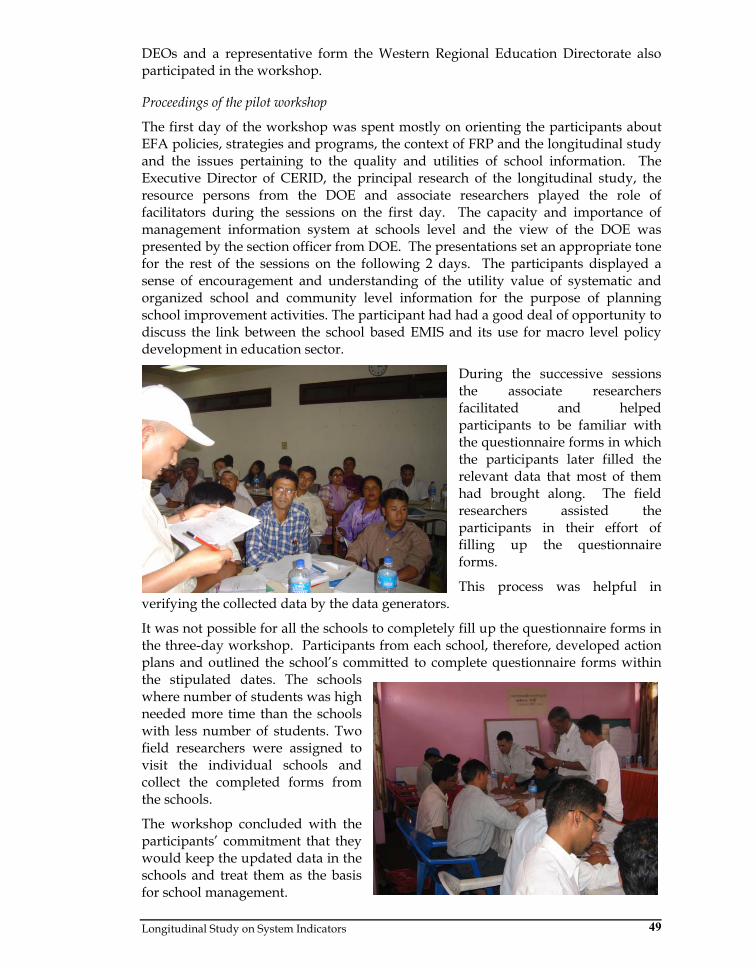
Longitudinal Study on System Indicators 49
DEOs and a representative form the Western Regional Education Directorate also participated in the workshop.
Proceedings of the pilot workshop
The first day of the workshop was spent mostly on orienting the participants about EFA policies, strategies and programs, the context of FRP and the longitudinal study and the issues pertaining to the quality and utilities of school information. The Executive Director of CERID, the principal research of the longitudinal study, the resource persons from the DOE and associate researchers played the role of facilitators during the sessions on the first day. The capacity and importance of management information system at schools level and the view of the DOE was presented by the section officer from DOE. The presentations set an appropriate tone for the rest of the sessions on the following 2 days. The participants displayed a sense of encouragement and understanding of the utility value of systematic and organized school and community level information for the purpose of planning school improvement activities. The participant had had a good deal of opportunity to discuss the link between the school based EMIS and its use for macro level policy development in education sector.
During the successive sessions the associate researchers facilitated and helped participants to be familiar with the questionnaire forms in which the participants later filled the relevant data that most of them had brought along. The field researchers assisted the participants in their effort of filling up the questionnaire forms.
This process was helpful in verifying the collected data by the data generators.
It was not possible for all the schools to completely fill up the questionnaire forms in the three-day workshop. Participants from each school, therefore, developed action plans and outlined the school’s committed to complete questionnaire forms within the stipulated dates. The schools where number of students was high needed more time than the schools with less number of students. Two field researchers were assigned to visit the individual schools and collect the completed forms from the schools.
The workshop concluded with the participants’ commitment that they would keep the updated data in the schools and treat them as the basis for school management.
FRP Report 50
Successive workshops
The entire research team of the Longitudinal Study had participated in the pilot workshop at Kaski in order to be acquainted with the process and be prepared to facilitate similar workshops elsewhere. They also had a second opportunity to work collectively and practice the facilitation skill in a successive workshop organized at Lalitpur district from 5th to 7th of June 2005. Then further workshops were organised concurrently by smaller teams in the two sub-clusters at Biratnagar from 21st to 23rd and 24th to 26th June, and in one cluster each at Chitwan from 21st to 23rd June, at Kailali from 25th to 27th June, and at Banke from 28th to 30th June. The process and the objectives of the workshops were same as those of the workshop at Kaski district. The Executive Director of CERID, the coordinator and advisor of FRP, the coordinator of System Indicators Study, resource persons representing the MOES, DOE, RED and selected DEOs took part in the workshops.
Substantial amount of data were collected from the sampled schools in all those workshops. More importantly the participants found the workshop to be very useful particularly from the point of view of starting the school-based EMIS in their respective contexts. As it was not possible to complete the questionnaires in the workshop itself, the participants drew their action plans to fill-up the remaining data in the forms and hand them over to the field researchers. In the case of some schools, however, the action plans showed exceptionally longer time requirement due to unavoidable situations. The study team, therefore, had no choice but to wait patiently to build up the school database, process the data and produce the summary sheets.
In all the workshops, the facilitators representing the study team also prepared their own action plan. One of the prominent commitments they made through the action plan was to return the school specific data (cleaned, computerized and printed hard copies) to each of the 62 sampled schools within the specified time period. It was discussed in the workshops that the schools would take the interest and initiative to verify the returned data. It was expected that eventually the schools would have the expertise and resources to carry out the task of collecting, cleaning, organizing and analyzing their own data and most importantly, making an extensive use of such data for decision making and school management.
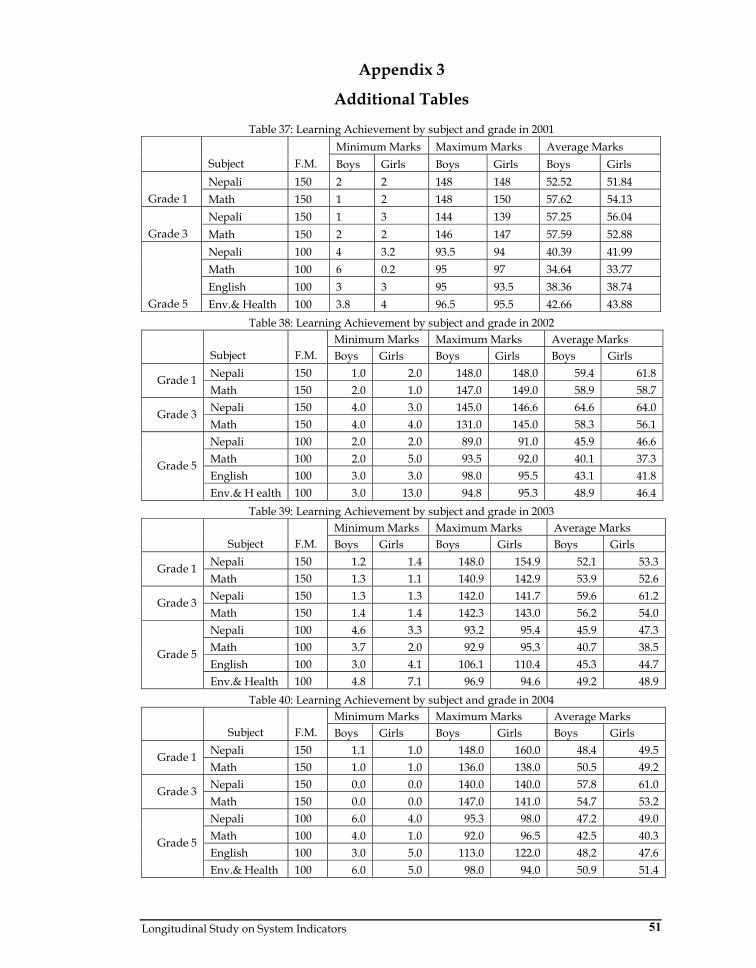
Longitudinal Study on System Indicators 51
Appendix 3
Additional Tables
Table 37: Learning Achievement by subject and grade in 2001 Minimum Marks Maximum Marks Average Marks
Subject F.M. Boys Girls Boys Girls Boys Girls Nepali 150 2 2 148 148 52.52 51.84
Grade 1 Math 150 1 2 148 150 57.62 54.13 Nepali 150 1 3 144 139 57.25 56.04
Grade 3 Math 150 2 2 146 147 57.59 52.88 Nepali 100 4 3.2 93.5 94 40.39 41.99 Math 100 6 0.2 95 97 34.64 33.77 English 100 3 3 95 93.5 38.36 38.74
Grade 5 Env.& Health 100 3.8 4 96.5 95.5 42.66 43.88 Table 38: Learning Achievement by subject and grade in 2002
Minimum Marks Maximum Marks Average Marks Subject F.M. Boys Girls Boys Girls Boys Girls
Nepali 150 1.0 2.0 148.0 148.0 59.4 61.8 Grade 1 Math 150 2.0 1.0 147.0 149.0 58.9 58.7 Nepali 150 4.0 3.0 145.0 146.6 64.6 64.0 Grade 3 Math 150 4.0 4.0 131.0 145.0 58.3 56.1 Nepali 100 2.0 2.0 89.0 91.0 45.9 46.6 Math 100 2.0 5.0 93.5 92.0 40.1 37.3 English 100 3.0 3.0 98.0 95.5 43.1 41.8
Grade 5
Env.& H ealth 100 3.0 13.0 94.8 95.3 48.9 46.4 Table 39: Learning Achievement by subject and grade in 2003
Minimum Marks Maximum Marks Average Marks Subject F.M. Boys Girls Boys Girls Boys Girls
Nepali 150 1.2 1.4 148.0 154.9 52.1 53.3 Grade 1 Math 150 1.3 1.1 140.9 142.9 53.9 52.6 Nepali 150 1.3 1.3 142.0 141.7 59.6 61.2 Grade 3 Math 150 1.4 1.4 142.3 143.0 56.2 54.0 Nepali 100 4.6 3.3 93.2 95.4 45.9 47.3 Math 100 3.7 2.0 92.9 95.3 40.7 38.5 English 100 3.0 4.1 106.1 110.4 45.3 44.7
Grade 5
Env.& Health 100 4.8 7.1 96.9 94.6 49.2 48.9 Table 40: Learning Achievement by subject and grade in 2004
Minimum Marks Maximum Marks Average Marks Subject F.M. Boys Girls Boys Girls Boys Girls
Nepali 150 1.1 1.0 148.0 160.0 48.4 49.5 Grade 1 Math 150 1.0 1.0 136.0 138.0 50.5 49.2 Nepali 150 0.0 0.0 140.0 140.0 57.8 61.0 Grade 3 Math 150 0.0 0.0 147.0 141.0 54.7 53.2 Nepali 100 6.0 4.0 95.3 98.0 47.2 49.0 Math 100 4.0 1.0 92.0 96.5 42.5 40.3 English 100 3.0 5.0 113.0 122.0 48.2 47.6
Grade 5
Env.& Health 100 6.0 5.0 98.0 94.0 50.9 51.4

FRP Report 52
Table 41: Percentage of Daily Attendance of Students in 2001
Mon
th
Bais
hakh
Jest
ha
Ash
adh
Shra
wan
Bhad
ra
Ash
win
Kar
tik
Man
gsir
Pous
h
Mag
h
Falg
oon
Cha
itra
Tota
l
Grade 1 61.1 73.7 50.5 65.9 53.7 71.1 67.5 68.9 72.2 68.3 62.1 61.8 65.6
Grade 2 77.0 74.5 64.0 71.7 71.9 80.3 69.8 60.7 76.2 72.3 69.9 69.2 71.3
Grade 3 89.2 73.3 56.3 77.4 73.3 77.9 65.3 76.6 73.2 77.2 73.2 78.4 74.8
Grade 4 78.3 80.6 60.3 75.5 74.6 82.3 67.1 74.2 80.5 78.2 73.2 78.0 76.6
Grade 5 54.4 82.9 64.5 78.5 68.8 76.6 64.3 68.6 73.6 72.1 70.9 80.9 72.3
Table 42: Percentage of Daily Attendance of Students in 2002
Mon
th
Bais
hakh
Jest
ha
Ash
adh
Shra
wan
Bhad
ra
Ash
win
Kar
tik
Man
gsir
Pous
h
Mag
h
Falg
oon
Cha
itra
Tota
l
Grade 1 59.1 64.8 66.3 71.4 66.2 71.6 63.6 70.7 69.1 65.8 67.1 82.6 66.9
Grade 2 65.2 75.1 70.2 65.8 67.4 76.5 65.0 73.7 71.4 71.3 68.9 82.7 70.8
Grade 3 67.5 74.9 75.2 76.9 72.6 77.8 61.1 80.2 72.7 78.7 73.7 94.4 73.9
Grade 4 64.3 74.0 72.0 75.4 73.0 79.4 68.7 77.2 61.7 70.8 78.9 74.9 71.8
Grade 5 72.9 79.0 74.8 80.3 77.6 81.8 70.7 80.4 79.8 82.6 78.1 92.9 78.2
Table 43: Percentage of Daily Attendance of Students in 2003
Mon
th
Bais
hakh
Jest
ha
Ash
adh
Shra
wan
Bhad
ra
Ash
win
Kar
tik
Man
gsir
Pous
h
Mag
h
Falg
oon
Cha
itra
Tota
l
Grade 1 55.7 66.8 68.0 67.0 66.2 67.3 66.0 68.2 67.3 68.6 45.8 37.2 65.7
Grade 2 73.1 76.4 73.4 80.0 75.1 78.4 76.2 79.8 80.8 75.8 60.4 55.5 76.5
Grade 3 78.1 88.7 78.8 95.5 81.4 85.8 89.0 88.4 87.4 80.5 71.2 87.0 85.2
Grade 4 77.8 84.8 77.5 91.0 84.8 86.1 82.7 83.5 84.8 77.8 69.0 68.6 83.1
Grade 5 78.1 90.5 80.0 93.6 84.5 86.3 86.9 88.5 86.7 77.9 63.4 100.0 85.6
Table 44: Percentage of Daily Attendance of Students in 2004
Mon
th
Bais
hakh
Jest
ha
Ash
adh
Sraw
an
Bhad
ra
Asw
in
Kar
tik
Man
gshi
r
Pous
h
Mag
h
Falg
un
Cha
itra
Tota
l
Grade 1 50.0 62.0 81.0 77.2 71.4 62.6 65.8 69.9 81.6 75.3 72.4 57.3 68.5 Grade 2 62.4 62.5 71.3 54.8 71.5 71.7 68.6 81.8 81.0 61.5 67.4 52.0 67.7 Grade 3 66.8 67.0 70.9 57.7 75.4 76.5 72.4 83.1 84.2 65.3 70.6 50.4 70.8 Grade 4 66.2 67.8 74.8 59.6 76.2 77.1 70.3 85.7 85.0 64.9 73.7 54.9 72.0 Grade 5 68.9 68.6 72.4 63.3 74.1 77.3 74.5 82.5 86.8 67.9 74.9 55.5 72.9
Table 36: Learning Achievement based on School Examination (2001- 2004) 2001 2002 Minimum Maximum Average Minimum Maximum Average
Subject Boys Girls Boys Girls Boys Girls Boys Girls Boys Girls Boys Girls Nepali 2.0 2.0 148.0 148.0 52.5 51.8 1.0 2.0 148.0 148.0 59.4 61.8 Grade 1 Math 1.0 2.0 148.0 150.0 57.6 54.1 2.0 1.0 147.0 149.0 58.9 58.7 Nepali 1.0 3.0 144.0 139.0 57.3 56.0 4.0 3.0 145.0 146.6 64.6 64.0 Grade 3 Math 2.0 2.0 146.0 147.0 57.6 52.9 4.0 4.0 131.0 145.0 58.3 56.1 Nepali 4.0 3.2 93.5 94.0 40.4 42.0 2.0 2.0 89.0 91.0 45.9 46.6 Math 6.0 0.2 95.0 97.0 34.6 33.8 2.0 5.0 93.5 92.0 40.1 37.3 English 3.0 3.0 95.0 93.5 38.4 38.7 3.0 3.0 98.0 95.5 43.1 41.8
Grade 5
Env.& Health 3.8 4.0 96.5 95.5 42.7 43.9 3.0 13.0 94.8 95.3 48.9 46.4
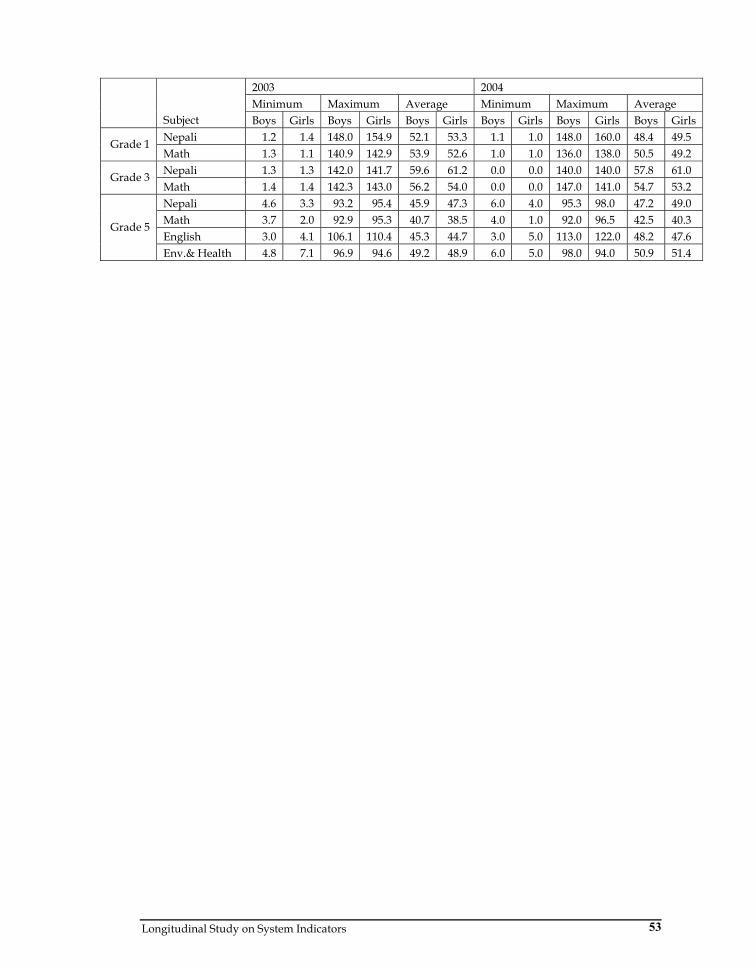
Longitudinal Study on System Indicators 53
2003 2004 Minimum Maximum Average Minimum Maximum Average
Subject Boys Girls Boys Girls Boys Girls Boys Girls Boys Girls Boys Girls Nepali 1.2 1.4 148.0 154.9 52.1 53.3 1.1 1.0 148.0 160.0 48.4 49.5 Grade 1 Math 1.3 1.1 140.9 142.9 53.9 52.6 1.0 1.0 136.0 138.0 50.5 49.2 Nepali 1.3 1.3 142.0 141.7 59.6 61.2 0.0 0.0 140.0 140.0 57.8 61.0 Grade 3 Math 1.4 1.4 142.3 143.0 56.2 54.0 0.0 0.0 147.0 141.0 54.7 53.2 Nepali 4.6 3.3 93.2 95.4 45.9 47.3 6.0 4.0 95.3 98.0 47.2 49.0 Math 3.7 2.0 92.9 95.3 40.7 38.5 4.0 1.0 92.0 96.5 42.5 40.3 English 3.0 4.1 106.1 110.4 45.3 44.7 3.0 5.0 113.0 122.0 48.2 47.6
Grade 5
Env.& Health 4.8 7.1 96.9 94.6 49.2 48.9 6.0 5.0 98.0 94.0 50.9 51.4
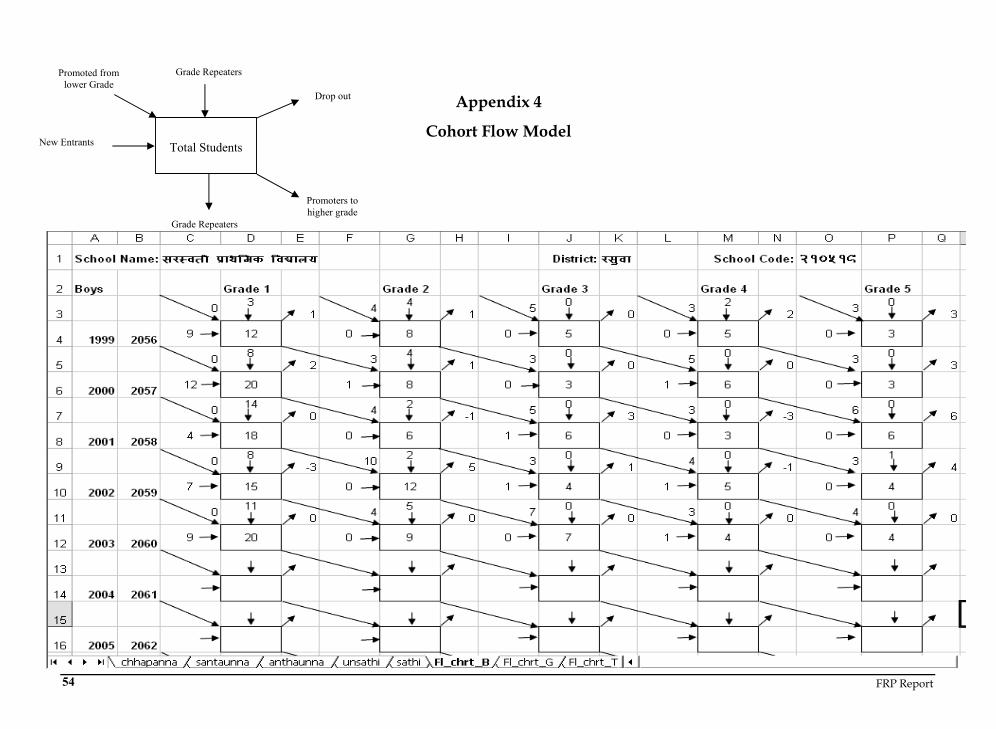
FRP Report 54
Appendix 4
Cohort Flow Model
Promoted from lower Grade
New Entrants
Grade Repeaters
Grade Repeaters
Promoters to higher grade
Drop out
Total Students