Embed Size (px)
Citation preview

A LOOK AT THE FINANCIAL STATEMENTSFINANCIAL STATEMENTS – HOW THEY RELATE TO EACH OTHER AND FINANCIAL STATEMENT ANALYSIS
Edward B. Peacock, CPA
214 356 [email protected]

Topics• Levels of Financial Statements
▫Example Statements (see handouts)▫Government-wide statements▫Fund level statements▫Statistical Section
• Financial Analysis – process of drawing meaning from financial statements▫ Identifying Available Resources
GAAP basis Budgetary basis
General fund Proprietary funds
• Ratio Analysis
Edward B. Peacock, CPA

Edward B. Peacock, CPA
Levels of Financial Statements
•Government-wide financial statements▫Measurement focus – economic resources▫Basis of accounting - accrual basis▫Statement of Net Assets – p11 - reports what
the government owns and owes at the end of the fiscal year Two columns - governmental activities and
business-type activities – side by side comparison
▫Statement of Activities - p12-13 – reports financial results during a fiscal year

Edward B. Peacock, CPA
Levels of Financial Statements
•Fund level financial statements, p14-24▫Governmental funds, p14-15
Modified accrual basis Current assets and current liabilities
Reconciliations of modified accrual to full accrual basis, p16, p19
▫Proprietary funds, W&S, Golf Full accrual basis
Current assets and current liabilities are identified in the fund level SNA, p11, p20

Edward B. Peacock, CPA
Levels of Financial Statements•Statistical Section
▫Typically presents information for the most recent 10 years
▫Usually is not audited▫Contains tables of trends – help you understand
how your gov’t’s finances have changed over time Financial Revenue capacity Debt capacity Demographic and economic information Operating information

Edward B. Peacock, CPA
Identifying Available Resources•Government-wide Statements
▫Restricted versus unrestricted net assets, p11•Fund level statements
▫Governmental funds Fund balance, p14
▫Proprietary funds Unrestricted net assets, p11, p21 Working capital (current assets less current
liabilities) Frequently used in rate analysis
Cash basis, p23

Edward B. Peacock, CPA
Restricted and Unrestricted Net Assets•Capital assets net of related debt, p11
▫Cannot readily be sold and converted into cash
•Restricted net assets▫External restrictions on how resources may
be used•Unrestricted net assets
▫Resources that don’t fall into the first two categories
▫Not necessarily liquid

Edward B. Peacock, CPA
Fund Level Resources•Governmental Funds, p14
▫Nonspendable – not a liquid resource▫Restricted – externally restricted for a specific
purpose Special revenue funds Capital projects funds Debt service funds
▫Committed – appropriated by governing body▫Assigned fund balance – can be unassigned▫Unassigned – can be used as beginning
resource in the budget
Edward B. Peacock, CPA
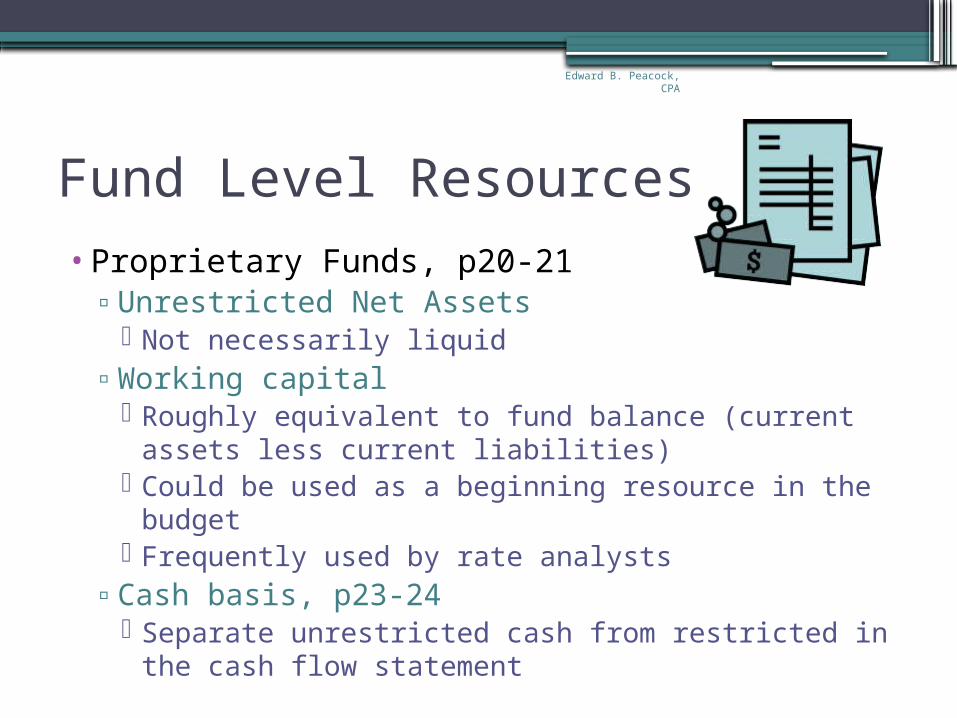
Fund Level Resources•Proprietary Funds, p20-21
▫Unrestricted Net Assets Not necessarily liquid
▫Working capital Roughly equivalent to fund balance (current assets
less current liabilities) Could be used as a beginning resource in the
budget Frequently used by rate analysts
▫Cash basis, p23-24 Separate unrestricted cash from restricted in the
cash flow statement

Edward B. Peacock, CPA
General Fund - Unassigned Fund Balance Measures
2011 2012
Unassigned Fund Balance, p14 $8,938,129 $11,741,652
Total Expenditures and Other Financing Sources and Uses, p17
$46,735,773 $44,836,091
Unassigned Fund Balance as a % of Total Expenditures and Other Financing Sources and Uses
19% 26%
Total Expenditures and Other Financing Sources and Uses (Per Day)
$128,043 $122,839
Unassigned Fund Balance # of Days of Operations
70 81

Edward B. Peacock, CPA
Working Capital - Proprietary Funds
•A short term measure of the funds’ ability to meet the obligations that will come due over the next year
•Current assets less current liabilities•A more stringent approach – compare
only the most liquid assets, generally unrestricted cash and cash equivalents to current liabilities

Edward B. Peacock, CPA
Proprietary Funds – Working Capital
FY 2011 Water and Sewer
FY 2011Golf
FY 2012Water and Sewer
FY 2012Golf
Current Assets, p20
SNA $15,980,106
$94,032 $15,987,055
$81,224
Less: Current Liabilities, p21
SNA $5,060,044 $1,447,670
$5,328,831 $1,401,595
Working Capital
$10,920,062
-$1,353,638
$10,658,224
-$1,320,371

Edward B. Peacock, CPA
Proprietary Funds Expenditures – Budgetary Basis
FY 2011 Water and Sewer
FY 2011Golf
FY 2012Water and Sewer
FY 2012Golf
Operating Expenses, p22
SREV 18,490,100
2,937,825 17,948,243
2,941,753
Less: Depreciation, p22
SREV -2,464,771 -403,024 -2,529,720 -402,428
Add: Transfers, p22 SREV 1,501,990 199,141 1,444,541 232,120
Add: Debt Principal, p23
SCF 1,470,000 285,000 1,540,000 295,000
Add: Interest, p23 SCF 501,768 126,867 274,208 119,525
Total Expenditures 19,499,087
3,145,809 18,677,292
3,185,970
Expenditures per Day 53,422 8,619 51,171 8,729

Edward B. Peacock, CPA
Proprietary Funds – Working Capital Measures
FY 2011 Water and Sewer
FY 2011Golf
FY 2012Water and Sewer
FY 2012Golf
Total Expenditures (Budgetary Basis)
19,499,087
3,145,809 18,677,292
3,185,970
Expenditures per Day
53,422 8,619 51,171 8,729
Working Capital 10,920,062
-1,353,638
10,658,224
-1,320,371
Working Capital as % of Total Expenditures
56% -43% 57% -41%
Number of Days Working Capital
204 -157 208 -151

Edward B. Peacock, CPA
Proprietary Funds – Unrestricted Cash
2012 W&S 2012 GOLF
Current assets: Cash and cash equivalents
SNA
$13,299,600
$0
Noncurrent assets:Restricted cash and investments
SNA
$11,844,580
$220,320
Cash and cash equivalents, ending
SCF $25,144,180
$220,320

Edward B. Peacock, CPA
Ratio Analysis•The act of converting the numbers in the FS into
a form which specific decisions can be based•Are created by dividing one number into another•Financial story is not told with a single ratio, but
with an accumulation of ratios and other information
• If presented ratio information, be careful to ask how it was calculated
•Always specify the components of the ratios used in your analyses

Edward B. Peacock, CPA
Ratio Analysis
•To give meaningful financial ratios, always place your ratios in context, i.e.,▫Compare to PY – improving, declining,
holding steady?▫Compare to other similar governments –
higher, lower, roughly the same?▫Is there a commonly accepted benchmark?

Edward B. Peacock, CPA
Types of Ratios• Common-Size Ratios
▫$ Dollar Change▫% Percentage Change
• Short Term Focus – Liquidity▫Current Ratio▫Quick Ratio
• Long Term Focus – Solvency▫Debt to Assets Ratio▫Debt to Net Assets▫Coverage Ratios
Interest Coverage Debt Service Coverage

Edward B. Peacock, CPA
Common-Size Ratios
•Serve two valuable purposes▫Provide quick overview of finances▫How they’ve changed since prior year▫Can be applied to any kind of FS
information Percentage change – shows magnitude of
change Percentage distribution – shows portion of
the total represented by individual elements

Edward B. Peacock, CPA
Dollar Amount and Percentage Change
2011 2012 $ Change % Change
Capital Assets
SNA
254,274,206
250,588,786
-3,685,420
-1.45%
Receivables
SNA
15,865,895 17,326,709 1,460,814 9.21%

Edward B. Peacock, CPA
Percentage Distribution2011 2012
Capital Assets
SNA
254,274,206, 63.53%
250,588,786, 61.16%
Receivables
SNA
15,865,895, 3.96% 17,326,709, 4.23%

Edward B. Peacock, CPA
Liquidity Ratios
•Concerned with the ability to pay immediate obligations
•Current ratio▫Current assets / current liabilities
•Quick ratio▫Cash and cash equivalents / current
liabilities

Edward B. Peacock, CPA
Current and Quick RatiosFY 2011 Water and Sewer
FY 2011Golf
FY 2012Water and Sewer
FY 2012Golf
Current Assets
SNA
15,980,106 94,032 15,987,055 81,224
Cash and Investments
SNA
13,036,960 0 13,299,600 0
Current Liabilities
SNA
5,060,044 1,447,670 5,328,831 1,401,595
CURRENT RATIO
3.16 .06 3.00 .06
QUICK RATIO
2.58 0.00 2.50 0.00
Edward B. Peacock, CPA
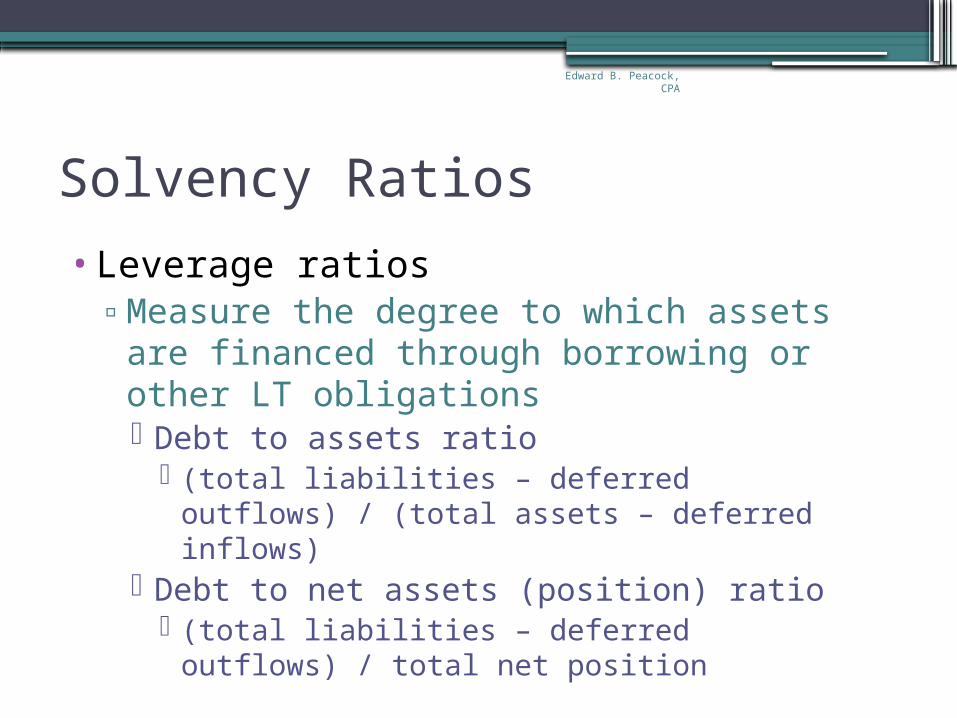
Solvency Ratios
•Leverage ratios▫Measure the degree to which assets are
financed through borrowing or other LT obligations Debt to assets ratio
(total liabilities – deferred outflows) / (total assets – deferred inflows)
Debt to net assets (position) ratio (total liabilities – deferred outflows) / total net
position
Edward B. Peacock, CPA
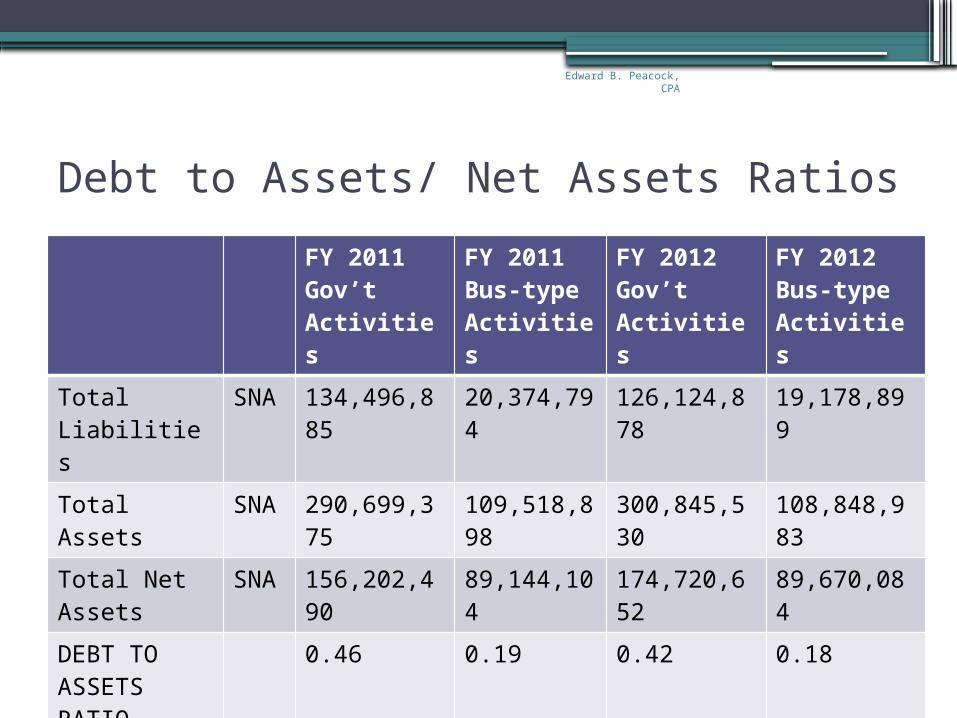
Debt to Assets/ Net Assets RatiosFY 2011 Gov’t Activities
FY 2011 Bus-type Activities
FY 2012Gov’t Activities
FY 2012Bus-type Activities
Total Liabilities
SNA
134,496,885
20,374,794
126,124,878
19,178,899
Total Assets SNA
290,699,375
109,518,898
300,845,530
108,848,983
Total Net Assets
SNA
156,202,490
89,144,104
174,720,652
89,670,084
DEBT TO ASSETS RATIO
0.46 0.19 0.42 0.18
DEBT TO NET ASSETS RATIO
0.86 0.23 0.72 0.21

Edward B. Peacock, CPA
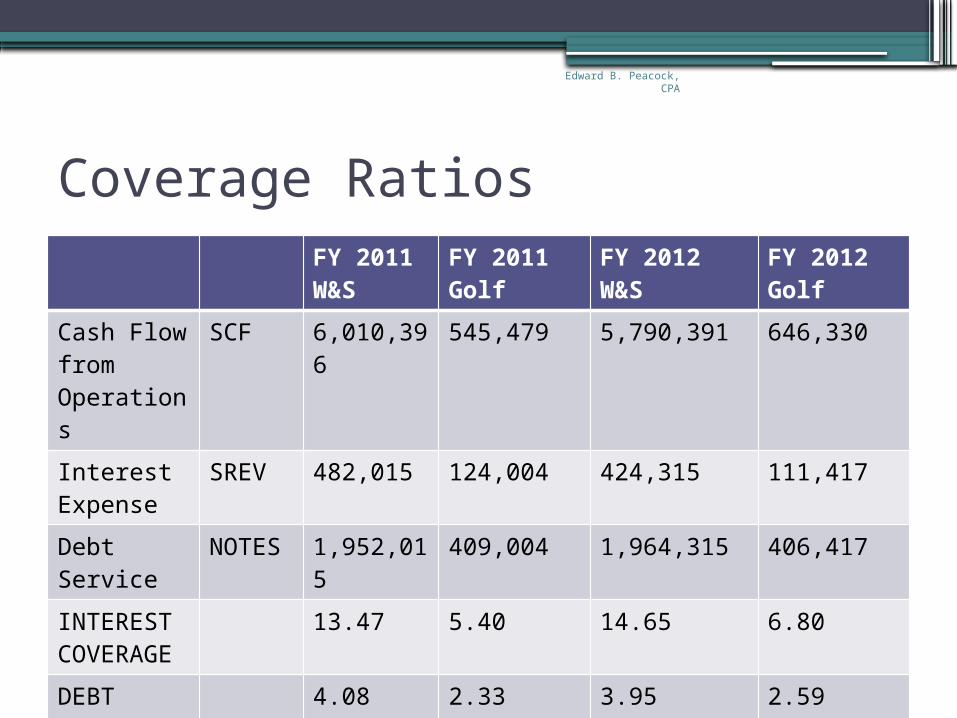
Coverage Ratios
•Compare available resources with resource needs▫Interest coverage
Cash flow from operations + interest expense / interest expense
▫Debt service coverage Cash flow from operations + debt service /
debt service
Edward B. Peacock, CPA
Coverage RatiosFY 2011 W&S
FY 2011Golf
FY 2012W&S
FY 2012Golf
Cash Flow from Operations
SCF 6,010,396
545,479 5,790,391 646,330
Interest Expense
SREV 482,015 124,004 424,315 111,417
Debt Service
NOTES
1,952,015
409,004 1,964,315 406,417
INTEREST COVERAGE
13.47 5.40 14.65 6.80
DEBT SERVICE COVERAGE
4.08 2.33 3.95 2.59

Edward B. Peacock, CPA
Summary AnalysisGeneral Fund W&S Golf
2011 2012 2011 2012 2011 2012
FB, WC %
19% 26% 56% 57% -43% -41%
# Days 70 81 204 208 -157 -151
Current Ratio
3.16 3.00 .06 .06
Quick Ratio
2.58 2.50 0 0
Interest Coverage
13.47 14.65 5.4 6.8
Debt Svc Coverage
4.08 3.95 2.33 2.59

Questions?
Eddie Peacock
Edward B. Peacock, CPA214 356 [email protected]://www.EBPeacockCPA.com
Edward B. Peacock, CPA